
Abstract
A number of novel urinary biomarkers have been identified and partially qualified for use as markers for renal injury in rats. We used two multiplex assays for these novel biomarkers to quantify biomarker concentration in serial urine collections from rats of both sexes administered varying concentrations of cisplatin. From these data, we calculate inter-individual variation and reference ranges from predose animals and intra-individual variation and reference change values from undosed control animals. The biomarkers evaluated are albumin, α glutathione s-transferase, glutathione S-transferase-yb1, lipocalin-2, kidney injury molecule-1, osteopontin, and renal papillary antigen 1. For any creatinine-corrected novel biomarkers, we found intra-individual variation to be no greater than 44% and inter-individual variation to be no greater than 46%. Reference change values for most corrected analytes (except osteopontin) were 50–100%, indicating that a >100% increase in analyte concentration between serial samples would be unlikely to be associated with inherent analytical or biological variation.
Introduction
Drug-induced kidney injury is a cause of candidate compound attrition in drug development (Garrett and Workman 1999; Kola and Landis 2004; Lesco and Atkinson 2001). Traditional monitoring of renal toxicity in preclinical studies is carried out by the histological assessment of renal tissues in conjunction with assessment of renal function with plasma surrogates (urea or creatinine) and by concurrent assessment of a variety of urinary parameters that include color, urine specific gravity, semiquantitative dipstick analysis, electrolytes, and enzymes. With the exception of histopathological examination, the functional assessments and evaluation of urinary parameters are widely regarded as being insensitive to, and poorly specific for, renal injury (Han et al. 2002; Star 1998).
Over recent years, intensive efforts by cross-pharmaceutical collaborations have led to the identification and partial qualification by pharmaceutical regulators of numerous novel urinary proteins that act as biomarkers for kidney injury in rats (Ozer et al. 2010; Yu et al. 2010). Based on submissions to the regulators by both the Predictive Safety Testing Consortium and the International Life Sciences Institute (ILSI), additional relevant information has been identified in order to widen the context of use for these biomarkers. These data include investigation of sex differences at baseline or in response to damage by nephrotoxicants as well as longitudinal assessment of biomarker change after injury and during recovery (Abadie 2010; Goodsaid et al. 2008).
The present study has been facilitated by the growing availability of a number of the urinary protein biomarkers identified in the early qualification submissions as part of two multiplex immunoassays. Multiplexing of these assays allows for rapid assessment of a number of biomarkers from a small sample volume at each analysis. To date, these multiplex plates have not been evaluated together.
The biomarkers of interest in this series of papers included five traditional (two plasma and three urinary) and nine novel (one plasma and eight urinary) biomarkers of renal injury in the rat. The traditional biomarkers under evaluation were plasma urea, creatinine and urinary total protein (TP), glucose, and n-acetyl-β-d-glucosaminidase (NAG). The novel biomarkers under evaluation were plasma cystatin C and urinary albumin, α-glutathione s-transferase (α-GST), glutathione S-transferase-yb1 (GSTYb1), lipocalin-2, kidney injury molecule-1 (KIM-1), osteopontin, and renal papillary antigen-1 (RPA-1).
Over a series of three articles, we report the findings from a study following groups of Han Wistar rats of both sexes evaluated prior to and following a single administration of cisplatin, a well-characterized nephrotoxicant in animals and humans that causes injury and necrosis predominantly in the S3 segment of the proximal tubule. The aims of the study were to determine: the intra- (CVI) and inter- (CVG) individual biological variation of the urinary biomarkers in rats; the longitudinal biomarker response after injury with cisplatin and during recovery; whether any significant sex differences were apparent in terms of the baseline population or in biomarker response to injury; and whether a shortened collection period had any significant impact on either biomarker baseline variation or the interpretation of biomarker response following injury.
In this article, we report the design and methodologies used in the study and determine from predose and control rats the CVI and CVG, the reference ranges, and reference change values (RCV) of the urinary biomarkers.
The second article reports the effects of shortened collection periods on the biomarkers, and the third article reports the similarities and differences in urinary biomarker response over time in male and female rats and relates these findings to histopathological changes (Pinches et al. 2012a; Pinches et al. 2012b [this volume]).
Methods
Animals
In total, eighty-five male and eighty-five female HsdHan Wistar rats supplied by Harlan UK (Bicester, UK) were used in this study. They were acclimatized for at least six days prior to dosing, and each animal was uniquely identified by an ear-notch. Animals were housed five per cage in racks, and cages were cleaned at least once each week. Cages were labeled with animal identities, compound, dose level, and Home Office license details. Rats were bedded on aspen wood chips and provided with sizzle nest and aspen chew blocks. The animals had free access to pelleted RM1 (E) SQC (SDS, Kent, UK) diet and water, except during the six-hour urine collection period, when food was temporarily withdrawn. The bedding, enrichment materials, diet, and water supply were all regularly analyzed for chemical and microbial contaminants. The room environment was regulated between 19°C and 23°C and between 40% and 70% relative humidity. Lighting was provided by fluorescent tubes on a twelve-hour light/dark cycle. Rats were housed in an accredited facility at AstraZeneca Research Facilities (Nether Alderley, Cheshire, UK). All animal procedures were carried out under local ethical committee guidelines and approval, and they followed the UK Home Office (1989) Code of Practice for the Housing and Care of Animals used in Scientific Procedures.
Study Design
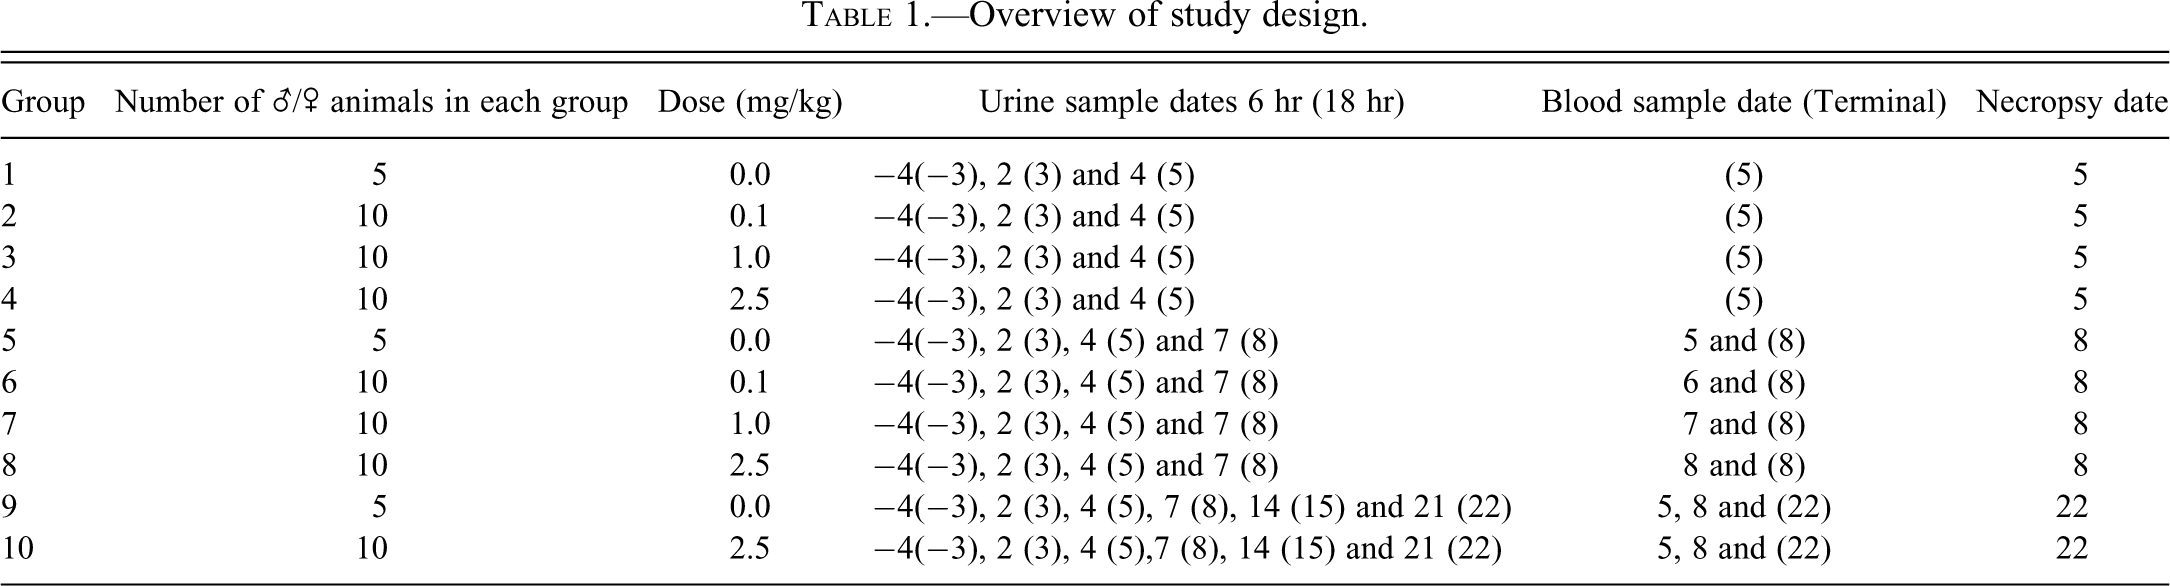
An overview of the study design is shown in Table 1. In brief, ten groups of ten male and ten female (five animals of each sex in three control groups) Han Wistar rats were given a single dose of 0.1 mg, 1 mg, or 2.5 mg cisplatin dissolved in 0.9% physiological saline or the same volume per body weight of vehicle to control animals (5 mL/kg) by intraperitoneal injection. Urine samples were collected on a maximum of six occasions with two timed collections on each occasion, the first for six hours, during daylight hours, followed by a rest period and then a further collection for eighteen hours, overnight. The analysis of novel biomarkers was performed at all time points in males and for eighteen-hour collections only in females.
Overview of study design.
Materials
Cisplatin (cis-diammineplatinum [II] dichloride, CAS No. 15663-27-1) was purchased from Sigma-Aldrich (Gillingham, UK). Doses were selected on the basis of results obtained in an exploratory dose-finding toxicity study in which a clear dose response for degeneration/necrosis of the S3 segment of the proximal tubules was observed at 1 and 5 mg/kg on Days 2 and 5 and no response was observed at 0.1 mg/kg. The high dose was selected in order to establish clear kidney toxicity without lethality.
Urine Collection
Urine samples were taken by metabowl collection at six and eighteen hours according to the schematic detailed in Table 1. The six-hour daytime urine collection was taken with food withdrawn. The eighteen-hour overnight collection was taken with food available. Animals had access to water ad libitum throughout both urine collections. Urine samples were cooled with ice water during metabowl collection, and resultant volumes were measured at the end of sample collection. Multiple aliquots were made and analyzed for urine specific gravity and quantitative measurement of glucose creatinine, NAG, and total protein on the day of collection. A maximum of three aliquots (up to 1 mL each, excess discarded) were subsequently stored. One aliquot was stored with the addition of Rat Urinary Stabilizing buffer (Argutus Medical, Dublin, Ireland, IE cat. number BIO86RTSTB). Buffer was added to each urine sample at a ratio of 1:4. Aliquoted samples were stored at −80°C until analysis.
Biomarker Analysis
Traditional plasma biomarkers
The following plasma chemistry parameters were measured: creatinine, urea, total protein, albumin, total bilirubin, AST, ALT, ALP, GLDH, cholesterol, triglycerides, glucose, sodium, potassium, and total calcium. All parameters were measured on the Roche Modular P analyser (Roche Diagnostics, West Surrey, UK) using assay kits supplied by Roche Diagnostics (unless stated otherwise below) and followed standard methods. In brief, enzymatic colorimetric methods were used to analyse cholesterol, triglyceride, AST, and GLDH. Colorimetric methods were used for total protein, total bilirubin, and ALP. Ultraviolet assays were used for urea ALP, and glucose. Creatinine concentrations were determined using a jaffe reaction method. Sodium and potassium were measured on the ISE module of the Roche analyzer. Calcium and albumin assays were end point colorimetric methods (Instrumentation Laboratory, Warrington, Cheshire, UK).
Novel plasma biomarker
Plasma cystatin C was measured using a turbidimetric method (DakoCytomation/Alere, Stockport, UK) on the Roche Modular P analyzer according to the manufacturer’s directions.
Traditional urinary biomarkers
Urinary glucose, total protein, creatinine, and NAG were measured on the Roche Modular P analyzer (Roche Diagnostics, West Surrey, UK). The glucose and creatinine assay kits were supplied by Roche Diagnostics and followed a method described previously. The urinary total protein kit was measured using a colorimetric method (Sigma Aldrich, Gillingham, Dorset, UK). NAG was measured using a colorimetric assay (PPR diagnostics, London, UK).
Novel urinary biomarkers
Urinary biomarkers were assessed using a multiplex ECL-based Meso Scale Discovery (MSD) Sector Imager 6000 instrument (MSD, Gaithersburg, MD, USA). Analysis was conducted using three plate options. α-GST, GSTYb1, and RPA-1 were assessed using the Argutus AKI Test assay kit (MSD, Gaithersburg, MD, USA) according to the manufacturer’s instructions. Briefly, urine samples stabilized by the addition of buffer (Argutus Medical) were diluted five-fold in assay diluent. The precoated assay plates were incubated with 150 µL 0.5% blocking solution (as supplied with the kit) for one hour with shaking. Into each well, 25 µL of diluent and samples/calibrator were dispensed. Plates were incubated for two hours at room temperature while being shaken vigorously before the addition of detection antibody (25 µL/well). Plates were then incubated for a further two hours and shaken as before. Between the steps, the plates were washed three times with PBS-0.05% Tween. Finally, read buffer was added (150 µL/well) and the plates were read within five minutes.
A similar protocol was followed for analysis of lipocalin-2, osteopontin, albumin, and KIM-1 using a kidney injury panel 1 assay kit (MSD). Urine samples were diluted ten-fold in mouse/rat serum cytokine assay diluent (supplied with the kit) prior to analysis, and samples and calibrators were mixed with albumin tracer before addition (50 µL/well) to the plate. All other steps were similar to those outlined above and were conducted according to the manufacturer’s instructions.
For all data analysis, duplicate sample values with a CV value greater than 15% were rejected and any standard curve values with recovery outside the range of 80–120% were omitted from the curve fit process. Internal QC material was generated using standard curve material (two points) chosen to be on the linear part of the curve, and within- and between-plate precision was calculated. Test plates were subsequently accepted if QC material values fell within ±2 SD of their calculated mean.
Statistical Analysis
Creatinine correction
Creatinine adjustment is an accepted method to normalize urinary biomarker values to account for the wide variation in urine concentration that can be seen within and between individuals over time (Alessio et al. 1985; Heavner et al. 2006). Creatinine adjustment assumes that creatinine excretion is uniform across time within individuals. We tested this assumption because renal physiology (such as reabsorption in the proximal tubules) can alter creatinine excretion (Kinter 2005), and it may be altered by injurous processes. To ensure that creatinine adjustment did not significantly influence the underlying biomarker profiles within each sex, total urinary creatinine excretion values (urine creatinine concentration × urine volume) from all groups and at all time points were compared with controls.
We also investigated the assertion that correction for creatinine is more appropriate than correction for volume when comparing biomarker values between sexes. For this purpose, we took all values during the study and calculated the mean urine creatinine values and mean urine volume for each collection and each sex. The proportions of these figures (mean female volume or creatinine / mean male volume or creatinine) were then compared to each other for both collection periods.
Reference range, biological variation, and critical difference calculation
Estimates of biological variation, reference change values (RCV), and reference ranges were calculated for urine parameters only. Estimates for serum parameter were not made because of the low number of repeat serum samples from control animals (n < 10).
Mean, standard deviation, and reference ranges for each collection method and each sex were estimated using the predose samples obtained from all animals included in the study (control and experimental animals; eighty-five samples in total). With the exception of urinary volume and urinary specific gravity, all urinary biomarker distributions were skewed to the right and could not be transformed, so a one-tailed nonparametric method to obtain the 95% reference interval was used. For urinary volume and urinary specific gravity, a parametric two-tailed method was used.
To obtain estimates of the various components of biological variation, an approach recommended by Fraser and Harris (1989) was used. The distribution of the means of repeated sampling and the extreme means for all analytes were examined. Outliers were identified and excluded from subsequent analysis (one for glucose in males at six hours and NAG in females at eighteen hours). Testing for homogeneity of variances within subjects was performed, and no further outliers were identified, as Cochrane values were below the critical value (P= .05). Intra-individual (CVI) and inter-individual (CVG) coefficients of variation were calculated. The critical difference (the change needed between two serial results to be significant) was calculated as 1.65 × √2(CVA 2+ CVI 2) (Fraser and Harris 1989; Jensen and Aaes 1993; Jensen et al. 1993). In this equation, CVA is the analytic coefficient of variation, estimated to be 15%, except for Vol, where it was estimated to be 5%, using a one-sided critical difference, except for Vol, which was considered to be two sided and used the formula 1.95 × √2(CVA 2+ CVI 2). CVA was estimated.
RPA-1 Immunohistochemistry
RPA-1 immunohistochemistry was carried out using a method described by Price et al. 2010. Briefly, kidneys were fixed for twenty-four to forty-eight hours in 10% neutral-buffered formalin; they were then embedded in paraffin, and 4 µm sections were cut. Immunostaining was carried out using a Labvision autostainer (Labvision, Fremont, CA, USA). Slides were incubated with RPA-1 antibody for one hour at room temperature. Horseradish peroxidase–labeled goat anti-mouse IgG secondary antibody (DAKO Envision + System-HRP) was added for thirty minutes at room temperature, and peroxidase was then visualized with diaminobenzidine (DAB, DAKO Envision kit) applied for ten minutes at room temperature. Sections were counterstained using hematoxylin (Carazzi’s) for one minute. Image capturing of the slides was carried out using a Scanscope scanner (Aperio Technologies Incorporated, Vista, CA, USA).
Results
Creatinine Correction
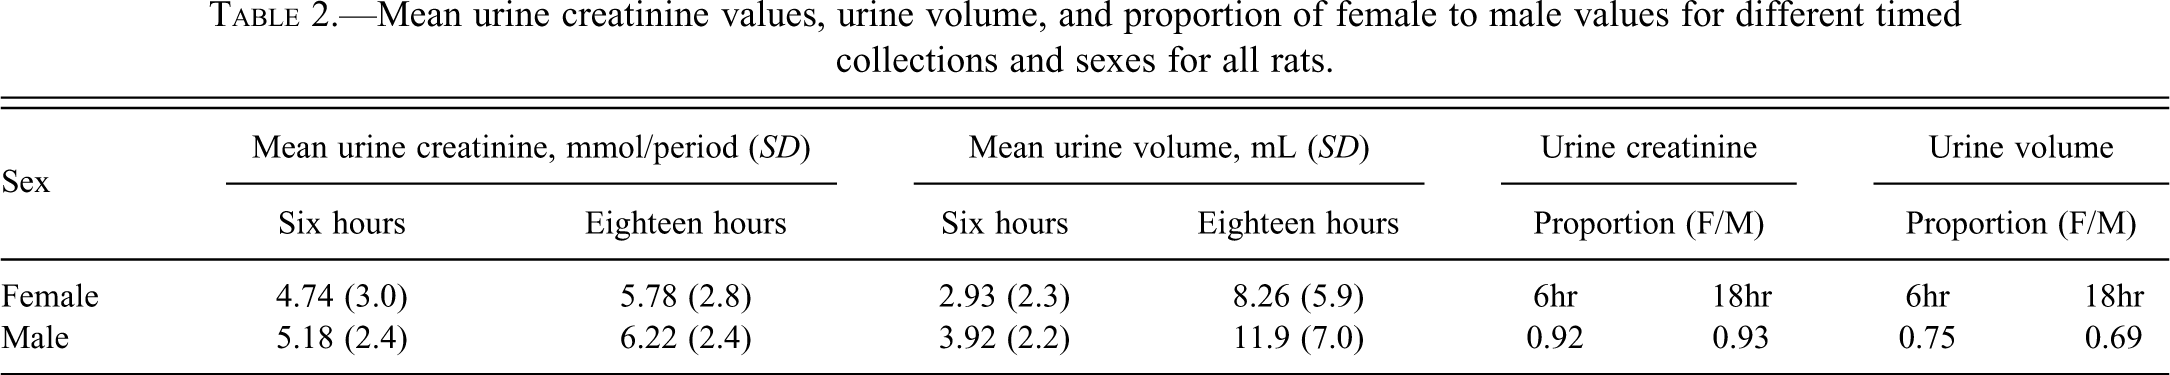
Male rats had significantly greater urinary creatinine concentrations and greater urine volume excretion than female rats (Table 2). There were no significant differences between total creatinine excretion in control groups and with any dosed group (data not shown). Urinary creatinine concentration had a lower proportional difference between the sexes than urinary volume (Table 2), so we concluded that correction for creatinine would introduce less bias than correction for volume. All urinary biomarker values are presented as both the actual concentrations and as adjusted (“normalized”) for creatinine concentration (corrected value = biomarker/creatinine concentration). Where units are quoted, these reflect the original urinary concentration and not the normalised ratios.
Mean urine creatinine values, urine volume, and proportion of female to male values for different timed collections and sexes for all rats.
Reference Ranges
Urinary analyte mean values and standard deviation taken from all predose rats (n = 85 for each sex) at both collection regimens and for both sexes are shown in Tables 3 and 4. Findings of specific interest were: male rats had higher mean values for urine volume, total protein, GSTYb1 and α-GST, whereas female rats had higher RPA-1 and albumin. We further investigated the differences in α-GST and RPA-1 between sexes using immunohistochemistry of kidney sections. This showed that females had areas of RPA-1 staining within the S3 area of the proximal tubule (Figure 1B and D), whereas males did not (Figure 1A and C). No such differences were seen for α-GST expression. Reference ranges for biomarkers are shown in Table 5. The reference ranges showed a similar pattern of differences between sexes as the mean values, with urinary TP, GSTYb1, and α-GST ranges higher in males and urinary albumin and RPA-1 ranges higher in females. In addition, urinary NAG had much wider reference ranges for the six-hour collection period than for the eighteen-hour collection.
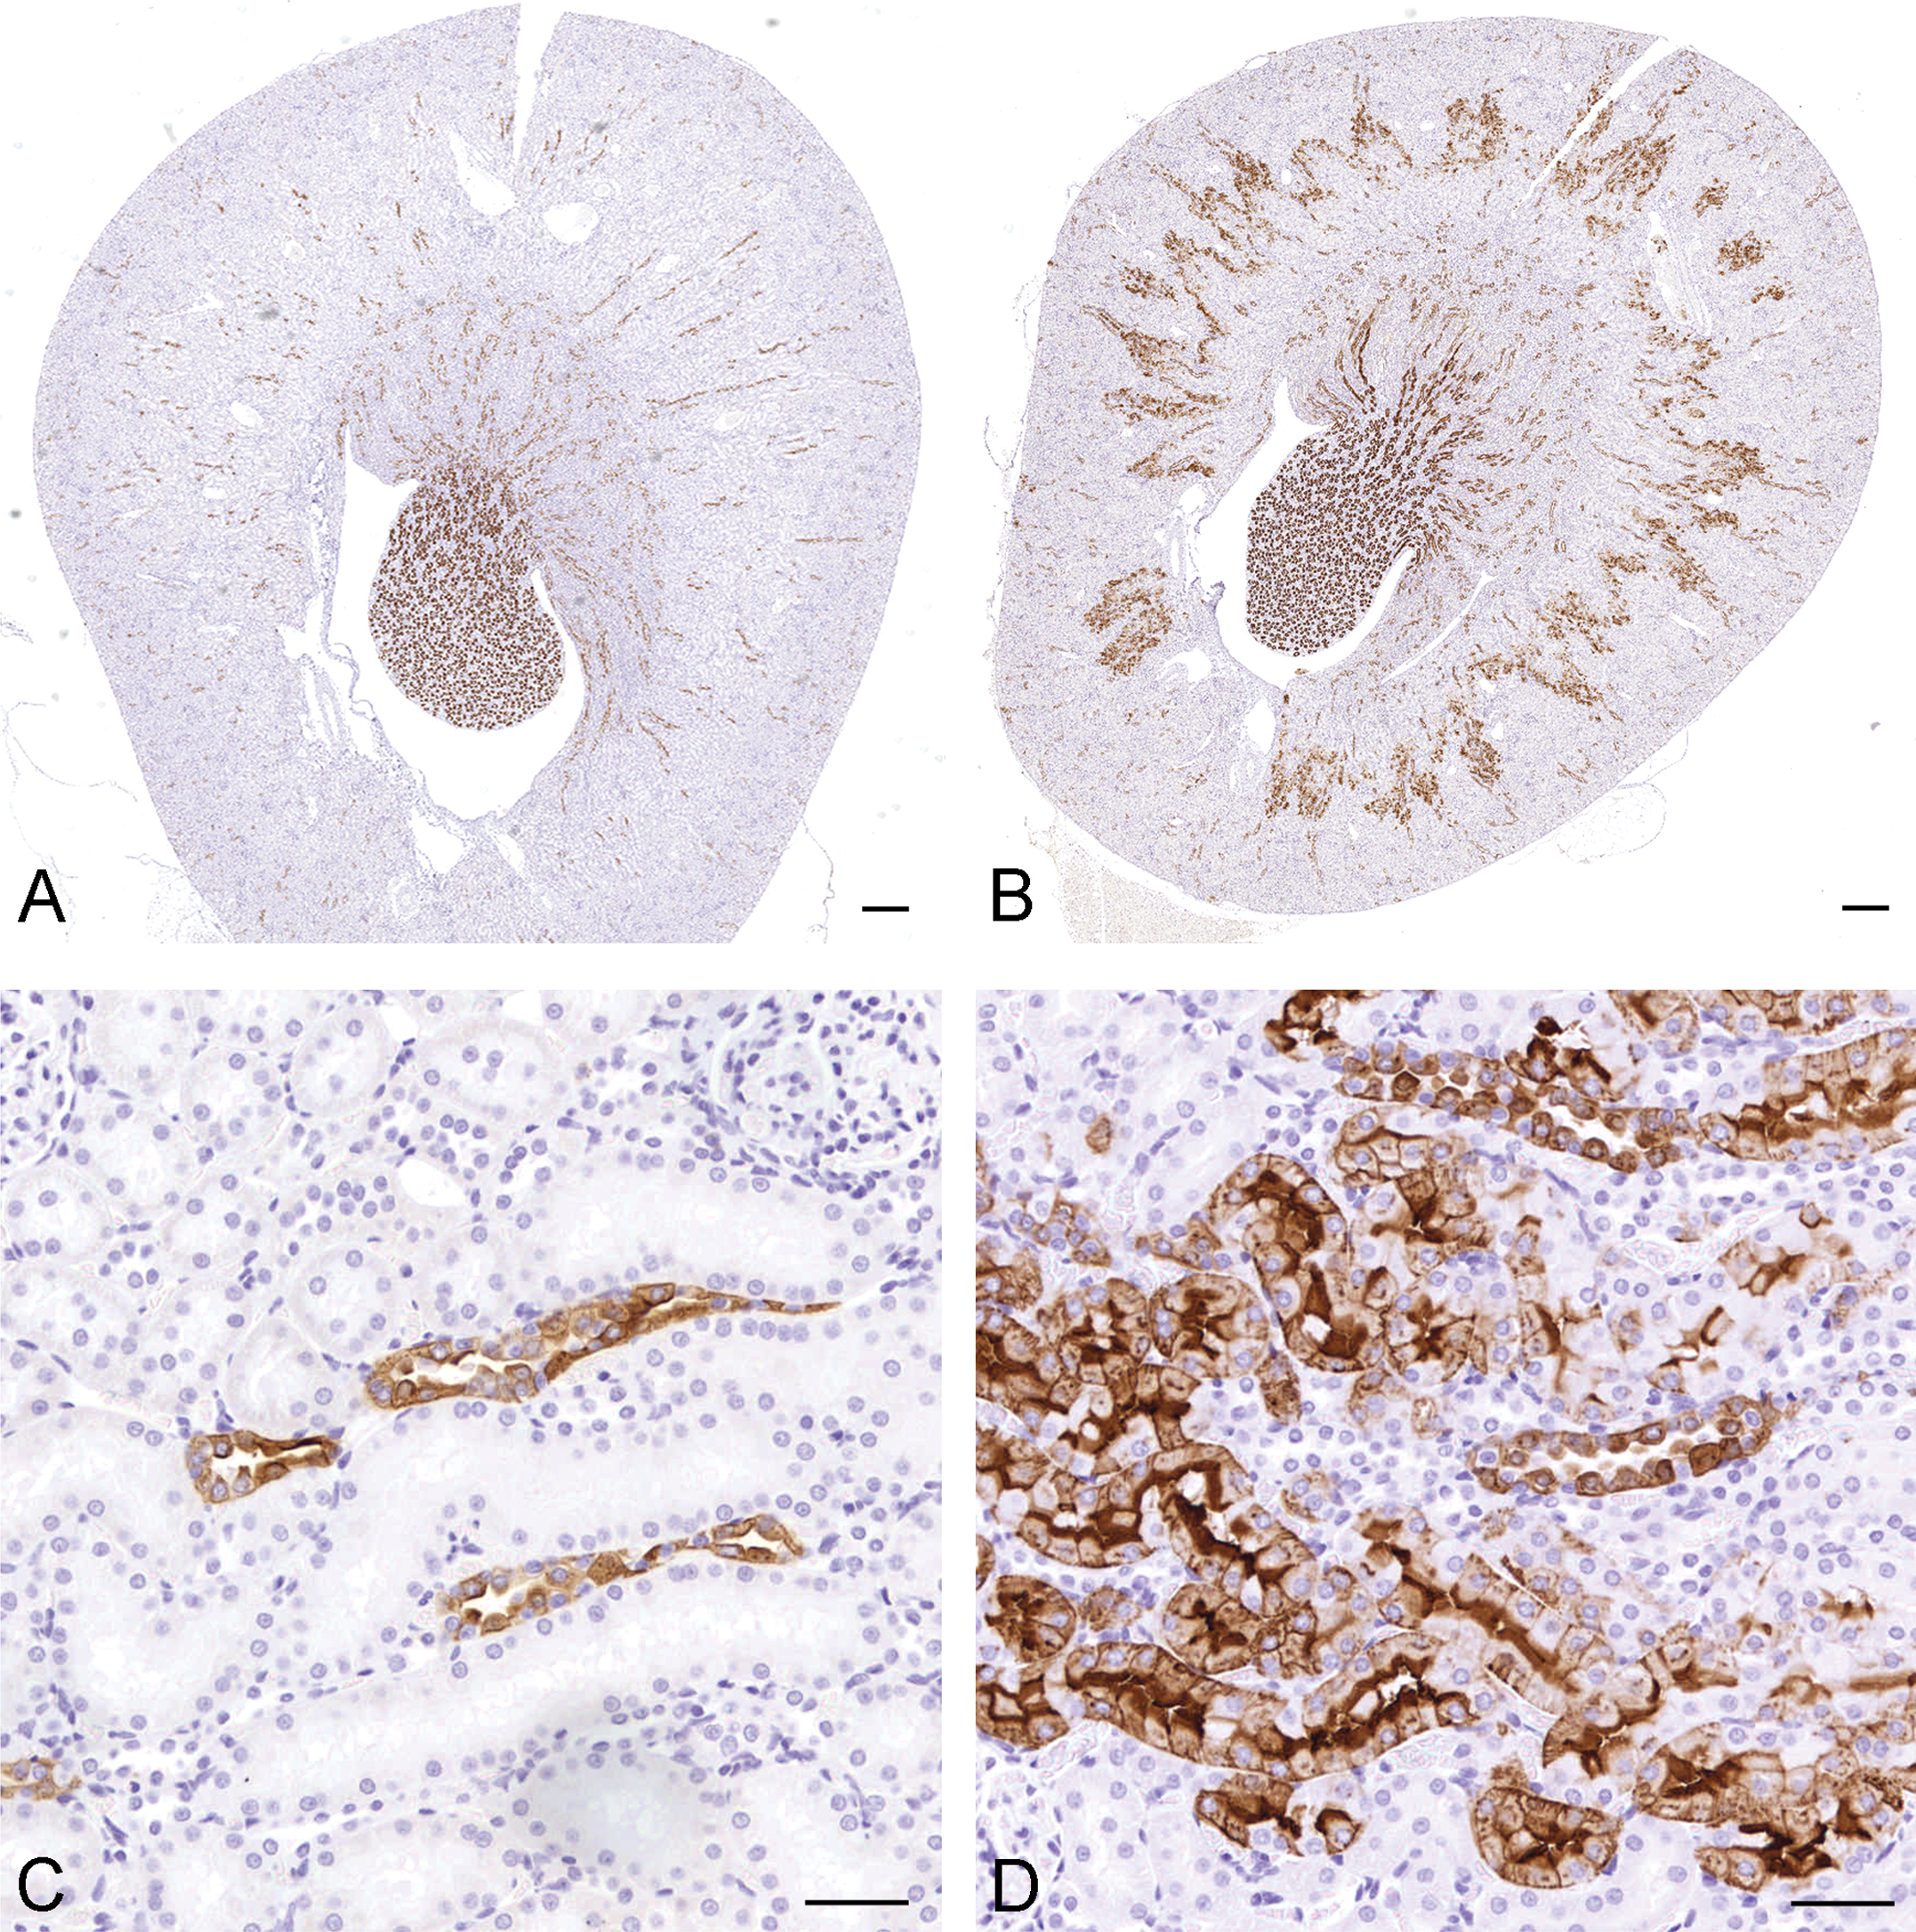
Immunohistochemistry using the anti-RPA-1 antibody on male (A and C) and female (B and D) control kidney sections. At low magnification, additional staining can be seen in females (B) that is absent in males (A). At higher magnification, it can be seen that only collecting ducts are stained positive in males (C), whereas collecting ducts and S3 proximal tubules are positive in females (D). Scale bar = 500 µm in A and B and 50 µm in C and D.
Biomarker mean and standard deviation for urinary concentrations and normalized values for predose female rats.
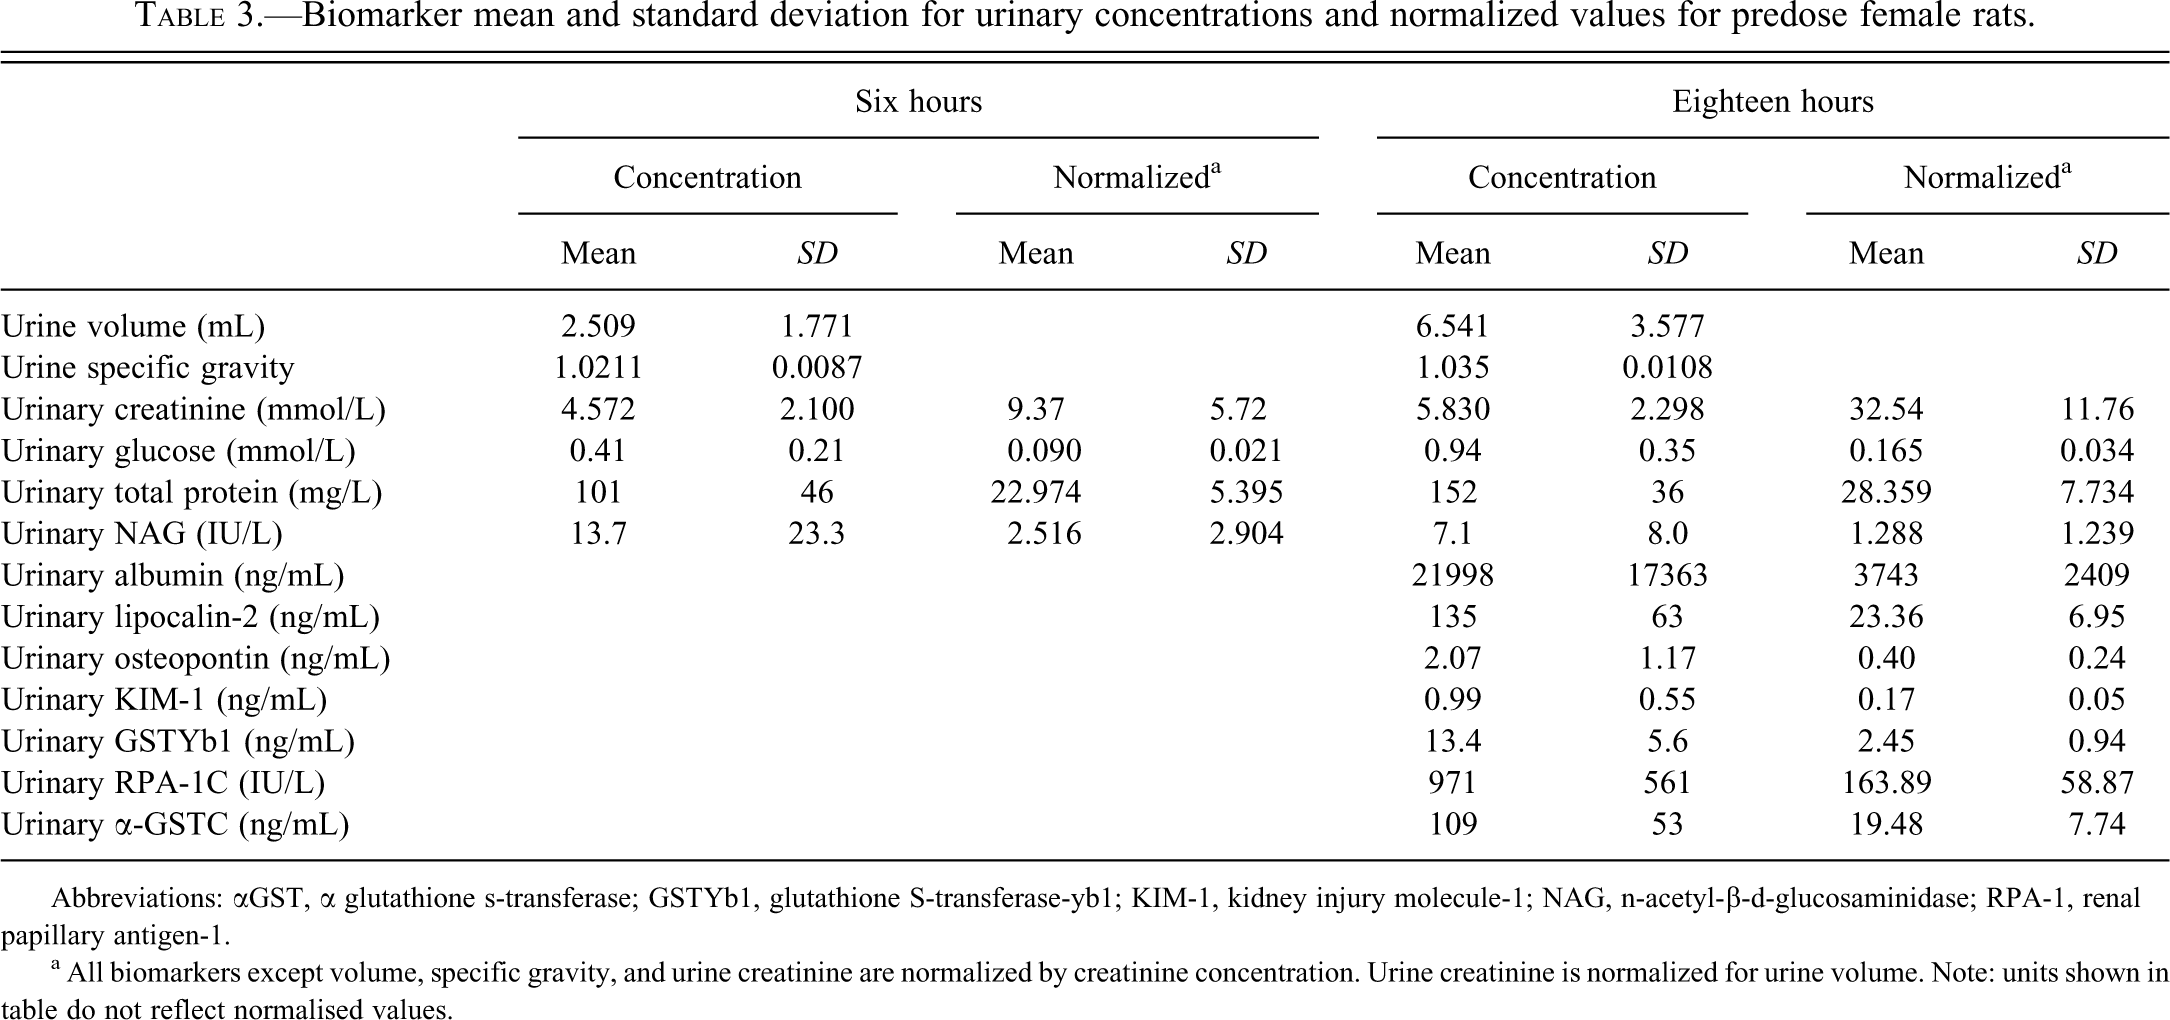
Abbreviations: αGST, α glutathione s-transferase; GSTYb1, glutathione S-transferase-yb1; KIM-1, kidney injury molecule-1; NAG, n-acetyl-β-d-glucosaminidase; RPA-1, renal papillary antigen-1.
aAll biomarkers except volume, specific gravity, and urine creatinine are normalized by creatinine concentration. Urine creatinine is normalized for urine volume. Note: units shown in table do not reflect normalised values.
Biomarker mean and standard deviation for urinary concentrations and normalized values for predose male rats.
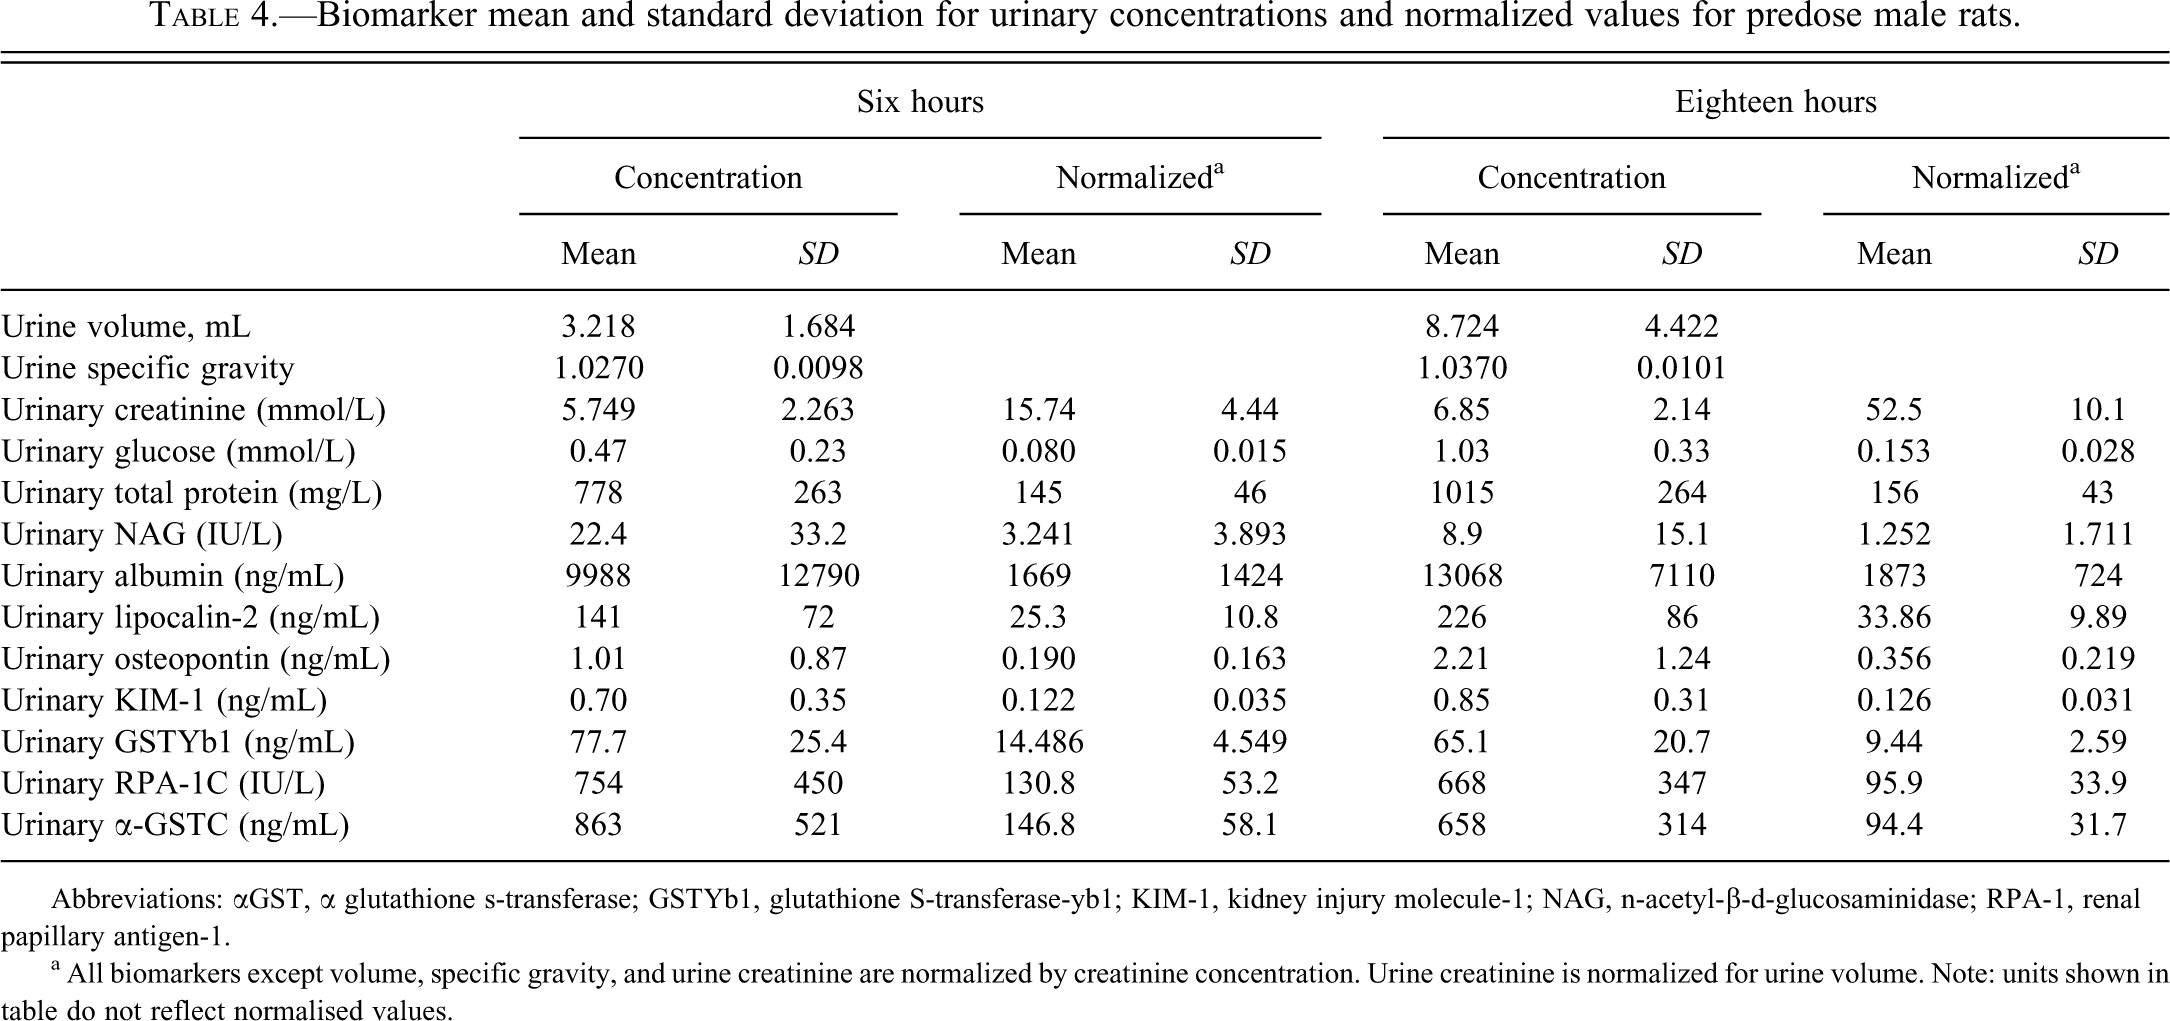
Abbreviations: αGST, α glutathione s-transferase; GSTYb1, glutathione S-transferase-yb1; KIM-1, kidney injury molecule-1; NAG, n-acetyl-β-d-glucosaminidase; RPA-1, renal papillary antigen-1.
aAll biomarkers except volume, specific gravity, and urine creatinine are normalized by creatinine concentration. Urine creatinine is normalized for urine volume. Note: units shown in table do not reflect normalised values.
Reference ranges in predose rats of urine biomarkers normalized for creatinine.
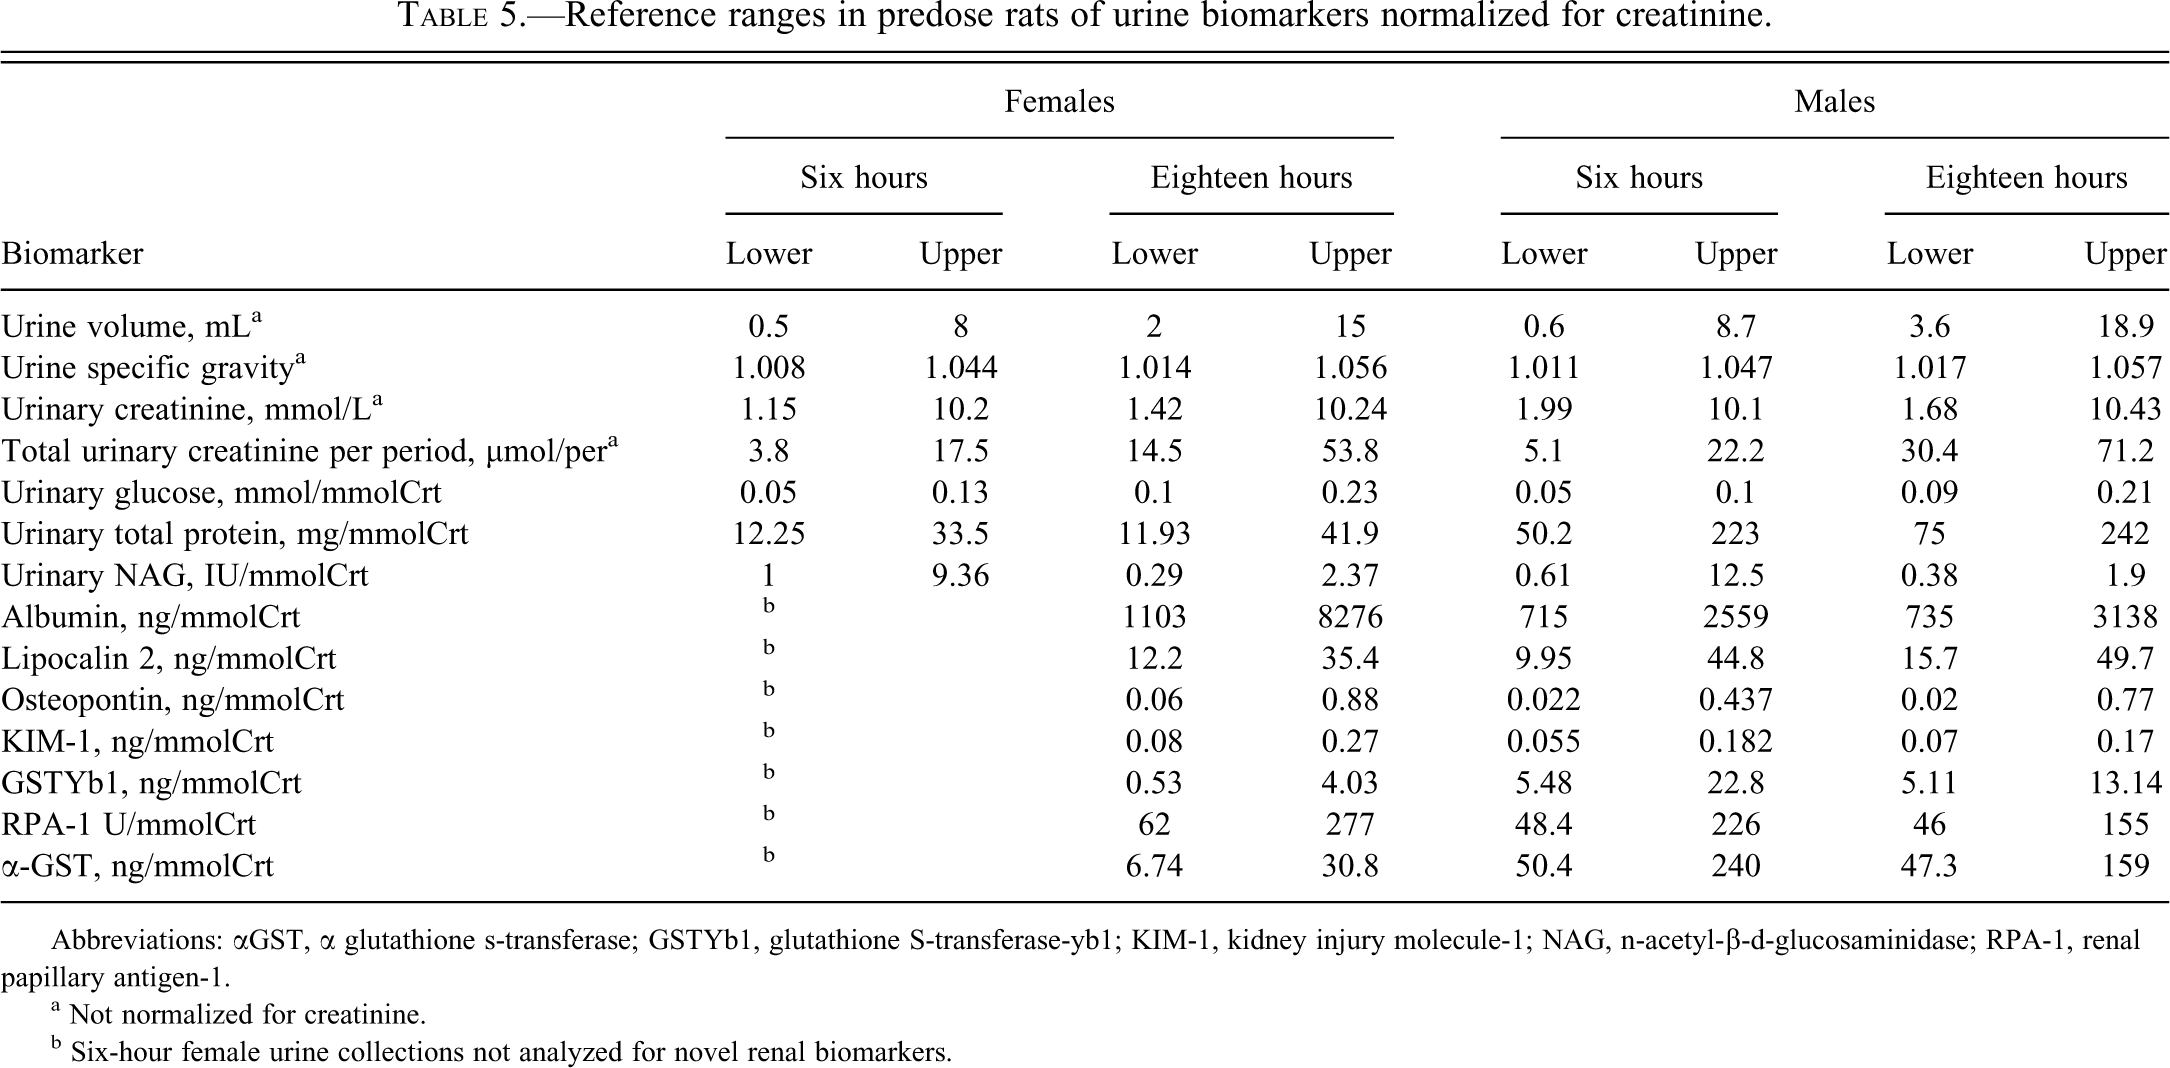
Abbreviations: αGST, α glutathione s-transferase; GSTYb1, glutathione S-transferase-yb1; KIM-1, kidney injury molecule-1; NAG, n-acetyl-β-d-glucosaminidase; RPA-1, renal papillary antigen-1.
a Not normalized for creatinine.
b Six-hour female urine collections not analyzed for novel renal biomarkers.
Biological Variation
The median value, CVI and CVG, and RCV for each biomarker calculated from control animal data (n = 15 for each sex) are given in Tables 6 and 7. The median values for this group reflected a similar pattern of differences to that described above for the mean of all predose animals.
Median value, within- and between-animal variation, and reference change value in female control rats
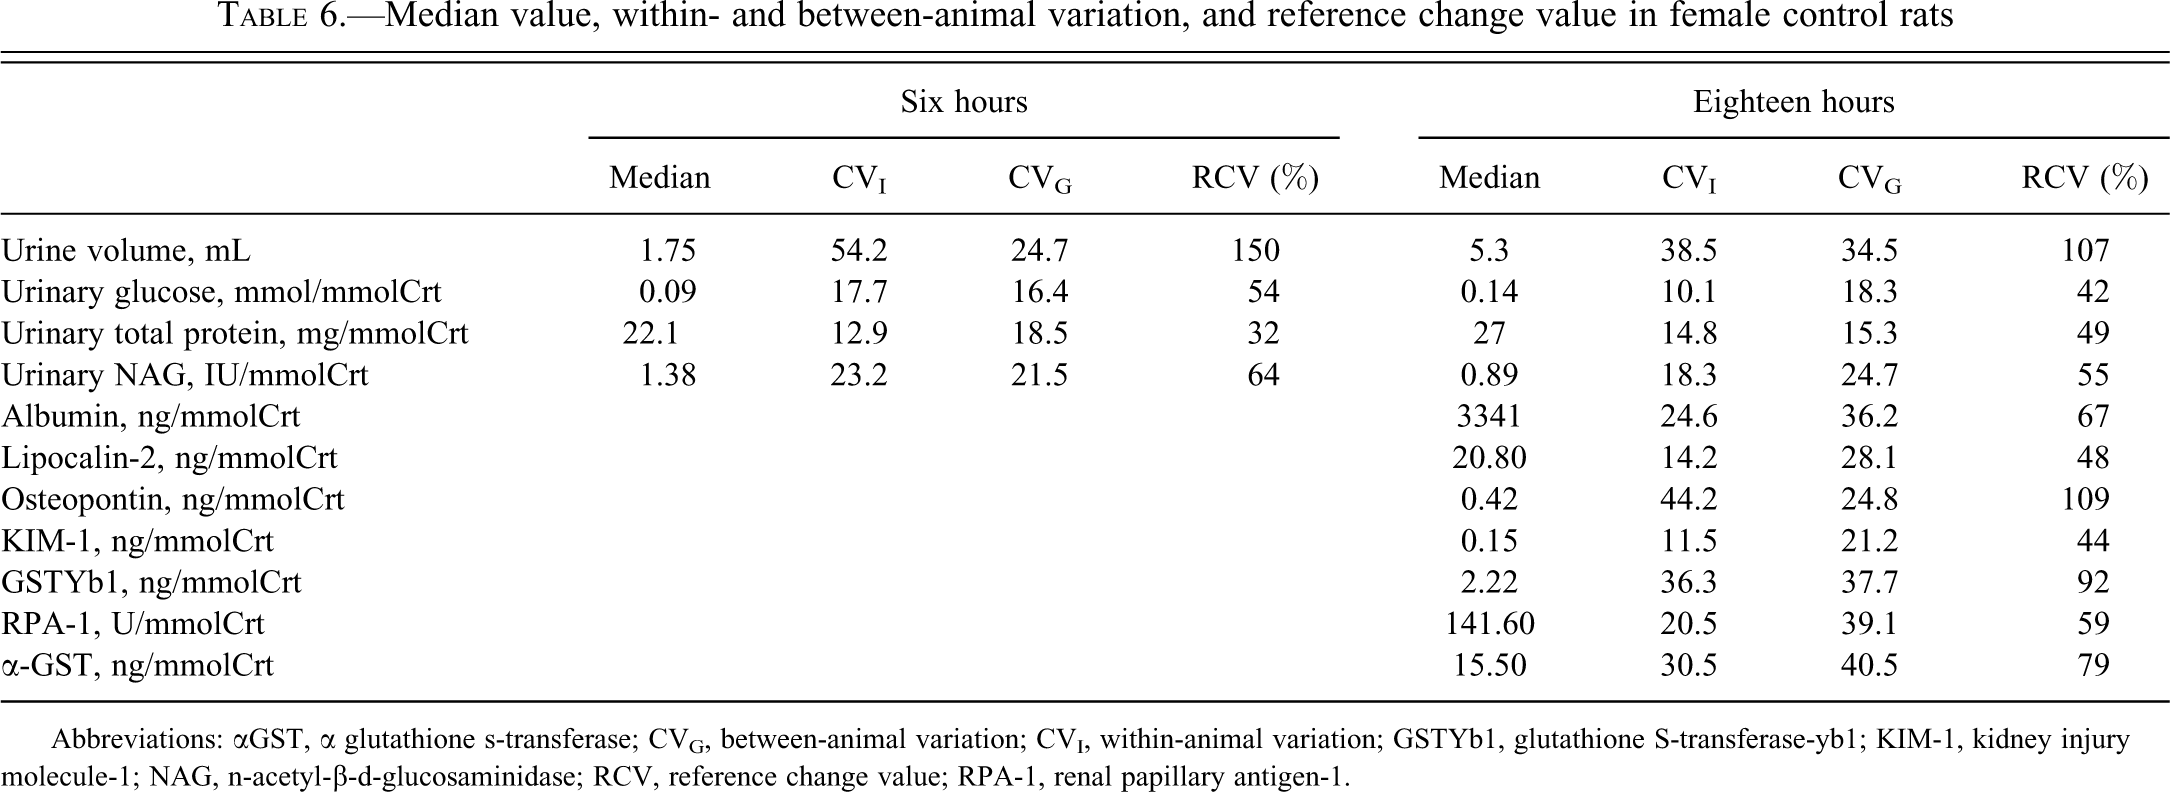
Abbreviations: αGST, α glutathione s-transferase; CVG, between-animal variation; CVI, within-animal variation; GSTYb1, glutathione S-transferase-yb1; KIM-1, kidney injury molecule-1; NAG, n-acetyl-β-d-glucosaminidase; RCV, reference change value; RPA-1, renal papillary antigen-1.
Median value, within- and between-animal variation, and reference change value in male control rats.
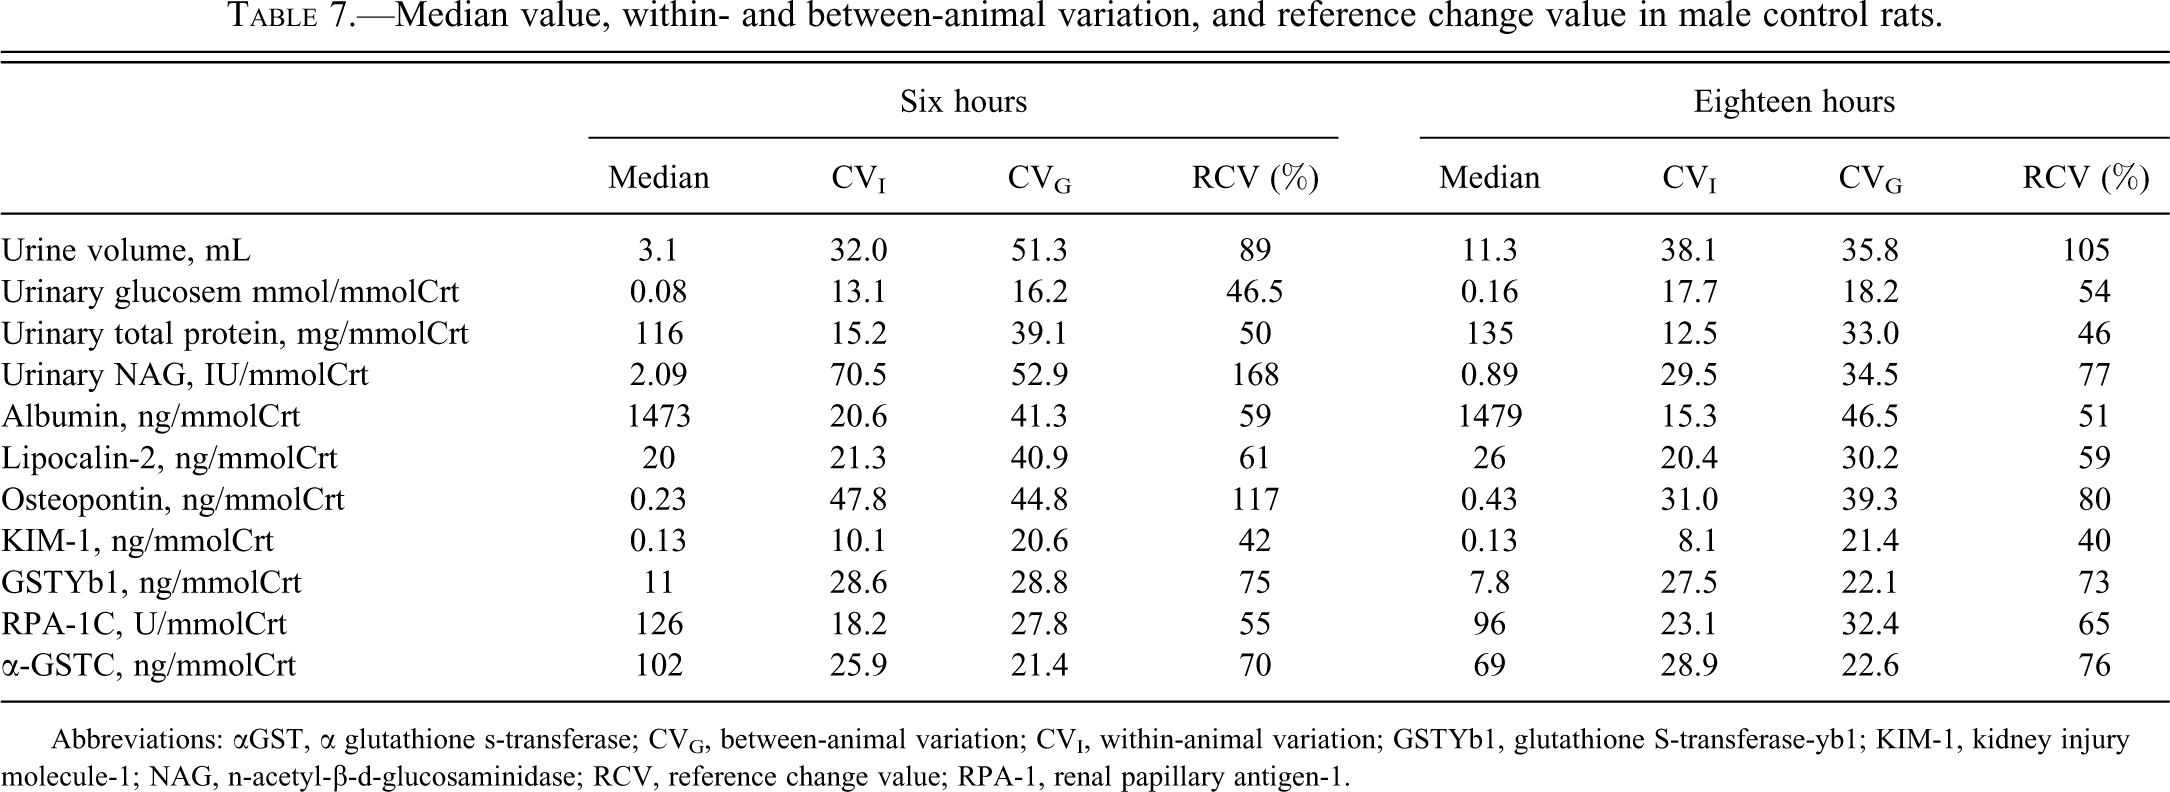
Abbreviations: αGST, α glutathione s-transferase; CVG, between-animal variation; CVI, within-animal variation; GSTYb1, glutathione S-transferase-yb1; KIM-1, kidney injury molecule-1; NAG, n-acetyl-β-d-glucosaminidase; RCV, reference change value; RPA-1, renal papillary antigen-1.
As expected, most analytes had lower CVI than CVG, with the exception of urine volume, NAG, osteopontin, and α-GST. However, for all of them, except six-hour NAG in males and six-hour urine volume in females, the magnitude of CVG and CVI was similar. A shorter collection period had a generally minimal impact on either CVI or CVG, except for urine volume in females, NAG in males, and marginally on osteopontin in males.
The RCV is defined as the critical difference that must be exceeded between two sequential results for the second value to be considered a significant (or true) finding (with p < 0.05), as opposed to noise associated with biological variation. We found most analytes had RCVs of between 50% and 100%. KIM-1 had the lowest RCV in both sexes and at both time points at ∼40%. Urine volume, osteopontin, and NAG had the highest RCV following a six-hour collection (NAG: 168%). Collection of urine volume, osteopontin, and NAG for eighteen hours tended to lead to lower RCV (except for NAG in females), but they were higher than other biomarkers for this collection period. With the exception of these analytes, RCV at both collection points were generally similar in magnitude for the other biomarkers.
Discussion
The identification and monitoring of renal injury in preclinical studies is important to the pharmaceutical industry, as it facilitates the progression of candidate drugs through the development process. The current reliance on histopathological examination and insensitive serum markers means that identifying the onset of injury and following its progression is often difficult. The novel urinary biomarkers that have recently become more widely available offer a solution to this problem; however, a thorough understanding of the biological behavior of these biomarkers is necessary to allow interpretation, understanding, and wider acceptance of their use.
A cornerstone to implementing a new biomarker is to gain understanding of the associated biological variation. Data on biological variation can be used to set analytical performance goals, determine the utility of population-based reference intervals (Harris 1974), determine the allowable difference between analytical methods (Fraser 1983; Fraser 1988; Fraser et al. 1992), and estimate the critical difference for significance between sequential results (Fraser and Harris 1989).
To date, the intra- and inter-individual biological variation of novel protein biomarkers in urine have been published for only two biomarkers, α-GST and RPA-1 in males (HESI 2008). In the present study, our findings were of a similar magnitude to those reported previously for these two biomarkers. Published information has not been available for the remaining biomarkers reported herein. Furthermore, information has also been absent from the literature regarding these biomarkers in females and over different collection periods. We found biological variation within individuals to be no greater than 48% for any novel biomarker (osteopontin in males) and no greater than 46% between individuals (albumin in males) following correction for creatinine.
Sex differences in the composition of urine have been recognized for a number of parameters such as urinary creatinine and total protein (Loeb 1989). Increased male rat urinary protein is attributable mainly to α- and β-globulins, uromucoid proteins, and prealbumin (Thrall 2004), whereas increased urine creatinine reflects the greater body mass of male rats compared with females. Given that current practice is to correct urinary biomarker values for creatinine concentration, it would be expected that if biomarker excretion were similar between sexes, then females would have slightly higher values for corrected biomarkers (owing to a lower denominator). Such findings were noted in albumin, RPA-1, and KIM-1, for which females had higher median and reference values than males. In the present study, we also reported differences in urinary concentration of α-GST and RPA-1 of magnitudes that are unlikely to reflect the influence of normalization. It was considered that such differences could be attributable to a number of factors, including potential changes in assay performance that can occur when assays are new to market and are undergoing post-marketing optimization. To determine if between-batch analytical variation was responsible for the difference between sexes noted in this study, forty samples (twenty male and twenty female) were chosen to represent a range of values and reanalyzed on the same plate for RPA-1, α-GST, and GSTYb1 (Argutus AKI MSD assay; data not shown). No significant differences were found between the original result and those obtained on the mixed-sex plate. This finding suggests therefore that the differences in these biomarkers reflect a true sex difference rather than an analytical error.
The finding that females (but not males) had focal areas of RPA-1 staining within the S3 area of the proximal tubule supports the hypothesis that there is a differential expression of RPA-1 between the sexes, that could account for the higher urinary RPA-1 values noted in females. Females also had higher albumin excretion than males, the cause of which is not apparent but may reflect changes in assay plate performance over time or could alternatively be the result of a real difference between the sexes. Additional investigatory work may be warranted to explore this finding.
This is the first study to publish detailed RCV for novel urinary biomarkers. Reference change values can be used to highlight changes in analyte results that are likely to be associated with a ‘true’ change in an individual when serial results are measured. In this way, such values are very useful when experience in the interpretation of biomarker results is limited. For most analytes in this study, a >100% increase in analyte concentration between samples would be indicative of a unidirectional change with the likelihood of this result being a false positive of < 0.05. Although such an increase may not be specifically associated with histopathologically observable changes, the RCV gives the lowest cutoff value at which biomarker changes within an individual may be considered of significance.
To date, there have been few published reference ranges for the novel urinary biomarkers that have become commercially available. Reference ranges were provided for KIM-1 and albumin in the Predictive Safety Testing Consortium submission to the U.S. Food and Drug Administration (Blank et al. 2008). It remains good practice for each laboratory facility to calculate its own reference values, as these values will vary according to rat strain, assay manufacturing changes, collection protocol, and changes in method for correction. We have presented our own reference ranges here to facilitate the acceptance and use of these biomarkers within the wider research community.
In the recent qualification opinion published by the European Medicines Agency (Abadie 2010), significant gaps were identified and recommendations were made on how to further the qualification claims made for the biomarkers included in the submission. These include extending qualification to females and monitoring biomarker change over time and correlating this to changing histological findings. The following articles in this series will address two of these gaps. Specifically, the second paper will will evaluate any differences between shorter sample collection periods (that improve animal welfare) and the longer collection periods that have been used traditionally and the final article in the series addresses sex differences and asks the question, “Do biomarker changes track resolution of histopathology?”
This article reports the design, methodology, and control animal data for a large study that was designed to assess sex and collection period differences in urinary biomarkers alongside an assessment of reversibility in these biomarkers following injury. We determined the biological variation of novel urinary biomarkers both within and between individual rats and applied this data to determine RCV for each biomarker.
Footnotes
The authors declared no potential conflicts of interest with respect to the research, authorship, and/or publication of this article.
The authors received no financial support for the research, authorship, and/or publication of this article.