
Abstract
The toxicity of polybrominated diphenyl ethers (PBDEs), flame-retardant components, was characterized in offspring from Wistar Han dams exposed by gavage to a PBDE mixture (DE71) starting at gestation day 6 and continuing to weaning on postnatal day (PND) 21. Offspring from the dams underwent PBDE direct dosing by gavage at the same dose as their dams from PND 12 to PND 21, and then after weaning for another thirteen weeks. Liver samples were collected at PND 22 and week 13 for liver gene expression analysis (Affymetrix Rat Genome 230 2.0 Array). Treatment with PBDE induced 1,066 liver gene transcript changes in females and 1,200 transcriptional changes in males at PND 22 (false discovery rate < 0.01), but only 263 liver transcriptional changes at thirteen weeks in male rats (false discovery rate < 0.05). No significant differences in dose response were found between male and female pups. Transcript changes at PND 22 coded for proteins in xenobiotic, sterol, and lipid metabolism, and cell cycle regulation, and overlapped rodent liver transcript patterns after a high-fat diet or phenobarbital exposure. These findings, along with the observed PBDE-induced liver hypertrophy and vacuolization, suggest that long-term PBDE exposure has the potential to modify cell functions that contribute to metabolic disease and/or cancer susceptibilities.
Introduction
Polybrominated diphenyl ether (PBDE) flame-retardant exposures are widespread in the United States (Schecter et al. 2010). The PBDEs have physicochemical properties similar to those of other persistent organic chemicals; they are hydrophobic and lipophilic and have a low vapor pressure and a high log Kow (U.S. Environmental Protection Agency [EPA] 2008a, 2008b, 2008c). There are up to 209 possible isomers of PBDEs. The most common PBDEs found in the environment include PBDE 47, 99, and 153 (EPA 2010; World Health Organization 2003).
The most prevalent PBDE congener found in human tissue is PBDE 47 (Petreas et al. 2003; Schecter et al. 2010; Sjodin et al. 2004). PBDE congeners show long-range atmospheric transport, environmental persistence, and bioaccumulation in various species (including humans) and are considered persistent organic pollutants (POP; World Health Organization 2003).
Environmental exposures come from the use of PBDEs as flame retardants found in polyester foams and other household products. Leaching of PBDEs from these foams deposited at waste dumps may result in the release PBDE isomers into the environment, which may affect water, fish, seals, and humans (Hale et al. 2003; Hale et al. 2002; Hale et al. 2001). The U.S. EPA has recently conducted an exposure assessment for PBDEs and reports that exposure in children (average PBDE intake, 47.2 ng/kg/day) is greater than in adults (average PBDE intake, 7.1 ng/kg/day) (EPA 2010). PBDE exposure to the infant may occur from the mother’s milk (Schecter et al. 2010; Schecter et al. 2006) and house dust (Frederiksen et al. 2010; Harrad et al. 2010; Johnson et al. 2010; Lorber 2008). PBDE exposure is associated with delayed time to pregnancy in women (Harley et al. 2010) and in altered learning parameters in children (Roze et al. 2009).
The European Union banned the use and sale of PBDEs in 2004, and the U.S. manufacturer of PBDEs voluntarily phased out its production in 2004 (EPA 2009). Nevertheless, the potential for PBDE exposures remains a concern because of continued widespread occurrence of these chemicals in the environment, and the long half-life of PBDEs in humans, which is up to six years (EPA 2010).
The biological effects of PBDEs in rodents include thyroid and liver toxicity, developmental neurotoxic effects, and reproductive toxicity (EPA 2008a, 2008b, 2008c). PBDEs disrupt endocrine activity (Hamers et al. 2006; Legler and Brouwer 2003; Meerts et al. 2001), alter thyroid hormone levels (Darnerud et al. 2007; Ellis-Hutchings et al. 2006; Zhou et al. 2002), and induce liver cytochrome p450 levels (Birnbaum and Cohen Hubal 2006; Sanders et al. 2005; Zhou et al. 2002). PBDE-induced toxicities may increase the risk for the development of other diseases (Baker et al. 2007; Ervin 2009; Yanovski and Yanovski 2002). Exposures to PBDEs, nongenotoxic chemicals (Agency for Toxic Substances and Disease Registry 2004), may cause conditions characteristic of those seen in metabolic disease (Lim et al. 2008).
Many PBDE toxicities, including endocrine and liver toxicity, are similar across species (Harley et al. 2010; Roze et al. 2009; EPA 2008a, 2008b, 2008c, 2008d). In this paper we analyze PBDE-induced rat liver toxicity and gene transcript changes to better understand the molecular basis for PBDE toxicities.
Materials and Methods
Chemical
DE-71 (technical pentabromodiphenyl oxide; CAS no. 32534-81-9) was obtained from Great Lakes Chemical Corporation (West Lafayette, IN; Lot 2550OA30A). Components of this mixture included primarily the tetra through penta PBDEs and a small component of hexabromodiphenyl ethers. The molecular weight for tetrabrominated diphenyl ethers is 469.6; for pentabromated diphenyl ethers, 548.5; and for hexabromo diphenyl ethers, 627.4. The DE71 bulk chemical analysis (National Toxicology Program 2004; Sanders et al. 2005) showed the following composition: 2,2′,4,4′-tetrabromodiphenyl ether, PBDE-47 (36%); 2,2′,4,4′,5-pentabromodiphenyl ether, PBDE-99 (42%); 2,2′,4,4′,6-pentabromodiphenyl ether, PBDE-100 (10%); 2,2′,4,4′,5,5′-hexabromodiphenyl ether, PBDE-153 (3%); 2,2′,4,4′,5,6′-hexabromodiphenyl ether, PBDE-154 (4%); and 2,2′,3,4,4′-pentabromodiphenyl ether, PBDE-85 (2%). The remaining 3% consisted of several identified tri-heptaBDEs and some unidentified PBDEs (National Toxicology Program 2004). This flame-retardant mixture also contained approximately 66 ng/g of brominated dioxins or furans. Consequently, a dose of 50 mg/kg is a dose of approximately 3.3 ng/kg body weight of brominated dioxins or furans, a dose not expected to contribute to liver toxicity (National Toxicology Program 2004; Sanders et al. 2005).
Experimental Design
Time-mated female Wistar/Han dams (CRL:WI (HAN)) were obtained from Charles River Laboratories (Raleigh, NC). Dams were dosed by gavage with 0 or 50 mg/kg DE71 in corn oil (dosing volume 5 mL/kg) from gestation day (GD) 6 through postnatal day (PND) 21, seven days per week. Pups were dosed by gavage at the same dose as their dam starting on PND 12 and continuing through PND 21 seven days per week until weaning. Weaning occurred on PND 21, which was designated as day 1 of the thirteen-week portion of the study. On day 1 of the thirteen-week portion of the study, dosing began on a five days/week schedule. Pups used for PND 22 toxicogenomic study were dosed through PND 21, the day prior to PND 22 liver sample collection. Gestational exposure at 50 mg/kg did not affect littering end points for number of dams delivering live litters, number of live or dead pups per litter, or body weights of pups during lactation (data not shown). The NIH 07 diet (Ziegler Brothers, Inc., Gardners, PA) was given to dams and pups throughout the pregnancy and gestation periods and until PND 22, at which time pups were given NTP-2000 diet (Ziegler Brothers). Tap water and NTP-2000 diet were available ad libitum (National Toxicology Program 2005a, 2005b).
On PND 22, liver samples from five male and five female rat pups from the control group and five male and five female rat pups from the 50 mg/kg group were collected for toxicogenomic analysis (each pup came from a different dam, for a total of ten dams from the control group and ten dams from the 50 mg/kg group). Liver samples were collected from ten males and ten females from the control and ten males and ten females from the 50 mg/kg groups for histopathlogic analysis (total of twenty dams from the control group and twenty dams from the 50 mg/kg group). Liver samples from five male rats were randomly selected from each group for the thirteen-week toxicogenomic analysis. No females were sampled for toxicogenomic analysis at thirteen weeks because of possible interference of estrous cycling with interpretation of toxicogenomic findings at this time point.
The care of animals on this study was according to NIH procedures as described in the U.S. Public Health Service Policy on Humane Care and Use of Laboratory Animals (Office of Laboratory Animal Welfare; April 2002). The study protocols were approved by the local animal care and use committee.
Necropsy and Collection of Liver Samples for Toxcogenomic Analysis
Animals at PND 22 and thirteen weeks were euthanized with carbon dioxide. For liver collection, the abdominal cavity of each rat was opened and the liver removed. A portion of the liver was minced on an ice-cold surface and placed into RNAlater (Ambion, Inc., Austin, TX) for incubation overnight at 4°C. The samples were then transferred to –20°C for storage prior to RNA extraction.
Liver Histopathology
Sections of the livers from the week 13 male rats were fixed in 10% neutral buffer formalin, embedded in paraffin, sectioned at approximately 5 μm, and mounted on glass slides. After staining with hematoxylin and eosin, coverslips were attached to the slides. Tissues were then evaluated microscopically at different magnifications by a board-certified veterinary pathologist.
The grading criteria for hepatocellular hypertrophy was as follows: minimal severity was recorded when hepatocellular hypertrophy was observed but was present in <10% of the hepatocytes in the section; mild severity was recorded when ≥10% and <50% of the hepatocytes in the section were affected; moderate severity was recorded when ≥50% and <75% of the hepatocytes in the section were affected; and marked severity was recorded when ≥75% of the hepatocytes in the section were affected. Cytoplasmic vacuolization was graded independently of hepatocellular hypertrophy according to the following grading scale: minimal severity was recorded when cytoplasmic vacuolization was observed but was present in <25% of the hepatocytes in the section; mild severity was recorded when ≥25% and <50% of the hepatocytes in the section were affected; moderate severity was recorded when ≥50% and <75% of the hepatocytes in the section were affected; and marked severity was recorded when ≥75% of the hepatocytes in the section were affected. Livers from control and treated rats were cryosectioned and stained with Oil Red O to identify the presence of lipids.
RNA Preparation and Microarray Hybridization
A section of the liver was collected at necropsy and placed into RNAlater (Ambion, Inc., Austin, TX). RNA was extracted from liver using the QIAGEN RNeasy (QIAGEN, Valencia, CA). The RNA was analyzed for quantity and purity by UV analysis using the NanoDrop ND-1000 (NanoDropTechnologies, Wilmington, DE). Samples were concentrated using Microcon filters (Millipore, Billerica, MA). All samples were evaluated for RNA integrity by gel electrophoresis using the Flash Gel RNA cassette system (Lonza, Rockland, ME). Total RNA (50 ng) was used to synthesize double-stranded cDNA for each sample using Affymetrix GeneChip® Expression 3′amplication two-cycle target labeling and control reagents (Affymetrix, Inc., Santa Clara, CA). The cDNA served as a template to synthesize biotin-labeled antisense cRNA using an in vitro transcription (IVT) labeling kit. Labeled cRNA was fragmented and hybridized to the Affymetrix Rat Genome 230 2.0 GeneChip Array®. Array hybridization, washing, and staining were performed according to the Affymetrix recommended protocol EuKGE_Ws2v5. The chips were scanned using an Affymetrix GeneChip® Scanner 3000. Quality control measurements were evaluated to determine if the data derived from the arrays were of sufficient quality prior to comparisons for differential expression.
Microarray Data Analysis
Data Normalization
Probe intensity data from all Rat Genome 230 version 2.0 Affymetrix GeneChip® arrays was read into the R software environment (http://www.R-project.org) directly from .CEL files using the R/affy package (Gautier et al. 2004). Probe-level data quality was assessed using image reconstruction, histograms of raw signal intensities, hierarchical clustering of samples, and MvsA plots. Normalization was carried out using the robust multi-array average (RMA) method using all probe intensity data sets together (Irrizarry et al. 2003). Briefly, the RMA method adjusts the background of perfect match (PM) probes, applies a quantile normalization of the corrected PM values, and calculates final expression measures using the Tukey median polish algorithm.
Statistical Assessment of Differential Gene Expression
Analysis of variance (ANOVA) methods were used to statistically resolve gene expression differences using the R/maanova package (Wu et al. 2003). To find differentially expressed probe sets in response to dose, the data were subset into male pups, female pups, or male rats. Then the model

was used to fit the log-transformed gene expression measures Yi, where μ is the mean for each array, DOSE is the dose effect (control, 50 mg/kg), and ∊i captures random error. To find sex-related effects in pups, the data were subset into 59 mg/kg dose or control pups and the model

was used, where SEX is the sex effect (male, female). To find age-related effects in males, the model

was used, where AGE is the effect for age (PND 22, thirteen weeks), DOSE is the dose effect (control, 50 mg/kg), and AGE:DOSE is the interaction effect between age and dose. Finally, to test for sex-dependent responses in dose response, the model

was used, where SEX:DOSE is the interaction effect between sex and dose. All statistical tests were performed using Fs, a modified F statistic incorporating shrinkage estimates of variance components (Cui et al. 2005). P values were calculated by permuting model residuals 1,000 times and corrected using the p.adjust() function in R using method = “BH.”
Gene Ontology Analyses
Overrepresented classifications of genes were determined from statistical outcomes by testing for association with biological process gene ontology (GO) terms. Enrichment of pathway members among differentially expressed probe sets was found using the one-tailed Fisher exact test for 2 × 2 contingency tables. Mappings between Affymetrix probe sets, Entrez gene identifiers, and GO terms are based on the R/rat2302.db package (http://www.bioconductor.org).
Comparison of Gene Transcript Expression to Human Disease
Gene lists and the normalized gene expression estimates (Equations 1–4 above) were compared against results in the literature using the NextBio Platform (Kupershmidt et al. 2010). The NextBio Platform is a Web-based tool to search, discover, and share knowledge using correlation analyses that are able to integrate data across various gene expression platforms and experiments for public and proprietary data. These studies include data sets that have been published and are available in GEO.
Using the NextBio datasets, we compared PND 22 male pup liver transcript data (∼1,200 differentially expressed transcripts; false discovery rate (FDR) < 0.01) to gene transcript patterns in other disease conditions. PBDE transcript patterns were compared to those in rats after phenobarbital exposure (Waterman et al. 2010). Because brominated chemicals induce colon cancers in rodents (Dunnick et al. 1997a), and to further examine the potential of brominated flame retardants to create colon disease susceptibilities, we compared the PBDE transcript patterns to those in human colon cancer gene expression profiles (Ancona et al. 2006; Irizarry et al. 2009; Jorissen et al. 2008; Saaf et al. 2007).
Results
Polybrominated diphenyl ether exposures (DE71) at 50 mg/kg caused no treatment-related effects on survival of rats. Body weight of treated males was 7% greater than controls (p = .13) and 14% lower than controls for females at week 13 (p = 0.002; Table 1 ). Treatment-related liver toxicity and increased liver weights occurred in both sexes (Table 1; Figure 1 ). At week 13, the liver toxicity consisted of hepatocyte hypertrophy characterized by enlarged hepatocytes with an increased amount of cytoplasm, enlarged nuclei, and pale eosinophilic and granular cytoplasm. The hepatocyte hypertrophy was observed primarily in the centrilobular and midzonal regions of the hepatic lobule (lesion not shown).
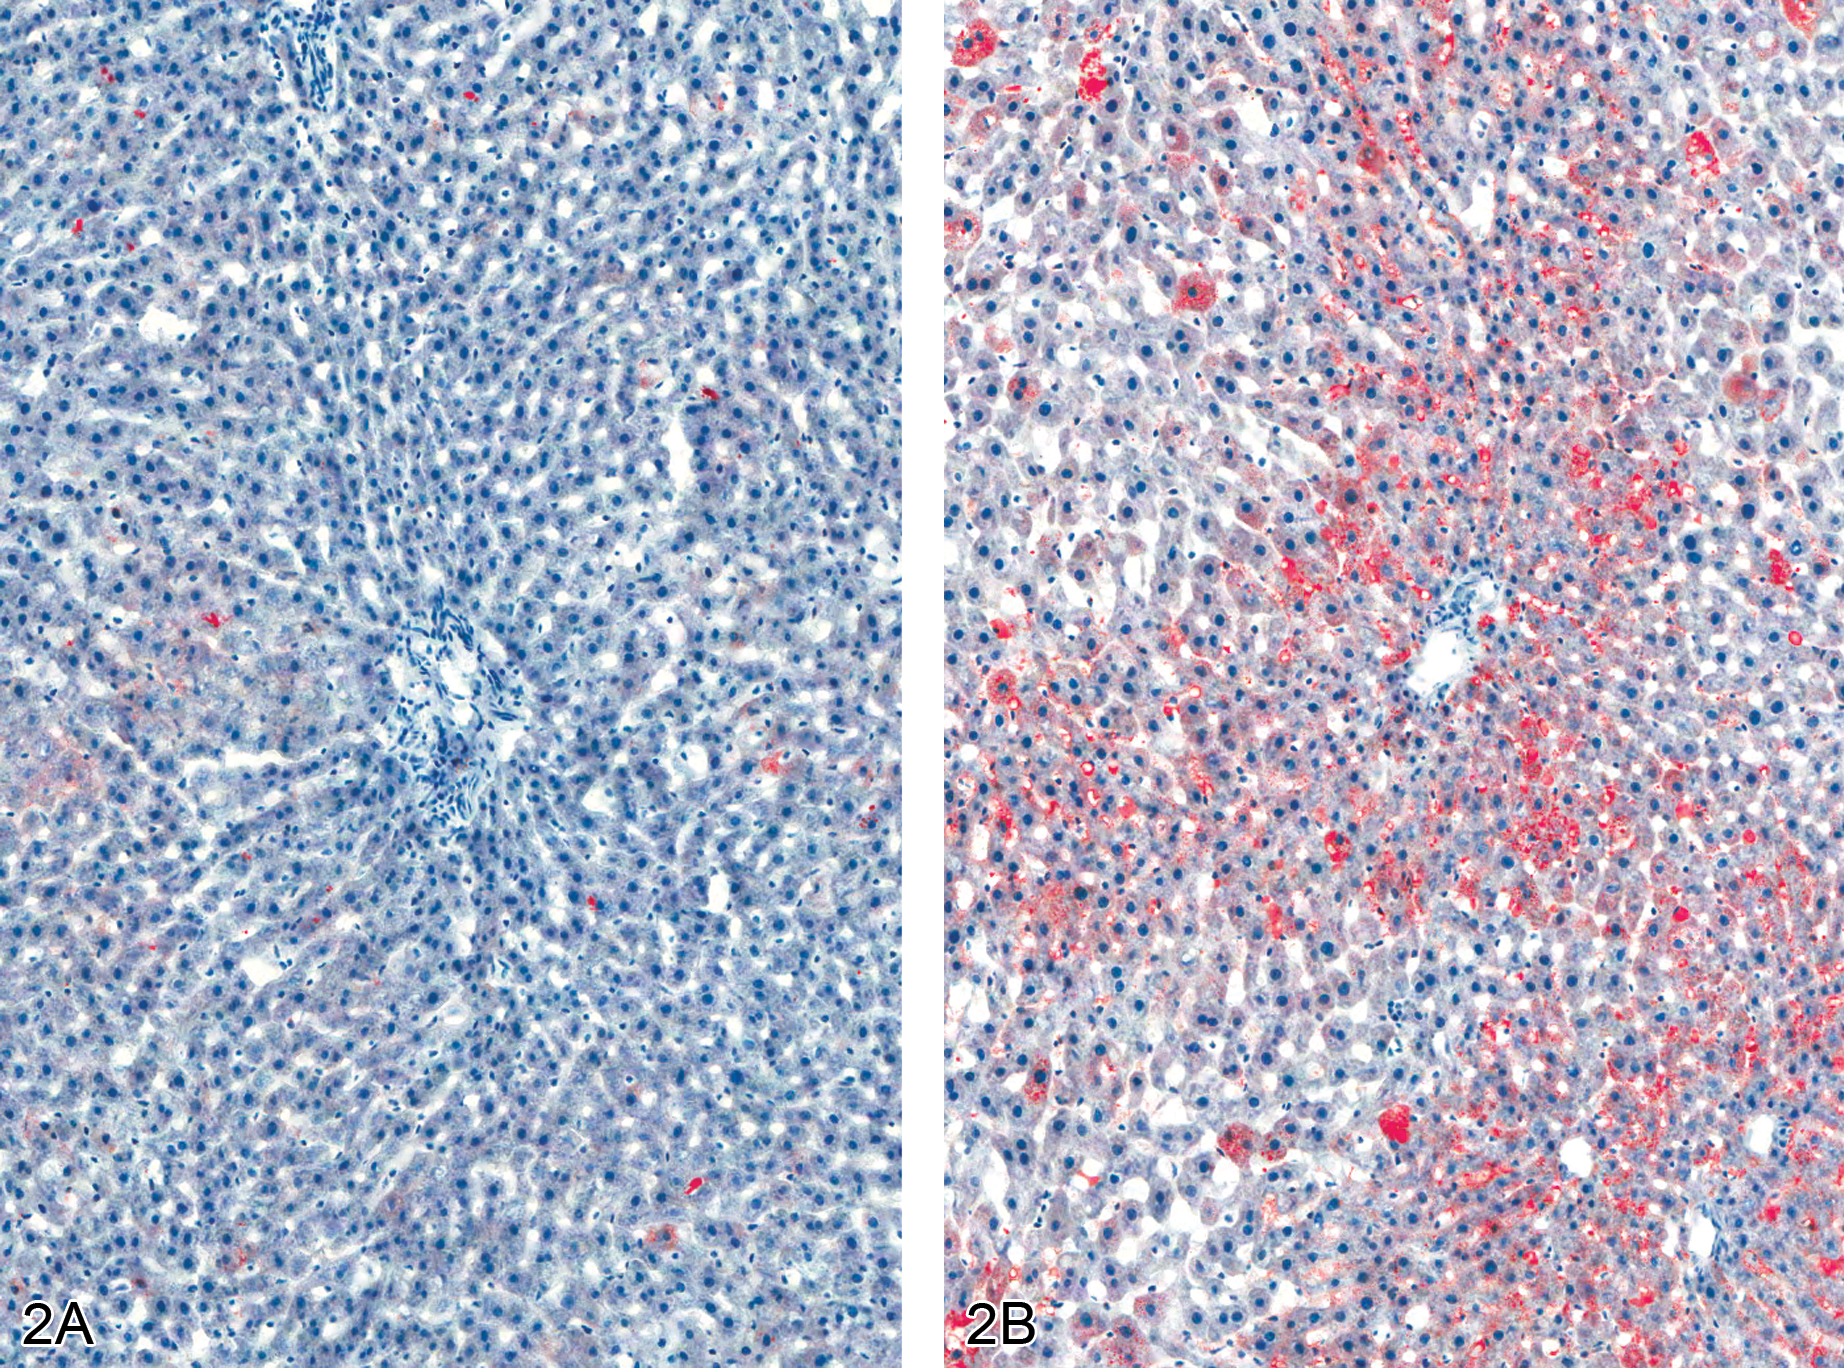
Fat accumulation in polybrominated diphenyl ether–treated liver at thirteen weeks (Oil Red O staining of frozen liver sections). (A) Male rat, normal control liver. 10×. (B) Male rat, 50 mg/kg, increase in the amount of fat in the liver of the treated rat, as evidenced by increased red stain. 10×.
Treatment-related effects of polybrominated diphenyl ether, male rats, week 13.
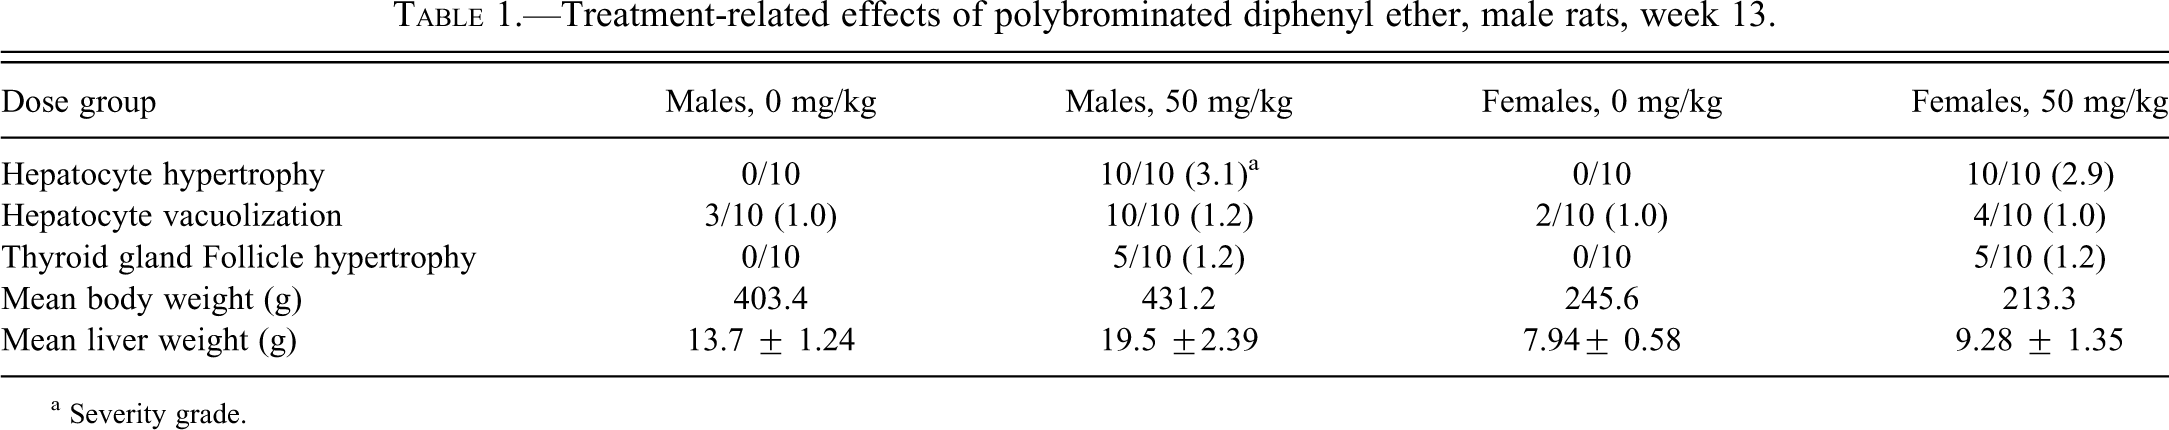
a Severity grade.
Hepatocyte cytoplasmic vacuolization was also observed at thirteen weeks in treated rats and consisted of multiple small, variably sized vacuoles or large discrete, singular vacuoles within the cytoplasm of enlarged hepatocytes. Some hepatocytes contained a few scattered, small vacuoles within the cytoplasm, and other heptocytes were distended with numerous small vacuoles in the cytoplasm (microvesicular vacuolization). In addition, scattered large, generally singular but occasionally multiple, clear vacuoles, compatible with macrovesicular vacuolization, were also noted in association with the microvesicular cytoplasmic vacuolization (Figure 1). Hepatocellular cytoplasmic vacuolization was most prominent in the periportal regions. Positive staining with Oil Red O indicated the vesicles within the cells from treated rats contained lipid (Figure 2 ).
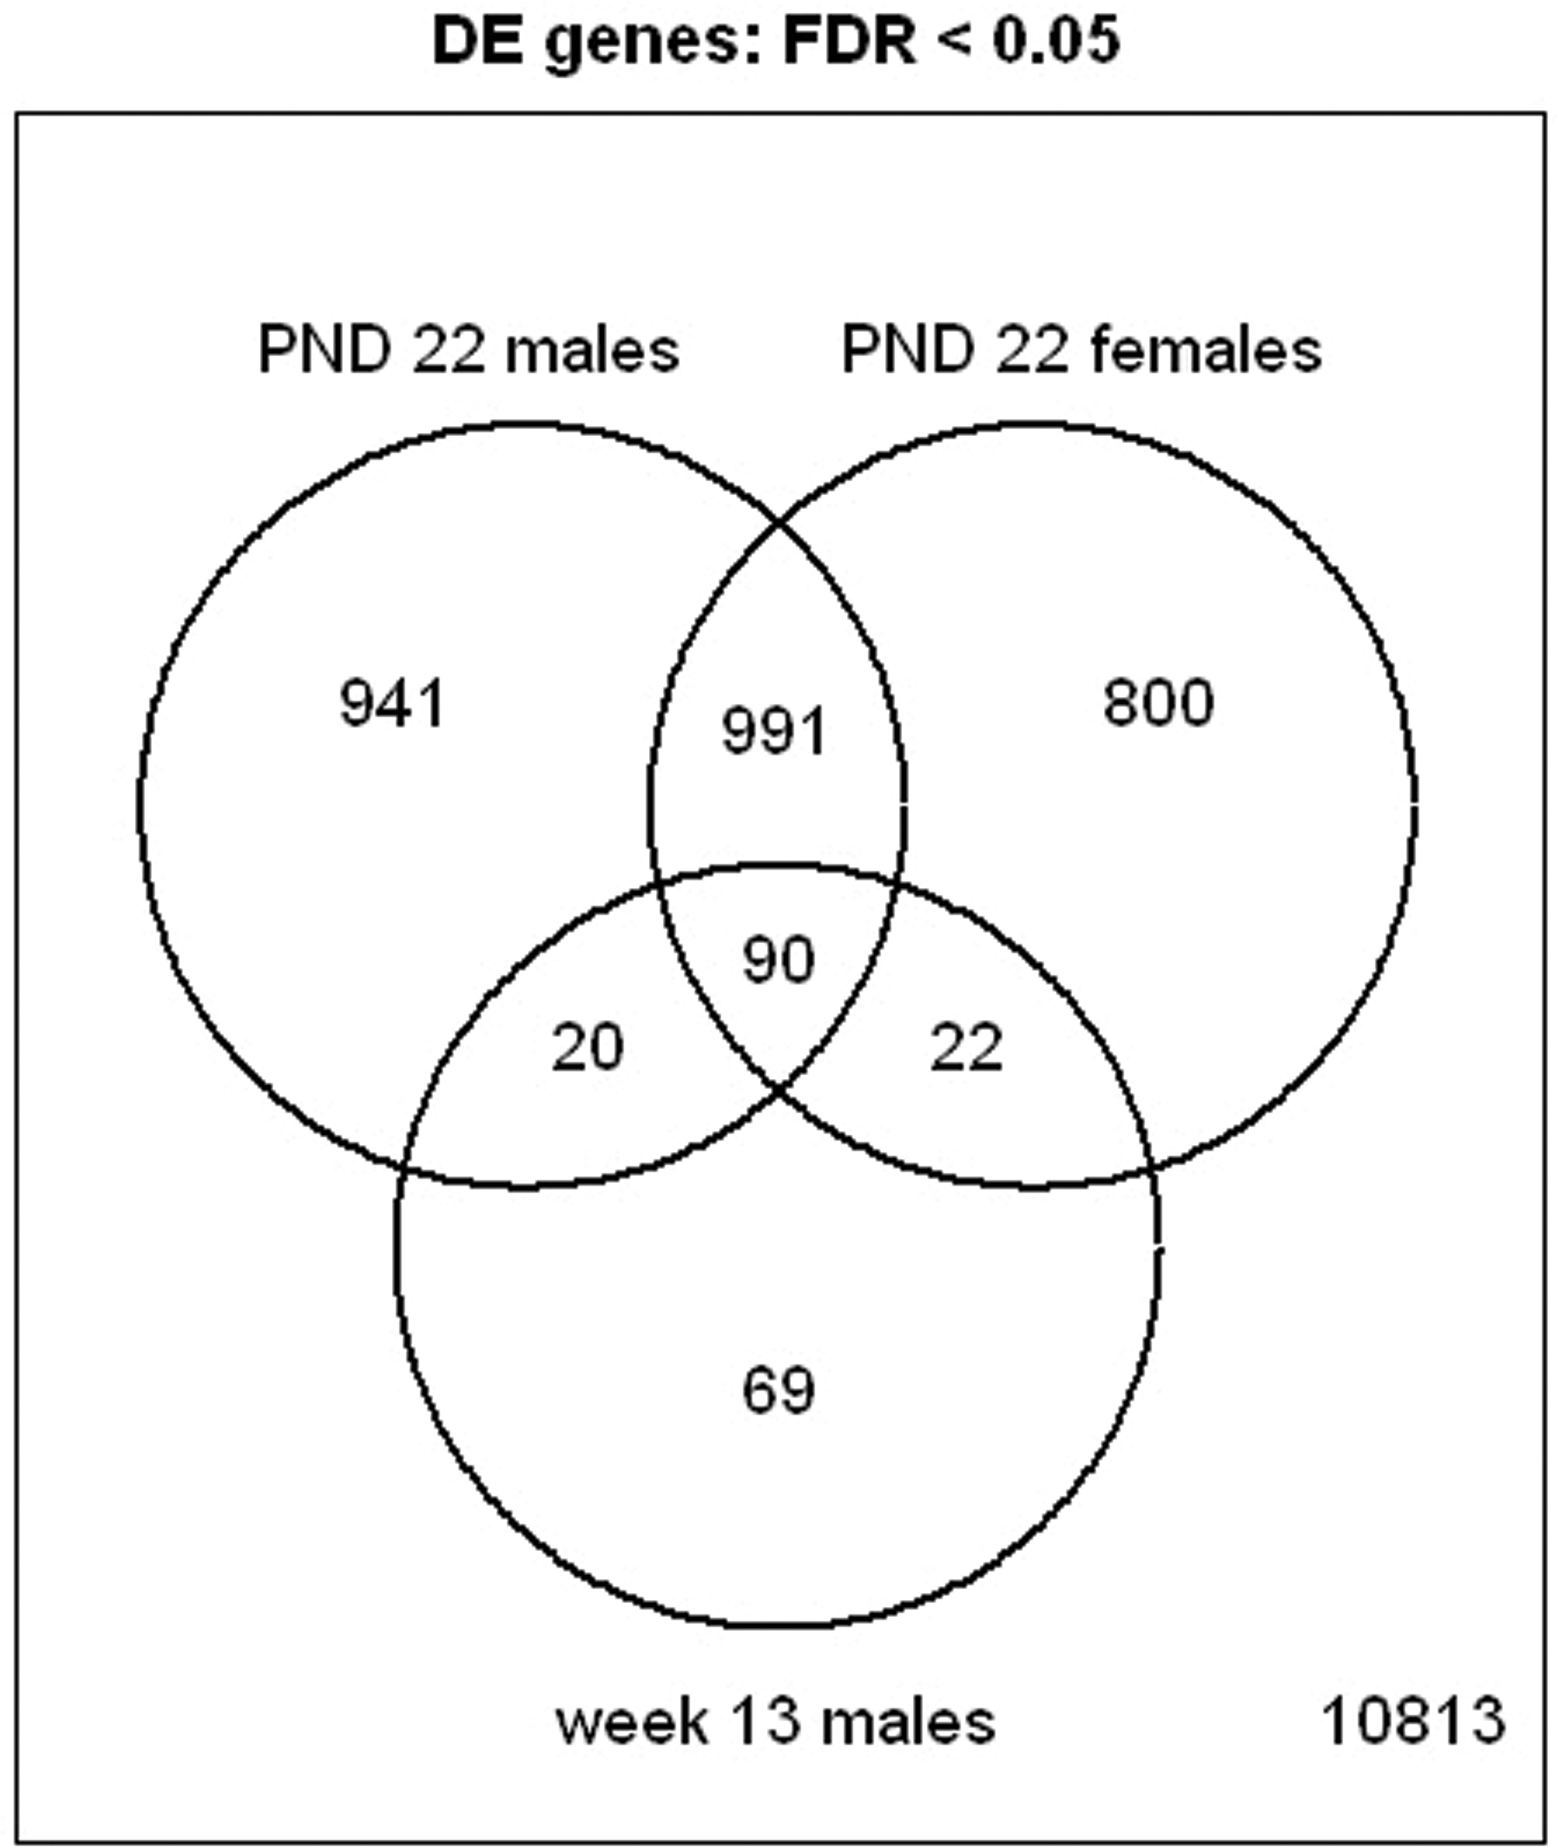
Venn diagram of overlapping significant gene transcripts at PND 22 (males [PMH/PMC] and females [PFH/PFC]), and week 13 (males [RMH/RMC]).
A total of 1,200 differentially expressed transcripts (DETs; control vs. treated animals) were found in male pups, and 1,066 DETS were found in females, at PND 22 (FDR < 0.01). The gene list size for thirteen-week male rats was too small to investigate at FDR < 0.01. However, at an FDR of 0.05, there were 263 DETs in male rats at week 13 (Table 2 and Supplements 1–3). Approximately ninety genes in common were found to be differentially expressed because of PBDE treatment (FDR < 0.05) in PND 22 males, PND 22 females, and week 13 males (Figure 3 ; Supplement 4). Some of the transcripts that were up-regulated at PND 22 and week 13 included aldh1a1, cyp1a1, abcc3, zshhx2, far4, cltb, abhd4, abhd4, ces2, zeint, fam134b, and vps26a. However, at PND 22 there were many more cytochrome P450s up-regulated than at week 13.
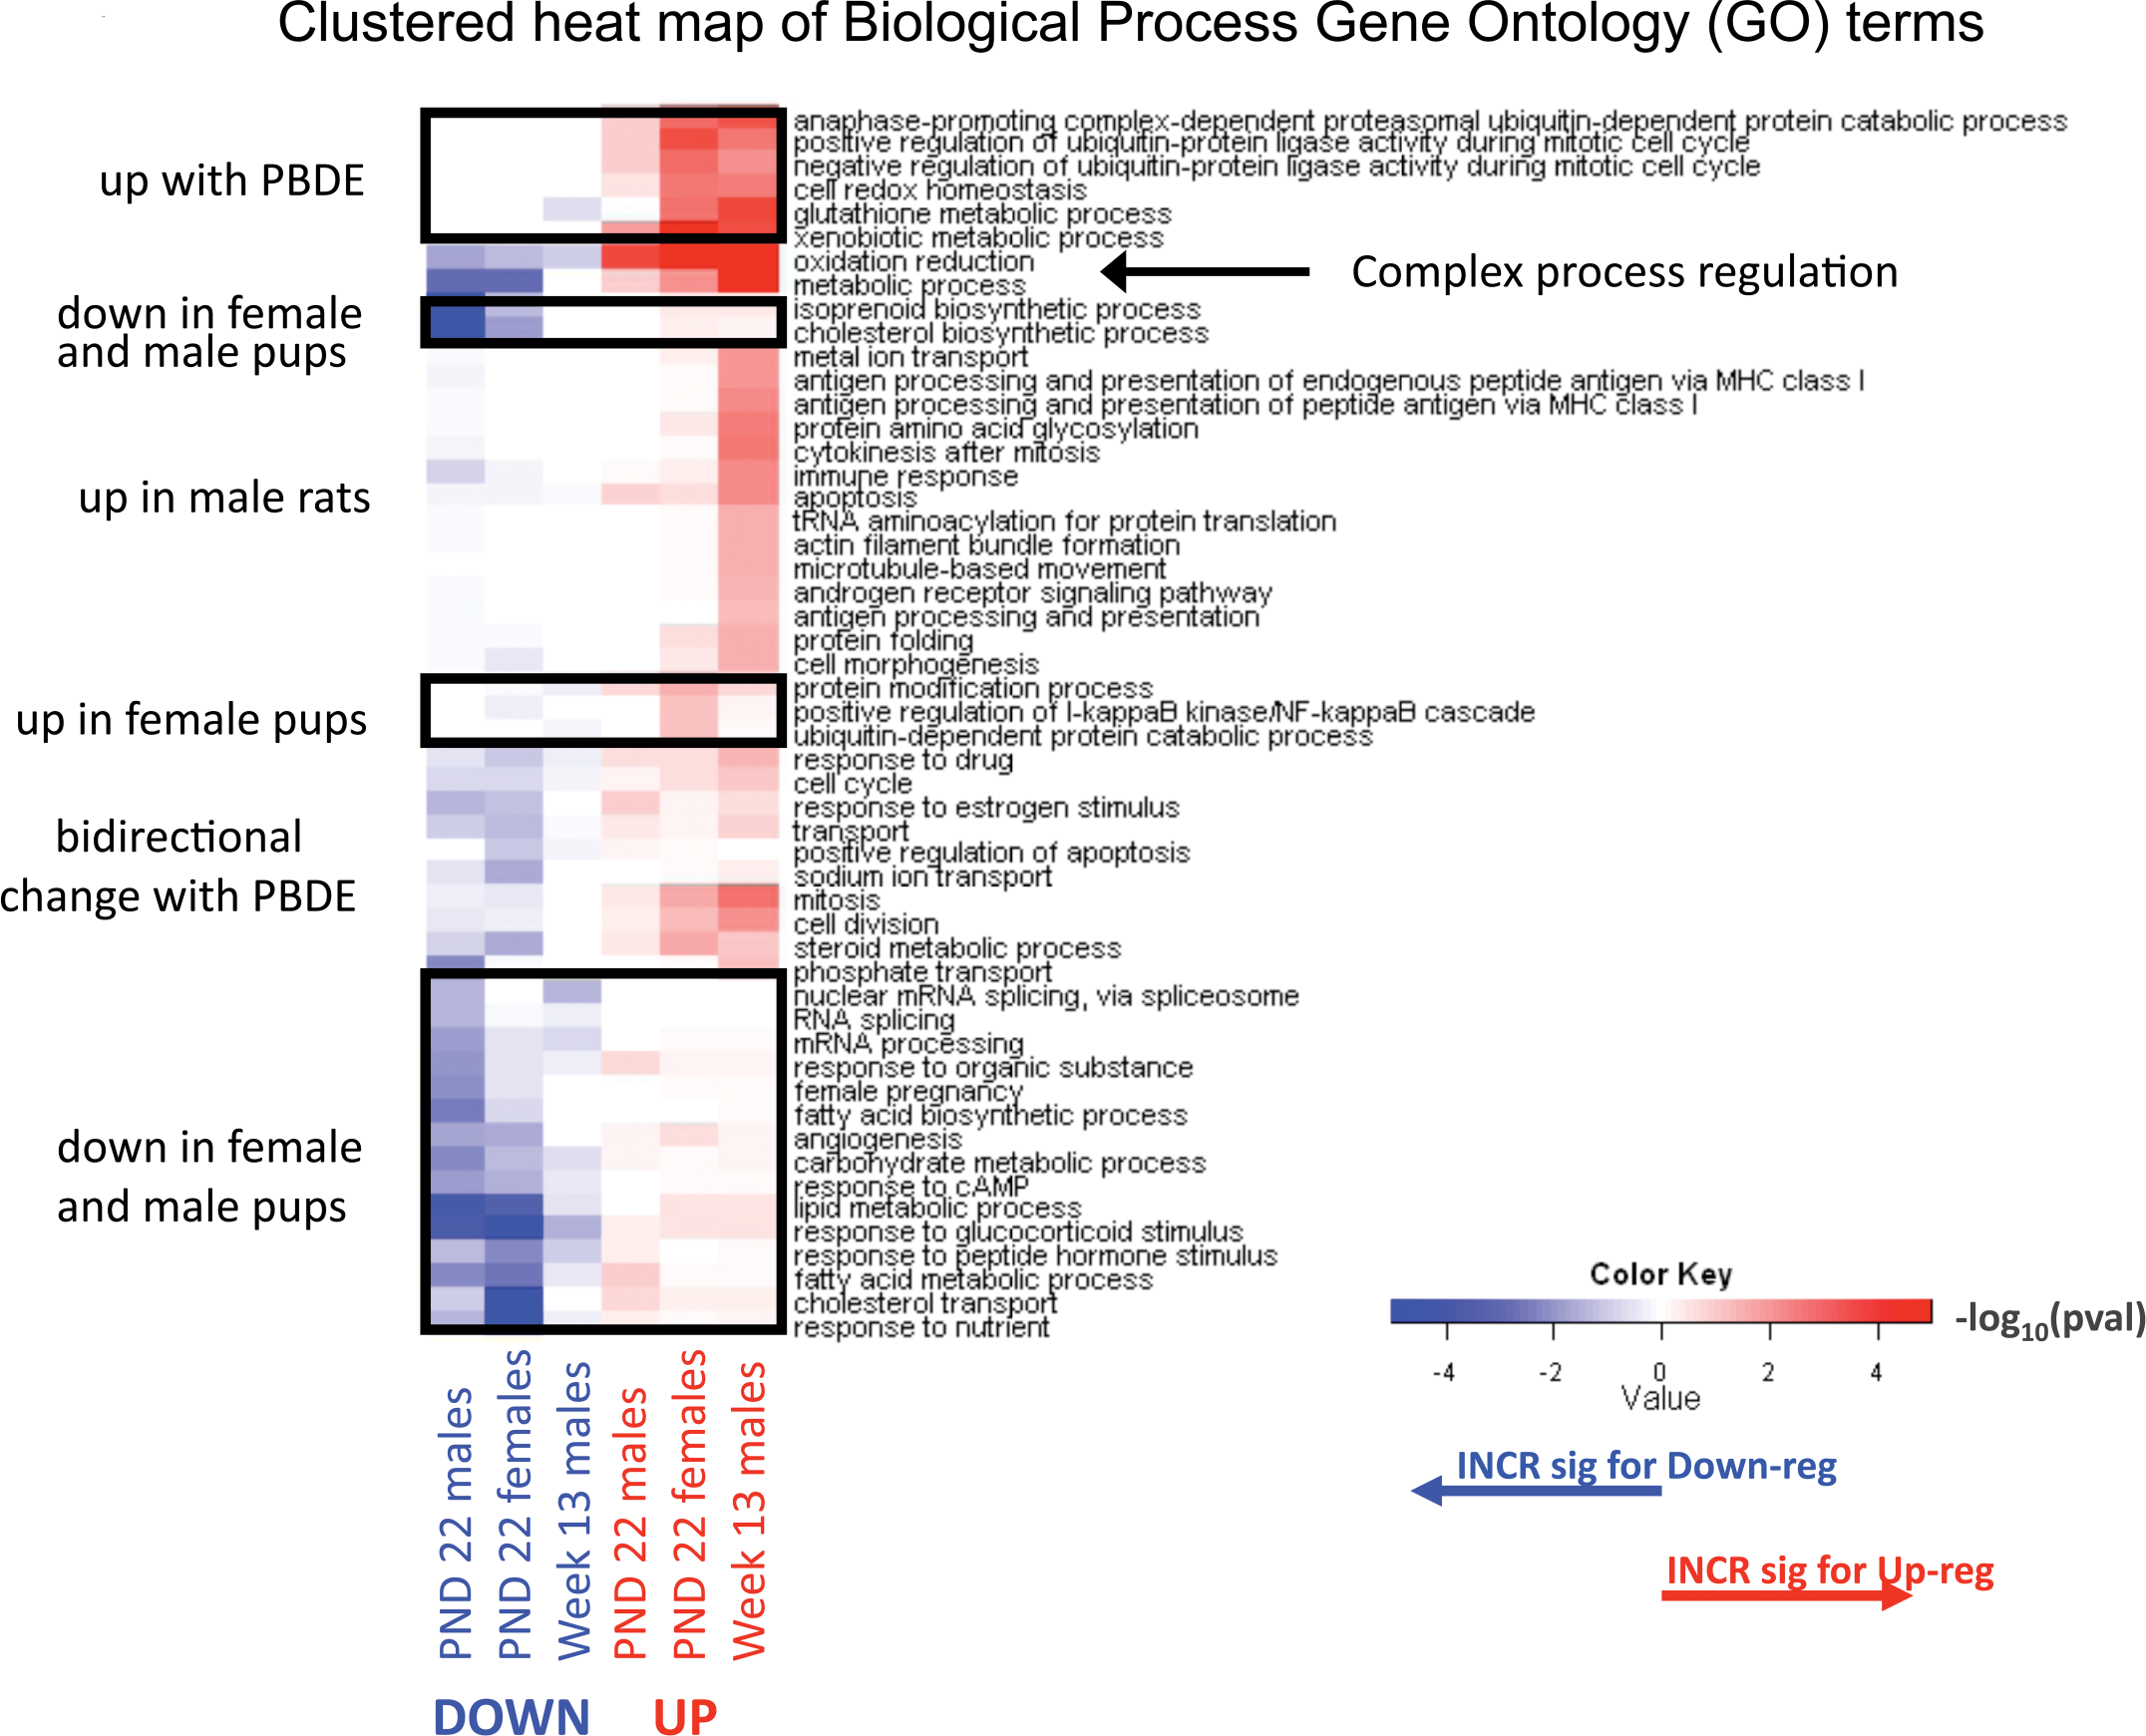
Clustered heat map of biological process gene ontology (GO) terms in up-regulated (red) or down-regulated (green) genes in comparison to PBDE-treated (H) animals to controls (C). Differentially expressed genes for female and male pups (P) were determined by a false discovery rate (FDR) threshold of 0.01, whereas gene lists in thirteen-week-old rats (R) were based on FDR < 0.05. Included processes have p < .05 and at least five differentially expressed genes in at least one comparison. Color key scale indicates the minus log10 p value of GO term significance. Comparisons of female pups (PFH vs PFC), male pups (PMH vs PMC), thirteen-week-old rats (RMH vs RMC).
Number of polybrominated diphenyl ether–induced significant liver gene transcripts.
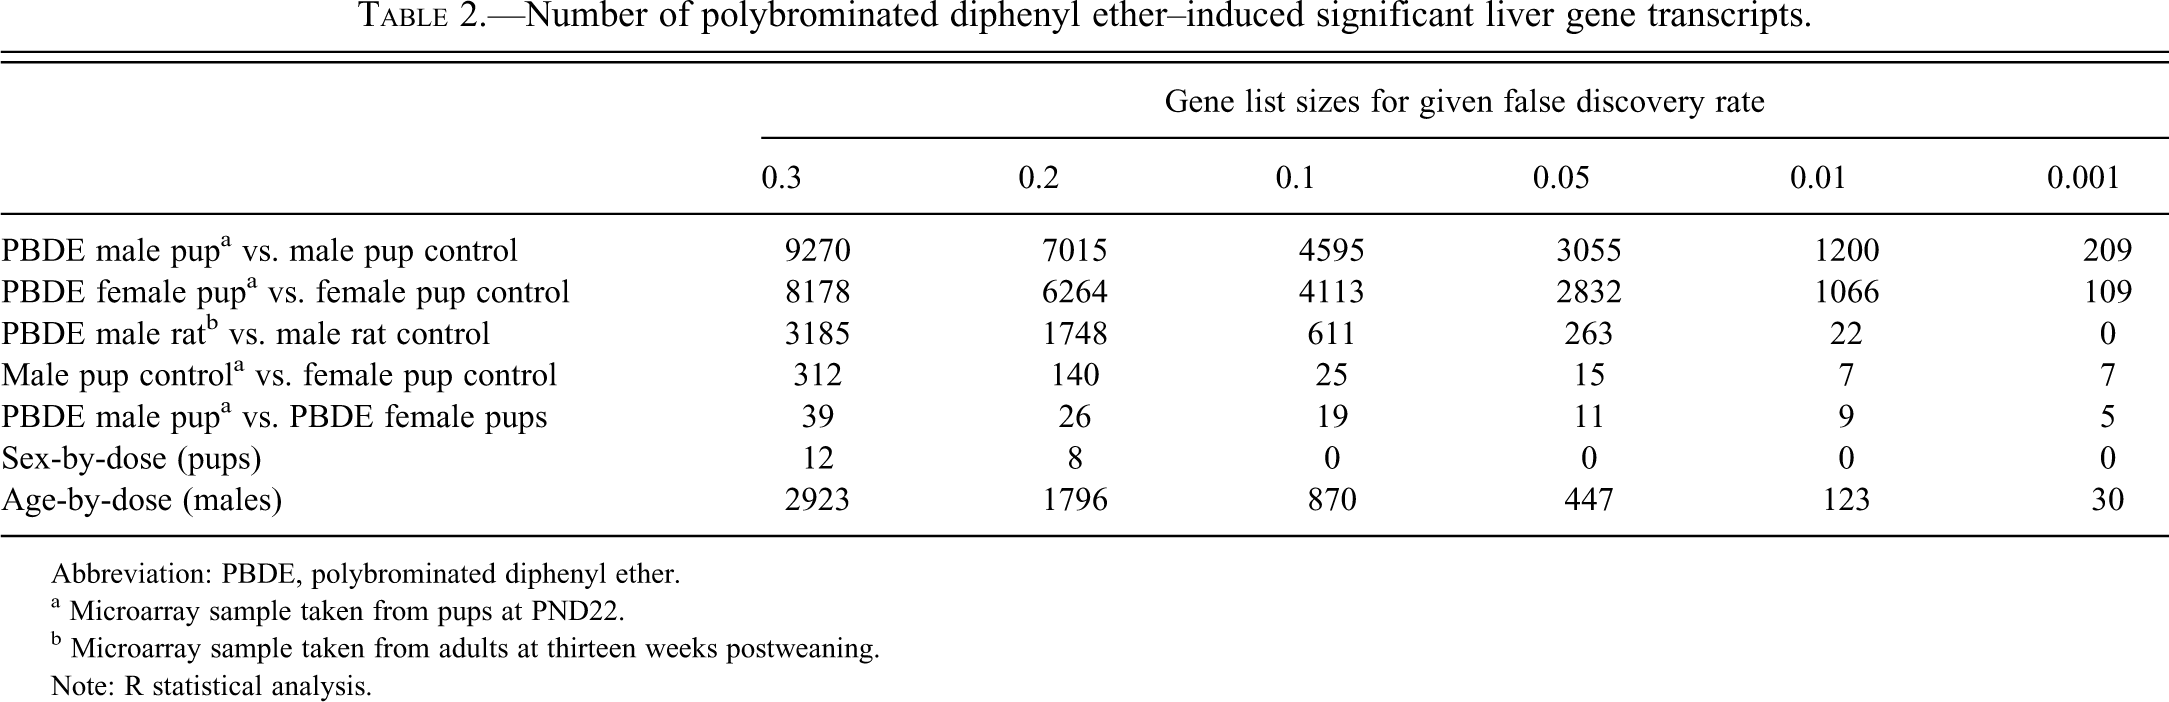
Abbreviation: PBDE, polybrominated diphenyl ether.
a Microarray sample taken from pups at PND22.
b Microarray sample taken from adults at thirteen weeks postweaning.
Note: R statistical analysis.
No sex-dependent differences in gene expression response to PBDEs were found at PND 22 (Table 2; FDR < 0.01). Therefore, we used male PND 22 data to represent the PND 22 profile. With increasing time of PBDE exposure, an adaptive response to the PBDE liver toxicity was suggested by the larger number of DETs found at PND 22 (3,055 DETs FDR < 0.05) than at week 13. A total of 447 age-dependent changes in gene expression response to PBDEs were found here (FDR < 0.05).
Gene ontology analysis (Supplement 5) indicated that gene transcript changes found at PND 22 (Supplements 1 and 2) and week 13 (Supplement 3) are important in multiple cell functions, including oxidative and metabolic functions (Figure 4A). Alterations in transcripts for lipid metabolism were also significant at PND 22 (Table 3B). Many cytochrome P450 transcripts were increased in treated PND 22 pups (Table 3C). PBDE treatment induced alterations in cell cycle gene transcripts and in cancer disease pathways (Table 3D). Up-regulation of the Abcc3 transcript (functions in metabolite conjugation) and glutathione S-transferase α 4 (Gsta4) occurred at both PND 22 and week 13.
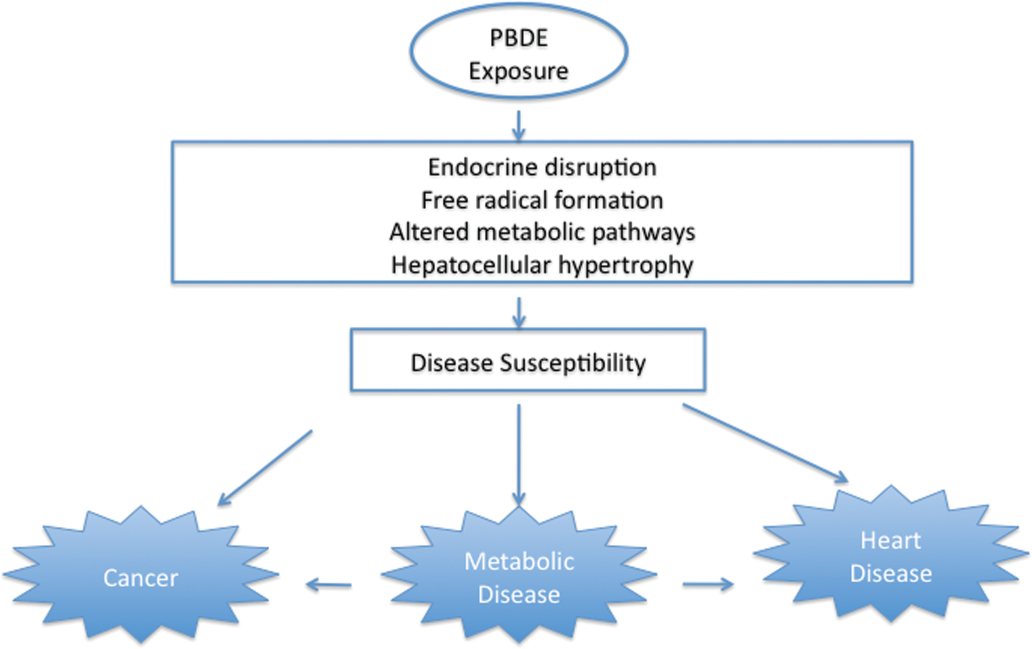
Steps in PBDE toxicity process.
Selected liver gene transcript changes in postnatal day 22 male pup liver.a
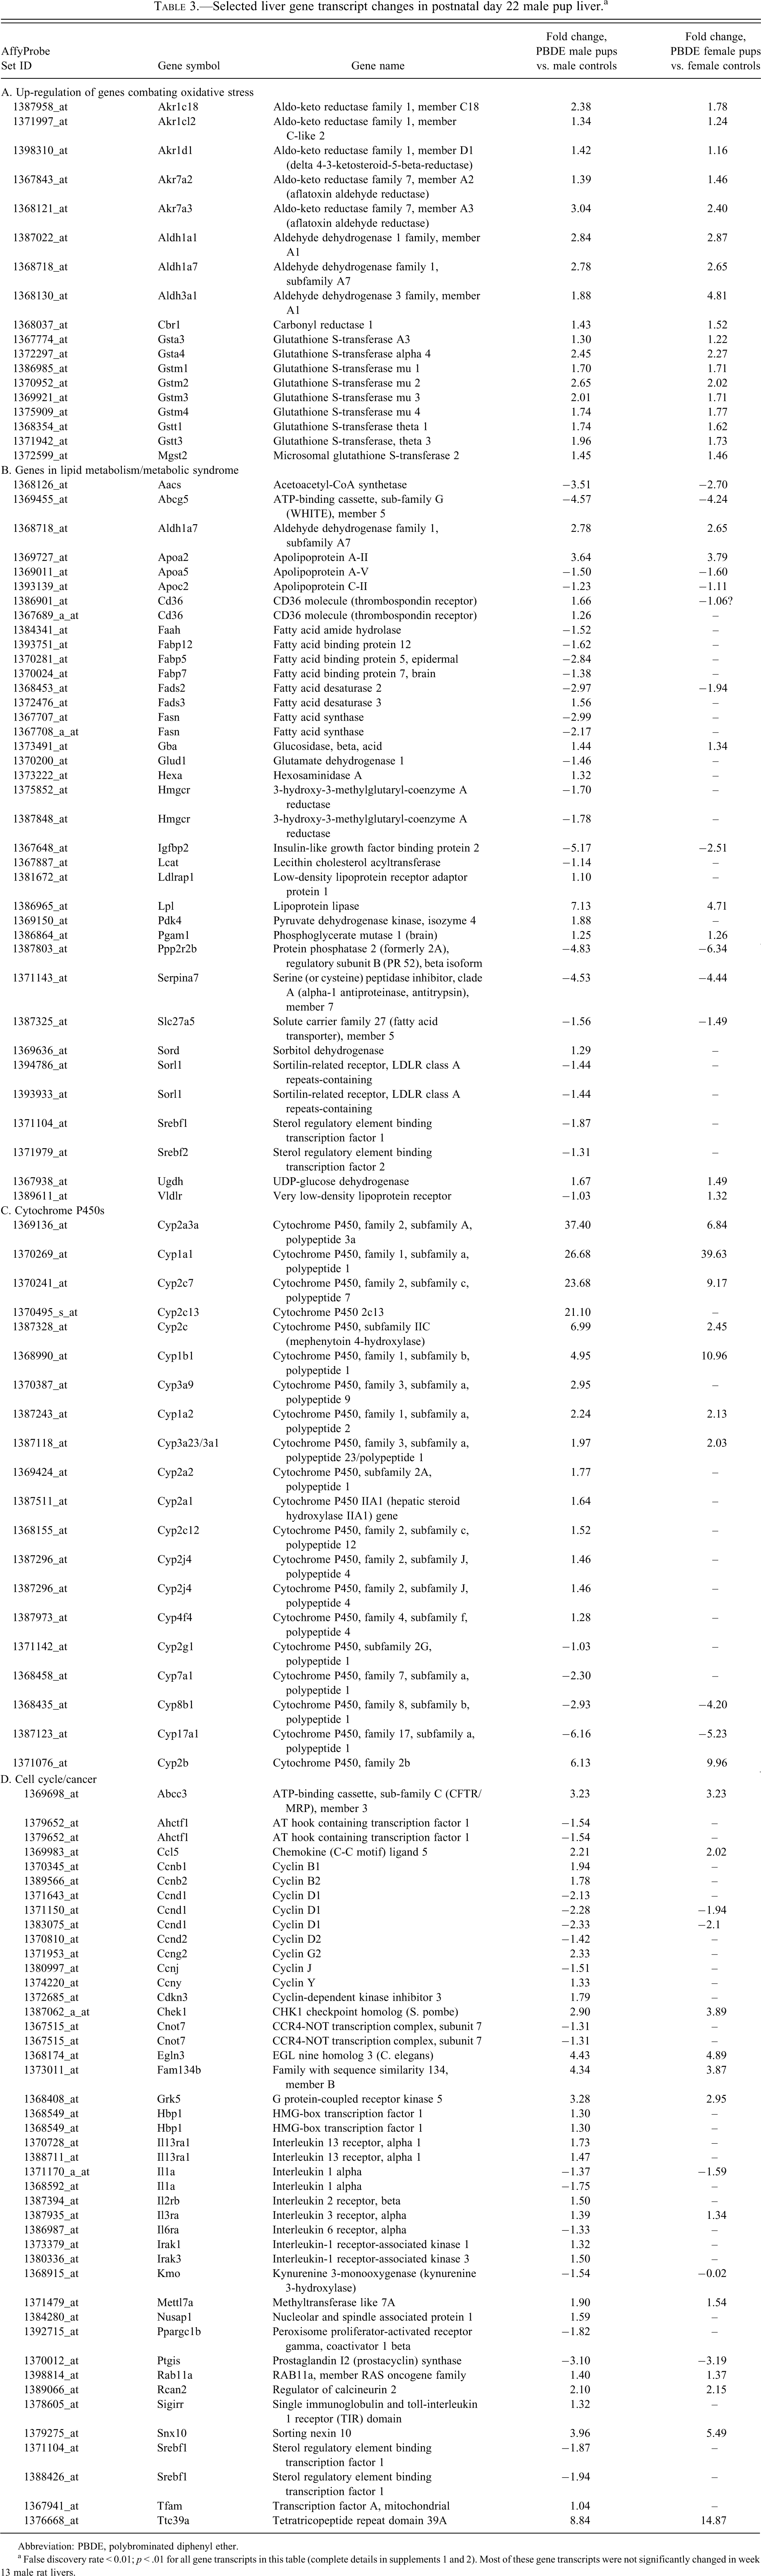
Abbreviation: PBDE, polybrominated diphenyl ether.
a False discovery rate < 0.01; p < .01 for all gene transcripts in this table (complete details in supplements 1 and 2). Most of these gene transcripts were not significantly changed in week 13 male rat livers.
After scrutinizing the expression pattern of important genes (described above), PND 22 transcript data were subjected to a global bioinformatics analysis using NextBio software to compare the expression profiles obtained in this study to expression profiles found in the literature. PBDE liver gene transcript patterns correlated with other rodent studies on high-fat diets, including upregulation of cyp2c7, ces2, lpl, cyp2c, cyp2b2 (Almon et al. 2009; van Erk 2011). PBDE transcript patterns correlated with liver transcript patterns after phenobarbital exposure (rats; Supplement 6), with 67 up-regulated transcripts and 164 down-regulated transcripts that overlapped those in phenobarbital-treated rats, including up-regulation (>4 fold) of transcripts for P450, chemokine, carboxyesterase, and growth arrest activity (cyp1a1, cxcl9, ces2, zdhhc2, lpl, cyp2b2, rn71071, cyp1b1, egin3, and gadd45b).
PBDE transcript patterns were similar to some of the changes found in human cancers, including colon cancers (Supplement 7). Transcripts up-regulated in human colon cancer and after PBDE treatment included cyp2b6, fam134b, chek1, rcan2, ccng2, ccl5, and acacb.
Discussion
In utero/postnatal exposure of Wistar Han rats starting on GD 6 (start of organogenesis) to a mixture of low-molecular-weight polybrominated diphenyl ethers (PBDEs) resulted in liver toxicity characterized by hepatocyte hypertrophy and hepatocyte cytoplasmic vacuolization. This liver toxicity in the Wistar Han rat is similar to that observed in the F344/N rat after PBDE exposure (Dunnick and Nyska 2009). Hepatocellular vacuolization, as seen in PBDE rat livers, is often indicative of accumulation of fat deposits (Eustis et al. 1990). Nonalcoholic fatty liver is a hepatic manifestation of the metabolic syndrome (Lucero et al. 2010) and a common cause of liver enzyme elevation in humans and in rats (Stickel and Hellerbrand 2010).
The occurrence of hepatocellular hypertrophy and vacuolization may predispose rats to liver cancer. However, not all exposures that result in these liver histopathologic features lead to liver cancer (Maronpot et al. 2010). From a review of NTP chemical study findings at ninety days, only 45% of rats studied with chemical-induced liver hypertrophy went on to have liver carcinogens in two-year cancer studies (Allen et al. 2004). Thus, there is a need for additional biomarkers to predict disease.
PBDE-induced liver gene transcript changes modify cell pathways and functions that, along with the liver toxicity, may lead to disease susceptibilities. These changes include alterations in lipid and metabolic pathways. For instance, at PND 22, PBDE increased the transcript for lipoprotein lipase seven-fold versus that in untreated liver. An increase in lipoprotein lipase activity has been associated with diabetes and metabolic diseases (Lopaschuk et al. 2010). PBDE decreased the cyp7a transcript, which codes for an enzyme critical in the metabolism of cholesterol to bile acids and in controlling hepatic triglyceride levels (Lee et al. 2010). The PBDE transcript patterns reported here support other findings, which show that PBDE exposures lead to increased body weights in rodents and alterations in adipocyte metabolism (Hoppe and Carey 2007; Suvorov and Takser 2010).
Thyroid homeostasis is important in preventing metabolic, reproductive, developmental, and cardiac disease (Choksi et al. 2003; Jahnke et al. 2004; Miller et al. 2009; Pedrelli et al. 2010). PBDE-induced alterations in thyroid hormone levels (Dunnick and Nyska 2009; Richardson et al. 2008) may affect mitochondria biogenesis (Leigh-Brown et al. 2010) or alter mitochondria-based TCA cycle and lipid distribution (Harper and Seifert 2008). Liver gene transcript analysis in the current study supports a finding of altered lipid metabolism. A PBDE-induced effect on lipid metabolism, along with PBDE-induced endocrine effects, may create susceptibilities to metabolic diseases.
The PBDE-induced liver toxicity was accompanied by increases in liver P450 transcripts—including those for cyp2a3a, cyp1a1 cyp1b1, cyp2c7, cyp2c13, cyt2c, and cyp2b—coding for enzymes critical in the metabolism of chemicals, drugs, fatty acids, and steroids (Yang et al. 2010). Up-regulation of these cytochrome P450 liver enzymes has been found with other chemicals that cause fatty liver, or steatosis (Lee et al. 2008; Lee et al. 2010), and is associated with the development of carcinogenic events (Rendic and Guengerich 2010). An adaptive response to the PBDE liver toxicity was suggested by fewer significant liver gene transcript changes at week 13 than at PND 22, and induced liver transcripts for enzymes involved in decreasing aldehyde loads (Ellis 2007), which may be part of an adaptive response to toxicity.
PBDE and dioxin exposures are both associated with increases in liver P450 enzyme levels (Boverhof, Burgoon et al. 2006; Boverhof, Kwekel et al. 2006; N’Jai et al. 2008; Sanders et al. 2005; Szabo et al. 2009) and may involve activation of AH, PXR, or CAR receptors (Szabo et al. 2009). The PBDE mixture used in our studies contained a low level of brominated dioxins and furans that by themselves would not be expected to cause cancers (Dunnick and Nyska 2009), but in combination with the PBDEs may have synergistic carcinogenic effects. Whether that occurred in our studies would require further investigation.
Other studies report the PBDE exposures increase expression of genes coding for liver enzymes, including cyp2B, hepatic deiodinase 1 protein (D1) activities and cyp2b1, d1, and hepatic efflux transporter gene expression (mdr1, mrp2, mrp3) in rats at PND4, PND21, and PND60 (Szabo et al. 2009). Not all of these liver gene transcripts were up-regulated in our PBDE studies, although a different strain of rat (Long Evans rat) was used in the Szabo et al. (2009) studies.
The liver gene expression profile generated by PBDE at PND 22 was similar to the transcriptional profile produced by phenobarbital in rodents (Nesnow et al. 2009; Waterman et al. 2010). Phenobarbital is a chemical that induces liver tumors in rodents (Butler 1978; Imaida and Wang 1986; Rossi et al. 1977). The changes include transcript abundance increases for P450s, chemokines, carboxylesterases, and growth factor arrest (gadd45b) gene transcript levels, and were similar to liver gene transcript patterns found in human liver cancers (Frau et al. 2010; Tanaka and Arii 2010; Teoh 2009).
Liver genotoxic carcinogens are characterized by a specific liver fingerprint after fourteen days or thirteen weeks of exposure (up-regulaton of mybl2, cyp1A1, and adam8 and down-regulation of wwox, fhit, RGD1561899) (Auerbach et al. 2009). This “genotoxic chemical” fingerprint was not seen with PBDE exposure, except for the up-regulation of cyp1A1. Based on these findings, the PBDE liver toxic mechanisms appear to differ from those of genotoxic liver toxins.
PBDE liver transcript patterns include those found in metabolic disease conditions. Metabolic disease conditions may contribute to the development of cancer (e.g., colorectal or uterine cancer) or heart disease, particularly when either one occurs in combination with other underlying genetic conditions or environmental exposures (Lopaschuk et al. 2010).
PBDE liver gene transcript patterns overlapped those seen in human cancer (colon), including up-regulation of cyclins (Koliadi et al. 2010) and other cell cycle controls (Stephens et al. 2011). In other studies, we reported that brominated chemicals may have a particular propensity to cause intestinal tumors (Dunnick et al. 1997b). Bromide radical formation in the intestine resulting in DNA damage (Ballmaier and Epe 2006) is one hypothesis for the cause of a brominated chemical carcinogenic response in the intestine, and additional studies would be needed to determine whether this cancer occurs after long-term PBDE exposure.
PBDE treatment decreased expression of cyp17a1, a decrease that is associated with blocking androgen production (Hofland et al. 2010) and altering sex steroidogenesis (Canton et al. 2006). PBDE transcript patterns associated with alterations in the endocrine system are consistent with the ability of PBDEs to cause MCF7 cell proliferation (Darnerud 2008; Mercado-Feliciano and Bigsby 2008a, b; Song et al. 2008; Talsness et al. 2008). In addition, PBDE is an ER α and β agonist in human T47D breast cancer cell lines (Meerts et al. 2001).
PBDE and its metabolites (e.g., 6-OH-BDE47) may increase reactive oxygen species leading to lipid peroxidation, aldehyde formation, and DNA adduct formation (An et al. 2010; Jin et al. 2010). For these reasons, PBDE exposure could contribute to the development of carcinogenesis processes, as suggested by our findings (Figure 5 ).
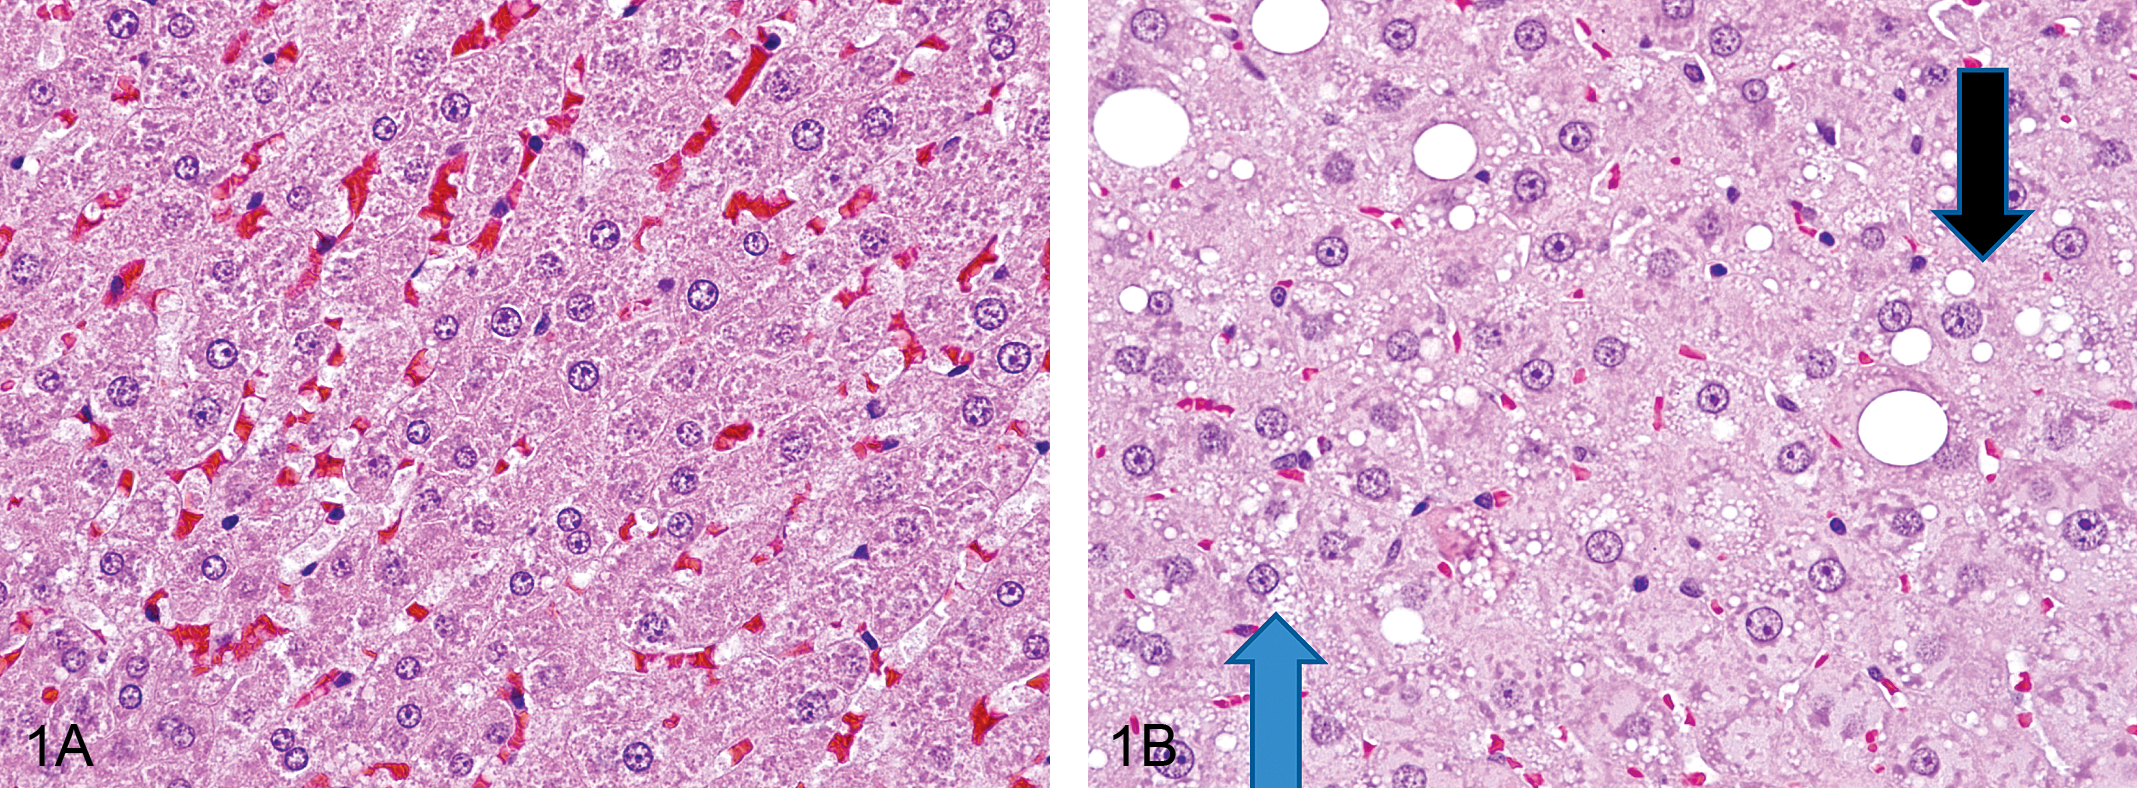
Photomicrographs of control and polybrominated diphenyl ether–treated livers at thirteen weeks. (A) Male rat, normal control liver. Hematoxylin and eosin, 600×. (B) Male rat, 50 mg/kg, microvesicular vacuolization of hepatocytes (blue arrows); macrovesicular vacuolization of hepatocytes (black arrows). Hematoxylin and eosin, 600×.
The liver gene transcript changes observed in this study suggest that PBDE exposure could lead to disease susceptibilities including those for metabolic/lipid disease (e.g., lipoprotein lipase [lpl]), cancer (e.g., cell cycle control transcripts [cyclins] or chemokine transcripts), and sex hormone synthesis (cyp17).
Footnotes
SUPPLEMENT 1.—Liver gene transcript changes, PND 22 males.
SUPPLEMENT 2.—Liver gene transcript changes, PND 22 females.
SUPPLEMENT 3.—Liver gene transcript changes, week 13 males.
SUPPLEMENT 4.—PBDE significant genes at PND 22 and week 13.
SUPPLEMENT 5.—GO analysis.
SUPPLEMENT 6.—PBDE PND 22 male liver gene transcripts versus phenobarbital gene transcript changes (developed from Nextbio database).
SUPPLEMENT 7.—PBDE PND 22 male liver gene transcripts versus human colon cancer genes (developed from Nextbio database).
This work was supported by the intramural program of the National Institute of Environmental Health Sciences (NIEHS), Research Triangle Park, NC. However, the statements, opinions, or conclusions contained therein do not necessarily represent the statements, opinions, or conclusions of NIEHS, NIH or the United States government. The in-life portion of this study was conducted under the supervision of Dr. C. Hébert, Southern Research Institute, under NIEHS contract NO1-ES-45516 and the microarray analysis under contract N01-ES-55536. Statistical support was provided under NIEHS contract ES 55547. We thank G. Kissling, A. Merrick, and M. Sanders, NIEHS, for their review of the manuscript.
Abbreviations
References
Supplementary Material
Please find the following supplemental material available below.
For Open Access articles published under a Creative Commons License, all supplemental material carries the same license as the article it is associated with.
For non-Open Access articles published, all supplemental material carries a non-exclusive license, and permission requests for re-use of supplemental material or any part of supplemental material shall be sent directly to the copyright owner as specified in the copyright notice associated with the article.