
Abstract
Recombinant human idursulfase, an intravenous enzyme replacement therapy indicated for treatment of somatic symptoms of mucopolysaccharidosis II (Hunter syndrome), is anticipated to have minimal benefit for the cognitive impairment associated with the severe phenotype. Because intrathecal (IT) administration of enzyme replacement therapy for other lysosomal enzyme disorders has shown efficacy in animal models, an IT formulation of idursulfase (idursulfase-IT) and a drug-delivery device (subcutaneous port connected to a lumbar IT catheter) were developed for treating central nervous system (CNS) involvement. In this chronic safety study, cynomolgus monkeys were dosed weekly with IV idursulfase (0.5 mg/kg) and every four weeks with idursulfase-IT (3, 30, and 100 mg) for six months, with device and vehicle controls treated similarly (n = 6, all groups). Necropsies were performed twenty-four hours post–final IT dose or after a recovery period (four weeks post–final dose in vehicle-control, 3 mg, and 100 mg IT groups: n = 6). No clinical signs or gross central nervous system lesions were observed. Compared to controls, more pronounced cellular infiltrates in brain and spinal cord meninges were noted, which largely resolved after the recovery period. Central nervous sytem levels of idursulfase-IT were dose dependent, as determined by enzyme activity and immunohistochemistry. The no–observed-adverse-effect level of idursulfase-IT was 100 mg.
Keywords
Introduction
Mucopolysaccharidosis (MPS) II (Hunter syndrome) is an X-linked disease caused by the deficiency of iduronate-2-sulfatase, the lysosomal enzyme that catalyzes the removal of O-linked sulfates from the glycosaminoglycans (GAG) dermatan sulfate and heparan sulfate (Neufeld and Muenzer 2001). Mucopolysaccharidosis II occurs predominantly in males, with an estimated incidence of 1 in 162,000 live births (Meikle et al. 1999). The phenotype, which results from accumulation of GAG within tissues and organs, ranges from attenuated to severe, with clinical signs that include skeletal and joint abnormalities, pulmonary dysfunction, organomegaly, and valvular cardiac disease (Neufeld and Muenzer 2001). In the mouse model of MPS II, microscopic examination of tissues demonstrated foamy, vacuolated cell types in various tissues, suggestive of mononuclear phagocytes containing lysosomal storage material (Garcia, Pan et al. 2007).
Approximately 75% of MPS II patients have the severe phenotype, which is commonly associated with cognitive impairment resulting from central nervous system (CNS) involvement (Young and Harper 1982). Potential sequelae include developmental delays, behavioral disturbances, regression, and convulsions (Young and Harper 1983). Communicating hydrocephalus may occur and contribute to the deterioration of the CNS (van Aerde et al. 1981; Yatziv and Epstein 1977).
Idursulfase (Elaprase [recombinant human iduronate-2-sulfatase]; Shire Human Genetic Therapies, Inc., Lexington, MA) has been developed as an enzyme replacement therapy (ERT) for treating MPS II, and it is currently approved for this indication in many countries worldwide, including the United States (2006) and countries of the European Union (2007). Cellular internalization of idursulfase is mediated by the binding of mannose–6–phosphate moieties on idursulfase to cell surface mannose–6–phosphate receptors, providing a receptor-mediated uptake mechanism for the enzyme (Kakkis 2002). Intravenous (IV) idursulfase treatment was found to reduce tissue GAG levels in the mouse model (Garcia, DaCosta et al. 2007). The preclinical program supporting the marketing authorization for idursulfase included acute studies in both the rat and the monkey; a six–month, repeat-dose study in monkeys; a male fertility study; and a pre- and postnatal development study (United States Food and Drug Administration 2006). In the six-month IV monkey study, no adverse toxicological findings related to dosing were observed up to the maximum dose tested, 12.5 mg/kg weekly. Although anti–idursulfase antibodies were detected in some animals, no adverse clinical signs were noted. In the one-year, Phase II/III clinical trial (Muenzer et al. 2006), patients receiving idursulfase (0.5 mg/kg weekly or every other week) exhibited significant improvement compared to placebo in a single two-component composite end point (percentage predicted forced vital capacity and a six-minute walking test). Infusion-related events were the most commonly reported adverse events considered to be possibly related to treatment (Muenzer et al. 2006).
Notably, as with the IV administration of many ERT, idursulfase is not expected to cross the blood-brain barrier (BBB) in sufficient amounts to affect the CNS symptoms associated with MPS II (Hemsley and Hopwood 2009). Different methods of achieving effective CNS ERT levels have been studied, including administration of high IV doses (Vogler et al. 2005), the use of epinephrine (Urayama et al. 2007), direct infusion into the striatal region of the brain (Zirzow et al. 1999), chemical modification of the infused enzyme (Grubb et al. 2008), and direct intrathecal (IT) injection into the cerebrospinal fluid (CSF) via lumbar or cisterna magna puncture (Auclair et al. 2010; Dickson et al. 2007; Hemsley et al. 2007, 2008; Hemsley and Hopwood 2009; Hemsley, Norman et al. 2009; Kakkis et al. 2004; Muñoz-Rojas et al. 2008, 2010). Intrathecal administration of ERT for the treatment of lysosomal storage diseases has shown efficacy in various animal models (Auclair et al. 2010; Dickson et al. 2007; Hemsley et al. 2007, 2008; Hemsley and Hopwood 2009; Hemsley, Norman et al. 2009; Kakkis et al. 2004), including a mouse model of MPS IIIA (Sanfilippo syndrome; Hemsley et al. 2007, 2008) and canine models of MPS IIIA (Hemsley, Norman et al. 2009) and MPS I (Hurler syndrome; Kakkis et al. 2004). Dose-dependent reductions in heparan sulfate–derived oligosaccharides were accompanied by improvements in pathology and behavior (Hemsley et al. 2007).
Based on these findings, we developed an idursulfase formulation appropriate for lumbar IT administration (idursulfase-IT), specifically via a novel IT drug-delivery device. In an exploratory three-month toxicity study in cynomolgus monkeys administered idursulfase-IT monthly, no adverse findings related to idursulfase at doses of 150 mg or less were observed (data not shown). To support the chronic use of idursulfase-IT in humans, the present study examined the safety of the combination of repeat-dose (monthly) lumbar IT injections of idursulfase-IT (3, 30, or 100 mg) with weekly bolus IV idursulfase (0.5 mg/kg) to cynomolgus monkeys for six months. The coadministration of 0.5 mg/kg IV idursulfase with the monthly IT doses was designed to emulate the clinical use of this therapy. A comprehensive panel of assessments that included histopathology, immunohistochemistry, and tissue biodistribution was performed. To our knowledge, this is the first study involving the chronic IT administration of ERT in the nonhuman primate.
Materials and Methods
Animals
Forty-eight adult male cynomolgus monkeys (Macaca fascicularis) approximately four to six years old and weighing 4.04 to 7.83 kg were used in this study. Animals were fed twenty-five biscuits of PMI-Certified Primate Diet 5048 (Richmond, IN) daily. Water was provided ad libitum via a filtered automatic water system and was withheld during urine collection periods. Animals were housed in individual stainless steel cages in rooms with controlled temperature and humidity, with a cycle of twelve hours of light and twelve hours of darkness. Housing complied with the Guide for the Care and Use of Laboratory Animals, United States Department of Health and Human Services, No. 86-23, and the Animal Welfare Act (9 CFR Part 3). The studies were performed at Northern Biomedical Research, Inc. (Muskegon, MI), a facility accredited by the Association for Assessment and Accreditation of Laboratory Animal Care, and the protocol was approved by the Institutional Animal Care and Use Committee of the testing facility.
The study was conducted in accordance with the United States Food and Drug Administration Good Laboratory Practice Regulations (21 CFR Part 58); the Japanese Ministry of Health, Labor, and Welfare Good Laboratory Practice Standards Ordinance 21; and the Organization for Economic Cooperation and Development Principles of Good Laboratory Practice [C(97) 186/Final]. This study complied with the Guiding Principles in the Use of Animals in Toxicology (Society of Toxicology).
Implantation of Delivery Devices
Prior to study initiation, subcutaneous ports and IT catheters were surgically implanted in all animals. Prednisolone sodium succinate (IV, 30 mg/kg) and flunixin meglumine (intramuscular [IM], 2 mg/kg) were administered prior to surgery. The animals were pretreated with subcutaneous atropine sulfate (0.04 mg/kg), sedated with IM ketamine hydrochloride (HCl; 8 mg/kg), intubated, and maintained on approximately 1 L/min of oxygen and 2.0% isoflurane. An incision was made over the dorsal processes of the lumbar spine (L4, L5, or L6), and a hemilaminectomy was made for the insertion of a tapered polyurethane catheter (58.4 cm in length with six side holes of 0.33 mm diameter) at L3, L4, or L5. The catheter was inserted through a small dural incision and was advanced approximately 10 cm anterograde to the area of the thoracolumbar junction. A titanium subcutaneous port was attached to the IT catheter and implanted in the subcutaneous tissue. Proper catheter placement was confirmed by myelogram using Isovue-300 (0.8 mL; Bracco Diagnostics, Inc., Princeton, NJ). After recovering from surgery, animals received butorphanol tartrate (IM, 0.05 mg/kg) and ceftiofur sodium (IM, 5.0 mg/kg twice daily for two days).
Study Design and Idursulfase Dosing
The study design is presented in Table 1 . The animals were randomized into five treatment groups. Intravenous administration of idursulfase, saline/phosphate-buffered saline (PBS), or vehicle was initiated at least six days after device implantation and was administered weekly, for a total of twenty-three doses. An IV dose of idursulfase, saline, or vehicle was administered weekly with IT doses (PBS instead of saline) two days before every fourth weekly IV dose. The regimen was repeated for a total of twenty-three IV doses and six IT doses. Full necropsies were performed on six animals in all five treatment groups at the end of the study period (main necropsy, day 161/162) and on the remaining six animals in groups 2, 3, and 5 following a four-week recovery period (recovery necropsy, day 189/190).
Study design.
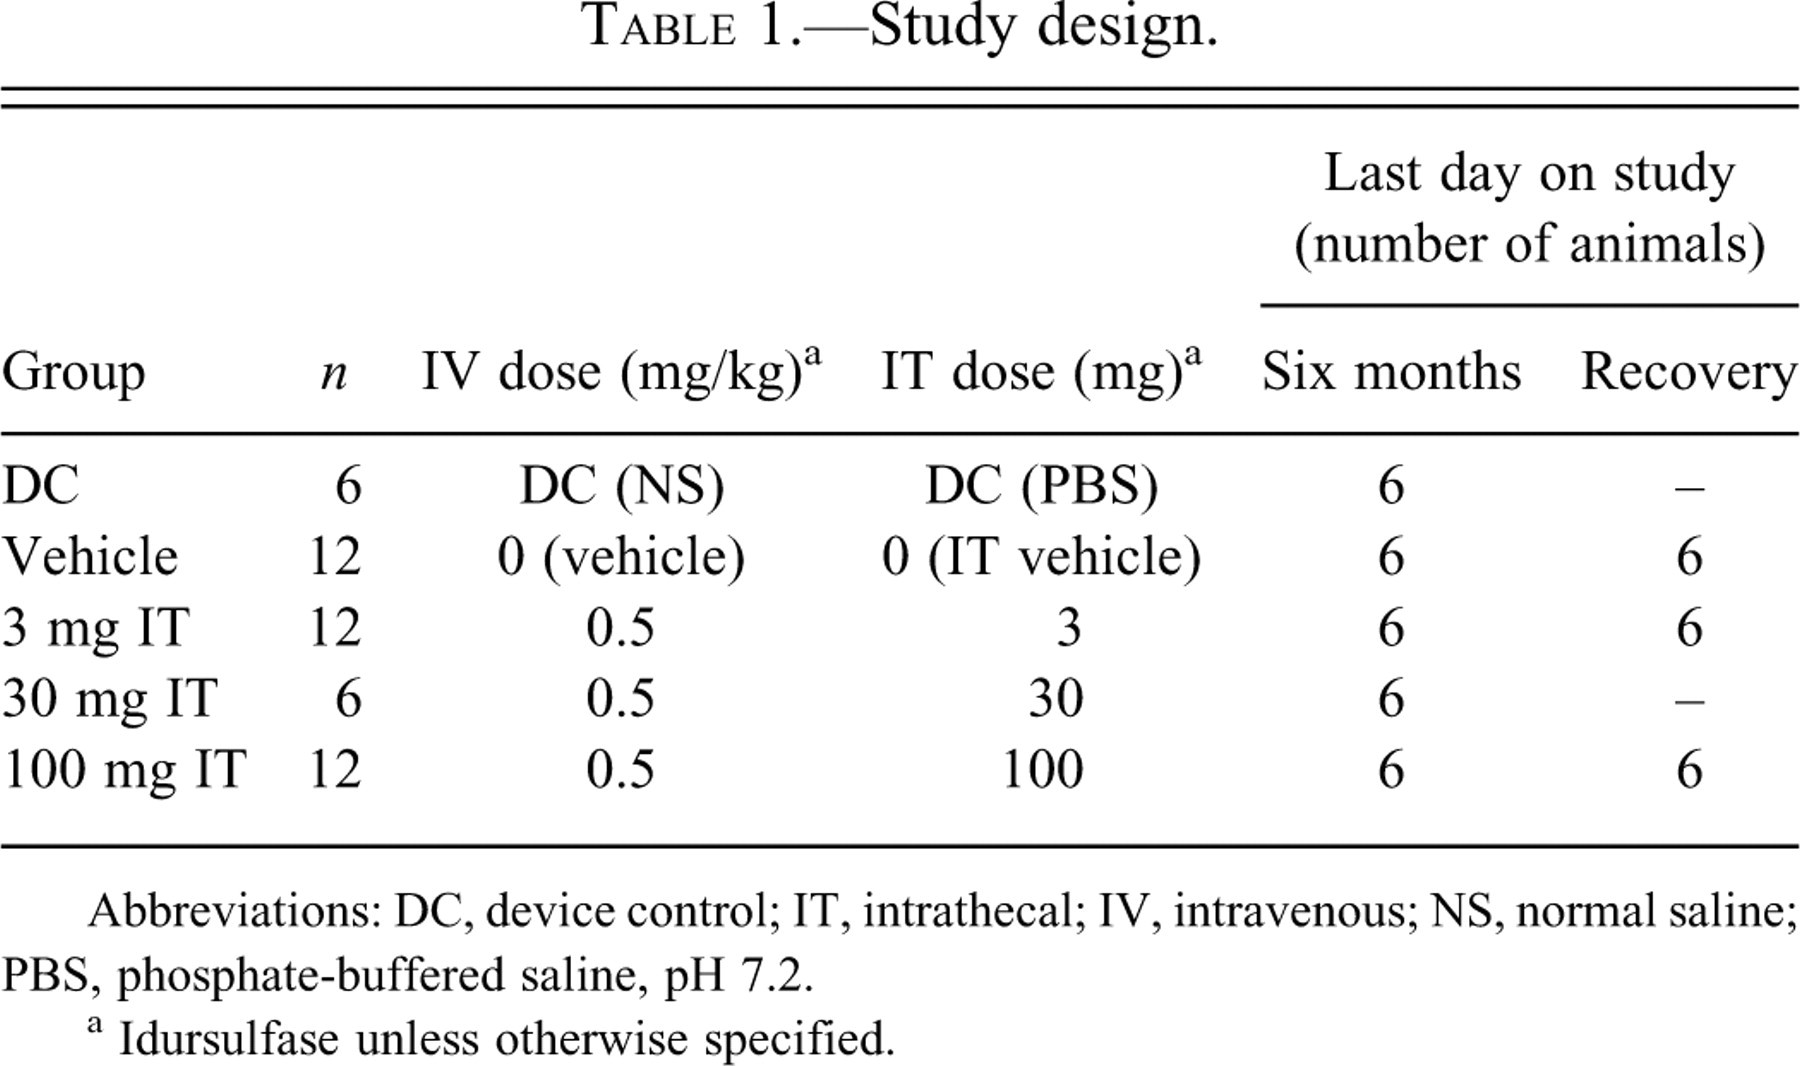
Abbreviations: DC, device control; IT, intrathecal; IV, intravenous; NS, normal saline; PBS, phosphate-buffered saline, pH 7.2.
a Idursulfase unless otherwise specified.
Idursulfase was provided in IT and IV formulations. The IT formulation was supplied in a vehicle of 154 mM sodium chloride and 0.005% polysorbate 20 (pH 6.0) at concentrations of 3, 30, and 100 mg/mL. The specific activity of the idursulfase-IT formulation was approximately 65 U/mg, as determined using a specific activity ion chromatography method. Monthly doses of idursulfase-IT were administered as a 1-mL bolus and were followed with a flush of 0.5 mL PBS. Animals additionally received a weekly IT catheter maintenance flush of 0.5 mL PBS. Commercially available IV idursulfase in a vehicle of 20 mM sodium phosphate, 137 mM sodium chloride, and 0.02% polysorbate 20 (pH 6.0) at a concentration of 2 mg/mL was used in the study. Animals in the vehicle control group received idursulfase-IT vehicle and IV idursulfase vehicle. Device control animals received PBS (pH 7.2) IT and 0.9% sodium chloride IV.
Clinical Evaluation
The occurrence of clinical signs as well as findings from morbidity and mortality observations were recorded at least twice daily starting at the first dose. Body weights were measured prior to surgery, on the day of surgery, weekly during the study, and at necropsy. Food consumption was monitored daily starting before surgery. Physical and neurological examinations were conducted before the study was initiated, each month during the study, and before necropsy was performed. Physical examinations included monitoring of heart rate, respiration, body temperature, auscultation, gait, disposition, abdominal palpation, lymph nodes, and general appearance of the eyes, ears, oral cavity, skin, and nails. Neurological examinations included monitoring of general sensory (level of consciousness, tracking) and motor functions, cerebral reflexes (pupillary, blink, and corneal reflex), and spinal reflexes (sensory foot, knee jerk, cutaneous, proprioceptive, and tail reflex). Electrocardiographic (ECG; leads I, II, and III) and ophthalmologic examinations were completed prior to the first dose of idursulfase and in the week before the main necropsy. Ophthalmic examinations were performed by indirect ophthalmoscope, the animals were sedated with ketamine HCl (IM, 8 mg/kg), and eyes were dilated with 1% tropicamide.
Clinical Pathology
Blood samples were collected from fasted animals for hematology (2 mL in potassium EDTA tube), serum chemistry (3 mL in clot tube), and coagulation (2 mL in sodium citrate tube) evaluation prior to the study start, after each IT dose (two to four hours postdose), and before necropsy. Urine samples were collected during the same time frame via pan collection.
Cerebrospinal fluid samples were collected via the lumbar catheter for total cell count (0.75 mL) and chemistry (0.5 mL) before the first IV dose, before and after each IT dose, and at necropsy. There was an initial decline in the number of catheters that were patent for sampling CSF, stabilizing at approximately 60–70% at each time point after three months on study. If an animal had a nonsampling catheter because of an obstruction, a spinal tap (cisterna magna) was performed at necropsy. For comparative purposes, the first CSF sample collected for all study animals prior to administration of the first dose (predose one month) is presented as an in-study reference for selected parameters (mean ± SD; range; number of animals) in the results section.
Although the blood and CSF originally were scheduled to be taken two hours postdose, based on a preliminary data analysis, the postdose (IT or IV) collection interval was changed from two to four hours postdose starting at IV dose 11 and IT dose 3 to allow more time for distribution and absorption of idursulfase in the CNS compartment.
Idursulfase Analysis
Blood samples for idursulfase analysis were collected from a peripheral vein and measured before and after each IT and IV dose and at necropsy (main or recovery). Cerebrospinal fluid samples were collected via the IT catheter before the first IV dose; after IV doses during months 1, 3, and 6 (IV doses 3, 11, and 23, respectively); approximately five days prior to IT dosing; after each IT dose (two to four hours postdose); and at necropsy (main or recovery). Idursulfase concentrations were determined by enzyme-linked immunosorbent assay. The capture antibody was a polyclonal goat anti-idursulfase IgG (with some cross-reactivity to monkey iduronate-2-sulfatase), and the detection antibody was a horseradish peroxidase-conjugate of the same goat anti-idursulfase IgG. The limit of detection at a 1:50 dilution was 62.5 ng/mL. Samples exceeding the high end of the calibration curve were further diluted and retested.
Anti-Idursulfase Antibody Analysis
Blood and CSF samples for antibody analysis were collected approximately five days prior to each monthly IT dose (in conjunction with the predose IV sample) and at necropsy. A Meso Scale Discovery bridge test (a nonvalidated method; Gaithersburg, MD) was used for detection of anti–idursulfase antibodies. Samples were tested at a 1:20 dilution; the limit of detection at a 1:20 dilution was 200 ng/mL and 160 ng/mL for serum and CSF, respectively. Samples exceeding the high end of the calibration curve were further diluted and retested.
Necropsy and Preparation of Tissues
Animals underwent a full necropsy either twenty-four hours after the final IT dose (main necropsy) or at the end of the four-week recovery period (recovery necropsy). All animals were sedated with ketamine HCl (IM, 8 mg/kg), were maintained on an isoflurane/oxygen mixture, and received an IV bolus of heparin sodium (200 IU/kg). Animals were perfused via the left cardiac ventricle with room temperature 0.001% sodium nitrite in saline at a rate of 200 mL/min for twelve minutes (~2400 mL). After collection, tissue samples were then fixed in 10% neutral buffered formalin for histopathological examination/immunohistochemical analysis or were frozen on dry ice and stored at –60°C or lower for analysis of idursulfase activity.
The brain was cut in a brain matrix at 3-mm coronal slice thickness (MBM-2000C, ASI Instruments, Inc., Warren, MI). The slices were numbered, with the most rostral slice designated as Slice 1. Slices 1, 4, 7, 10, 13, and 16 were processed for histopathology, and slices 2, 5, 8, 11, 14, and 17 (if available) were processed for immunohistochemistry. Slices 3, 6, 9, 12, and 15 were frozen for analysis of idursulfase activity. The spinal cords (cervical, thoracic, and lumbar portions) were cut into 1-cm sections. The first slice and every third slice thereafter were processed for histopathological evaluation, and the second slice and every third slice thereafter were processed for immunohistochemical analysis. The third slice and every third slice thereafter were frozen for idursulfase analysis. The distribution of slices was adjusted so that the slice containing the tip of the intrathecal catheter (Slice 0) was fixed in formalin and analyzed for histopathology. Duplicate samples of approximately 5 g of the liver were taken from two separate lobes and frozen for idursulfase analysis and an additional sample of approximately 5 g was fixed for immunohistochemical analysis.
Histopathology
The brains; spinal cords; dorsal spinal nerve roots/ganglia; sciatic, tibial, and sural nerves; liver; kidney; heart; and gross lesions harvested at necropsy from all animals were embedded in paraffin and stained with hematoxylin and eosin. Brains were sectioned at approximately 5 µm. Brains from the device and vehicle control groups, and the high-dose animals were stained with Fluoro-Jade B (a stain increasing the sensitivity of evaluating neuronal degeneration) and Bielschowsky’s silver (a procedure that allows direct visualization of axons, dendrites, and neuronal filaments). The Fluoro-Jade B–stained slides were examined under fluorescent lighting using a fluorescein isothyocyanate filter cube.
Spinal cords were sectioned with a transverse and oblique section taken at the cervical, thoracic, and lumbar areas (one slice examined at each level); an additional transverse section was taken from the cauda equina. Dorsal spinal roots and ganglia (midcervical, midthoracic, and midlumbar) were also harvested. Peripheral nerves (sciatic, tibial, and sural) were sectioned longitudinally, postfixed in osmium, embedded in Spurr’s resin, and sectioned (1–2 µm) and stained with toluidine blue. Serial spinal cord sections, as well as dorsal spinal nerve roots and ganglia, from the device and vehicle control groups and the high-dose group were stained with Bielschowsky’s silver. Spinal cord sections from these groups also were stained with anti-glial fibrillary acidic protein, an immunohistochemical stain that allows for direct visualization of astrocytes and their processes.
Tissue Processing and Staining for Immunohistochemistry
Six formalin-fixed coronal brain slices (slice numbers 2, 5, 8, 11, 14, and 17) of 3-mm thickness from each animal were numbered 1 to 6 from anterior to posterior. Slices 1 to 4 were from the cerebrum, and the posterior two slices contained cerebellum and brain stem (medulla oblongata) tissue. For histological studies, brain slice numbers 1, 3, and 6; spinal cords (cervical, thoracic, and lumbar regions); and livers were embedded in paraffin for subsequent sectioning and immunohistochemical staining for idursulfase. A specific monoclonal antibody (clone 2C4-2B2; Maine Biotech, Portland, ME) was used to label recombinant idursulfase. Negative controls were performed using an irrelevant mouse IgG instead of clone 2C4-2B2. Deparaffinized slides were incubated with primary mouse anti-idursulfase antibody overnight at 2 to 8°C. A secondary goat antimouse biotinylated immunoglobulin G was added and incubated for thirty minutes at 37°C. Avidin and biotinylated horseradish peroxidase macromolecular complex was added and incubated for thirty minutes. Slides were incubated in peroxidase substrate diaminobenzidine solution until the desired stain intensity developed. Nuclei were counterstained with hematoxylin.
Tissue Dissection and Preparation of Extracts for Quantitative Analysis
Frozen brain slices 3, 6, 9, 12, and 15 were dissected by separating the left and right hemispheres. Surface tissue was taken by measuring 4 mm in from the surface, and the remaining tissue in each hemisphere was considered deep tissue. This approach resulted in four samples per slice: left surface, left deep, right surface, and right deep. Cerebellar and brain stem tissues, when present, were isolated prior to separating the hemispheres and were processed independently. Spinal cord sections were prepared similarly, weighed, and homogenized.
Tissue samples were homogenized in lysis buffer (1 mL/0.25 g tissue) formulated with 10 mM Tris, 5 mM ethylenediaminetetracetic acid (EDTA), 0.1% Igepal supplemented with Alpha Complete protease inhibitor minitablets (Roche Diagnostics, Indianapolis, IN) using TeenA Lysing Matrix A tubes or conical polypropylene tubes. Samples were processed for forty seconds in the Fastprep-24 automated homogenizer (MP Biomedicals, Solon, OH) or PowerGen Model 125 powered homogenizer (Omni International, Kennesaw, GA). Once homogenized, samples were subjected to five freeze-thaw cycles using an ethanol/dry ice bath and a 37°C water bath and then centrifuged at 4°C to pellet tissue debris; supernatants were stored at –80°C until assayed.
Determination of Idursulfase Activity in Tissue Extracts
Idursulfase activity was determined with a two-step fluorometric assay using the substrate 4-methylumbelliferyl-α-iduronate-2-sulfate (Moscerdam Substrates, Rotterdam, the Netherlands). Briefly, tissue extracts were diluted in 0.2% bovine serum albumin (pH and heat treated to inactivate lysosomal enzymes, supplemented with 0.004% sodium azide). Substrate was desulfated by duplicate incubations of 10 µL of diluted sample with 20 µL of 1.25 mM substrate for four hours at 37°C. After idursulfase inhibition by the addition of 20 µL of phosphate/citrate buffer (0.2 M Na2HPO4/0.1 M citric acid, 0.02% sodium azide, pH 4.7), samples were incubated with 10 µL of lysosomal enzymes purified from bovine testis for twenty-four hours at 37°C to liberate 4-methylumbelliferyl from substrate desulfated in the first reaction. This second reaction was stopped by adding 200 µL of stop buffer (0.5 M NaHCO3/Na2CO3, pH 10.7 with 0.025% Triton X-100) to each well. Fluorescence was measured in ninety-six–well fluorometry plates using a SpectraMax M2 fluorescent plate reader (Molecular Devices, Sunnyvale, CA). Results were calibrated using 4–methylumbelliferone (MP Biomedicals) as a standard and were normalized to total protein in tissue extracts, as determined by bicinchonic acid assay (Pierce Biotechnology, Rockford, IL). Idursulfase activity was expressed as nmol of substrate hydrolyzed per hour per milligram of total protein (nmol/hr/mg protein).
Statistical Analyses
Body weights, body weight changes, food consumption, respiratory rate, body temperature, heart rate, CSF cell count, CSF chemistry, clinical pathology data, urine data, and absolute and relative organ weights were analyzed by a one-way analysis of variance and a comparison of the device and vehicle control groups to each idursulfase-dosed group by Dunnett test. In addition, the statistical analysis compared the two control groups to each other. Analysis was two tailed for significance levels of 5% and 1%. All means are presented with standard deviations.
Results
In-Life Observations
Clinical observations during the course of the study were unremarkable. There were no statistically significant differences between the idursulfase and control groups in body weight, in body weight change from study initiation, or in food consumption during the study. No idursulfase-related clinical signs or changes in the physical or neurological examinations or ECG were observed, and no ophthalmological findings were considered related to idursulfase.
Clinical Pathology
There were no changes considered related to idursulfase in hematology, serum chemistry, or coagulation during the study. A transient decrease in urine pH noted at months 2 and 3 in the 100 mg–dosed animals returned to normal in the subsequent months.
Mean postdose total leukocyte counts and mean percentage of neutrophils in the CSF over the course of the study are shown in Figures 1A and 1B. As mentioned previously, during the first and second months of the study, CSF samples were obtained predose and two hours postdose. Because of the elevated protein observed at two hours for the first two months of the study, the sampling time was changed to four hours postdose beginning at the three-month evaluation to give the test article additional time for absorption and distribution. At the three-month interval, the first four-hour postdose CSF total leukocyte counts (Figure 1A) were significantly elevated in the 100 mg/dose animals (7,550 ± 5,214 cells/mm3; p ≤ .01) relative to the device-control (461 ± 460 cells/mm3) and vehicle–control (1,437 ± 2,711 cells/mm3) animals. Although not statistically different, elevations in CSF leukocyte counts were also observed postdose after the four-, five-, and six-month doses. These elevations were above the in-study value for CSF white blood cell (WBC) count obtained from animals prior to dose 1; mean, 61 ± 136 cells/mm3 (range, 11–868 cells/mm3; n = 39) and were observed in all groups, including device control and vehicle. The increases in total leukocyte counts were primarily attributed to an increase in neutrophils (Figure 1B).
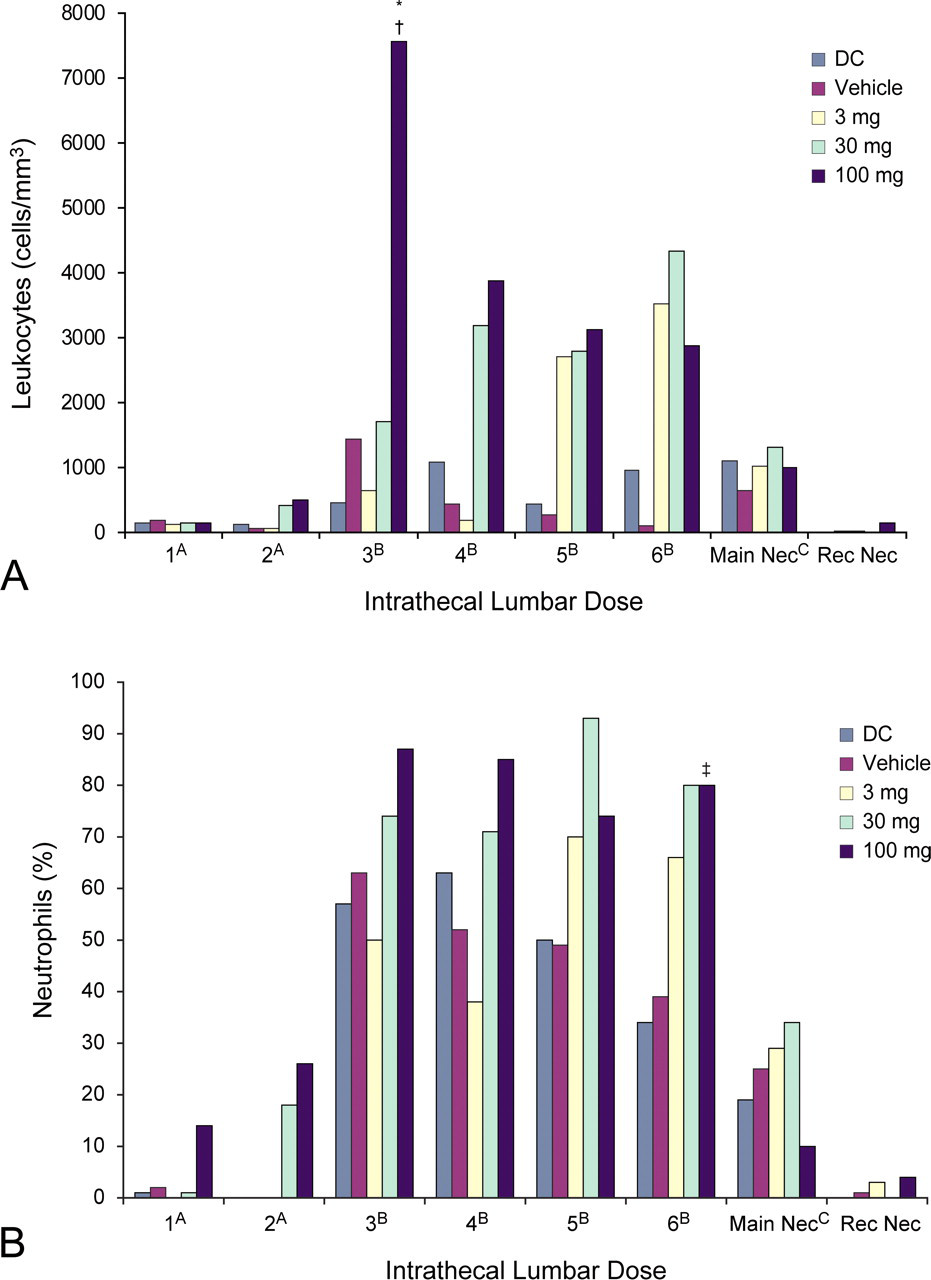
Mean postdose total leukocytes (A) and mean percentage of neutrophils (B) in the cerebrospinal fluid over the course of the study. (A) Samples collected two hours postdose. (B) Samples collected four hours postdose. (C) Samples collected twenty-four hours after the final dose. *p ≤ .01 (compared to the device control); † p ≤ .01 (compared to vehicle); ‡ p ≤ .05 (compared to vehicle). CSF, cerebrospinal fluid; Main Nec, main necropsy; Rec Nec, recovery necropsy.
At the six-month, four-hour postdose evaluation, the 100 mg/dose animals had significantly higher mean percentage of neutrophils in the CSF relative to the vehicle control group (Figure 1B: 80 ± 11% vs. 39 ± 40%; p ≤ .05), and concomitantly, there was lower mean percentage of lymphocytes compared to the device (10 ± 8% vs. 53 ± 47%; p ≤ .05) and vehicle controls (10 ± 8% vs. 51 ± 34%; p ≤ .01).
The CSF WBC for idursulfase-IT groups at the main necropsy (twenty-four hours postdose) were lower than those observed at the four-hour postdose collection. At the main necropsy evaluation, WBC were slightly elevated in all groups, and idursulfase-IT–dosed groups had similar values as the device and vehicle controls. At the recovery necropsy, WBC returned to levels similar to predose 1 CSF samples.
Cerebrospinal Fluid Chemistry
Significant postdose reductions in mean glucose levels were observed in the 3 mg/dose group at month 6, in the 30 mg/dose group at months 1 and 6, and in the 100 mg/dose group at months 3, 4, 5, and 6 (Figure 2 ). At the six-month time point, compared to the device and vehicle controls (with mean glucose levels of 40 ± 10 and 42 ± 5 mg/dL, respectively), the 3 mg/dose group had a mean value of 23 ± 12 mg/dL, the 30 mg/dose group had a mean value of 19 ± 7 mg/dL, and the 100 mg/dose group had a mean value of 22 ±11 mg/dL. The glucose reductions were in some cases slightly below the in-study reference value, taken prior to dose 1; mean, 43 ± 6 mg/dL; range, 28–66 mg/dL (n = 39). Glucose levels increased in the CSF in idursulfase-IT–dosed groups between monthly doses, but there were some statistically significant differences observed at the sample prior to the next IT dose. At the predose evaluation for the month 2 interval, there were significantly lower mean CSF glucose levels in the 30 and 100 mg/dose groups (37 ± 4 and 38 ± 6 mg/dL, respectively) compared to levels in the vehicle control group (47 ± 3 mg/dL; p ≤ .01). Significantly lower mean glucose levels were also observed predose at month 5 in the 30 mg/dose (34 ± 6 mg/dL; p ≤ .01) and in the 100 mg/dose (38 ± 5 mg/dL; p ≤ .05) groups compared to levels in the device and vehicle control groups (46 ± 4 and 45 ± 3 mg/dL, respectively).
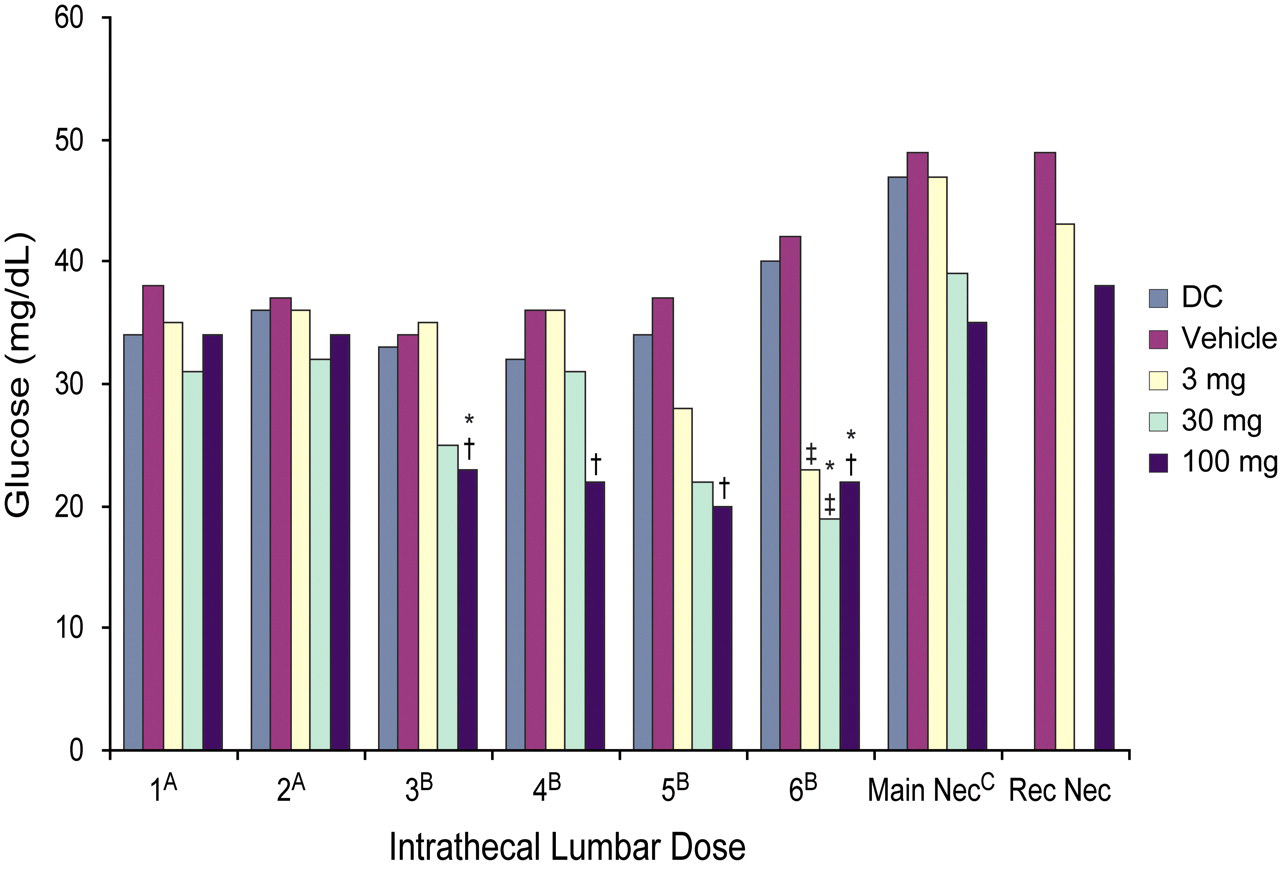
Mean postdose glucose levels in the CSF over the course of the study. (A) Samples collected two hours postdose. (B) Samples collected four hours postdose. (C) Samples collected twenty-four hours after the final dose. *p ≤ .05 (compared to the device control; † p ≤ .01 (compared to vehicle); ‡ p ≤ .05 (compared to the vehicle). CSF, cerebrospinal fluid; DC, device control; Main Nec, main necropsy; Rec Nec, recovery necropsy.
Significant increases relative to the control groups in mean postdose CSF total protein levels were observed at months 1, 2, and 3 in the 30 mg/dose group and after each of the six doses in the 100 mg/dose group (Figure 3A). At the three-month postdose sample, the total protein values were greatly elevated in the 30 and 100 mg/dose groups, 239 ± 46 and 728 ± 125 mg/dL, respectively. In comparison, in-study total protein values obtained from animals prior to dose 1 were: mean, 76 ± 228 mg/dL; range, 18–1,454 mg/dL (n = 39). Increases in the albumin fraction were responsible for the majority of changes in total protein (Figure 3B). There were no significant differences between the idursulfase-dosed groups and the control groups at the main or recovery necropsies.
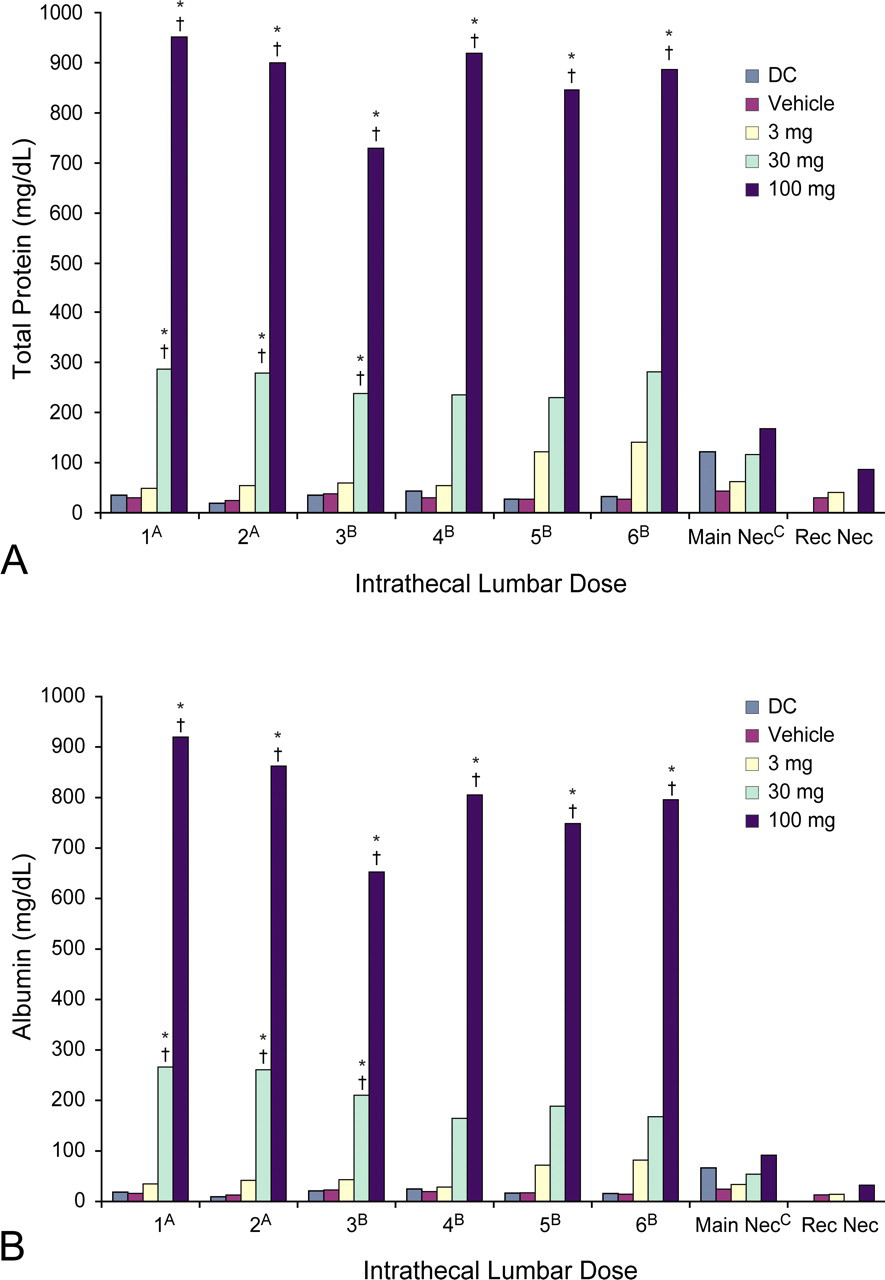
Mean postdose total protein (A) and albumin (B) levels in the CSF over the course of the study. (A) Samples collected two hours postdose. (B) Samples collected four hours postdose. (C) Samples collected twenty-four hours after the final dose. *p ≤ .01 (compared to the device control); † p ≤ .01 (compared to vehicle). CSF, cerebrospinal fluid; DC, device control; Main Nec, main necropsy; Rec Nec, recovery necropsy.
Serum and CSF Idursulfase Concentrations
For the 100 mg/dose group, mean serum idursulfase levels were higher at four hours (months 3 and beyond) than at two hours (months 1 and 2) after the idursulfase-IT dose. Following IV administration, levels were lower at four hours than at two hours postdose (data not shown). There was a dose-dependent elevation in mean serum levels at the main necropsy in the 30 and 100 mg/dose groups that returned to basal levels at the recovery necropsy (Table 2 ).
Serum idursulfase concentrations at study termination (main and recovery necropsies).
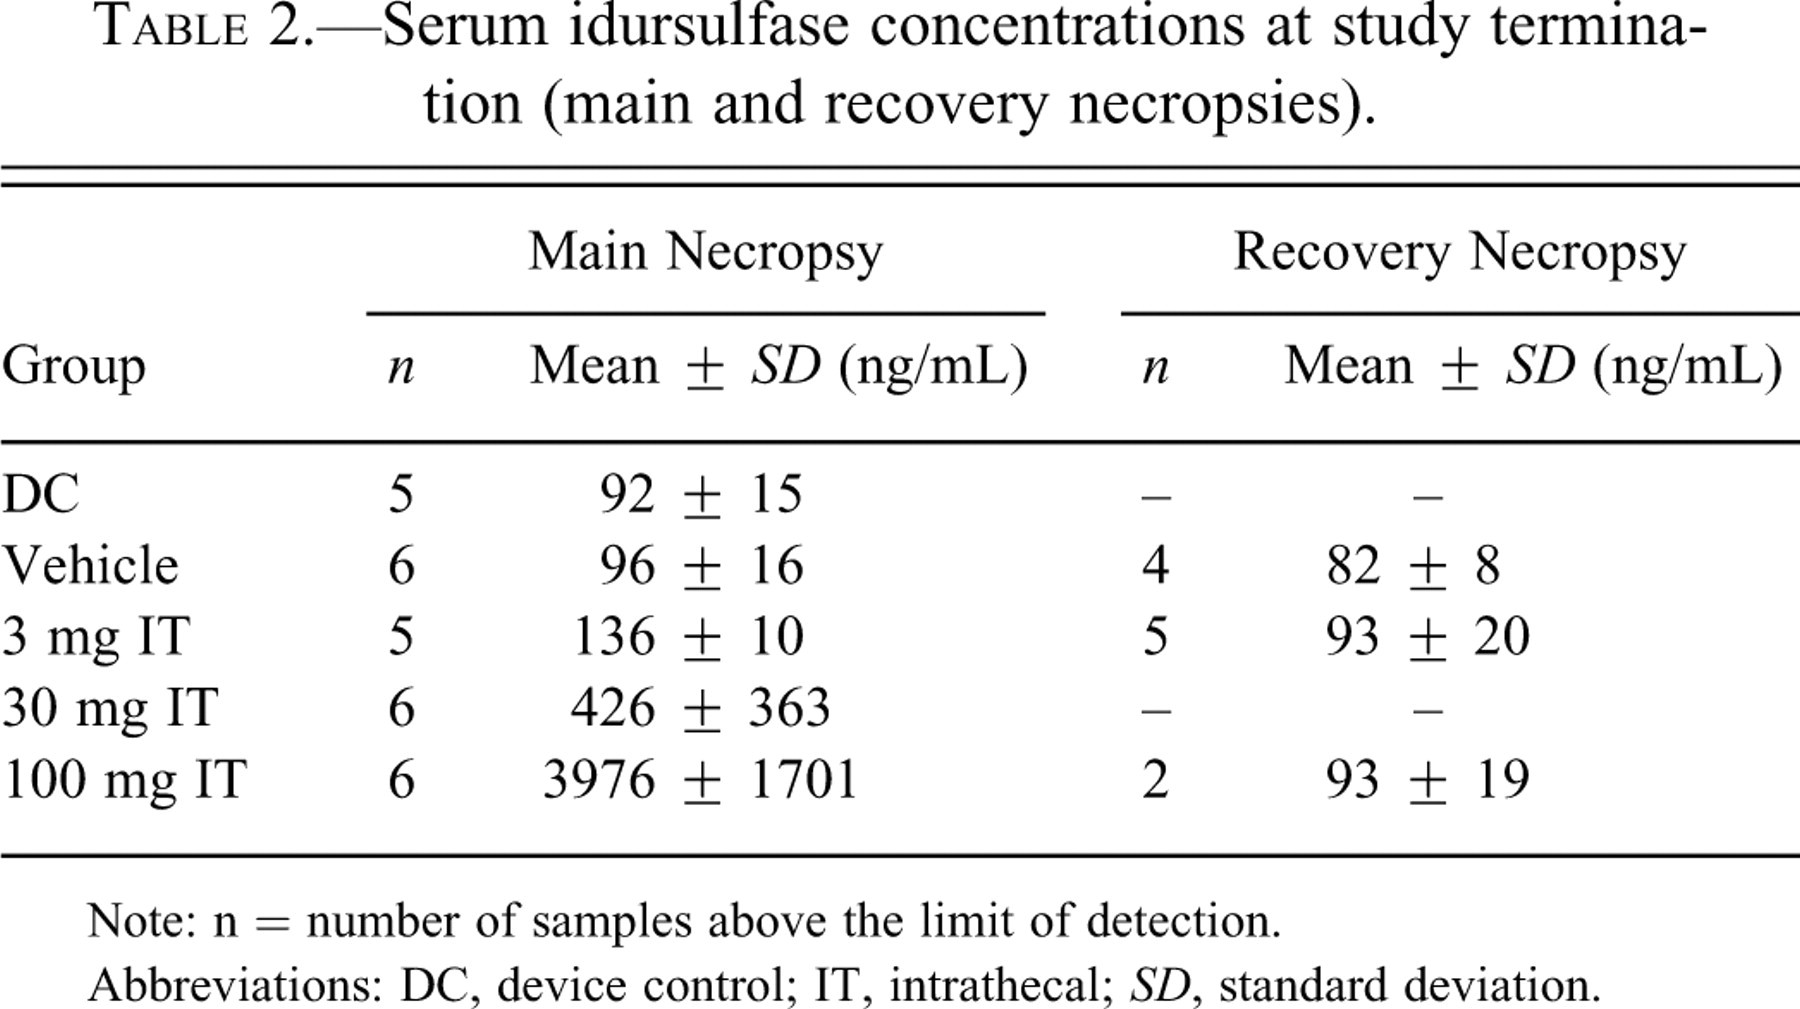
Note: n = number of samples above the limit of detection.
Abbreviations: DC, device control; IT, intrathecal; SD, standard deviation.
Idursulfase was not detected in the CSF after IV dosing. Following IT dosing, mean idursulfase concentrations increased with dose, with no apparent differences in levels observed at two or four hours postdose (data not shown). At the main necropsy, mean CSF idursulfase concentrations showed a dose-dependent increase in the 3, 30, and 100 mg/dose groups, whereas only the 100 mg/dose group had elevations at the recovery necropsy (Table 3 ). The mean idursulfase values of the 100 mg/dose recovery group appear to be disproportionately affected by one animal with a value of more than 7,000 ng/mL (all others were less than 130 ng/mL).
CSF idursulfase concentrations at study termination (main and recovery necropsies).
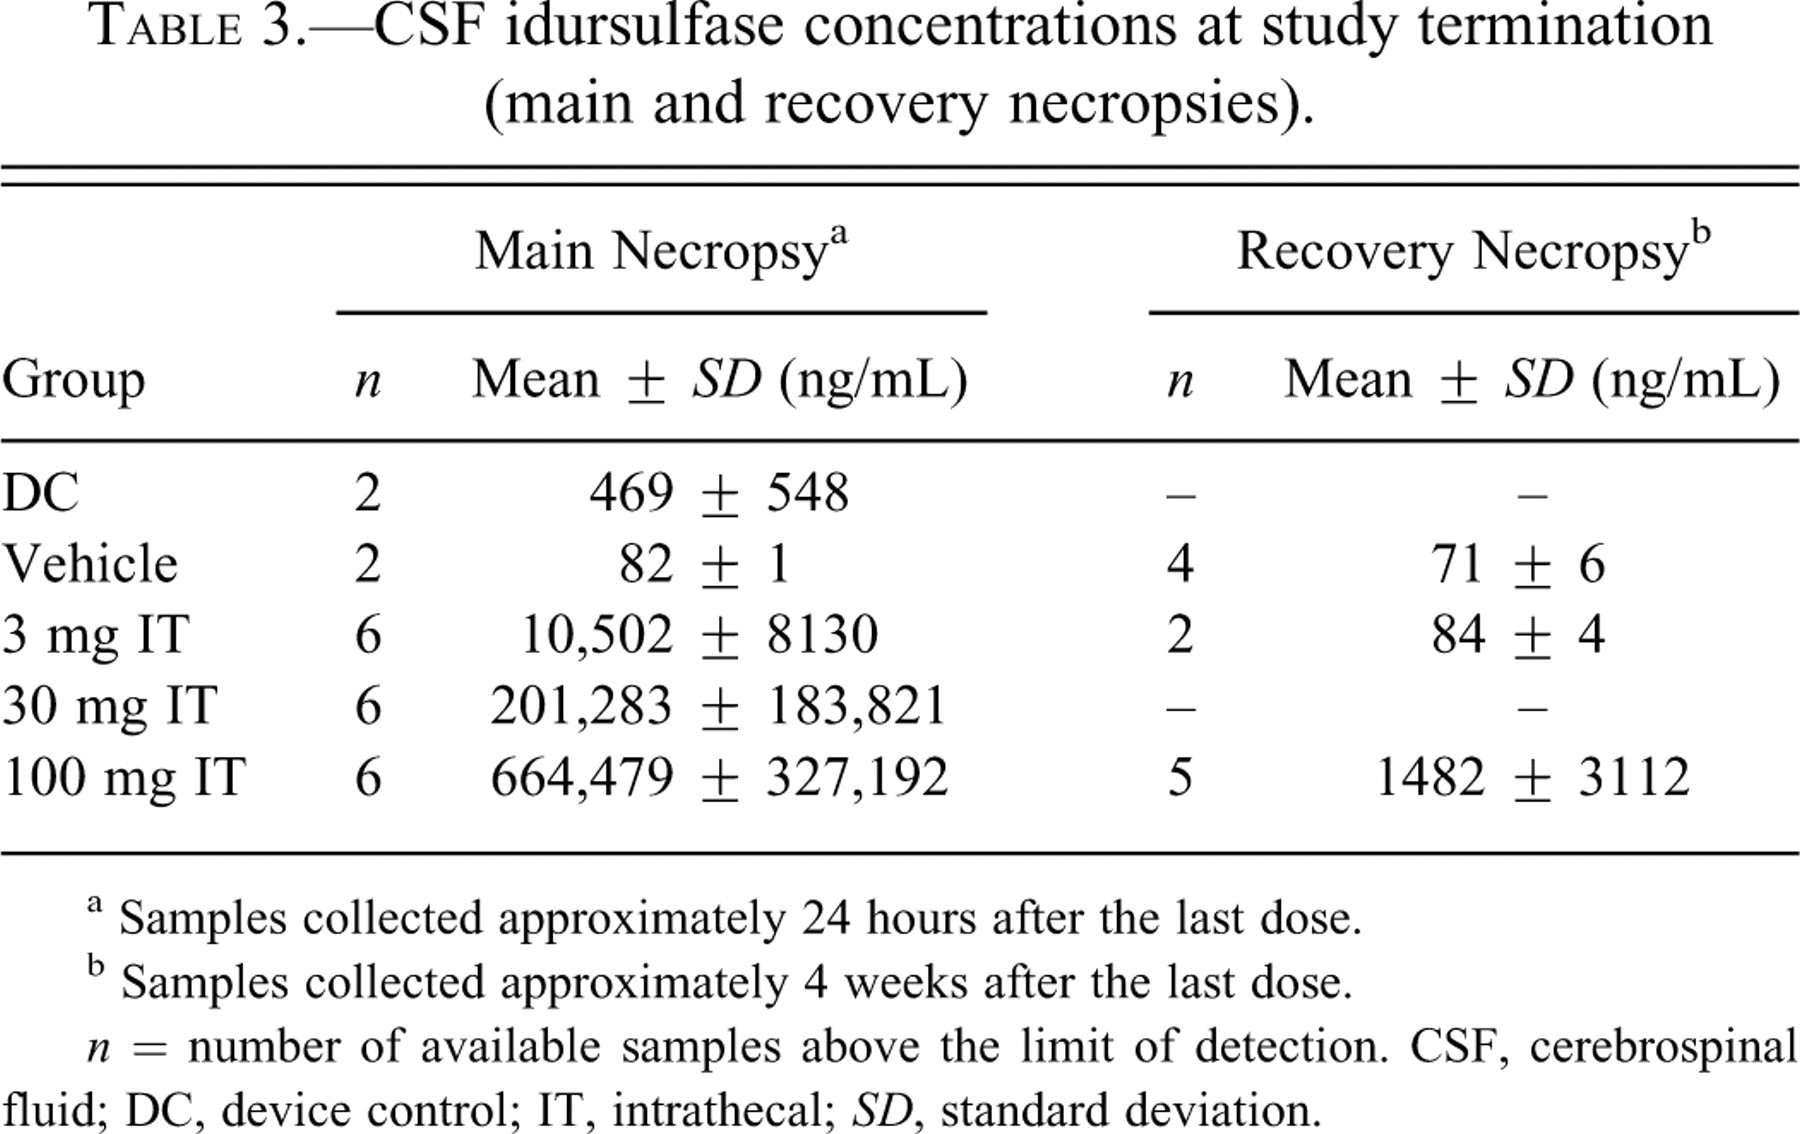
a Samples collected approximately 24 hours after the last dose.
b Samples collected approximately 4 weeks after the last dose.
n = number of available samples above the limit of detection. CSF, cerebrospinal fluid; DC, device control; IT, intrathecal; SD, standard deviation.
Gross and Histologic Pathology Findings
No idursulfase-related gross necropsy findings or changes in organ weights were observed. Leukocyte infiltrates (WBC present without notable damage or change to surrounding tissues) were observed in the meninges of the brain in the vehicle control group (Figure 4A and B) and in the idursulfase groups (Figure 4C-F). The infiltrates consisted of macrophages/lymphocytes (mononuclear cells), neutrophils, or eosinophils. Idursulfase-associated changes included more pronounced leukocyte infiltrates in the meninges, cervical spinal cord, and cauda equina of all dose groups; in the thoracic spinal cord of the 30 and 100 mg/dose groups; and in the lumbar spinal cord in the 100 mg/dose group. The infiltrates largely resolved during the four-week recovery period but still were generally more pronounced in the 100 mg/dose group than in the controls. Inflammation (infiltrates accompanied by tissue damage/response) was present in the epidural soft tissue adjacent to the spinal cord and in the perineurial connective tissue surrounding the spinal nerve roots at all dose levels and was more marked in idursulfase-IT–dosed groups than in the control groups.
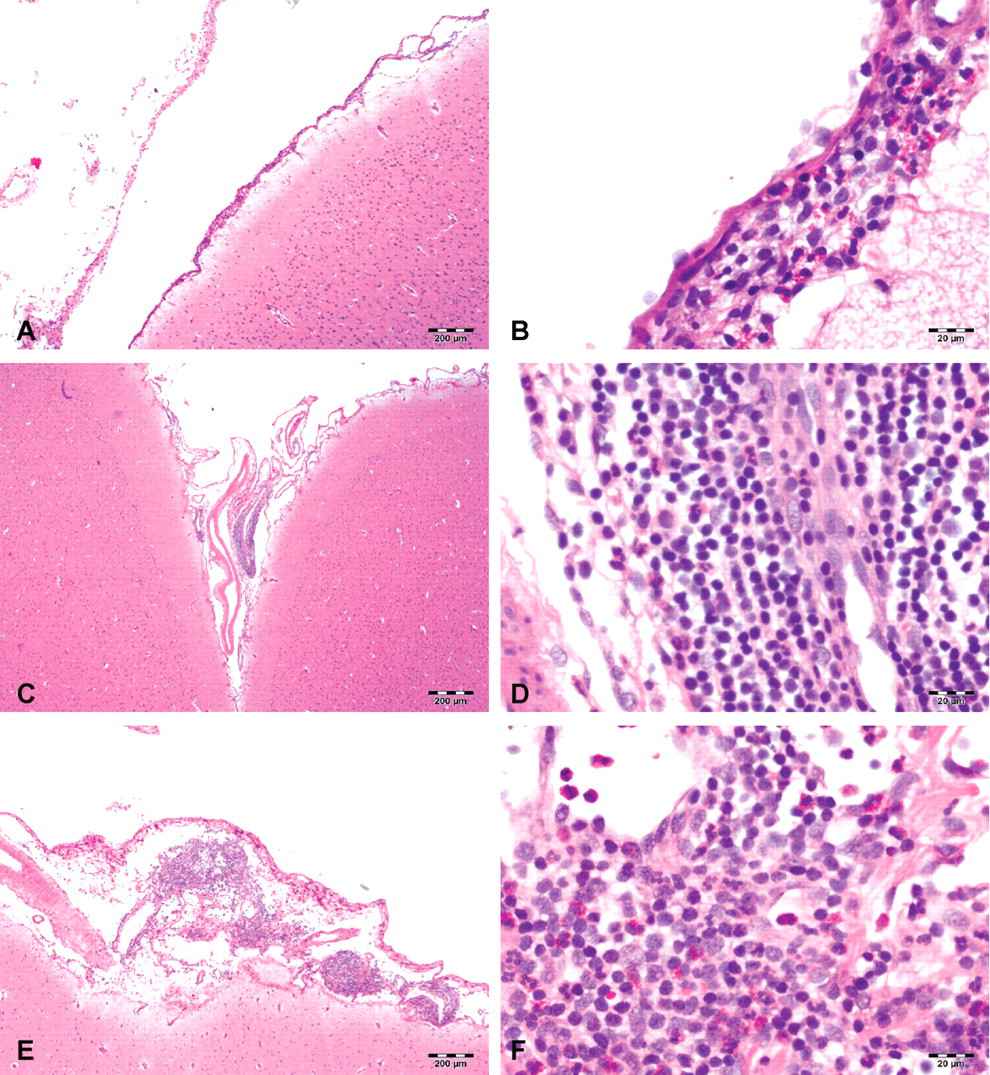
Representative images of tissue sections from the meninges of the brain stained with hematoxylin and eosin. (A) Vehicle control animal showing leukocyte infiltrates in the meninges and (B) a high-power view of same vehicle control animal showing the cells are a mixture of lymphocytes and eosinophils. (C) A low-dose idursulfase (3 mg/dose) animal showing meningeal infiltrates, which in some low-dose animals were comparable to controls. (D) A high-power view of the same low-dose idursulfase (3 mg/dose) animal showing nearly all cells were mononuclear cells (macrophages and lymphocytes). (E) Meningeal infiltrates in a high-dose idursulfase animal (100 mg/dose); the overall severity of infiltrates was relatively similar to those in the mid-dose group (30 mg/dose; not shown). (F) A high-power view of the same high-dose (100 mg/dose) animal. The infiltrates were a mixture of lymphocytes and eosinophils. Scale bars: 200 µm.
Changes in the spinal cord associated with the drug-delivery device (i.e., changes present at a similar incidence and average severity in controls and test article–treated animals) included nerve fiber degeneration, catheter tract fibrosis, compression of the cord (adjacent to the catheter tract), and gliosis (verified with the use of glial fibrillary acidic protein staining). None of these findings were considered idursulfase related. Schwann cell hyperplasia and nerve fiber degeneration of spinal nerve roots, especially in the region of the cauda equina, were interpreted to be a result of physical trauma related to the placement and/or presence of the drug-delivery device.
Serum and CSF Antibody Analysis
Serum and CSF samples were collected prior to all six IT doses and at necropsy (Table 4 ). Those collected prior to the first IV dose were considered baseline samples. Not all animals had every scheduled CSF sample collected. None of the control (device or vehicle) animals developed anti-idursulfase antibodies in serum or CSF at any time point. Animals in the 3, 30, and 100 mg/dose groups developed serum antibodies that were detected as early as dose 2. Cerebrospinal fluid antibodies were detected as early as dose 3 (100 mg/dose) or 4 (3 and 30 mg/dose). Once serum antibodies were detected, they were detected in each sample thereafter. All animals with detectable CSF antibody levels also had detectable serum antibody levels. The CSF antibodies were detected later than the serum antibodies in each case. Relative concentrations of serum and CSF antibodies generally were higher in animals receiving 30 or 100 mg/dose than in animals receiving the 3 mg dose; the relative concentration of CSF antibodies was lower than that of serum antibodies at any dose. Development of antibodies to a human protein is expected and did not result in any clinical signs in this study.
Summary of anti-idursulfase antibody results.
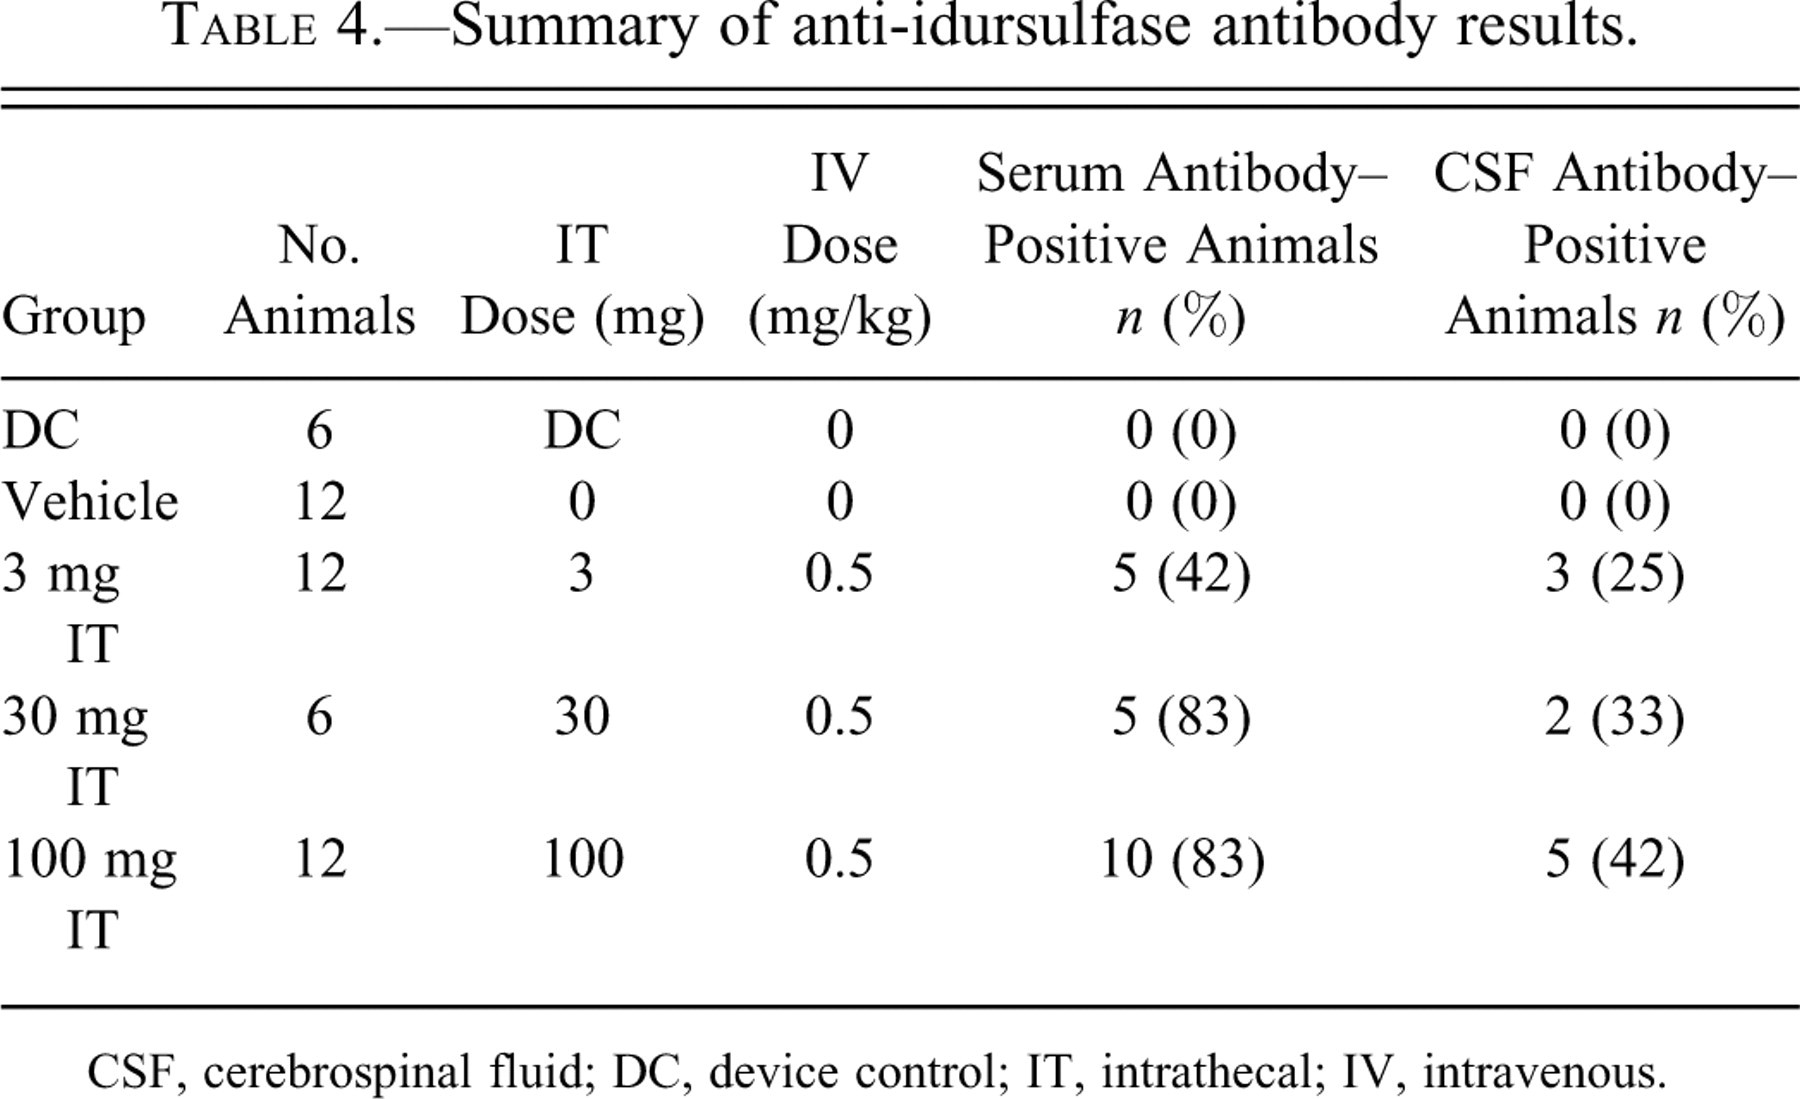
CSF, cerebrospinal fluid; DC, device control; IT, intrathecal; IV, intravenous.
Idursulfase Enzyme Activity
Basal idursulfase enzyme activity was determined in the device and vehicle-control animals in the brain, spinal cord, and liver twenty-four hours after the last IT injection (main necropsy) or after a four-week recovery period (recovery necropsy). Basal idursulfase enzyme activity levels in the brain (including the brain stem and cerebellum) ranged from 73.1 ± 14.5 to 369.5 ± 213.3 nmol/hr/mg of protein (Figure 5A). The enzyme activity in the brain of the 3 mg/dose group (range, 168.8 ± 23.5 to 523.4 ± 365.5 nmol/hr/mg of protein) was apparently not different from basal levels in the control animals at the main necropsy. Enzyme activity in the brain of the 30 and 100 mg/dose animals was above baseline, ranging from 505.8 ± 125.6 to 753.8 ± 183.2 and 1,447.2 ± 282.6 to 2,593.9 ± 315.1 nmol/hr/mg of protein, respectively. Enzyme activity returned to basal levels at the end of the four-week recovery period.
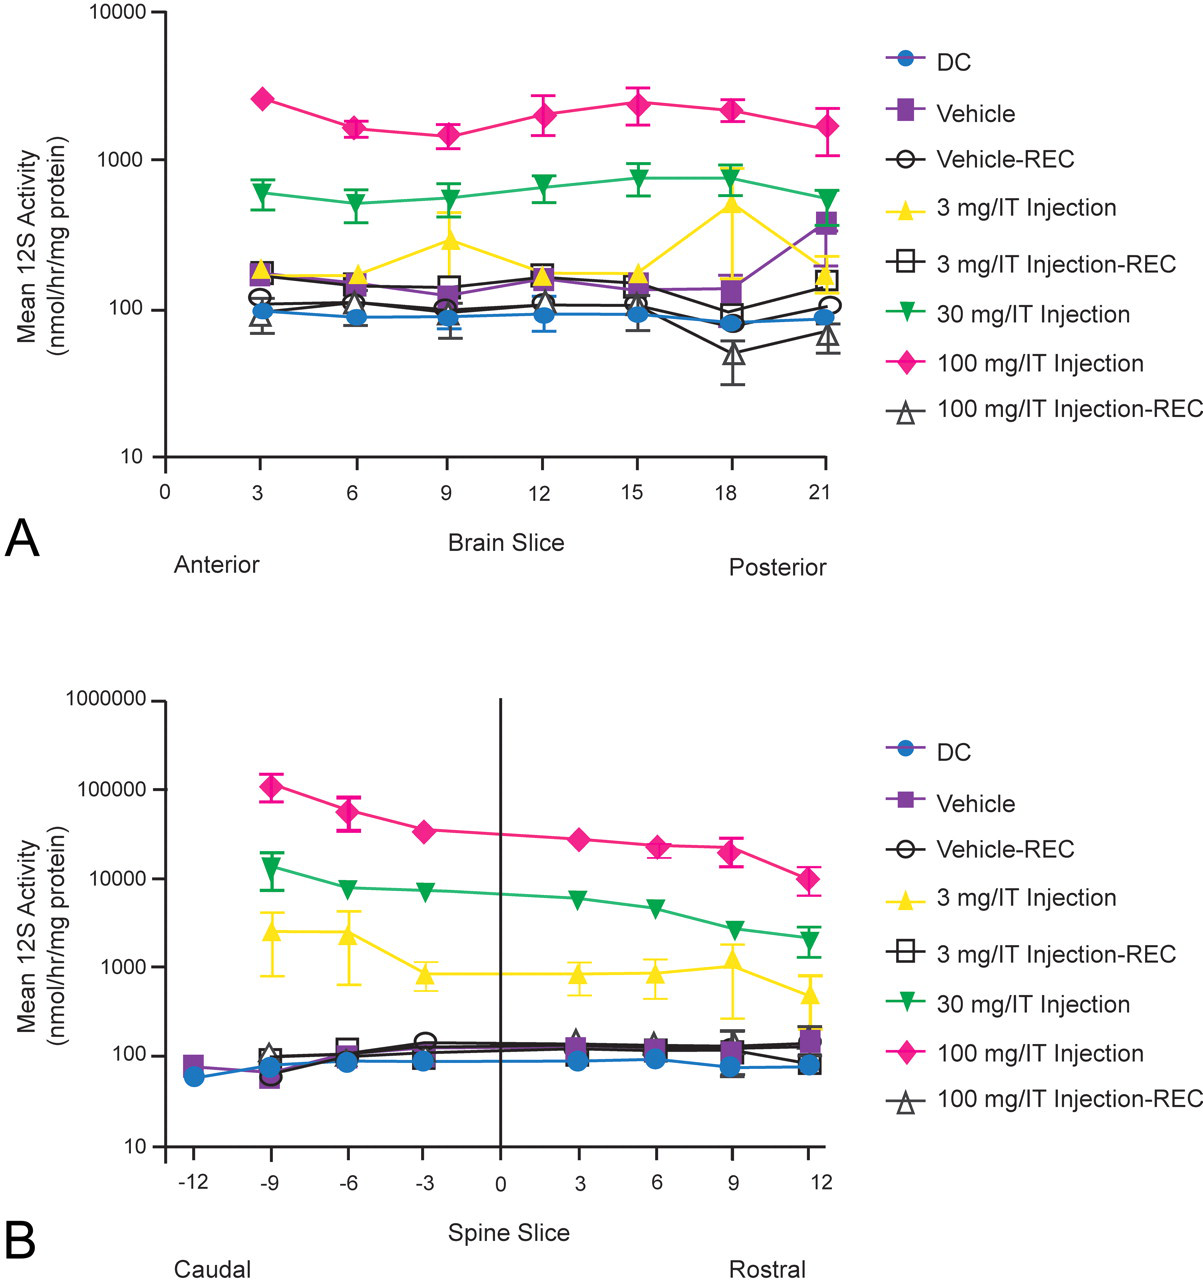
Idursulfase activity in cynomolgus monkey brain and spinal cord. Slice 0 is the catheter tip. (A) Idursulfase activity in the brain. Slices 18 and 21 refer to the brain stem and cerebellum, respectively. (B) Idursulfase activity in the spinal cord. All tissue samples were collected approximately twenty-four hours after the last dose or four weeks after the last dose for the recovery animals. DC, device control; I2S, iduronate-2-sulfatase; REC, recovery group.
The enzyme activity was evenly distributed throughout the brain, with no clear differences in enzyme activity levels from anterior to posterior brain, between the right and left hemispheres, or in the brain stem and cerebellum between any idursulfase-treated animals. In the 3 and 30 mg/dose groups, there were no apparent differences in enzyme activity between surface and deep-brain tissue samples. Although no statistical analyses were performed, there appeared to be a trend toward higher enzyme activity levels in the surface samples relative to the deep samples in the 100 mg/dose animals. Enzyme activities were at endogenous levels following the four-week recovery period.
Basal idursulfase enzyme activity in the spinal cord was similar to that in the brain, ranging from 77.2 ± 7.0 to 127.8 ± 4.5 nmol/hr/mg of protein (Figure 5B). Enzyme activity increased with dose in all regions of the spinal cord and was higher in the lumbar region near the tip of the catheter and lower in the cervical region. Samples from animals necropsied after the four-week recovery period in the 3 and 100 mg/dose idursulfase injection groups had enzyme activity that returned to basal levels.
In the liver, enzyme activity in the main necropsy samples increased with IT dose. Mean basal enzyme activity in the liver ranged from 7.0 ± 1.1 to 9.3 ± 2.1 nmol/hr/mg of protein. Mean enzyme activities were 67.3 ± 11.83 nmol/hr/mg of protein in the 3 mg/dose group, 799.8 ± 102.4 nmol/hr/mg of protein in the 30 mg/dose group, and 5,110.5 ± 1,135.5 nmol/hr/mg of protein in the 100 mg/dose group. At the end of the recovery period, idursulfase enzyme activity in the 100 mg/dose group remained slightly above basal levels.
Immunohistochemistry
Positive staining was detected in the brains of all idursulfase-IT–dosed animals, with the exception of one animal in the 3 mg/dose group. The lack of staining in the untreated animals (vehicle group, Figure 6A ) demonstrated the specificity of the antibody to injected human idursulfase. In the 3 mg/dose group, only meningeal cells and a few glial cells beneath the meninges were positive; no idursulfase immunostaining was detected in neurons (Figure 6B). In the 30 (Figure 6C) and 100 mg/dose (Figure 6D, 6E) groups, large populations of cerebral neurons, as well as meningeal and glial cells, were positive for idursulfase staining. Idursulfase staining was observed both in surface neurons next to the meninges and in deep neurons adjacent to the white matter. In all animals positive for idursulfase staining, no marked differences in neuronal staining were observed among the frontal, middle, and rear sections of the brain. No idursulfase staining was detected in the brains of any animals in the 3 and 100 mg/dose groups at the four-week recovery necropsy.
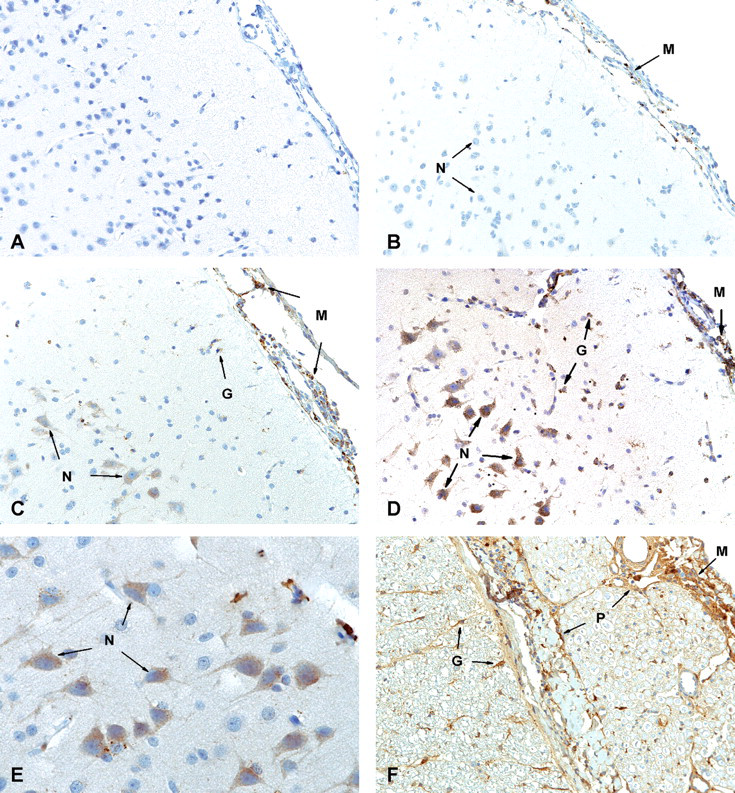
Idursulfase immunostaining in cynomolgus monkey brain and spinal cord. (A) Cerebrum of a vehicle-dosed animal showing no staining; 20× magnification. (B) Cerebrum of a 3 mg/dose–treated animal showing positive staining in meningeal cells but not neurons; 20× magnification. (C) Cerebrum of a 30 mg/dose–animal showing marked positive staining in meningeal and glial cells and in numerous neurons; 20× magnification. (D) Cerebrum of a 100 mg/dose–animal showing more intense staining in neurons and glial cells; 20× magnification. (E) Cerebrum of a 100 mg/dose–animal showing stronger staining observed in more neurons; 40× magnification. (F) Lumbar spinal cord of a 100 mg/dose–animal showing strongly positive staining of meningeal and glial cells and epi/peri/endoneurium; 20× magnification. G, glial cells; M, meningeal cells; N, neurons; P, epi/peri/endoneurium.
There was dose-dependent staining in the spinal cords of all idursulfase-treated animals, with the highest intensity observed in the lumbar region near the distal end of the catheter. The spinal cord in the 100 mg/dose group was positive for meningeal, glial, and perivascular cells (Figure 6F) and neurons, and the 30 mg/dose group was positive for neurons as well as meningeal and glial cells. Only meningeal cells were positive for idursulfase in the 3 mg/dose animals. No idursulfase was detected in the spinal cords of any animals in the 3 and 100 mg/dose groups after the four-week recovery period.
In the liver, dose-dependent staining was observed in the sinusoidal cells (Kupffer and endothelial cells) of all idursulfase-dosed animals (Figure 7A–D). Sinusoidal staining was more marked in the 30 mg/dose group (Figure 7B) than in the 3 mg/dose group (Figure 7A). The intensity of sinusoidal staining was greatest in the 100 mg/dose group, and staining also was detected in hepatocytes (Figure 7C and D). No idursulfase staining was observed in the animals in the 3 and 100 mg/dose groups following the four-week recovery period. Idursulfase was not detected in the brain, spinal cord, and liver samples of any animals in the device and vehicle control groups.
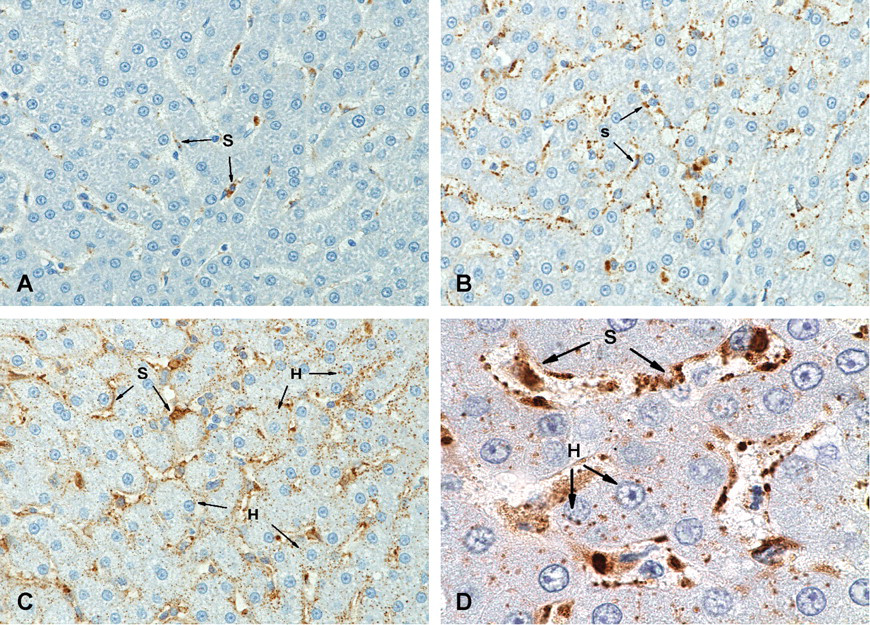
Idursulfase immunostaining in cynomolgus monkey liver. (A) In the 3 mg/dose group, only sinusoidal cells were positive for idursulfase; 40× magnification. (B) More marked staining was found in sinusoidal cells in the 30 mg/dose group; 40× magnification. Marked staining was found in sinusoidal cells as well as in hepatocytes in the 100 mg/dose group; (C) 40× magnification. (D) 100× magnification. H, hepatocytes; S, sinusoidal cells.
Discussion
In this study, monthly delivery of idursulfase-IT in combination with weekly idursulfase IV administration for six months was generally well tolerated in cynomolgus monkeys. No remarkable changes were observed in body weight, clinical status, ophthalmological/neurological/physical examinations, ECG, or gross organ appearance. Findings were limited to transient changes in CSF clinical pathology accompanied by meningeal infiltrates and epidural inflammation, with nearly complete reversal in all but the highest dose group following the recovery period. In nonclinical intrathecal studies, meningeal infiltrates are commonly observed in device and vehicle controls (Butt 2011), as is CSF leukocytosis. In this study, administration of idursulfase-IT resulted in more pronounced meningeal infiltrates as compared to device and vehicle controls. Of particular note, widespread distribution of idursulfase throughout the brain and spinal cord was observed, similar to that seen with IT ERT in other animals to date (Hemsley and Hopwood 2009).
Monthly administration of idursulfase-IT elicited an inflammatory response characterized by neutrophilic diapedesis and infiltration, the effusion of albumin, and the lowering of glucose in the CSF compartment within two to four hours of dosing, findings that were not accompanied by any clinical signs. This response likely reflects a transient, localized, and incomplete opening of the BBB near the catheter tip related to changes in the tight junctions, which can result in the entry of leukocytes and plasma proteins into the CSF (Simard et al. 2007; Stamatovic et al. 2008). Increases in leukocyte and protein levels in the CSF have been reported previously in a Phase I trial for IT delivery of ciliary neurotrophic factor to patients with amyotrophic lateral sclerosis (Penn et al. 1997). Transient dose-dependent decreases in CSF glucose levels also were observed two to four hours after idursulfase-IT administration, with no significant differences between dose groups and controls twenty-four hours postdose at the main necropsy. The findings are consistent with studies showing that inflammatory responses in the CNS resulting from aseptic or septic meningitis are associated with decreases in CSF glucose levels, presumably as a result of increased use of glucose by inflammatory cells (Davson and Segal 1996). There also were changes in the spinal cord in some animals associated with the drug delivery device that included nerve fiber degeneration, catheter tract fibrosis, and compression of the spinal cord. None of these changes was considered to be related to idursulfase.
An important result of the present study is the unique information on the analysis of CSF within the temporal window of two to four hours postdose. Traditional IT studies may have failed to detect these transient changes, even if the sample was collected twenty-four hours postdose. The study design originally required sampling of CSF at the two-hour interval, which was revised to allow additional time for distribution of idursulfase in the CSF. This modification resulted in greater numbers of leukocytes being detected in the CSF but had no impact on total protein or albumin levels measured.
Approximately 67% of monkeys dosed with idursulfase developed a serum antibody response to the IV and IT administration of idursulfase, with no clinical signs resulting from the development of these antibodies. Only those animals that had a serum antibody response subsequently developed CSF antibodies. The relative antibody concentrations were lower in the CSF than in the serum and were detected at a later dose, which is not uncommon as the immune response matures and is consistent with other published results (Kakkis et al. 2004). This is an expected response when administering a recombinant human protein to an alternate species and is consistent with previous studies in mice (Garcia, DaCosta et al. 2007; Hemsley et al. 2007; McVie-Wylie et al. 2008) and monkeys (Hovland et al. 2007). In the Phase II/III clinical trial, approximately half of the patients had detectable anti-idursulfase antibodies after IV infusion (Muenzer et al. 2006).
Preclinical studies have provided evidence of the successful delivery of recombinant proteins directly into the CSF for the treatment of the neurologic pathology characteristic of many lysosomal storage diseases (Hemsley and Hopwood 2009). Kakkis et al. (2004) found that weekly IT administration of recombinant human iduronidase into the cisterna magna in a canine model of MPS I reduced GAG storage in the CNS. Using the same model, monthly and quarterly dosing of IT recombinant human iduronidase with concomitant IV dosing resulted in supranormal enzyme levels in the brain, as well as reductions in GAG storage (Dickson et al. 2007). In other studies, the injection of recombinant human sulfamidase into the cisterna magna in a naturally occurring mouse model of MPS IIIA resulted in a dose-dependent reduction in the level of heparan sulfate–derived oligosaccharides (Hemsley et al. 2007; Hemsley et al. 2008; Hemsley, Luck et al.2009) and behavioral improvements (Hemsley et al. 2007; Hemsley, Luck et al. 2009). Intrathecal treatment with recombinant human N–acetylgalactosamine 4-sulfatase in a feline model of MPS VI resulted in a reduction of oligosaccharide fragments in the CSF and vacuolization in the dura mater (Auclair et al. 2010).
There also have been several reports of patients undergoing direct injection of ERT into the CSF. The administration of alglucerase into the CSF of a child with acute neuropathic Gaucher disease was investigated (Bembi et al. 1995). In another report, repeated weekly injections of hexosaminidase A to two children with Tay-Sachs disease were well tolerated but did not result in any improvements (von Specht et al. 1979). More recently, when iduronidase was administered via lumbar puncture to a patient with spinal cord compression resulting from MPS I, improvements in the twelve-minute walking test, CSF GAG levels, and respiratory measures were found, with no major adverse events (Muñoz-Rojas et al. 2008). Moreover, when recombinant human N-acetylgalactosamine 4–sulfatase was administered to a child with MPS VI and spinal cord compression, some neurological and urodynamic improvements were seen, but there was a worsening of walking capacity (Muñoz-Rojas et al. 2010).
These case reports and data from animal models provide confidence for pursuing IT therapy as a treatment strategy for the neurological manifestations of lysosomal storage diseases. The current nonhuman primate toxicology study demonstrates the feasibility and tolerability of administering idursulfase via an IT drug-delivery device. The nonadverse CNS pathology and lack of adverse clinical signs have supported the recent investigational new drug approval and ongoing clinical trial evaluating the safety and efficacy of idursulfase-IT (ClinicalTrials.gov identifier NCT00920647).
In conclusion, monthly bolus idursulfase-IT administration in conjunction with weekly IV injections resulted in dose-dependent levels of idursulfase in the serum, CSF, brain, spinal cord, and liver. Idursulfase–IT–associated changes in CSF leukocyte counts and chemistry also were dose dependent and correlated with the WBC infiltrates in the CNS. Monitoring changes in CSF cellularity and protein and glucose concentrations appeared to be a reliable correlate of the morphological changes noted on histopathological evaluation and may be useful in patients treated with idursulfase-IT. These changes were an expected reaction to an IT-administered protein and were largely resolved after the recovery period. The no–observed-adverse-effect level in this study was considered to be 100 mg idursulfase–IT, the highest dose tested, in combination with 0.5 mg/kg IV idursulfase.
Footnotes
Acknowledgments
This study was sponsored by Shire Human Genetic Therapies, Inc. Julie Lieb contributed to the study design and monitored the study. Anne Renee Graham and Charlene Neal performed the immunohistochemistry. Nancy Savioli and Kate Zaleski performed the tissue idursulfase activity analysis. Judy Durant provided the data for CSF and serum idursulfase and antibody levels. The authors would like to thank Dr. Gaozhong Zhu and Kris Lowe for the development of the idursulfase-IT formulation. The authors also would like to thank Dr. Ann Barbier for her thoughtful discussions. Writing and editorial support in the preparation of the manuscript was provided by Dr. Erika L. Meyer of PharmaWrite, LLC, Princeton, NJ, and Dr. Linda E. Whetter of Zola Associates, Englewood Cliffs, NJ, and was supported by Shire Human Genetic Therapies, Inc. Portions of this manuscript were presented at the 49th Annual Meeting of the Society of Toxicology, March 7–11, Salt Lake City, Utah (Abstract #1061).
Acknowledgements
The following authors are employees of Shire Human Genetic Therapies, Inc.: B. R. Felice, T. L. Wright, R. W. Pfeifer, J. Pan, J. A. Ruiz, M. W. Heartlein, and P. Calias. R. B. Boyd is president and chief executive officer of Northern Biomedical Research, Inc., the contract research organization where the study was conducted. M. T. Butt is the president of Tox Path Specialists, LLC, which carried out the pathology evaluations in the study.
Acknowledgements
The author(s) received no financial support for the research and/or authorship of this article.