
Abstract
High doses of insulin and the insulin analog AspB10 have been reported to increase mammary tumor incidence in female rats likely via receptor-mediated mechanisms, possibly involving enhanced IGF-1 receptor activation. However, insulin and IGF-1 receptor functionality and intracellular signaling in the rat mammary gland in vivo is essentially unexplored. The authors investigated the effect of a single subcutaneous dose of 600 nmol/kg human insulin or IGF-1 on Akt and ERK1/2 phosphorylation in rat liver, colon, and mammary gland. Rat tissues were examined by Western blotting and immunohistochemistry by phosphorylation-specific antibodies. Insulin as well as IGF-1 caused Akt phosphorylation in mammary epithelial cells, with myoepithelial and basal epithelial cells being most sensitive. IGF-1 caused stronger Akt phosphorylation than insulin in mammary gland epithelial cells. Phosphorylation of ERK1/2 was not influenced by insulin or IGF-1. Rather, in liver and mammary gland P-ERK1/2 appeared to correlate with estrous cycling, supporting that ERK1/2 has important physiological roles in these two organs. In short, these findings supported that the rat mammary gland epithelium expresses functional insulin and IGF-1 receptors and that phosphorylation of Akt as well as ERK1/2 may be of value in understanding the effects of exogenous insulin in the rat mammary gland and colon.
Introduction
Recent epidemiological studies reported a possible link between the insulin analog glargine and cancer development (Hemkens et al. 2009; Smith and Gale 2009). These controversial studies have been discussed intensely (de Miguel-Yanes and Meigs 2009; Ehninger and Schmidt 2009; Pocock and Smeeth 2009) and are considered inconclusive by health authorities (EMEA 2009). However, this has highlighted the importance of the preclinical safety assessment of mitogenic and carcinogenic effects of insulin analogs.
At dose levels of 1,200 nmol/kg, approximately 100 to 200 times higher than therapeutic doses, the insulin analog AspB10 increased the incidence of mammary tumors in female rats (Dideriksen, Jorgensen, and Dreijer 1992), and examination of the proliferative effect in the rat mammary gland is therefore required for development of novel insulin analogs. This is done by immunohistochemical staining for proliferation markers, such as PCNA, Ki67, or BrdU, followed by quantitation of positive mammary epithelial cells (EMEA/CPMP 2001). The most likely explanation for any mitogenic effect of insulin analogs in the rat mammary gland is a receptor-mediated mechanism, where insulin receptors (IR) and IGF-1 receptors (IGF-1R) trigger proliferative and/or anti-apoptotic responses (Hansen 2008). If such receptor-mediated mechanisms contribute to cancer development, it is biologically plausible to assume that intracellular signaling events are involved. However, the effect of insulin on intracellular signaling in the rat mammary gland is essentially unexplored and it has not been determined whether subpopulations of rat mammary gland epithelial cells are especially sensitive to insulin.
Insulin and IGF-1 signal through the closely related IR and IGF-1R transmembrane receptor tyrosine kinases. Reflecting the high degree of receptor homology, insulin can signal through the IGF-1R and IGF-1 can signal through the IR, but the affinity of insulin and IGF-1 toward the non-cognate receptor is 500- to 1,000-fold and 50- to 100-fold reduced, respectively (Slieker et al. 1997). Binding of ligand to the IR and IGF-1R activates the PI3-kinase pathway, involving activation (phosphorylation) of the Akt protein kinase (Alessi et al. 1996). Both the PI3-kinase and Akt are recognized oncogenes (Vogt, Bader, and Kang 2006), and mutations resulting in activation of these proteins are seen in many human cancers (Bader, Kang, and Vogt 2006; Vivanco and Sawyers 2002). Activated Akt has important metabolic effects, such as stimulation of glucose uptake in cells by directing GLUT4 to the plasma membrane; stimulation of glycogenolysis, lipogenesis, and protein synthesis; and inhibition of lipolysis (Whiteman, Cho, and Birnbaum 2002). Akt also stimulates proliferation in a variety of ways: (1) by promoting transition from G0- to G1-, G1- to S-, and G2- to M-phase of the cell cycle (Kandel et al. 2002; Muise-Helmericks et al. 1998; Rossig et al. 2001; Shin et al. 2002; Shtivelman, Sussman, and Stokoe 2002); (2) by inhibiting apoptosis (Datta et al. 1997); (3) via the anabolic effects mentioned earlier, reflecting that mRNA translation and protein synthesis represent a main bottleneck for cell division (Bader et al. 2005; De and Rhoads 1990; Holland 2004; Holland et al. 2004); and (4) via the effects on carbohydrate metabolism mentioned earlier, reflecting the importance of up-regulated aerobic glycolysis in most human cancers (the Warburg effect) (Robey and Hay 2009).
The IR and IGF-1R can also activate the Ras/Raf/MEK/ERK kinase cascade (Liu and Roth 1998; Sasaoka et al. 1994). ERK1/2 regulates cellular activities such as gene expression, metabolism, proliferation, mitosis, and apoptosis (Robinson and Cobb 1997), and as for Akt, ERK1/2 is also capable of stimulating transition from G2- to M-phase (Dumesic et al. 2009). Interestingly, it has been reported that activation of ERK1/2 by IGF-1 requires transactivation of the epidermal growth factor receptor (Ahmad et al. 2004).
In the present study, the aim was to explore the effect of human insulin and IGF-1 on intracellular signaling in the rat mammary gland. We focused on Akt and ERK1/2 because (1) these protein kinases are known to be central for insulin and IGF-1 signaling, including mitogenic and anti-apoptotic signaling; (2) deregulation of Akt as well as ERK1/2 signaling is common during carcinogenesis; and (c) the Akt and ERK1/2 pathways are known to crosstalk and the balance between ERK1/2 and Akt signaling is known to influence the biological outcomes of IR/IGF-1R activation, for example, whether differentiation or proliferation occurs in breast cancer cells (Moelling et al. 2002; Ren, Accili, and Duan 2010; Zimmermann and Moelling 1999). Furthermore, the effect of the estrous cycle on intracellular signaling was examined. Finally, to allow preliminary evaluation of phosphorylated (activated) Akt and ERK1/2 as markers of mitogenic signaling, the effects of insulin (low if any mitogenic effect expected) and IGF-1 (high mitogenic effect expected) were compared between organs where insulin is expected to have mainly a metabolic effect (liver) and organs where insulin has been described to also have mitogenic effects (mammary gland and colon).
Materials and Method
Animal Experiments
Animal experiments were performed in accordance with the Danish national guidelines (Ministry of Justice 2003). Seven-week-old, female outbred Sprague Dawley rats (NTac:SD) were purchased from Taconic Europe (Ejby, Denmark). The animals were acclimatized for ten days before study initiation and were approximately ten weeks old at euthanasia. The rats were housed in transparent type VI macrolone cages with four or five animals per cage (floor area: 1,800 cm2) and given free access to complete pelleted rodent diet (Altromin 1320, Brogården, Hørsholm, Denmark) and non-chlorified and non-acidified drinking water. The animal room environment was maintained at 18-24°C, 30-70% relative humidity, 8-15 air changes per hr, and a 12/12 hour light-dark cycle. To ensure that the rats were sexually mature and cycling normally, vaginal smears were collected at experimental day (post-acclimatization) 1-13 (experiment 1) and 1-6 (experiment 3), as described previously (Marcondes, Bianchi, and Tanno 2002), and thereafter air-dried and stained with Hemacolor (Merck KGaA, Darmstadt, Germany). The estrous cycle stage at euthanasia was furthermore confirmed by histological examination of the internal reproductive organs, as described previously (Westwood 2008).
The aim of experiment 1 was to examine the time course of insulin- and IGF-1-induced Akt and ERK1/2 phosphorylation using Western blotting. The experiment included twenty-four animals; four animals were treated with vehicle and euthanized after 15 min. Ten animals were treated with native human insulin, and ten animals with human IGF-1 and euthanized after 15, 30, 60, 150, or 300 min (two insulin-treated and two IGF-1-treated animals per time-point). Animals treated with insulin received a single subcutaneous injection of 600 nmol/kg (100 IU/kg) recombinant native human insulin (Novo Nordisk A/S, Copenhagen, Denmark). Animals treated with IGF-1 received a single subcutaneous injection of 4.6 mg/kg (600 nmol/kg) recombinant native human IGF-1 (Increlex, Mecasermin, Institut Produits Synthese IPSEN AB, Stockholm, Sweden). Vehicle-treated animals received a single subcutaneous injection of 1 ml/kg of aqueous vehicle containing 7 mM phosphate, 150 mM glycerol, 22 mM NaCl, and 30 mM phenol, pH 7.4.
In experiment 2 and 3 the aim was to examine insulin- and IGF-1-induced Akt and ERK1/2 phosphorylation using IHC. In the initial experiment 2, three untreated animals and three animals treated subcutaneously with insulin as described earlier were euthanized 30 min after treatment. In experiment 3, five animals were treated with vehicle, insulin, or IGF-1, respectively, as described earlier, and euthanized 30 min after treatment.
Collection of Plasma and Tissue Samples for Western Blotting, Histology, and IHC
In experiment 1 (Western blotting), the animals were anaesthetized with isoflurane and euthanized by exsanguination through incision of the abdominal aorta. Blood samples were collected in 2 ml EDTA-coated Vacutainer tubes (BD, Plymouth, UK). Immediately after euthanasia, samples of the left liver lobe, the right gastrocnemius muscle (comprising red and white muscle fibers), the 4th left mammary gland, and the middle part of the colon were collected, frozen in liquid nitrogen, and stored at –80°C. The colon samples were rinsed in isotonic saline to remove feces and comprised mucosa as well as smooth muscle layers. Vagina, uterus, and both ovaries were fixed overnight at room temperature in 4% neutral buffered formaldehyde (VWR, Herlev, Denmark).
In preliminary experiments, we found that perfusion fixation with paraformaldehyde was required for optimal immunohistochemical staining of phosphorylated proteins. In experiments 2 and 3 perfusion fixation was therefore applied. The animals were anaesthetized by subcutaneous injection with 0.75 ml Hypnorm (VetaPharma Ltd, Leeds, UK) and 3.75 mg Midazolam (Hameln Pharmaceuticals GmbH, Hameln, Germany) per kg. After deep surgical anesthesia was achieved (after approximately 20 min), the heart was exposed, fixed with a pair of forceps, and two incisions were made: one in the right atrium and auricle and one in the left ventricle near the apex of the heart. Through the incision in the left ventricle, animals were perfused first with isotonic saline for 3 min at 30 ml/min and then with 4% paraformaldehyde in PBS (Ampliqon, Skovlunde, Denmark) for 7 min at 30 ml/min. Successful perfusion was evidenced by lighter coloring of the liver and generalized muscular contractions after perfusion for approximately 1 min with saline and paraformaldehyde, respectively. After perfusion, all right-side mammary glands and samples of the liver, the gastrocnemius muscle, the middle part of the colon, vagina, uterus, and both ovaries were fixed in 4% paraformaldehyde overnight at room temperature.
Analysis of Rat Plasma for Human IGF-1 and Human Insulin
The rat plasma samples were analyzed for human IGF-1 using the Octeia human IGF-1 ELISA kit (Immunodiagnostics System Nordic A/S, Herlev, Denmark). According to the manufacturer, this kit does not detect rat IGF-1. Standards were made by diluting Increlex in rat plasma to concentrations ranging from 0 ng/ml to 1,000 ng/ml. Briefly, rat plasma samples and standards were incubated for 10 min at room temperature with releasing reagent to inactivate IGF-binding proteins and human IGF-1 was afterward quantified by ELISA, according to the manufacturer’s instructions.
Rat plasma samples were analyzed for human insulin content using a luminescence oxygen channeling immunoassay (also called AlphaLisa) developed at Novo Nordisk A/S (Denmark). Briefly, the homogenous bead based assay utilized two monoclonal antibodies (one of which is biotinylated) against human insulin, creating a sandwich between acceptor-beads, insulin, and donor-beads, which generated a signal proportional to the concentration of insulin. The antibodies displayed minimal cross-reactivity to rat insulins (i.e., <1% of the reactivity to human insulin).
The plasma half-lives of human IGF-1 and insulin were estimated as described previously (Brown and Davis 2001).
Preparation of Tissue Lysates and Western Blotting for Phosphorylated Akt and ERK1/2
Frozen tissue samples were lysed in cell extraction buffer (Bio Source, Invitrogen A/S, Taastrup, Denmark) containing protease inhibitor cocktail (Sigma-Aldrich Denmark A/S, Brøndby, Denmark) and 1 mM 4-(2-Aminoethyl) benzenesulfonyl fluoride hydrochloride (a serine protease inhibitor) (Calbiochem, Merck KGaA, Darmstadt, Germany), using a Qiagen Tissue Lyser apparatus according to the manufacturer’s instructions (Qiagen Nordic, Ballerup, Denmark). The following volumes of cell extraction buffer were added to the tissue samples: Mammae and muscle; 8 µl/mg, liver; 17 µl/mg and colon; 10 µl/mg. Lysates were cleared by centrifugation at 20,000 g for 15 min at 4°C. The protein content was determined by the BCA method according to manufacturer’s instructions (Thermo Fischer Scientific, Copenhagen, Denmark). Lysates from individual animals were pooled according to tissue and treatment. The lysate pools contained equal amounts of total protein from each animal.
Lysate pools were mixed with an equal volume 2×SDS sample buffer (40 mM Tris-HCl, 20% glycerol, 2% SDS, 5% β-mercaptoethanol, 0.005% bromphenol blue, pH 6.8) and denaturated at 90°C for 10 min in a heating block. SDS-PAGE of 20 µg total protein per lysate pool was performed on precast 4-12% gradient gels (NuPAGE, Invitrogen, California, USA) at 125 V for 1.5 hour in 1×MOPS buffer and proteins were electro-transferred to 0.45 µm PVDF membranes (Invitrogen) in transfer-buffer containing 25 mM Trizma base, 192 mM glycine (Sigma-Aldrich Denmark A/S), and 20 vol% ethanol (Kemetyl A/S, Køge Denmark), using a XCell II Blot Module (Invitrogen A/S).
The PVDF membranes were blocked in 5% fat-free skim milk (Merck KGaA) in PBS containing 0.5% Tween 20 (PBS-T) for 60 min, washed in PBS-T for 3×5 min and incubated with primary antibody diluted in 5% BSA in PBS-T overnight at 4°C with continuous gentle shaking. The primary antibodies were: monoclonal rabbit anti-phosphorylated Akt (Ser473) (Cell Signaling Technology Inc., Danvers, Massachusetts, USA, #9271) diluted 1:1,000, monoclonal rabbit anti-phosphorylated p44/42 MAPK (specific for dual phosphorylation of ERK1 on Thr202/Tyr204, and of ERK2 on Thr185/Tyr187, or single phosphorylation of Thr202) (Cell Signaling Technology Inc., #4376) diluted 1:1,000, mouse monoclonal antibody anti-GAPDH (Abcam, Cambridge, UK, cat. no. ab8245) diluted 1:100,000, and mouse monoclonal antibody anti-beta actin (Abcam, cat. no. ab6276) diluted 1:80,000. The following day, the membranes were washed 3×5 min in PBS-T and incubated for 60 min at room temperature with HRP-conjugated goat anti-rabbit IgG (Biorad, Copenhagen, Denmark, cat. no.170–6515) or HRP-conjugated goat anti-mouse IgG (Biorad, cat. no. 170–6515), diluted 1:3,000 in PBS-T with 5% fat-free skim milk powder. Finally, the membranes were washed for 3×5 min in PBS-T, and protein bands were visualized with Super Signal West Pico Chemiluminescent Substrate (Thermo Fisher Scientific) and a LAS3000 CCD camera (Fujifilm Danmark A/S, Vedbæk, Denmark). Quantitation of the Western blots was performed with MultiGauge software, according to the manufacturer’s instructions (Fujifilm). Based on three Western blot replicates, the P-Akt and P-ERK1/2 bands were normalized relative to the mean of β-actin- and GAPDH-bands and results were expressed relative to the vehicle-treated animals, namely, the intensity of P-Akt and P-ERK1/2 bands in the vehicle treated animals were thereby set to 1.0.
Histochemistry and Immunohistochemistry for Phosphorylated Akt and ERK1/2
Following fixation in paraformaldehyde for 24 hr, mammary gland samples were trimmed for horizontal sectioning (Hvid, Thorup, Oleksiewicz, et al. 2010) and samples of all other organs were trimmed according to RITA-guidelines (Ruehl-Fehlert et al. 2003). The trimmed tissue samples were processed through graded concentrations of ethanol (Kemetyl A/S) to xylene (Applichem, GMbH, Darmstadt, Germany), embedded in paraffin, cut at 2-3 µm, mounted on glass slides (Sakura Finetech Europe B.V.), and stored at –20° C. Sections of vagina, uterus, and ovaries were stained with hematoxylin and eosin (HE). Sections of the 4th mammary gland, liver, colon, and skeletal muscle were stained immunohistochemically with 0.125-0.25 µg/ml rabbit monoclonal antibody against phosphorylated Akt (Ser473) (Cell Signaling Technology Inc., clone D9E, XP
Tissue sections were heated at 60°C for 15 min, deparaffinized in xylene, and rehydrated through baths with graded concentrations of ethanol at room temperature. Endogenous peroxidase was quenched with 0.6% H2O2 (Merck KgAa, Darmstadt, Germany) in deionized water for 10 min, followed by washing in TBS with 0.05% Tween 20 (TBS-T) (Sigma-Aldrich Denmark A/S). Epitope retrieval was performed in T-EG buffer (10 mM Trizma base, 0.5 mM EGTA, pH 9) at 90°C for 15 min using a temperature-controlled microwave oven (Energy Beam Sciences Inc, East Granby, Connecticut, US). Slides were allowed to cool for 15 min before blocking with a biotin blocking system according to the manufacturer’s instructions (Dako, Glostrup, Denmark) and then with 5% normal donkey serum (Jackson ImmunoResearch Laboratories Inc., West Grove, PA, USA) in TBS-T for 60 min. Slides were incubated with the primary antibody diluted in antibody diluent (Dako) overnight at 4°C, washed, incubated with biotinylated donkey anti-rabbit immunoglobulin (Jackson ImmunoResearch Laboratories Inc.) diluted 1:500 in antibody diluent (Dako) for 60 min, and finally with HRP-conjugated streptavidin (Dako) diluted 1:500 in TBS-T for 30 min. DAB+ (Dako) was used as chromogen. Following counterstaining with hematoxylin for 15 sec, slides were rinsed in running tap water for 5 min, dehydrated through baths with graded concentrations of ethanol and xylene, and finally mounted with Pertex.
As a further control of staining specificity, phosphatase treatment was performed of sections from insulin-treated animals. After the epitope retrieval described earlier, slides were washed twice in demineralized water for 3 min and incubated with lambda protein phosphatase (New England Biolabs, Ipswich, Massachusetts, USA) at 37°C for 2 hr. For dephosphorylation of P-ERK1/2 and P-Akt, 1,600 and 16,000 units of lambda protein phosphatase, respectively, were used in 200 µl reaction buffer (1 mM MnCl2, 50 mM HEPES, 100 mM NaCl, 2 mM DTT, 0.01% Brij 35 at pH 7.5) per tissue section. As negative control for phosphatase treatment, serial sections from insulin-treated animals were incubated with 200 µl reaction buffer containing no enzyme at 37° C for 2 hr. After phosphatase treatment, tissue sections were washed twice in demineralized water for 3 min, once in TBS-T for 3 min, and stained for P-ERK1/2 and P-Akt as described earlier.
Quantitation of Mammary Epithelial Cells and Hepatocytes with Nuclear Staining for P-Akt and Nuclear/Cytoplasmic Staining for P-ERK1/2
Mammary epithelial cells displaying nuclear staining for P-Akt and mammary epithelial cells and hepatocytes displaying nuclear or cytoplasmatic staining for P-ERK1/2 were quantified using a BX51 microscope equipped with a DP71 digital camera (Olympus Danmark A/S, Ballerup, Denmark) and VIS software (Visiopharm, Hørsholm, Denmark). All sections were blinded to the investigator. At 12.5× magnification, a mask was drawn around the entire liver section or the mammary fat pad. Random sampling of vision fields was performed at 400× magnification. In liver sections, a counting frame was superimposed on each vision field, and for each animal, a total of 300 to 400 hepatocytes were counted in approximately 90 randomly selected vision fields. Generally, counting of 100 to 200 events in 100 to 200 vision fields is known to ensure efficient and reliable sampling (Gundersen et al. 1988). The percentage of P-ERK1/2 positive hepatocytes (labeling index) was calculated by dividing the number of P-ERK1/2 positive cells with the total number of hepatocytes counted. In mammary gland sections, primary and secondary counting frames were superimposed on each vision field. The primary counting frame was used to count P-Akt or P-ERK1/2 positive mammary epithelial cells. The secondary counting frame was used to count positive and negative (i.e., all) mammary epithelial cells. The area of the secondary counting frame was ten times smaller than the primary counting frame, to achieve an approximately equal number of counts in both frames. At least 200 to 300 mammary epithelial cells distributed in approximately 200 vision fields were counted in each section. The counts were adjusted for the different sizes of the counting frames, and the percentages of P-Akt and P-ERK1/2 positive mammary epithelial cells (labeling indices) were calculated as the number of P-Akt and P-ERK1/2 positive epithelial cells divided by the total number of epithelial cells.
Statistical Analysis
Statistical analysis was performed with SAS 9.1.3 software (SAS Institute Inc., Cary, North Carolina, USA). Observations were assumed to be independent and to achieve normal distribution and equal variance, data were transformed using the natural logarithm. No outliers, defined as observations with numerical standardized residual values >3, were identified. The normalized levels of P-Akt determined by Western blotting were analyzed in a one-way analysis of variance using the “proc glm” procedure in SAS. To identify differences between treatments, multiple t-tests with Dunnett’s adjustment were used.
The P-Akt and P-ERK1/2 labeling indices determined by immunohistochemistry (IHC) were analyzed with treatment and estrous cycle phases as explanatory variables in a general linear model, using the “proc mixed” procedure in SAS. Type 3 tests were used to identify significant explanatory variables. To identify differences between treatments or estrous cycle phases, multiple t-tests with Bonferonni correction were used.
Results
Equivalent Molar Doses of Human Insulin and IGF-1 Resulted in Different Plasma Cmax Values
Peak plasma concentrations of insulin and IGF-1 were observed 30 min after subcutaneous injection (Figure 1 ). The observed Cmax was approximately 270 nM for IGF-1 and approximately 700 nM for insulin. The plasma half-lives of insulin and IGF-1 were estimated to approximately 47 min and 1.4-15 hr, respectively.
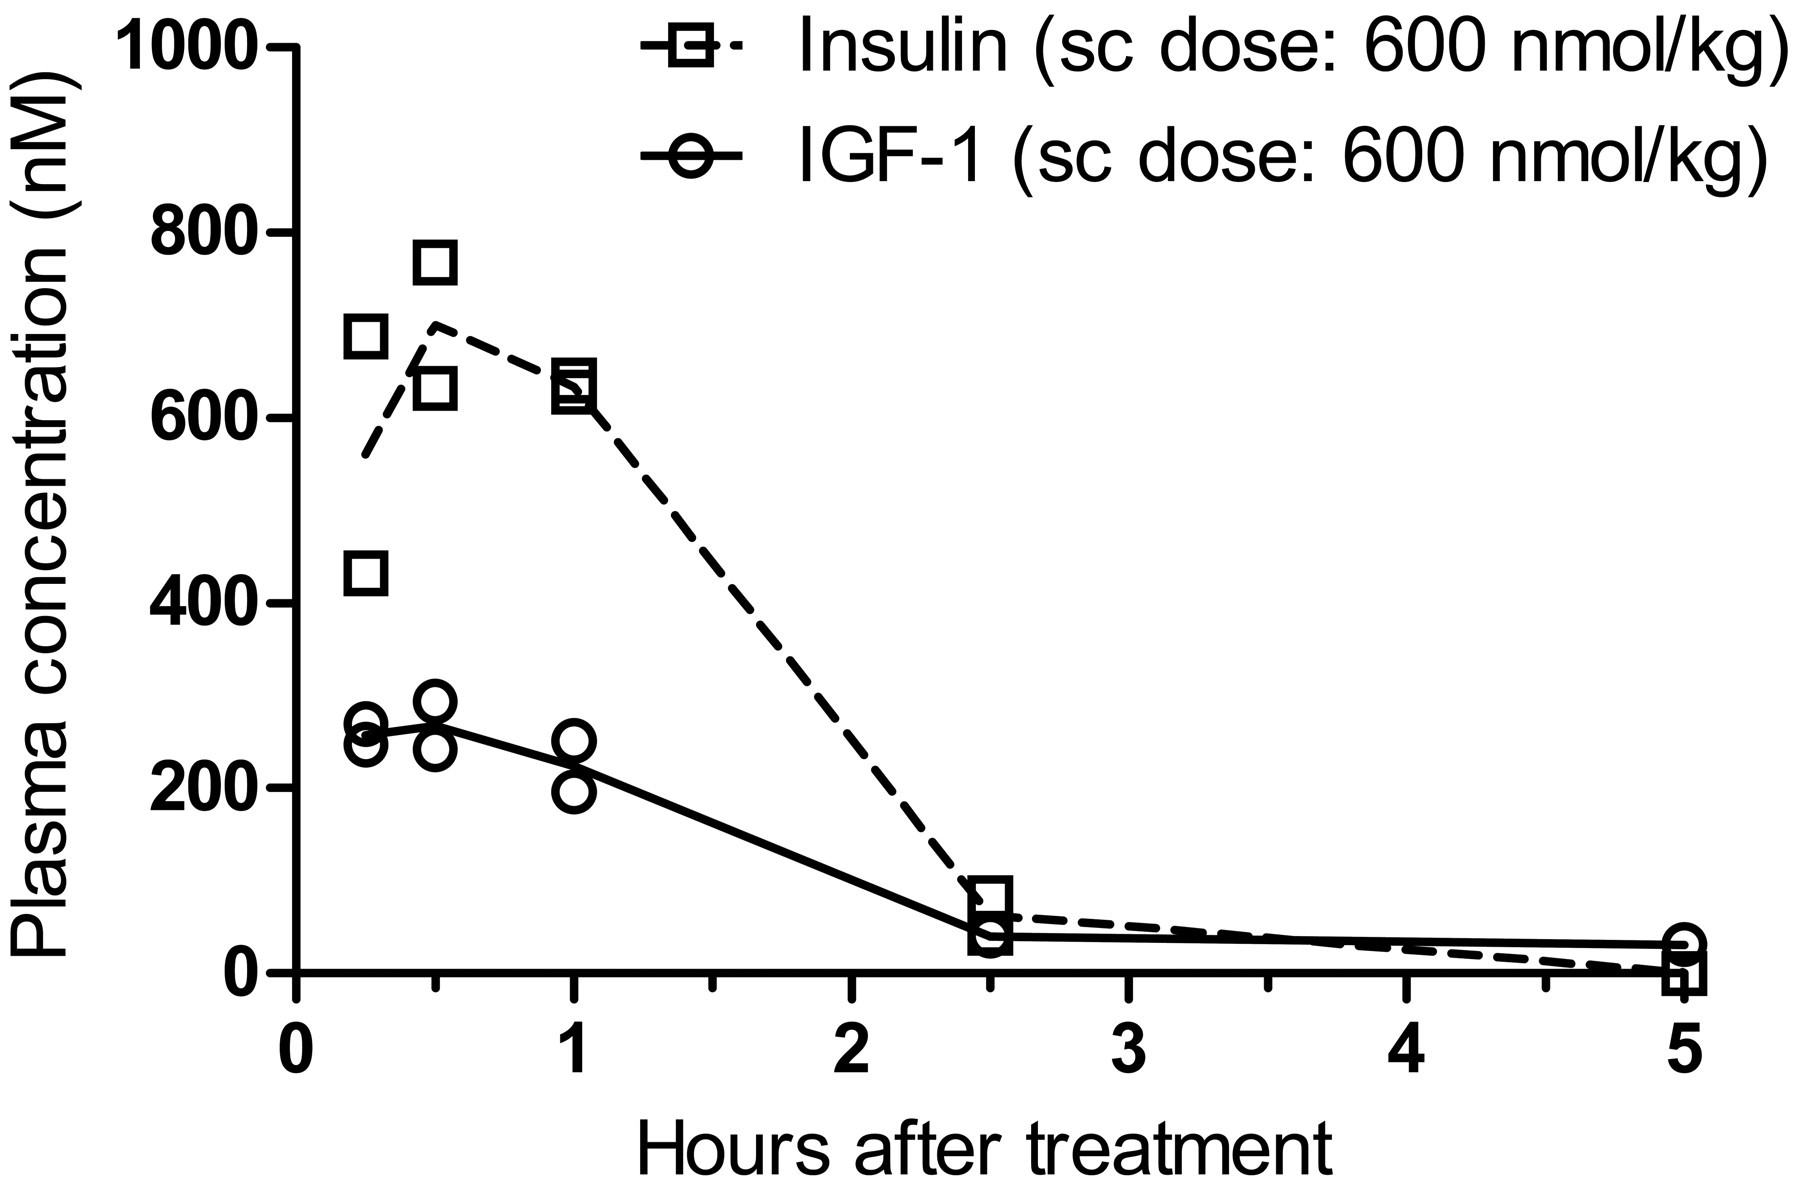
Plasma concentrations of human insulin and human IGF-1 after subcutaneous injection in female rats. Rats received a single subcutaneous injection of 600 nmol/kg human insulin or human IGF-1 at time 0. Blood samples were collected at euthanasia, namely, animals differ between time-points.
Rapid and Sustained Phosphorylation of Akt Following a Single Dose of Insulin or IGF-1
By Western blotting, phosphorylation of Akt was observed 15 min after insulin or IGF-1 treatment in the mammary gland and colon (Figures 2 and 3 ). In the colon, Akt phosphorylation started to decline between 1 and 2.5 hr after treatment (Figure 3C), whereas Akt phosphorylation in the mammary gland was more sustained in insulin-treated animals (Figure 3A). The most pronounced difference between insulin and IGF-1 was observed in the liver, with insulin producing a more sustained Akt phosphorylation than IGF-1 (Figure 3B). In the gastrocnemius muscle, treatment with insulin and IGF-1 resulted in a nonsignificant trend toward increased phosphorylation of Akt (Figure 3D).
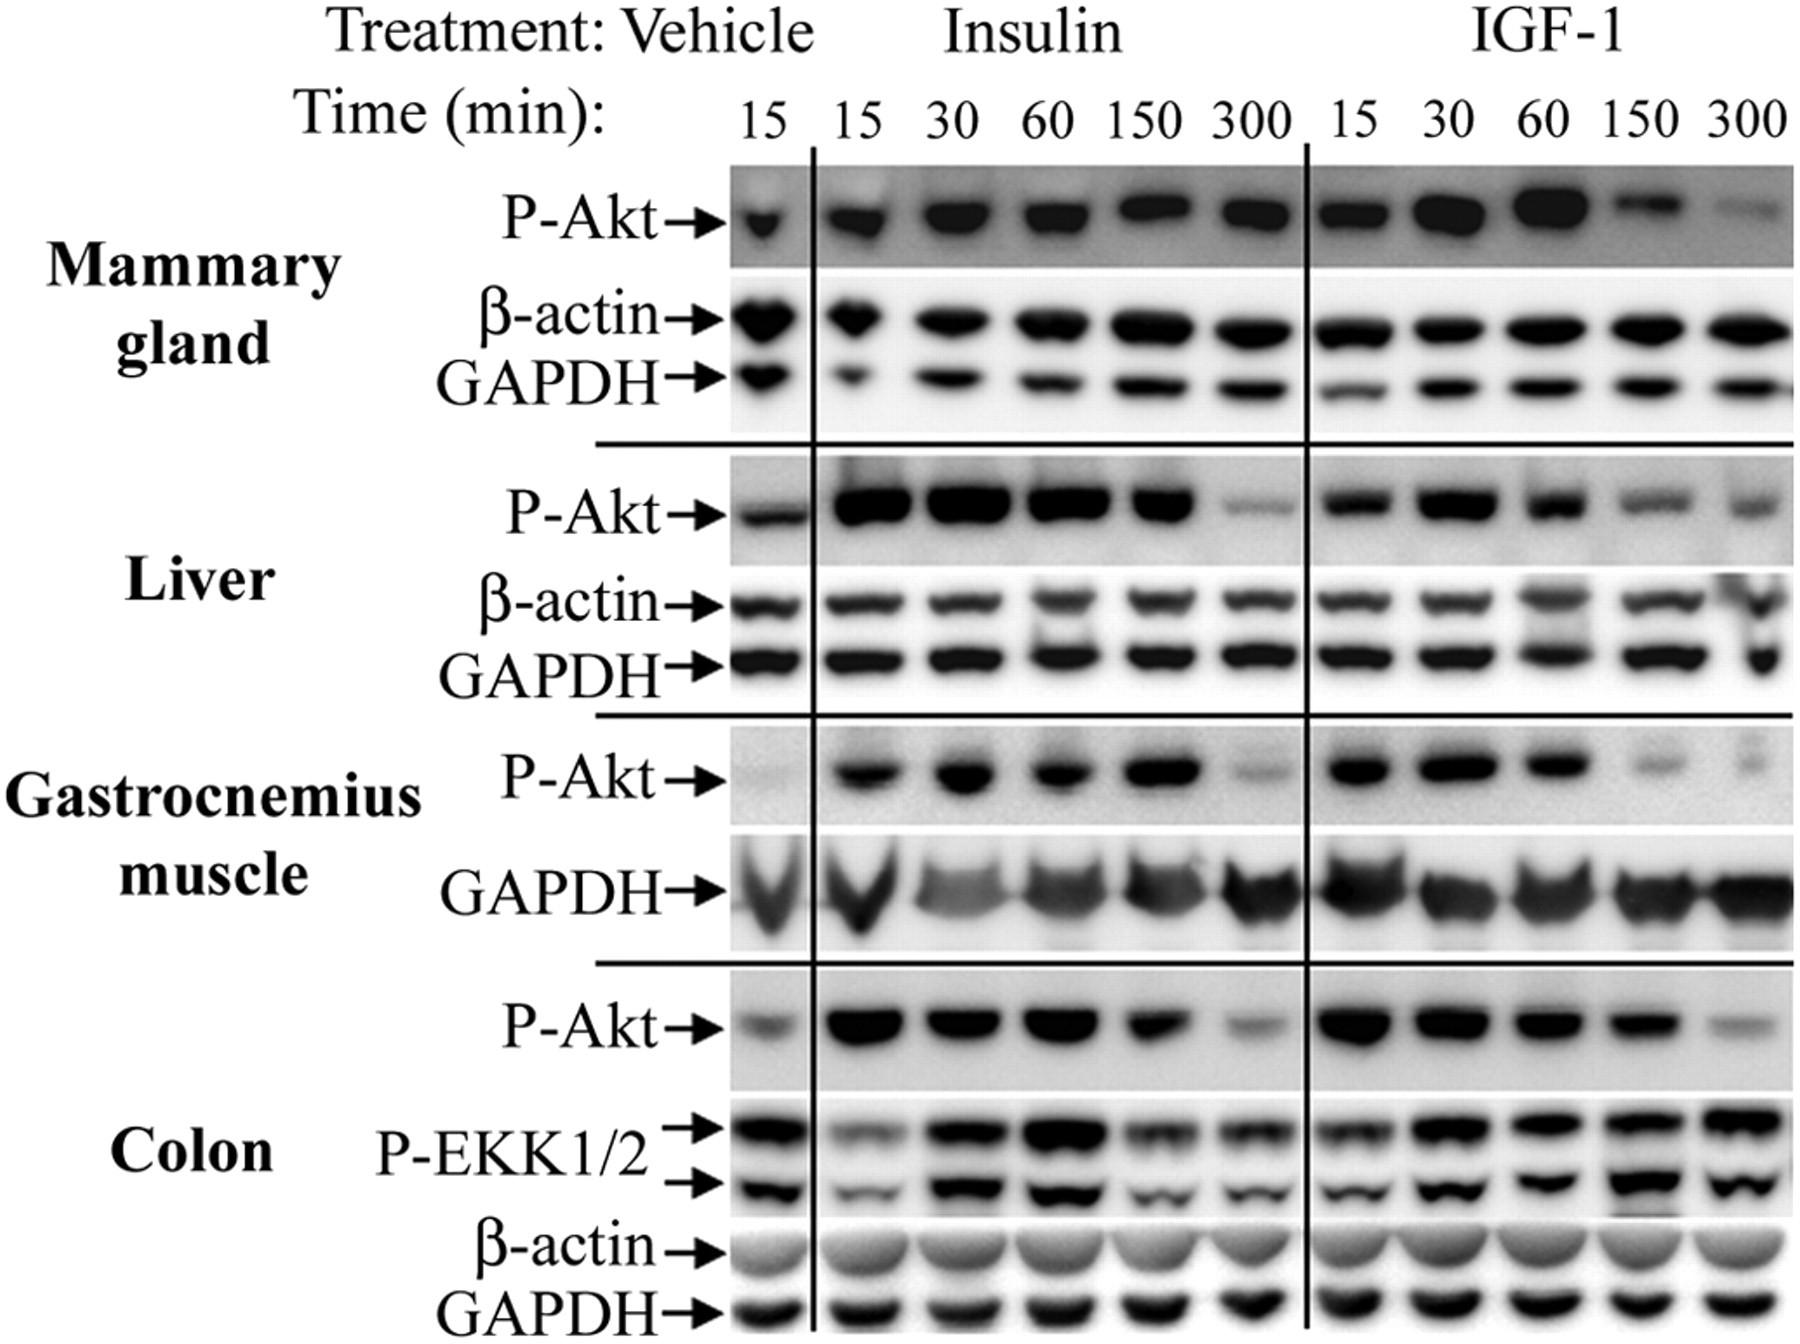
Rapid phosphorylation of Akt in rat tissue after a single subcutaneous injection of insulin or IGF-1. Pools of tissue lysate from four vehicle-treated animals and two insulin- and IGF-1-treated animals were examined at each timepoint. P-Akt: phosphorylated Akt. P-ERK1/2: Phosphorylated ERK1/2. For each lysate pool, 20 µg total protein was loaded and parallel blots for β-actin and GAPDH were performed to verify equal protein loading.
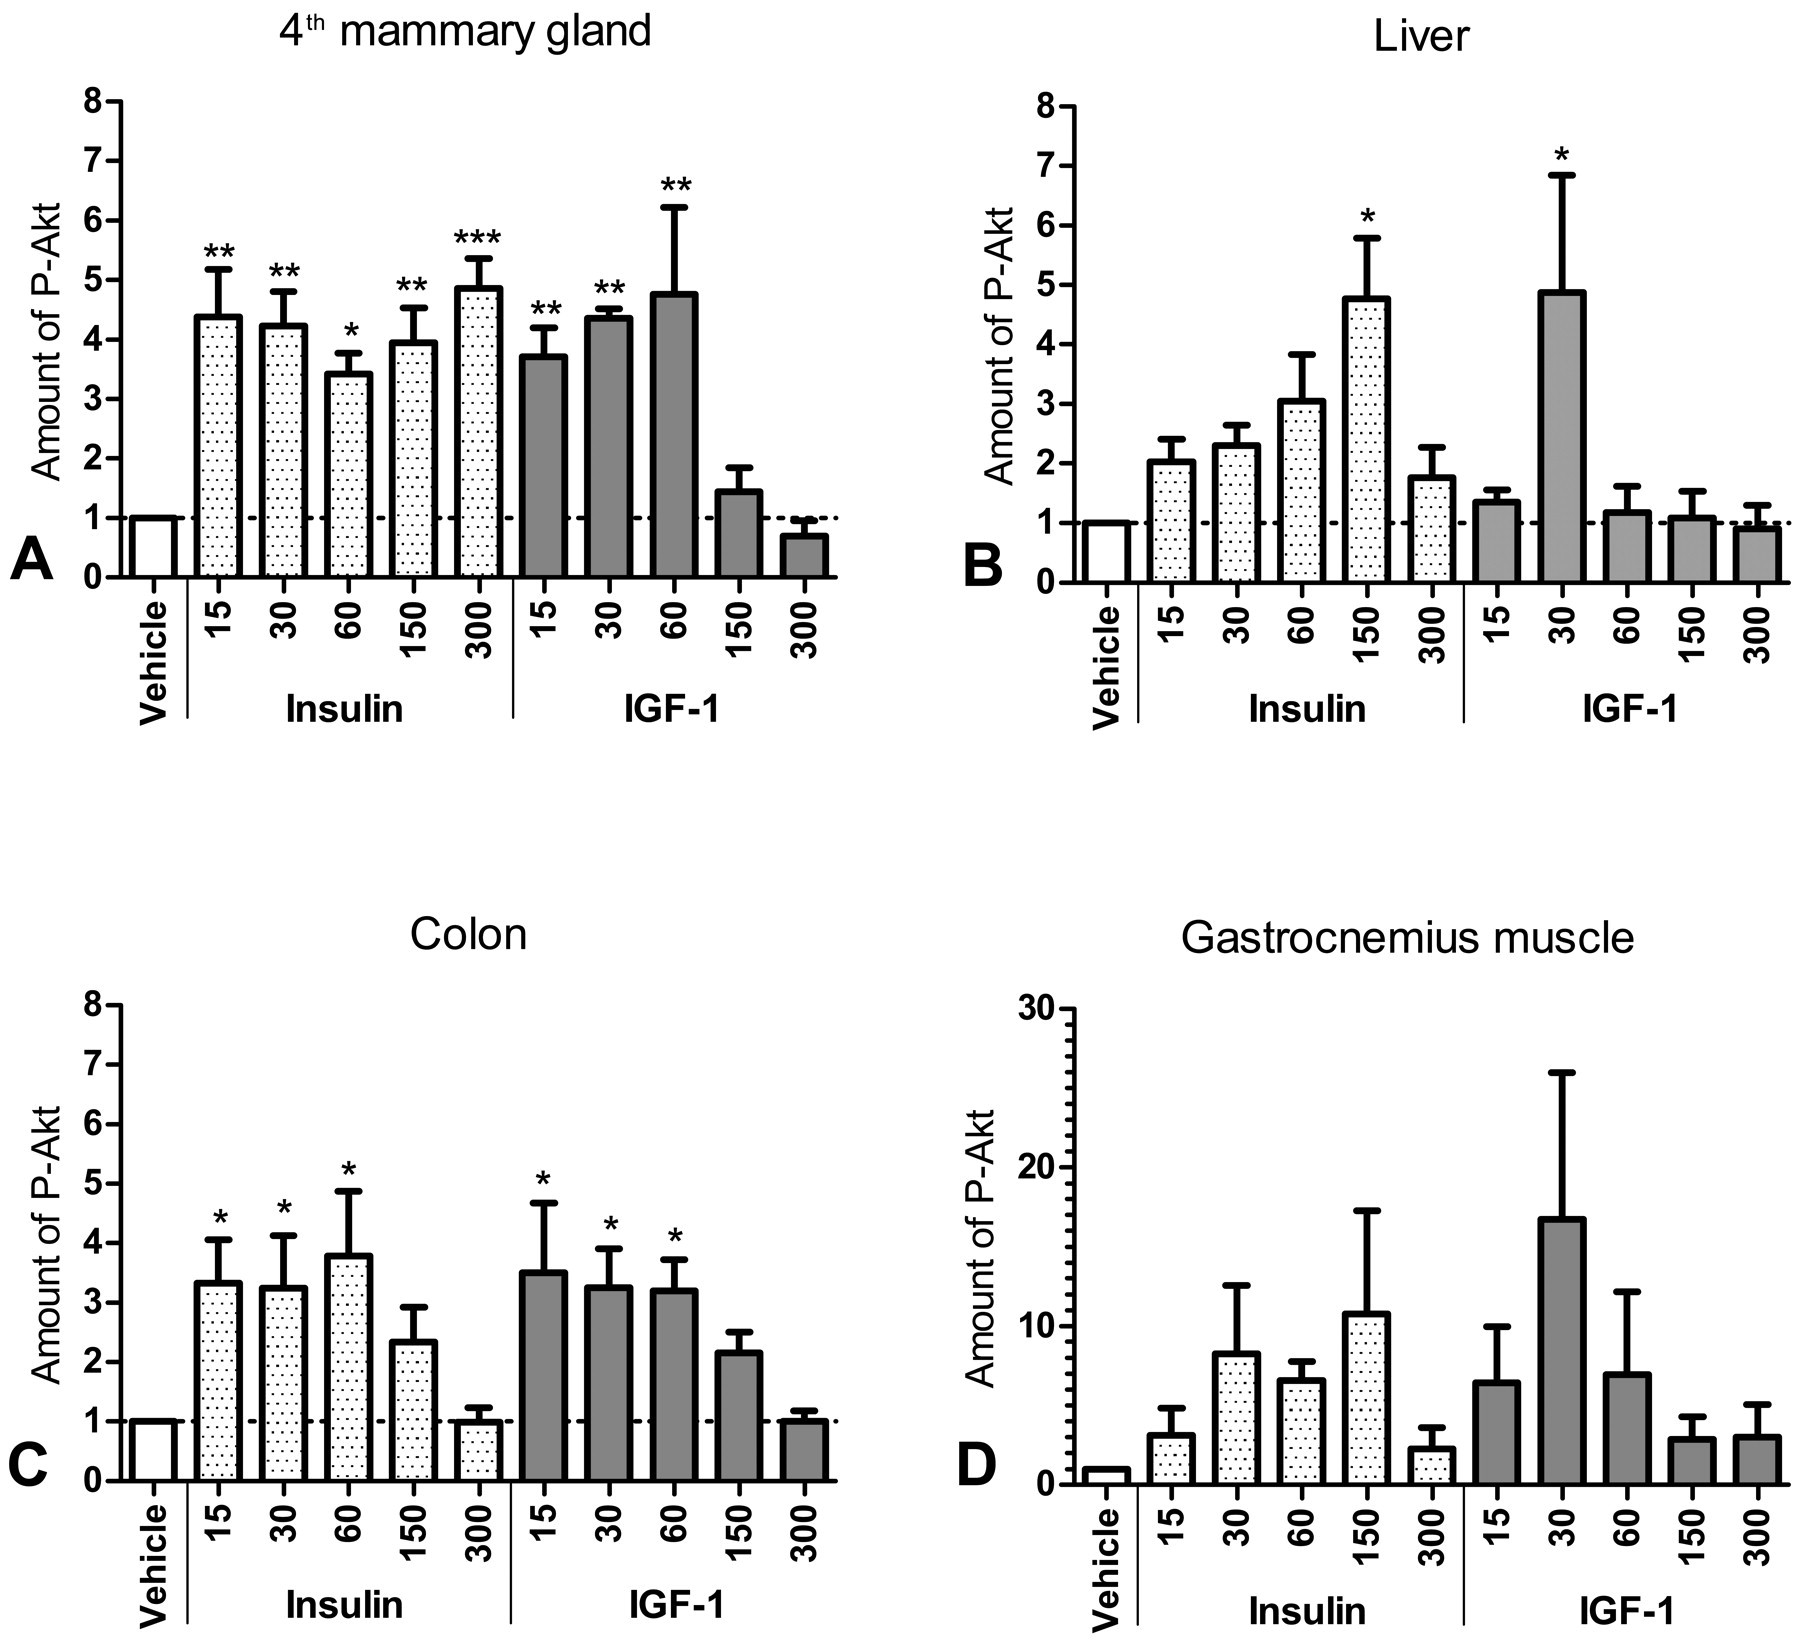
Quantitation of Western blots shown in Figure 2. Bars show the mean band intensity from triplicate Western blots, normalized to β-actin, GAPDH, and vehicle-treated animals. Error bars show the standard error of the mean. P-Akt: phosphorylated Akt. Values above 1 indicate increased phosphorylation of Akt in tissue lysate from insulin or IGF-1 treated animals, compared to vehicle controls. *p < .05. **p < .001. ***p < .0001.
Insulin and IGF-1 Caused Different Akt Phosphorylation Patterns in the Liver
Based on the Western blot data, animals were euthanized 30 min after treatment for IHC analysis of phosphoproteins. In nontreated and vehicle-treated animals, only very weak staining for P-Akt was observed in the cytoplasm of hepatocytes and staining was diffuse throughout the liver parenchyma. Only very few hepatocytes displayed a strong cytoplasmatic staining (Figure 4C ). In insulin-treated rats, all hepatocytes displayed strong staining for P-Akt, in most cases also nuclear (Figures 4A, 4E, and 4F). In IGF-1-treated animals, hepatic P-Akt staining was weaker and more heterogeneous compared to animals treated with insulin (Figures 4H). Also, in contrast to insulin, IGF-1 induced phosphorylation of Akt in cells resembling Kupfer or stellate cells (Figure 4H). In short, Western blotting (Figures 2 and 3B) as well as IHC (Figure 4) showed completely different patterns of Akt phosphorylation between insulin- and IGF-1-treated animals.
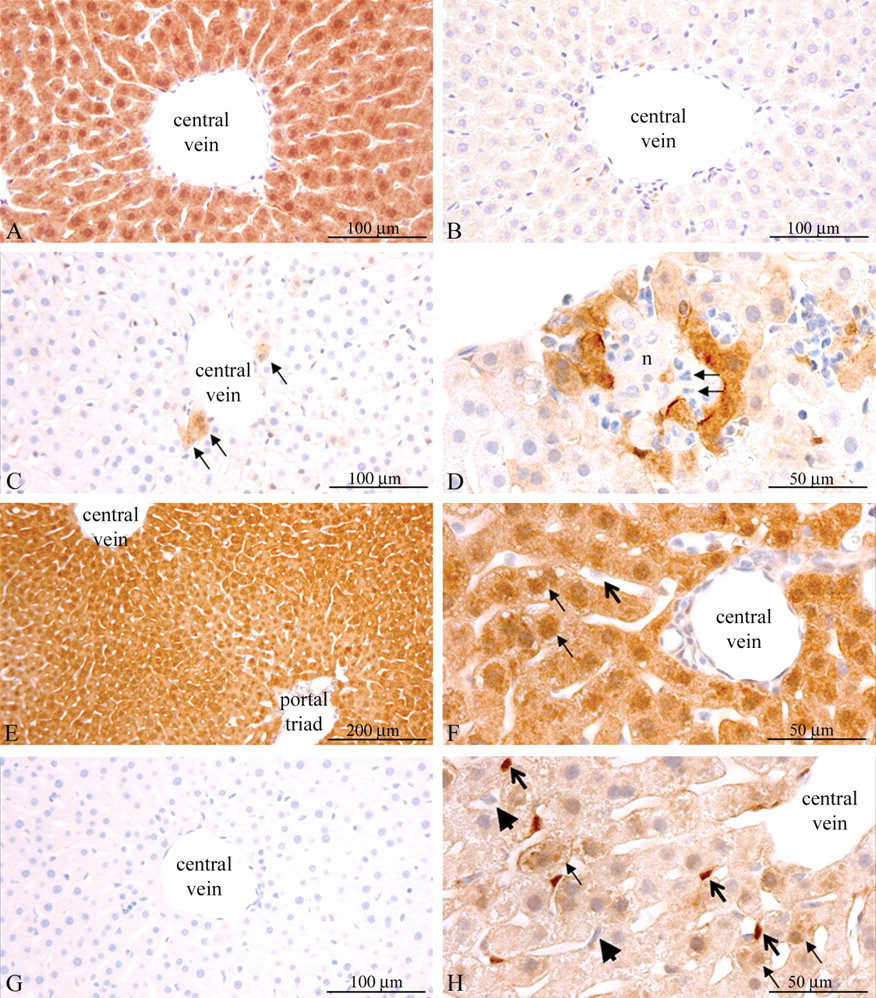
Differences between patterns of Akt phosphorylation induced by human insulin and IGF-1 in rat liver. A: Insulin-treated rat (negative control for phosphatase treatment). The section was incubated for two hr without phosphatase and subsequently stained for P-Akt. Strong staining for P-Akt was observed. 200× magnification. B: Serial liver section from the same insulin-treated animal as in panel A, incubated with lambda protein phosphatase for 2 hr and subsequently stained for P-Akt. The staining was essentially completely absent. 200× magnification. C: Vehicle-treated rat. Very few P-Akt positive hepatocytes were found, generally near central veins of hepatic lobules (arrows). 200× magnification. D: Vehicle-treated rat. Strong staining for P-Akt was observed in the hepatocytes lining an area with coincidental acute necrosis of hepatocytes (n). Infiltration with neutrophils (arrows) was observed among the necrotic hepatocytes. 400× magnification. E: Insulin-treated rat. All hepatocytes throughout the hepatic parenchyma were strongly P-Akt positive. 100× magnification. F: Insulin-treated rat. All hepatocytes displayed strong cytoplasmatic staining for P-Akt, and most also appeared to display nuclear staining of P-Akt (small arrows). Cells resembling Kupfer cells or hepatic stellate cells were negative for P-Akt (large bold arrows). 400× magnification. G: Vehicle-treated rat. Section was incubated with isotype negative-control antibody. No staining was observed. 200× magnification. H: IGF-1-treated rat. The P-Akt staining appeared more heterogeneous than in insulin animals, with strong staining in a minority of hepatocytes (small arrows). Cells resembling Kupfer cells or hepatic stellate cells were strongly stained (bold open arrows). Endothelial cells lining the sinusoids appeared negative (large arrow-heads). 400× magnification.
Hepatic ERK1/2 Phosphorylation Was Not Influenced by a Single Dose of Insulin or IGF-1 but Marked Centrilobular and Activated Hepatocytes and Was Influenced by Estrous Cycling
In the liver, staining for P-ERK1/2 was heterogeneous with some hepatocytes and cells resembling Kupfer or stellate cells displaying strong cytoplasmatic and nuclear staining, whereas other hepatocytes were completely negative (Figure 5D ). Furthermore, the staining of P-ERK1/2 exhibited a marked centrilobular pattern, which was not affected by treatment with insulin or IGF-1 (Figures 5E and 5F). However, the percentage of P-ERK1/2 positive hepatocytes was significantly increased during proestrus compared to estrus (Figure 6F ). Also, strong staining for P-ERK1/2 was observed in hepatocytes bordering coincidental focal lesions with acute inflammation and necrosis (Figure 5G; hepatocytes bordering these spontaneous lesion also displayed positive staining for P-Akt, see Figure 4D).
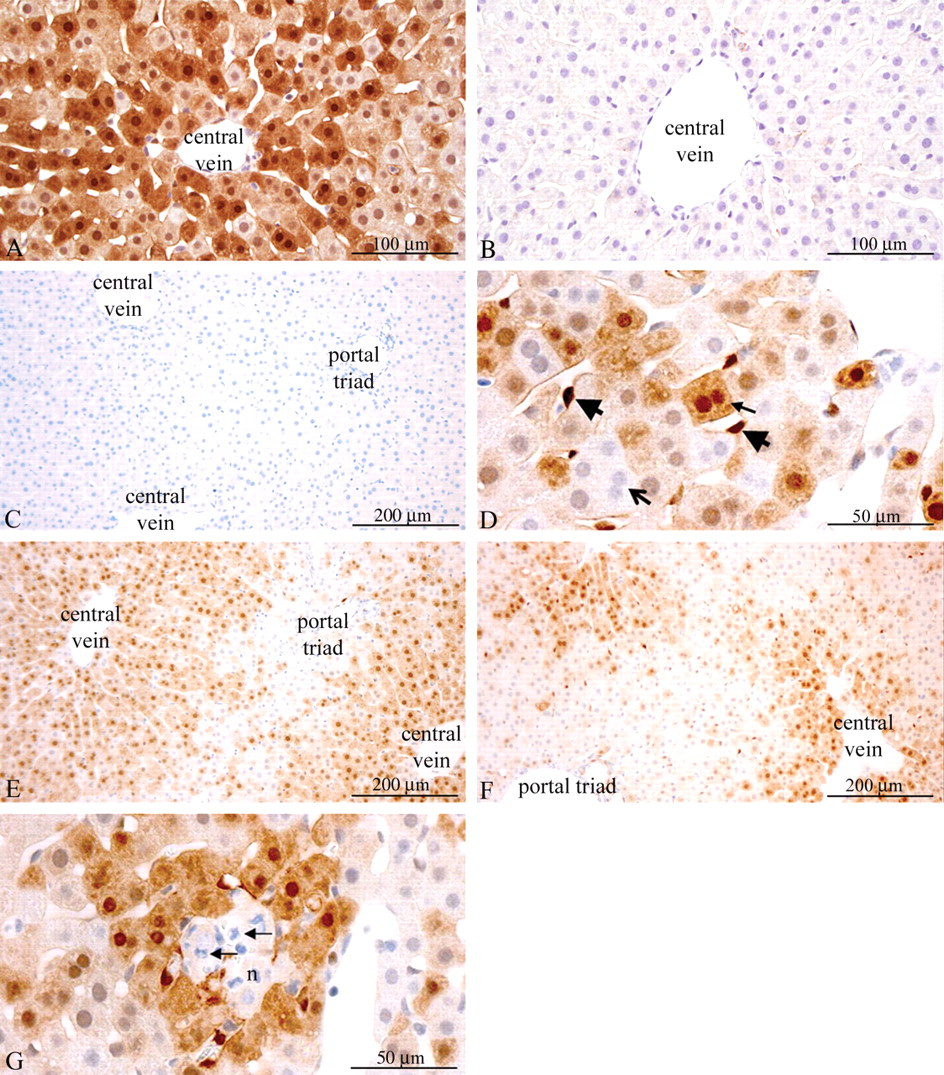
Physiological phosphorylation of ERK1/2 had centrilobular localization in rat liver and was not influenced by a single dose of insulin or IGF-1. A: Insulin-treated rat in estrus (negative control for phosphatase treatment). The section was incubated without phosphatase for 2 hr and stained for P-ERK1/2. Strong cytoplasmatic and nuclear staining for P-ERK1/2 was observed. 200× magnification. B: Serial section from the same rat as in A. The section was incubated for 2 hr with lambda protein phosphatase and stained for P-ERK1/2. No staining was observed. 200× magnification. C: Vehicle-treated rat, proestrus. The section was stained with an isotype-matched negative control antibody. No staining was observed. 100× magnification. D: Vehicle-treated rat, estrus. Hepatocytes staining strongly for P-ERK1/2 were sometimes binucleated (small arrow), whereas neighboring hepatocytes and also binucleated hepatocytes could be completely negative for P-ERK1/2 (bold open arrow). Cells resembling Kupfer cells or hepatic stellate cells displayed strong staining for P-ERK1/2 (bold arrowheads). 400× magnification. E: Vehicle-treated rat in proestrus. Compared to F, a larger percentage of the hepatocytes were stained for P-ERK1/2. 100× magnification. F: Vehicle-treated rat in estrus. Compared to E, a lower percentage of the hepatocytes were stained for P-ERK1/2. 100× magnification. G: Vehicle-treated rat in diestrus (serial section from the same rat as in panel 4D). The hepatocytes lining an area with coincidental acute inflammation and necrosis of hepatocytes (n) and neutrophilic infiltration (arrows) displayed strong cytoplasmatic and nuclear staining for P-ERK1/2. 400× magnification.
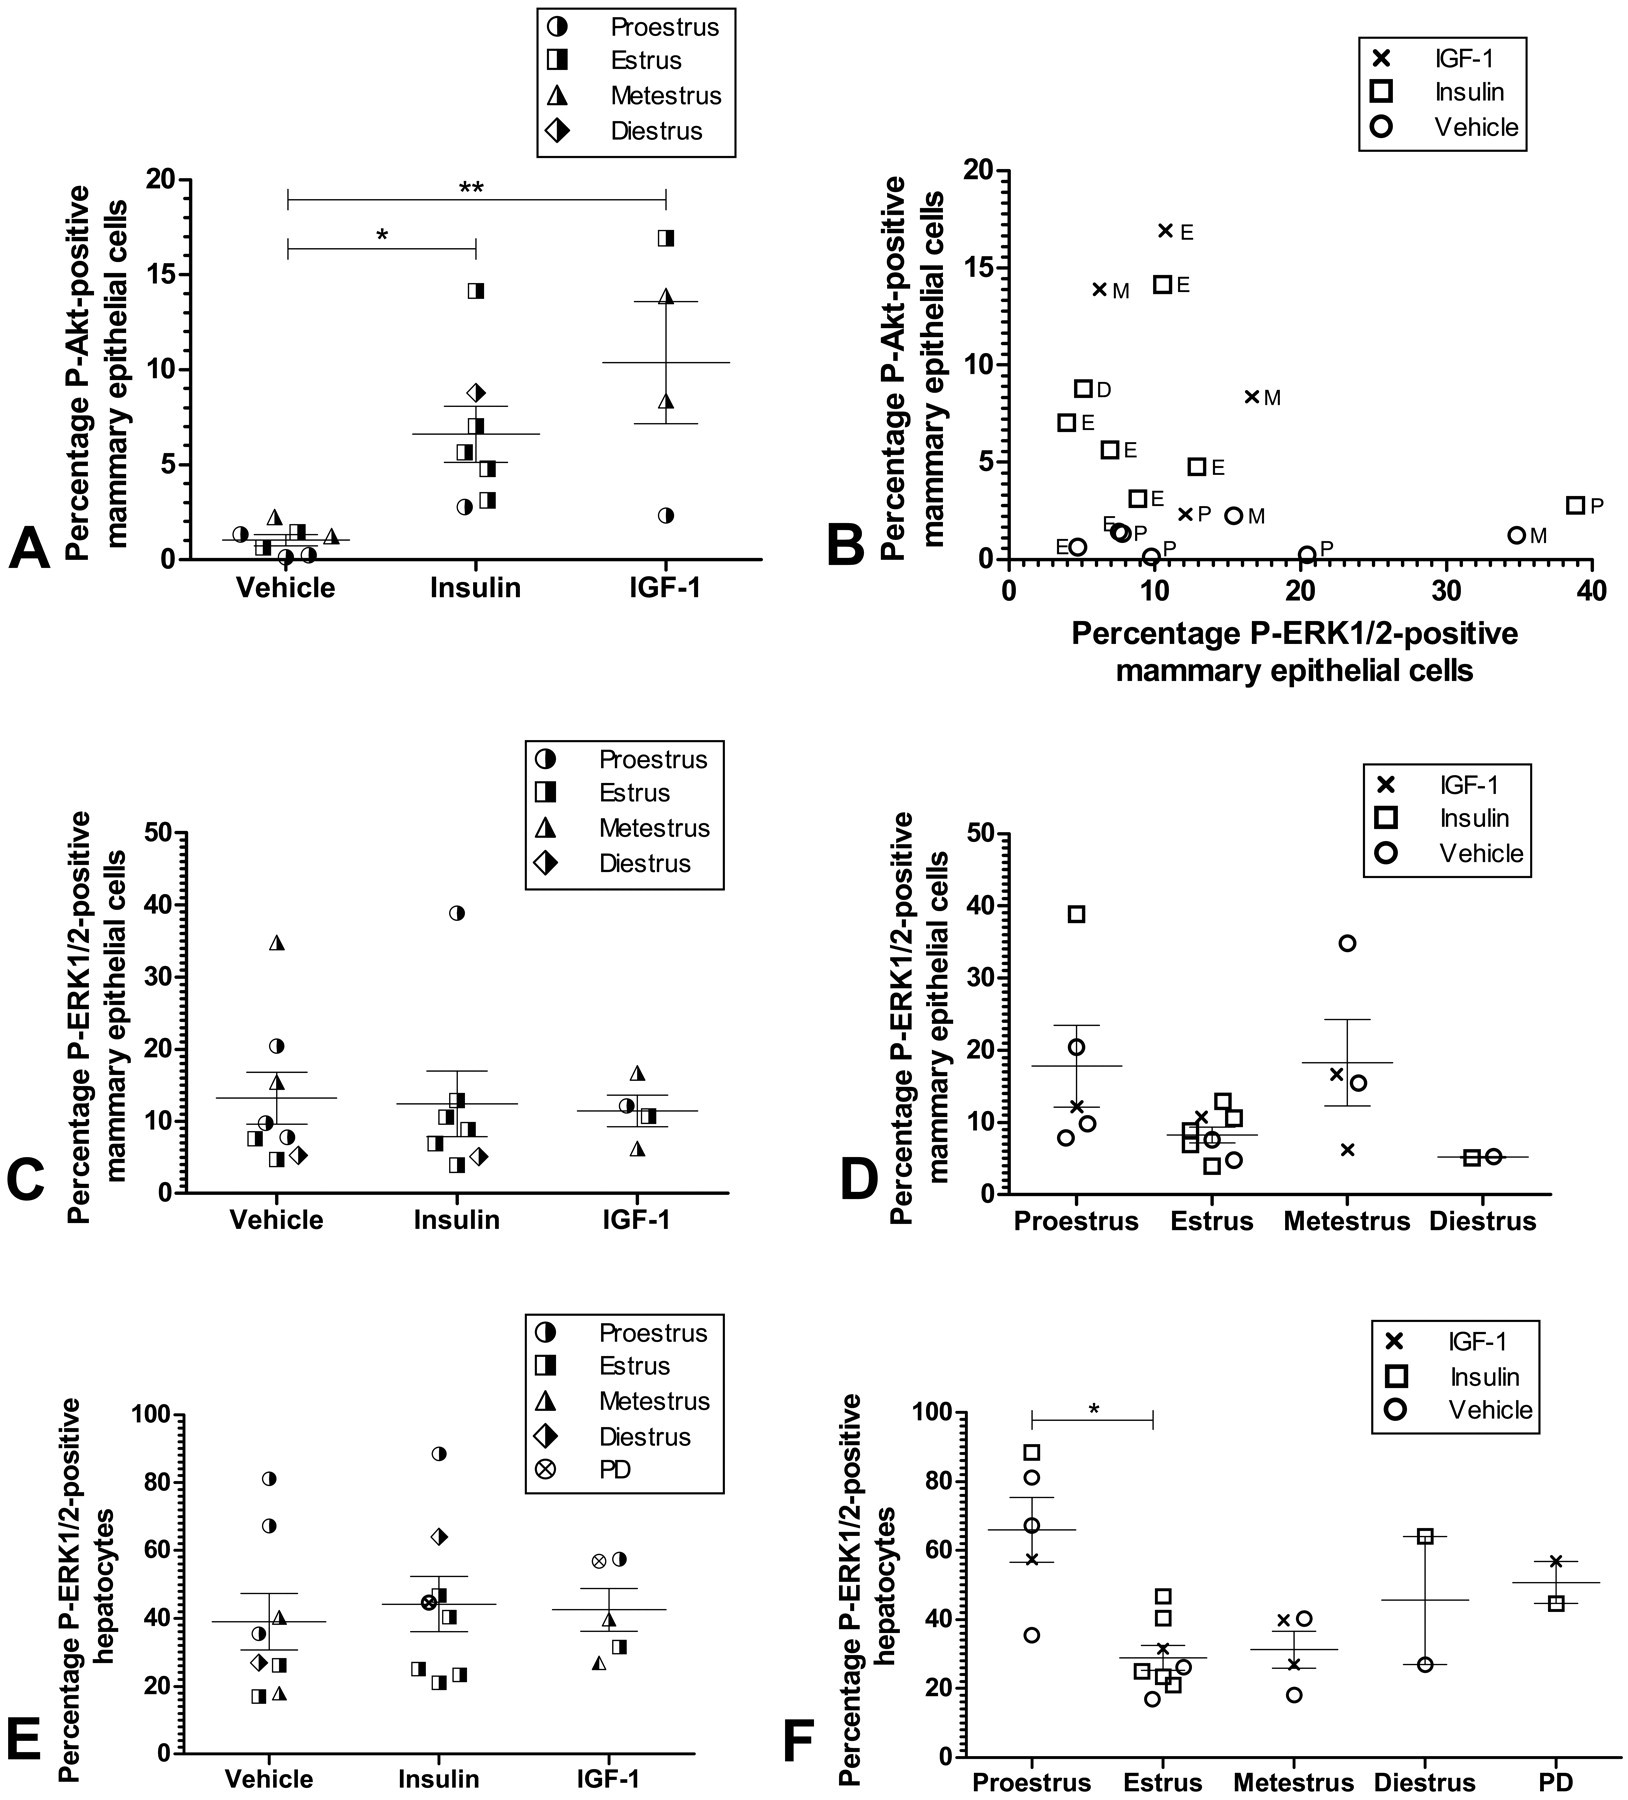
Quantification of IHC data. Tissue sections were stained for P-Akt and P-ERK1/2 and counting of positive cells was performed in sections blinded to the investigator. Circles, squares, triangles, and crosses show observations from individual rats. Horizontal bars: Mean percentage of positively stained cells. Error bars: Standard error of the mean. *p < .05. **p < .001. A: Insulin as well as IGF-1 caused 6- to 10-fold increases in the percentage of mammary epithelial cells with nuclear staining for phosphorylated Akt. The percentage of P-Akt positive mammary epithelial cells was not dependent of the estrous cycle (not shown). B: Correlation between percentages of mammary epithelial cells positive for P-Akt and P-ERK1/2 in individual rats. Treatment groups are shown by symbols and estrous cycle stages indicated next to each data point. E: Estrus, P: Proestrus, M: Metestrus, D: Diestrus. The animals where insulin or IGF-1 induced increased levels of P-Akt positive mammary epithelial cells did not show any tendency toward increased levels of P-ERK1/2 positive mammary epithelial cells. C: Percentages of mammary epithelial cells positive for P-ERK1/2. No differences were observed between animals treated with vehicle, insulin, or IGF-1. D: Percentages of mammary epithelial cells positive for P-ERK1/2 stratified for estrous cycle phases. A nonsignificant trend toward increased levels of mammary epithelial cells positive for P-ERK1/2 in proestrus and metestrus was observed. E: Percentages of hepatocytes positive for P-ERK1/2. No difference was observed between animals treated with vehicle, insulin or IGF-1. PD: Pseudopregnant. F: Percentages of hepatocytes positive for P-ERK1/2, stratified for estrous cycle phases. The labeling indices among animals in proestrus were significantly increased compared to animals in estrus. *p < .05. PD: Pseudopregnant.
A Single Dose of Insulin or IGF-1 Increased Activation and Nuclear Translocation of Akt in the Mammary Gland Epithelium, with Basal Cells Appearing Most Responsive
In vehicle-treated rats, weak cytoplasmatic staining for P-Akt was observed in the cytoplasm of mammary gland epithelial cells (Figures 7E and 7F ). Only a very low percentage of mammary epithelial cells (approximately 1%) displayed nuclear staining (Figure 6A). Following treatment with insulin or IGF-1, increased cytoplasmatic staining was observed and the percentage of mammary epithelial cells with nuclear staining for P-Akt was also significantly increased (Figures 6A, 7I, and 7L). Interestingly, myoepithelial cells and the basal epithelial layers in mammary gland duct and lobules displayed stronger P-Akt staining than did luminal epithelial cells (Figures 7H, 7I, 7K, and 7L). In the surrounding connective tissue, staining was also observed in fibrocytes and adipocytes forming the mammary fat pad (Figures 7G and 7J). Interestingly, while insulin caused stronger P-Akt staining in the mammary fat pad than IGF-1, IGF-1 caused stronger P-Akt staining in the mammary epithelium than insulin (Figs 7G, 7J, 7I, and 7L). Finally, the mean percentage ± SD of mammary epithelial cells with nuclear staining for P-Akt were 1.35 ± 1.20 in proestrus (N = 5), 6.71 ± 5.88 in estrus (N = 8), 6.44 ± 5.88 in metestrus (N = 4), and 8.80 in diestrus (N = 1) with no significant difference between phases, namely, the percentages of mammary epithelial cells with nuclear staining for P-Akt were not dependent on the estrous cycle (not shown).
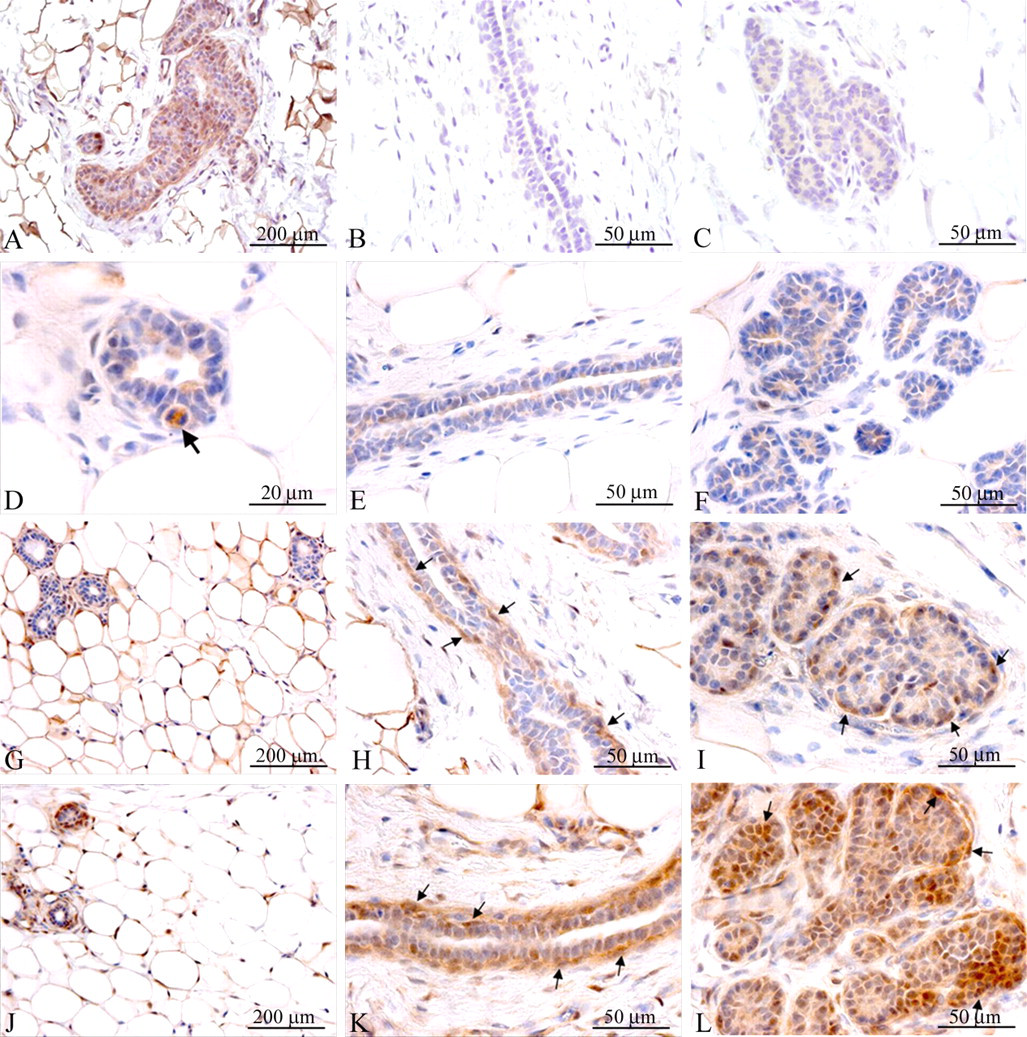
Human IGF-1 as well as insulin increased Akt phosphorylation in the rat mammary gland. A, B, and C: Phosphatase control of staining specificity. Parallel mammary gland sections from an insulin-treated rat were incubated either without enzyme (A) or with lambda protein phosphatase (B and C) for 2 hr and subsequently stained for P-Akt. Staining for P-Akt was almost completely absent after phosphatase treatment (B and C). A: 100× magnification, B and C: 400× magnification. D, E, and F: Vehicle-treated rat. No staining was observed in adipocytes in the mammary fat pad, whereas mitotic mammary epithelial cells displayed strong staining of P-Akt (D, arrow). Very weak cytoplasmatic staining was also observed in mammary epithelial cells in mammary ducts (E) and in alveolar lobules (F). The staining of P-Akt in D, E, and F was essentially exclusively cytoplasmatic. D: 1,000× magnification, E and F: 400× magnification. G, H, and I: Insulin-treated rat. Strong staining for P-Akt was observed in the nuclei and cytoplasm of adipocytes in the mammary fat pad (G). In the mammary ducts (H) and alveolar lobules (I) increased cytoplasmatic staining was observed in essentially all mammary epithelial cells. Interestingly, the basal layer of myoepithelial cells and basal mammary epithelial cells displayed stronger staining than the luminal epithelial cells and appeared to have a higher level of cells with nuclear staining (H and I, arrows). G: 100× magnification, H and I: 400× magnification. J, K, and L: IGF-1-treated rat. Staining for P-Akt in adipocytes appeared weaker than in insulin-treated animals (J). In contrast, in the mammary ducts and alveoli, increased cytoplasmatic staining was observed in essentially all mammary epithelial cells, at a level above that seen in insulin-treated animals (K and L). Strong cytoplasmatic as well as nuclear staining was observed in the basal layer of mammary epithelial cells and myoepithelial cells (K, L, arrows). J: 100× magnification, K and L: 400× magnification.
Phosphorylation of P-ERK1/2 in Mammary Epithelial Cells Changed with the Estrous Cycle
Neither insulin nor IGF-1 treatment affected the percentage of P-ERK1/2-positive mammary epithelial cells (Figure 6B). Interestingly, the percentage of P-ERK1/2-positive mammary epithelial cells was increased in proestrus and metestrus (Figure 6C). Thus, in liver as well as in mammary gland, proestrus and estrus were characterized by high and low ERK1/2 phosphorylation, respectively. Also, in liver as well as mammary gland, ERK1/2 phosphorylation could not be triggered by a single dose of exogenous insulin or IGF-1, but instead appeared associated with physiological changes.
Mammary Epithelial Akt and ERK1/2 Phosphorylation Were Largely Independent, Irrespective of Single-Dose Insulin or IGF-1
As mentioned earlier, insulin as well as IGF-1 induced Akt phosphorylation in the mammary gland, whereas ERK1/2 phosphorylation was associated with estrous cycling. When P-Akt and P-ERK1/2 labeling indices for the mammary gland were plotted against each other, there was no tendency for animals with high P-Akt labeling indices to also have high P-ERK1/2 labeling indices (Figure 6B). In other words, irrespective of estrous cycle and a single dose of exogenous insulin or IGF-1, phosphorylation of Akt and ERK1/2 appeared to be independently regulated in the mammary gland epithelium.
In the Mammary Gland, P-ERK1/2 Staining Occurred Typically in Cells Resembling Dark Cells, and in Alveolar Lobules and Alveolar Buds
The mammary gland epithelium has been described to comprise three different cell types, light, intermediate, and dark cells (I. H. Russo and Russo 1996; J. Russo, Tait, and Russo 1983). Often cells resembling dark cells displayed very strong nuclear and cytoplasmatic staining for P-ERK1/2, especially in proestrus and metestrus (Figure 8G ), whereas neighboring epithelial cells resembling light and intermediate cells were completely negative (Figure 8G). Additionally, the staining for P-ERK1/2 appeared heterogeneous between mammary gland compartments. In structures with a morphology typical of terminal end buds, the mammary gland epithelial cells were generally stained with low intensity, whereas fibrocytes in the surrounding connective tissue was stained with strong intensity (Figure 8E). In contrast, in structures with a morphology typical of alveolar lobules and alveolar buds, epithelial cells were stained with much higher intensity (Figure 8F). Staining was also present in adipocytes in the fat pad (Figures 8A, 8C, and 8F).

Physiological phosphorylation of ERK1/2 was cyclical in the rat mammary gland and was not influenced by a single dose of insulin or IGF-1. A and B: Phosphatase control of staining specificity. In serial mammary gland sections from an insulin-treated animal staining of P-ERK1/2 was almost completely absent after phosphatase treatment (compare A and B). 200× magnification. C: Animal in proestrus (treated with vehicle). A tendency toward higher P-ERK1/2 labeling indices was observed during proestrus and metestrus (pictures of the latter stage are not shown), irrespective of treatment. 50× magnification. D: Animal in diestrus (treated with vehicle). A tendency toward lower P-ERK1/2 labeling indices was observed in diestrus and estrus (the latter not shown), irrespective of treatment. 50× magnification. E: Terminal end bud from animal in proetrus (treated with vehicle). Mammary epithelial cells in terminal end buds displayed no or weak staining (bold arrows), whereas fibrocytes in the surrounding connective tissue were stained with strong intensity for P-ERK1/2 (thin open arrows). 400× magnification. F: Alveolar buds from animal in proestrus (treated with vehicle). Alveolar buds and lobular structures generally exhibited a higher level of epithelial cells staining strongly for P-ERK1/2 than did terminal end buds (compare to panel E). Both luminal epithelial cells and cells resembling basal epithelial cells or myoepithelial cells were stained for P-ERK1/2 (arrow). 400× magnification. G: Alveolar buds from animal in proestrus (treated with vehicle). In the alveolar buds, epithelial cells resembling dark cells were stained strongly for P-ERK1/2, whereas light and intermediate epithelial cells were completely negative (arrows). 1,200× magnification. H: Terminal end bud from animal in diestrus (treated with vehicle). High P-ERK1/2 levels were generally observed in mitotic mammary epithelial cells (arrow). 1,000× magnification.
Single-Dose Insulin or IGF-1 Caused Akt Phosphorylation in Colon
Weak staining for P-Akt was observed in the cytoplasm of colon epithelial cells from vehicle-treated animals (Figure 9B ). Insulin as well as IGF-1 caused increased cytoplasmic and occasional nuclear staining for P-Akt in the colon epithelium as well as in fibrocytes in the lamina propria (Figures 9C and 9D). These IHC results were in agreement with the Western blot data (Figure 2 and 3C), but were not formally quantified because it was difficult to make a clear distinction between positive and negative intestinal epithelial cells.
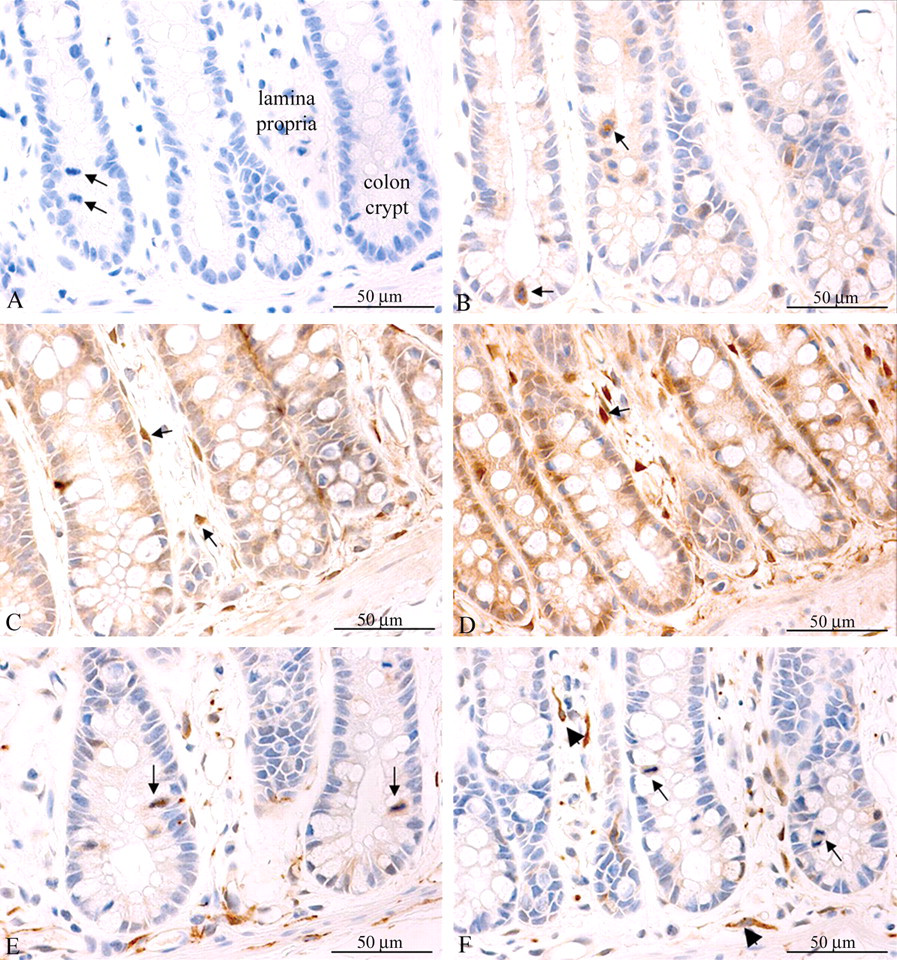
Insulin and IGF-1 induced Akt but not ERK1/2 phosphorylation in the rat colon. All pictures were captured at 400× magnification. A: Vehicle-treated rat. Section was incubated with isotype negative-control antibody. No staining was observed. Arrows show mitotic intestinal epithelial cells. B: Vehicle-treated rat, staining for P-Akt. Weak staining was observed in the intestinal epithelium, with mitotic cells exhibiting the strongest staining (arrows). No staining was observed in the lamina propria between intestinal crypts. C: Insulin-treated rat, staining for P-Akt. Staining was stronger than in vehicle-treated rats and also present in fibrocytes in the lamina propria (arrows). D: IGF-1-treated rat, staining for P-Akt. Staining was generally stronger than in sections from rats treated with insulin or vehicle and present in the intestinal epithelial cells as well as in fibrocytes in the lamina propria (arrow). E: Vehicle-treated rat, staining for P-ERK1/2. Staining was observed almost exclusively in mitotic intestinal epithelial cells (arrows) and in fibroblasts in the lamina propria. F: Insulin-treated rat, staining for P-ERK1/2. Staining was observed almost exclusively in mitotic intestinal epithelial cells (arrows) and in fibroblasts in the lamina propria (arrowheads). The staining pattern did not differ from that of vehicle-treated rats, namely, insulin-treated rats did not exhibit increased ERK1/2 phosphorylation in the colon. IGF-1-treated rats did not exhibit increased ERK1/2 phosphorylation in the colon (not shown).
Staining for P-ERK1/2 was observed in endothelial cells and fibrocytes in the lamina propria (Figures 9E and 9F). Weak staining for P-ERK1/2 was observed in the colon epithelial cells (Figure 9E). Similar to what was seen in the liver and mammary gland, neither insulin nor IGF-1 affected this staining pattern.
P-Akt and P-ERK1/2 Were Associated with Mitoses in Mammary Gland and Colon
Interestingly, irrespective of estrous cycle stage and treatment with insulin or IGF-1, mitotic mammary epithelial as well as colon epithelial cells typically displayed particularly strong staining for P-Akt and P-ERK1/2 (Figures 7D, 8H, 9B, 9E, 9F).
Discussion
The present study showed that (1) a single, supra-pharmacological dose of insulin or IGF-1 caused phosphorylation of Akt, but not ERK1/2, in rat mammary gland and colon epithelium; (2) in tissue where insulin has been described to have mainly metabolic effects (liver and the mammary fat pad), insulin caused stronger Akt phosphorylation than did IGF-1, whereas in organs where insulin has been described to have mitogenic effects (mammary gland and colon), IGF-1 caused stronger Akt phosphorylation than did insulin; and (3) in the liver and mammary gland, ERK1/2 phosphorylation appeared to be correlated with estrous cycle and certain anatomical structures and cell types, supporting an important role of ERK1/2 in the physiological regulation of cellular functions in these organs.
This is the first study of the acute effect of a supra-pharmacological insulin dose on intracellular signaling in the rat mammary gland epithelium. Lee et al. (2003) assessed P-Akt and P-ERK1/2 by Western blotting in mouse mammary gland tissue after a single iv treatment with IGF-1 (Lee et al. 2003). In agreement with our findings, Lee et al. (2003) observed a rapid increase in Akt and ERK1/2 phosphorylation in mammary gland lysate following treatment with IGF-1, but the interpretation of the biological relevance of such findings with lysates, which contain all mammary cell types, is difficult. For example, in our study, insulin and IGF-1 caused comparable Akt phosphorylation in the colon and mammary gland when assessed by Western blotting, but IHC indicated that IGF-1 in fact caused stronger phosphorylation of Akt in the biological relevant cell type (mammary gland and colon epithelium) than did insulin (Figures 7 and 8). These results are in our opinion not contradictory, as we with IHC specifically measured the percentage of cells positive for P-Akt or P-ERK1/2, whereas the level of P-Akt or P-ERK1/2 per positive cell was not quantified.
We administered equimolar, supra-pharmacological doses of insulin and IGF-1 by subcutaneous injection and observed plasma half-lives in reasonable agreement with existing data (EMEA 2004; Zapf et al. 1986) and Cmax values of 270 nM for IGF-1 and 700 nM for insulin. Total endogenous IGF-1 plasma levels are approximately 15 nM in young female Sprague Dawley rats (Jackson et al. 1991). For insulin, the normal plasma concentration in young female Sprague Dawley rats (fed state) is approximately 0.3 nM (Hales and Kennedy 1964; Mizoguchi and Imamichi 1986). Thus, exposures to human insulin and IGF-1 in this study were approximately 900- and 18-fold above endogenous levels, respectively. Based on circulating plasma levels, insulin and IGF-1 exposures were not equal in our study. However, as IGF-1 is bound by IGF-binding proteins in plasma and tissue, we believe administration of equimolar doses, as opposed to setting doses to obtain equal plasma levels, is the better option. In any case, as discussed in the following, these exposure differences are unlikely to explain the differences we observed between insulin and IGF-1 effects in for example the mammary gland.
We performed IHC for Akt phosphorylated on Ser473, a modification known to be required for biological Akt activity (Scheid, Marignani, and Woodgett 2002). Furthermore, we quantified the levels of cells with nuclear P-Akt staining following treatment with insulin or IGF-1 (as all mammary epithelial cells, irrespective of treatment, displayed cytoplasmatic staining of P-Akt, with variable intensity). We therefore consider the IHC P-Akt staining a quite specific marker for biologically active, functional Akt kinase. In the liver and mammary gland, insulin and IGF-1 appeared to have diametrically opposite effects on Akt activity: in the liver as well as mammary gland fat pad, insulin caused stronger Akt activation than did IGF-1 (Figures 4E, 4G, 7G, and 7J). In contrast, in the mammary gland epithelium, IGF-1 caused stronger Akt activation than did insulin (Figures 7I and 7L), namely, in organs and cell types where insulin has been described to have metabolic effects, there was a stronger activation of Akt by insulin than by IGF-1. In contrast, in organs and cell types where insulin has been described to have mitogenic effects, there was a stronger activation of Akt by IGF-1 than by insulin. These different rankings between insulin and IGF-1 in Akt activation in different organs are not easily explained by differences in exposure to insulin and IGF-1. Instead, the apparently higher potency for IGF-1 than insulin in causing Akt activation in the mammary and colon epithelia is in agreement with an ~6-fold higher expression of IGF-1R than IR in rat mammary gland epithelial cells (Hvid et al. 2011), and is perhaps further strengthened by the fact that in our study IGF-1 exposure was below insulin exposure (Figure 1). Similarly, the apparently higher potency for insulin than IGF-1 in causing Akt activation in the liver is in agreement with a ~30-fold higher expression of IR than IGF-1R in the rat liver (Hvid et al. 2011). In short, even though insulin causes Akt activation in different organs, our data indicated that Akt phosphorylation reflected receptor expression and is a potential marker in studies of the receptor-mediated mitogenic effects, if any, of insulin and insulin analogs in the rat mammary gland.
Both human insulin and IGF-1 decrease blood glucose in rats, which could give rise to secondary metabolic effects. One could speculate that such secondary metabolic effects could affect Akt and ERK1/2 and other signaling pathways. In our study, it was not possible to determine whether the observed activation of Akt and ERK1/2 was caused exclusively by binding of ligands to IR and IGF-1R, or by secondary metabolic effects, or both. However, due to the fact that Akt and ERK1/2 phosphorylation was observed already after 30 min (Figure 3), we consider it most likely that the Akt and ERK1/2 phosphorylation is a direct effect reflecting binding of ligands to the IR and IGF-1R and activation of the IR and IGF-1R tyrosine kinase signaling pathways.
In the mammary gland epithelium, insulin as well as IGF-1 caused strongest Akt activation in basal epithelial cells in the ducts (Figures 7H and 7K) and in cells with resemblance to endothelial cells and basal epithelial and myoepithelial cells in the alveolar buds and lobules (Figures 7I and 7L). We have recently shown that basal epithelial and myoepithelial cells in the rat mammary gland tended to have higher expression of IR than luminal epithelial cells (Hvid et al. 2011). Additionally, the basal epithelial cell population is thought to contain mammary stem cells (Regan and Smalley 2007; Shackleton et al. 2006; Sleeman et al. 2006). Taken together, this opens the possibility that subpopulations of mammary epithelial cells are particular sensitive to insulin and IGF-1, which would have practical implications for mitogenicity testing of insulin analogs in vivo.
As regards ERK1/2 phosphorylation, due to the staining characteristics of this antibody, it was not possible to specifically quantify nuclear P-ERK1/2 staining, and cells with cytoplasmatic, nuclear, or both nuclear and cytoplasmatic staining were all counted as positive. Nevertheless, the phosphorylations for which both Western as well as IHC antibodies were specific (see method) are known to correlate with activation of ERK1/2 (Payne et al. 1991; Roux and Blenis 2004). For ERK1/2 phosphorylation, the IHC data were in strong contrast to the P-Akt data on several fronts: (1) for P-ERK1/2, no effects of treatment with insulin or IGF-1 were seen in liver, colon, and mammary gland (Figures 5, 6, 7, and 8); (2) in liver as well as mammary gland, the P-ERK1/2 staining appeared localized to organ compartments and certain epithelial cell types (Figures 5 and 8), whereas P-Akt staining was diffuse (Figures 4 and 7). For example in the mammary gland, epithelial cells in alveolar lobules and alveolar buds exhibited stronger staining of P-ERK1/2 than terminal end buds, and dark epithelial cells exhibited stronger staining than light and intermediate epithelial cells (Figure 8G); (3) in the liver and mammary gland epithelium, P-ERK1/2 varied across estrous cycle phases, with maximum in proestrus (liver) or pro- and metestrus (mammary gland epithelium). The aforementioned observations support an important role for ERK1/2 in the normal physiological regulation of cell function in the rat liver and mammary gland. As a consequence of the differences in Akt and ERK1/2 activation patterns, no correlation was observed between P-Akt and P-ERK1/2 labeling indices in mammary epithelial cells (Figure 6B). Thus, in contrast to the findings in immortalized and cancer cell lines where insulin and IGF-1 can activate both Akt and ERK1/2 pathways (Ahmad et al. 2004; Listov-Saabye et al. 2009), a single dose of insulin or IGF-1 appeared to preferentially activate Akt, but not ERK1/2, in rat mammary epithelial cells in vivo. This is perhaps surprising, given the sustained nature of Akt activation (Figures 2 and 3A). However, a previous study reported that activation of ERK1/2 in normal mammary epithelial cells by IGF-1 requires transactivation of the epidermal growth factor receptor (Ahmad et al. 2004). In any case, it is well known that the balance between Akt and ERK1/2 activation influences biological outcomes of IR/IGF-1R signaling, for example, whether differentiation or proliferation occurs (Moelling et al. 2002; Ren, Accili, and Duan 2010; Zimmermann and Moelling 1999). Interestingly, in other studies, we found no mitogenic effect of daily treatment with insulin or IGF-1for up to 4 days in the mammary gland (not shown). On the other hand, endogenous cell proliferation in the mammary gland epithelium was maximal during metestrus (Hvid, Thorup, Sjogren, et al. 2010), which corresponds with the time of maximal ERK1/2 phosphorylation in the mammary gland epithelium (Figure 6D). While the current study is too small to substantiate such hypotheses, experiments are planned to explore whether treatment regimes providing also ERK1/2 activation may enhance mitogenic effects of insulin- and IGF-1 in the rat mammary gland.
The centrilobular P-ERK1/2 staining pattern in the liver was surprising. Yet, it is well known that the different zones in a hepatic lobule have different functional properties (Chiquoine 1953; Cohen et al. 1997; Tsutsumi et al. 1989), that hepatocytes express estrogen as well as progesterone receptors (Chamness, Costlow, and McGuire 1975; Haukkamaa 1976), and that estrogen and progesterone have biological effects in the liver (O’Mahony, Thomas, and Harvey 2009; Schindler 2007). This supports that the observed centrilobular staining pattern for P-ERK1/2 and the dependency of the estrous cycle is biologically plausible (Figures 5E and 5F). In addition, the lack of effect of insulin or IGF-1 on hepatic ERK1/2 phosphorylation in the liver (Figure 6C) is essentially in agreement with a previous study (Authier et al. 2004).
Despite the distinct staining patterns of P-Akt and P-ERK1/2 described previously, similarities were also observed: hepatocytes bordering coincidental lesions with acute inflammation and necrosis were strongly positive for P-Akt as well as P-ERK1/2 (Figures 4D and 5G), and mitotic epithelial cells in the mammary gland and colon were strongly positive for P-Akt as well as P-ERK1/2 (Figures 7D, 8H, 9B, 9E, and 9F). This is in agreement with the well-known involvement of Akt and ERK1/2 in inflammatory and cytokine-mediated signaling (Bommhardt et al. 2004; Pastore et al. 2005), as well as transition from G2- to M-phase (Dumesic et al. 2009; Kandel et al. 2002; Shtivelman, Sussman, and Stokoe 2002). This therefore supports that P-Akt and P-ERK1/2 could be used as markers of a possible effect from insulin and insulin analogs on progression of cells from G2- to M-phase.
In this study, we did not have identical representation of all estrous cycle stages across treatment groups, and larger studies are therefore required to confirm our results. However, in the mammary gland and liver, P-Akt staining was treatment-related (Figures 6A and 7), whereas P-ERK1/2 staining was not treatment related but instead correlated with the estrous cycle. We believe that observations such as these support that the patterns of Akt and ERK1/2 phosphorylation reported herein represent real, biological effects, as opposed to artifacts caused by unequal numbers of animals in different estrus cycle phases.
In conclusion, this study showed that rat mammary gland epithelial cells express functional IR and IGF-1R and that Akt activation by insulin or IGF-1 correlated with receptor expression levels. For refinement of animal models for the assessment of receptor-mediated mitogenic and carcinogenic effects of insulin and insulin analogs, it is necessary first to fully understand IR and IGF-1R function and signaling in the rat mammary gland. The data presented in this study support that immunohistochemical analysis of intracellular signaling cascades may prove a valuable tool in this regard, because this approach makes it possible to monitor IR and IGF-1R signaling in situ in relevant subpopulations of cells in complex organs such as the rat mammary gland.
Footnotes
ACKNOWLEDGEMENT
We wish to thank Susanne J. Rasmussen and Susanne D. Høiberg for skillful technical assistance during the animal experiments and Pia Jensen for valuable advice during preparation of tissue lysates and Western blotting. Katie Crossby, Cell Signaling Technology, is thanked for kindly providing the protocol for phosphatase-treatment of tissue sections, and Elisabeth D. Galsgaard for stimulating discussions during validation of antibodies for IHC. Annick Desjardins is thanked for proofreading the manuscript.
Abbreviations
The author(s) declared no potential conflicts of interests with respect to the authorship and/or publication of this article. The author(s) received no financial support for the research and/or authorship of this article.