
Abstract
Reliable detection and measurement of cell proliferation are essential in the preclinical assessment of carcinogenic risk of therapeutics. In this context, the assessment of mitogenic potential on mammary glands is crucial in the preclinical safety evaluation of novel insulins. The existing manual counting is time-consuming and subject to operator bias. To standardize the processes, make it faster, and resistant to errors, we developed a semiautomated image analysis system (CEPA software, which is open-source) for counting of proliferating cells in photomicrographs of mammary gland sections of rats labeled with Ki-67. We validated the software and met the predefined targets for specificity, accuracy, and reproducibility. In comparison to manual counting, the respective mean differences in absolute labeling indices (LIs) for CEPA software were 3.12% for user 1 and 3.05% for user 2. The respective regression analysis revealed a good correlation between the CEPA software user and manual counting. Moreover, the CEPA software showed enhanced reproducibility between independent users. The interuser variability is centered around 0 and the absolute difference was about 0.53% LI. Based on validation data, our software has superiority to the manual counting and is a valid and reliable tool for the routine analysis of cell proliferation in mammary glands from rats exposed to insulin analogs.
Introduction
Tumor development is a result of an imbalance of cell proliferation and cell death. Beside inhibition of apoptosis, the deregulation of cell proliferation is a crucial and constant feature in the multistage model of carcinogenesis that is considered at least as a 2 event model comprising DNA-alteration and proliferation. 1,2 There is clear evidence that DNA replication and cell proliferation are essential in the fixation of DNA alterations as the initial steps in production of mutated cells, which could be either a spontaneous or induced process. At the promotion and progression phase of carcinogenesis, in particular driven by nongenotoxic compounds, cell proliferation is essential in the progression toward malignant tumors by enhancing the clonal expansion of cells with DNA damage or by increasing the probability of spontaneous DNA replication errors. 2 –4 It should also be mentioned that there is no simple relationship between proliferation and carcinogenesis. 5 Based on the 2 event model, growth alterations caused by nongenotoxic compounds may play a key role by converting DNA adducts to mutations, enhancing the rate of spontaneous mutations, increasing the survival of mutated cells, and giving mutated cells a preferential growth advantage. 6 –8 In addition, cell proliferation is presumably the only established marker to predict and detect carcinogenic potential of nongenotoxic compounds, whereas a large battery of tests is available for genotoxicity. Therefore, the reliable detection and measurement of cell proliferation are essential in the nonclinical assessment of carcinogenic risk of compounds developed as pharmaceuticals, biocides, or other chemicals and need to be standardized. 9,10 Moreover, as the regulatory environment moves toward more prospective evaluations utilizing quantitative pathway-based models, standardization of proliferation assays becomes an increasingly important part of cancer risk assessment. 10 Measurement of cell proliferation is usually done by the immunohistochemical detection of proliferation marker, such as bromodeoxyuridine (BrdU) and Ki-67. The Ki-67 is a well-established proliferation marker, 11,12 and a good correlation between both markers was proven for many species, including the rat 13 and in particular for the mammary gland. 14
Based on these facts, and taking into account the pattern of Ki-67 staining and its ability to quantify cell proliferation in G1, G2, and M phases of the cell cycle makes it the “first-choice” marker to measure cell proliferation. 15 Although, there is certain scientific evidence from human tumor pathology that phosphohistone H3 may outperform Ki-67 as prognostic indicator. 16 –18 But decades of practice and also profound studies indicate the prognostic superiority of Ki-67 to phosphohistone H3 and other novel proliferation markers. 19
Since about 100 years, insulins and insulin analogs have been increasingly and widely administered for the treatment of both type 1 and 2 diabetes mellitus in order to achieve normoglycemia. However, conventional insulins were found to have limitations. Therefore, over the past few decades, continuous efforts have been put on the development of biosynthetic human insulins and insulin analogs with improved metabolic profiles. Insulin displays its biological action through co-stimulation of the insulin and insulin-like growth factor (IGF)-receptors, 20,21 which are also associated with cell proliferation. Because of this distinct and critical role, it has been suspected that insulin analogs might have enhanced mitogenic potential. First evidence came from in vitro studies, 22,23 which showed that the modified sequence and structure of insulin analogs could enhance their mitogenicity. In an attempt to verify mitogenic risk of insulin analogs, several clinical observational studies were initiated and their outcomes published, 24 –30 but the results were considered as inconclusive by the European Medicines Agency. This assessment was substantiated through scientific reviews and further experimental data, where further elaboration of this issue was recommended. 31 –34 Based on the regulatory and scientific guidance, it’s obvious that the verification of mitogenicity remains essential for the preclinical development of new biosynthetic insulin (analogs). 35 The preclinical investigation of cell proliferation induced by insulins and insulin analogs has been carried out in rat as the standard model with particular emphasis on the mammary gland. 21,36 –38 Guidance and scientific protocols have been worked out that describe a precise evaluation of mammary gland proliferation in preclinical carcinogenicity assessment of pharmaceuticals. 14,39 Manual counting has been the most commonly used method whereby the pathologist evaluates Ki-67 labeling by estimating the number of labeled slides according to what is seen on the glass slide. According to literature, a minimum of 1000 to 1500 counted cells is considered to be necessary in order to achieve significance and statistical power. 9 Manual counting requires the analysis of a large number of labeled tissue slides and therefore a large investment of time and resources is needed. Moreover, interobserver variability may be substantial 40 and one of the main sources of variability, poor reproducibility, and uncertainty. 40 Currently, the arising of automated cell counting instruments has provided the possibility of analyzing a huge number of samples in a shorter time 41 and with higher accuracy.
But, unfortunately, there are very few scientifically sound studies on the software-automated counting of Ki67 stains on rat tissue samples. In our study, we set out to develop and validate a semicomputerized approach for evaluation of cell proliferation in rat mammary gland tissue. To our knowledge, this study represents the first thorough validation of an automation system using Ki-67-staining of proliferating cells in rat mammary gland. In a 2007 study published by Persohn et al, 40 researchers described an automatic detection using the commercial Definiens analysis software. But unlike our study, their investigations were focused on rat cecum and colon tissue slides that were processed for BrdU immunohistochemistry. There are recent studies on software-automated counting of Ki-67 stains, for instance, the comparative study published by Swiderska et al, 42 where the authors developed a computerized system based on MATLAB and compared the manual, semiautomatic, and automatic labeling of Ki-67 spots from slide images, or the investigation published by Samols et al, 43 on correlation of software-automated counting of Ki-67 Proliferation Index with pathologic grade and disease progression. But in these studies the biological samples used were all from patients with cancer with various degree of disease progression. Therefore, we developed our semiautomated image analysis system, CEPA software for detection of cell proliferation in rat mammary gland that can provide consistent, reproducible, and highly objective measurements of labeling indices (LIs).
Methods
For the evaluation of the CEPA software in terms of accuracy and reproducibility of results, a toxicology study was used, which focused on mammary gland.
Animals
The validation study for the evaluation of the CEPA software consisted of 10 female Crl: CD Sprague Dawley rats (Charles River Laboratories, Harlan Winkelmann GmbH, Borchen, Germany), 5 rats served as controls, and 5 rats underwent a subcutaneous treatment with 50 IU/kg/d with a novel insulin analog for 1 month. However, no further distinction was made between the controls and the treated rats throughout the evaluation, as the focus of the study was the validation of the CEPA software, the specific treatment and treatment effects were not relevant. However, as it was important to validate the CEPA software not only by control samples with expected low LI but also with samples with higher LI, we used samples from insulin-treated animals too. As a result, we could validate the CEPA software within a broad range of LIs.
The rats intended for mammary gland sampling were taken from a toxicology study. The 6- to 7-week-old rats were housed with a maximum of 3 animals per cage and subjected to a 12-hour light-dark cycle. The rats had ad libitum access to food (ssniff; R/M-H pellets, Soest, Germany) and water. This rat toxicity study performed at Sanofi-Aventis Deutschland GmbH was authorized by the competent authorities according to the German animal welfare acts and conducted in compliance with the EEC Council Directive of the European Community from November 24, 1986, on the approximation of laws, regulations, and administrative provisions of the Member States regarding the protection of animals used for experimental and other scientific purposes (86/609/EEC).
Histology and Immunohistochemistry
The skin with mammary gland tissue from female rats from one side were taken in whole and separated in 4 different parts. After a fixation time of 24 hours, the trimming and dehydration of the mammary gland tissue followed. Two sections were cut from each block; the first section was stained with hematoxylin and eosin (H&E) in order to get an overview of the amount of mammary glands present and the second section was labeled with Ki-67 to identify proliferating cells.
For the detection of the total number of cells, a classical hemalum counterstaining was performed. After rinsing the deparaffinized and rehydrated paraffin sections with distilled water, antigen retrieval was conducted with citrate buffer (pH 6.0) in pretreatment module, which is a pressure cooker instrument, for 20 minutes, followed by a preincubation with a blocking reagent (anti-mouse Fab fragments 1:50 dilution) for 10 minutes. Incubation with ready to use anti-rat Ki-67 antibody, clone SP6, was performed for 1 hour and the enzyme detection of positive reactions by using the Ultra Vision LP/AP polymer kit (primary antibody enhancer for 20 minutes; Alkaline phosphatase polymer Kit for 30 minutes; chromogen fast red for 12 minutes; counterstaining with hemalum).
Manual Counting and Analysis With the CEPA Software
The labeled mammary gland sections were photomicrographed randomly (Figure 1). For each individual animal, ≈10 to 15 photomicrographs were taken from the processed mammary gland tissue. The magnification of the microscope was set to ×20. The number of the photographs were dependent on the mammary gland tissue quantities. The obtained micrographs were printed out for manual counting and in parallel, the image files were subsequently loaded into the CEPA software for analysis of cell proliferation. For the analysis with both methods, only glandular epithelial cells of mammary tissue were captured. Cells with diffuse or stippled red pigment over the nuclei were counted positive. On the printed photomicrographs as well as within the CEPA software, red- and blue-labeled nuclei (total number of labeled cells) as well as red-labeled nuclei alone (labeled proliferating cells) were identified and counted. At least a total of 1000 to 1500 blue- and red-labeled nuclei were counted in ductular and alveolar structures to achieve statistical power. 9,44
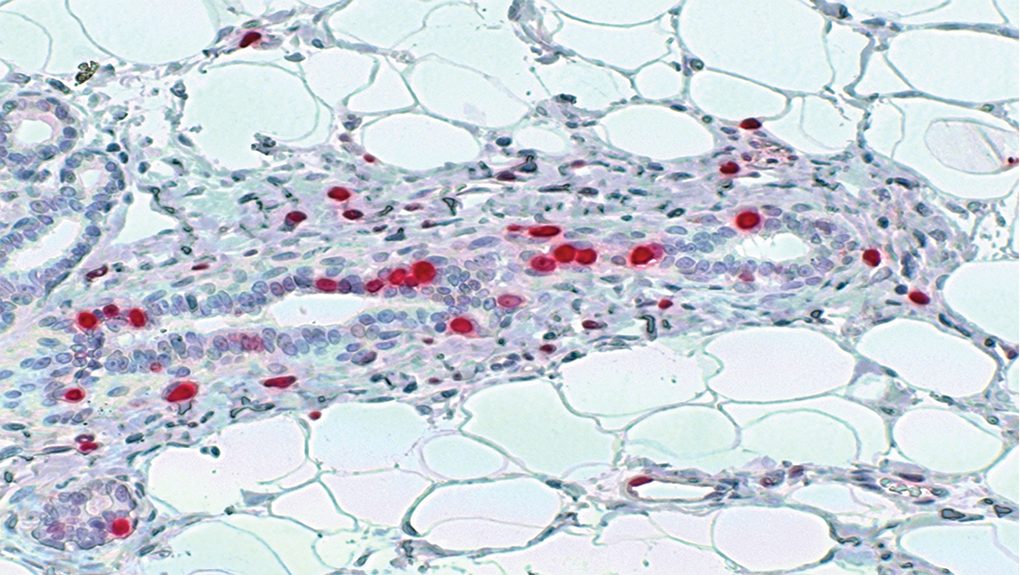
Ki67 immunostaining of mammary gland tissue. The red-stained nuclei (Ki-67 positive nuclei) are indicating proliferating cells. The staining pattern varies between stippled and diffuse reactions over the nuclei of the glandular tissue. The blue nuclei (Ki-67-negative nuclei) are non-proliferating cells.
The LI for every specimen was determined as the ratio of red-labeled nuclei to the total number of counted nuclei and expressed as percentage (%).
Development of the Image Analysis Cepa Software
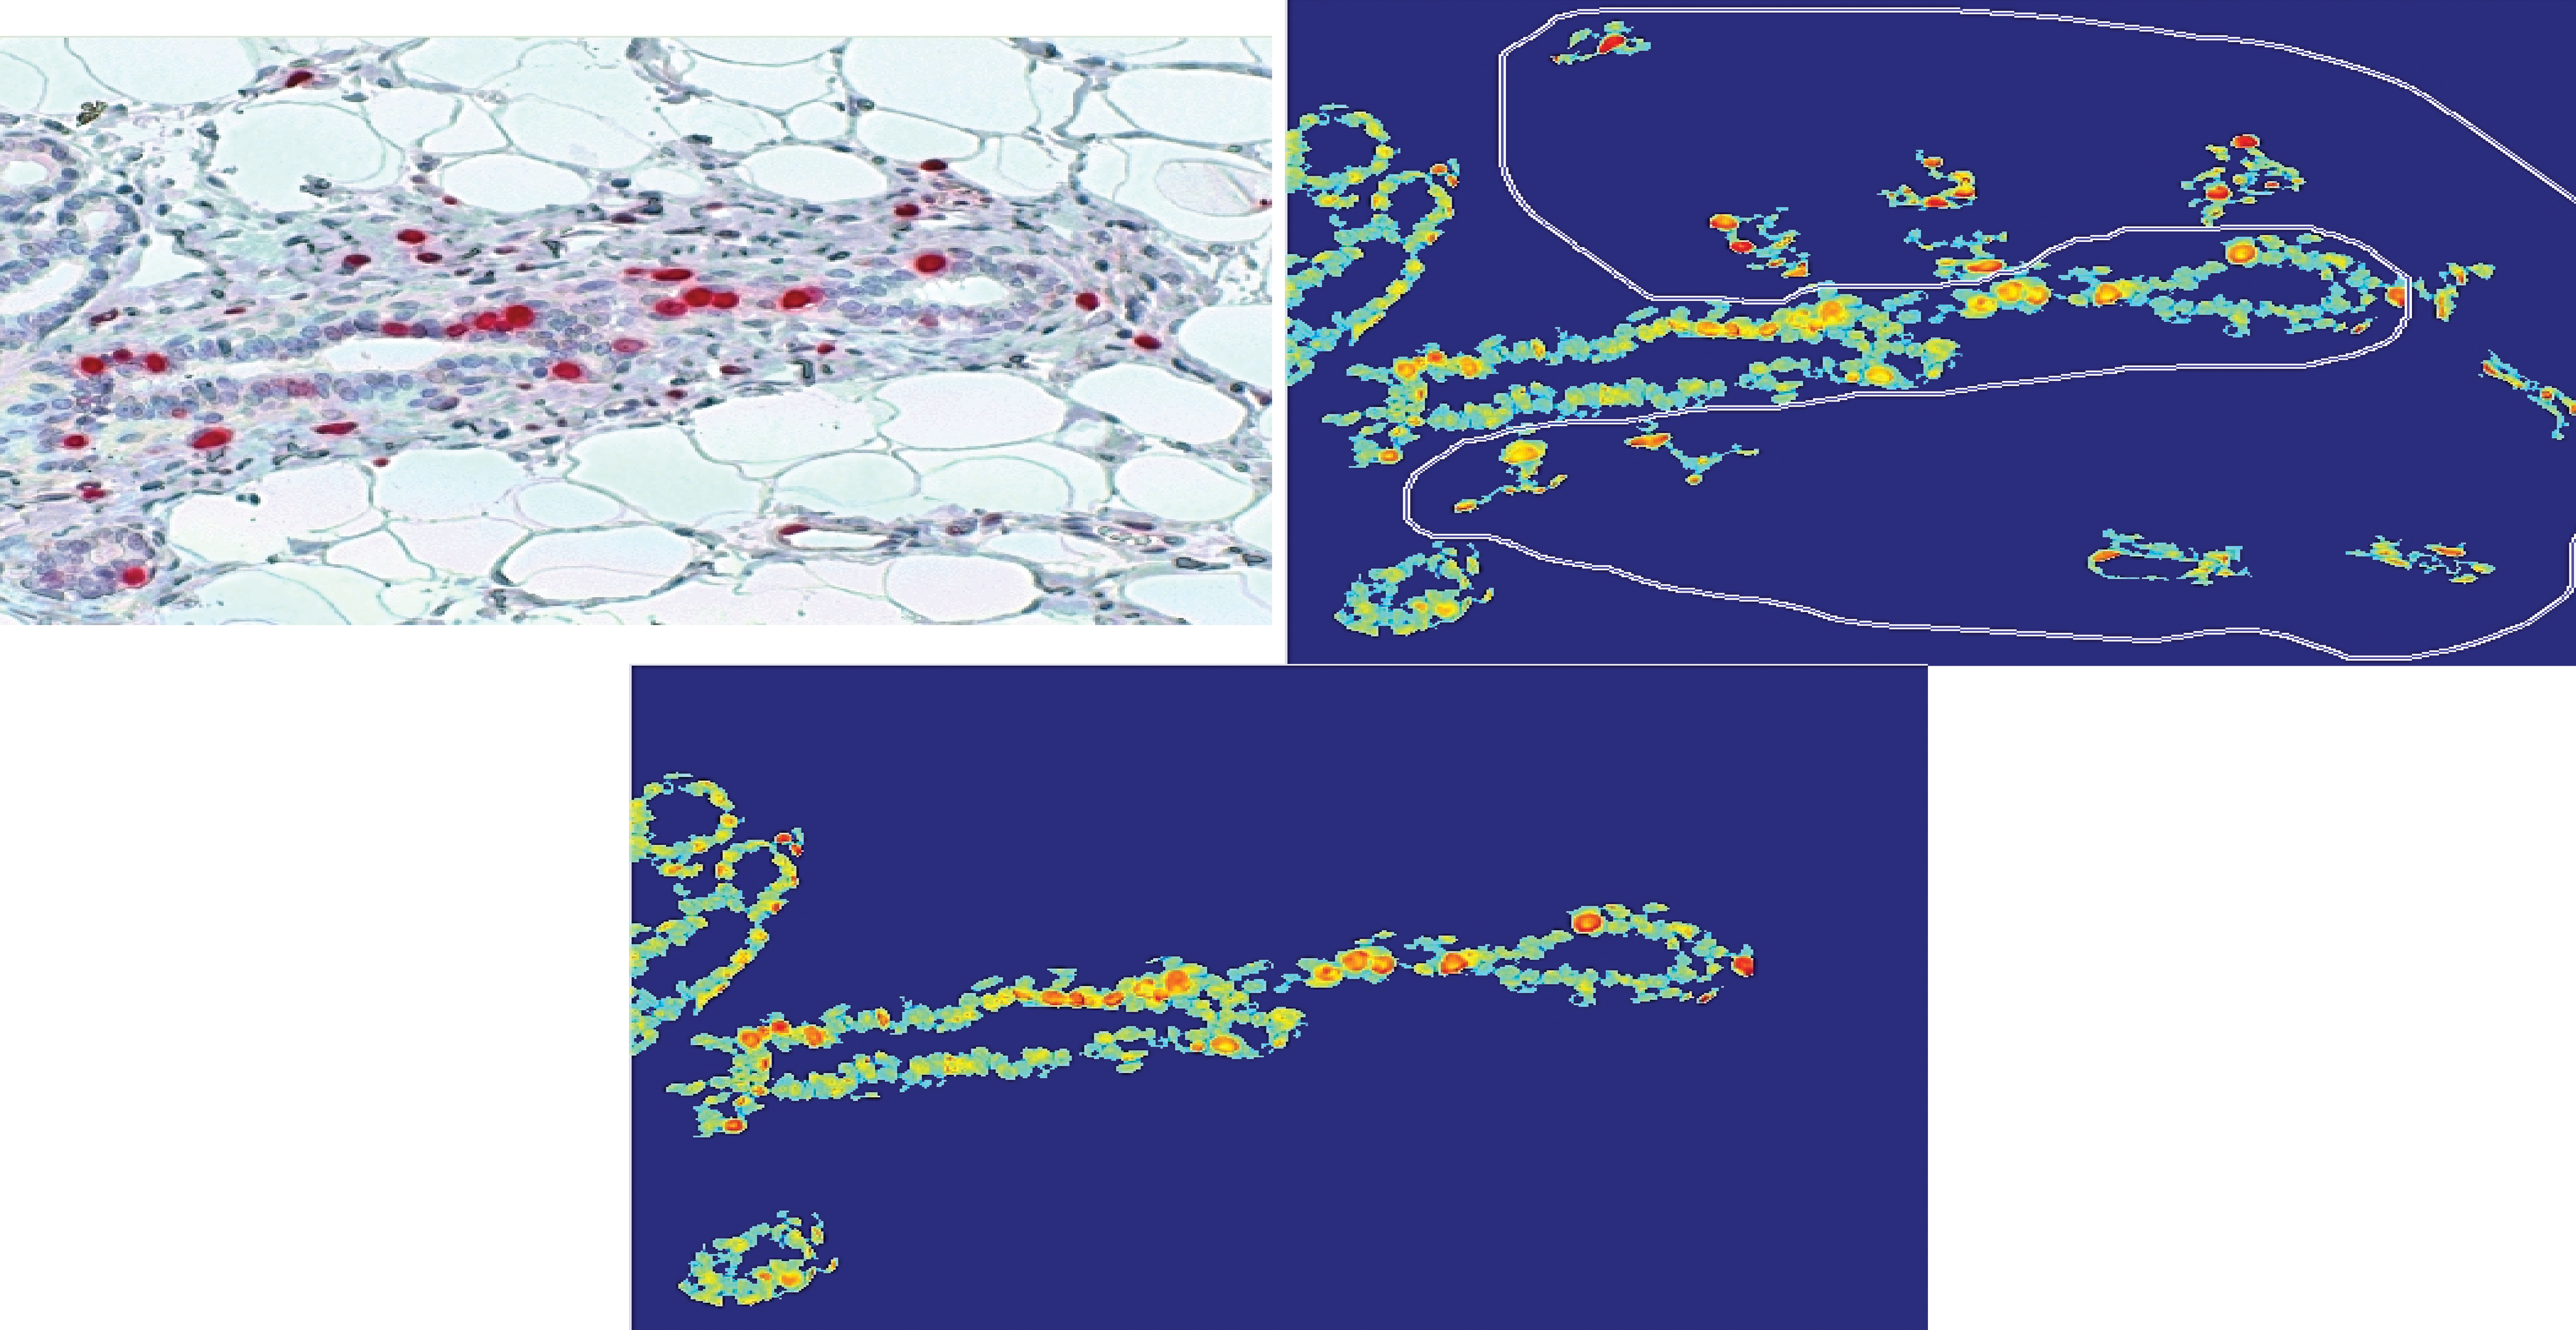
The CEPA software was coded in MATLAB (version R2013b, MathWorks Natick, MA). The graphical user interface (GUI) was developed and used for the semiautomated image analysis of photomicrographs. Loading the image, the CEPA software performs automatically filtering and multiple analysis steps. They mainly consists of the identification of red- and blue-labeled nuclei. The result of this automatic analysis step is shown as an image side by side with the original image (Figure 2).
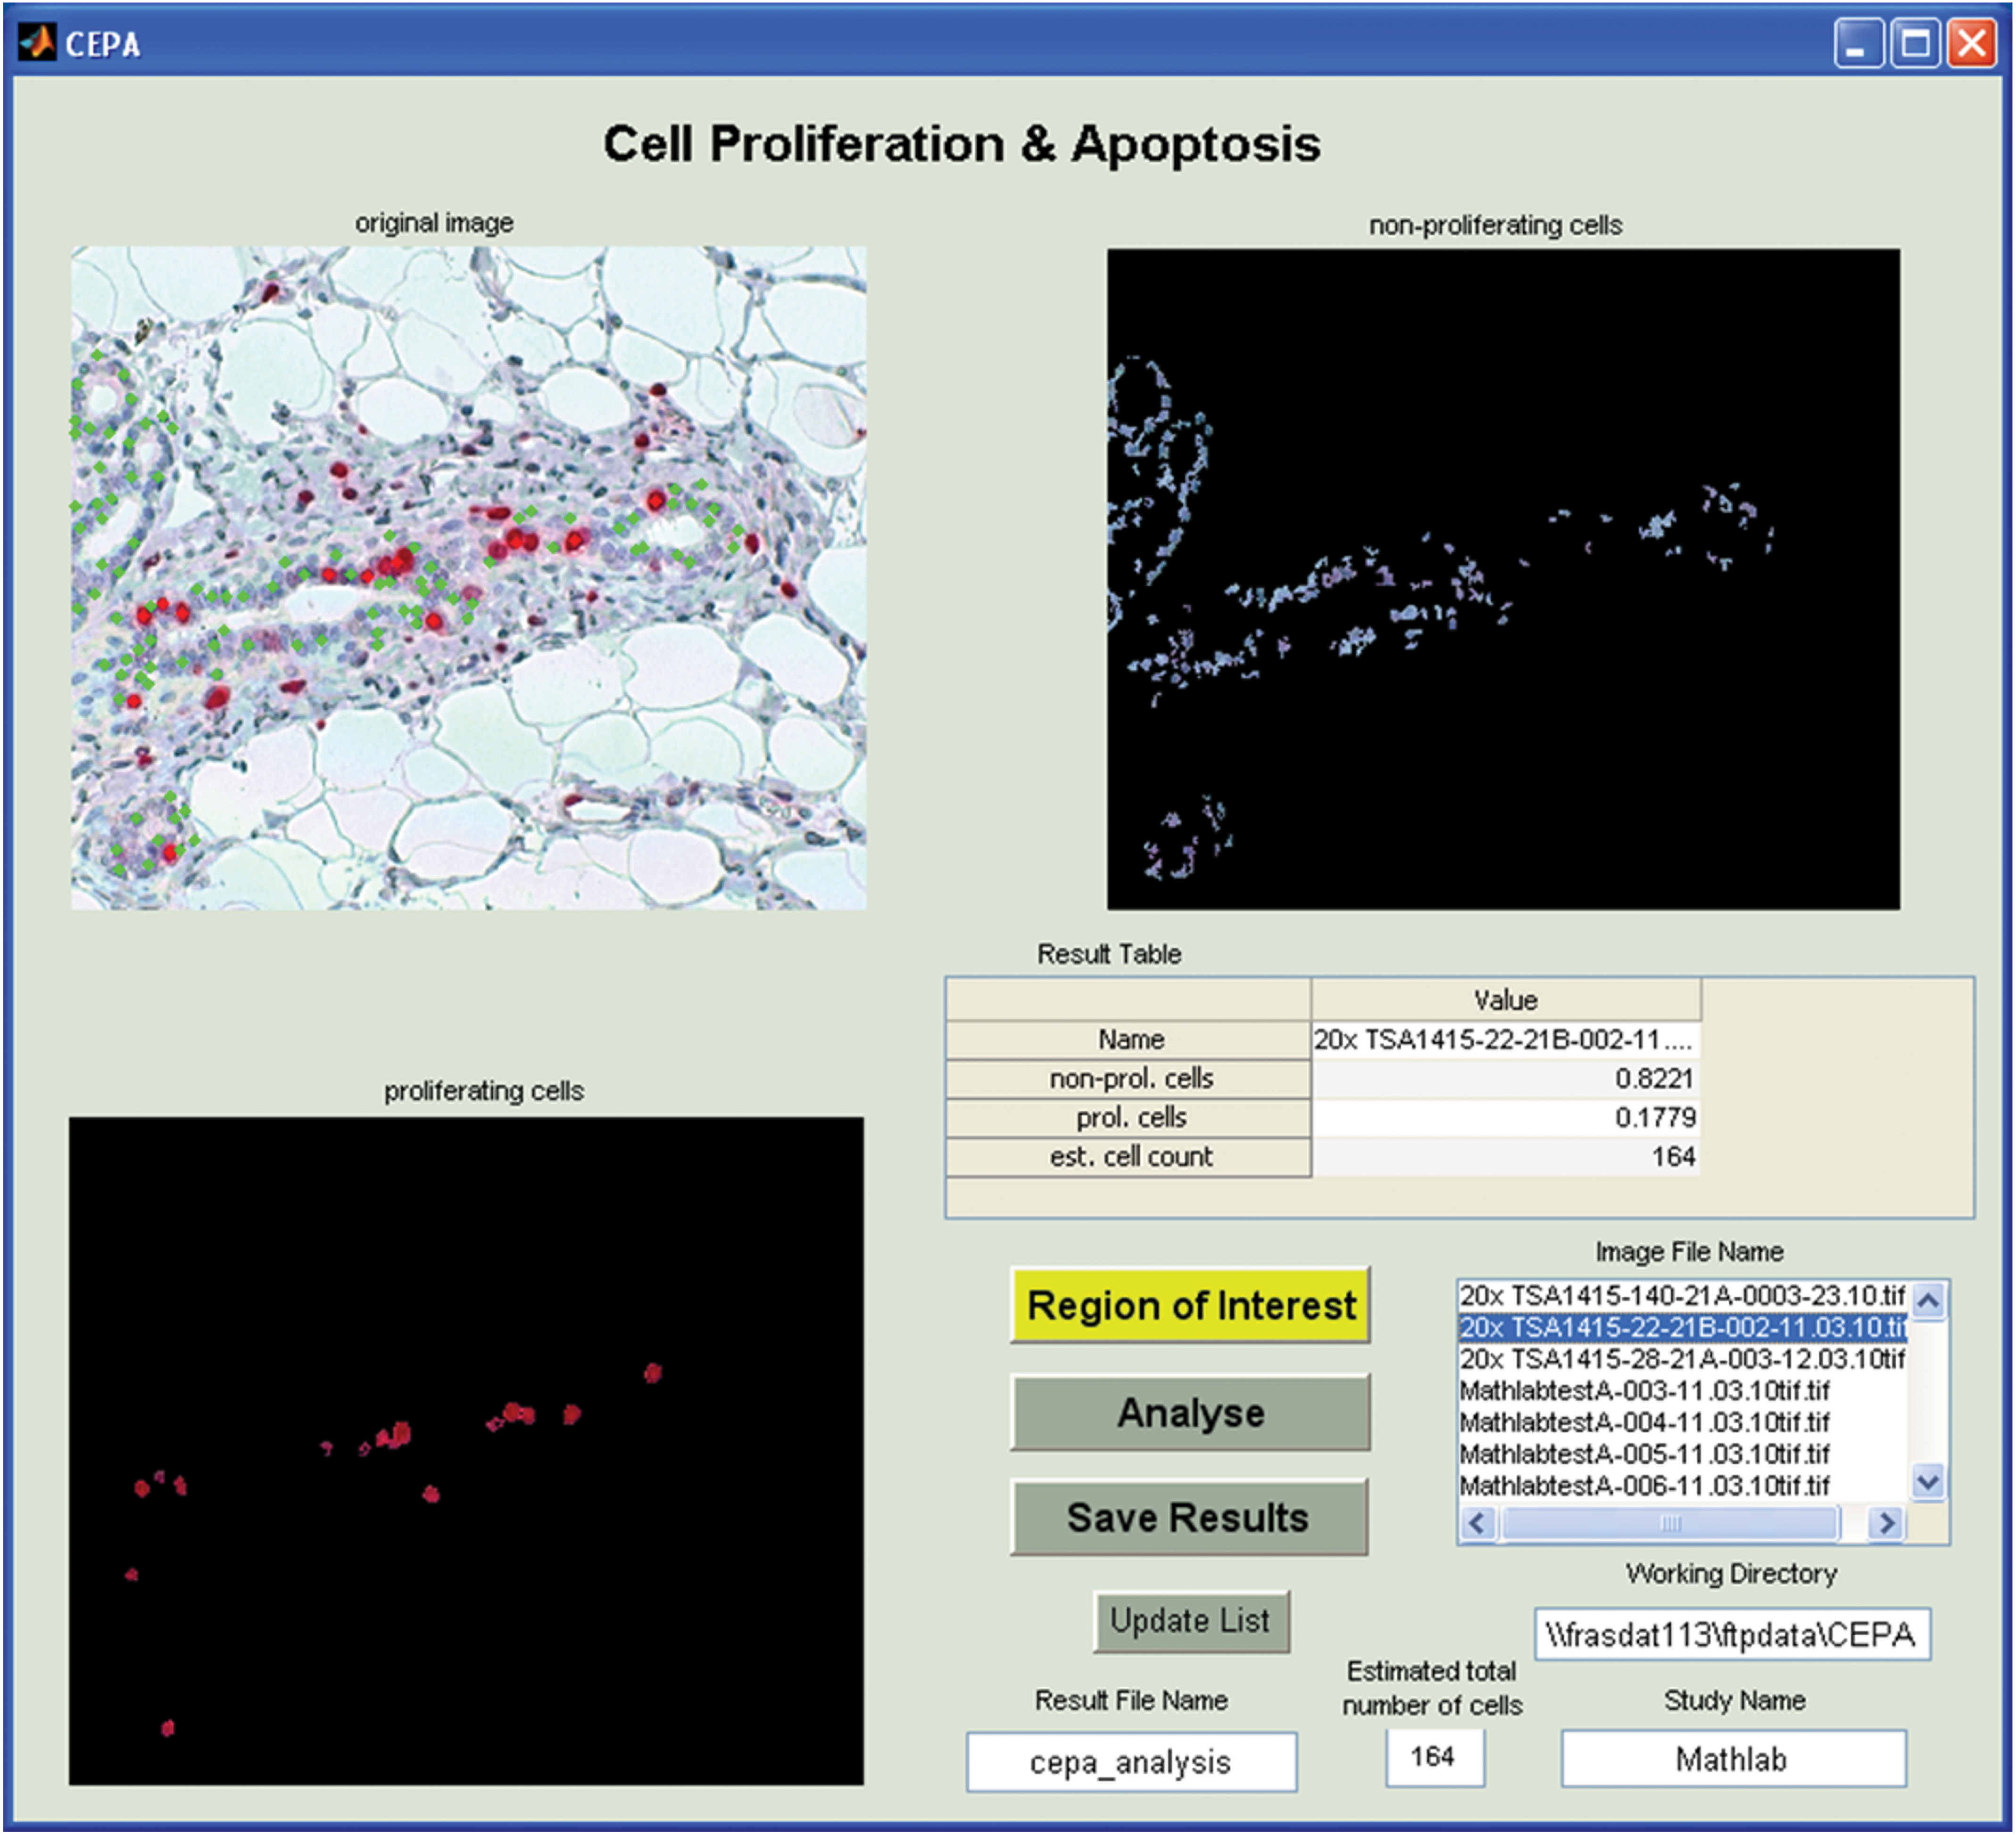
Illustrates main CEPA software graphical user interface (GUI). The upper left image shows the original photomicrograph and the identified cells-nuclei marked by a green dot. The upper right image shows the identified non-proliferating cells-nuclei and the lower left image shows the identified proliferating cells-nuclei only. Lower right part hosts the analysis functionality.
The fraction of proliferating (red-labeled nuclei)—and non-proliferating (blue-labeled nuclei) cells is calculated (in this context, non-proliferating cells mean nuclei negative for Ki-67 labeling and with proliferating cells nuclei positive for KI-67 labeling). Further, the program estimates the total number of cells considered for determination of the LI. In Figure 2, the GUI is presented, after an image was loaded into the CEPA software. The algorithm and the workflow are illustrated and described in the following parts: Noise filter (selection of most interesting regions) Identification of cells Identification of proliferating and non-proliferating cells Calculation of the fraction of proliferating cells Calculation of the total number of identified cells.
Noise Filter
In order to identify the glandular epithelial cells as regions of interest (ROI) and to exclude nonglandular compartments as connective and adipose tissue, the latter areas were considered as noise and had to be filtered out. As a first step, this filtering procedure is applied. The filtering procedure calculates the intensity value I distribution of the red, green, and blue color intensities (Ir , Ig , and Ib ). If the color intensity values (Ir , Ig , and Ib ) of the individual pixels are greater than the 75th percentile of the respective distribution, then these pixels are marked and filtered out. Furthermore, any pixel is marked and filtered out if the intensity of the green color Ig is above the 35th percentile of the intensity distribution of the green color (Ig ). The resulting image is then further analyzed and passed to the classification step.
Classification of Non-Proliferating Cells/Nuclei and Proliferating Cells/Nuclei
The automatic classification of each single pixel of the image obtained after applying the noise filter, required a training procedure of the classifier used. The training procedure of the classifier comprised the collection of a training set. For the compilation of the appropriate training data set for the machine learning algorithm, numerous proliferating, non-proliferating glandular cells/nuclei as well as, nonglandular cells/nuclei from connective and adipose tissue were randomly selected from a set of images. From these selected and manually classified cells/nuclei, the corresponding pixel information were extracted and characteristic features determined. The characteristic features for each pixel were besides the color intensities Ir
, Ig
, and Ib
, the ratio of any 2 color intensities Ir
, Ig
, and Ib
. The following intensity ratios were calculated (
The following classification rules have been obtained: Proliferating cells/nuclei
Ir
> 47.3 and Ir
< 84.9
Ig
< 49.2
Ib
< 122.7
rrg
> 1.4 + scaling factor (median of rrg
)
rrb
> 1.5 + scaling factor (median of rrb
)
rgb
< 0.72 + scaling factor (median of rgb
) Non-proliferating cells/nuclei
Ir
> 84.9 and Ir
< 139.0
Ig
> 76.0 and Ig
< 116.6 or Ig
> 132.8 and Ig
< 140.0
Ib
> 142.9 and Ib
< 172.7 or Ib
> 235.8 (rrg
> 0.88 and rrg
< 1.2) + scaling factor (median of rrg
) (rrb
> 1.17 and rrb
< 1.33) + scaling factor (median of rrb
) (rgb
> 0.83 and rgb
< 1.34) + scaling factor (median of rgb
).
Identification of Nonproliferating Cells/Nuclei and Proliferating Cells/Nuclei
As soon as the image was loaded into the CEPA software, the 6-dimensional feature vector (V ∈ R6) was determined (Ir , Ig , Ib , rrg , rrb , and rgb ) for any pixel of the loaded image. Based on the feature vector, the classifier was grouping any pixel into the group of proliferating and non-proliferating cell/nuclei, if at least 3 of the 6 classification rules were fulfilled. As a result a set of classified pixels of interest were obtained and further evaluated based on the neighborhood of each pixel. Neighboring pixels were combined and grouped together, such that adjacent pixel, which have been assigned to the same group by the classifier, was being considered as cells of interest and further evaluated (Table 1). The cells/nuclei of interest or identified regions within the image were further evaluated in respect to their morphological characteristics. The nuclei of cells of interest (glandular epithelium) were expected to have a round to oval shape. Therefore, the eccentricity (roundness) of cells/nuclei of interest have to be at least ≥0.65 and the size of the area should be at least ≥175 pixels.
The corresponding elements of the feature vector (V ∈ R6) are shown for 5 selected pixel of 3 typical cell/nuclei types (proliferating epithelial cell/nuclei, non-proliferating epithelial cell/nuclei and connective tissue cell/nuclei), respectively.a
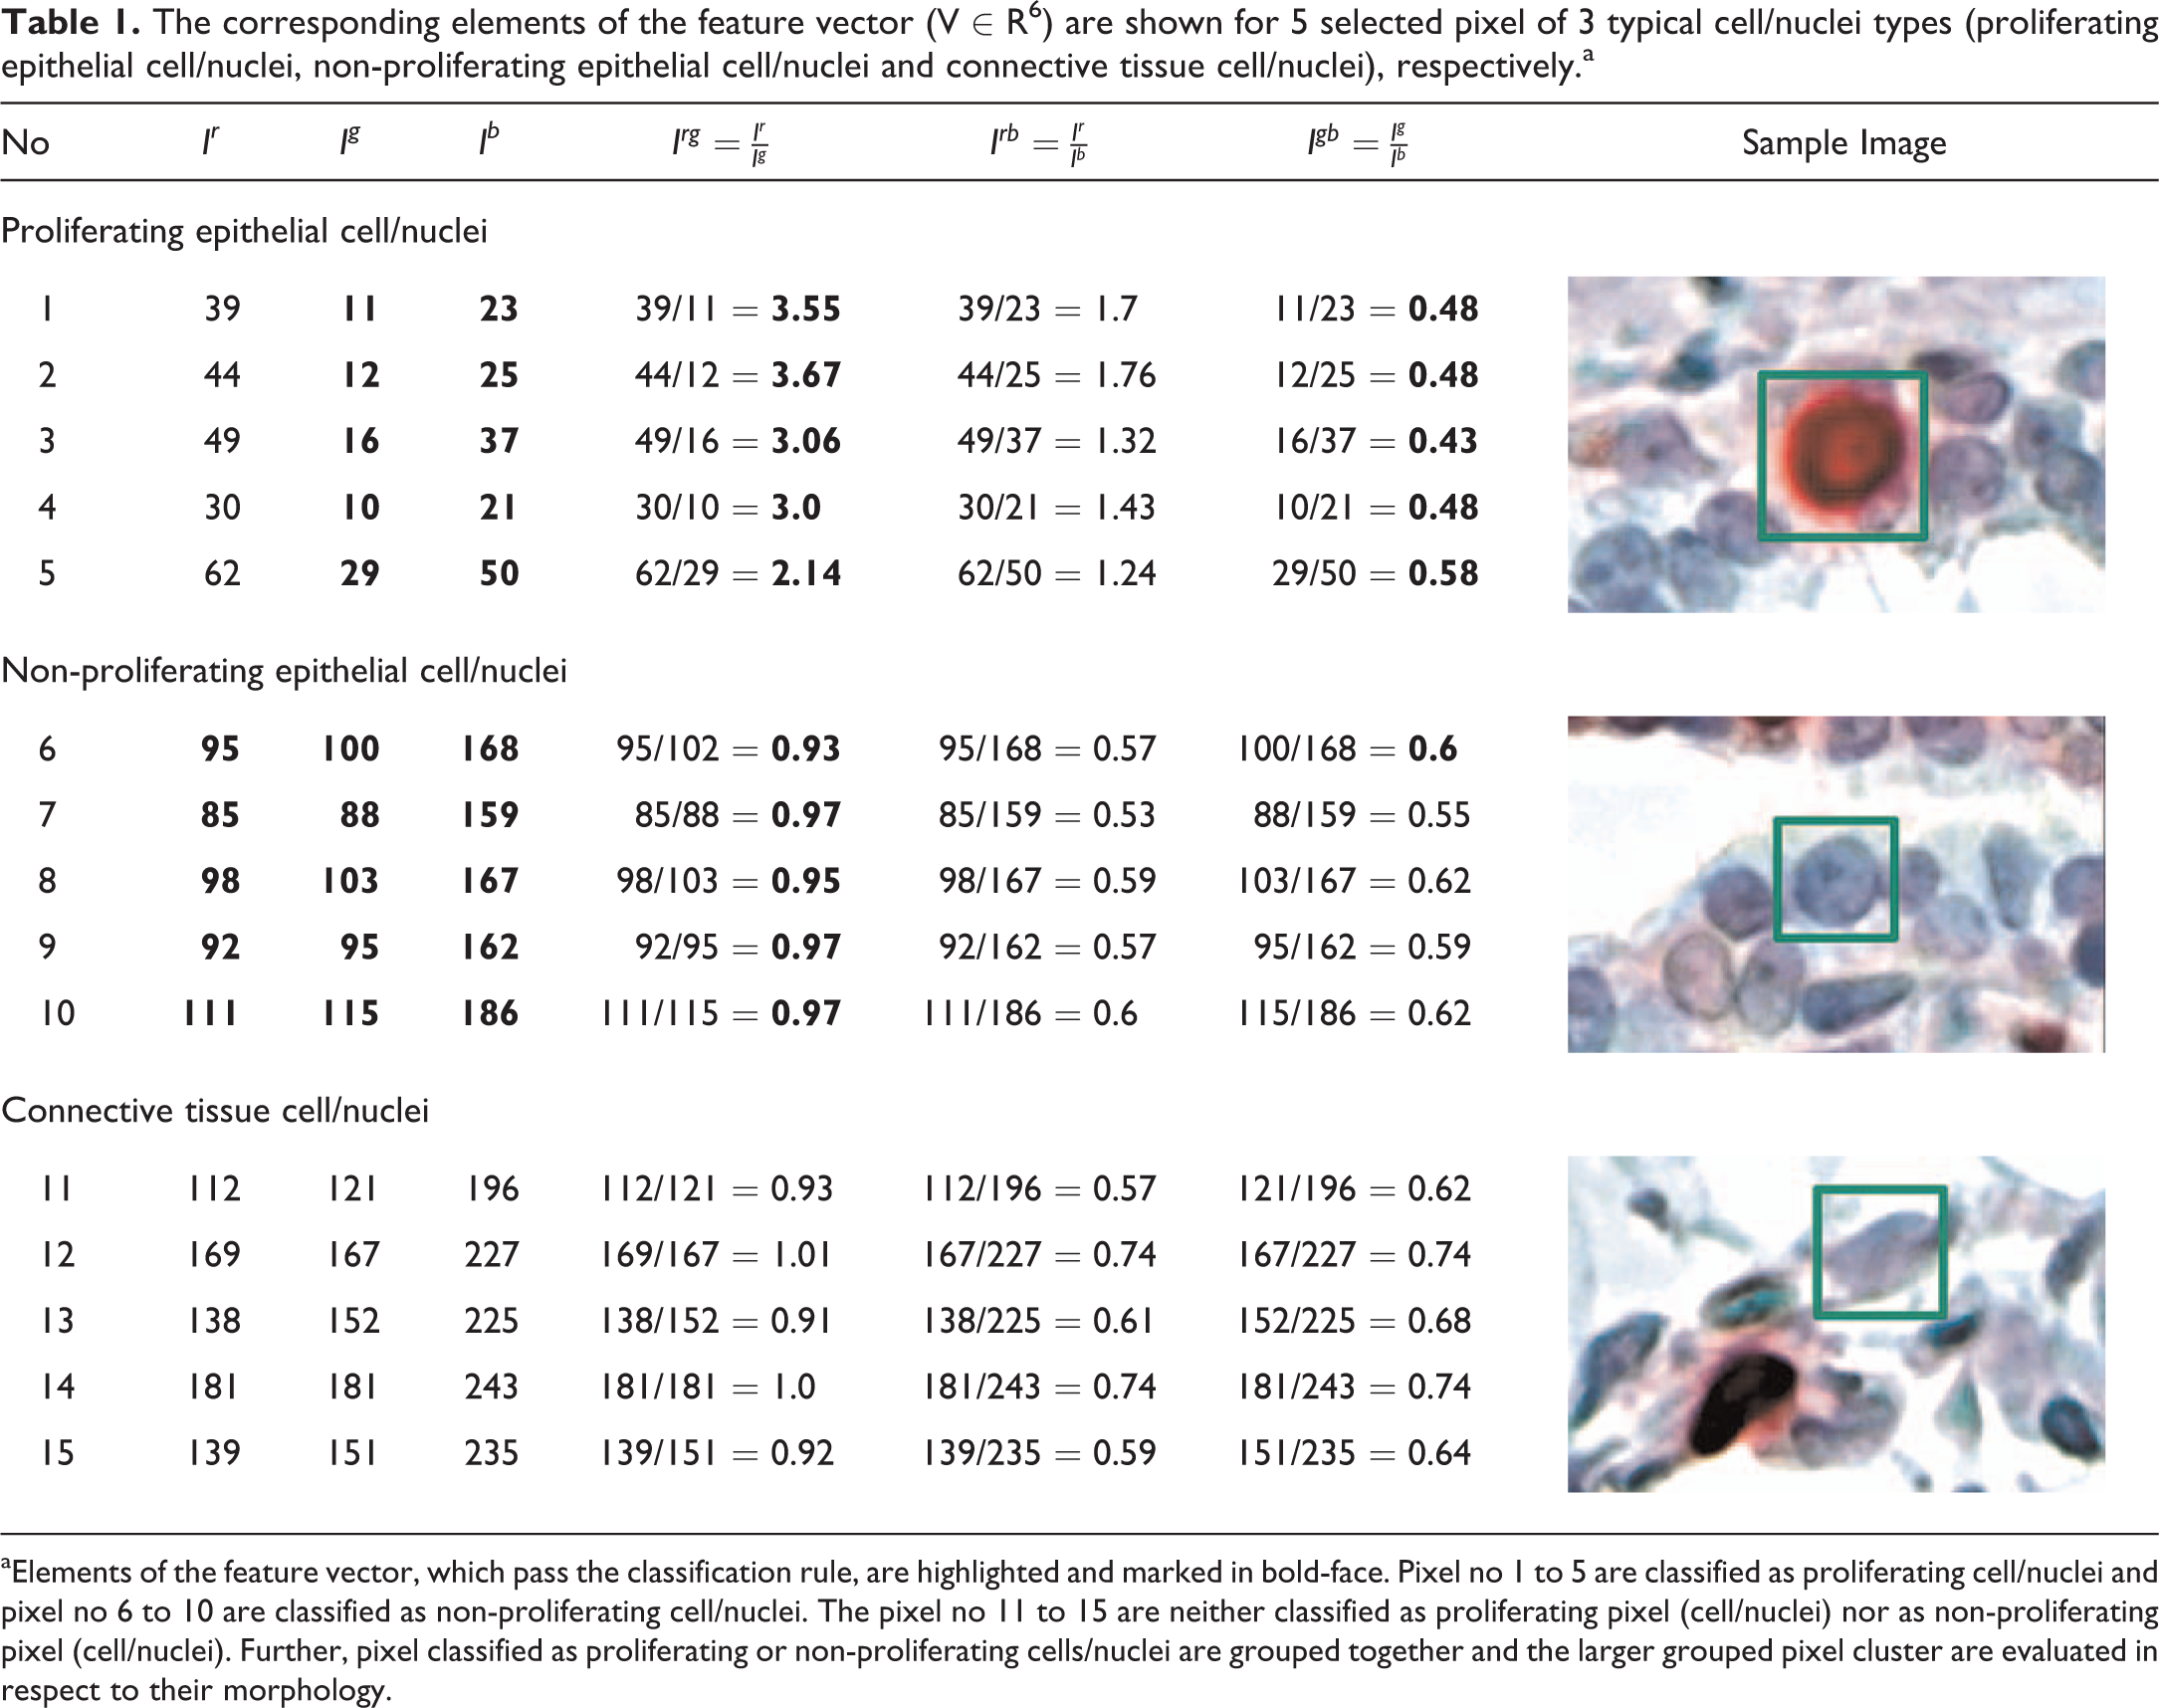
aElements of the feature vector, which pass the classification rule, are highlighted and marked in bold-face. Pixel no 1 to 5 are classified as proliferating cell/nuclei and pixel no 6 to 10 are classified as non-proliferating cell/nuclei. The pixel no 11 to 15 are neither classified as proliferating pixel (cell/nuclei) nor as non-proliferating pixel (cell/nuclei). Further, pixel classified as proliferating or non-proliferating cells/nuclei are grouped together and the larger grouped pixel cluster are evaluated in respect to their morphology.
Fraction of Non-Proliferating Cells/Nuclei and Proliferating Cells/Nuclei
Based on the identified non-proliferating and proliferating cells/nuclei, the fraction of proliferating cells/nuclei is calculated:
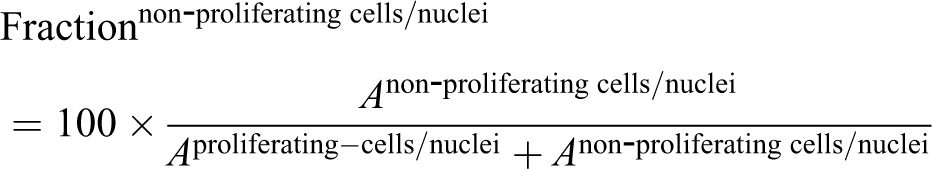
where as A denotes the total area (in pixel) of the identified proliferating and non-proliferating cells/nuclei.
The fraction of proliferating cells/nuclei (fractionproliferating−cells/nuclei) is calculated as 100 − fractionnon-proliferating−cells/nuclei and is being reported as the LI and expressed in (%).
The number of cells/nuclei, which are considered for the calculation of the fraction of proliferating cells/nuclei (fractionproliferating cells/nuclei) is being estimated by the total area A of identified cells divided by the size of an average cells/nuclei. The size of the average cell/nuclei was estimated by analyzing the photomicrographs used as training set for either the classifier or the development of the CEPA software. The average cell/nuclei size was 194 pixel.
Selection of Region of Interest
The automatic identification of cells of interest had often detected nonglandular compartments (connective and adipose tissue), and unfortunately, they were considered as glandular cells. Although the miss-classified nonglandular compartments were only smaller portions of all nonglandular compartments within the whole image, the obtained portion of proliferating cells was not correctly determined. Therefore, the possibility of user intervention was implemented whereby the user is able to manually annotate the nonglandular tissue and removing it from further analysis (Figure 3). This has significantly improved the precision and specificity of the overall analysis.
Selection of false classified ROI (upper right image) and the possibility to remove manually these regions (bottom). The resulting ROIs were considered for further analysis. ROI indicates regions of interest.
Software
Development, testing, and validation of the CEPA software was done in MATLAB (version R2013a, Mathworks Natick, MA). The training of the classifier was performed in R© (version 3.4.1 (2017-06-30)) 45 using the caret (classification and regression training) package. 46 Scatterplots and other plots were created in ggplot (ggplot2, version 3.1.0). 47 The Bland-Altman plots and respective histogram distribution were obtained by using ggExtra (version 0.8), 48 The regression analysis was performed using gam (version 1.16). 49
Validation Procedure
A validation protocol was created for the study in order to predefine the criteria for accuracy, specificity, and reproducibility. In general, the results of LI obtained by manual counting from 10 different rats were compared to those from the usage of the CEPA software. With regard to accuracy, it was defined that the differences of absolute LI values obtained by the CEPA software from manual counting results for the same animal should not exceed 10% LI. In addressing the reproducibility of results obtained from the CEPA software, the LI values obtained by 2 independent users (on different workstations and different days) were compared. The absolute difference of the LI obtained by the independent users should not exceed 5% in order to pass our reproducibility criteria. Concerning specificity, the goal was that only epithelial cells of the mammary gland are considered.
Statistical Analysis
The reliability of the LI obtained by the application of the CEPA software by 2 independent trained user and manual counting was evaluated. Therefore, Bland-Altman and scatterplots were created to investigate the reproducibility of the LI acquired. The difference between manual counting and the results obtained by the usage of the CEPA software by 2 trained users were calculated and plotted as histograms within the Bland-Altman plot. Further, the calculated distribution was tested for normality (Shapiro-Wilk Test) and P < .05 were considered to be significant. Linear regression analysis was performed in order to assess the reproducibility of the results obtained by the usage of the CEPA software and manual counting.
The comparison of the 2 methods were considered to agree, if the R 2 values were greater or equal to 0.9. Furthermore, the absolute difference of the LI values for the same animal should not exceed 10%. In addressing the reproducibility of results obtained from the CEPA software, the LI values obtained by 2 independent users (on different workstations and different days) were compared. The absolute difference of the LI obtained by the independent users should not exceed 5% in order to pass our reproducibility criteria. Concerning specificity, the goal was that only epithelial cells of the mammary gland are considered.
Availability of the CEPA Software
The CEPA software is open-source and can be obtained on request by contacting the authors.
Results
The performance of the CEPA software was validated concerning accuracy, reproducibility, and specificity. To achieve this, we analyzed 93 photomicrographs from mammary gland sections of 10 female rats were taken from randomly chosen fields. To obtain the required statistical power a total number of 1000 to 1500 epithelial cells from 10 photomicrographs per rat were investigated. 9,44 We used the LI results from the CEPA software to compare them with the respective LI results obtained by manual counting. The comparison was conducted on the level of the photomicrographs and not at the level of the individual rats. Hence, the proliferative activity was indicated as LI per photomicrograph.
The images were loaded into the CEPA software and were evaluated by 2 independent trained users (termed CEPA user 1 and CEPA user 2). The obtained LI per photomicrograph is shown in the Supplementary Table 1 The results from the 2 CEPA users were compared to those obtained by manual counting of the same photomicrograph in order to assess the accuracy and reproducibility of the developed CEPA software. The deviation of the LI obtained by the usage of the CEPA software from those of manual counting as described in methods, did not exceed ±10%, which is the known interindividual variation when manual counting was carried out. 40 The absolute differences of mean LI of the usage of the CEPA software with manual counting was 3.12% for CEPA user 1 and 3.05% for CEPA user 2. Even the maximum absolute differences of the LI were in the range of ±10%. The maximum absolute differences were 9.24% for CEPA user 1 and 9.36% for CEPA user 2. In addition, a linear regression analysis have been performed. In Figure 4, the comparison is shown as a scatter plot. A linear line fitted to the data, qualitatively supports (R 2 = 0.91) the visual impression that there is a good correlation of the results obtained by the usage of the CEPA software compared to manual counting. The estimated slope s of the line is greater than 1 (s = 1.05 [CEPA user 1 vs manual counting] and s = 1.03 [CEPA user 2 vs manual counting]).
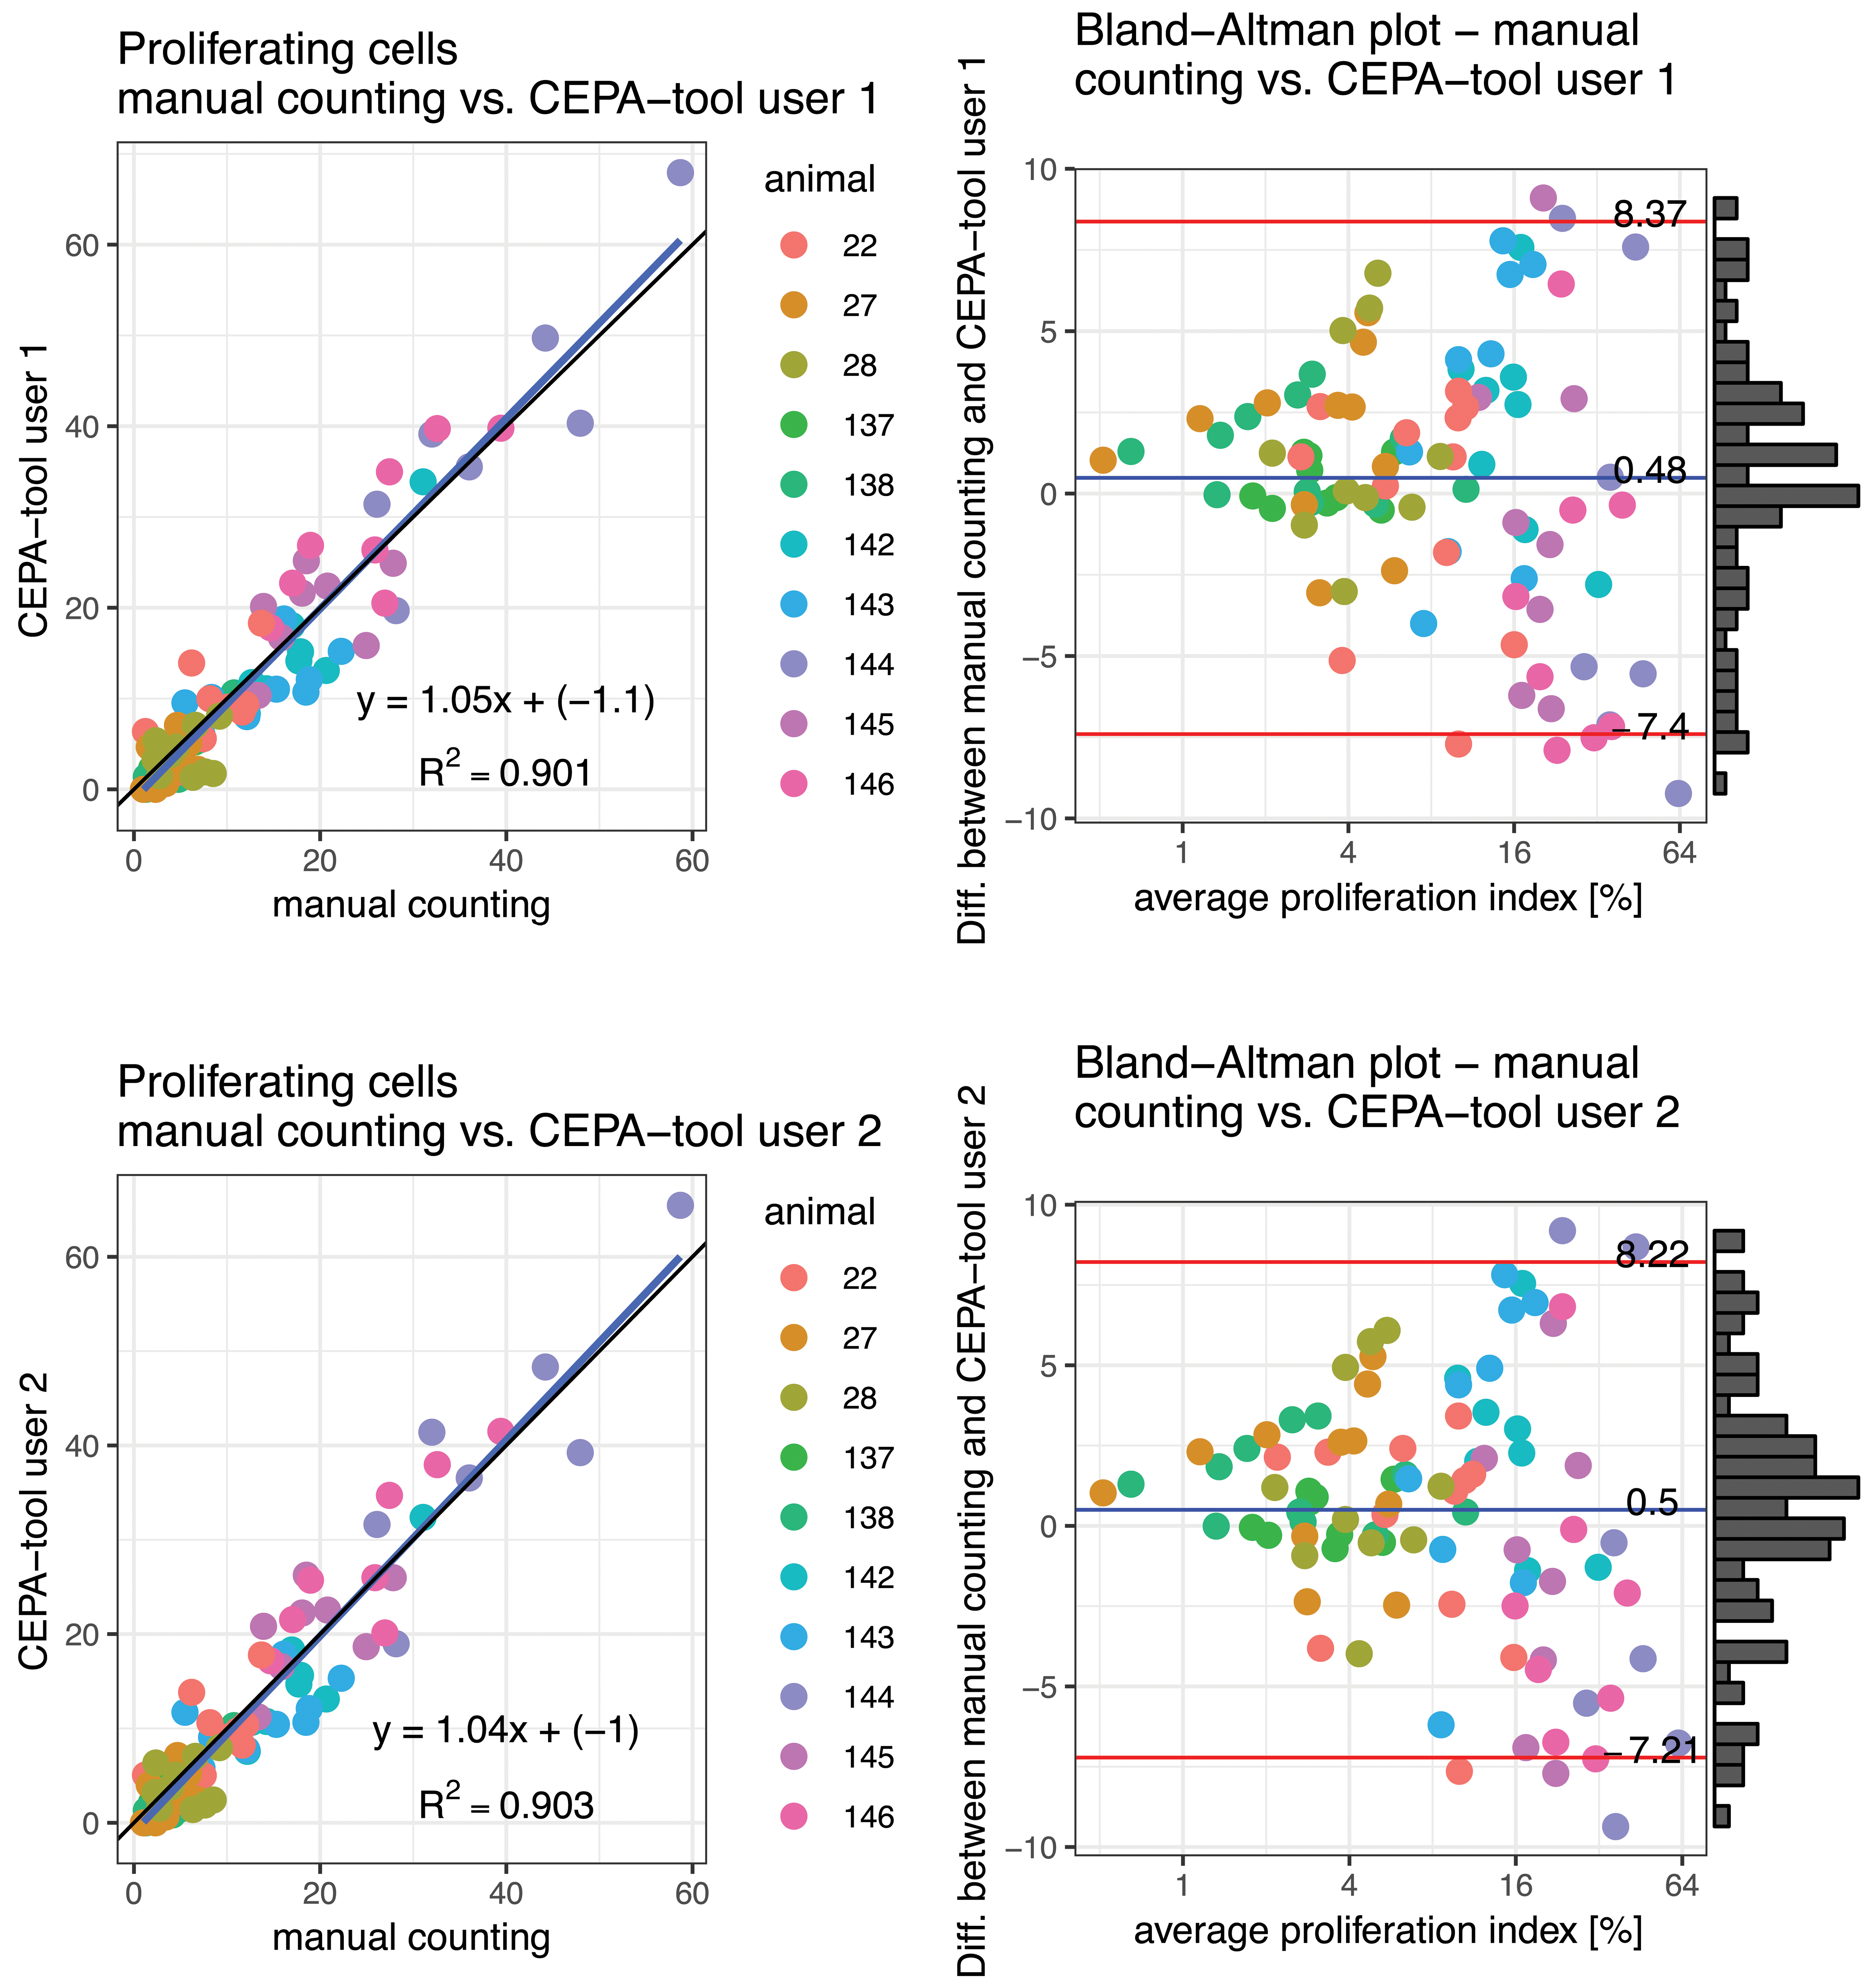
Comparison between manually determined fraction of non-proliferating cells with results obtained by CEPA software is shown in the scatter plot. The graphical comparison indicates a linear correlation between both methods (r2 = 0.901 and r 2 = 0.903) with slope s ≈ 1.05 (s = 1.05 and s = 1.04). According to the slope s >1.0, CEPA software is overestimating the fraction of proliferating cells. The respective Bland-Altman plots are shown for each comparison. The average proliferation index (%) is shown in log (base 2) scale, because most of the measurements are smaller than 16%.
According to the Bland-Altman plot (Figure 4), the differences between manual counting and the results obtained from the CEPA software were for small LI values <3% very low. For the LI values >3%, the difference was quickly increasing to the level of the 95% confidence interval [CI]. The differences between the results of manual counting and the usage of the CEPA software were tested to be normally distributed (Shapiro-Wilk test). The overall mean difference was in the range of 0.5 (manual counting vs CEPA user 1 = 0.5 and manual counting vs CEPA user 2 = 0.48). In general, manual counting resulted in a 0.5 higher LI (%) compared to the usage of the CEPA software. The generally higher LI of manual counting might be the result of some unconscious bias of the judgment of the red-stained proliferating cells. 50,51
In contrast, the average difference of the results of the trained CEPA software users was 0.02% (Figure 5). In order to assess the reproducibility of the results obtained by the usage of the CEPA software, the LI obtained from the 2 independent CEPA users operated on different workstations and different days were compared to each other. The absolute differences between both CEPA users in terms of mean LI ranged between 0.01 and 0.8%. Further, the differences of the LI results obtained by 2 independent user of the CEPA software was even lower as expected. The differences of the absolute LI values were clearly lower than the predefined acceptance threshold of 5% defined in the validation protocol. The average of the absolute difference of the LI (|LICEPA-user1 − LICEPA-user2|) was 0.526%. The absolute min/max differences of the LI were 0 and 2.8% (Figure 5).
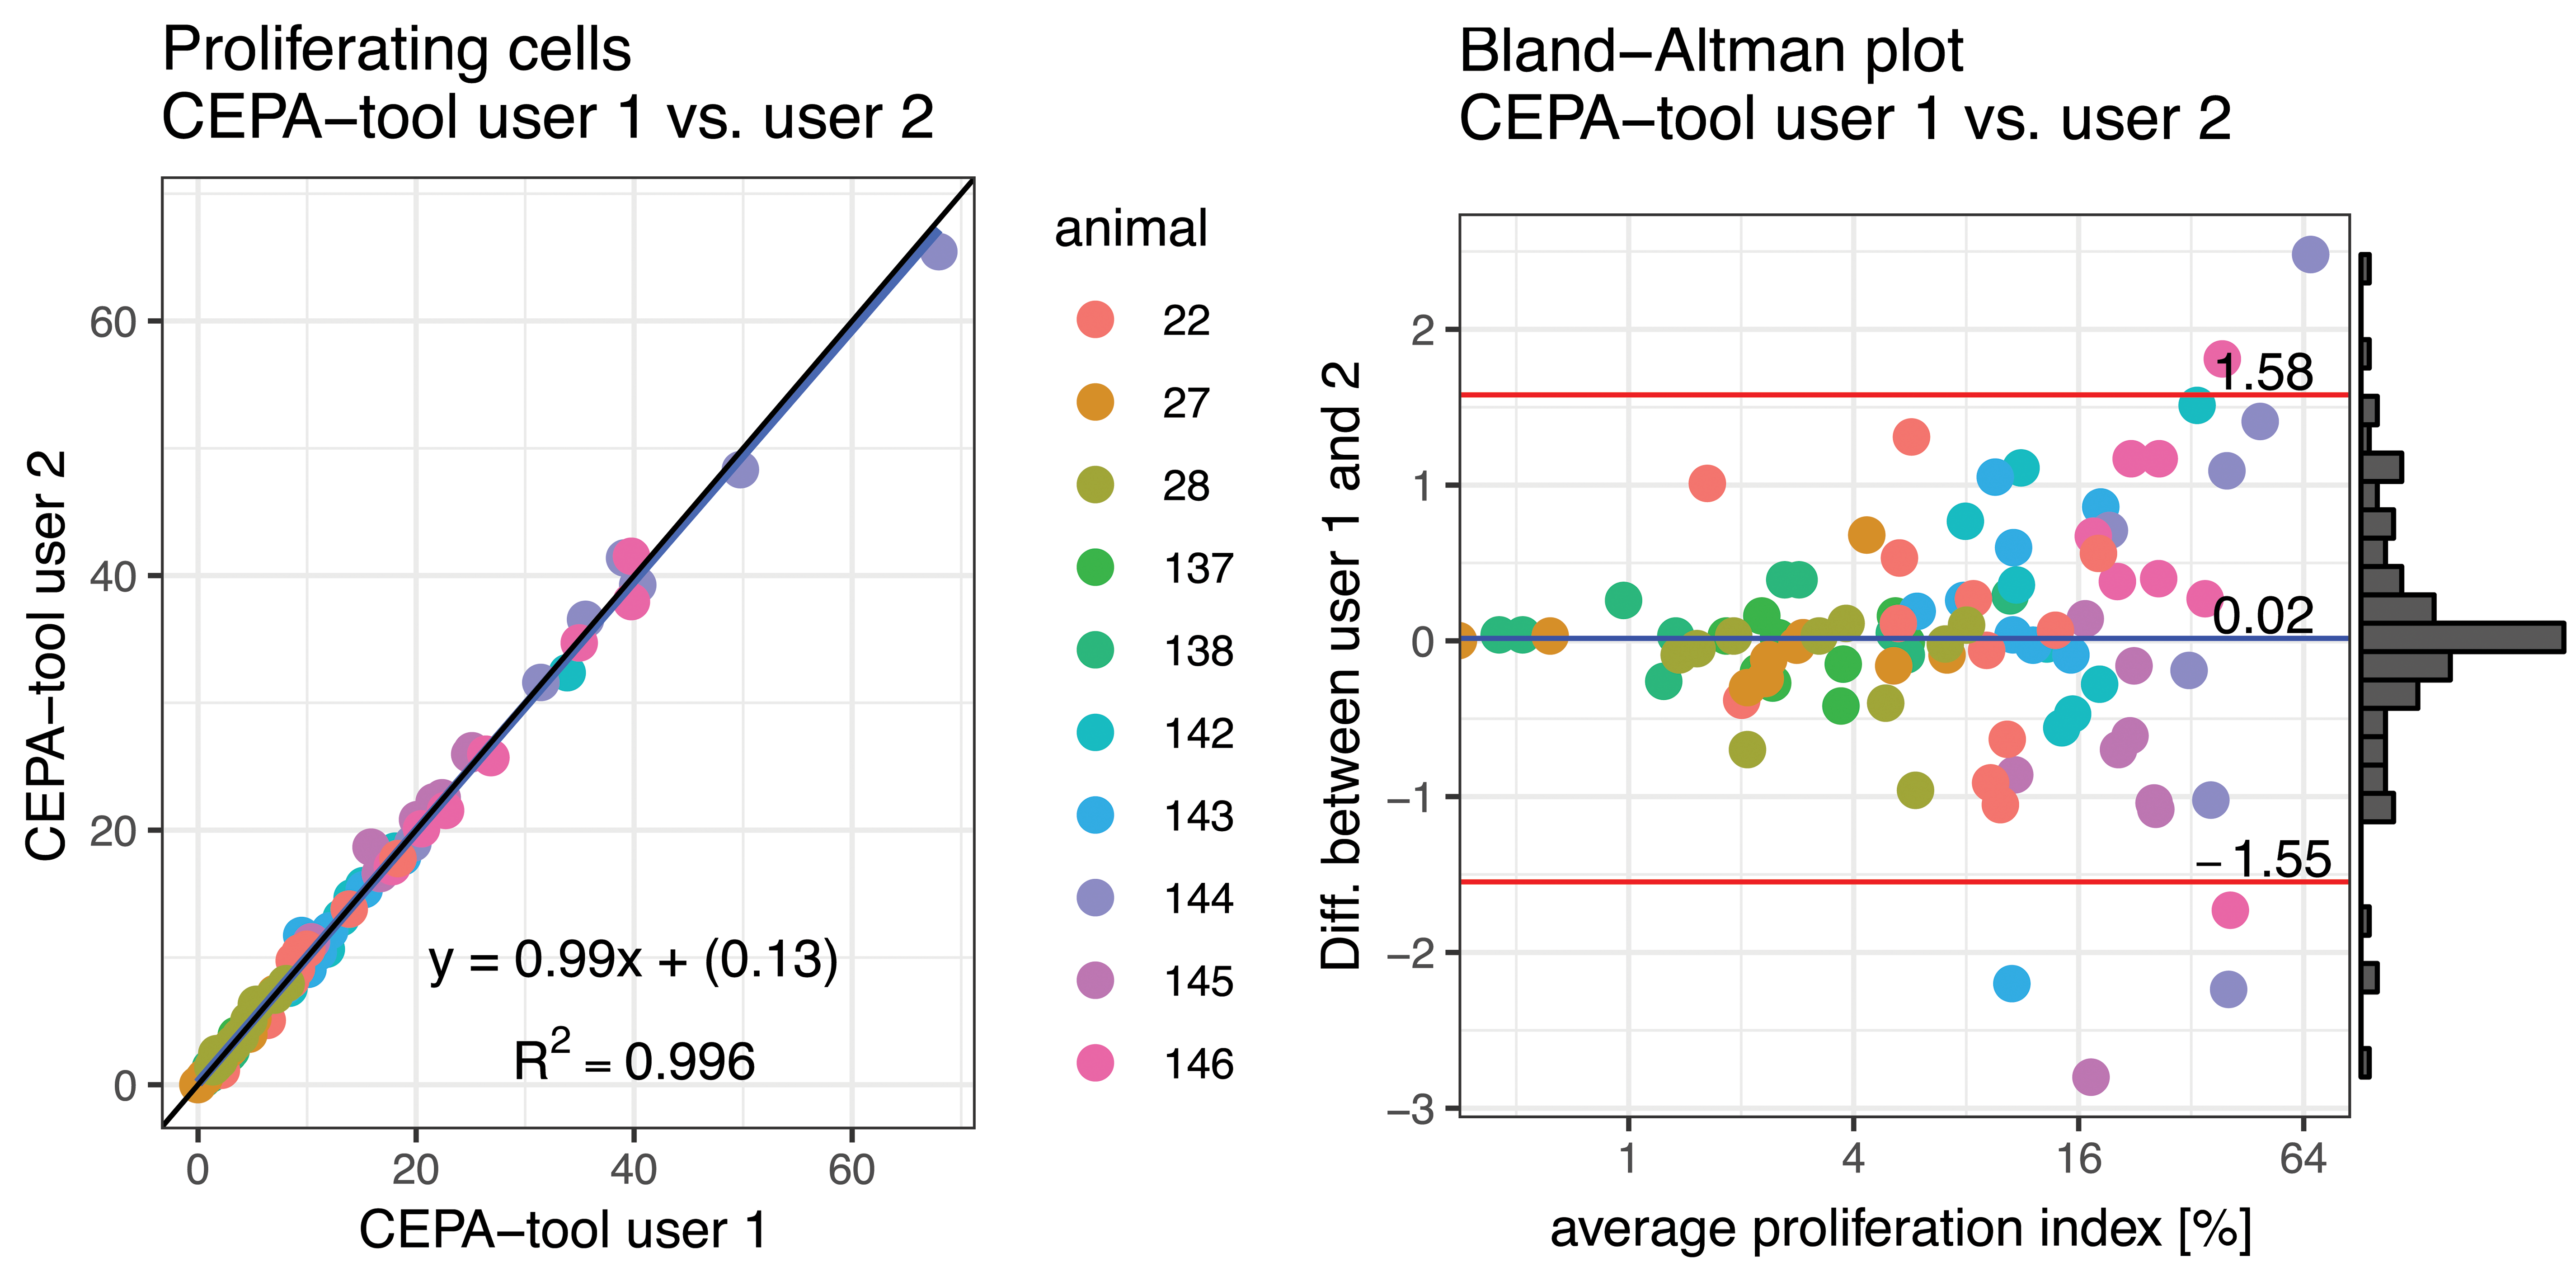
The fraction of non-proliferating cells obtained by the usage of CEPA software by 2 independent trained user is shown in the scatter plot. The graphical comparison indicates a linear correlation between both user (r 2 = 0.996 and slope s = 0.99). The slope s ≃1.0 indicate an excellent reproducibility of the usage of CEPA software by trained users. The Bland-Altman plot illustrates a narrow 95% confidence interval (CI): −1.6 to 1.6 The average proliferation index (%) is shown in log (base 2) scale because most of the measurements are smaller than 16%.).
The software was optimized by incorporating manual intervention. This means that the user has to verify the marked nonepithelial cells and has to exclude them manually from the ROI. As a consequence, the specificity is guaranteed as each photomicrograph is evaluated by an expert, and therefore, the selectivity is increased.
Discussion
Over the past few decades, continuous efforts have been put on development of insulin analogs, which compared to basal insulins have a favorable metabolic profile. The interplay of insulin with insulin- and IGF-receptors, which are also associated with cell proliferation, is critical for developing the metabolic function. Because of this interplay and critical role of associated receptors in cell proliferation, it has been suspected that insulin analogs might enhanced frequency of cell proliferation and hence induce tumor development. 20,21,52 Because of this, there is an increasing demand by drug developers for pathologists to provide objective preclinical data that will help to guide development of new insulin therapies while mitigating the risk of molecules with enhanced mitogenic potential. To meet this need, we developed and validated a computerized image analysis system that allows detecting objectively cell proliferation in rat mammary glands. The CEPA software was proven to be a valid and reliable tool for the semiautomated detection and quantification of proliferating cells in mammary gland slides stained with Ki-67 immunohistochemistry. The predefined criteria set in the validation protocol for accuracy and reproducibility was met during the validation process, when compared to manual pathologist’s counting. In order to achieve the criteria for specificity, we modified the software to a semiautomated approach, in which an additional manual inspection step was introduced to exclude nonepithelial cells of the connective and adipose tissues of the investigated tissue from the ROI. Additionally this optimization step ensures that every image is evaluated by the trained user, which can be seen as a quality control step. Although the CEPA software requires manual intervention, the difference of the obtained LIs by 2 trained users of the CEPA software was remarkably low (95% CI [−1.6% to 1.6%]). The definition of the acceptable variation range of LI was another important factor to consider. There are very few published studies that address this in their investigations. Primarily, Persohn et al 2007 40 highlighted this in their work when they validated an automated image analysis software. They applied a range of ±10% for the validation of their software, which was developed to detect intestinal cell proliferation of rats. This range in turn was derived from interindividual variation when regular manual counting was carried out. Taking this criterion as a bar we obtained LIs ranged clearly below 10% and provided the accuracy of our automated procedure. Moreover, the LIs we obtained with our automation system were within the range of controls that are listed in the CEPA database 53 for mammary gland. Another validation criterion in our study was satisfactory reproducibility. In order to achieve reproducibility, we had defined a variation threshold of ±5%, which we outperformed with ±1% variation between 2 independent users. In conclusion, we present here an automated system that was developed for semiautomated image analysis and passed all statistically relevant quality criteria.
Although we developed and designed the CEPA software for the image analysis of mammary gland tissue slides but due to the modular design of the CEPA software, the tool can be easily adopted for the analysis of other tissue types and organs. Our developed and validated CEPA software is noncommercial, and we will make it accessible to scientific community. The software package is set in a way that and scientists can easily adopt and integrate it to their internal network platforms for routine operation.
Supplemental Material
Supplemental Material, DS1_TPX_10.11770192623319863129 - Development and Validation of an Image Analysis System for the Measurement of Cell Proliferation in Mammary Glands of Rats
Supplemental Material, DS1_TPX_10.11770192623319863129 for Development and Validation of an Image Analysis System for the Measurement of Cell Proliferation in Mammary Glands of Rats by Klaus Lindauer, Thomas Bartels, Petra Scherer and Mostafa Kabiri in Toxicologic Pathology
Footnotes
Authors’ Note
In this context the CEPA-software is not directly related to the Industry Working Group of Pharmaceutical Companies focusing on Cell Proliferation and Apoptosis (CEPA). However, the name CEPA-software was chosen, because our work on this software was inspired and scientifically supported by the discussions within the CEPA, a subgroup of RITA (Registry of Industrial Toxicology Animal data).
Author Contributions
K.L. developed the image analysis algorithm of CEPA software, designed the graphical user interface, and performed the analysis of the validation results. T.B. performed and supervised the validation procedure of CEPA software. P.S. and T.B. performed all the experiments, the manual counting of the photomicrographs of the mammary gland slides and the validation procedure. M.K. initiated and supervised the development of the CEPA software. All authors wrote the manuscript.
Declaration of Conflicting Interests
The author(s) declared no potential conflicts of interest with respect to the research, authorship, and/or publication of this article.
Funding
The author(s) received no financial support for the research, authorship, and/or publication of this article.
Supplemental Material
Supplemental material for this article is available online.
References
Supplementary Material
Please find the following supplemental material available below.
For Open Access articles published under a Creative Commons License, all supplemental material carries the same license as the article it is associated with.
For non-Open Access articles published, all supplemental material carries a non-exclusive license, and permission requests for re-use of supplemental material or any part of supplemental material shall be sent directly to the copyright owner as specified in the copyright notice associated with the article.