
Abstract
Treatment with drugs from multiple classes induces vascular injury with medial necrosis, hemorrhage, endothelial damage, and inflammation. Previous research has suggested early events might be occurring well in advance of the full lesions that appear forty-eight to seventy-two hours after dosing with SCH 351591, a PDE IV inhibitor. This study was performed to study early events in detail. Rats were dosed with 20 mg/kg of drug by gavage and sacrificed at times between fifteen and 240 minutes after dosing. Tissues were collected for histopathological analysis and gene expression studies. Serum was collected for biomarker analysis. The data from biomarker analysis showed a three-part response with an early phase that was maximal at fifteen to thirty minutes, a second phase from forty-five to 180 minutes, and the third phase that was starting to rise at four hours. The first phase included increases in lymphocytes, serum histamine, and serum nitrite. The second phase shows continued elevation of serum nitrite. The third phase was marked by an increase in serum GRO/CINC-1. At fifteen minutes, histopathology showed activation of mast cells, but not degranulation. Increases in endothelial activation and perivascular inflammatory cells were first apparent at thirty minutes and increased through 240 minutes.
Introduction
Drug-induced vascular injury (DIVI) to mesenteric arterioles in the rat associated with phosphodiesterase inhibitors (PDEi) was first known to have been reported in a long-term study of caffeine, a nonspecific PDEi. After eighty weeks of dosing, extensive fibrinoid necrosis, severe inflammation, and extensive narrowing of the vessel lumen were observed. Four of the thirty rats in the caffeine-only and three of thirty in the caffeine and phenacetin group died from massive intra-abdominal hemorrhage owing to rupture of the vessels (Johansson 1981). Similar results were observed in a chronic study of another nonspecific PDEi, theophylline (Collins et al. 1988) and confirmed in a second study (Nyska et al. 1998).
Vascular injury can also be caused by exposure to supra-physiological doses of endogenous mediators including vasopressin (Byrom 1937), L-norepinephrine (Joris and Majno 1981), angiotensin (Vitullo, Gerrity, and Khairallah 1985), and dopamine (Kerns, Arena, and Morgan 1989). Morphologically similar injury has also been reported following electrically induced vasoconstriction (Kamio 1972).
Studies with more specific PDEi showed that DIVI was observed following treatment with PDE IIIi (Hanton et al. 1995), PDE IVi (Larson et al. 1996), and PDE Vi (Shim et al. 2001). In addition to the fibrinoid necrosis and inflammation observed with caffeine or theophylline, frank medial hemorrhage was also reported. Drugs in other classes have also been shown to cause histologically similar lesions. These drugs include the K+ channel opener minoxidil (Joseph 2000), the dopaminergic compound fenoldopam (Kerns, et al. 1989), and the endothelin receptor antagonist CI-1020 (Albassam et al. 1999).
The time course of events during the development of DIVI is not well understood. Cellular perivascular inflammatory infiltration by mast cells, followed by granulocytes, monocytes, and lymphocytes, is seen following treatment with the PDE IIIi SKF 95654 and is detectable by histopathology within one to two hours of dosing (J. Zhang et al. 2002). Previous studies have shown that systemic changes in blood pressure can be detected in the same time range; however, in that study, histopathological changes were not seen until twelve hours postdosing (Joseph, Rees, and Dayan 1996). For both studies, the inflammatory infiltrate was a mixture of granulocytes and monocytic cells. Our previous study with the PDE IVi SCH 351591 showed that events were discernable as early as one hour postdosing (Weaver et al. 2008; J. Zhang et al. 2008).
The research in this study was undertaken to make a more complete examination of the early events following administration of a dose of PDE IVi known to lead to fully developed DIVI. An additional goal was to determine whether knowledge of the early events might lead to additional insight into the pathogenesis of this form of toxicity. The data show that DIVI is a not a singular happening, but rather a sequence of events involving endothelium, vascular smooth muscle and the innate arm of the immune system.
Materials and Methods
Animals
Sprague Dawley rats, 175–200 g, were purchased from Harlan, Inc (Indianapolis, IN, USA) and were housed individually. Rats were fed Certified Purina Rodent Chow #5002 (Ralston Purina Co., St. Louis, MO, USA) and water ad libitum. The experimental protocol was approved by the Institutional Animal Care and Use Committee, Center for Drug Evaluation and Research, FDA and conducted in an AAALAC-accredited facility. All procedures for animal care and housing were in compliance with the Guide for the Care and Use of Laboratory Animals (Institute of Laboratory Animal Resources 1996).
Chemicals
The phosphodiesterase IV inhibitor SCH 351591 was provided by Schering-Plough Research Institute. The compound was suspended in phosphate buffered saline (PBS) for administration.
In Vivo Studies
Animals were dosed by oral gavage with a volume of 1 mL. All treated rats were dosed at 20 mg/kg, and controls received vehicle alone. Five animals were dosed for each time point using a staggered dosing schedule so that each animal was sacrificed at the correct time. At the indicated time points, the rats were anesthetized with isofluorane and exsanguinated. Blood and tissues for RNA expression analysis were placed in RNAlater (Ambion, Inc, Austin, TX, USA) and then stored at −20°C until analysis. Serum for biomarker analysis and tissues for histopathology were collected and stored as previously described (J. Zhang et al. 2008).
Serum Nitrite
The measurement of serum nitrite was performed using the Total Nitric Oxide Assay (R&D Systems, Inc., Minneapolis, MN, USA) according to the manufacturer’s instructions. Since nitric oxide (NO) is metabolized to nitrite (NO2 −) and nitrate (NO3 −), the determination of total serum nitrate and nitrite concentration in this assay provides a quantitative measurement of nitric oxide generated by nitric oxide synthesis. Serum samples were diluted twofold and passed through a 10 kD molecular weight filter (Biomax-10, Millipore, MA, USA) before measurement. The optical density (OD) was measured at 540 nm.
Biomarkers
Hematology parameters were measured with a VetScan HMT analyzer (Abaxis Inc, Union City, CA, USA). Serum for all biomarker assays was stored at −70°C until used. The mast cell marker beta-hexosaminidase was measured in serum using a colorimetric method (adapted from Xiang and Nilsson 2000). Briefly, serum was incubated with p-nitrophenyl N-acetyl-β-D-glucosaminide for sixty minutes. The reaction was stopped with pH 10 carbonate buffer, and absorbance was read at 405 nm. The following sandwich enzyme-linked immunosorbent assay kits were used to measure these biomarkers: rat interleukin-6 (IL-6), (BioSource International, Camarillo, CA, USA); rat GRO/CINC-1 (human CXCL-2 homolog); and histamine and serotonin (IBL-America, Minneapolis, MN, USA).
Histopathology
Tissues were fixed in 10% buffered formalin and then embedded in paraffin, sectioned, and stained with hematoxylin and eosin as previously described (J. Zhang et al. 2008).
mRNA Evaluation
Rat mesentery for array analysis was dissected free of the intestines, fat, and lymph nodes. Heart tissues were used as collected. In both cases, tissues were immediately placed in RNAlater and frozen for later analysis. For RNA extraction, tissues were homogenized in the Tissuelyzer (Qiagen, CA, USA) for two minutes at 30 Hz, and RNA was subsequently extracted using the Qiagen RNeasy Micro kit according to manufacturer’s instructions. For gene expression analysis, RNA from three biological samples at the fifteen-minute and the four-hour time point were analyzed. Five micrograms of total RNA from each sample was processed and hybridized to the Affymetrix rat genome 230 2.0 GeneChip according to manufacturer’s instructions.
Results
Early Biomarkers
The data consistent with a very early event are shown in Figure 1. This early phase appears to be in the first thirty min following drug administration. Serum nitrite is significantly elevated at fifteen and thirty minutes (Figure 1A). Peripheral blood lymphocyte numbers (Figure 1B) showed a significant elevation at fifteen minutes, but changes at other times were not statistically different from control. Histamine in serum (Figure 1C) was elevated early, with a significant elevation at thirty minutes. The data for β-hexosaminidase (Figure 1D) show an apparent early elevation at fifteen and thirty minutes, however, the changes were not statistically significant.
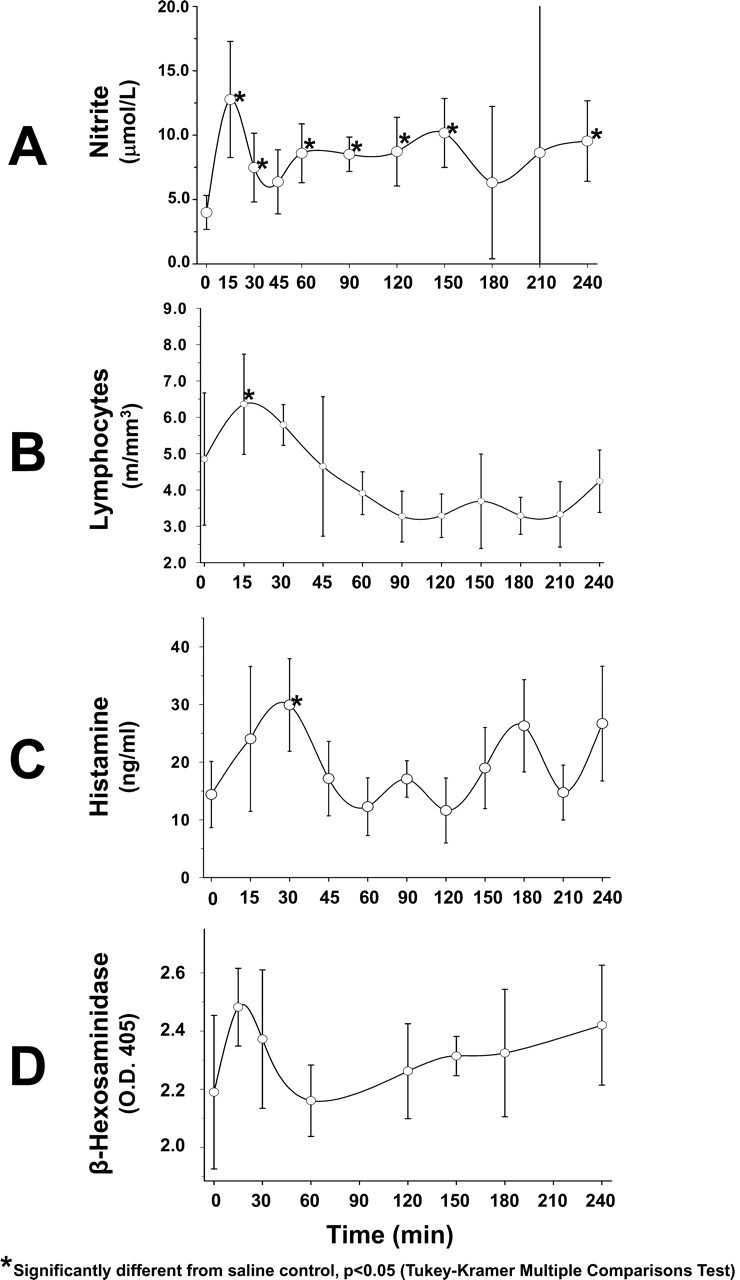
Early biomarkers in vascular injury caused by 20 mg/kg of SCH 351591. (A) Serum nitrite. (B) Peripheral blood lymphocytes. (C) Serum histamine. (D) Serum β-hexosaminidase. All times are minutes after administration of drug.
Intermediate Biomarker
The intermediate time phase covers time points from approximately 45 minutes to 180 minutes. The only biomarker that was elevated in this time window was serum nitrite (Figure 1A).
Later Biomarkers
A third pattern of response was detected with other biomarkers. The cytokine GRO/CINC-1 (Figure 2A) showed no changes early but showed a clear elevation at the four-hour time point. A similar pattern was observed in circulating granulocyte numbers (Figure 2B) with no remarkable findings in the early time points but a late rise, starting about 210 min and reaching statistical significance at four hours.
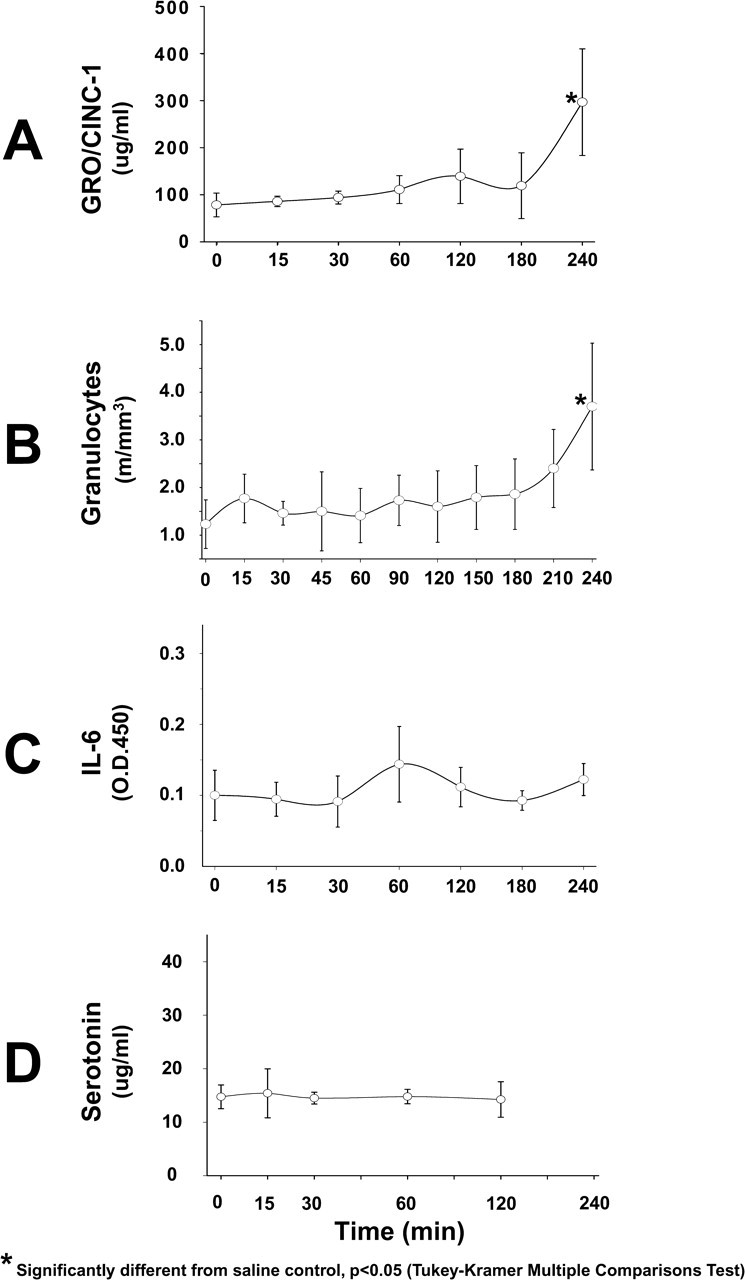
Later biomarkers in vascular injury caused by 20 mg/kg of SCH 351591. (A) Serum GRO/CINC-1. (B) Peripheral blood granulocytes. (C) Serum IL-6. (D) Serum serotonin. All times are minutes after administration of drug.
We also measured IL-6 (Figure 2C) and serotonin (Figure 2D) in serum and did not observe any significant changes at the time points measured in this study.
Histopathology
Increasing changes in histopathology were observed at all times from fifteen minutes through four hours (Figure 3). The changes are consistent with an immediate and gradually increasing inflammatory response.
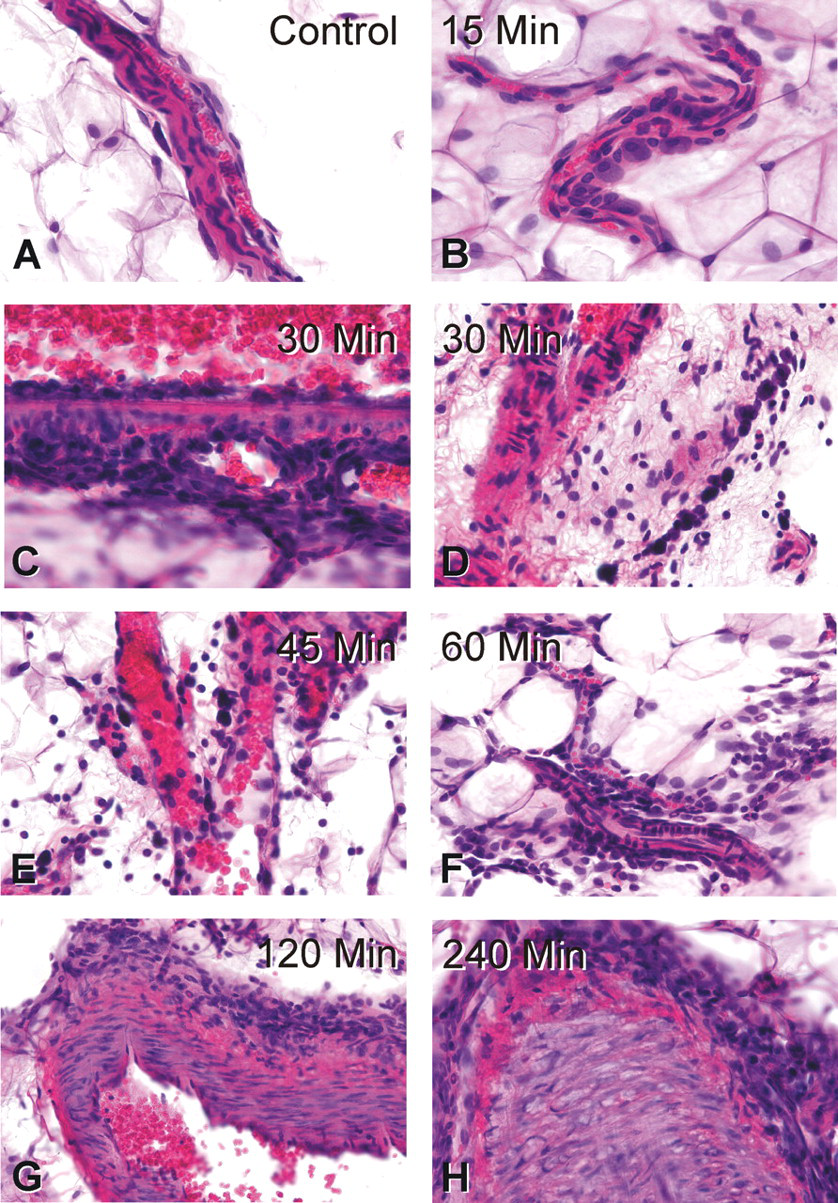
Photographs of hematoxylin and eosin–stained sections (400×) showing SCH 351591-induced inflammatory response of the mesenteric blood vessels in rats. (A) Treatment of rat with saline: no inflammatory response. The resident mast cells that are elongated in shape with intensely staining nuclei. (B) Fifteen minutes after administration of SCH: increase in the size of mast cells and apparent nuclear decondensation consistent with mast cell activation. (C) Thirty minutes after administration of SCH: a blood vessel wall in small vein with endothelial cell activation and inflammatory cells in the media. (D) Thirty minutes after administration of SCH: significant increase in the size, the number and the basophilia of mast cells indicates extreme activation of mast cells and recruitment of small lymphocytes, mononuclear cells and eosinophils. (E) Forty-five minutes after administration of SCH: significant dilatation of mesenteric capillaries, MC activation, and emigration of leukocytes from capillary lumen into the mesenteric matrix. (F) Sixty minutes: significant recruitment of eosinophils, neutrophils, and mononuclear cells at the periphery of arterioles and capillaries. (G) One hundred twenty minutes after administration with SCH: perivascular inflammation at site of periphery of small-sized artery. (H) Two hundred forty minutes after administration with SCH: severe perivascular inflammation at site of periphery of large-sized artery.
Mast Cells
In control animals, numerous mast cells are observed along the outside of small blood vessels (Figure 3A). These cells have a small to moderate amount of cytoplasm and condensed nuclei. At fifteen minutes, mast cells immediately adjacent to the small arterioles appear to be increased in size and the nuclei were larger and less intensely stained (Figure 3B) in comparison with saline-treated rats (Figure 3A). This change was observed at all times out to four hours. Degranulation of mast cells was not observed at any time point in this study. Apparently increased numbers of mast cells were also seen although formal counting was not performed. The increasing infiltration of other leukocytes over time makes it difficult to determine if this change continued throughout the study period.
Vascular Alterations
Dilation of both arterioles and venules was observed beginning at fifteen minutes and continued throughout the observation period. The vascular endothelial cells showed apparent activation, as evidenced by expansion of cytoplasm and rounding (Figure 3C). This change was first observed at thirty minutes after dosing and was observed at all time points thereafter.
Infiltrating Leukocytes
A progressive cellular inflammatory response was observed. At thirty minutes, a limited number of mononuclear cells was seen around some venules (Figure 3C, 3D). This response extended to arterioles and capillaries at forty-five minutes (Figure 3E). The initial granulocyte response was also seen at thirty minutes with the appearance of a few eosinophils in the perivascular area. Neutrophils were first seen starting at 60 minutes after drug administration. During the period from sixty to 240 minutes, the perivascular cellular inflammation became more severe and shifted proportions to a majority eosinophilic response (Figure 3F, 3G). At 240 minutes, the severity of the inflammation continues to increase (Figure 3H).
mRNA Changes
At the fifteen-minute time point, no significant changes were observed. At the 240-minute time point, α-amylase and pancreatic trypsin 1 (Amy1, 46 fold; Prss1, sixteen-fold) were strongly upregulated in the mesentery. In addition, the enzymes chymopasin (Ctr1, fourteen-fold) and elastase 2 (Ela2, fourteen-fold) were also elevated. Three genes in the same pathway (Dbp, six-fold; Nr1d1, seven-fold; Nr1d2, three-fold) were upregulated. In heart tissue, Per1 and Dbp were seen to be upregulated to a similar extent.
Discussion
The results of this study show that the early events in the development of DIVI can be separated into three phases. The early phase occurs in the first thirty minutes following administration of this compound. A second phase covers the forty-five– to 180–minute period, followed by the initial appearance of protein biomarkers first observed at 210 minutes.
The very rapid response following oral administration is consistent with published pharmacokinetic data on SCH 351591 (Billah et al. 2002). That study showed a very rapid rise in plasma concentration following oral administration. The plasma concentration reached 75% of maximum within thirty minutes of dosing, which suggests that the effects seen at fifteen minutes could plausibly be directly caused by the administered compound.
The first phase of the response to the PDE IVi takes place in the zero to thirty-minute time period. It is characterized by apparent migration and activation of mast cells around mesenteric blood vessels as seen by histopathology. This finding is similar to the increase in mast cell number observed following PDEIIIi treatment (J. Zhang et al. 2002), although on a faster time course. The activation is also suggested by the changes in levels of histamine, β-hexosaminidase, and total nitrite in serum, as well as the possible disturbance in circulating lymphocyte numbers. This appears to be a secretory event, as degranulation of mast cells was not observed in the zero to four-hour time frame in this study as well as in the same time frame in our previous study (J. Zhang et al. 2008). It has previously been shown that mast cells can release mediators without undergoing degranulation (see Chapter 7 in Dvorak [2005] for a review of this topic).
The source of serum nitrite cannot be clearly determined. Both eNOS (NOS3) and nNOS (NOS1) are constitutively expressed in or immediately adjacent to mesenteric vasculature. The expression of nNOS is reported in both nerve fibers and resident mast cells, whereas eNOS is primarily in vascular endothelial cells (Kashiwagi et al. 2002). Nonlocal sources of NO could be from nNOS found in resting neutrophils, but not monocytes (Greenberg et al. 1998).
The lymphocyte response could be a direct effect mediated by PDE IV (Landells et al. 2001) or a secondary effect mediated by either histamine via the H4 receptor (M. Zhang, Thurmond, and Dunford et al. 2007) or by nitric oxide (Niedbala et al. 2002). The increase in numbers of circulating lymphocytes at fifteen minutes is clearly a result of movement of lymphocytes into circulation from a site such as the spleen or bone marrow. The subsequent reduction back to baseline by forty-five minutes is consistent with alterations in trafficking.
The second phase covers from forty-five minutes out to 180 minutes. This segment is characterized by gradually increasing inflammatory changes in the tissue, but no changes in any of the biomarkers that were evaluated in this study. The histopathology showed increasing perivascular infiltration of leukocytes shifting to a more eosinophilic mixture.
The third phase starts at about 210 minutes and represents the beginning of increases in serum biomarkers, especially GRO/CINC-1. The observed change in GRO/CINC-1 confirms our previous observation that this cytokine appears to be an early responder in the main phase of the development of DIVI lesions (Weaver et al. 2008). This increase in serum GRO-1 was not associated with an obvious increase in GRO-1 mRNA in this study.
A number of mediators showed no detectable response in the time window evaluated for this study. Serotonin was selected, as rat mast cell granules are known to have significant amounts of serotonin (Pihel et al. 1995). We did not detect a change, however, the background level was quite high and the variation among animals was such that it would be difficult to detect the small change seen with serum histamine where the background was much lower. We also looked at IL-6 based on our findings in a longer-term study (Weaver et al. 2008). In that study, a nonsignificant increase was seen at the one-hour time point. No change was seen in IL-6 levels in this study, suggesting that this cytokine may not be involved in the early events of DIVI.
The changes in mesentery measured by gene array are quite limited in the present study. Four of the genes are for degradative enzymes (Amy1, Ctrl, Ela2, Prss1). Similar changes were observed in laser-dissected endothelial region cells from fenoldopam-treated rats (Dalmas et al. 2008). The cause of these changes is uncertain, as mast cells have been shown to contain dopamine, among many other mediators (Yong 1997). The modulation of Per1 has been reported to be a direct result of PDE IV inhibition (Masumoto et al. 2003), and it is observed to be upregulated in heart in the present study. Per1 would seem to be a potential candidate biomarker for vascular injury. Regulation of Dbp, Nr1d1 and Nr1d2 has been shown to be affected by Per1 (Kamphuis et al. 2005; Mühlbauer et al. 2004).
In conclusion, the data demonstrate that with the PDE IVi SCH 351591, there are responses to the compound as early as fifteen minutes after oral gavage administration of the compound. The changes show that the inflammatory response is initiated very early and that local cellular infiltration is seen in advance of the appearance of circulating biomarkers. Apparent dilation and activation of endothelial cells were observed. Additional research will be needed to determine if these changes are specific to this compound or class or are a general characteristic of compounds associated with DIVI.
Footnotes
The authors are employees of their respective organizations listed above and have no other financial interests.