
Abstract
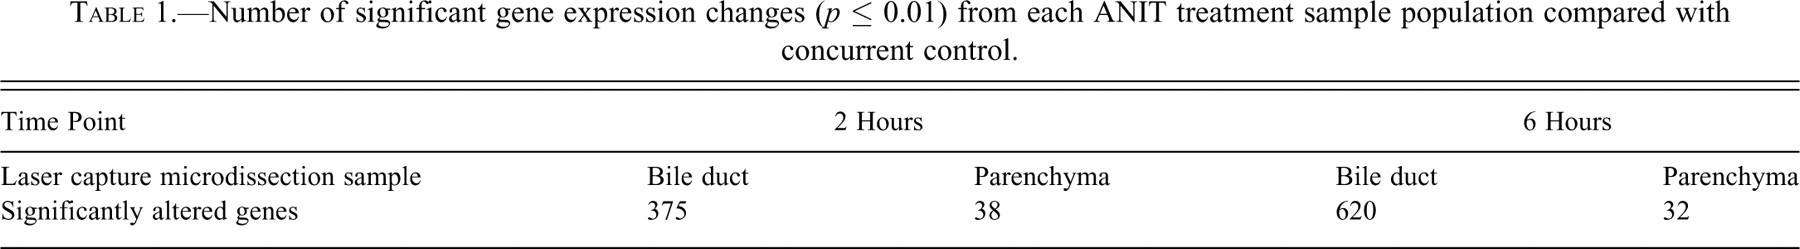
Acute toxic responses to a 50-mg/kg oral dose of 1-naphthylisothiocyanate (ANIT) were evaluated by microarray analysis of laser capture–microdissected rat biliary epithelium or hepatic parenchyma obtained 2 and 6 hours postdose. Distinct differences in gene expression patterns between biliary epithelium and hepatic parenchyma were noted at the 2-hour postdose time point, where 375 genes were altered in biliary epithelium but only 38 genes were altered in hepatic parenchyma. Endoplasmic reticulum stress genes were uniquely expressed in biliary epithelial cells at 2 hours postdose. By 6 hours postdose, 620 genes were altered in biliary epithelium, but only 32 genes were altered in hepatic parenchyma. In biliary epithelium, expression of genes involved in the unfolded protein response had decreased compared with the 2-hour time point, while expression of genes involved in protein degradation such as proteasome-ubquination pathways and cell death pathways had increased. At this same time, hepatic parenchymal gene expression changed little. Within 6 hours following oral exposure to ANIT, prior to morphologic changes, specific biliary epithelial gene expression changes, indicative of a vigorous unfolded protein response with protein destruction and cell death pathway activation were noted, in contrast to minor changes in the hepatic parenchyma.
Keywords
Introduction
Morphologic and functional alterations of the biliary tree are often seen as part of a spectrum of effects observed in various hepatotoxicities, either due to direct damage or as sequelae to parenchymal damage. Biliary tree involvement can manifest in a variety of nonspecific ways, including degeneration, necrosis, and/or hyperplasia. Understanding antecedent molecular events may enable full characterization and even prediction of distinct chemically induced hepatobiliary effects. 1-naphthylisothiocyanate (ANIT) is a model hepatobiliary toxicant that causes intrahepatic biliary injury in rats (Kossor et al. 1993) that is morphologically similar to drug-induced cholangitic cholestasis in humans (Zimmerman 1999). The precise pathogenesis of acute ANIT-induced biliary injury has not been clearly established. ANIT is thought to diffuse out of the blood and cross the sinusoidal membrane of the hepatocyte because of its lipophilicity. Within the hepatocyte, it is metabolized by the cytochrome P450 system and conjugated to glutathione (GSH) for elimination into bile, where it can be detected within 1 hour of oral administration (Jean and Roth 1995). The ANIT-GSH conjugate is likely excreted via the canalicular transporter MRP2, as MRP2 knockout mice are protected from ANIT-induced cholestasis (Dietrich et al. 2001). The role of GSH in ANIT excretion is supported by the observation that GSH depletion prevents ANIT accumulation in bile (Jean and Roth 1995). In cultured hepatocytes, ANIT-GSH complexes secreted into the culture medium were unstable at neutral pH, and 95% of the conjugate dissociated to release ANIT within 5 minutes (Carpenter-Deyo et al. 1991). Roth and coworkers have suggested that a similar dissociation takes place in bile in vivo and then leads to damage of the biliary epithelium (BE; Jean, Bailie, and Roth 1995; Jean and Roth 1995; Carpenter-Deyo et al. 1991; Roth and Dahm 1997). ANIT toxicity may be amplified via repeated rounds of glutathione conjugation and excretion, subsequently followed by uptake of released ANIT from bile (Carpenter-Deyo et al. 1991). Depletion of cellular glutathione and release of cytotoxic and inflammatory mediators, including those that attract neutrophils, have been suggested to contribute to hepatic injury (Dahm, Schultze, and Roth 1991; Hill, Jean, and Roth 1999; Roth and Dahm 1997; Roth and Hewett 1990). It has also been proposed that ANIT induces alterations in BE tight junctions (Kossor et al. 1993; Connolly et al. 1988; Krell et al. 1987; Kan and Coleman 1986).
Ultrastructural changes in BE have been described to occur as early as 4 hours following oral exposure, including dilation of bile ducts, loss of microvilli from bile duct epithelial cells, and an apparent opening of the tight junctions between bile duct epithelial cells (Connolly et al. 1988). These changes were more pronounced after 6 hours, at which time there was vacuolation of the endoplasmic reticulum (ER) in BE (Connolly et al. 1988). However, histologic evidence of BE injury is typically observed later, with overt necrosis seen by 24 hours following oral administration (Indacochea-Redmond and Plaa 1971). Following a single dose of ANIT, necrotic cell debris is usually cleared by 72 hours, and bile flow is returned to normal by 96 hours (Kossor et al. 1993).
To better understand the acute gene expression changes of the BE in situ to this classic biliary toxicant, we used laser capture microdissection (LCM) to collect BE or hepatic parenchyma (HP) before there was histologic evidence of injury from a dose of ANIT that causes complete necrosis of BE within 24 hours. The isolated cell populations were evaluated by microarray analysis to assess the mechanisms involved in cell injury, response to injury, and cell death. Marked differences in gene expression of the BE and the HP were found.
The LCM approach provides a more specific evaluation of defined cell populations; in this case, the emphasis was on biliary epithelial cells from large bile ducts only due to the functional heterogeneity of biliary epithelia (Glaser et al. 2006) and identification of more subtle changes in gene expression by avoiding the dilution effects that can occur when all the cell types present in the liver are analyzed together. Unlike in vitro systems, this approach has the advantage of evaluation of the BE in situ where normal metabolism occurs and architectural and functional interactions between BE cells, stromal cells, and the extracellular matrix are maintained.
Materials and Methods
Animals
Eight-week-old male Sprague Dawley rats (NTac:SD; Taconic, Germantown, NY) were used.
All procedures were conducted in accordance with published guidelines (National
Research Council’s Guide for the Care and Use of Laboratory Animals) and the U.S.
Department of Agriculture’s Animal Welfare Act and were approved by GSK’s
Institutional Animal Care and Use Committee. Animals were given
Chemicals
ANIT (Lot 08420DD; Sigma-Aldrich, St. Louis, MO) was formulated as a suspension in corn oil and administered to rats at a dose volume of 10 mL/kg. ANIT-treated rats received 50 mg/kg of ANIT per os, and control rats received an equivalent volume per os of corn oil only.
Clinical Chemistry
Whole blood was collected from the vena cava at necropsy from rats at 2, 6, and 24 hours postdose, starting at 10 a.m. Serum was analyzed on an Olympus AU640e analyzer (Olympus America, Melville, NY).
Some clinical chemistry parameters were log-transformed values (paraoxonase 1, paraoxonase/high-density lipoprotein ratio, and lactate dehydrogenase) and were analyzed via a one-way analysis of variance (ANOVA; Littell, Stroup, and Freund 2002; GLM Procedure of SAS/STAT 1999). Those parameters that a transformation could not satisfy the homogeneity of variance assumption (alanine aminotransferase, glutamate dehydrogenase, aspartate aminotransferase, alkaline phosphatase, total bile acids, total bilirubin, albumin, total protein, globulin and albumin/globulin ratio) were analyzed via a one-way Welch ANOVA (GLM Procedure of SAS/STAT 1999; Littell, Stroup, and Freund 2002). All tests were performed at the 5% level of statistical significance. The Hochberg multiplicity adjustment was applied to avoid erroneously rejecting the null hypothesis.
Tissue Collection
Rats were euthanized under isoflurane anesthesia. Samples of the left lateral and the median lobe were collected. Samples were immersed in 10% neutral buffered formalin. Following fixation, liver sections were processed into paraffin. Six-micron sections were stained with hematoxylin and eosin (H&E) for microscopic review. Left lateral lobe samples from each rat were also snap frozen in Optimal Cutting Temperature compound (BD, Franklin Lakes, NJ) and then held at –80°C until cryosectioning. Frozen liver samples were collected from rats only at 2 and 6 hours following ANIT dosing because bile ducts were nearly uniformly necrotic at 24 hours postdose, which prohibited gene expression analysis.
Laser Capture Microdissection
Approximately 16 frozen sections from the left lateral lobe of each animal were cut onto membrane slides. Cryosections were cut at 14 microns and stored at –80°C and processed within 7 days to minimize RNA degradation. LCM of cell populations was performed with the CellCut instrument from Molecular Machines & Industries (Zurich, Switzerland). Each slide was stained using a modified H&E stain protocol for LCM, to visualize the BE. Biliary epithelial cells were collected from bile ducts with a diameter of 20 microns or greater. Isolation of HP, containing hepatocytes and sinusoidal lining cells, was achieved by collecting a roughly star-shaped section of tissue that was centered on the terminal hepatic venule and extended into acinar zone 1 between portal tracts.
Modified H & E Stain Protocol for LCM
75% ETOH, 30 seconds dH2O, 30 seconds Hematoxylin, 15 seconds dH2O, 10 seconds 95% ETOH, 30 seconds Eosin Y, 15 seconds 75% ETOH, 30 seconds 95% ETOH, 30 seconds 100% ETOH, 30 seconds Xylene, 5 minutes Air dry, 5 minutes
RNA Isolation, Amplification, and Labeling
The LCM samples of BE or HP collected from the multiple liver sections per animal were pooled prior to RNA isolation and purification of BE or HP, respectively. The RNA isolation and purification procedure was performed with the Molecular Devices' PicoPure RNA Isolation Kit reagents and purification columns according to the manufacturer’s directions (Molecular Devices, Sunnyvale, CA). The RNA samples were stored at –80°C prior to linear amplification of the RNA. The NuGEN Ovation RNA Amplification System V2 and the FL-Ovation cDNA Biotin Module V2 were used to amplify RNA into cDNA and fragment and biotin label cDNA, respectively, according to the manufacturer’s directions (NuGEN Technologies, Inc., San Carlos, CA). The biotin-labeled cDNA (3.75 μg/sample) generated from each isolated cell type (BE or HP) per animal was used for the hybridization process with Affymetrix RAE230A GeneChips (Affymetrix, Santa Clara, CA). Specific NuGEN protocol information is available on the NuGEN support Web site at http://www.nugeninc.com/nugen/index.cfm/resources/user-guides/.
Affymetrix GeneChip Protocol
One RAE 230A chip per sample for a total of 40 chips (5 animals per group) was used in the microarray analysis. The Affymetrix protocol for washing, staining, and scanning of chip RAE 230A was followed according to the manufacturer’s instructions. Detailed information is available on their Web site at http://www.affymetrix.com/support/technical/manual/expression_manual.affx.
Quality Control Analysis of Affymetrix Genechips
Standard Affymetrix array quality metrics including Raw Q, scaling factor, percent calls, and GAPDH/β-Actin 3′/Middle (M) signal intensity ratios were used to determine the quality of the samples collected. SAS JMP Genomics (Cary, NC) was used for QC distribution analysis (Boxplot, Kernel Density, QC correlation and principle components, and QC correlation and grouped scatter plot). In addition, Rosetta Resolver’s principle component analysis and Array Studio (OmicSoft Corporation, Research Triangle Park, NC) were used for quality control and to assess a treatment response. All chips passed these quality assessments with the exception of one of the 6-hour bile duct samples, which was removed from the gene expression analysis as a technical outlier based on QC analysis with JMP Genomics. Therefore, the microarray gene expression analysis was conducted from five animals per group for the 2-hour BE and HP samples and the 6-hour HP samples and four animals for the 6-hour BE samples of control rats.
Identification of Significantly Altered Gene Expression
Differentially expressed probe sets were identified using the integrated pipeline in Resolver RatioBuild, which combines signal quantification and detection of differential expression in Rosetta Resolver version 5.1 (Rosetta Biosoftware, Seattle, WA). Rosetta Resolver incorporates an error model that captures the variance intensity for Affymetrix GeneChips, which conservatively estimates intensity error and then uses this value to stabilize the variance estimation (Weng et al. 2006). The performance of Resolver’s error model for signal quantification and detection of differentially expressed genes was among the best of signal quantification and statistical methods evaluated by Vardhanabhuti et al. (2006). In our study, each treatment group was compared with the concurrent control group, with the output containing fold changes relative to control and p values for all probe sets interrogated.
Gene Expression Analysis
Ingenuity Pathway Analysis version 5.0 (IPA; Ingenuity, Mountain View, CA, http://www.ingenuity.com/index.html) was used for gene annotation and pathway analysis. Following processing in Rosetta Resolver, the entire data set, including Affymetrix identifiers and corresponding expression values such as fold change and p value, were uploaded into the IPA application. Each gene identifier was mapped to its corresponding gene object in the Ingenuity Pathway Knowledgebase (IPKB). For multiple probe sets reporting for a gene, IPA automatically selected the probe set that showed the largest fold change compared with control. Ingenuity was used to annotate all of the probe sets of the microarray analysis. A p-value cutoff of ≤0.01 (values generated by Rosetta Resolver) was set to identify genes whose expression was significantly differentially regulated compared with concurrent controls. A fold-change cutoff was not used. These genes, termed Focus Genes in Ingenuity, were overlaid onto a global molecular network developed from information contained in the IPKB. Networks of these Focus Genes were then generated based on their connectivity. IPA calculated a significance score for each network using a p-value calculation that was displayed as the negative log10 of that p value. This score indicated the likelihood that the assembly of a set of focus genes in a network were explained by chance. For example, a score of 6 indicates that there is a 1 in 1,000,000 chance that the focus genes were together in a network randomly.
The IPA Top Canonical Pathways and Top Tox Lists tools were used to identify the pathways and gene lists that were most significant in the data set. Fischer’s exact test was used to calculate a p value, determining the probability that each canonical pathway or toxicity list assigned to that data set is not random.
Microarray Data Set
The microarray data have been deposited in NCBI's Gene Expression Omnibus and are accessible through GEO series accession number GSE20498 (http://www.ncbi.nlm.nih.gov/geo/query/acc.cgi?acc=GSE20498).
Results
Histology
There were no histologic changes in the BE or hepatocytes in livers collected from animals that were killed at 2 hours and 6 hours following ANIT dosing (Figure 1A-1C ). By 24 hours postdosing, the BE of intralobular and larger bile ducts was necrotic and inflammation was present (Figure 1D).
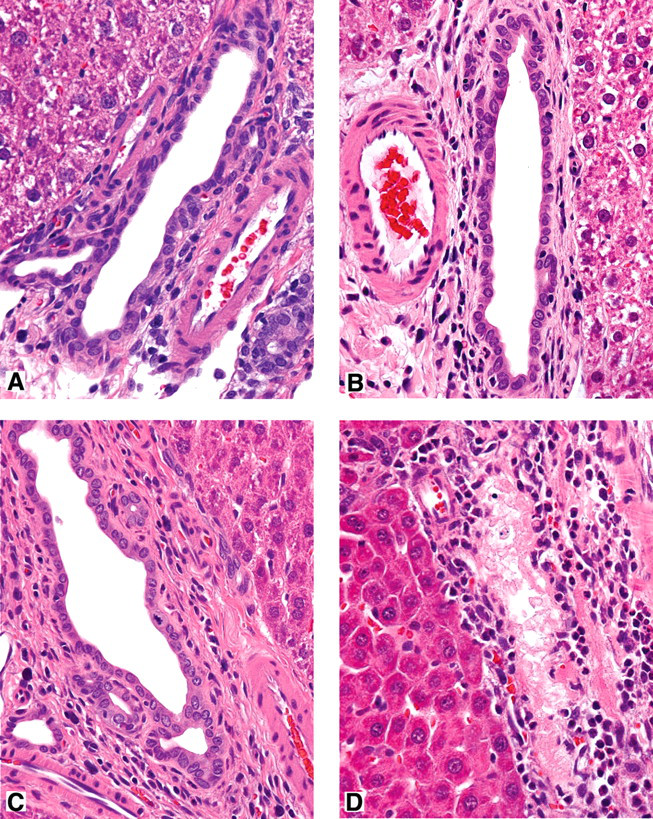
Light microscopic appearance of bile ducts. (A) Untreated rat. (B) Two hours following 1-naphthylisothiocyanate (ANIT) treatment. (C) Six hours following ANIT treatment. (D) Twenty-four hours following ANIT treatment. Hematoxylin and eosin stain. Original magnification x425.
Clinical Chemistry
Rats treated with ANIT showed a statistically significant increase compared with vehicle-treated controls for the following liver-related analytes: total bilirubin at 2, 6, and 24 hours and lactate dehydrogenase at 6 hours. Paraoxonase 1 was elevated in treated animals, and bile acids levels (p < 0.055), aspartate aminotransferase (p < 0.052), and alanine aminotransferase (p< 0.064) were just outside of statistical significance at 24 hours. Other analytes were not significantly different.
Sample Purity
Expression of cytokeratin 19 (KRT19), a recognized marker for BE (Shiojiri 1997) was used to determine the purity of the bile duct samples collected via LCM. Based on cytokeratin 19 signal comparisons of BE versus HP samples for the 2- and 6-hour time points, the purity of BE samples that were collected ranged from 98.1% to 99.0%, equivalent to an approximate 83-fold selectivity of cytokeratin 19 expression in bile ducts compared with liver parenchyma.
Two-Hour Time Point
Based on transcriptional response, preferential targeting of BE by ANIT was evident as early as 2 hours following oral exposure, whereas very few changes occurred in hepatocytes and associated sinusoidal lining cells (Table 1 ). Of the 12,444 probe sets analyzed, there were 375 genes that showed altered expression in the LCM-isolated BE, while analysis of HP showed that only 38 genes had altered expression. IPA results show that the top Ingenuity networks identified at the 2-hour time point were associated with (1) cellular compromise, posttranslational modification, and protein folding (network score 44); (2) small-molecule biochemistry and molecular transport (network score 37); (3) cell cycle (network score 37); and (4) cell-to-cell signaling and interaction (network score 35). The top toxicology lists included oxidative stress response mediated by nuclear regulatory factor 2 (NRF2; p value 1.4E-04), oxidative stress (p value 3.6E-04), and positive acute-phase response proteins (p value 6.5E-03), with top canonical pathways including NRF2-mediated oxidative stress response (p value 2.2E-04) and glutathione metabolism (p value 2.7E-03). Table 2 highlights the key genes altered in BE epithelium following ANIT exposure and their associated functions derived from the unsupervised analysis provided by IPA as well as genes identified through a supervised approach for data analysis.
Number of significant gene expression changes (p ≤ 0.01) from each ANIT treatment sample population compared with concurrent control.
Differential expression of select genes in rat bile duct epithelium following ANIT treatment
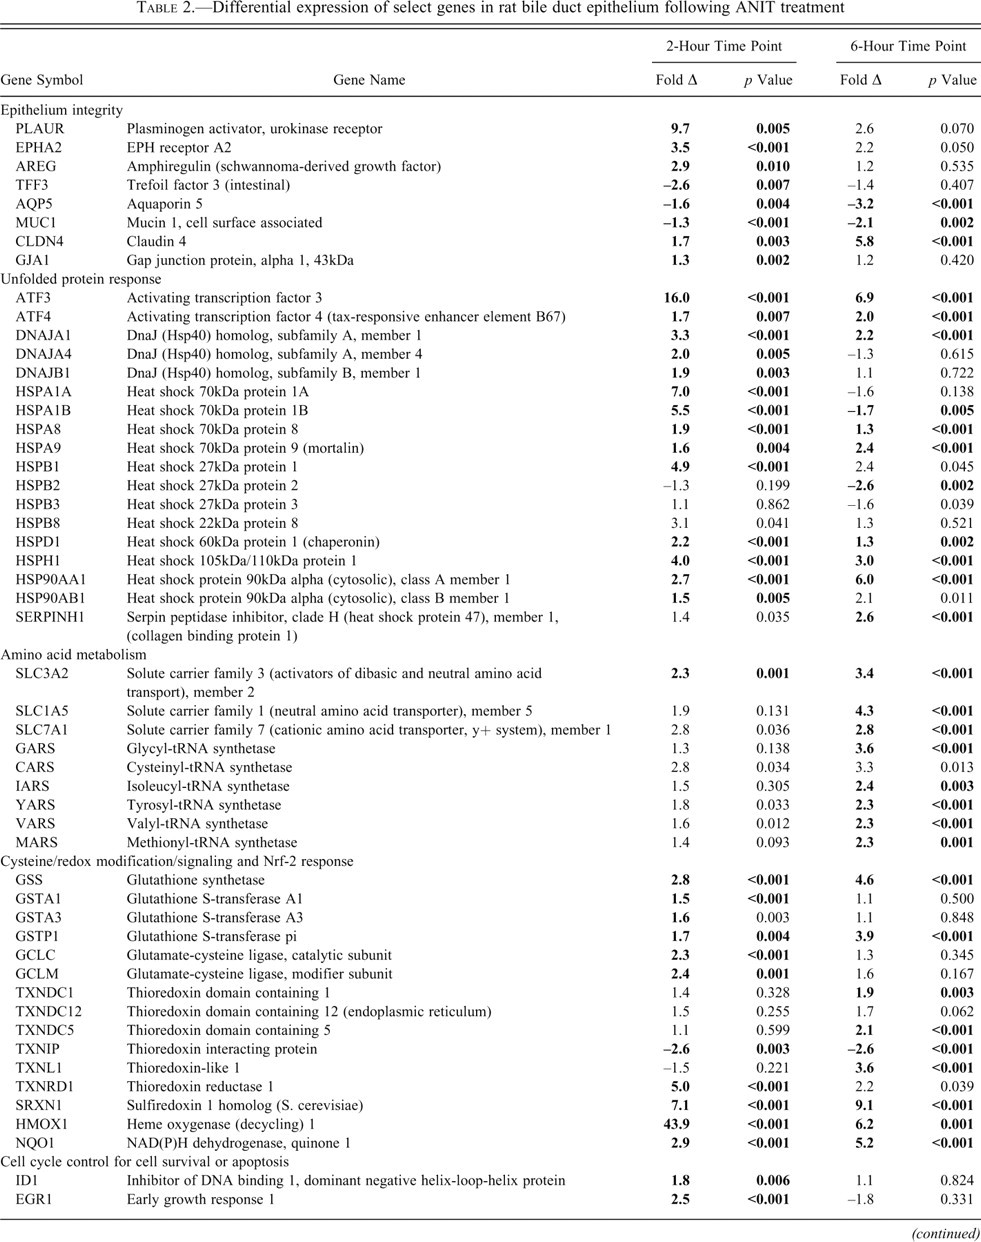
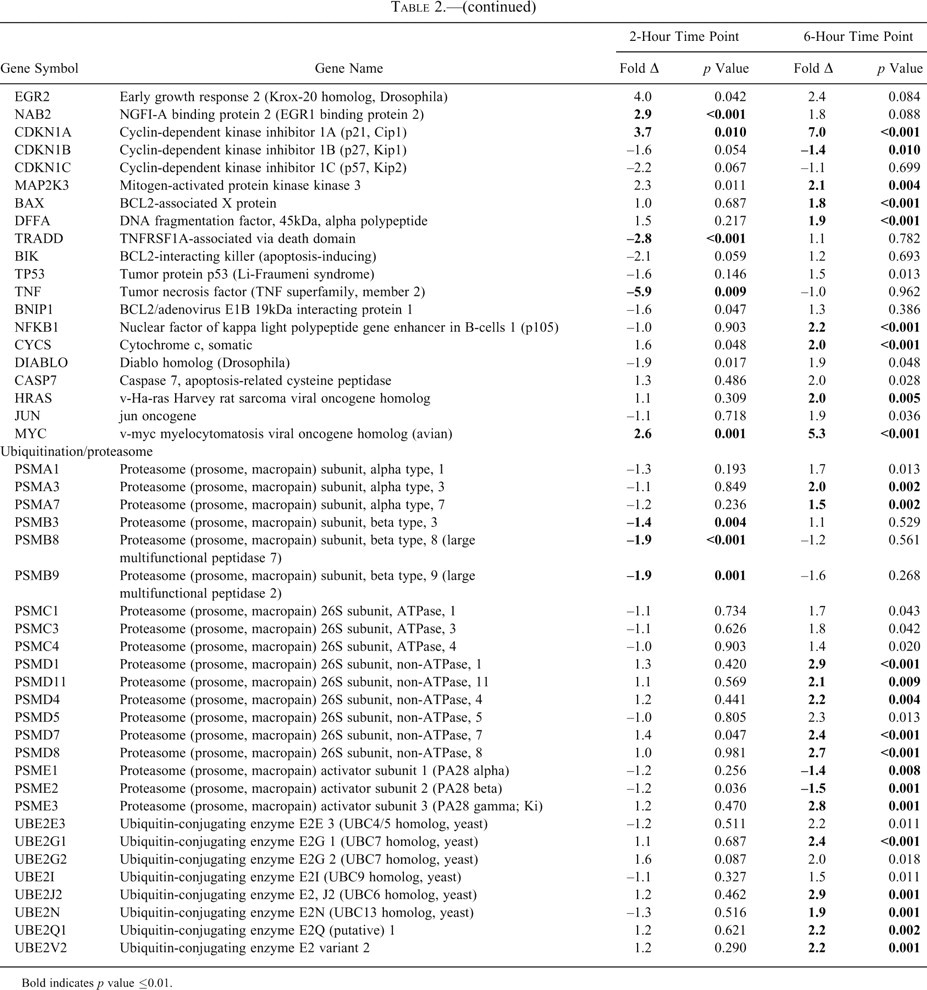
Bold indicates p value ≤0.01.
There was increased expression of genes involved in the response to protein unfolding and ER stress (Figure 2A). In particular, activating transcription factor (ATF) 3 was increased 16-fold and ATF4 was increased 1.6-fold. The up-regulation of ATF3 and ATF4 was associated with a prominent increase in expression of genes involved in antioxidant responses. These included mitochondrial (e.g., HSPA9 [GRP75] and HSPD1), cytoplasmic (e.g., HSPA8, HSPA1A, HSPA1B [HSP70s]), and ER (e.g., SERPINH1) chaperone protein synthesis and cationic and anionic amino acid transporters (e.g., SLC3A2, SLC1A5), all of which are downstream of the UPR (Figure 2A; Table 2). Concurrently, NRF2-dependant pathways, involved in antioxidant defense, were also induced, as seen by a 40-fold increase in hemeoxygenase 1 (HMOX1) expression, among others (Table 2; Figure 2A). The induction of initiating UPR signaling cascade genes, HSPA5 (GRP78/BIP), EIF2AK3 (PERK), ATF6, and DDIT3 (CHOP), was not evident.
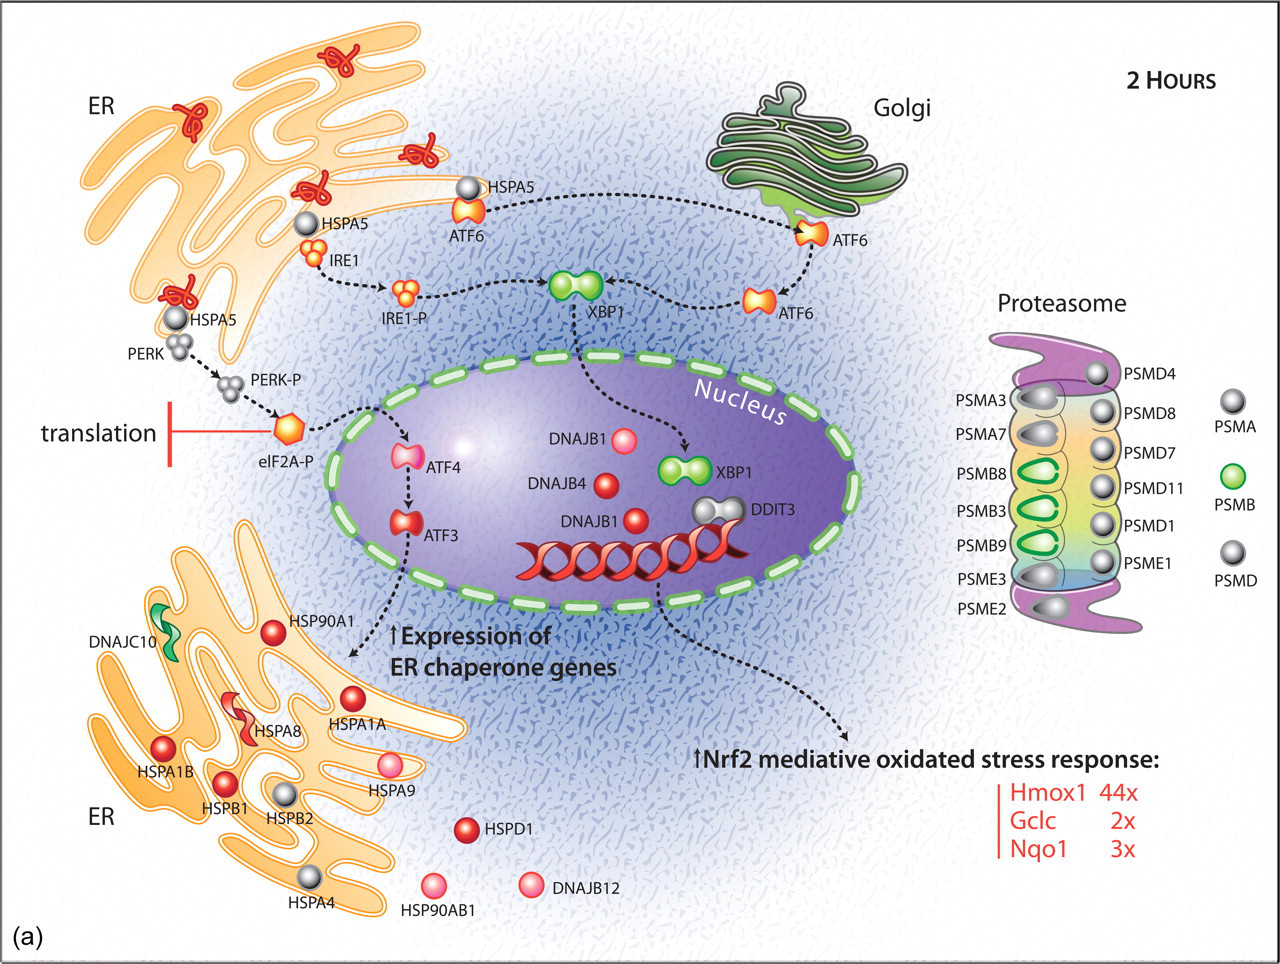
(a) Diagram of selected gene expression changes associated with unfolded protein response in biliary epithelium at 2 hours postdosing with 1-naphthylisothiocyanate (ANIT). Genes depicted in red were up-regulated, those in green were down-regulated, and those in gray were unchanged.
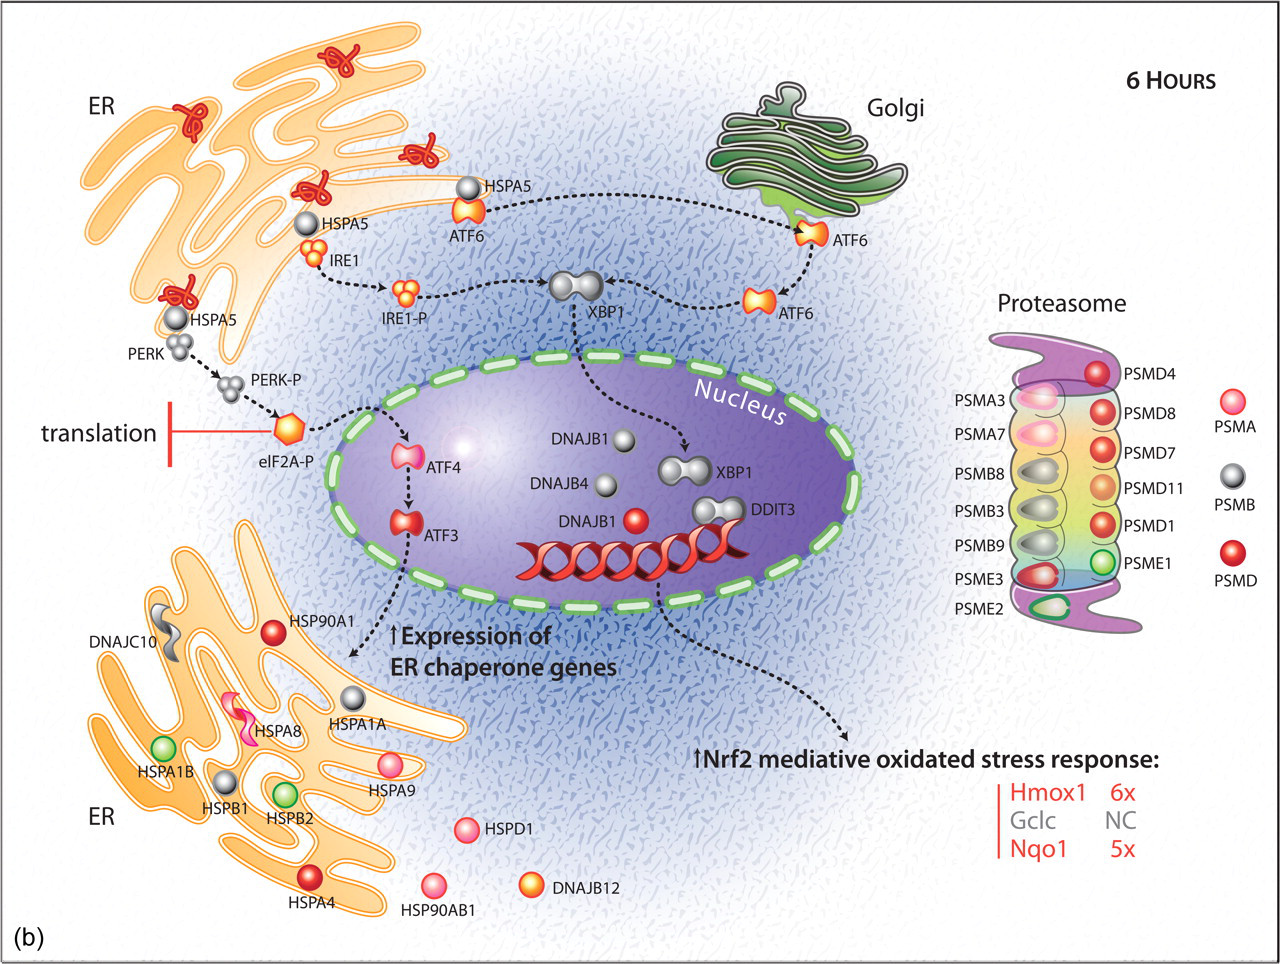
(b) Diagram of selected gene expression changes associated with unfolded protein response in biliary epithelium at 6 hours postdosing with ANIT. Genes depicted in red were up-regulated, those in green were down-regulated, and those in gray were unchanged.
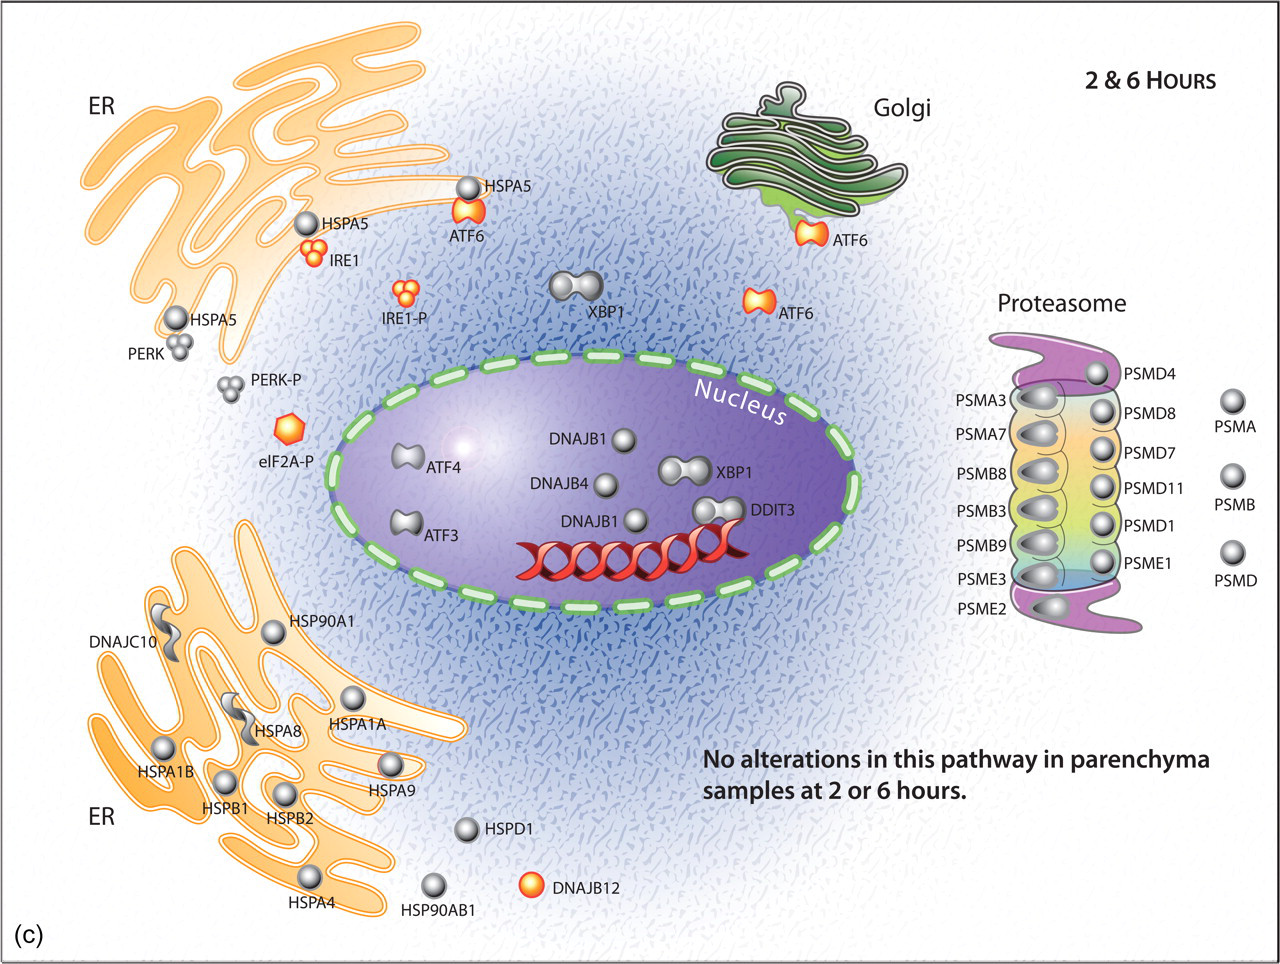
(c) Diagram showing the absence of regulation of selected genes associated with unfolded protein response and/or proteasome degradation in hepatic parenchyma at 2 or 6 hours postdosing with ANIT.
Based on the gene expression changes, there is support for the view that there is a response to oxidation of cysteine and thiol groups, which may be due to a direct action of the dithiocarbamate metabolite of ANIT with a variety of surface proteins and cytoplasmic proteins in the biliary lumen. At 2 hours, there was increased expression of glutathione-S-transferase (GST) alpha-1 (GSTA1), GST alpha-3 (GSTA3), and GST pi (GSTP1; Table 2), members of an enzyme family that catalyze conjugation of GSH to reactive electrophiles. GSTP1, which mediates responses to oxidative damage, is also involved in the JNK pathway. Sulfiredoxin and thioredoxin-reductase expression were also increased, the protein products of which are involved in reduction of disulfide bonds as well as the reversal of glutathionylation on cysteine residues, which are initially formed by GSTs.
The cell fate gene ID-1 was increased 1.8-fold in conjunction with downstream genes in this pathway such as early growth response 1 (EGR1) and early growth response binding protein (NAB2), which were increased 2.5-fold and nearly 3-fold, respectively. A possible interpretation of the up-regulation of these genes and others involved in cell proliferation and repair suggest that cell survival signaling is predominating over cell death signaling at this early time point (Figure 3 ; Table 2).
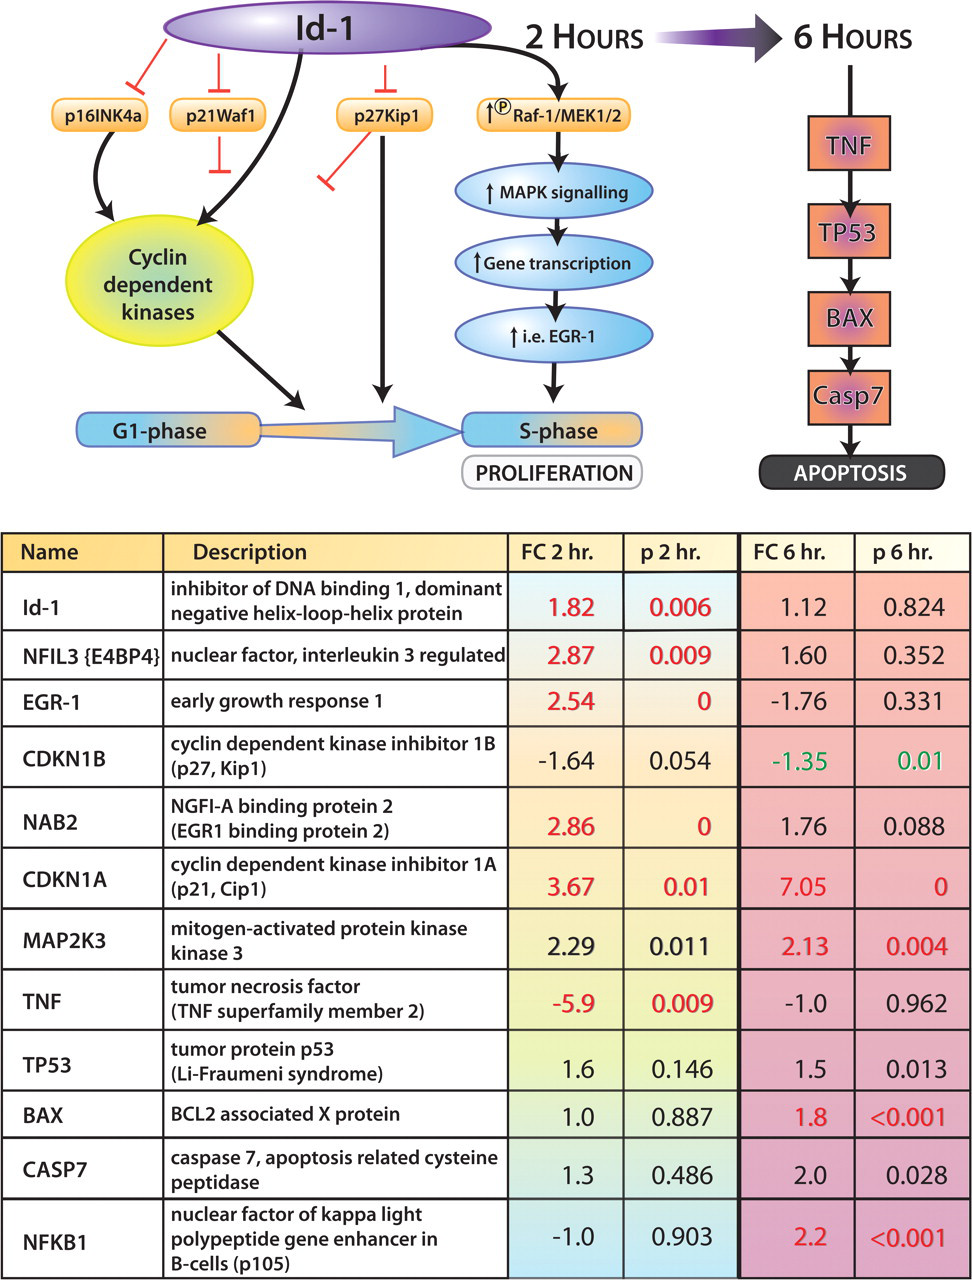
Fold changes in expression of genes involved in the cell survival ID-1 signaling pathway in biliary epithelium at 2 and 6 hours following 1-naphthylisothiocyanate administration (Wong, Y.-C., et al. 2004).
At 2 hours post–ANIT treatment, there were a number of ectoproteins, mucins, and protective epithelial genes altered, indicating a possible loss of BE membrane integrity, which could render intracellular proteins susceptible to injury (Table 2). Plasminogen activator–urokinase receptor, responsible for epithelial integrity defense, was highly up-regulated, and trefoil factor 3, involved in mucin viscosity, was reduced. In addition, there was increased expression of both mucin 1 (MUC 1; associated with epithelial mucin changes) and claudin 4 (CLDN4), which is associated with tight junction integrity (Table 2).
Hepatic parenchyma was essentially unaffected at 2 hours, as evidenced by altered expression of only 38 genes. A modest increase in genes associated with ribosomal protein synthesis and 1.8-fold increase in expression of CYP7A1, a gene involved in bile acid synthesis, were noted (Table 1 ).
Six-Hour Time Point
IPA results show that the top Ingenuity networks identified at the 6-hour time point were associated with (1) RNA posttranslational modification, cell cycle (network score 54); (2) molecular transport, protein trafficking, RNA trafficking (network score 51); (3) protein folding (network score 38); and (4) cell-to-cell signaling and interaction (network score 36). The top toxicology lists included hypoxia-inducible factor signaling (p value 2.1 E-05) and oxidative stress (p value 2.0E-03), with top canonical pathways including aminoacyl-tRNA biosynthesis (p value 3.3E-05) and protein ubiquination pathway (p value 2.1E-03). Based on these unsupervised results of IPA and supervised analysis, major genes and pathways associated with 6 hours of ANIT exposure in BE are presented (Table 2 ).
Comparison of gene expression changes at 6 hours versus 2 hours showed that the pattern of gene expression in bile ducts was altered from predominantly protective responses at 2 hours to those predominantly associated with disposal of damaged proteins and cell death (6 hours; Table 2). At 6 hours, there was increased transcription of numerous genes involved in protein ubiquination and proteosome activity, which could be interpreted as an adaptive response for destruction of damaged proteins (Figure 2B). Overall, synthesis of heat shock proteins shifted from up-regulation at 2 hours to down-regulation at 6 hours (Figure 2A and 2B). HSPA1A and HSPA1B genes were up-regulated 7-fold and 5.5-fold at 2 hours but were down-regulated 1.6-fold and 1.7-fold at 6 hours. Up-regulation of oxidative stress pathways mediated by NRF2 was maintained, but the number of affected genes in this pathway was lower than that seen at 2 hours (Figure 2A and 2B). At the 6-hour time point, the cell survival genes ID1 and downstream genes EGR1 and NAB2 no longer had increased transcription that was evident at 2 hours (Figure 3), suggesting a transition to up-regulation of cell death pathways, which is supported by a 1.8-fold increase in BAX (Table 2). There was a pattern of gene expression consistent with acute cell damage occurring at 6 hours but not at 2 hours (e.g., up-regulation of JUN [2-fold] and HRAS [2-fold] and activation of the death receptor signaling pathway [Table 2]).
Gene expression changes in the hepatic parenchyma at 6 hours remained quite limited in comparison to those in the isolated biliary epithelium. In contrast to the changes observed at 2 hours in the liver parenchyma, at 6 hours the modest ribosomal-related gene changes were no longer evident (Table 3). In the hepatic parenchyma samples collected at 2 and 6 hours postdose, there were no changes in genes associated with ER-stress/UPR and proteasome degradation pathway, which were noted in the BE samples (Figure 2A-2C). At the 6-hour time point, noteworthy changes that were detected in the HP included up-regulation of CYP1A1 (5-fold), CYP1A2 (2-fold), and CYP2B6 (2.8-fold); however, CYP7A1 expression was not altered (Table 3). Clinical chemistry showed that ALT serum enzyme levels were increased (2-fold); although this was not a statistically significant increase, it was nearly so (p < 0.055). There was no evidence at 2 or 6 hours of altered expression of genes associated with neutrophil chemotaxis, including, but not limited to, RANTES, MIP1α, MIP1β, or proinflammatory cytokines (Table 3).
Differential expression of select genes in rat liver parenchyma following ANIT treatment
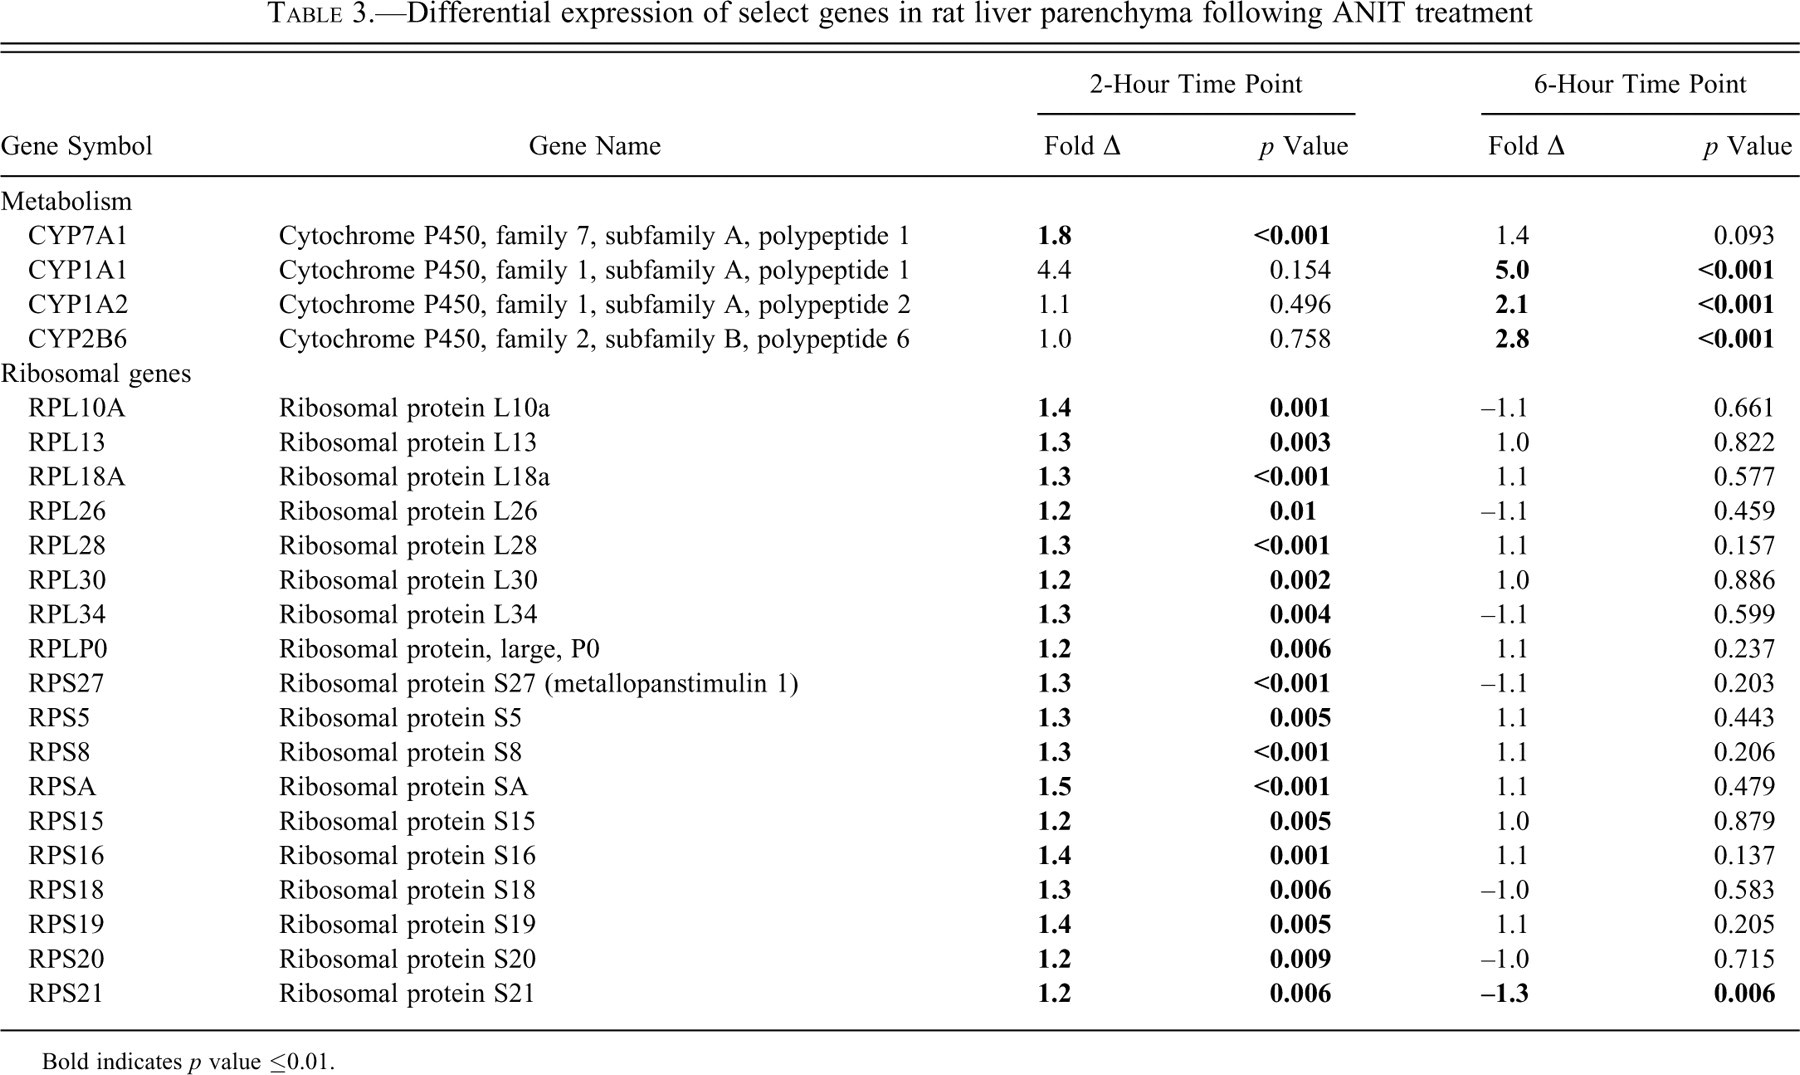
Bold indicates p value ≤0.01.
Based on these results, we propose a model of acute ANIT selective toxicity to BE (Figure 4 ).
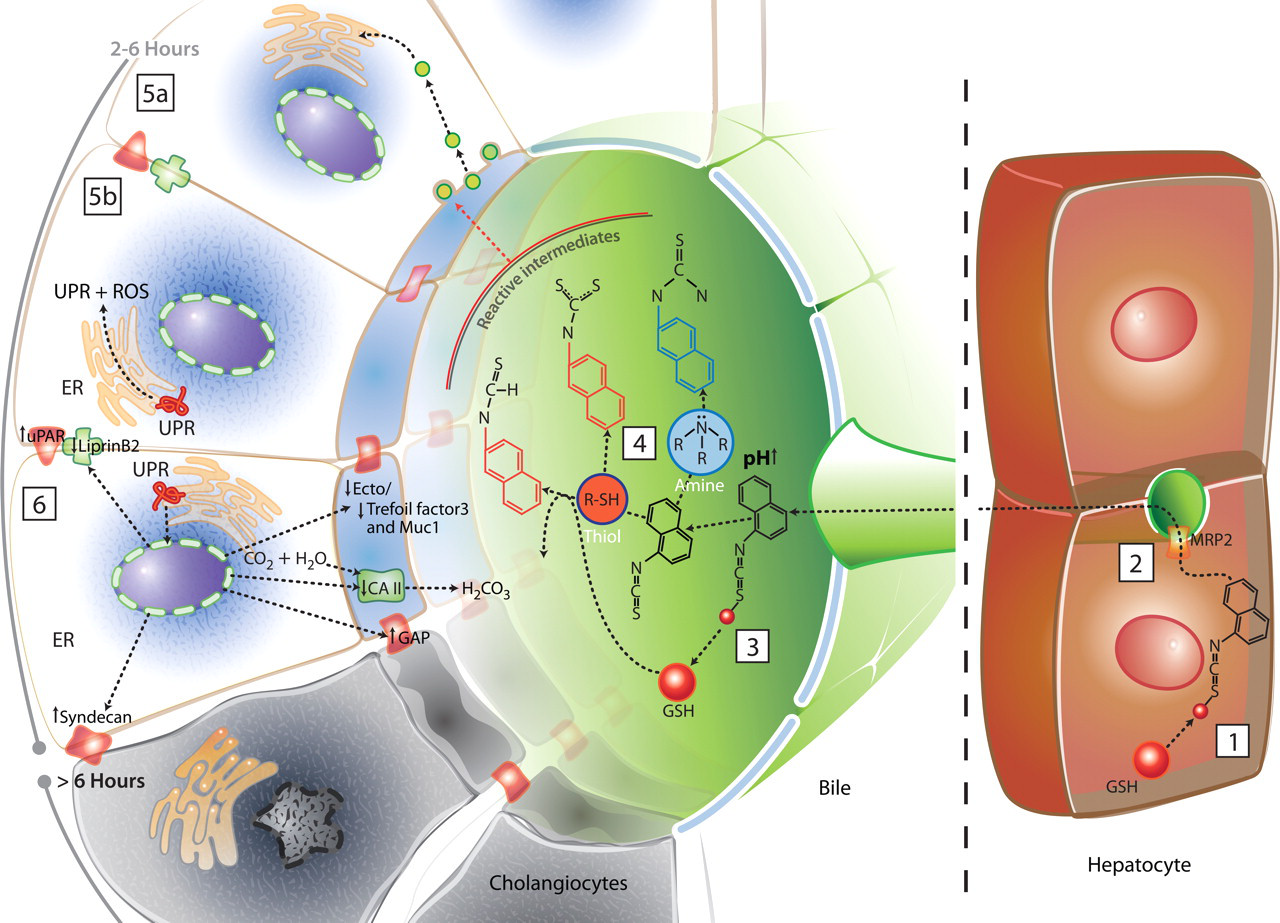
Proposed pathobiology from 2 to 6 hours post–(1-naphthylisothiocyanate; ANIT) exposure based on literature review and gene expression analysis conducted in this study. (1) ANIT is absorbed and conjugated to glutathione within minutes by GSTs in the hepatocyte. (2) MRP2 transports conjugated ANIT into the bile canaliculus. (3) ANIT dissociates from glutathione in the bile as the bile enters the larger bicarbonate-secreting bile ducts and the pH rises. (4) ANIT is highly reactive alone, and in combination with locally secreted amines or protein-derived thiols in the bile, numerous reactive intermediates (dithiocarbamates, thioaldehydes, thiourea, and thiolates) can be formed. Reactive intermediates then interact with sulfhydryl groups on protective mucins and trefoil factor 3 and on ectoproteins on microvilli and at tight junctions and gap junctions. (5a, 5b) High rates of endocytosis of biliary epithelium may lead to internalization of either damaged surface proteins bound to ANIT or of ANIT unbound into the biliary epithelial cytoplasm with reverse transport to the ER and initiation of the unfolded protein response and oxidative stress. (6) Deficits in ectoprotein and tight/gap junction and cell adhesion proteins (red and green symbols) leads to transcriptional dysregulation aimed at adaptation and survival.
Discussion
We have demonstrated (1) altered gene expression in the BE, indicating activation of oxidative stress pathways among others as soon as 2 hours following ANIT exposure, when there is scant change in hepatic parenchyma; (2) within 6 hours, the pattern of gene expression in BE changes significantly toward cellular damage responses and cell death pathways; and (3) overall, the gene expression changes in the BE are much more extensive than those that occur in the hepatic parenchyma at either time point.
Gene expression changes in the BE within 2 hours are consistent with observations that within an hour of exposure, ANIT is conjugated to glutathione and subsequently transported into bile (Jean and Roth 1995). Rapid BE injury following ANIT oral dosing has been shown previously only at the ultrastructural level. At 4 hours following oral ANIT administration, early gap junction alterations, tight junction opening, and loss of surface microvilli were identified (Connolly et al. 1988).
In our study, indicators of ER stress signaling are activated in BE at 2 hours after ANIT treatment. The ER, well recognized for its function in protein synthesis and protein folding, also plays a pivotal role in sensing cellular stress (Zhang and Kaufman 2008). Previous reports have shown that ATF3 gene expression is induced as early as 2 hours in numerous tissues after initiation of a stress condition (Hai et al. 1999) and up-regulation of ATF3 may require the transcriptional regulator ATF4 (Jiang et al. 2004). Apparent activation of NRF2 by ATF3 initiated expression of a number of genes involved in an antioxidant response, including increased expression of NRF2-downstream response genes (HMOX1, NQOR, GSTs, etc.), numerous chaperone/heat shock protein genes, and amino acid transporters (SLC3A2, SLC1A5). In contrast to the 2-hour time point results, which show up-regulation of regulatory factors ATF4 and ATF3 in the bile duct epithelium, the key UPR activating genes HSPA5 (GRP78/BIP), EIF2AK3 (PERK), ATF6, and DDIT3 (CHOP) were not altered at 2 or 6 hours. However, a reduction in XBP1 gene transcripts was detected at 2 hours, which may indicate splicing of this mRNA to the transcriptionally active form for UPR target gene induction. In this study, up-regulation of the key UPR activating genes may have occurred earlier than at our 2-hour sampling. Although many of the UPR-regulated genes (e.g., NRF2 response, heat shock proteins) were also up-regulated at 6 hours, in general, the magnitude of the induction and the number of statistically significant genes associated with this pathway are lower at the 6-hour time point, suggesting that the bile duct cells are reprogramming from a first response cell survival mode to one of cellular damage removal and cell death. This model is supported by the up-regulation of genes comprising the proteasome, coincident with down-regulation of several heat shock family members (DNAJA4, HSPA1A, HSPA1B) at 6 hours that were upregulated at 2 hours.
It is noteworthy that ID1 and downstream response genes such as EGR1 and its associated protein early growth response binding protein (NAB2) involved in cell proliferation and repair are up-regulated at the 2-hour time point only and that apoptosis inducers (tumor necrosis factor–α;TNF-α) and apoptotic genes (BAX, BNIP1, TRADD, DIABLO) are down-regulated or show no change in expression at 2 hours, suggesting cell proliferation and survival signaling are predominating over cell death signaling early, before reaching a point of no return and progressing on to a program of cell death. At this early 2-hour time point, there is little indication that the misfolded proteins likely being produced by ANIT oxidative damage have reached the point of up-regulating proteasomal degradation.
By 6 hours following ANIT exposure, the pattern of BE gene expression changed to one in which ubiquitination and proteasomal degradation were prominent. Cell fate pathways were now transformed from cell survival (ID1, EGR1, and NAB2 are no longer up-regulated) to cell death, and the TNF-α and apoptosis pathways were up-regulated at 6 hours. At 24 hours following ANIT administration, there was extensive necrosis of the epithelium of the large bile ducts.
ANIT is recognized for the characteristic neutrophilic infiltrate around bile ducts and in the hepatic parenchyma (Kodali et al. 2006; Roth and Dahm 1997; Hill et al. 1999; Roth and Hewett 1990). A role of neutrophil-induced hepatocellular injury via oxidative injury in the pathogenesis of ANIT toxicity has been proposed (Hill and Roth 1998; Dahm, Schultze, and Roth 1991; Kodali et al. 2006; Roth and Dahm 1997; Hill, Jean, and Roth 1999). An association between lipid peroxidation by neutrophils or direct chemical activity and ANIT-induced liver injury has been shown, but changes in liver levels of lipoxygenase or myeloperoxidase were not measured until 12 hours after dosing (Kongo et al. 1999). In our study, neutrophils were observed microscopically around and within damaged bile ducts at 24 hours, as previously shown by others, but not at the 2- or 6-hour time points. However, our transcriptional data show that acute biliary injury caused by ANIT differs from the hepatocellular injury based on the cell-specific induction of proteasomal genes and cell death pathways at 6 hours in the BE of the large bile ducts but not in the liver parenchyma, which showed few gene expression changes at the 2- and 6-hour time points. In addition, the transcriptional changes we detected at 6 hours in the bile ducts occurred several hours before any histologic evidence of a neutrophilic response, although neutrophils may still play a role in the period between 6 hours and 24 hours. There was no evidence of increased expression of genes encoding chemotactic factors for neutrophils in BE or HP at 2 or 6 hours. Thus, our results suggest that the role of neutrophils in BE injury is secondary to the acute bile duct toxicity of ANIT. This view is supported by observations that hepatocytes, but not BE cells, are protected by neutrophil depletion after ANIT treatment or in knockout mice lacking CD18, a subunit of β2 integrins and an essential component in normal neutrophil function (Kodali et al. 2006).
In the acute phase of ANIT toxicity, the differences in gene expression between the BE and the HP are prominent. Compared with the targeted BE, the HP is largely quiescent at both the 2- and 6-hour time points. However, the few changes that are evident in HP appear to center around responses to bile salt and bilirubin metabolism. For example, at 2 hours post ANIT dose, cholesterol-7a-hydroxylase (CYP7A1) was increased. Because CYP7A1 synthesizes bile acids from cholesterol (Makishima et al. 1999), the early increase in CYP7A1 expression could be due to decreased enterohepatic circulation of bile acids or may be due to a direct effect of ANIT. In addition, ANIT treatment induced the expression of CYP1A1 in HP at 6 hours, possibly due to induction, since the enzyme can be induced by both ANIT (Mori et al. 2005) and increased bilirubin (Sinal and Bend 1997), which was elevated at all time points in our study.
The toxicity of ANIT can be mediated from the lumen of the biliary tree (Dietrich et al. 2001). Proposed mechanisms for ANIT-induced BE injury include dissociation from glutathione as an ionic dithiocarbamate or as a highly reactive sulfur analogue of an aldehyde (thioaldehyde, thial) that may be available for transformation to more reactive chemical species. By 2 hours following administration, the dissociation of ANIT-GSH may be increased in the large bile ducts because unlike small bile ducts, the large ducts are secretin responsive and secrete bicarbonate, which results in an overall increase in the pH of bile in the large ducts (Alpini et al. 1989). Therefore, the localized toxicity of ANIT to the large rather than the small bile ducts, as was seen histologically at 24 hours following dosing, may lie in the highly reactive products formed from the thiocyanate portion of the molecule in the bicarbonate-rich environment of the large bile ducts.
In this study, we have demonstrated the combined strength of laser-capture microdissection and the evaluation of an early time course to elucidate the gene expression changes specific to the large biliary epithelial cell population in their normal microenvironment, independent of the effects imposed by isolated BE in vitro culture methods. At 2 hours following oral exposure to ANIT, there is a large number of genes responding to chemical-induced injury in the BE but very few in hepatocytes. The advantage of evaluating the BE in isolation is that analysis of the entire population of cells within the liver is less likely to reveal gene expression changes due to the dilution of the BE mRNA from unaffected hepatocytes and sinusoidal lining cells. Our results show that specific cell populations can respond very rapidly to orally administered toxicants, and it is likely that time points earlier than 2 hours would have revealed meaningful gene expression changes. This report highlights the importance of timing during sample collection because samples from later time points may miss the alterations initiating pathogenesis and may be more likely to capture downstream responses to the injury itself, although it is possible that even at 2 hours, some gene expression alterations may be due to the effect of injury, rather than be indicative of the pathogenesis. More specifically, the transcriptional responses at 2 hours in BE give an indication of the molecular changes occurring within the cell within a brief interval following exposure and to the transient nature of the adaptive/cell survival pathway at the 6 hours that precedes cell death. Mechanistic studies to support these observations would be valuable, but given the limited cell population taken from their normal milieu, it was not feasible to assess changes other than those associated with gene expression.
In summary, this is the first report that elucidates the early gene expression of the in situ BE response to acute injury following an ANIT dose that leads to bile duct degeneration and necrosis. This study provides insight into acute ANIT toxicity, demonstrating that BE generates a robust ER stress response as the first line of defense to mitigate cellular damage by 2 hours following exposure to ANIT, and at 6 hours signals for protein degradation and removal, and ultimately programming of cell death. In addition, we have demonstrated evidence of significant BE stress prior to histologic evidence of injury and neutrophilic infiltration.
Footnotes
Work was performed at GlaxoSmithKline, Safety Assessment, Research Triangle Park, North Carolina, USA. Funds for this project were provided by GlaxoSmithKline.
Acknowledgments
The authors wish to thank the members of the GlaxoSmithKline Hepatotoxicity Board for thoughtful review of the article.