
Abstract
Macrocyclic trichothecene mycotoxins encountered in water-damaged buildings have been suggested to contribute to illnesses of the upper respiratory tract. Here, the authors characterized the adverse effects of repeated exposures to roridin A (RA), a representative macrocyclic trichothecene, on the nasal airways of mice and assessed the persistence of these effects. Young, adult, female C57BL/6 mice were exposed to single daily, intranasal, instillations of RA (0.4, 2, 10, or 50 μg/kg body weight [bw]) in saline (50 μl) or saline alone (controls) over 3 weeks or 250 μg/kg RA over 2 weeks. Histopathologic, immunohistochemical, and morphometric analyses of nasal airways conducted 24 hr after the last instillation revealed that the lowest-effect level was 10 μg/kg bw. RA exposure induced a dose-dependent, neutrophilic rhinitis with mucus hypersecretion, atrophy and exfoliation of nasal transitional and respiratory epithelium, olfactory epithelial atrophy and loss of olfactory sensory neurons (OSNs). In a second study, the persistence of lesions in mice instilled with 250 μg/kg bw RA was assessed. Nasal inflammation and excess luminal mucus were resolved after 3 weeks, but OSN loss was still evident in olfactory epithelium (OE). These results suggest that nasal inflammation, mucus hypersecretion, and olfactory neurotoxicity could be important adverse health effects associated with short-term, repeated, airborne exposures to macrocyclic trichothecenes.
Keywords
Introduction
Damp building-related illnesses (DBRI) include a number of respiratory, immunological, and neurological conditions that have been associated with airborne exposure to indoor air fungi. An Institute of Medicine expert committee concluded that there is sufficient scientific evidence to suggest an association between exposure to moldy, damp, indoor environments and upper respiratory tract symptoms (nasal congestion, runny or itchy nose, sneezing, throat irritation) as well as some lower respiratory tract symptoms and syndromes (wheeze, cough, asthma exacerbation, and hypersensitivity pneumonitis in susceptible people) (Institute of Medicine 2004). This committee, however, also concluded that there was insufficient evidence to link damp conditions to other health conditions, including pulmonary hemorrhage and neurological effects (e.g., memory loss).
The toxic black mold Stachybotrys chartarum is a saprophytic fungus that grows on damp cellulosic building materials such as wallboards, ceiling tiles, and cardboard (Andersson et al. 1997; Boutin-Forzano et al. 2004; Tuomi, Saarinen, and Reijula 1998; Tuomi et al. 2000). It has been suggested that S. chartarum or its trichothecene mycotoxins are etiologic contributors to DBRI (Fung, Clark, and Williams 1998; Hossain, Ahmed, and Ghannoum 2004; Jarvis et al. 1986, 1998; Kilburn 2004). The role of S. chartarum in DBRI still remains a public health enigma, and much more research is needed in the areas of mechanisms, dose-response, and exposure assessments (Institute of Medicine 2004; Pestka et al. 2008).
Macrocyclic trichothecene mycotoxins are found in spores and mycelial fragments of S. chartarum, which can become airborne and inhaled under certain conditions (Sorenson et al. 1987; Brasel et al. 2005; Pestka et al. 2008). We have demonstrated that mice instilled once intranasally with a relatively low amount (250 ng) of the macrocyclic trichothecene satratoxin G (SG) develop rapid and dramatic loss of olfactory sensory neurons (OSNs), through apoptosis, in both the nose and brain (Islam, Harkema, and Pestka 2006). In a subsequent study, it was found that roridin A (RA), a macrocyclic trichothecene with a similar chemical structure, similarly induced rapid apoptosis and marked loss of OSNs in the nasal airways and the olfactory bulb (OB) of mice after a single intranasal instillation (Islam et al. 2007).
While the toxicologic effects of nasal exposure to a single dose of macrocyclic trichothecenes have been reported, little is known of the effects of repeated exposures or persistence of such effects. The purpose of the present study was to characterize the effects of repeated, low-dose, intranasal exposures to RA on the nasal epithelium of mice and assess the persistence of these effects. RA was chosen as the representative macrocyclic trichothecene for this purpose due to the lack of commercially available SG and the difficulty in purifying large amounts of this latter trichothecene for in vivo research. RA is commercially available and is produced in large quantities by the fungus Myrothecium.
Materials and Methods
Experimental Design
Studies were carried out in accordance with National Institutes of Health guidelines and overseen by the All University Committee on Animal Use and Care at Michigan State University. Pathogen-free female C57BL/6 mice (7-8 weeks, Charles River, Portage, MI) were randomly assigned to experimental groups (n = 6). Mice were housed in polycarbonate cages containing Cell-Sorb Plus bedding (A & W Products, Cincinnati, OH, USA) and covered with filter bonnets. Room lights were set on a 12-hr light/dark cycle. Temperature and relative humidity were maintained between 21–24°C and 40–55% humidity, respectively. RA was purchased from Sigma Chemical Co. (St. Louis, MO, USA). The toxin was evaluated by high-performance liquid chromatography (HPLC) and a single peak was detected at 260 nm, indicating purity > 99% (Hinkley and Jarvis 2001).
We initially conducted a study to determine the dose-response relationships of RA and nasal injury in mice receiving repeated, daily, intranasal instillations under light anesthesia using a mixture of 3.5% isoflurane (Abbott Laboratories, IL Abbott Park, IL, USA) and 96.5% oxygen. Mice received an intranasal instillation of 0, 0.4, 2, 10, or 50 μg/kg body weight (bw) (approximately 0, 7, 36, 180, or 900 ng, respectively) of RA in 50 μL of pyrogen-free saline (Abbott Laboratories; 25 μL per nostril) once a day, 5 days a week for 2 consecutive weeks, followed by 4 consecutive days in the 3rd week. Therefore, at the end of the last instillation, mice had received a total intranasal dose of 0, 0.1, 0.5, 2.5, or 12.6 μg of RA. An additional group of mice similar in strain, gender, and age (n = 6) was instilled intranasally with a high RA dose of 250 μg/kg bw (4,500 ng/mouse) for 9 days (5 consecutive days the 1st week and 4 consecutive days the 2nd week), which was equivalent to a total intranasal dose of 40.5 μg/mouse.
A subsequent study was conducted to determine the persistence of toxin-induced nasal lesions at 3 weeks after the end of the last instillation. We chose only the highest daily dose (250 μg/kg bw) for this study. Mice (n = 6/group) received single, daily, intranasal instillations of either saline (control mice) or 250 μg/kg bw RA for 9 days (5 consecutive days the 1st week and 4 consecutive days the 2nd week). Mice were sacrificed at 1 day or 3 weeks after instillation. Please see Table 1 for a description of all experimental groups.
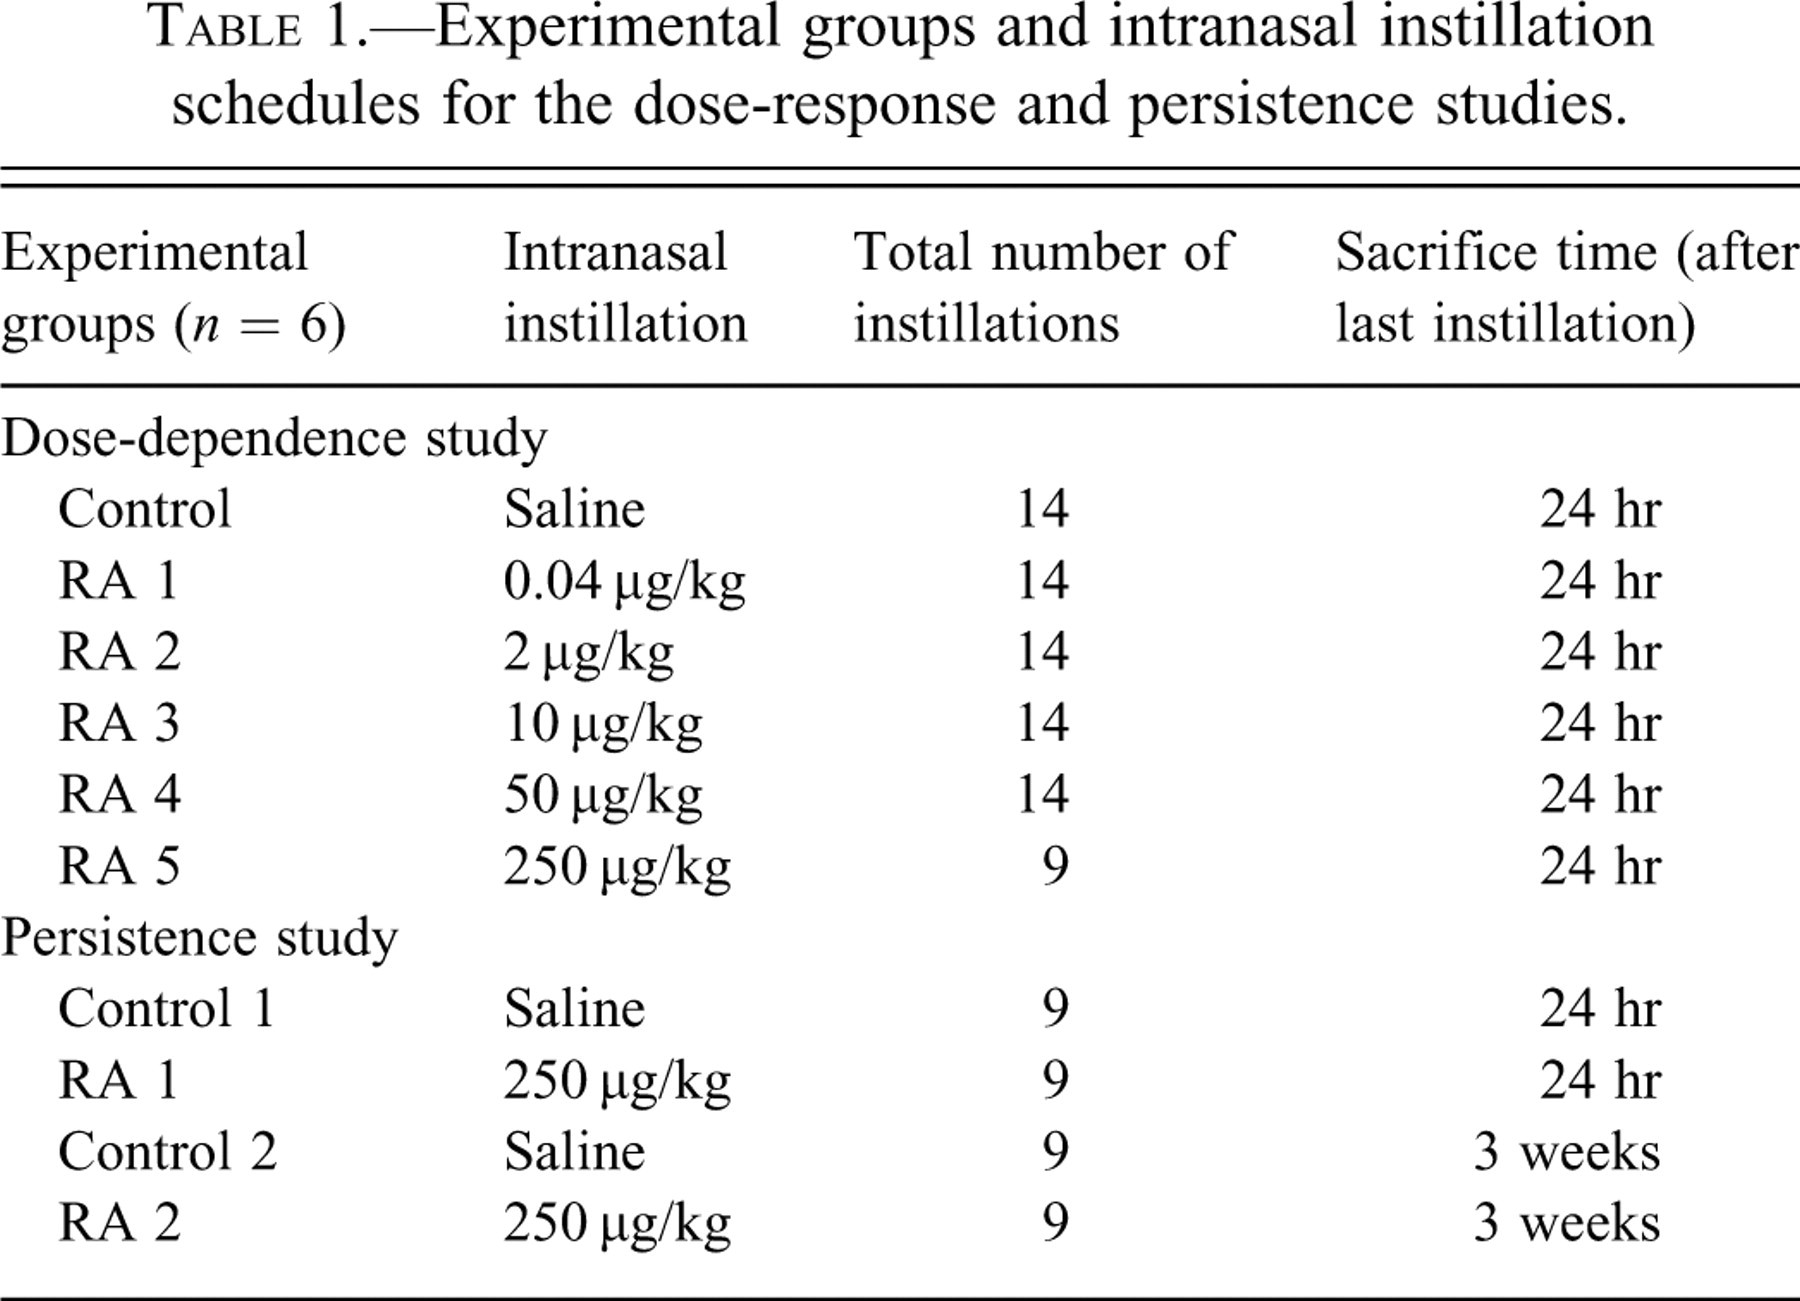
Experimental groups and intranasal instillation schedules for the dose-response and persistence studies.
Animal Necropsies and Tissue Processing
At the designated time of sacrifice, mice were deeply anesthetized with an intraperitoneal (ip) injection of 0.1 ml of 12% (w/v) sodium pentobarbital and euthanized by exsanguination via the abdominal aorta. After death, the head from each mouse was immediately removed from the carcass and the lower jaw, skin, muscles, eyes, and dorsal cranium were removed. The nasal cavities were flushed with 500 μL of 10% (v/v) neutral buffered formalin (Fischer Scientific, Fair Lawn, NJ, USA) using a 1 mL syringe and 20-gauge cannula, retrograde through the nasopharyngeal meatus. Nasal cavities were then immersed in a large volume of the same fixative and stored for 24 hr prior to further processing. Following fixation, the heads were decalcified in 13% (v/v) formic acid for 7 days and then rinsed in tap water for at least 4 hr.
Transverse tissue blocks at four specific anatomic locations from the heads of the mice were selected for light microscopy as previously described (Young 1981; Harkema, Carey, and Wagner 2006; Islam, Harkema, and Pestka 2006). Briefly, the proximal section (T1) was taken immediately caudal to the upper incisor teeth; the middle section (T2) was taken at the level of the incisive papilla of the hard palate; the third nasal section (T3) was taken at the level of the second palatal ridge; and the most caudal nasal section (T4) was taken at the level of the intersection of the hard and soft palates, through the proximal portion of the olfactory bulb (OB) of the brain (Figure 1 ).
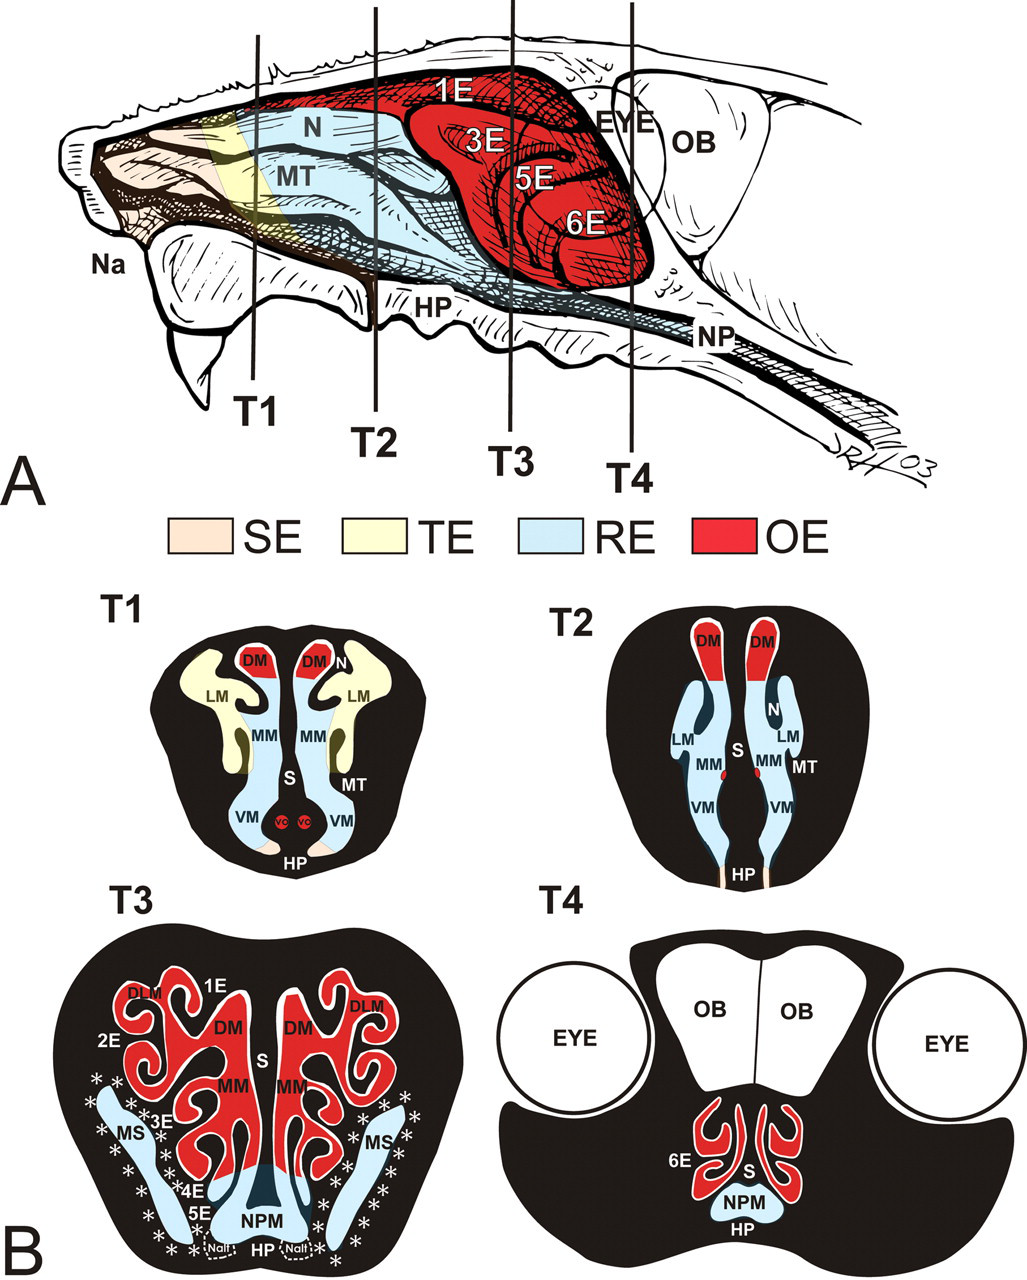
Location of nasal epithelial populations (A), right nasal passage of the murine nose with septum removed, exposing nasoturbinate (N), maxilloturbinate (MT), and ethmoid turbinates (E1-6); vertical lines indicate anterior surfaces of transverse tissue blocks (T1-T4) that were selected for microscopic examination. SE, squamous epithelium; TE, transitional epithelium; RE, respiratory epithelium; OE, olfactory epithelium; Na, naris; NP, nasopharynx; OB, olfactory bulb; HP, hard palate. (B) Cross-sectional views of T1-4. DM, dorsal medial meatus; LM, lateral meatus; N, nasoturbinate; MM, middle medial meatus; MT, maxilloturbinate; S, septum; VO, vomeronasal organ; VM, ventral meatus; HP, hard palate; DLM, dorsal lateral meatus; 1E, ethmoid turbinate one; 2E, ethmoid turbinate two; 3E, ethmoid turbinate three; 4E, ethmoid turbinate four; 5E, ethmoid turbinate five; MS, maxillary sinus; NPM, nasopharyngeal meatus; 6E, ethmoid turbinate six; OB, olfactory bulb; Nalt, nasal associated lymphoid. Asterisks = anatomical location of the lateral nasal glands (LNG).
Nasal tissue blocks were processed for histopathologic, immunohistochemical, and morphometric analyses. All of these blocks were embedded in paraffin, and the anterior face of each block was sectioned at a thickness of 5 microns and stained with hematoxylin and eosin for routine light microscopic examination. Additional slides were stained with Alcian Blue (pH 2.5)/Periodic Acid Schiff (AB/PAS) to identify acidic and neutral mucosubstances stored in mucus-secreting cells of airway surface epithelium and underlying nasal glands (septal and lateral nasal glands and Bowman’s glands).
Immunohistochemistry
Additional tissue sections were immunohistochemically stained to identify neutrophils in the nasal mucosa (cellular marker of inflammatory response) and mature OSNs in olfactory epithelium (OE). Tissue sections intended for olfactory marker protein (OMP; present only in mature OSNs) immunohistochemistry, T1-T4, were first incubated with a nonspecific protein-blocking solution containing normal sera (Vector Laboratories Inc., Burlingame, CA, USA). The sections were then pretreated with 3% H2O2 in methanol to eliminate endogenous peroxidase. The sections were then transferred to a 1:4,000 dilution of primary polyclonal antibodies directed against OMP-containing sensory neurons (goat anti-OMP antibody provided by Dr. Frank Margolis, University of Maryland). Sections were incubated in biotinylated antispecies IgG. Immunoreactivity of OMP was visualized using Vector R.T.U. Elite ABC-Peroxidase Reagent (Vector Laboratories Inc.) followed by Nova Red Chromagen (Vector Laboratories Inc.).
T1-T4 sections designated for anti-neutrophil staining were first incubated with a nonspecific protein-blocking solution containing normal sera (Vector Laboratories Inc.). The sections were then transferred to a 1:200 dilution of primary monoclonal antibodies directed against neutrophils (rabbit anti-rat neutrophil antibody provided by Dr. Robert Roth, Michigan State University). Anti-neutrophil antibody treatment was followed by anti-rabbit IgG, Strepavidin-Phosphatase complex (KPL Laboratories, Gaitherburg, MD, USA), and Fast Red chromagen. Following immunohistochemistry, slides were lightly counterstained with hematoxylin.
Light Microscopy and Morphometric Analysis
Standard morphometric techniques were used to estimate the numeric cell density of OSNs in the OE lining the medial surface of second ethmoid turbinates (2E; T3), the dorsal meatus (DM; T2), and the septal vomeronasal organ (VO; T1) (Figure 1). All cell counts were determined using light microscopy at a final magnification of 790×. Numeric cell density was quantitatively estimated by counting the number of nuclear profiles of OMP-positive cells and dividing by the length of the underlying basal lamina. The length of basal lamina was determined by measuring the contour of the basal lamina on a digital image using Scion Image (Scion Corporation, Fredrick, MD, USA).
To morphometrically estimate the severity of the nasal inflammatory response, nuclear profiles of immunohistochemically stained neutrophils were counted in the nasal mucosa lining the maxilloturbinates (MT) in T1. Numeric cell densities for these inflammatory cells were calculated in the same way as OSNs and expressed as the number of neutrophils per length of basal lamina.
Thickness of OE lining the medial surface of the olfactory epithelium (OE) lining (1) the dorsal medial meatus (T2) and (2) the medial surface of ethmoid turbinate two (ET2) was morphometrically estimated using a standard cycloid grid overlay and computer software specifically designed for point and intercept counting (Stereology Toolbox, Davis, CA, USA) as previously described in detail (Hyde et al. 1990; Hyde, Magliano, and Plopper 1991; Islam, Harkema, and Pestka 2006). Briefly, microscopic measurements were made at a final magnification of 1,920× using a light microscope coupled to a 3.3 megapixel digital camera (Q-color 3 Camera, Quantitative Imaging Corp., Burnaby, BC, Canada) and a Dell Dimension 8200 (Dell, Austin, TX, USA). The thickness (τ) of OE, as measured by volume (μm3) of OE per unit area (μm2) of basal lamina, was estimated from point and intercept counts with a 136-point, 35-curve cycloid grid using the equation τ = (3.2 × Pp)/(2 × Io), where Pp is the number of points counted for the OE and Io is the number of intercepts of the basal lamina. OE thickness at the two intranasal sites was calculated for each mouse from point and intercept counts covering the entire dorsal medial meatus (T2) and the entire medial surface of ET2 in both the right and left nasal airways.
The volume density (Vs) of AB/PAS-stained mucosubstances in the respiratory epithelium lining the nasopharyngeal meatus (NPM) in the T4 nasal section was quantified using computerized image analysis and standard morphometric techniques. The area of AB/PAS-stained mucosubstance was calculated from the automatically circumscribed perimeter of stained material using a Dell XPS 400 computer and Scion Image (Scion Corporation). Basal laminar length was calculated from the contour length on the digitized image. The volume of mucosubstances per unit of surface area of basal lamina was estimated using a previously described method (Harkema et al. 1987). The Vs of the intraepithelial mucosubstances was expressed as nanoliters of mucosubstance per mm2 of basal lamina.
The Vs of AB/PAS-stained mucosubstances in subepithelial Bowman’s glands in the lamina propria of ethmoid turbinate two in the T3 nasal section was quantified using a technique similar to that described above. The Vs of mucosubstances in Bowman’s glands was also expressed as nanoliters of mucosubstance per mm2 of basal lamina.
The Vs of AB/PAS-stained mucosubstances in the Lateral Nasal glands (LNG, Stenos Glands) surrounding the maxillary sinus in T3 was quantified using image analysis and standard morphometric techniques. The area of AB/PAS-stained mucosubstance was calculated from the automatically circumscribed perimeter of stained material using a Dell XPS 400 computer and Scion Image (Scion Corporation). The length of the basal lamina underlying the modified respiratory epithelium lining the maxillary sinus was calculated from the contour length on the digitized image. The dorsal, ventral, and medial areas of the glands, which contain PAS-staining mucosubstances, were selected for measurement purposes. The volume of mucosubstances per unit of surface area of basal lamina was estimated using a previously described method (Harkema et al. 1987). The Vs of the mucosubstances was expressed as nanoliters of mucosubstance per mm2 of basal lamina.
Nasal Lavage, Cytology, and Flow Cytometry
The nasal passages of mice receiving 0 and 250 μg/kg bw RA and sacrificed at 1 day after the last instillation were lavaged immediately after death and prior to tissue fixation with 500 μL of saline retrograde through the nasopharyngeal meatus using a 20-gauge cannula and a 1 mL syringe. Approximately 98% of the lavage fluid was recovered. Of the collected nasal lavage fluid, 85 μL was taken for cytospin and 10 μL was taken for hemocytometry. After the cytospin was complete, the slides were prepared and stained using a standard Diff Quick staining protocol (Dade Behring, Newark, DE, USA). Differential cell counts were used to quantify cells on stained slides.
The concentrations of Interleukin-6 (IL-6), Interleukin-10 (IL-10), Monocyte Chemotactic Protein-1 (MCP-1), Tumor Necrosis Factor-alpha (TNF-α), Interferon-gamma (IFN-γ), and Interleukin-12 (IL-12) in nasal lavage fluid were determined using Cytometric Bead Array (CBA) Mouse Inflammation Kit (BD Biosciences, San Diego, CA, USA). Concentrations of Interleukin-2 (IL-2), Interleukin-4 (IL-4), and Interleukin-5 (IL-5) were also determined using a Cytometric Bead Array mouse T-helper one/T-helper two (Th1/Th2) Cytokine CBA (BD Biosciences, San Diego, CA). Th1 cytokines include MCP-1, TNF-α, IFN-γ, IL-2, and IL-12. Th2 cytokines include IL-4, IL-5, IL-6, and IL-10. Measurements were carried out according to manufacturer’s instructions using a FACSCalibur and BD CBA Analysis software (BD Biosciences, San Jose, CA, USA). Cytokine concentrations are expressed as pg/ml.
Real-Time PCR for Inflammatory Cytokines and Chemokines
Animals designated for real-time PCR (rt-PCR) analysis of nasal and brain tissues (only mice exposed to 0 or 250 μg/kg bw RA) were sacrificed 24 hr after the final intranasal instillation of RA. The head of each mouse was removed and the skin, muscles, eyes, and lower jaw were removed from the head. The nose was split in a saggital plane adjacent to the midline of the head. The nasal septum was removed to expose the nasal turbinates, found on the lateral wall of each nasal passage. A dissection microscope and ophthalmic surgical instruments were used to remove the ethmoid turbinates (ET), maxillo- and naso-turbinates (MNT), and OB. Collected tissues were then submerged in an appropriate volume of RNAlater™ (Ambion Inc., Austin, TX, USA). RNA was isolated using RNeasy® Protect Mini kit (Qiagen Inc. Valencia, CA, USA) within 7 days of tissue collection. Rt-PCR for cytokine genes Interleukin-1 (IL-1), IL-6, TNF-α, inducible Nitric Oxide Synthase (iNOS), MCP-1, mucin 5b (MUC5b), and Macrophage Inflammatory Protein-2 (MIP-2) were performed on an ABI PRISM® 7900HT Sequence Detection System using Taqman One-Step RT-PCR Master Mix and Assays-on-Demand™ primer/probe gene expression products according to the manufacturer’s protocols (Applied Biosystems, Foster City, NY, USA). Relative quantification of gene expression was carried out using an 18S RNA control and an arithmetic formula method as previously described (Islam, Harkema, and Pestka 2006; Audige et al. 2003).
Statistics
All data were analyzed using SigmaStat v. 3.1 (Jandel Scientific, San Rafael, CA, USA). Criterion for significance was set at p < .05. Morphometric data were analyzed using a one-way or two-way analysis of variance (ANOVA) with Student-Newman-Keuls post hoc test. The dose-response effects of RA were evaluated by comparing groups receiving RA to a control group receiving only the saline vehicle. The persistence of nasal lesions, quantified using morphometric techniques, was evaluated by comparing groups receiving RA to their respective saline vehicle controls, as well as comparing groups sacrificed at 1 day and 3 weeks after the last instillation of RA.
Results
Animal Responses to RA Instillations
In the initial dose-response study, no significant clinical signs were observed in mice repeatedly instilled with doses of 50 μg/kg bw RA or less. Mice in the initial study instilled with the highest dose of RA, 250 μg/kg bw, became markedly lethargic with signs of respiratory distress (dyspnea) by the 9th day of RA instillation. It was therefore decided not to continue with the high-dose intranasal instillations and to sacrifice these mice the following day. These mice received a total of 9 instillations, with sacrifice on day 10.
Repeated Intranasal RA Exposure Induced Dose-Dependent Rhinitis and Mucus Hypersecretion at 1 Day Postexposure
As an illustrative guide to complement the nasal histopathology described below, Figure 1 provides a diagrammatic representation of the key intranasal landmarks and surface epithelial cell populations lining the nasal airways (meatus) throughout the murine nose.
Repeated RA instillations induced nasal epithelial and inflammatory lesions predominantly in mice that received the two highest doses (50 and 250 μg/kg bw). Only minimal epithelial changes were found in mice instilled with 10 μg/kg bw RA, and no nasal lesions were present in any of the mice receiving lower doses of RA or the saline vehicle alone. Mice instilled with the highest dose of RA and sacrificed 24 hr after the 9th daily instillation had a severe, bilateral rhinitis characterized by a marked, mixed, inflammatory cell infiltrate composed mainly of neutrophils and lesser numbers of mononuclear cells (lymphocytes and monocytes). This exposure-induced neutrophilic rhinitis was also associated with marked mucosal edema and atrophy of airway surface epithelium. Inflammatory changes in the mucosal tissues were present throughout the nasal airways (T1-T4), but slightly more severe in the proximal airways (T1-2 compared to T3-4).
Concurrent with RA-induced rhinitis, there were copious amounts of secreted AB/PAS-stained mucus, containing inflammatory cells (mainly neutrophils) and epithelial cellular debris, in the proximal and distal nasal airway lumena of high-dose RA-instilled mice (Figure 2 ). Mucopurulent material partially occluded some of the smaller meatuses between the ETs in the more distal nasal sections (T3, T4). Considerably less luminal mucus was present in the nasal airways of mice that received 50 μg/kg bw RA. Although these mice had conspicuous RA-associated nasal inflammatory and epithelial lesions of the same morphologic character as the high-dose RA mice, these changes were less severe, as reflected in the morphometric analyses described below.
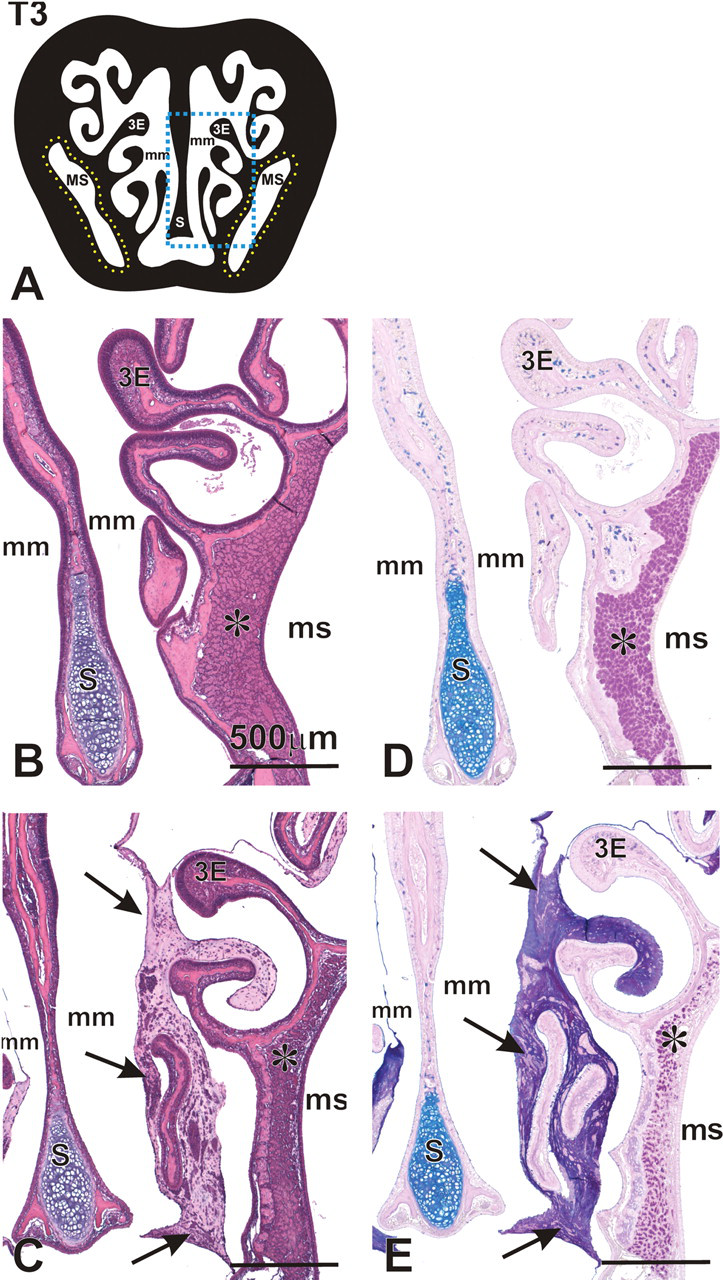
Airway mucosubstances in nasal section T3 of mice instilled with 250 μg/kg RA. (A) Cross-section representation of nasal section T3. Blue box indicates area represented in panels B-E. Yellow outline indicates anatomical location of lateral nasal glands (LNG) surrounding the maxillary sinus (MS). 3E, ethmoid turbinate 3; mm, medial meatus. (B–E) Photomicrographs of H&E (B,C) or AB/PAS (D,E) stained nasal section T3 in animals intranasally instilled with saline (B,D) or RA (C,E). Arrows indicate significant accumulation of mucus in the airways of animals instilled with RA. Asterisk indicates the lateral nasal glands surrounding the maxillary sinus (MS), with loss of AB/PAS-staining mucosubstances in mice instilled with RA (C,E). 3E, ethmoid turbinate 3; mm, medial meatus; S, septum.
In the most proximal nasal sections (T1, T2) of RA mice exposed to the two highest doses of RA, there was marked interstitial edema and neutrophil infiltration in the mucosal tissues lining the MNT (Figure 3 ) and to a slightly lesser degree in the mucosa lining the lateral walls and nasal septum. Mice repeatedly instilled with 50 and 250 μg/kg bw RA had 8- and 16-fold more neutrophils in the mucosa lining the maxilloturbinates (T1) compared to that in saline-instilled control mice (Figure 4 ). The numeric densities of neutrophils in the maxilloturbinates of mice exposed to 10 μg/kg bw RA, or lower doses, did not differ significantly from those of control mice.
Marked edema and neutrophilic influx (rhinitis) of the maxilloturbinate (MT) and lateral wall in nasal section T1. Light photomicrographs of the MT and lateral wall from mice instilled with saline alone (A,D) or 250 μg/kg bw RA (B,E,F). Blue rectangle in (C) indicates the location of photomicrographs in nasal section T1. Tissues A and B were stained with H & E. Tissues D, E, and F were immunohistochemically stained with a monoclonal antibody directed against murine neutrophils (red-stained cells indicated by arrows). Rectangle in E indicates the location of the tissue in F; e, nasal transitional epithelium; lp, lamina propria; tb, turbinate bone; DM, dorsal meatus; LM, lateral meatus; MM, medial meatus; S, septum; VM, ventral meatus; VO, vomeronasal organ; HP, hard palate.
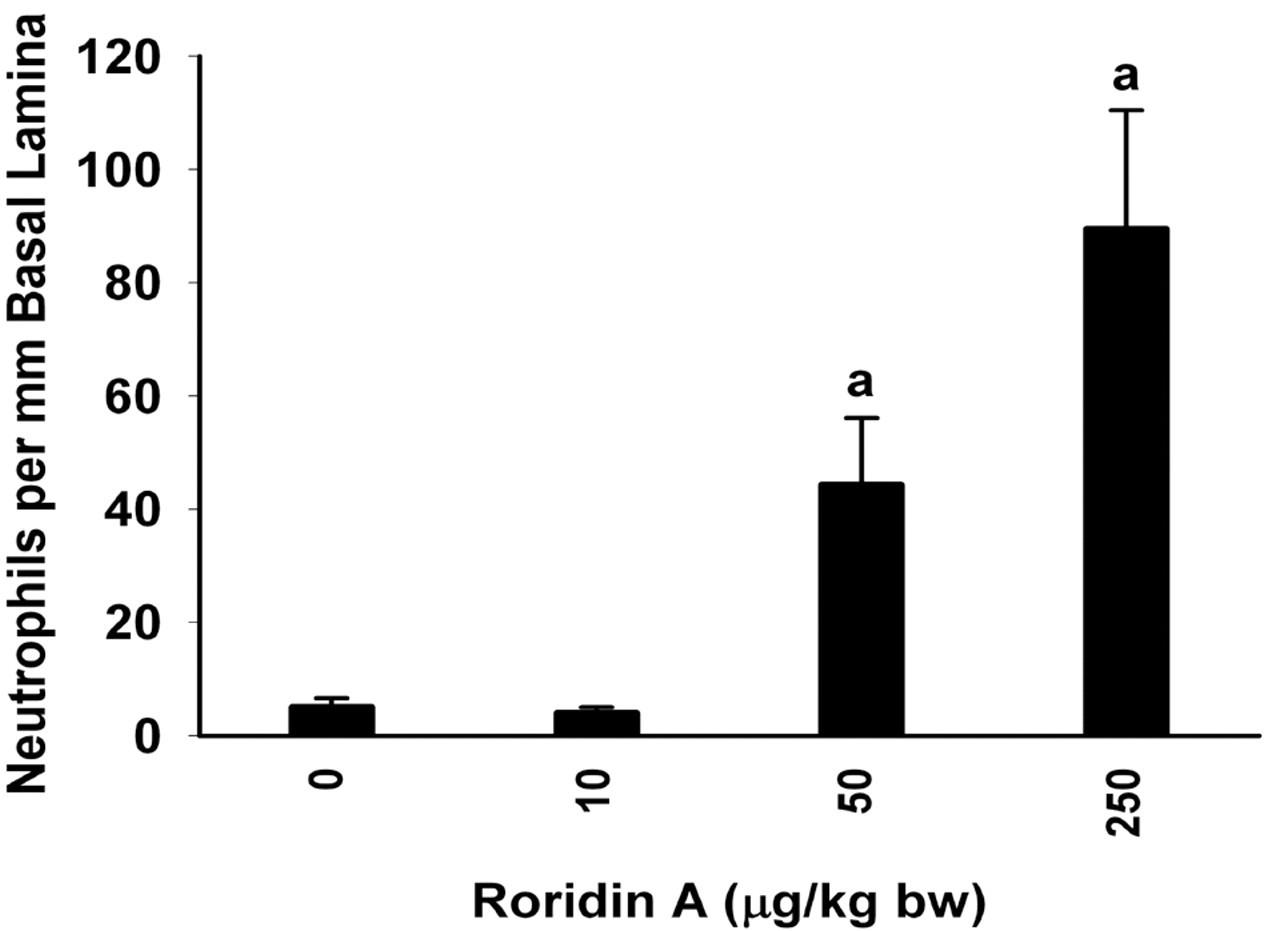
Dose-dependent neutrophilic rhinitis in mice instilled with RA. Significant neutrophilic influx in the epithelium and lamina propria (mucosa) of mice instilled with 50 or 250 μg/kg bw RA. Bars represent group means ± standard error of the mean (SEM); a indicates significantly different from respective saline control group (p < .05).
In mice exposed to 50 or 250 μg/kg bw RA, nasal transitional epithelium (NTE) lining the lateral meatus in T1 was minimally to markedly atrophic due to toxin-induced epithelial degeneration, necrosis and exfoliation (Figure 3). In a few areas, the normally low cuboidal, nonciliated NTE was replaced by a thin, squamoid, regenerative epithelium. In addition, there was histologic evidence of necrosis of turbinate bone (mild loss of trabecular bone with numerous lacunae without osteocytes), which was most prominent in the proximal aspects of maxilloturbinates of mice instilled with the highest dose of RA.
Interestingly, RA induced only minimal to mild changes to respiratory epithelium (RE) lining the mid and dorsal nasal septum (T1, T2), the dorsal meatus (T1), lateral wall (T2), and distal aspects of the MNT (T2). In some focal sites, there was attenuation or loss of surface cilia with replacement of the RE with a thin nonciliated, low cuboidal, or squamoid regenerative epithelium. These changes in RE were more severe and consistent in mice instilled with 250 μg/kg bw, compared to those instilled with 50 μg/kg bw RA.
Concomitant with the marked accumulation of luminal mucus in the nasal airways of high-dose RA mice, there was conspicuous loss of AB/PAS-stained mucosubstances in the mucous goblet cells of RE lining the mid and ventral aspects of the proximal septum (T1) and the more distal nasopharyngeal meatus (NPM) (T4; Figure 5 ). Compared to saline-instilled control mice, animals exposed to 50 and 250 μg/kg bw RA, had 42% and 86% less AB/PAS-stained mucosubstances in RE of the NPM, respectively. In contrast, mice exposed to 10 μg/kg bw RA had a 48% increase in stored mucosubstances in the RE lining the NPM, as compared to controls (Figure 5).
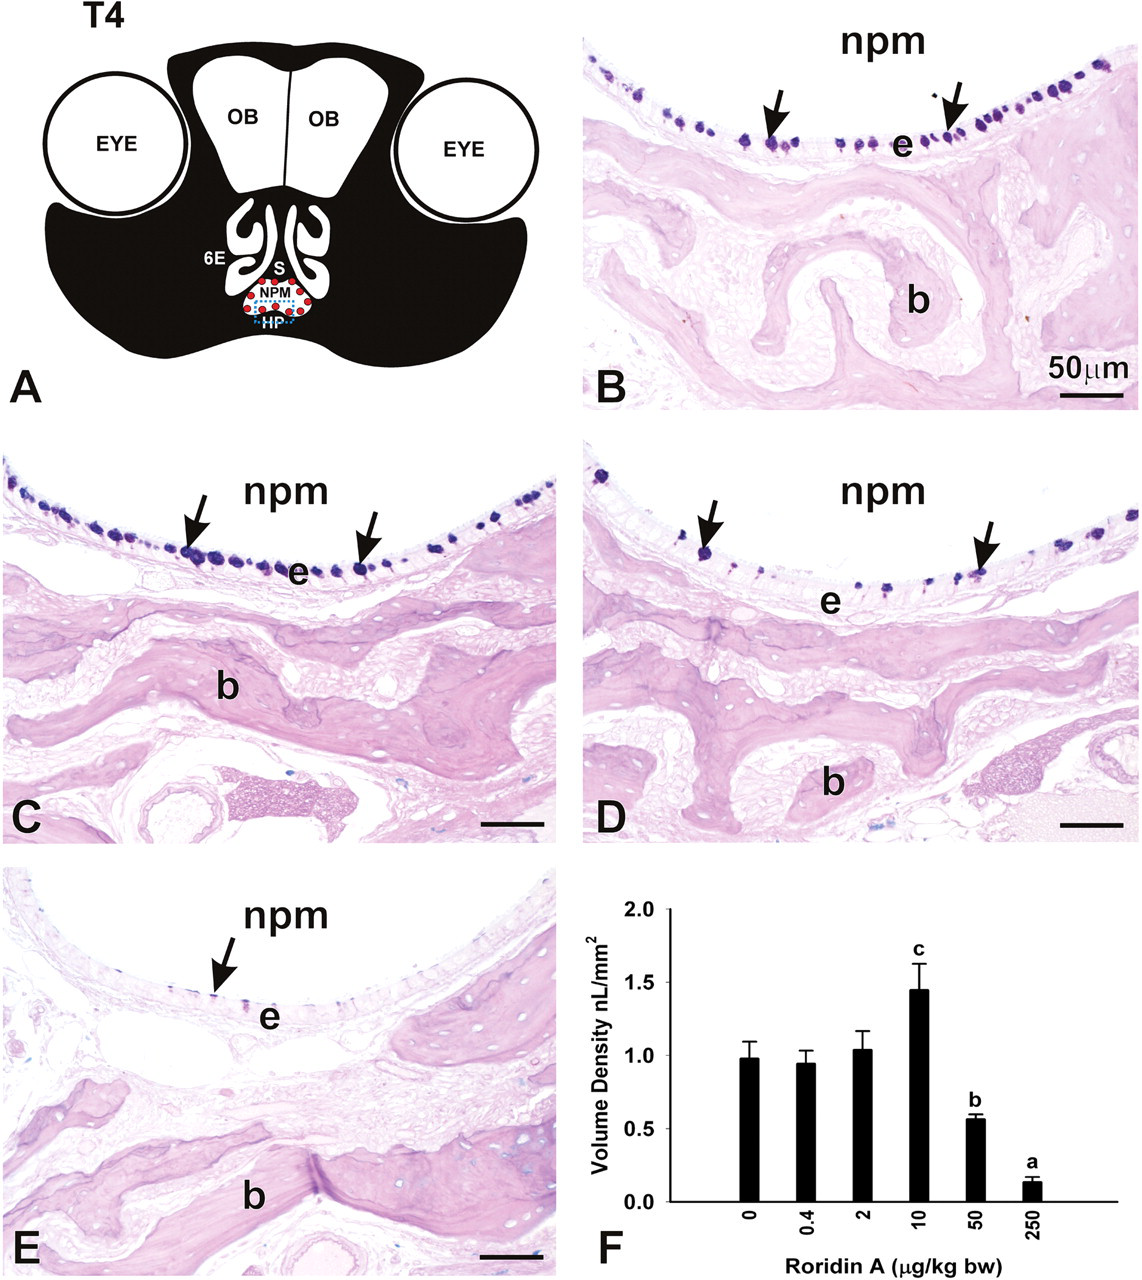
RA-induced changes in the volume density (Vs) of mucus in the respiratory epithelium lining the NPM. (A) Diagrammatic representation of nasal section T4. Red dots indicate location of morphometric measurement of mucus Vs. Blue rectangle indicates the location of photomicrographs. OB, olfactory bulb; 6E, ethmoid turbinate 6; S, septum; HP, hard palate. (B-E) Light photomicrographs of mucus (arrows) in respiratory epithelium (e) in animals instilled with saline alone (B), 10 μg/kg (C), 50 μg/kg bw (D), or 250 μg/kg bw RA (E). b, bone. (F) Dose-dependent changes in the Vs of mucus in the epithelium lining the NPM. Bars represent group means ± standard error of the mean (SEM). a indicates significantly different from respective saline control group, b indicates significantly different from saline and 250 μg/kg bw groups, and c indicates significantly different from saline, 50 μg/kg bw, and 250 μg/kg bw groups, (p < .05).
In addition to the decreases in stored mucosubstances in the RE lining the nasal airways, mice instilled with the two highest doses of RA had marked loss of AB/PAS-stained mucosubstances in nasal glands located in the subepithelial lamina propria of the proximal septum (septal glands; T1, T2) and in the lateral wall surrounding the maxillary sinus (T3; lateral nasal gland [LNG]; Figure 6 ). Mice instilled with 50 and 250 μg/kg bw RA had 55% and 95% less AB/PAS-stained mucosubstances in the LNG, respectively, as compared to saline-instilled control mice (Figure 6). Interstitial edema and neutrophil infiltration were also present in the interstitial tissue surrounding these affected glands. With this marked loss of intracellular mucosubstances, there was also bilateral atrophy of the glandular tissue, but without histologic evidence of glandular epithelial cell necrosis or apoptosis. No significant exposure-related histologic changes were present in the nasal glands of mice that were repeatedly instilled with lower RA doses of 0.4, 2, or 10 μg/kg bw.
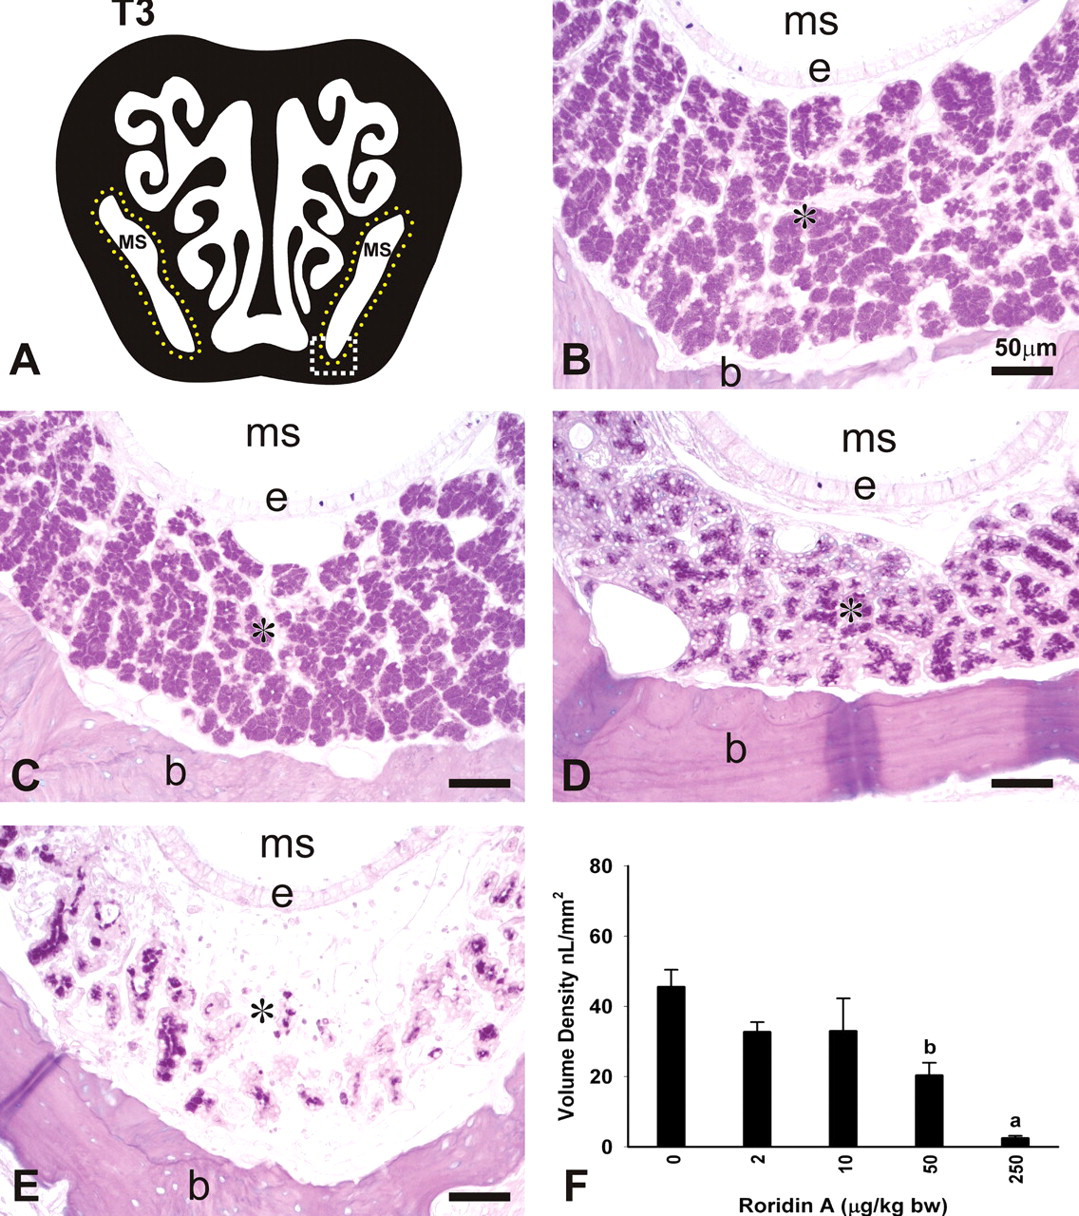
RA-induced changes in the volume density (Vs) of mucus in the LNG. (A) Diagrammatic representation of nasal section T3. Yellow dots indicate the location of the LNG surrounding the maxillary sinus (MS). White rectangle indicates the location of photomicrographs. (B-E) Light photomicrographs of the LNG (asterisk) of mice instilled with saline alone (B), 10 μg/kg bw (C), 50 μg/kg bw (D), or 250 μg/kg bw RA (E). e, respiratory epithelium lining the MS; b, bone. (F) Dose-dependent decreases in the Vs of mucus in the LNG of mice instilled with 50 or 250 μg/kg bw RA. Bars represent group means ± standard error of the mean (SEM). a indicates significantly different from respective saline control and 50 μg/kg bw groups; b indicates significantly different from respective saline control group (p < .05).
In contrast to RA-induced changes in intraepithelial mucosubstance concentrations in RE lining the airway surfaces and the subepithelial nasal glands, there was no histologic evidence of any change in the amount or character of mucosubstances in Bowman’s glands underlying the OE one day after the final RA exposure. Morphometric determinations of the Vs of mucosubstances in these olfactory glands in ET2 (T3) did not statistically differ among the experimental groups (saline controls similar to RA-exposed mice; data not shown).
Repeated RA Exposure Induces OE Atrophy and Loss of OSNs
Another prominent nasal epithelial lesion that was present in both the 50 and 250 μg/kg bw RA-instilled mice was widespread atrophy of the OE that normally lines the dorsocaudal regions of the nasal airways (T1-T4; Figures 7, 8 ). Marked OE atrophy correlated closely with selective loss of OMP-stained OSNs, rather than a loss of adjacent sustentacular or basal cells in this neuroepithelial tissue. There was also concomitant atrophy of nerve bundles in the lamina propria underlying the affected OE. Associated with these neuroepithelial changes was a minimal to moderate inflammatory cell influx (mainly neutrophils) in the lamina propria, and to a lesser extent in the OE.
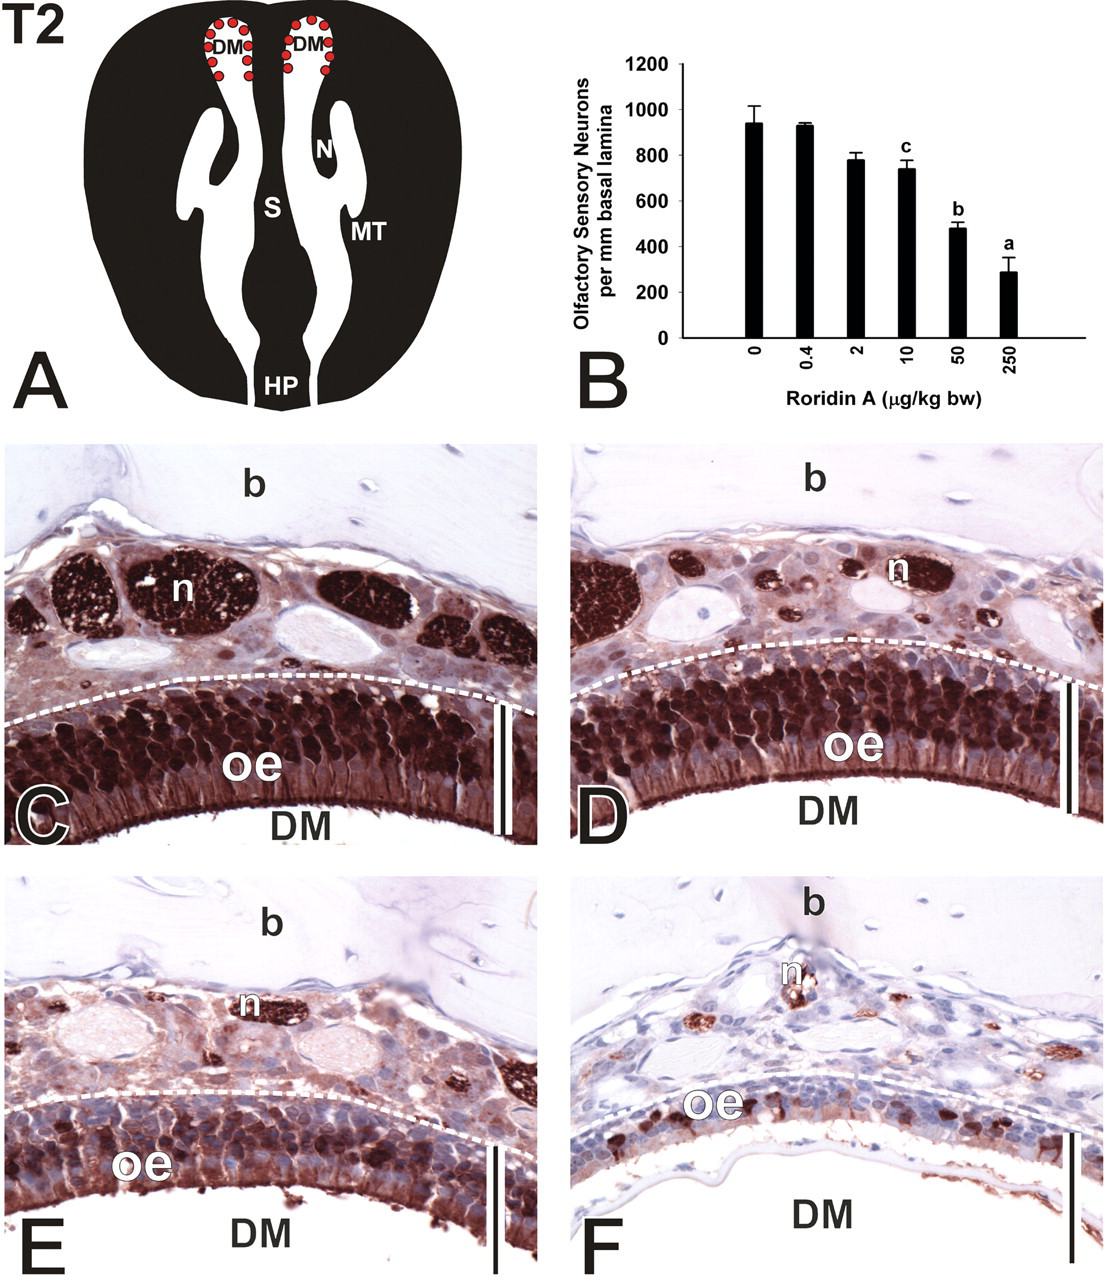
Loss of OSNs in the DM of T2. (A) Diagrammatic representation of nasal section T2. Red dots indicate location of morphometric analysis and photomicrographs. (B) Dose-dependent loss of OSNs in the DM. Bars represent group means ± standard error of the mean (SEM). a indicates significantly different from respective saline control, 50 μg/kg bw, and 10 μg/kg bw groups; b indicates significantly different from respective saline control and 10 μg/kg bw groups; c indicates significantly different from respective saline control group (p < .05). (C–F) Photomicrographs of OMP-stained tissue sections from mice instilled with saline (C), 10 μg/kg bw (D), 50 μg/kg bw (E), and 250 μg/kg bw RA (F). Bar = 50 µm. DM, dorsal meatus; oe, olfactory epithelium; n, nerve bundle; b, bone.
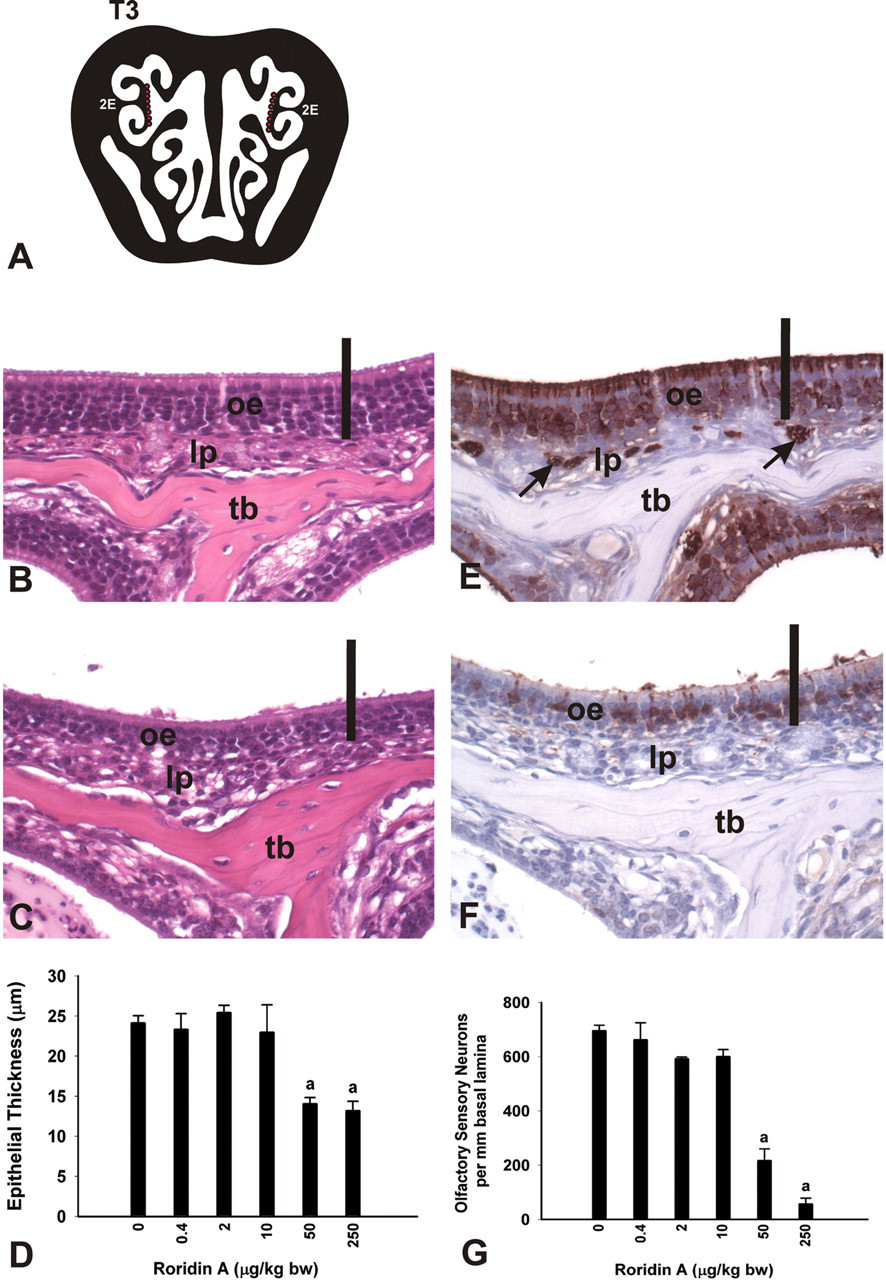
Dose-dependent atrophy of OE and loss of OSNs. (A) Diagrammatic representation of nasal section T3. Red dots indicate location of photomicrographs and morphometric analyses. 2E, ethmoid turbinate 2. (B,C,E,F) Light photomicrographs of mice instilled with saline alone (B,E) and 250 μg/kg bw RA (C,F). Sections were stained with H & E (B,C) or an antibody directed against OMP (E,F). oe, olfactory epithelium; lp, lamina propria; tb, turbinate bone; arrows indicate OMP-stained nerve bundles. Bar = 50 μm. (D,G) Morphometric analyses of the thickness of olfactory epithelium (OE) lining 2E (D) and the number of olfactory sensory neurons (OSNs) per mm basal lamina (G). Bars represent group means ± standard error of the mean (SEM). a indicates significantly different from respective saline control group (p < .05).
Compared to saline-instilled controls, mice exposed to 250 μg/kg bw RA had a 51% reduction in OE thickness (atrophy) and 70% less OMP-stained OSNs in the OE lining the DM T2 at 1 day postexposure. Although mice exposed to 10 and 50 μg/kg bw RA had no morphometrically detected reductions in OE thickness, these mice had significant losses of OMP-stained OSNs in the DM of 21% and 50%, respectively (Figure 7).
In a more distal intranasal site lined by OE, the medial aspect of ET2, mice exposed to 50 and 250 μg/kg bw RA had 41% and 45% reductions in OE thickness (atrophy) with 69% and 92% less OMP-stained OSNs, respectively, compared to saline-instilled control mice (Figure 8). Mice exposed to 10 μg/kg bw RA or less had no morphometrically detectable alterations in either OE thickness or OSN numeric density.
Concurrent with the dramatic loss of OMP-positive OSNs in the OE and lamina propria in the nasal mucosa of mice exposed to the highest dose of RA, there was also marked, bilateral atrophy and vacuolation of the outer tissue layer (olfactory nerve layer) of the olfactory bulbs (OB; T4; Figure 9 ). Loss of OMP staining was also evident in the adjacent glomerular layer of the OB where axons of OSNs first synapse with other neurons of the brain. A conspicuous influx of neutrophils was also present in these affected areas of the brain (i.e., minimal neutrophilic encephalitis; Figure 9). These histopathologic changes were also evident, but to a lesser degree, in mice exposed to 50 μg/kg bw, but not to lower doses of RA.
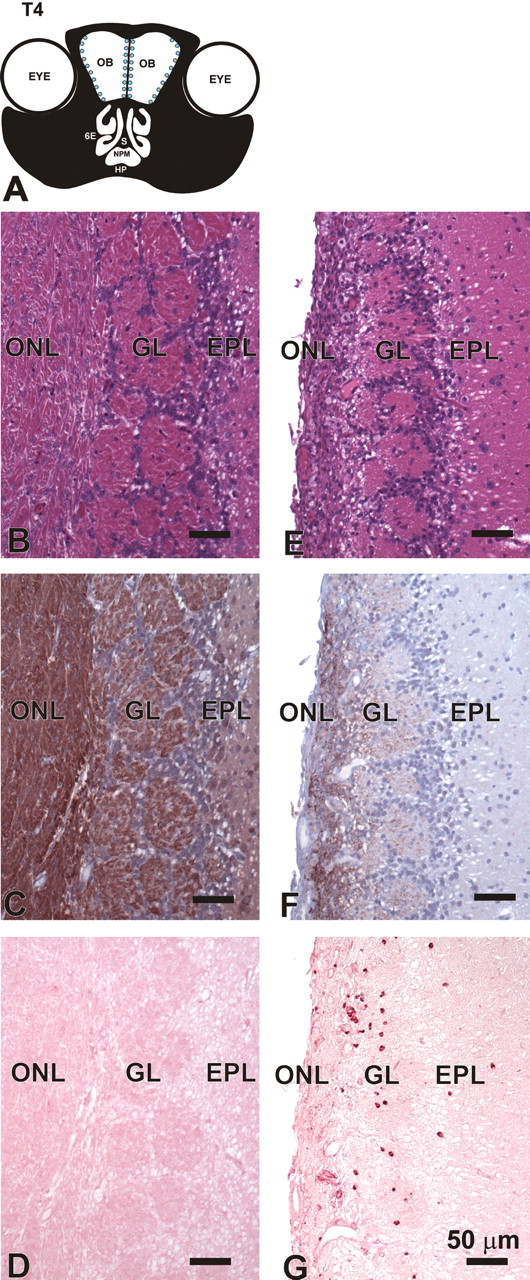
Atrophy and inflammation of the OB. (A) Diagrammatic representation of nasal section T4. Blue dots indicate area of atrophy. OB, olfactory bulb; 6E, ethmoid turbinate 6; S, septum; NPM, nasopharyngeal meatus; HP, hard palate. (B–G) Light photomicrographs of outer layers of the OB in T4 of mice instilled with saline alone (B,C,D) or 250 μg/kg bw RA (E,F,G). Tissues B,E stained with H & E. Tissues C,F immunohistochemically stained to detect OMP in OSNs located in the olfactory neuronal layer (ONL) and glomerular layer (GL). Tissues D,G immunohistochemically stained with an antibody directed against murine neutrophils. EPL, external plexiform layer.
Interestingly, only mice exposed to 250 μg/kg bw RA exhibited atrophy of the OE in the bilateral vomeronasal organ located within the ventral septum in T1 (Figure 10 ) and the OE of the organ of Massera (septal organ) bilaterally lining small focal areas in the proximal ventral septum (T2). As observed in the OE lining the main nasal airways, OE atrophy in these intranasal chemosensory organs corresponded to a selective loss of OSNs (Figure 10). Mice exposed to the RA high dose had 83% less OSNs in the VO, compared to saline-controls, at 1 day postexposure (Figure 10).
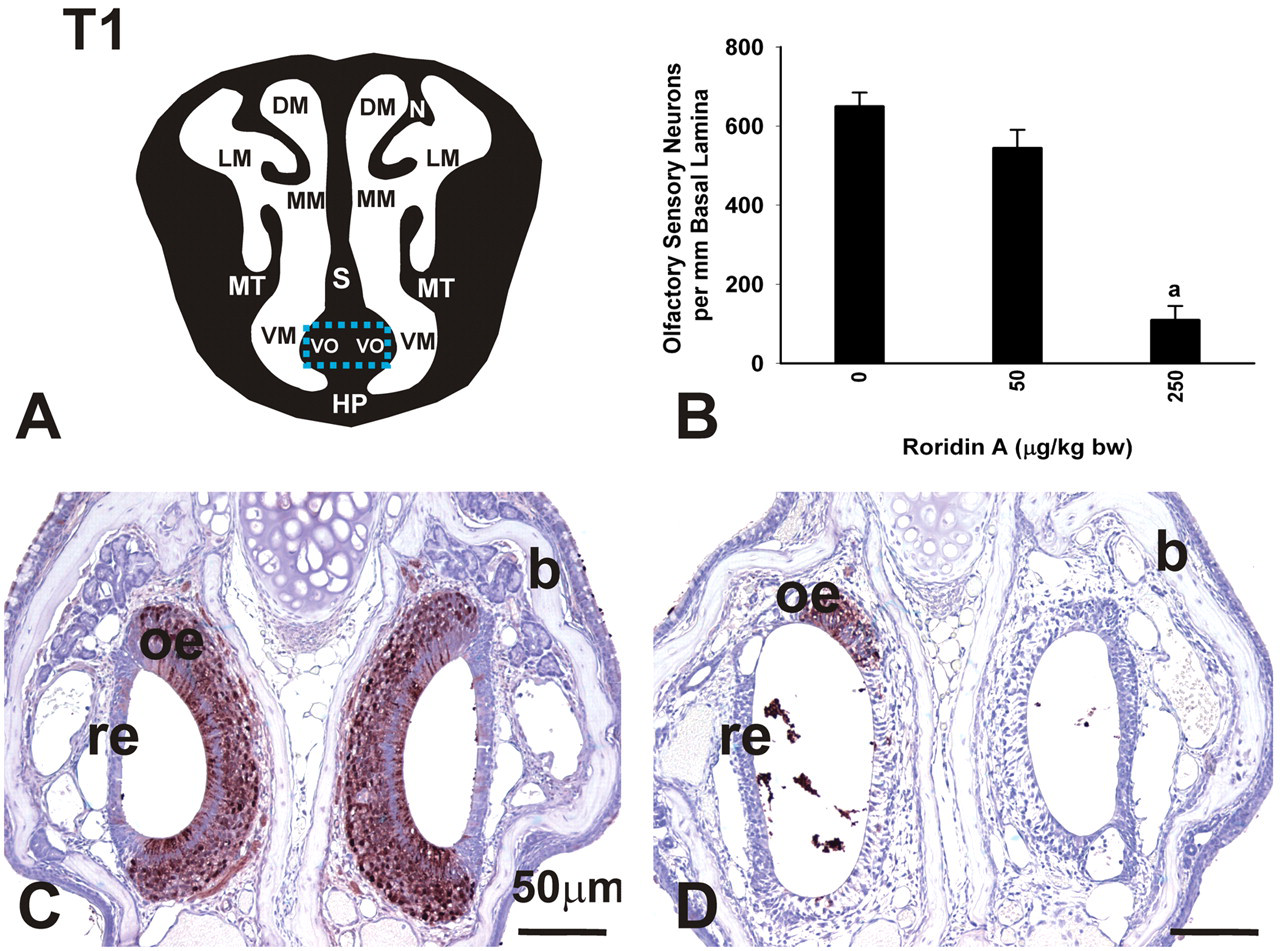
Loss of OSNs in the VO. (A) Diagrammatic representation of nasal section T1. Blue rectangle indicates location of photomicrographs and morphometric analysis. DM, dorsal meatus; LM, lateral meatus; MM, medial meatus; MT, maxilloturbinate; S, septum; VM, ventral meatus; VO, vomeronasal organ; HP, hard palate. (B) Loss of OSNs in the vomeronasal organ (VO). Mice instilled with 250 μg/kg bw had significantly fewer OSNs per mm basal lamina than saline control mice. Bars represent group means ± standard error of the mean (SEM). a indicates significantly different from respective saline control group (p < .05). (C,D) Light photomicrographs of the VO in mice instilled with saline alone (C) or 250 μg/kg bw RA (D). Tissues were stained with an antibody directed against OMP. Mice instilled with RA had significant loss of OSNs. oe, olfactory epithelium; re, respiratory epithelium; b, bone.
RA Induces Neutrophil Infiltration and Inflammatory Cytokines in Nasal Lavage Fluid
Nasal lavage fluid from saline-instilled control mice contained only a few nasal epithelial cells and only occasional neutrophils or other inflammatory cells. In contrast, nasal lavage fluid from mice repeatedly instilled with 250 μg/kg bw RA contained numerous neutrophils and a few epithelial cells (Figure 11 ). Nasal lavage fluids from saline controls and 250 μg/kg bw RA mice were analyzed for IFN-γ, TNF-α, MCP-1, IL-6, IL-10, IL-12, IL-2, IL-4, and IL-5. IL-2, IL-4, and IL-5 were not detected in any samples. Levels of IFN-γ, IL-10, and IL-12 were similar in controls and RA-exposed mice. Statistically significant increases in TNF-α, MCP-1, and IL-6 were detected in the lavage fluid of RA-instilled mice, and these were 12-fold, 28-fold, and 109-fold greater than the nasal lavage from controls, respectively (Figure 11).
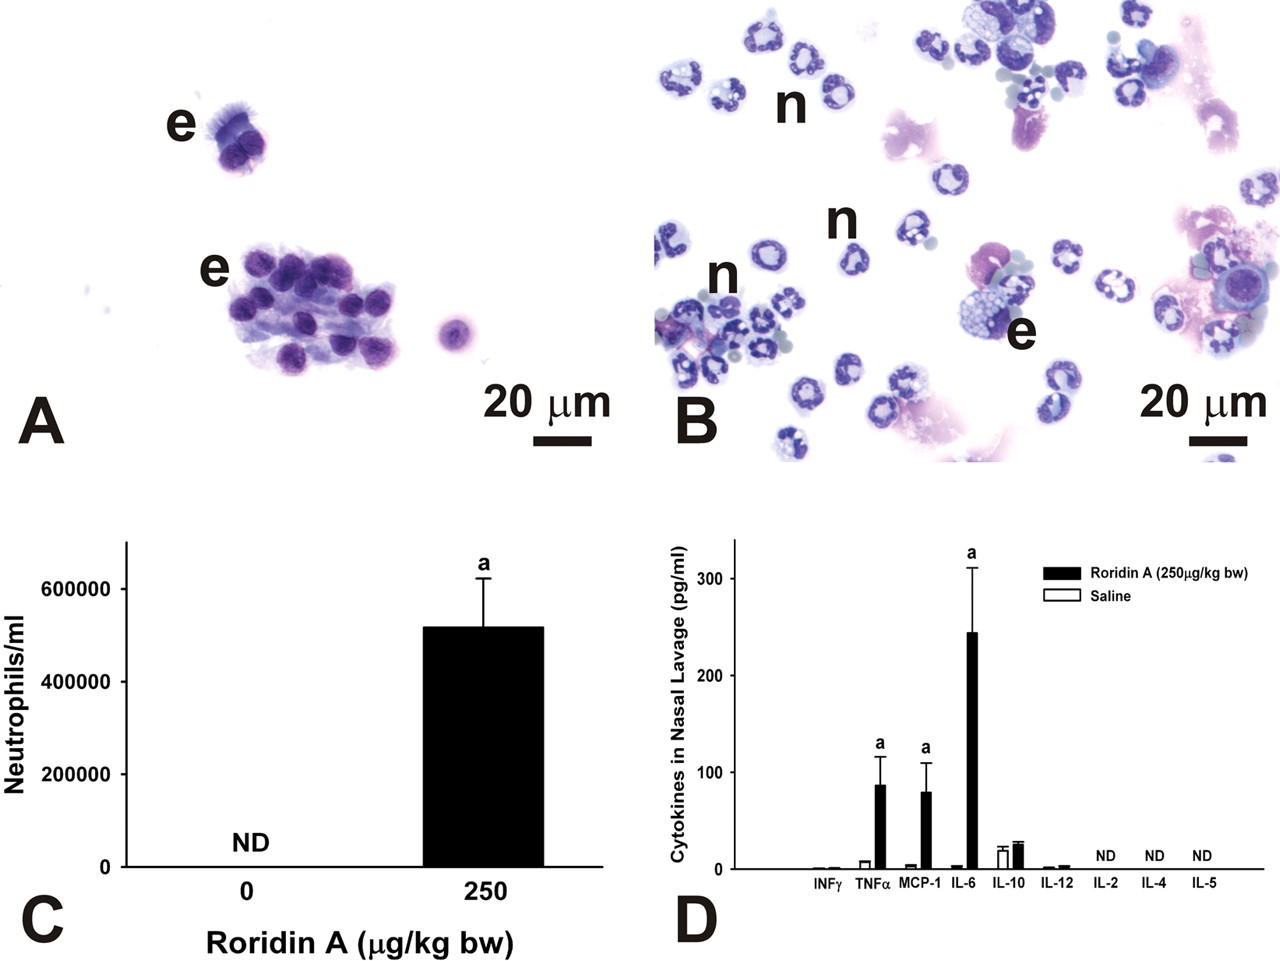
Cytology of cytokine expression in nasal lavage fluid from mice repeatedly instilled with saline alone or 250 μg/kg bw RA. (A) Photomicrograph of nasal lavage from a saline-instilled control mouse. Control animals had only a few epithelial cells (e) in nasal lavage. (B) Photomicrograph of nasal lavage from a RA-instilled mouse. RA-treated mice had numerous neutrophils (n) along with some epithelial cells (e) in their nasal lavage. Samples were stained with standard Diff Quick protocol. (C) Number of neutrophils in the lavage fluid from mice exposed to 250 μg/kg bw RA compared to controls. Bars represent group means ± standard error of the mean (SEM). a indicates significantly different from respective saline control group (p < .05). ND = not detected. (D) Flow cytometric determination of selected inflammatory cytokines in nasal lavage fluid from mice repeatedly exposed to saline alone or 250 μg/kg bw RA. TNF-α, MCP-1, and IL-6 were detected at levels significantly higher than those in lavage fluid from control animals. Bars represent group means ± SEM. a indicates significantly different from respective saline control group (p < .05). ND = not detected.
RA Induces Inflammatory Gene Expression in Nasal Tissues at 24 hr
Microdissected ET, MNT, and OB from mice instilled with either saline or 250 μg/kg bw RA were analyzed by real-time PCR for inflammatory gene expression. Upregulation of inflammatory genes IL-1α, IL-1β, TNF-α, IL-6, iNOS, MCP-1, MIP-2, and MUC5b were observed 24 hr after the final intranasal instillation (Figure 12 ). IL-1α expression was significantly increased in RA-treated mice compared to controls only in MNT tissue, though ET and OB tissues showed increased expression that was not significantly different from the controls. IL-1β expression was significantly increased in all treated tissues, with MNT tissue showing an increase of 250-fold increase over controls. TNF-α expression was also significantly increased in all RA-treated tissues. IL-6 expression was markedly increased in ET and MNT and was increased but not significantly different from controls in OB. iNOS showed 14-fold and 8-fold increases in ET and MNT, respectively. MCP-1 was significantly increased in all tissues, with 100-fold, 140-fold, and 25-fold increases in ET, MNT, and OB, respectively. MIP-2 showed the highest expression of all genes tested with a 256-fold increase in ET and a 363-fold increase in MNT when compared to control tissues. MUC5b also showed significant increases in ET and MNT, with 9-fold and 7-fold increases, respectively.
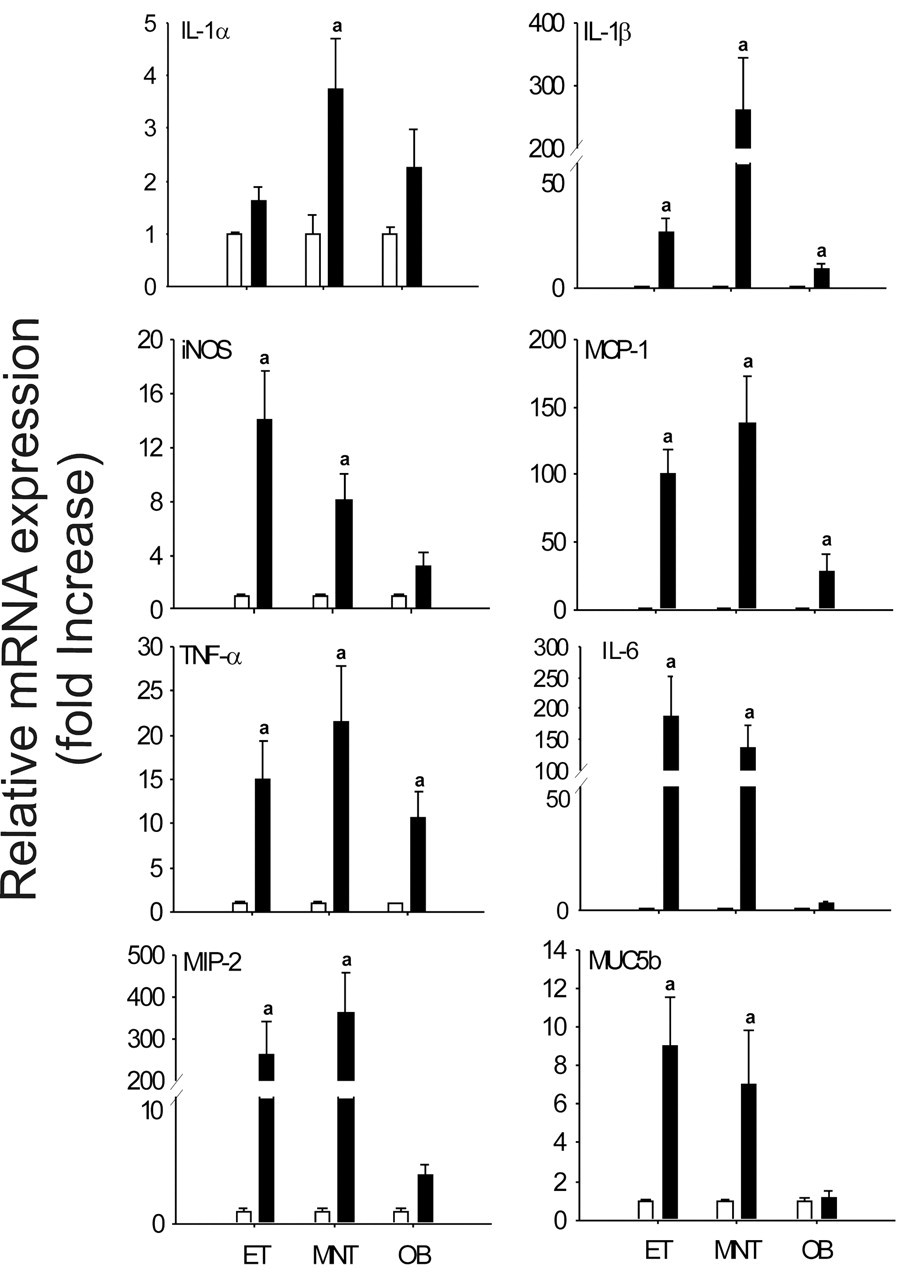
Relative expression (fold increase) of proinflammatory cytokine genes measured by real time-PCR in mice repeatedly exposed to 250 μg/kg bw. IL-1β, iNOS, MCP-1, TNF-α, IL-6, MIP-2, and MUC5B were significantly increased in the ET and MNT. IL-1α was increased only in the MNT. IL-1β, MCP-1, and TNF-α were also significantly increased in the OB. Bars represent group means ± SEM. a indicates significantly different from respective saline control group (p < .05).
Transient and Persistent Effects of RA on Nasal Airway Epithelium
RA-induced rhinitis with airway mucus accumulation and atrophy of nasal surface epithelium and glands were no longer present three weeks post-exposure in mice repeatedly instilled with 250 μg/kg bw RA. In addition, toxicant-induced necrosis of bone with loss of lacunal osteocytes was not present in the MT of mice instilled with this high dose of RA and sacrificed 3 weeks after the last instillation. There was complete restoration of the turbinate bone at 3 weeks postexposure to this high dose of RA.
In contrast, some RA-induced epithelial lesions persisted in the nasal airways of RA-instilled mice 3 weeks postexposure. There was a conspicuous increase in the amount of AB/PAS-stained mucosubstances in mucous goblet cells within the RE lining the nasopharyngeal meatus and in Bowman’s glands underlying OE (Figure 13 ). While there was minimal or no OE atrophy in mice sacrificed 3 weeks after intranasal instillations of 250 μg/kg bw, there was still some loss of OMP-stained OSNs in the OE of these mice. This was especially apparent in the OE lining the dorsal medial meatus in T2 (70% less than controls; Figure 14 ) and in the dorsal medial meatus, dorsal lateral meatus, and ET2 in T3 (75% less than controls; Figure 15 ). In some of these areas, hyalinosis was present in sustentacular cells of the affected OE that had noticeable loss of OSNs. Although there was some remaining loss of OSNs in OE, there was no histologic evidence of atrophy of OMP-stained axons of OSNs in the OB (no detectable atrophy of the olfactory nerve or glomerular layer). In addition, there was no neutrophilic encephalitis in the OB at 3 weeks following RA exposure.
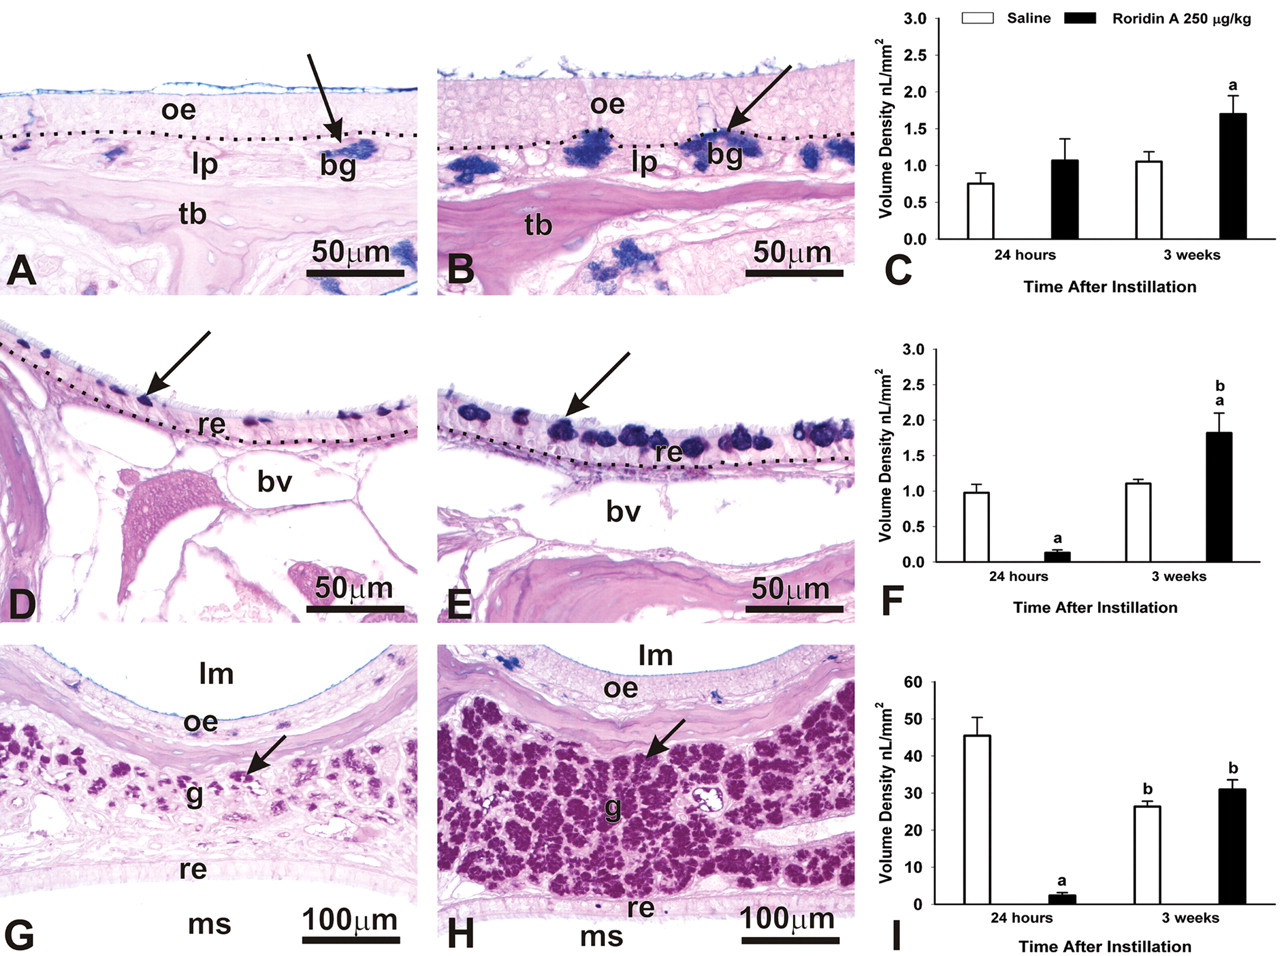
Persistence of RA-induced mucus-related changes. (A,B) Light photomicrographs of Bowman’s Glands (bg) in the lamina propria (lp) of ET2, (D,E) mucus in the RE lining the NPM, and (G,H) LNG. Mice were instilled with 250 μg/kg bw RA and sacrificed at 24 hr (A,D,G) or 3 weeks (B,E,H) postinstillation. oe, olfactory epithelium; tb, turbinate bone. (A,B) Arrow indicates AB/PAS-stained mucus. (D,E) re, respiratory epithelium; bv, blood vessel. Arrow indicates mucus in the respiratory epithelium. (G,H) lm, airway lumen; oe, olfactory epithelium; g, glands; re, respiratory epithelium; ms, maxillary sinus. Arrows indicate mucus in the LNG. All tissues were stained with AB/PAS. Morphometric analysis of the volume density (Vs) of mucus in Bowman’s Glands (C), RE lining the NPM (F), and mucus in the LNG (I) at 24 hr and 3 weeks following instillation. Bars represent group Vs means ± standard error of the mean (SEM). a indicates significantly different from respective saline control group (p < .05); b indicates significantly different from comparably instilled group sacrificed at 24 hr (p < .05).
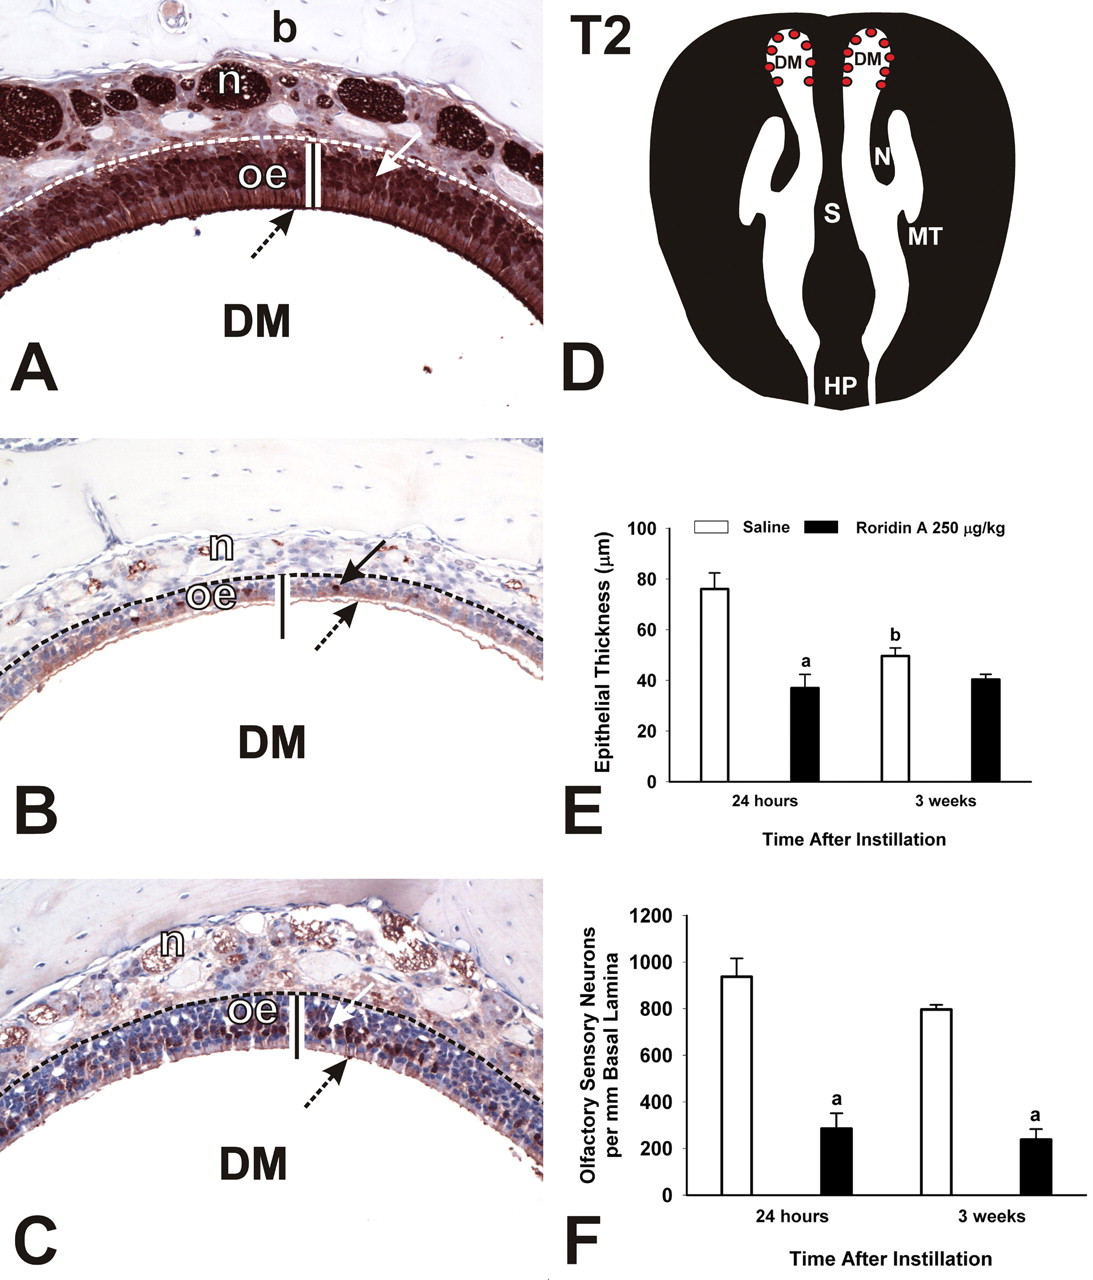
Persistence of loss of OSNs in the DM. (A–C) Photomicrographs of OMP-stained sections from mice instilled with saline (A) or 250 μg/kg bw at 24 hr (B) or 3 weeks (C) postexposure. DM, dorsal meatus; oe, olfactory epithelium; n, nerve bundle; b, bone. Arrows indicate OMP-stained nuclei. Bar = thickness of OE in saline control mouse. (D) Diagrammatic representation of T2. Red dots indicate location of photomicrographs and morphometric analyses. DM, dorsal meatus; N, nasoturbinate; S, septum; MT, maxilloturbinate; HP, hard palate. (E) Atrophy of OE and (F) loss of OSNs in the DM. Bars represent group means ± standard error of the mean (SEM). a indicates significantly different from respective saline control group (p < .05); b indicates significantly different from comparably instilled group sacrificed at 24 hr (p < .05).
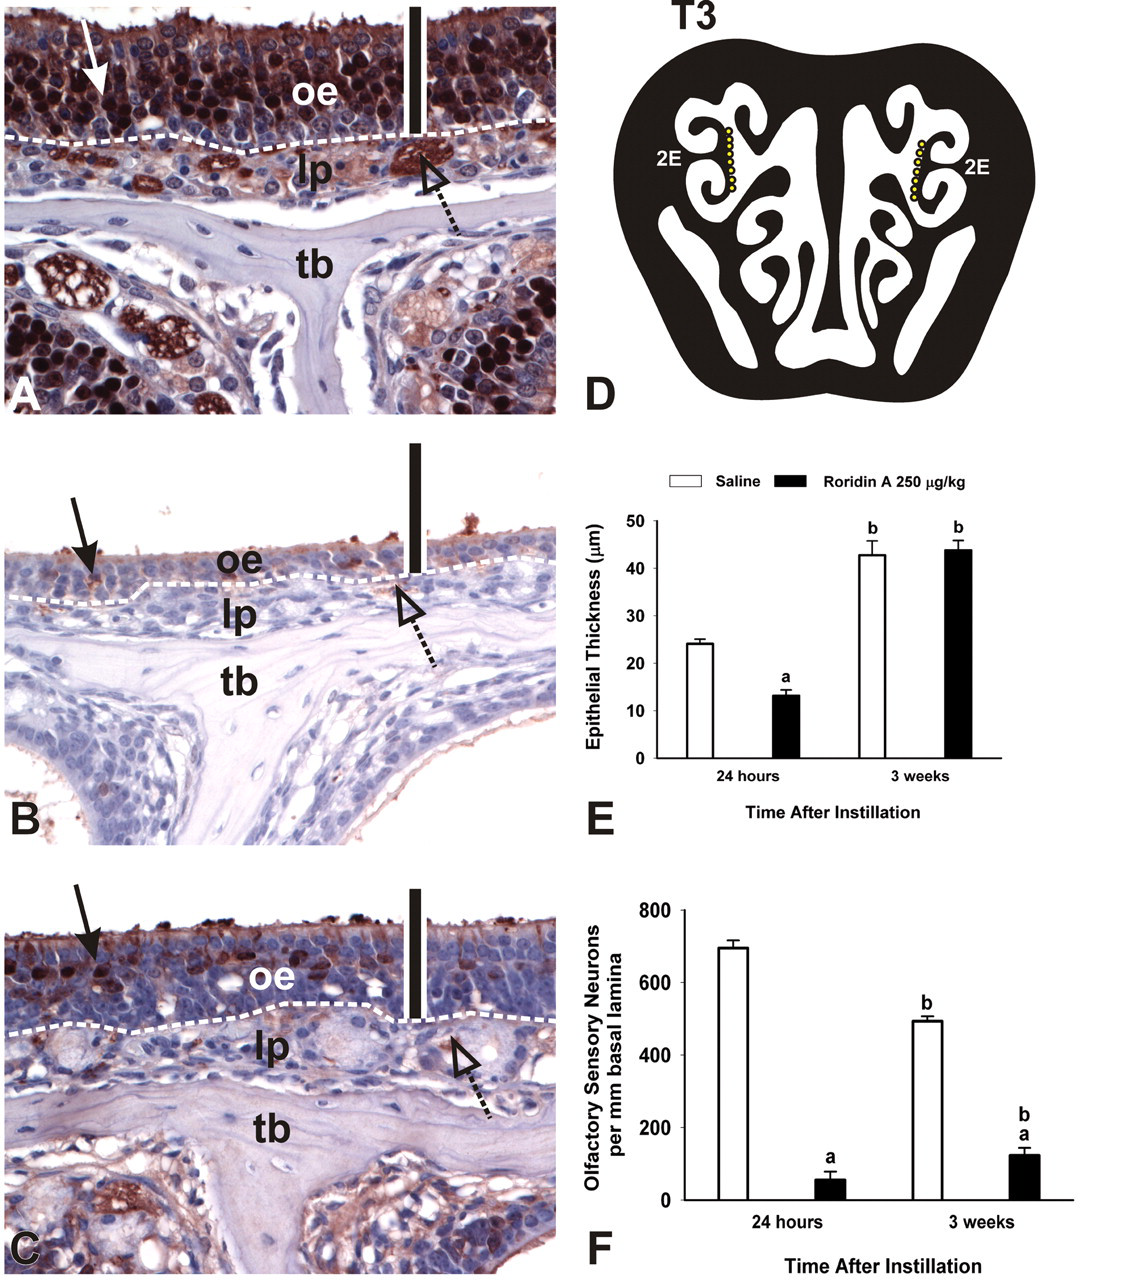
Persistence of loss of OSNs in OE lining ET2. (A-C) Photomicrographs of OMP-stained sections from mice instilled with saline (A) or 250 μg/kg bw at 24 hr (B) or 3 weeks (C) post-exposure. oe, olfactory epithelium; lp, lamina propria; tb, turbinate bone. Arrows indicate OMP-stained nuclei. Bar = 50 μm. (D) Diagrammatic representation of T3. Yellow dots indicate location of photomicrographs and morphometric analyses. 2E, ethmoid turbinate 2. (E) Atrophy of OE and (F) loss of OSNs in the DM. Bars represent group means ± standard error of the mean (SEM). a indicates significantly different from respective saline control group (p < .05); b indicates significantly different from comparably instilled group sacrificed at 24 hr (p < .05).
Discussion
Multiple factors contribute to the etiology of DBRI with a particularly important factor possibly being exposure to macrocyclic trichothecene mycotoxins (Pestka et al. 2008; Institute of Medicine 2004). The nose is a likely target of inhaled spores and toxins, as particles of various sizes (>5 μm to <10 nm in diameter) have been shown to deposit in the noses of humans and laboratory animals in aerosol studies (Cheng et al. 1990, 1991, 1996). Distinct types of epithelia line the nasal passages of mammals, including squamous epithelium, ciliated respiratory epithelium (RE), nonciliated transitional epithelium (NTE), and OE lining the turbinates in the dorsocaudal nasal cavity. OE includes OSNs, sustentacular support cells, and basal cells (Harkema, Carey, and Wagner 2006).
In the present study, repeated instillations of RA induced widespread inflammation throughout the nasal cavity, hypersecretion of mucosubstances, atrophy of OE and loss of OSNs, atrophy and loss of OMP staining in the OB, and necrosis and exfoliation of NTE and RE. A summary of the principal alterations in nasal epithelium caused by repeated instillations of RA are summarized in Table 2 , along with our morphometrically determined dose/response estimates based on nasal lesion and location. We previously reported that single, intranasal instillations of RA cause OE atrophy, loss of OSNs, and OB atrophy (Islam et al. 2007). Single instillations of RA also resulted in neutrophil infiltration in the affected OE and associated lamina propria. The additional changes observed following repeated exposures to RA in the present study were heretofore unreported and thus represent novel findings.
Summary of morphometrically determined, dose-dependent changes in the nasal airway epithelium caused by repeated RA instillations (24 hr following the last instillation).
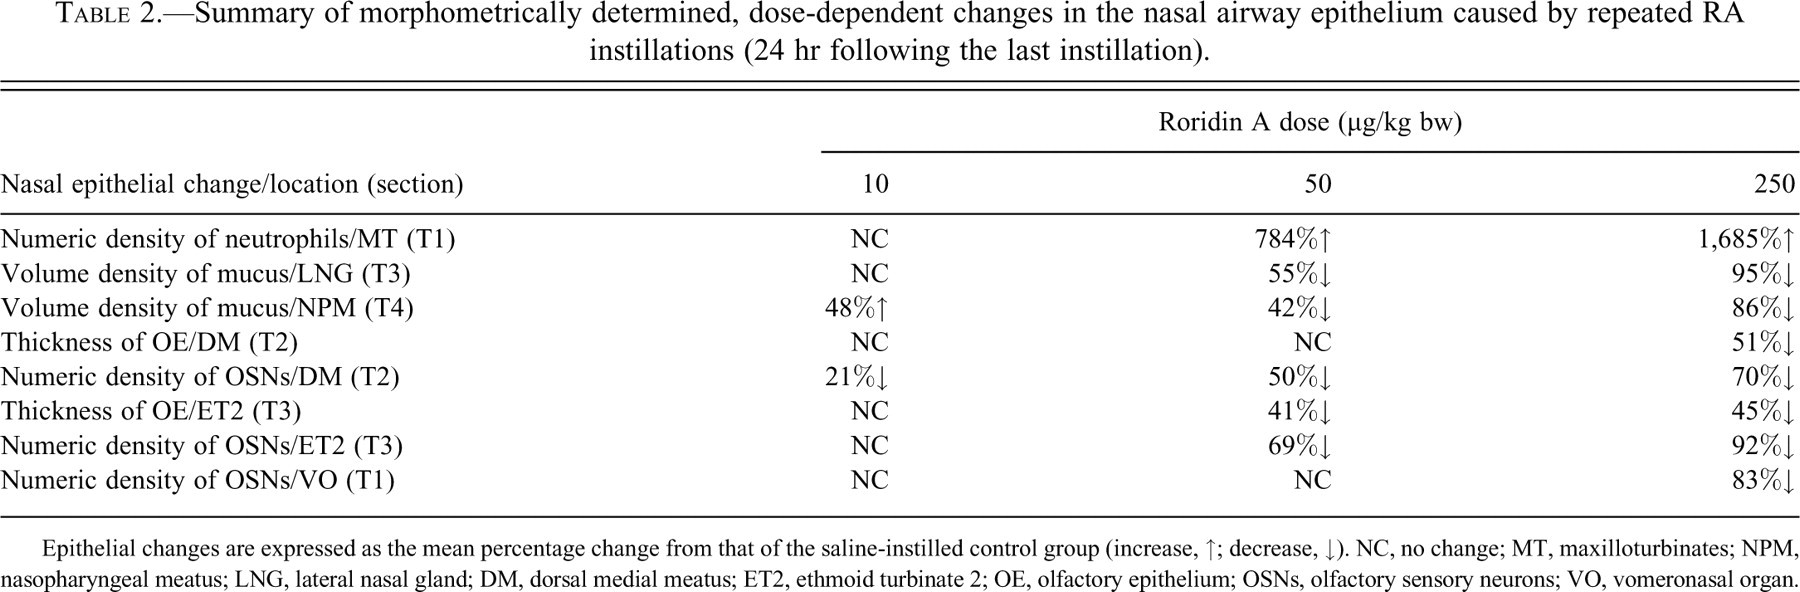
Epithelial changes are expressed as the mean percentage change from that of the saline-instilled control group (increase, ↑; decrease, ↓). NC, no change; MT, maxilloturbinates; NPM, nasopharyngeal meatus; LNG, lateral nasal gland; DM, dorsal medial meatus; ET2, ethmoid turbinate 2; OE, olfactory epithelium; OSNs, olfactory sensory neurons; VO, vomeronasal organ.
The neutrophilic inflammation induced by repeated exposures to RA was significantly more widespread and severe than that seen with single instillations of RA. No effects were observed in T1 and T2 after single instillations of RA. Here we observed significant inflammation and edema in the MNT accompanied by bone loss in the MT. Large numbers of neutrophils were also observed in the secreted mucus found in the airways. Elevated proinflammatory cytokine levels in the nasal lavage of mice instilled with the high dose of RA, as well as the increased proinflammatory gene expression, are consistent with the presence of an active inflammatory response consisting primarily of neutrophil infiltration 24 hr following the last RA exposure. The neutrophilic infiltration we observed was likely present during intranasal instillations of RA as well. Further work could investigate whether any of these genes remain upregulated in mice weeks after the last exposure to RA when visible evidence of inflammation is lacking.
The loss of stored product in mucus-secreting epithelial cells in both the airway surface epithelium and the LNG, along with the accumulation of excess mucus in the airway lumens, suggest that intranasal instillation of RA induced widespread mucus hypersecretion. These morphologic changes are consistent with those previously described in human subjects (Williams et al. 2006; Rogers 2007) and laboratory animals (Nikula and Green 2000; Reader et al. 2003) with chronic hypersecretory conditions in either the upper or lower respiratory tract (e.g., rhinitis, asthma, chronic bronchitis). Accumulation of airway mucus reflects a protective reaction in response to the inflammatory and tissue damaging effects of the repeated instillations of RA.
It is notable that the mucus response persisted 3 weeks after the last RA instillation. It is not known why Bowman’s glands in the lamina propria of ET2 were unaffected 24 hr after the last RA instillation. This would seem to indicate that these glands were not contributing significantly to the volume of mucus being released into the airway. It is also unclear why Bowman’s glands would then exhibit a pattern of mucus overproduction at 3 weeks postinstillation. Mucus overproduction in Bowman’s glands, the RE lining the NPM, and the LNG 3 weeks after the last RA instillation is likely an attempt to prevent further tissue injury.
RA might induce mucus hypersecretion by induction of proinflammatory cytokines IL-1β, IL-6, and TNF-α, which have been shown to cause mucus secretion and MUC gene expression (Rogers 2007). Additionally, TNF-α and proteinases can induce mucus secretion and goblet cell hyperplasia (Rogers 2007). Many molds including S. chartarum and other black mold species produce a variety of proteinases (Nielsen et al. 2002; Nielsen 2003; Yike, Rand, and Dearborn 2007). We observed significant neutrophilic inflammation throughout the nasal cavities of RA-exposed mice. Neutrophils have been shown to release proteinases and cytokines that contribute to pathways involved in chronic obstructive pulmonary disease, including potent stimulation of release of mucus from goblet cells (Kim and Nadel 2004). Cigarette-smoke-induced inflammation has been shown to play a role in mucus cell metaplasia and mucus hypersecretion (Yoshida and Tuder 2007). Ozone, another irritant gas, induces mucus cell metaplasia and secretion that is partly dependent on neutrophilic inflammation (Wagner et al. 2001). Damage to surrounding epithelial cells resulting in cytokine and growth factor release may also play a role in the mucus responses we observed (Rogers 2007). Additional studies are needed to better understand the mechanisms behind the observed mucus changes and to determine whether long-lasting changes in mucus production would result from repeated exposures to RA.
In contrast to the present study, single intranasal instillations did not result in atrophy and loss of OSNs in the OE lining the DM (Islam et al. 2007). The DM might have been spared from the effects of a single intranasal instillation of SG because of distinct populations of odorant receptors found in the nose (Islam, Harkema, and Pestka 2006). Ressler, Sullivan, and Buck (1993) described specific zones of odorant receptors in the OE, one of which was found in the dorsal meatus. It was postulated at that time that macrocyclic trichothecenes might bind to specific odorant receptors and initiate apoptosis in OSNs. The present results suggest that this is not the case. It is possible that macrocyclic trichothecenes interact with the odorant receptors on OSNs but that no binding specificity exists. Another potential explanation is that macrocyclic trichothecenes interact with the odorant receptors in the DM, but interaction with receptors in the previously described areas is preferential (Islam, Harkema, and Pestka 2006; Islam et al. 2007). Repeated instillations might saturate the receptors in the OE lining areas such as ET2 and result in interaction with OSNs in the DM and ultimately their destruction.
We previously demonstrated that RA causes expression of pro-apoptotic mRNA 24 hr after instillation (Islam et al. 2007). SG also causes upregulation of the pro-apoptotic genes Fas, FasL, p75, p53, BAX, caspase-three, and caspase-activated DNase (CAD) in the OE lining the ethmoid turbinates following a single intranasal instillation (Islam, Harkema, and Pestka 2006). Other mechanisms might involve the extended inflammatory response we observed with repeated instillations. In vitro studies have shown that TNF-α induces apoptosis in OSNs (Suzuki and Farbman 2000) via death receptor activation and the extrinsic apoptotic pathway. Fas is also involved in the extrinsic pathway (Cowan and Roskams 2002). Notably RA induces expression of Fas and TNF-α mRNA prior to or concurrent with expression and activation of caspase-three (Islam et al. 2007). The observed elevation in proinflammatory cytokines and chemokines in conjunction with a primarily neutrophilic cellular infiltration indicate an active inflammatory process that could indeed contribute to cell death.
The OSNs in OE are unique among the populations of neuronal cells within the body in that mature OSNs undergo a regular cycle of apoptosis and regeneration via basal cell proliferation and differentiation. OSNs have a typical lifespan of 30–40 days or longer, a short duration compared to other neurons (Graziadei and Graziadei 1978). Loss of OSNs persisted 3 weeks after the last RA instillation while atrophy of OE did not. It is possible that the cells present at 3 weeks after the instillations were immature OSNs, and thus would not be expressing OMP. It is also possible that the cells primarily contributing to OE thickness are sustentacular cells.
Intranasal perfusion with ZnSO4 has been used to induce OSN death in mice and rats to study recovery of OSNs following chemical lesion (Burd 1993; Herzog and Otto 1999). Ducray et al. (2002) showed that mice could differentiate water and butanol in a behavioral test maze approximately 18 days following intranasal instillation of ZnSO4, indicating that an intact sense of smell was present. In that study, OMP staining was significantly reduced at 25 and 35 days after instillation in treated mice in spite of the recovery of olfactory-mediated behavior at 18 days. Many of the cells observed in the OE were immature OSNs, suggesting that only a limited number of mature OSNs are needed to restore olfactory function (Ducray et al. 2002). To shed further light on the disparity between OE thickness and the number of OSNs, further studies are needed to determine the duration of OSN loss observed 3 weeks postexposure as well as determine whether these mice have retained or recovered their ability to detect odors.
Clarification is also needed on the effects of macrocyclic trichothecenes on basal cells in the OE. A small increase in OSNs was observed 3 weeks after the last instillation, which suggests that basal cells are retained since significant damage to these progenitor cells might result in an inability of OSNs to recover from repeated RA exposure. It is possible, however, that the incomplete recovery of the OSNs 3 weeks after the last instillation is due to damage to basal cells, particularly globose basal cells. Globose basal cells proliferate more rapidly than horizontal basal cells (Schwob 2002). Further studies are needed to characterize the effects of single and repeated exposures to macrocyclic trichothecenes on these progenitor cell populations.
We observed atrophy and loss of OMP staining in the OB 24 hr after the final RA instillation; however, after 3 weeks, this was no longer observed. It was also notable that IL-1β, TNF-α, and MCP-1 were upregulated in the OB 24 hr after the last RA instillation. Shipley (1985) reported retrograde and anterograde transport of wheat germ agglutinin-horseradish peroxidase between the OSNs and the OB. This type of transport suggests that inhaled environmental toxins could potentially travel along the axons of OSNs and reach the OB. It is possible that the toxicity observed in the OB results from such a transport mechanism. It is unclear whether this return to normality in the OB relates to recovery of OE. If transport via the axons of the OSNs is indeed the route by which the RA reached the OB to cause toxicity, it is possible that a gradient was established and the OB actually received a lower dose of RA than the OSNs. It is also possible that RA ascends to the OB shortly after instillation and results in neutrophilic inflammation, but further instillations of RA do not have significant effect on the OB. If RA travels to the OB via the axons of the OSNs, this connection may be lost as the OSNs undergo apoptosis. Future elucidation of the mechanisms of toxicity in the OB is warranted and should include determination whether any relationship exists between recovery of the OB and OSNs.
The atrophy and exfoliation of NTE and RE induced by repeated instillations of RA has not been previously reported. In a prior study, we speculated that the slower mucociliary clearance rate of OE, which is lined by immotile cilia, might account for the susceptibility of OSNs to RA that we observed (Islam et al. 2007). Repeated exposures to RA resulted in loss of cilia and death of ciliated cells. This might account for the effects of repeated RA exposures on the RE, which is lined by motile cilia with a high beat frequency (Morgan et al. 1984). Additional factors affecting mucosal clearance, such as metabolism and blood flow, may be impacted such that existing differences that may have accounted for the specific effects noted with a single instillation are overcome, leading to more widespread toxicity. The prolonged inflammatory response caused by repeated instillations of RA might account for the damage to other epithelial tissues in the nose.
Intranasal instillation was chosen as an exposure method to characterize the pathology caused by exposure to macrocyclic trichothecene mycotoxins but does not represent an environmental exposure route. The doses of RA utilized here are based on previous studies as well as the potential exposure of OSNs to airborne macrocyclic trichothecenes. A number of recent studies have attempted to quantify the amount of macrocyclic trichothecenes that may be found in indoor air. The dry spores of Stachybotrys chartarum have been shown to aerosolize and have a mean respirable diameter of 5 μm (Jarvis et al. 1998; Yike and Dearborn 2004). While particles less than 10 μm in diameter may reach the lungs (Salvi and Holgate 1999), it is likely that some would lodge in the nose. Tucker et al. (2007) indicate that 19 billion spores could be present in 1 square meter of S. chartarum growth on a surface. The results of their study indicate that approximately 0.2% of that growth may be released into the air if an airflow disturbance occurs. They note that if each spore contained 0.1 picogram of macrocyclic trichothecenes, this release would result in a toxin load in the air of approximately 4 μg from a single airflow disturbance. The doses of RA we have chosen include three doses below this theoretical airborne toxin load, with 10 μg/kg representing the lowest-effect dose in our studies. Additionally, Brasel et al. (2005) recently found that macrocyclic trichothecenes may be found in substances such as house dust, a potential route of exposure that does not require inhalation of spores. This route of exposure has not been accounted for in the currently published literature with respect to its contribution to the total amount of airborne macrocyclic trichothecenes. In the future, aerosol inhalation studies should address exposure to both aerosolized macrocyclic trichothecene mycotoxins and toxin-containing mold spores.
The results presented here may possibly represent a mechanistic explanation for some of the signs linked to DBRI, including nasal congestion and runny or itchy nose. The inflammatory effects that we report could account for these signs in people. Loss of the sense of smell has also been reported in connection with damp conditions (Institute of Medicine 2004). The loss of OSNs that we demonstrate here may represent evidence supporting such an effect, underscoring the importance of further studies to determine whether instilled mice have intact olfactory function. Additionally, the neutrophilic encephalitis we observed here may contribute to olfactory effects and possibly headaches or other neurological effects that cannot currently be linked to damp conditions in buildings.
Taken together, the results presented here suggest that repeated exposures to macrocyclic trichothecenes like RA evoke more severe and persistent effects than single, acute exposures. Since long-lasting and permanent loss of the sense of smell and neurologic effects associated with OB atrophy and inflammation could significantly impact human health, further studies are needed to determine the risk of such effects in humans. Finally, aerosol inhalation studies of macrocyclic trichothecenes in mice might better model the route of exposure and thus facilitate improved understanding of risk.
Footnotes
Acknowledgments
The authors thank Lori Bramble, Sarah Godbehere, Amy Porter, Kathleen Campbell, Rick Rosebury, and Mary Rosner for their technical assistance.