
Abstract
The digital transformation of healthcare services is redefining how information is accessed and evaluated by citizens. While organizational progress is often measured by technical maturity, this study shifts the focus to the user’s perspective. Grounded in the Donabedian framework (Structure-Process-Outcome), we investigate how Digital Maturity (Structure) and Information Literacy/Inclusion (Process) culminate in Patient Satisfaction (Outcome). Using Structural Equation Modelling (SEM) with a sample of 212 participants, the results reveal that maturity acts as a catalyst for literacy, but satisfaction is strictly dependent on effective digital inclusion. This paper contributes to ‘Healthcare for Information’ by highlighting that technological infrastructure alone is insufficient without a robust healthcare strategy for health information users.
Keywords
Introduction
The digital transformation of healthcare services has become a global priority, reshaping how care is delivered, accessed, and experienced. The integration of technologies such as electronic health records, telemedicine, mobile health applications, and artificial intelligence has revolutionized healthcare delivery. In the evolving landscape of healthcare, digital transformation is not solely a technological shift but a complex process involving human dimensions. Central to this is Digital Literacy, which, in the context of health, evolved into Health Information Literacy. This concept refers to the ability to seek, find, understand, and appraise health information from electronic sources and apply that knowledge to address health problems. It is a fundamental movement toward ensuring that users can effectively navigate digital health environments and make informed decisions using digital health information. However, digital transformation is not merely a technological shift; it also encompasses complex organizational, social, and human dynamics. Within this evolving context, the success of transformation depends not only on the availability of tools but on how they are adopted and experienced by healthcare stakeholders (Ahmed et al., 2020; Almaghaslah et al., 2022; Friedel et al., 2023; Hamasaki, 2024).
Critically, the digital transformation of healthcare cannot be measured solely by the sophistication of internal systems, but rather by its capacity to ensure digital inclusion. The concept of patient-centred care demands that digital literacy be recognized as a new social determinant of health. As organizational maturity advances, there is a burgeoning risk of a ‘digital fracture’, where patient satisfaction becomes precariously dependent on an individual’s ability to navigate complex ecosystems. Digital literacy represents the foundational skills needed to use these tools effectively, whilst digital maturity refers to the organization’s overall capacity to integrate processes in a sustainable and strategic manner.
To address the lack of integrative models that examine the interplay between these dimensions, this investigation proposes a conceptual framework grounded in Donabedian’s Structure-Process-Outcome (SPO) model. Unlike purely technological approaches, this study adapts the SPO framework to evaluate digital health in a holistic manner: Digital Maturity represents the ‘Structure’ (the available resources), Digital Literacy and Inclusion constitute the ‘Process’ (how individuals interact with the system), and Patient Satisfaction serves as the final ‘Outcome’.
By employing this classic quality-of-care, the research moves beyond technical metrics to explore whether technology translates into a meaningful and positive experience for the end user. Drawing from a systematic review of literature, this model is built upon the hypothesis that digital literacy influences digital maturity, and that both dimensions significantly impact stakeholder satisfaction. Ultimately, this research aims to provide new insights into how human and organizational capabilities jointly shape the outcomes of digital transformation in healthcare.
To provide a holistic understanding of this phenomenon, this research employs Donabedian’s Triad. We conceptualize Digital Maturity as the Structure (the technological and organizational readiness), Digital Literacy and Inclusion as the Process (the interaction between the user and the system), and Patient Satisfaction as the Outcome. This theoretical lens allows us to move beyond technical metrics and evaluate the human impact of healthcare digitalization.
So, in this study, we adopt the concept of Digital Literacy, which encompasses the ability to seek, find, understand, and appraise health information from electronic sources to address or solve a health problem. In the healthcare context, this is deeply connected to the Health Information Literacy movement, which emphasizes that access to information is a social determinant of health. While ‘digital literacy’ focuses on technical skills, and ‘information literacy’ on cognitive ones, Digital Information Literacy integrates both to ensure patients can navigate the complexities of modern digital health ecosystems (Norman & Skinner, 2006; van der Vaart & Drossaert, 2017).
Literature Review
The healthcare sector is undergoing a profound and transformative shift driven by digital technologies. Digital transformation is fundamentally reshaping how care is delivered, managed, and experienced, moving beyond mere technological adoption to a comprehensive restructuring of processes, organizational culture, and business models (Westerman et al., 2019; Zhang, 2024). From the digitization of patient records and the proliferation of telemedicine solutions to the integration of artificial intelligence (AI) in diagnostics and personalized medicine, digital tools are becoming central to modern healthcare (Xing et al., 2024; Yan et al., 2024). This ongoing paradigm shift aims to enhance operational efficiency, improve the quality of care, optimize resource allocation, and ultimately elevate the experience of both patients and healthcare stakeholders. However, the journey towards a fully digitized healthcare ecosystem is not without its challenges and opportunities. Key challenges include overcoming resistance to change among stakeholders, ensuring robust and secure digital infrastructure, addressing data privacy concerns, and mitigating the exacerbation of digital inequalities that could limit access to care for vulnerable populations (Anunciacao & Geada, 2021; Bogodistov et al., 2020; Zhang, 2024; Zhang et al., 2019). Despite these hurdles, digital transformation presents immense opportunities: it promises more accessible healthcare through remote consultations and monitoring, enables personalized care pathways based on vast data insights, fosters greater patient engagement, and supports continuous innovation in medical practices and service delivery (Dons et al., 2024; Xing et al., 2024). By strategically leveraging digital advancements, healthcare organizations can achieve greater effectiveness, sustainability, and responsiveness to evolving health needs. Digital transformation in healthcare refers to the strategic adoption and integration of digital technologies to improve delivery, management, and experience of care. This shift goes beyond the implementation of tools such as electronic health records or telemedicine platforms. It encompasses changes in organizational culture, workflows, patient-professional interactions, and the overall structure of service provision (Albrecht et al., 2020; Tossaint-Schoenmakers et al., 2021). Recent studies show that successful digital transformation depends not only on technological investment but also on the development of human capabilities, particularly digital literacy, and on the organization’s level of digital maturity (Arias López et al., 2023; Chen, 2021; Tegegne et al., 2023). Moreover, user satisfaction has become a key performance indicator, as it reflects the perceived value and usability of digital health systems (Baniasadi et al., 2023; Friedel et al., 2023).
Conceptual Model and Hypotheses
Based on the literature review presented, this study proposes the following research questions and hypotheses to explore the dynamics between maturity, literacy, and inclusion.
This article is guided by the overarching question: ‘How do digital literacy and digital maturity influence satisfaction in healthcare organizations undergoing digital transformation?’
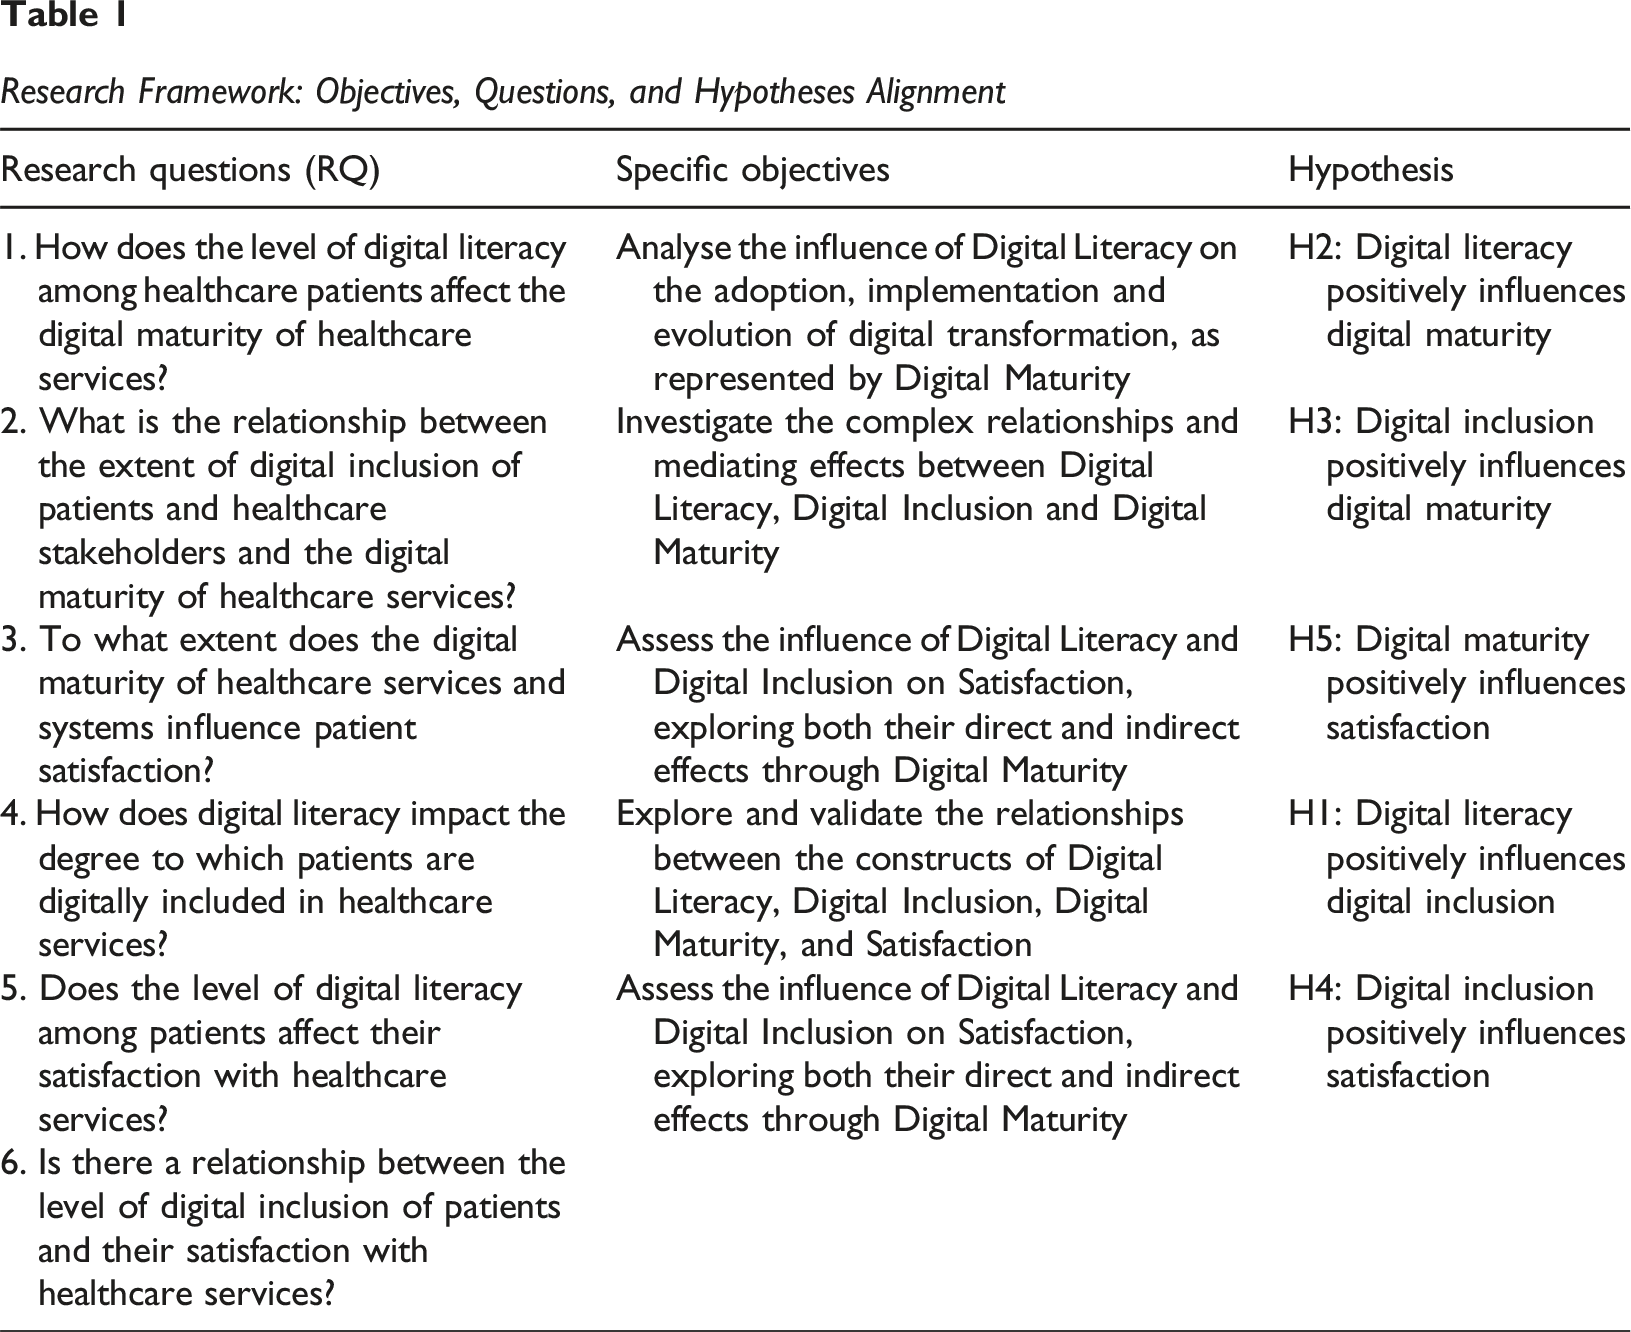
Research Framework: Objectives, Questions, and Hypotheses Alignment
The proposed research model, illustrated in Figure 1, hypothesis model, the outlines the relationships between key constructs in the context of digital transformation in healthcare. Grounded in theoretical foundations, the model explores how digital transformation acts as a driving force behind healthcare service delivery, sustainability, and leadership dynamics. The following hypotheses have been formulated to examine these interconnections and their implications. Hypothesis Model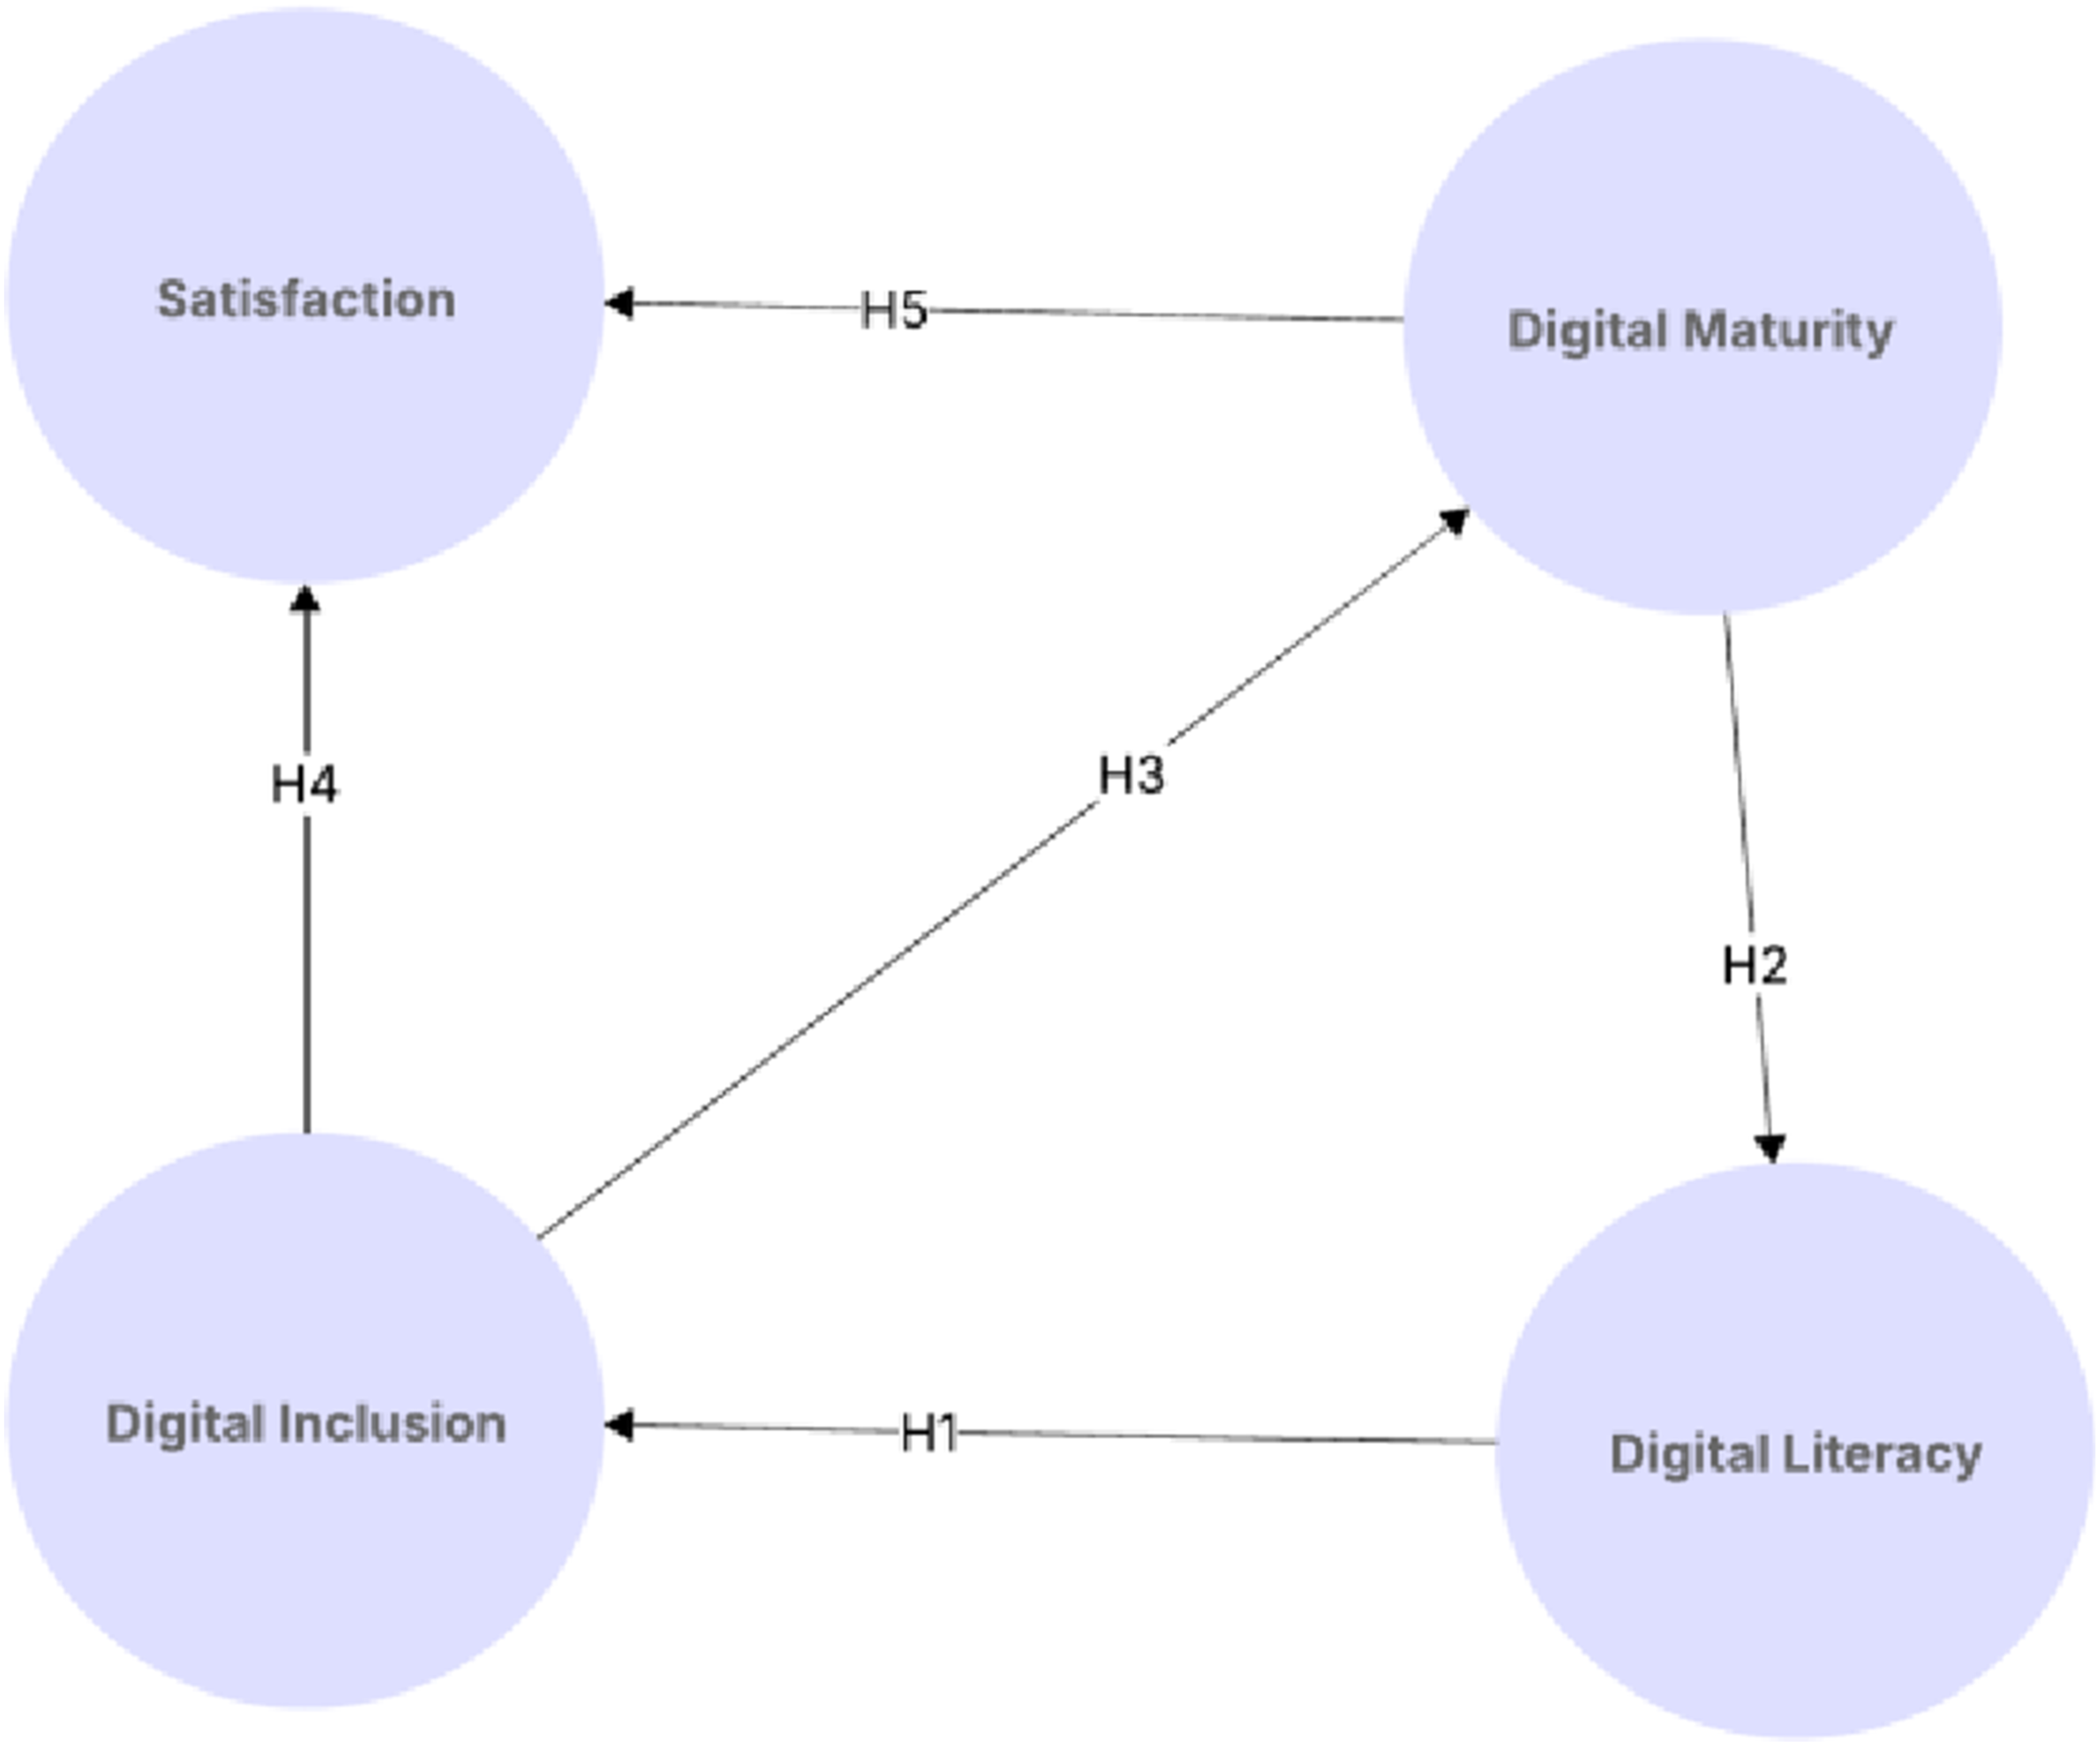
a. Digital Literacy (DL): Refers to the ability of healthcare patients to effectively understand and use digital technologies. b. Digital Inclusion (DI): Encompasses the efforts to ensure that all individuals and groups, regardless of their socio-economic status, location, or physical abilities, have access to and can effectively use information and communication technologies. In the context of healthcare organizations, this pertains to the equitable access and utilization of digital tools and services by patients. c. Satisfaction (S): Represents patient satisfaction with digital healthcare services, reflecting usability, efficiency, and perceived benefits. d. Digital Maturity (DM): Represents the degree of digital integration within a healthcare organization, including technological capabilities and process automation.
To bridge the gap between organizational infrastructure and patient experience, this research operationalizes the Donabedian Framework (Structure-Process-Outcome) as the foundation for its conceptual model. This approach allows for a systematic categorization of the variables under study: Structure (The foundation): Represented by Digital Maturity (DM), which encompasses the institutional readiness, technological assets, and systemic conditions of the healthcare environment. Process (The interaction): Represented by Digital Literacy (DL) and Digital Inclusion (DI). These variables reflect how patients interact with the information systems and the quality of the digital engagement between the user and the healthcare structure. Outcome (The result): Represented by Patient Satisfaction (SAT), serving as the ultimate measure of the service’s effectiveness and quality.
By aligning these variables with Donabedian’s pillars, this study operationalizes a quality-of-care assessment for the digital health information era, where satisfaction is the ultimate metric of success. This alignment provides a clear theoretical justification for our hypotheses, moving beyond a simple correlation study to a structured analysis of healthcare service quality.
To explore the impact of digital capabilities and organizational readiness on patient satisfaction, this investigation proposes a conceptual model comprising four key constructs: Digital Literacy, Digital Inclusion, Digital Maturity, and Satisfaction. These constructs are interlinked through six hypotheses (Table 1) that reflect both direct and mediated relationships, as illustrated in Figure 1.
Research Hypothesis Model
Figure 1 presents the conceptual framework that supports this investigation, illustrating the hypothesized relationships between the four main constructs: Digital Literacy (DL), Digital Inclusion (DI), Digital Maturity (DM), and Satisfaction (S). The model is designed to explore how individual digital competencies and organizational readiness jointly influence the quality of the digital healthcare experience from the perspective of patients. At the core of the model lies Digital Literacy, conceptualized as a foundational skillset enabling users to engage meaningfully with digital technologies. The model hypothesizes that higher levels of digital literacy enhance both digital inclusion and satisfaction directly and contribute to greater digital maturity at the organizational level. Digital Inclusion is posited as both an outcome of literacy reflecting the role of equitable access and participation in digital environments. Digital Maturity represents the organization’s structural and cultural capability to implement and optimize digital solutions. It is hypothesized to be influenced by both literacy and inclusion, and in turn, to predict user satisfaction, positioning it as a mediating construct between individual capabilities and perceived outcomes.
This framework allows for both direct and mediated paths to be tested, capturing the multi-layered nature of digital transformation in healthcare. The model is theoretically anchored in the Donabedian model (Figure 2), with Digital Maturity aligned with the structural component, Digital Literacy and Inclusion as enablers of process readiness, and Satisfaction as the primary outcome. Adapted Donabedian Model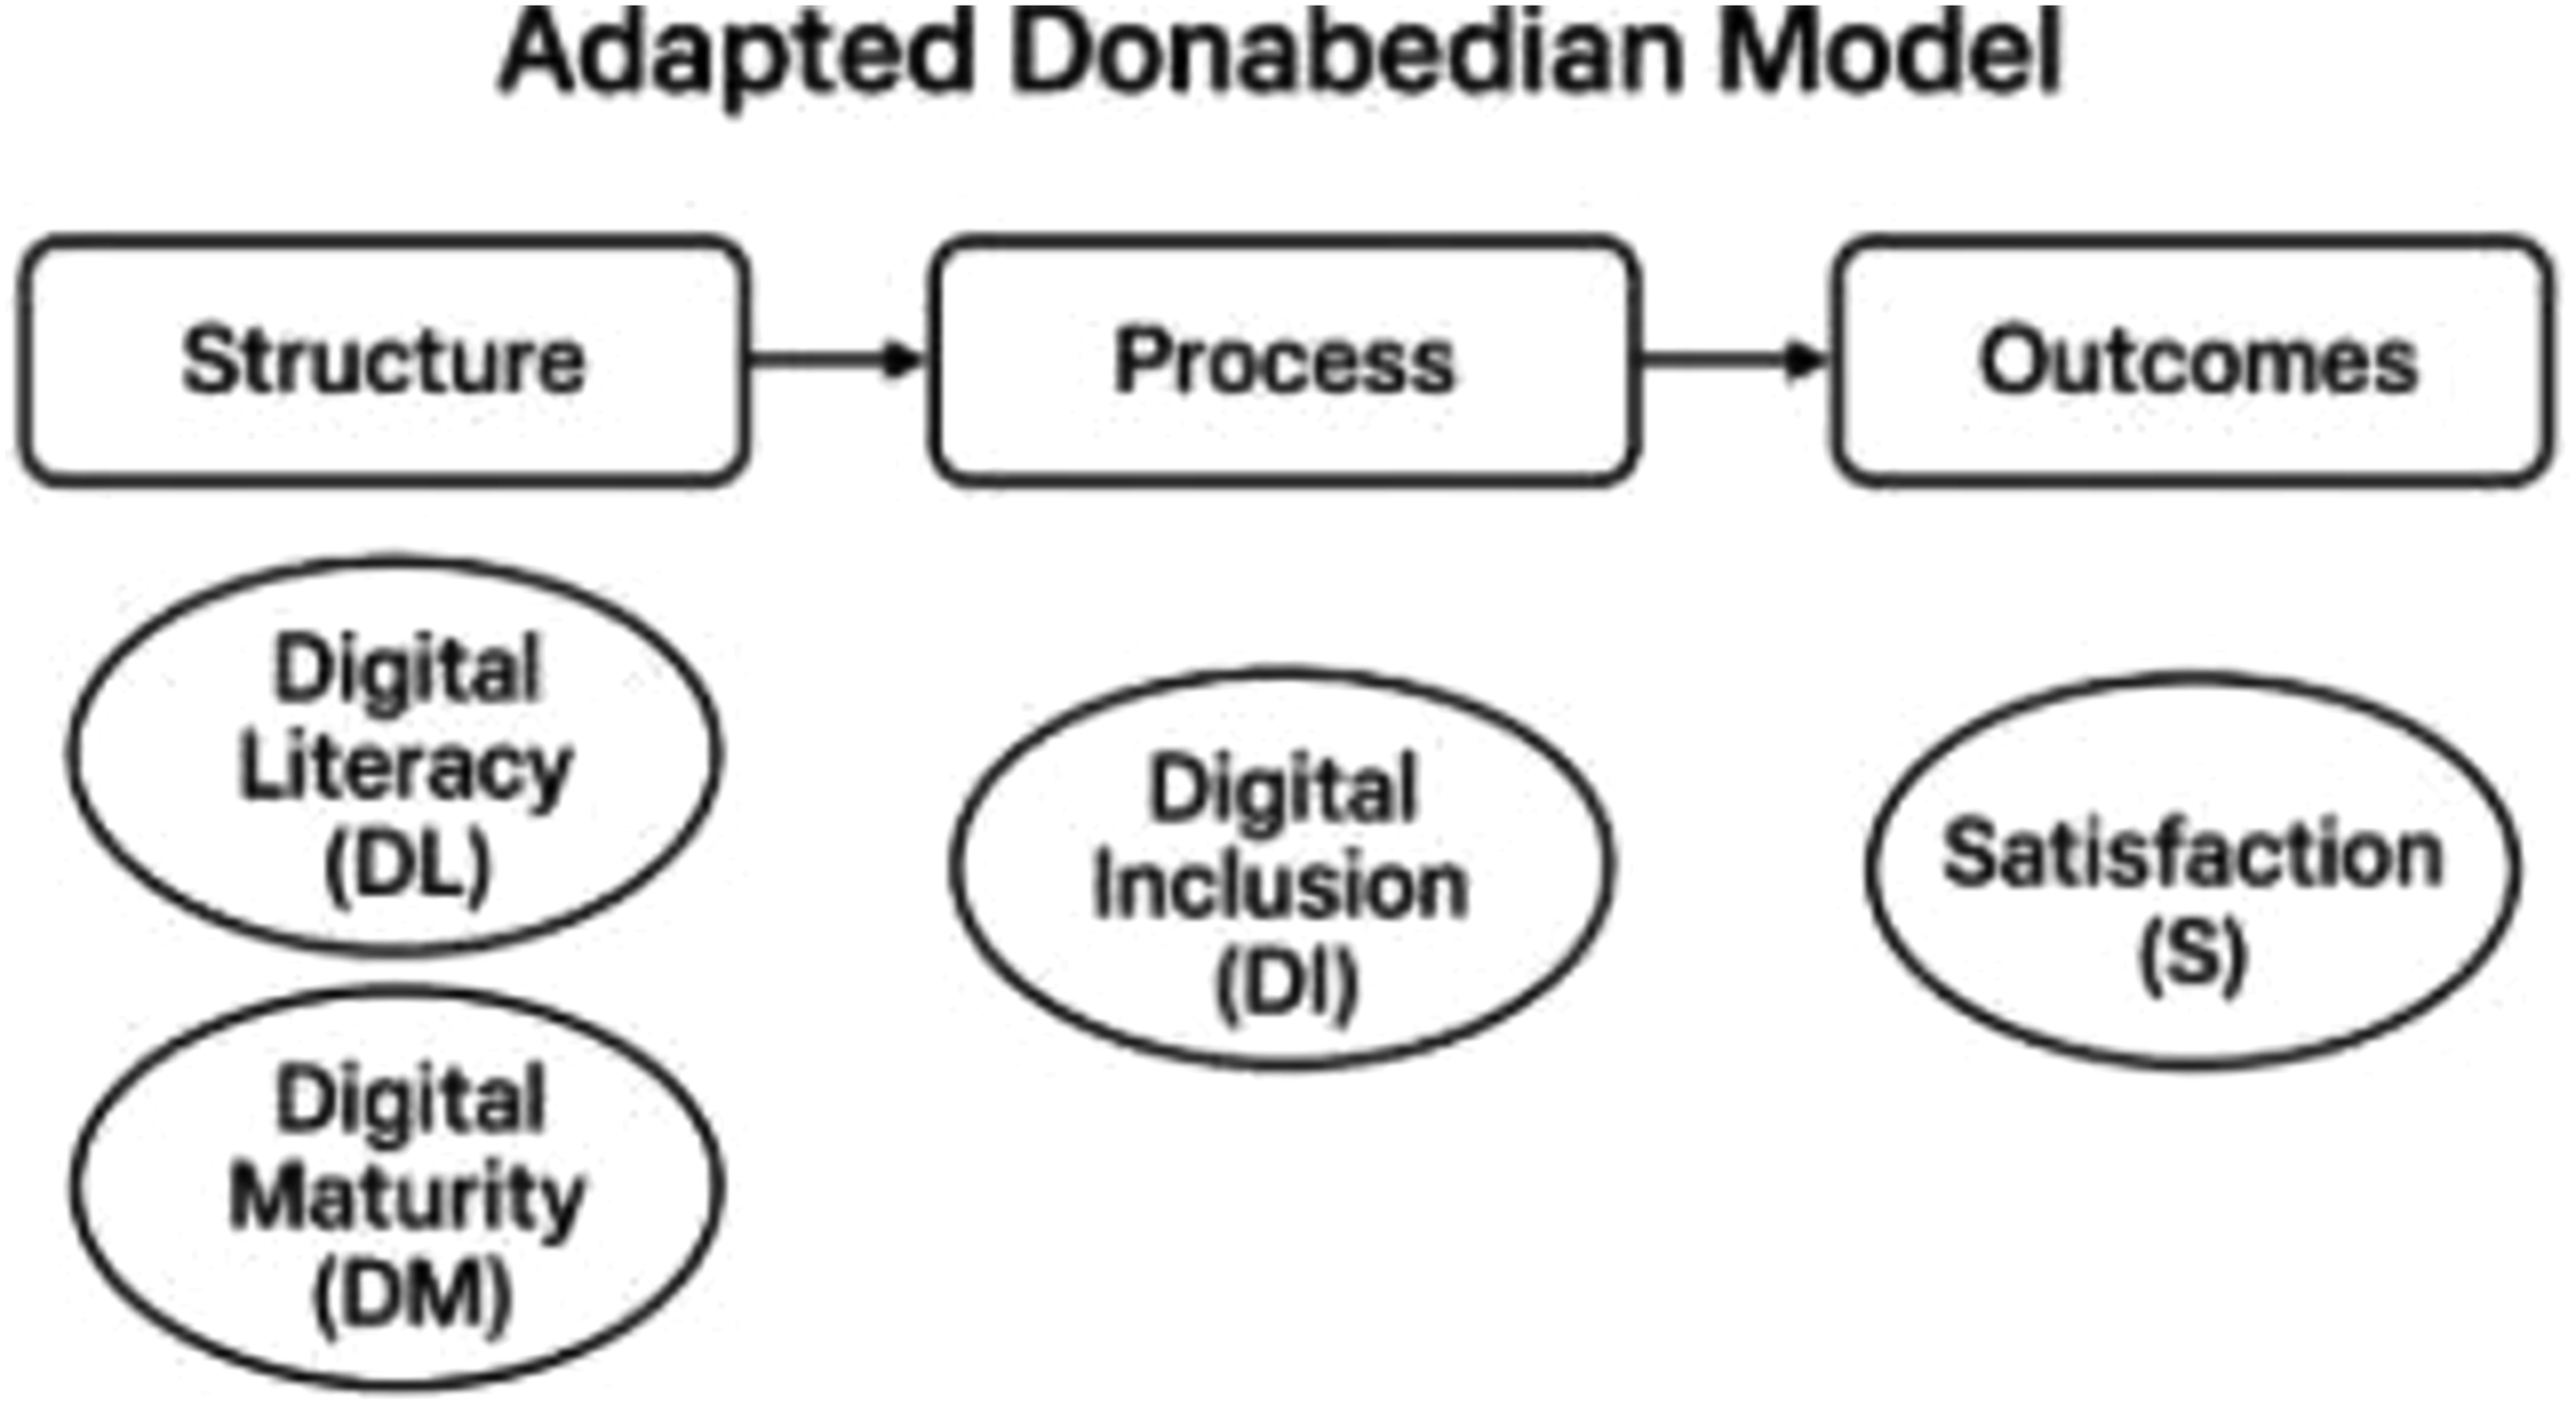
Figure 1 visually synthesizes the theoretical assumptions guiding the investigation and provides a roadmap for empirical validation through Structural Equation Modelling (SEM). The bidirectional interplay between constructs reflects the complex interdependencies between human capabilities and digital infrastructure in contemporary healthcare systems. This framework provides a robust theoretical support through which to explore how foundational digital capability’s grounded in the Donabedian model where Digital Maturity represents the Structure (organizational readiness), Digital Literacy and Inclusion represent the Process (individual capabilities and engagement), and Satisfaction is the Outcome.
Digital Literacy (DL)
Digital literacy has emerged as a fundamental competency in contemporary society, extending beyond mere technical proficiency to encompass a broader set of cognitive and social skills required for navigating digital environments (Alma Çallı & Çallı, 2021; Cetindamar et al., 2024; Eshet-Alkalai, 2004; van der Vaart & Drossaert, 2017). Various definitions and dimensions of digital literacy have been proposed in the literature. For instance, it is often conceptualized as the ability to locate, evaluate, create, and communicate information on digital platforms, while also understanding the ethical and safety implications of digital engagement. Key dimensions frequently include technical skills (e.g. operating devices, using software), informational skills (e.g. searching, evaluating credibility), communication skills (e.g. interacting online, netiquette), and safety/security awareness (e.g. protecting privacy, identifying risks) (Helsper & Van Deursen, 2015; van der Vaart & Drossaert, 2017). For the purpose of this investigation, digital literacy is understood as the individual’s capacity to access, comprehend, and effectively apply digital information and tools, particularly within the context of health services.
Digital literacy in healthcare is defined as the ability of individuals both patients to access, understand, and effectively use digital technologies in health-related contexts (Arias López et al., 2023). It is considered a prerequisite for meaningful engagement with digital services such as mobile health applications, telemedicine, and AI-based decision support tools. Empirical studies have demonstrated that higher levels of digital literacy among healthcare workers are associated with improved adoption of technology and organizational readiness for innovation (Jeong et al., 2019; Tartaglia et al., 2022). For patients, digital literacy reduces barriers to accessing care and contributes to better user experience and satisfaction (Baniasadi et al., 2023; Melhem et al., 2023). Thus, digital literacy is not only a foundational skill but also a driver of both digital maturity and satisfaction.
In the healthcare context, digital literacy is of paramount importance for both patients and healthcare stakeholders. For patients, it is crucial for navigating e-health platforms, understanding online health information, using health-related mobile applications, and engaging in digital communication with providers (Norman & Skinner, 2006; Wang, 2023; Wang et al., 2021). A higher level of digital literacy among patients can lead to greater self-management of health conditions, improved health outcomes, and more informed decision-making (Macken et al., 2019). Similarly, for healthcare stakeholders, digital literacy is essential for adopting and effectively utilizing electronic health records (EHRs), engaging in telemedicine, accessing digital medical resources, and participating in online professional development (Oh et al., 2022). Moreover, digital literacy serves as a foundational element for broader digital advancements within organizations. A higher level of individual digital literacy is widely recognized as a prerequisite for greater digital inclusion, empowering individuals to participate in and derive benefits from digital services (Adeogun & Faezipour, 2025; Helsper & Van Deursen, 2015; Morris et al., 2023). It enables individuals to overcome potential barriers to technology adoption and actively engages in the digital sphere, thus fostering a more inclusive environment.
Consequently, this leads to first hypothesis: • H1: Digital Literacy positively influences Digital Inclusion.
Furthermore, the collective digital literacy of an organization’s workforce is a significant driver of its overall digital maturity. The effective adoption and utilization of digital technologies are inherently dependent on the competencies and skills of the individuals within the organization (Fitzpatrick et al., 2023; Westerman et al., 2019).
Organizations with a more digitally literate workforce are better positioned to implement, adapt, and innovate with digital solutions, thereby advancing their digital maturity levels. This relationship forms the basis for second hypothesis: • H2: Digital Literacy positively influences Digital Maturity.
Digital Maturity (DM)
Digital maturity refers to the extent to which an organization has effectively integrated digital technologies across its functions, processes, and strategic vision, thereby maximizing the value derived from digital investments (Gartner et al., 2022; Gill et al., 2020)). It represents a spectrum, ranging from basic digital adoption to advanced, strategically aligned digital transformation, encompassing dimensions such as technology infrastructure, organizational culture, leadership, data analytics capabilities, and customer engagement (Westerman et al., 2019). Different models of digital maturity exist, often describing stages or levels of digital capability, but they commonly emphasize the need for a holistic approach that goes beyond mere technological implementation to include organizational and human factors. For the purpose of this investigation, digital maturity assesses the advanced capabilities of healthcare organizations in leveraging digital technologies for integrated service delivery and operational excellence. In healthcare, digital maturity is a critical determinant of an organization’s capacity for innovation, efficiency, and patient-centred care. Highly mature digital healthcare organizations are better equipped to implement electronic health records (EHRs) effectively, utilize data for improved clinical decision-making, offer seamless telehealth services, and foster patient engagement through digital platforms (Adler-Milstein, 2021). It signifies an organization’s readiness to adapt to evolving digital landscapes and deliver high-quality, sustainable healthcare services.
As previously discussed individual digital capabilities play a significant role in organizational digital progress. Specifically, Digital Literacy contributes to an organization’s digital maturity, as a digitally competent workforce is better positioned to adopt and leverage new technologies effectively (Westerman et al., 2019). This direct influence forms part of our conceptual framework (H2). Furthermore, Digital Inclusion, as explored in Section 2.3, also positively impacts digital maturity. Organizations that successfully foster digital inclusion among their internal and external stakeholders often overcome key adoption barriers, leading to a more comprehensive and effective utilization of digital tools and infrastructure, thus enhancing their overall digital maturity. This leads to third hypothesis: • H3: Digital Inclusion positively influences Digital Maturity.
Finally, a higher level of Digital Maturity within healthcare organizations is expected to have a direct and positive impact on Satisfaction. As organizations advance in their digital maturity, they typically offer more streamlined processes, integrated digital services, and enhanced user experiences, which directly translate into greater satisfaction for patients and users interacting with these digitally mature services (Agarwal et al., 2025). This forms the basis for fifth hypothesis: • H5: Digital Maturity positively influences Satisfaction.
Satisfaction (S)
Satisfaction in the context of digital healthcare refers to the perceived quality, usability, and effectiveness of digital services from the perspective of patients (Friedel et al., 2023; Ploog et al., 2022). It is influenced by various factors, including the accessibility of services, ease of use, personalization, and responsiveness of digital systems. Several studies suggest that both digital literacy and digital maturity influence satisfaction. Literate users are more likely to navigate and benefit from digital services, while mature digital infrastructures provide more stable and user-friendly environments (Baniasadi et al., 2023; Hamasaki, 2024; Santos-Jaén et al., 2022). Satisfaction is a central concept in service quality and consumer behaviour literature, broadly defined as an individual’s subjective evaluation of an experience, service, or product. This evaluation often results from a comparison between the perceived quality or performance and initial expectations. Within the scope of this research, satisfaction refers specifically to the patients’ perceived satisfaction with the digital health services and platforms provided by healthcare organizations. This encompasses their overall contentment with the digital touchpoints, tools, and information received, reflecting the perceived value and quality of these digital offerings. The importance of patient satisfaction in the healthcare context is well-established, contributing significantly to both individual well-being and organizational success (Wong et al., 2020). For patients, higher satisfaction is associated with improved adherence to treatment plans, greater trust in providers, and enhanced loyalty to healthcare services (Binder et al., 2021; Donabedian, 2005; Rahmaddian et al., 2025).
From an organizational standpoint, patient satisfaction serves as a vital indicator of service quality, operational performance, and institutional reputation. It can influence patient choice, foster positive word-of-mouth, and ultimately impact an organization’s sustainability and competitive standing in the evolving healthcare landscape. In the era of digital transformation, where digital interfaces increasingly mediate healthcare interactions, understanding and enhancing satisfaction with these digital facets of care is paramount for successful technology adoption, sustained engagement, and equitable access to modern healthcare.
Building upon the preceding discussions, Digital Inclusion plays a significant role in influencing satisfaction. When individuals feel digitally included, meaning they have effective access to, and support for using, digital healthcare services, their perceived experience tends to be more positive. This facilitated engagement directly contributes to a higher level of satisfaction with the digital services provided (Almaghaslah et al., 2022, 2022, 2022; Cresswell et al., 2025; Santos-Jaén et al., 2022). Therefore, we hypothesize: • H4: Digital Inclusion positively influences Satisfaction.
Furthermore, an organization’s Digital Maturity is expected to be a key determinant of satisfaction. As healthcare organizations advance in their digital maturity, they typically offer more sophisticated, integrated, and user-friendly digital services, leading to more efficient processes and enhanced service quality. These improvements in digital service delivery are directly linked to greater satisfaction among patients and users (Adeogun & Faezipour, 2025; Agarwal et al., 2025; Almaghaslah et al., 2022; Bancsik et al., 2024; Bell et al., 2024; Donabedian, 2005; Ferreira et al., 2019; Friedel et al., 2023; Parasuraman et al., 1988). This leads to fifth hypothesis: • H5: Digital Maturity positively influences Satisfaction.
Digital Inclusion
Digital inclusion in healthcare refers to ensuring that all individuals, regardless of their socio-economic or digital characteristics, have equitable access to and the ability to fully participate in the digital health environment. The bibliography highlights that digital inclusion is intrinsically linked to digital literacy, with the latter being a prerequisite for inclusion (Ahmed et al., 2020; Connolly et al., 2025; Jeong et al., 2019; Lee, 2025; Rydzewski, 2025; Santos-Jaén et al., 2022; Tegegne et al., 2023).
Digital inclusion extends beyond mere access to technology, encompassing a broader framework that ensures individuals possess the capabilities and opportunities to effectively use digital resources for meaningful purposes, thereby preventing digital exclusion and fostering full participation in the digital society (Selwyn, 2016; van Dijk et al., 2010). Its components typically include physical access to digital devices and internet connectivity; digital skills (which often overlap with digital literacy); the availability of relevant and engaging digital content; and support mechanisms to facilitate effective engagement and participation (Helsper & Van Deursen, 2015; Warsame et al., 2020). True digital inclusion aims to ensure that no one is left behind in a rapidly digitalizing world, irrespective of socio-economic status, geographical location, or pre-existing digital competencies.
In the healthcare sector, digital inclusion is particularly relevant for ensuring equity in access to digital health services. As healthcare increasingly relies on digital platforms for appointments, information, communication, and remote care, the digital divide can exacerbate existing health inequalities (Bourke et al., 2020; Shaw, 2023). Promoting digital inclusion in healthcare means ensuring that all patients, regardless of their background or current digital proficiency, have the necessary means, skills, and support to effectively utilize e-health tools, access reliable health information online, and engage with their care providers digitally (Elbin et al., 2022). This is crucial for achieving patient-centred care and improving public health outcomes across diverse populations.
Digital inclusion plays a significant role in fostering an organization’s journey towards higher digital maturity. Organizations that actively promote the digital inclusion of their stakeholders both internal (e.g. staff) and external (e.g. patients) tend to exhibit greater digital maturity. By addressing and overcoming barriers to technology adoption and ensuring widespread, effective use of digital tools, these organizations can maximize the value derived from their digital infrastructures and innovations. This leads to third hypothesis: • H3. Digital Inclusion positively influences Digital Maturity.
Furthermore, feeling digitally included in healthcare processes, characterized by facilitated access to digital services and adequate support, is a crucial factor for patient satisfaction with digital health services. When individuals perceive that digital healthcare tools are accessible, easy to use, and responsive to their needs, their overall satisfaction with the healthcare experience is likely to increase (Ammenwerth & Shaw, 2005). This direct impact on the user experience forms the basis for fourth hypothesis: • H4. Digital Inclusion positively influences Satisfaction.
Methodology
Research Design
This investigation adopts a quantitative research approach to gather statistical data to test the relationships between the constructs and validate the proposed model on a broader scale. The primary data collection method in this phase was the survey, complemented by documentary research. The survey was constructed using a five-point Likert scale, chosen for its ability to numerically order categories and capture participant attitudes and perceptions, with assurance of scientific validation. The survey was distributed via social networks like Facebook and LinkedIn, with a clear explanation of the investigation objectives provided to participants. The quantitative phase includes a set of theoretical constructs that structure the analytical model of the investigation. Each construct was operationalized into specific sub-dimensions, reflected in a set of validated items, developed based on scientific literature and adjusted to the context of health services. The quantitative instrument was structured around three core constructs: Digital Maturity, Digital Literacy and Satisfaction. Each construct comprises multiple dimensions derived from the literature and validated through previous studies. These dimensions were measured using multiple items, mostly rated on a 5-point Likert scale (from ‘Strongly disagree’ to ‘Strongly agree’).
The sample consists of 212 healthcare users. For this study, a ‘healthcare user’ is defined as any citizen who has accessed health services (public or private) within the last 12 months, regardless of whether the contact was digital or face-to-face. Participants were recruited through a non-probabilistic convenience sampling method via social media and professional networks. Although 217 responses were initially recorded in the system, 5 were excluded during the data cleaning phase due to incomplete answers (missing system responses), resulting in a final valid sample of 212. By shifting the analytical focus from the ‘provider’ to the ‘consumer’ of information, we ensure a nuanced understanding of how digital maturity translates into perceived quality of care under the Donabedian framework.
Participants and Sampling
The target population comprised healthcare users who interacted with health institutions across Mainland Portugal and the Islands. A non-probability convenience sampling method was employed, reaching respondents through various online platforms. This approach yielded a final sample of 212 valid responses. To ensure the validity of perceptions regarding Digital Maturity, eligibility was restricted to participants who had utilized healthcare services whether in-person or digital within the previous 12 months. The sample is inherently diverse and not limited to a single institution, providing a comprehensive overview of the national healthcare ecosystem. Furthermore, the minimum sample size was determined in accordance with the guidelines proposed by Hair et al. (2019) for Structural Equation Modelling (SEM). This followed the ‘10-times rule’, considering the number of predictors in the most complex regression equation (specifically, 10 times the maximum number of arrows pointing to a single construct) (Hair et al., 2019).
Instrument and Measures
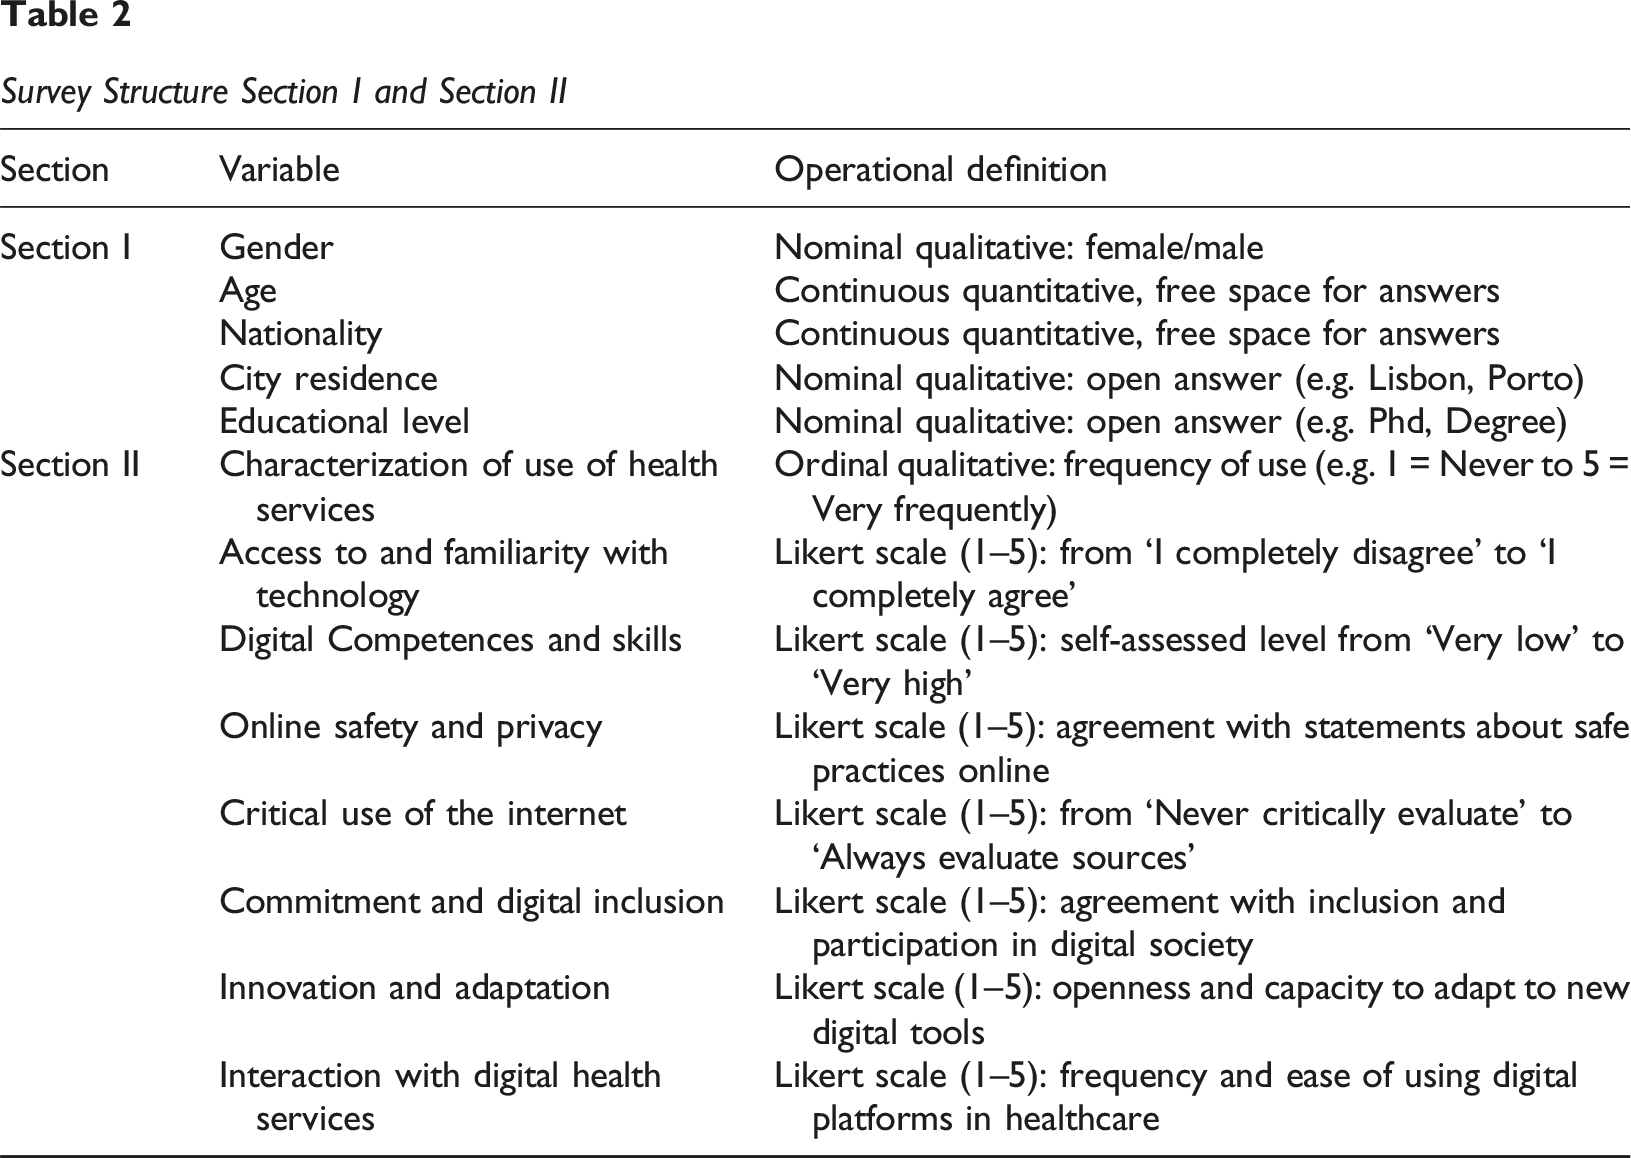
Data were collected using a structured survey divided into six sections: (a) Section I – Characterization of Participants and Use of Health Services:
This includes sociodemographic variables such as gender, age, nationality, municipality of residence, and level of healthcare. In addition, it collects information on health service usage habits, frequency, and reasons for choice. (b) Section II – Technological Profile and Multidimensional Digital Literacy:
This assesses dimensions such as access to and familiarity with technology, digital skills, online safety, critical use of the internet, digital inclusion, adaptation to innovation, and interaction with digital health services.
Survey Structure Section I and Section II
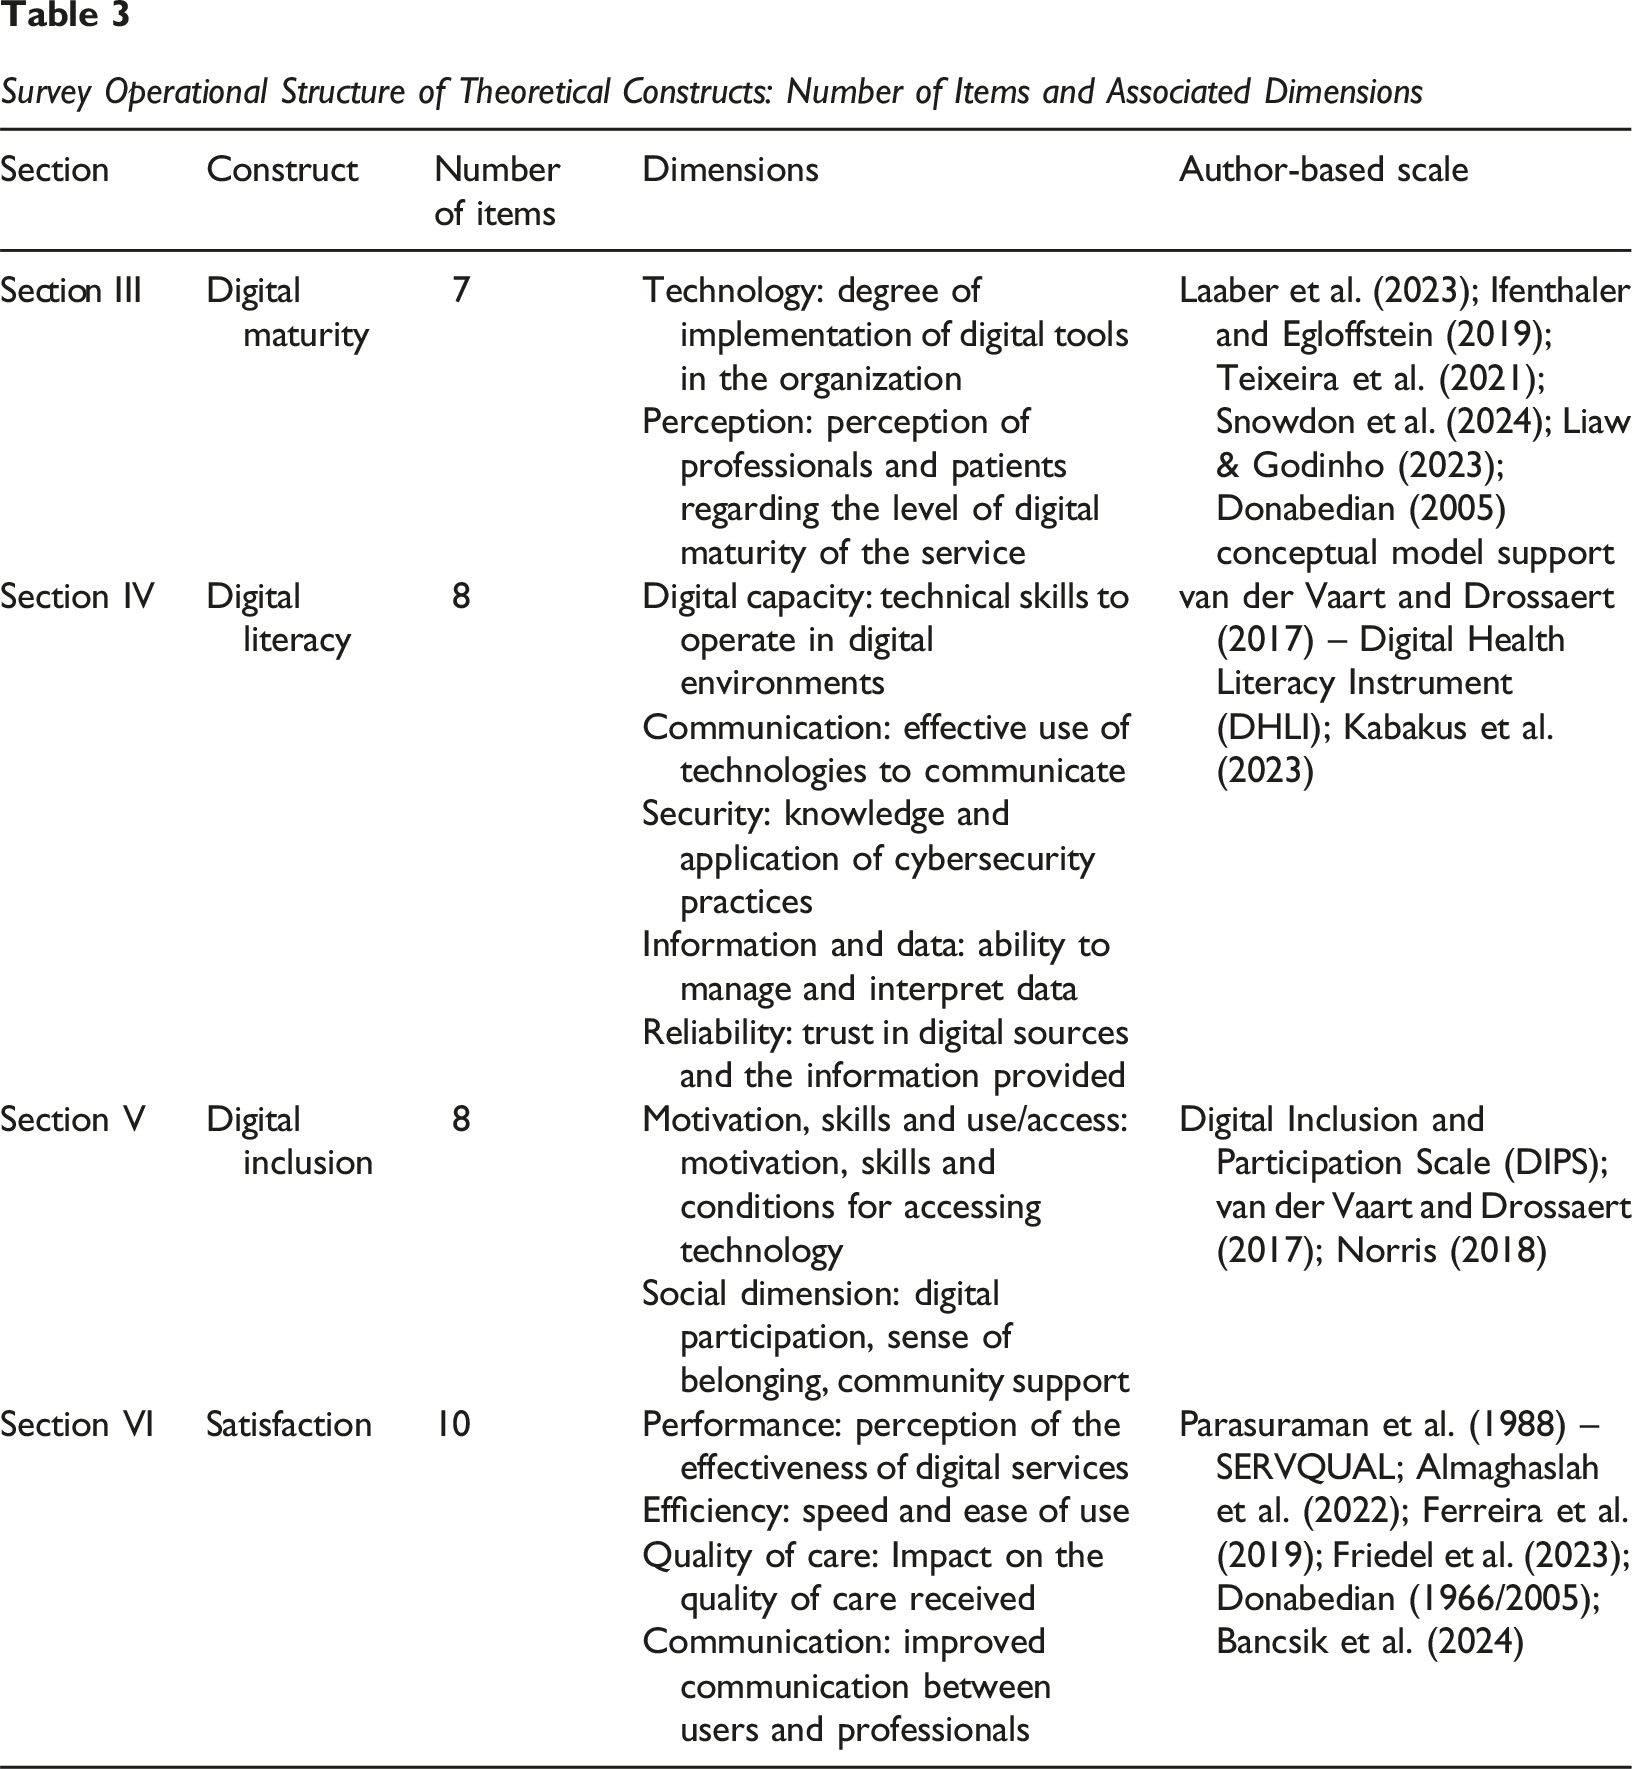
Survey Operational Structure of Theoretical Constructs: Number of Items and Associated Dimensions
Descriptive Analysis – Gender
Descriptive Analysis – Healthcare Level
Descriptive Analysis – Healthcare Level, Age, and Gender
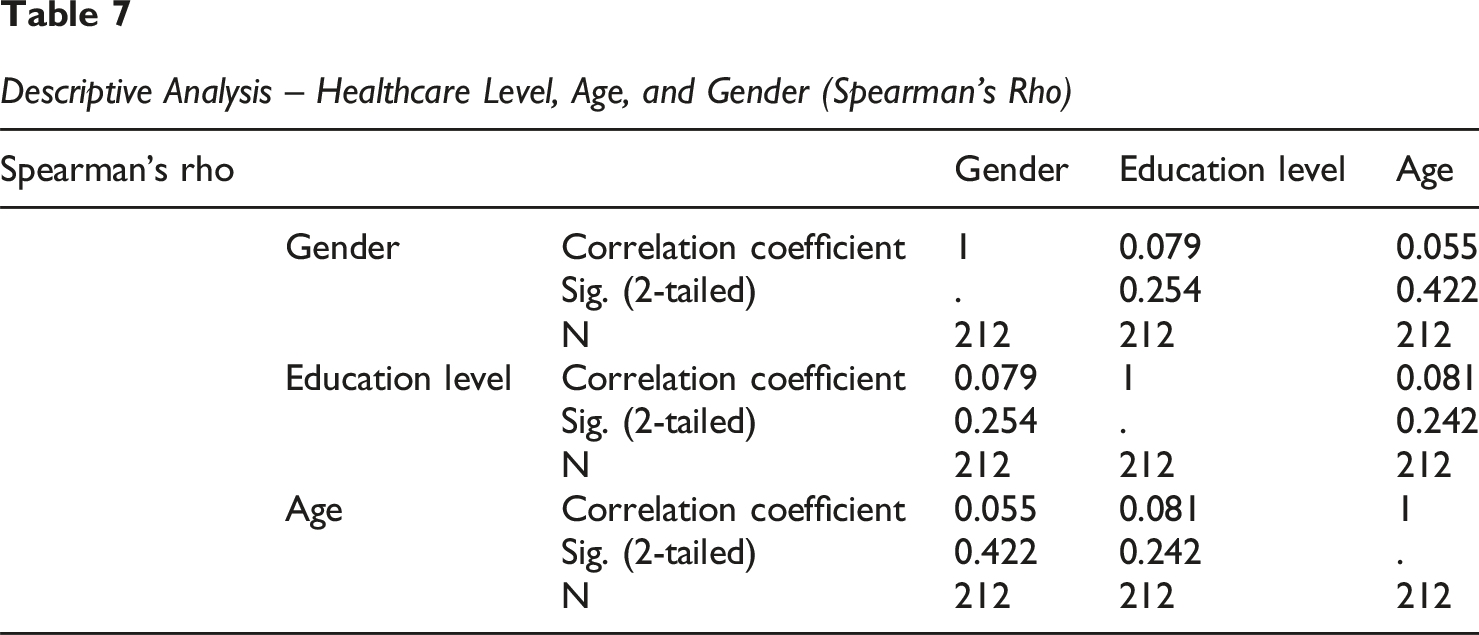
Descriptive Analysis – Healthcare Level, Age, and Gender (Spearman’s Rho)
Satisfaction Measurement
Maturity Measurement
Inclusion Measurement
Literacy Measurement
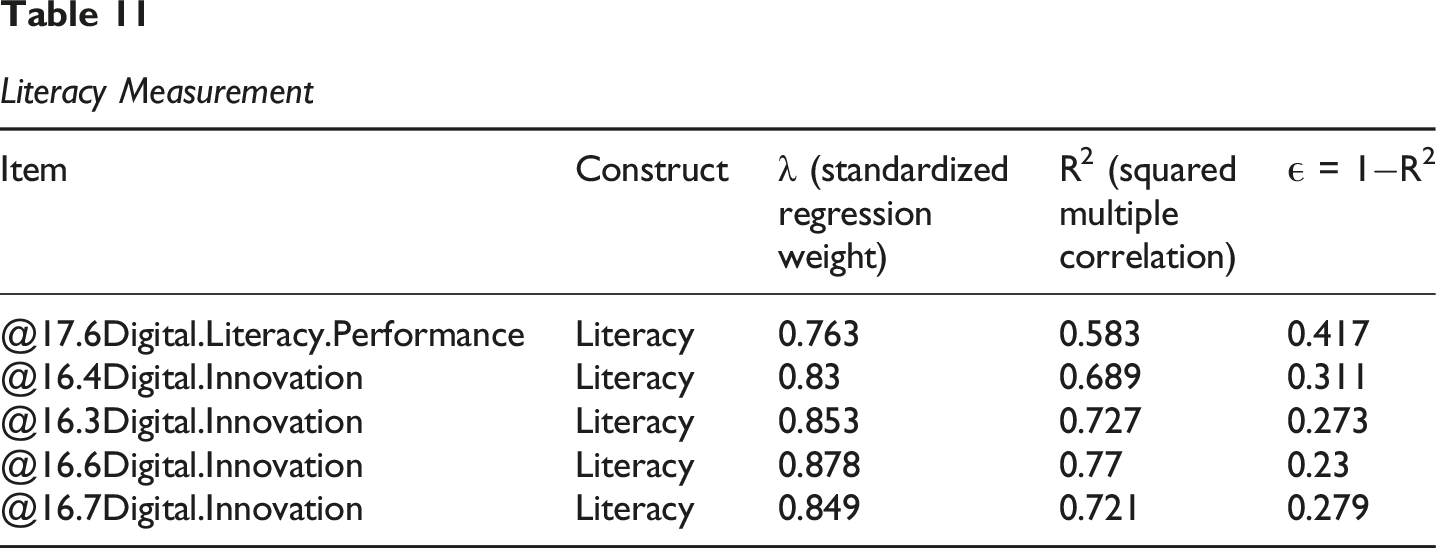
Table 3 summarizes the constructs, number of items, and underlying dimensions:
Responses were measured using a five-point Likert scale (1 = Strongly disagree; 5 = Strongly agree). The instrument was constructed using validated scales adapted to the healthcare context: (c) Section III – Digital Maturity
This section evaluates the degree of digital transformation within healthcare organizations from both structural and perceptual standpoints.
It includes items that measure: Technology: the extent to which digital tools and technologies are implemented in the organization. Perception: how patients perceive the level of digital maturity in their healthcare services.
These dimensions are grounded in validated frameworks and empirical studies on digital maturity in healthcare, including those by Laaber et al. (2023), Ifenthaler and Egloffstein (2019), and Teixeira et al. (2021). The conceptual structure also aligns with Donabedian’s (2005) quality model, particularly the ‘structure’ and ‘process’ dimensions as they relate to digitalization. The construct Digital Maturity, operationalized with 11 items, was structured along two dimensions: Technology and Perception. Its development and validation were based on extensive literature regarding digital maturity models in healthcare and other sectors. Key sources include the Digital Maturity Inventory (DIMI) by Laaber et al. (2023), as well as frameworks and maturity models proposed or adapted by Ifenthaler and Egloffstein (2019), Teixeira et al. (2021), and Snowdon et al. (2024), among others. These references ensured theoretical robustness and empirical adequacy to the healthcare context (Ifenthaler & Egloffstein, 2019; Laaber et al., 2023; Snowdon et al., 2024; Teixeira et al., 2021). (d) Section IV – Digital Literacy
This section explores the participants’ ability to engage effectively and safely in digital health environments. It comprises five key dimensions: Digital Capacity: technical ability to navigate and use digital environments. Communication: effectiveness in using digital tools to communicate with healthcare users. Security: knowledge and adoption of cybersecurity practices, including password management and phishing awareness. Information and Data: capacity to interpret, manage, and make decisions using digital health information. Reliability: trust in the sources and information accessed through digital platforms.
The structure of this section is based primarily on the Digital Health Literacy Instrument (DHLI) by van der Vaart and Drossaert (2017), supplemented by constructs adapted from Kabakus et al. (2023) to reflect emerging areas in digital interaction.
The construct Digital Literacy was operationalized through 8 items distributed across five interrelated dimensions: Digital Capacity, Communication, Security, Information and Data, and Reliability. These dimensions align with the conceptual structure proposed by van der Vaart and Drossaert (2017) in the development of the Digital Health Literacy Instrument (DHLI). The DHLI is a validated instrument specifically designed to measure a broad range of digital skills relevant in the health context, including not only functional digital abilities but also critical and safety-related aspects. Its rigorous validation process supports the theoretical foundation and measurement validity of the Digital Literacy construct in this investigation. (e) Section V – Digital Inclusion
This section captures the extent to which participants are digitally included within the health ecosystem. It includes two overarching dimensions: Motivation, Skills and Use/Access: individual readiness and ability to access and use digital services, as well as their motivation to do so. Social Dimension: perceived social inclusion, community support, and participation in digital society.
The conceptual foundation for this section comes from the Digital Inclusion and Participation Scale (DIPS) and other studies such as Norris (2018), and it shares a complementary relationship with DHLI in measuring foundational digital engagement. The construct Digital Inclusion was operationalized with 11 items across two major dimensions: Motivation, Skills and Use/Access and Social Dimension. Its structure was informed by existing tools such as the Digital Inclusion and Participation Scale (DIPS), which captures critical elements of access, digital skills, motivation, and online engagement. In addition, competencies drawn from the Digital Health Literacy Instrument (DHLI) (van der Vaart & Drossaert, 2017) supported the operationalization of inclusion within a healthcare digital context. The construct also reflects conceptual frameworks on digital inequality (e.g. Norris, 2018) and includes considerations based on validated transcultural studies addressing the digital divide in Portuguese-speaking populations. (f) Section VI – Satisfaction
This section aims to measure patient satisfaction with digital health services, across the following dimensions: Performance: perceived effectiveness of digital tools and platforms. Efficiency: perceived speed, convenience, and ease of use. Quality of Care: impact of digital services on the quality and continuity of care received. Communication: perceived improvement in communication between users and healthcare stakeholders.
The section draws upon the well-established SERVQUAL model (Parasuraman et al., 1988), along with validated survey instruments adapted to digital health settings from Almaghaslah et al. (2022), Ferreira et al. (2019), and others. The Donabedian model (1966/2005) supports the conceptual framing of satisfaction as an outcome of care quality. The construct Satisfaction was measured through 10 items that explore four interrelated dimensions: Performance, Efficiency, Quality of Care, and Communication. The measurement approach is grounded in the SERVQUAL model by Parasuraman et al. (1988), which has been extensively validated and adapted across sectors including healthcare. Additional support comes from recent literature such as Ferreira et al. (2019) and Bancsik et al. (2024), which provide systematic overviews of tools used to assess patient satisfaction. Practical applications and adaptations in digital contexts (e.g. Almaghaslah et al., 2022) were also considered for content validity. Conceptually, this construct is framed within Donabedian’s model of healthcare quality, where patient satisfaction is seen as a key outcome indicator. The selected constructs and dimensions are aligned with the theoretical framework adapted from Donabedian’s model of quality in healthcare (structure, process, outcomes). The digital dimensions reflect the growing body of literature around digital transformation readiness, literacy, and user focused outcomes in healthcare environments. Each scale was either adopted directly from validated instruments or adapted based on literature-backed constructs, ensuring content validity and consistency with prior research. Likert-type response formats were predominantly used (5-point), with some open-ended and categorical options for descriptive questions. This structure supports both descriptive and inferential statistical analyses to assess associations, patterns, and predictors of digital engagement, satisfaction, and inclusion among healthcare service patients.
Data Collection Procedures
Data collection took place during January 2025 using an online survey distributed via social media platforms (Facebook, LinkedIn). Participants received a brief description of the investigation. The investigation ensured anonymity and confidentiality of responses in accordance with ethical research standards.
Data Analysis
Data were analysed using IBM SPSS Statistics for descriptive and reliability analysis, and AMOS (Analysis of Moment Structures) for performing Structural Equation Modelling (SEM).
The following steps were performed: 1. Descriptive Analysis: Conducted to summarize the demographic profile and key variables using SPSS 2. Reliability Testing: Cronbach’s Alpha and Composite Reliability (CR) were used to evaluate the internal consistency of the constructs (threshold ≥0.70). 3. Measurement Model Evaluation: Confirmatory Factor Analysis (CFA) was conducted using AMOS to assess the quality of the measurement model: a. Indicator reliability (factor loadings) b. Convergent validity (using Average Variance Extracted – AVE) c. Discriminant validity (via Fornell-Larcker criterion and HTMT ratio) 4. Structural Model Evaluation (AMOS) Structural Equation Modelling (SEM) was applied to test the hypothesized relationships between latent constructs (e.g. Digital Literacy → Digital Maturity). Model fit indices such as CMIN/DF, CFI, TLI, NFI, and RMSEA were analysed to assess the overall goodness-of-fit. 5. Hypothesis Testing (AMOS) Path coefficients, standard errors, critical ratios, and p-values were used to determine the statistical significance of each hypothesized relationship. Direct and indirect effects were examined where applicable. 6. Model Re-specification (if needed) Based on model fit and modification indices, adjustments to the model were considered to improve alignment with the observed data.
Results
Descriptive Analysis
A total of 212 valid responses were collected from individuals with direct or indirect experience in healthcare services. The sample included healthcare patients who had interacted with digital or traditional healthcare systems. The demographic profile revealed a gender distribution pending to female, with participants aged predominantly between 21 and 73 years. Most respondents held a higher healthcare degree and resided in urban municipalities in Portugal. Regarding healthcare usage patterns, the majority reported regular interactions with both in-person and digital health services.
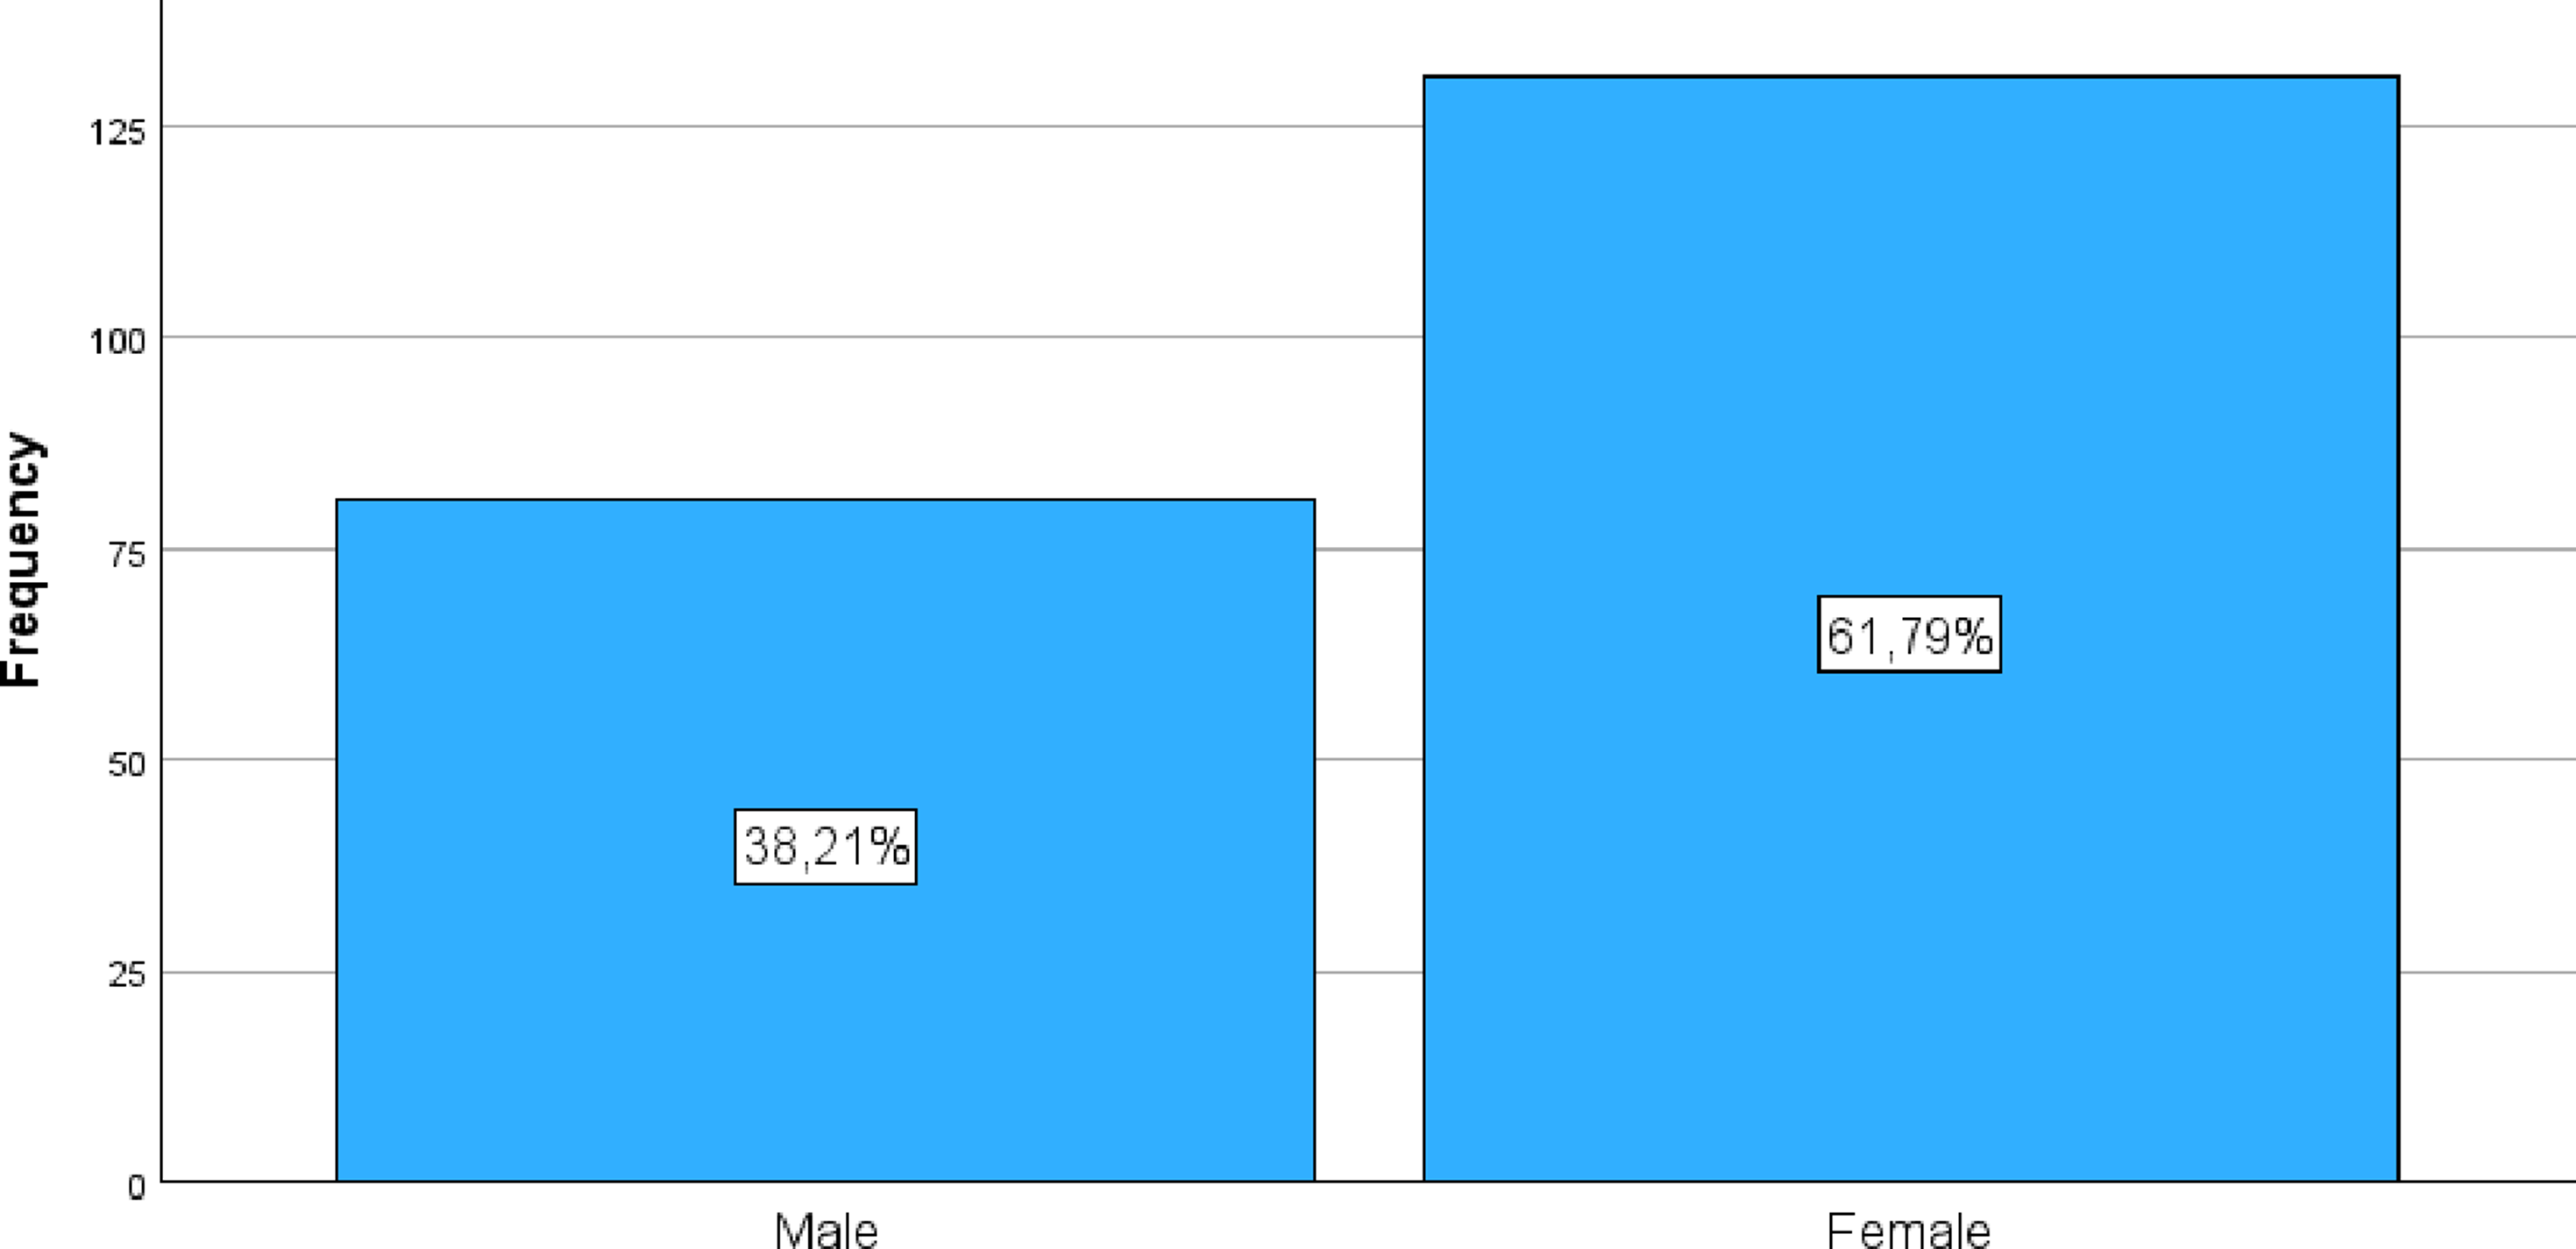
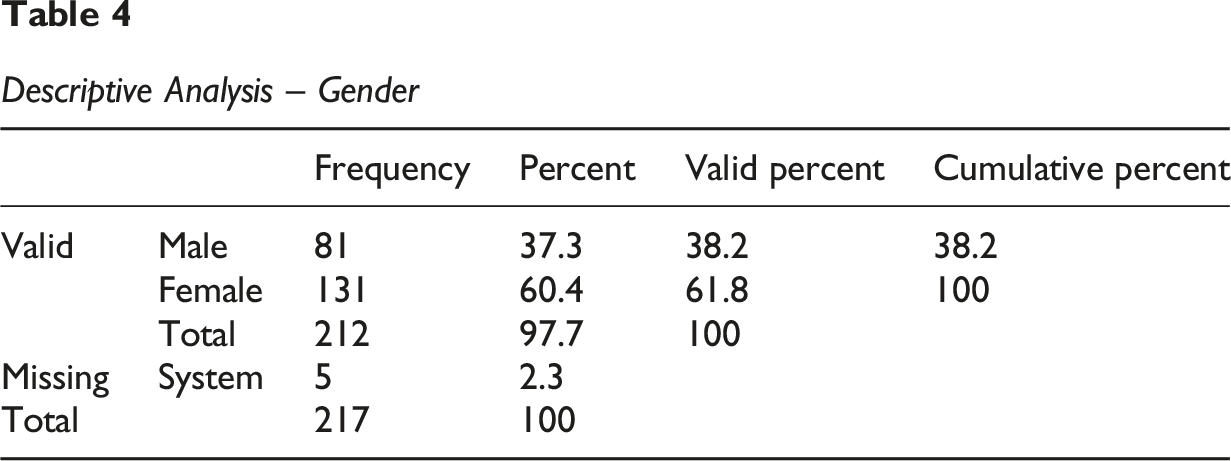
Observations: The total sample comprises 217 participants. There are 5 missing cases (2.3%) for the Gender variable, meaning 212 cases have valid data for this variable. The gender distribution is predominantly female, with 131 participants (61.8% of valid cases). Male participants account for 81 individuals (38.2% of valid cases). This distribution shows a considerable imbalance in gender representation within your sample, with a significantly higher proportion of female participants.
The investigation sample comprised 217 participants, of whom 212 provided valid data for the gender variable. A female predominance was observed, with 131 participants (61.8%), compared to 81 male participants (38.2%).
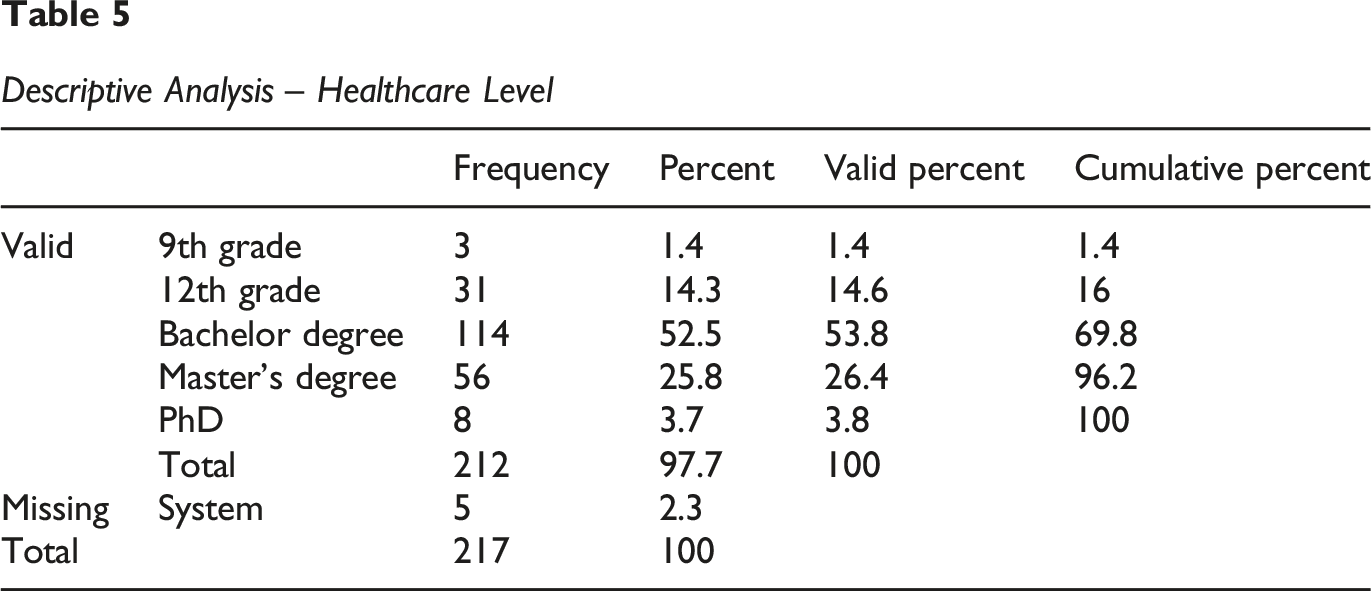
Observations: Like gender, there are 5 missing cases (2.3%) for the Healthcare Level, resulting in 212 valid cases.
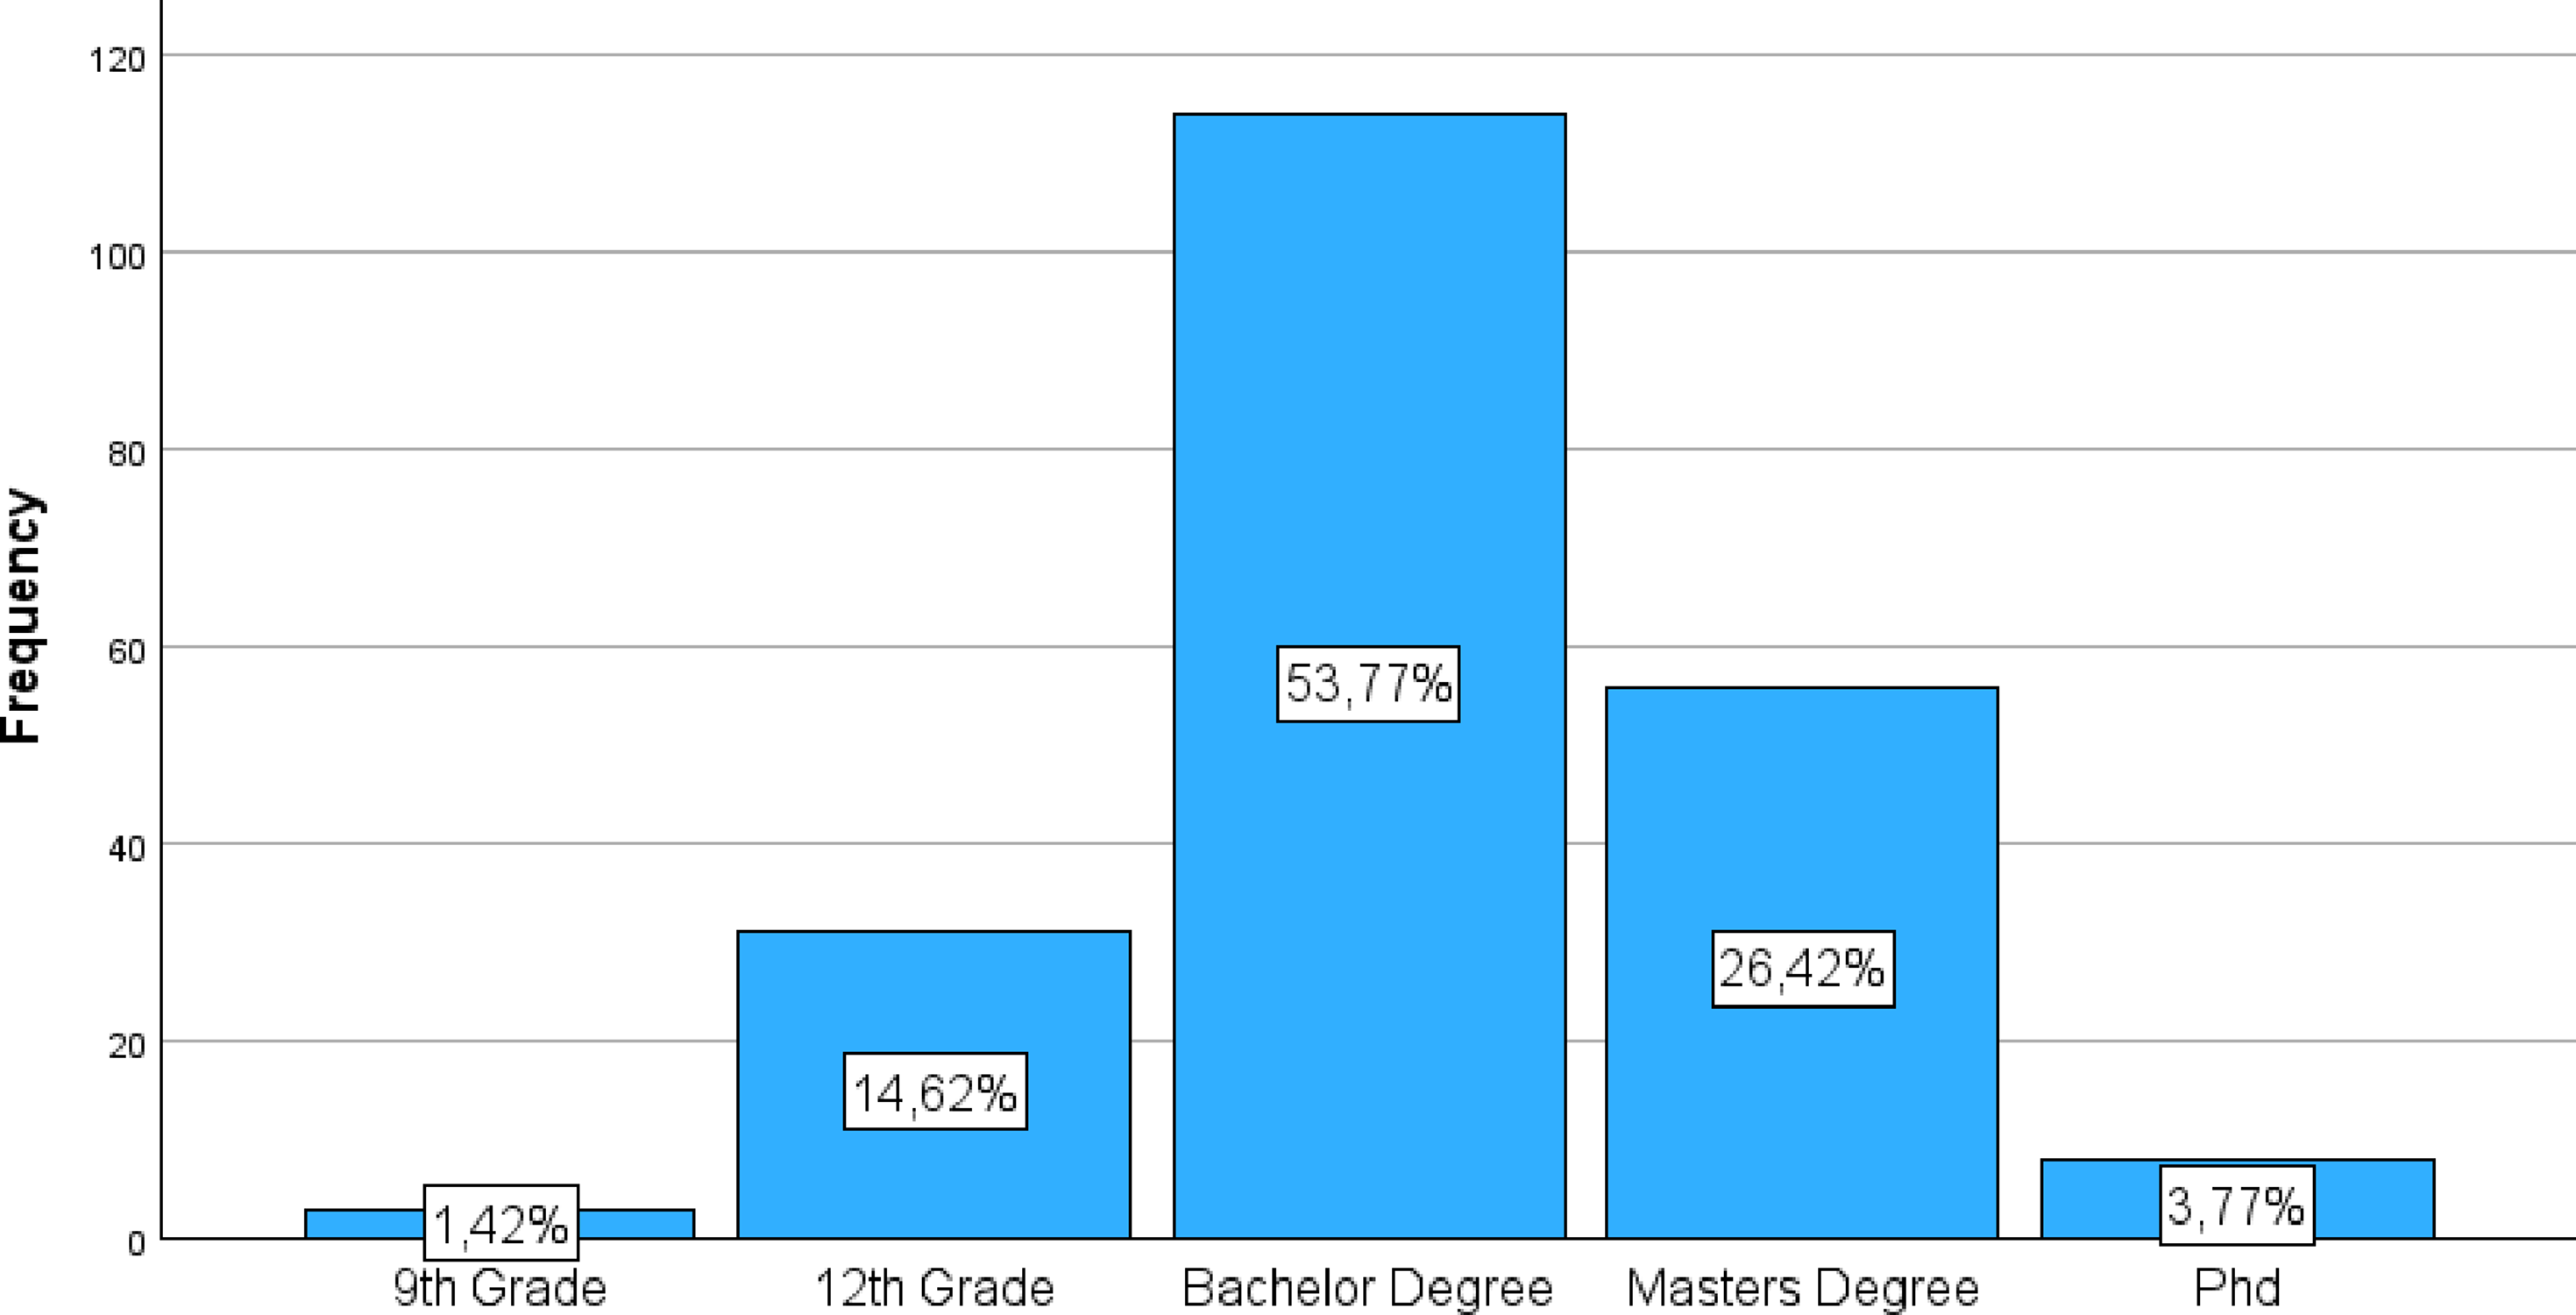
The sample exhibits a high level of healthcare, with most participants having higher healthcare qualifications: 9th Grade: 3 participants (1.4% of valid cases) 12th Grade: 31 participants (14.6% of valid cases) Bachelor’s degree: The most representative category, with 114 participants (53.8% of valid cases). Master’s Degree: 56 participants (26.4% of valid cases). PhD: 8 participants (3.8% of valid cases).
Most participants (53.8% + 26.4% + 3.8% = 84% of valid cases) hold at least a bachelor’s degree.
Regarding healthcare level, 212 participants provided valid data. The sample revealed a high level of academic qualification, with most respondents possessing higher healthcare. Specifically, 1.4% had a 9th-grade healthcare, 14.6% had a 12th-grade healthcare, 53.8% completed a bachelor’s degree, 26.4% held a master’s degree, and 3.8% had a PhD. Collectively, 84% of valid participants hold at least a bachelor’s degree.
Pearson Correlations
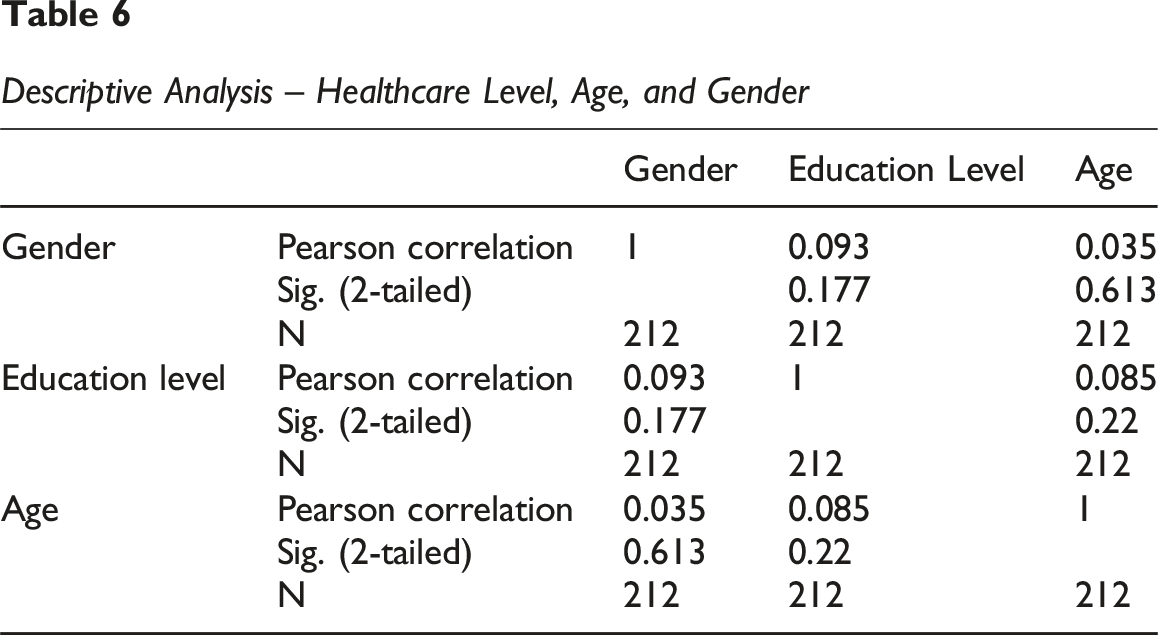
Pearson Correlation measures the strength and direction of a linear relationship between two continuous variables. In the case of a dichotomous variable (like Gender) and a continuous variable (like Age or Healthcare Level treated as interval), the Pearson coefficient is interpreted as a point-biserial correlation. (a) Age and Healthcare Level • Pearson Correlation: −0.198 • Sig. (2-tailed): 0.004 • N: 212
There is a weak (0.198) and negative statistically significant correlation (p = 0.004 < 0.05) between age and healthcare level. • This suggests that as age increases, the healthcare level tends to be slightly lower. This could reflect historical healthcare trends where younger generations, on average, have higher formal healthcare levels than older generations. (b) Age and Gender Pearson Correlation: 0.144 Sig. (2-tailed): 0.035 N: 212
There is a weak (0.144) and positive statistically significant correlation (p = 0.035 < 0.05) between age and gender. • A positive correlation suggests that age tends to be slightly higher for one of the gender groups (e.g. if Female is coded as 2, there might be a slight tendency for females in your sample to be somewhat older, on average, than males, or vice-versa, depending on your coding). For precise interpretation, it is essential to know the numerical coding of gender. (c) Healthcare Level and Gender • Pearson Correlation: −0.279 • Sig. (2-tailed): 0.000 • N: 212 • Explanation: There is a weak to moderate (0.279) and negative statistically highly significant correlation (p = 0.000 < 0.05) between healthcare level and gender. • Again, the interpretation of the direction depends on your coding for gender and healthcare. If (for example) higher healthcare levels have higher numerical values (e.g. 9th grade = 1, Master’s = 4) and Gender is 1 = Male, 2 = Female, a negative correlation (−0.279) suggests that females (value 2) tend to have slightly higher healthcare levels than males (value 1), or vice-versa if your coding is reversed. Confirm your coding to interpret the direction with certainty.
Spearman Correlations (Based on image_0ab0c5.png)
Spearman’s Rho measures the strength and direction of a monotonic (not necessarily linear) relationship between two ranked variables. It is more suitable for ordinal variables or when data do not meet Pearson’s normality assumptions. (a) Age and Healthcare Level Spearman’s Rho: −0.195 Sig. (2-tailed): 0.004 N: 212 Explanation: There is a weak (0.195) and negative statistically significant correlation (p = 0.004 < 0.05) between the rank order of age and the rank order of healthcare level. • The result is very similar to the Pearson Correlation, reinforcing the conclusion that as age increases, the healthcare level (in terms of rank) tends to be slightly lower. (b) Age and Gender Spearman’s Rho: 0.145 Sig. (2-tailed): 0.035 N: 212 Explanation: There is a weak (0.145) and positive statistically significant correlation (p = 0.035 < 0.05) between the rank order of age and the rank order of gender. • This result is almost identical to Pearson’s, maintaining the interpretation that age tends to be slightly higher for one of the gender groups according to your coding. (c) Healthcare Level and Gender Spearman’s Rho: −0.298 Sig. (2-tailed): 0.000 N: 212 Explanation: There is a weak to moderate (0.298) and negative statistically highly significant correlation (p = 0.000 < 0.05) between the rank order of healthcare level and the rank order of gender. • The strength of the Spearman correlation is slightly stronger than Pearson’s (−0.298 vs −0.279), which may indicate that the monotonic relationship is a bit more pronounced. The conclusion that females (or the group coded with a higher value) tend to have slightly higher healthcare levels is maintained.
General Summary of Correlations: Age and Healthcare Level: There is a weak, but significant, inverse relationship. Older individuals tend to have slightly lower formal healthcare levels in your sample. Age and Gender: There is a weak, but significant, relationship indicating a slight difference in average age between genders, depending on your gender coding. Healthcare Level and Gender: There is a weak to moderate, highly significant correlation, suggesting that one of the genders (likely female, if coded as 2) in your sample tends to have higher healthcare levels.
The Pearson and Spearman correlation analyses revealed consistent patterns in the relationships among the demographic variables of Age, Healthcare Level, and Gender within the sample, all with a valid number of participants (N = 212). 1. Age and Healthcare Level: Both analyses (Pearson: r = −0.198, p = 0.004; Spearman: rho = −0.195, p = 0.004) indicate a weak, but statistically significant and negative correlation. This finding suggests that, in the sample, older participants tend to have a slightly lower level of formal healthcare. 2. Age and Gender: The correlations between Age and Gender were consistently weak, positive, and statistically significant (Pearson: r = 0.144, p = 0.035; Spearman: rho = 0.145, p = 0.035). Although the strength of the relationship is modest, this suggests a small difference in the average age between gender groups, with one gender (depending on your numerical coding) tending to be slightly older in the sample. 3. Healthcare Level and Gender: A negative and highly significant correlation was observed between Healthcare Level and Gender, with a weak to moderate strength (Pearson: r = −0.279, p = 0.000; Spearman: rho = −0.298, p = 0.000). The slight difference in strength between Pearson and Spearman may indicate a clearer relationship when considering ordinal rankings. This correlation suggests that one of the gender groups (again, depending on your coding, but likely females) tends to have slightly higher healthcare levels in your sample.
In summary, the demographic data from sample reveals that, although correlations are mostly weak, there are statistically significant relationships: age tends to be inversely related to healthcare level, and there are subtle differences in age and healthcare levels between genders. These sample characteristics are important for contextualizing the results of more complex analyses regarding digital maturity, inclusion, and literacy.
Measurement Model Assessment (Confirmatory Factor Analysis – CFA)
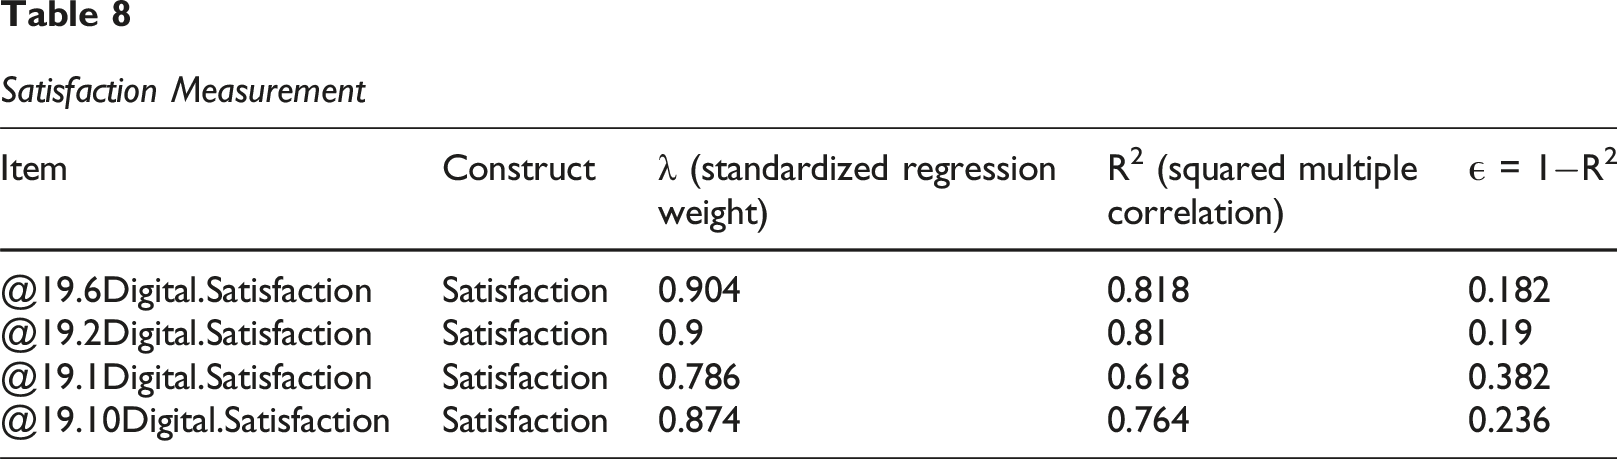
Satisfaction
Items: @19.6Digital.Satisfaction, @19.2Digital.Satisfaction, @19.1Digital.Satisfaction, @19.10Digital.Satisfaction (N = 4).
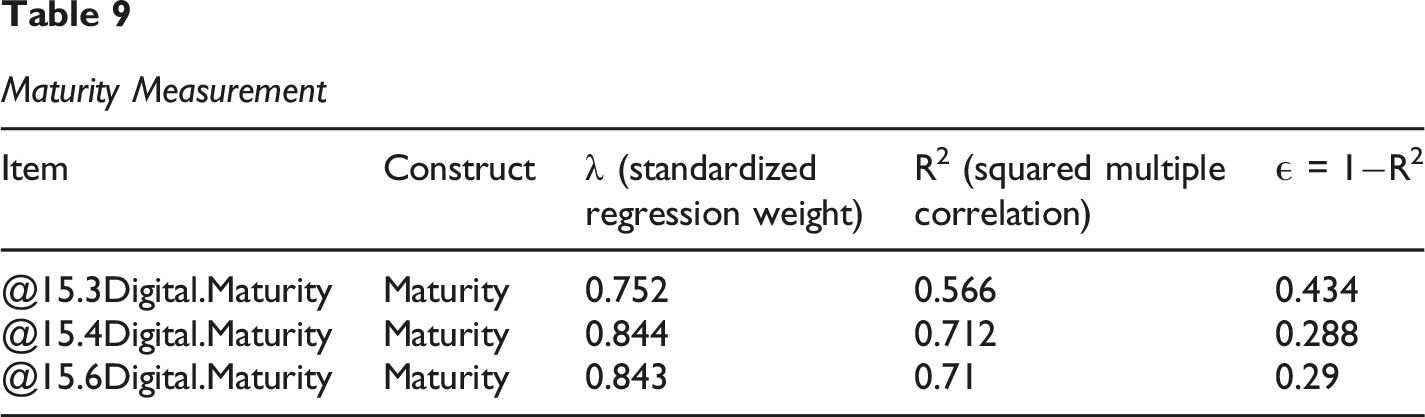
Digital Maturity
Items: @15.3-@15.4 @15.6, Total N = 3.
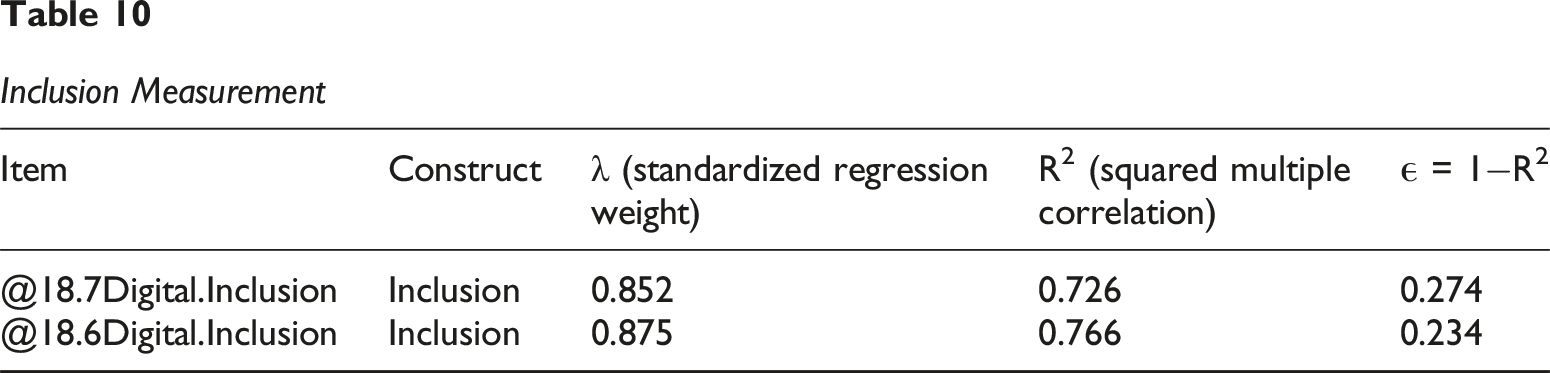
Digital Inclusion
Items: @18.6Digital.Inclusion, @18.7Digital.Inclusion (N = 2).
Digital Literacy
Items: @16.3, @16.4, @16.6, @16.7, @17.6 (N = 5).
Construct Reliability and Convergent Validity
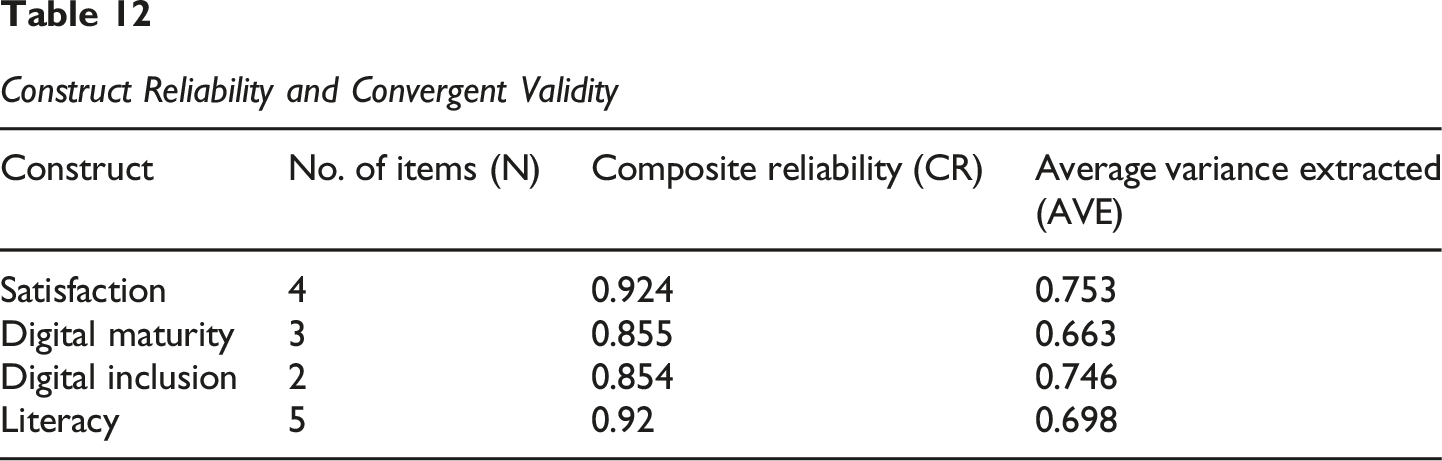
The composite reliability (CR) for all constructs ranged from 0.854 (Digital Inclusion) to 0.924 (Satisfaction). All CR values were well above the recommended threshold of 0.70 (Fornell & Larcker, 1981), indicating excellent internal consistency and reliability of the scales. Furthermore, the average variance extracted (AVE) for each construct ranged from 0.663 (Digital Maturity) to 0.753 (Satisfaction). All AVE values surpassed the critical threshold of 0.50 (Fornell & Larcker, 1981), providing strong evidence of convergent validity, as more than 50% of the variance in the items was explained by their respective constructs.
Discriminant Validity Assessment (Fornell-Larcker Criterion)
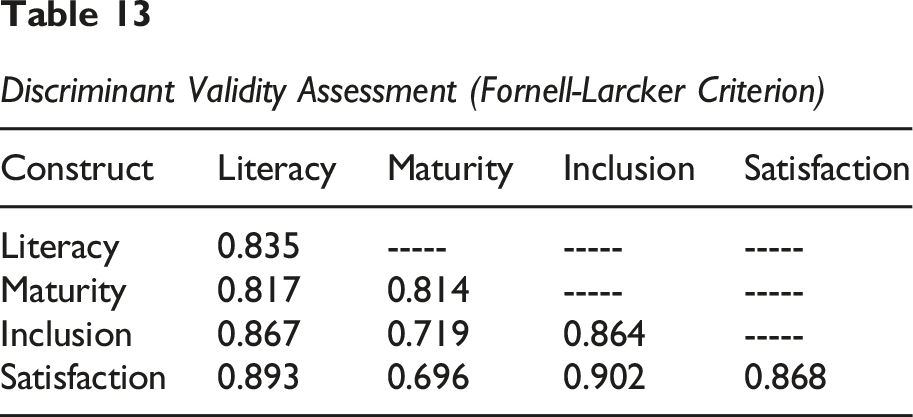
As shown in Table Y, the Fornell-Larcker criterion was not fully met for all constructs, indicating significant issues with discriminant validity in this model: The square root of AVE for Literacy (0.835) was lower than its correlations with Inclusion (0.867) and Satisfaction (0.893). The square root of AVE for Digital Maturity (0.814) was lower than its correlation with Literacy (0.817). The square root of AVE for Digital Inclusion (0.864) was lower than its correlations with Literacy (0.867) and Satisfaction (0.902). The square root of AVE for Satisfaction (0.868) was lower than its correlations with Literacy (0.893) and Inclusion (0.902).
Construct Reliability and Convergent Validity
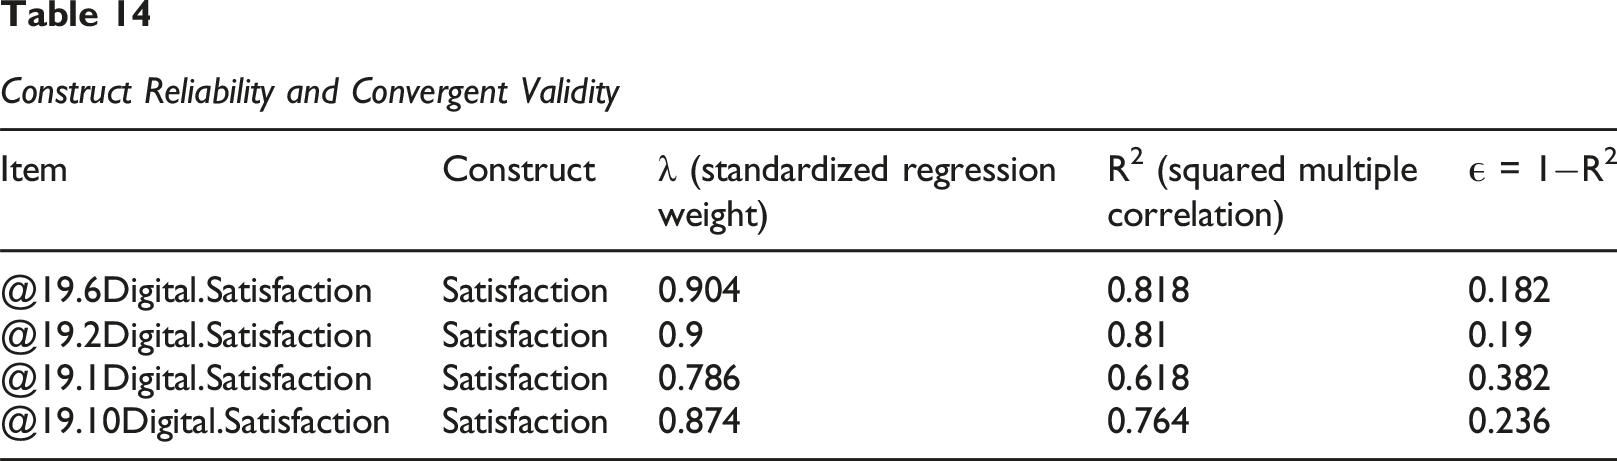
The composite reliability (CR) for all constructs ranged from 0.914 (Digital Maturity) to 0.972 (Satisfaction). All CR values were well above the recommended threshold of 0.70 (Fornell & Larcker, 1981), indicating excellent internal consistency and reliability of the scales. Furthermore, the average variance extracted (AVE) for each construct ranged from 0.574 (Digital Maturity) to 0.898 (Satisfaction). All AVE values surpassed the critical threshold of 0.50 (Fornell & Larcker, 1981), providing strong evidence of convergent validity, as more than 50% of the variance in the items was explained by their respective constructs.
The overall fit of the measurement model was evaluated using several goodness-of-fit indices (see Table Z for a summary). The results indicate a good fit to the data: χ2 = 330.269, df = 74, χ2/df = 4.463 (acceptable if < 5, ideally <3); CFI = 0.901; TLI = 0.859; and RMSEA = 0.046, with a 90% confidence interval of 0.041 to 0.051 (values from model.fit.23.pdf). These fit indices collectively suggest that the measurement model provides an acceptable to good representation of the relationships between the observed items and their underlying latent constructs.
Reliability Testing
To assess the internal consistency of the measurement model, Cronbach’s Alpha (α) and Composite Reliability (CR) were calculated for each construct and its respective dimensions. All constructs exceeded the recommended threshold of 0.70 for both α, indicating satisfactory reliability (Figure 3). Internal Consistency Reliability Statistics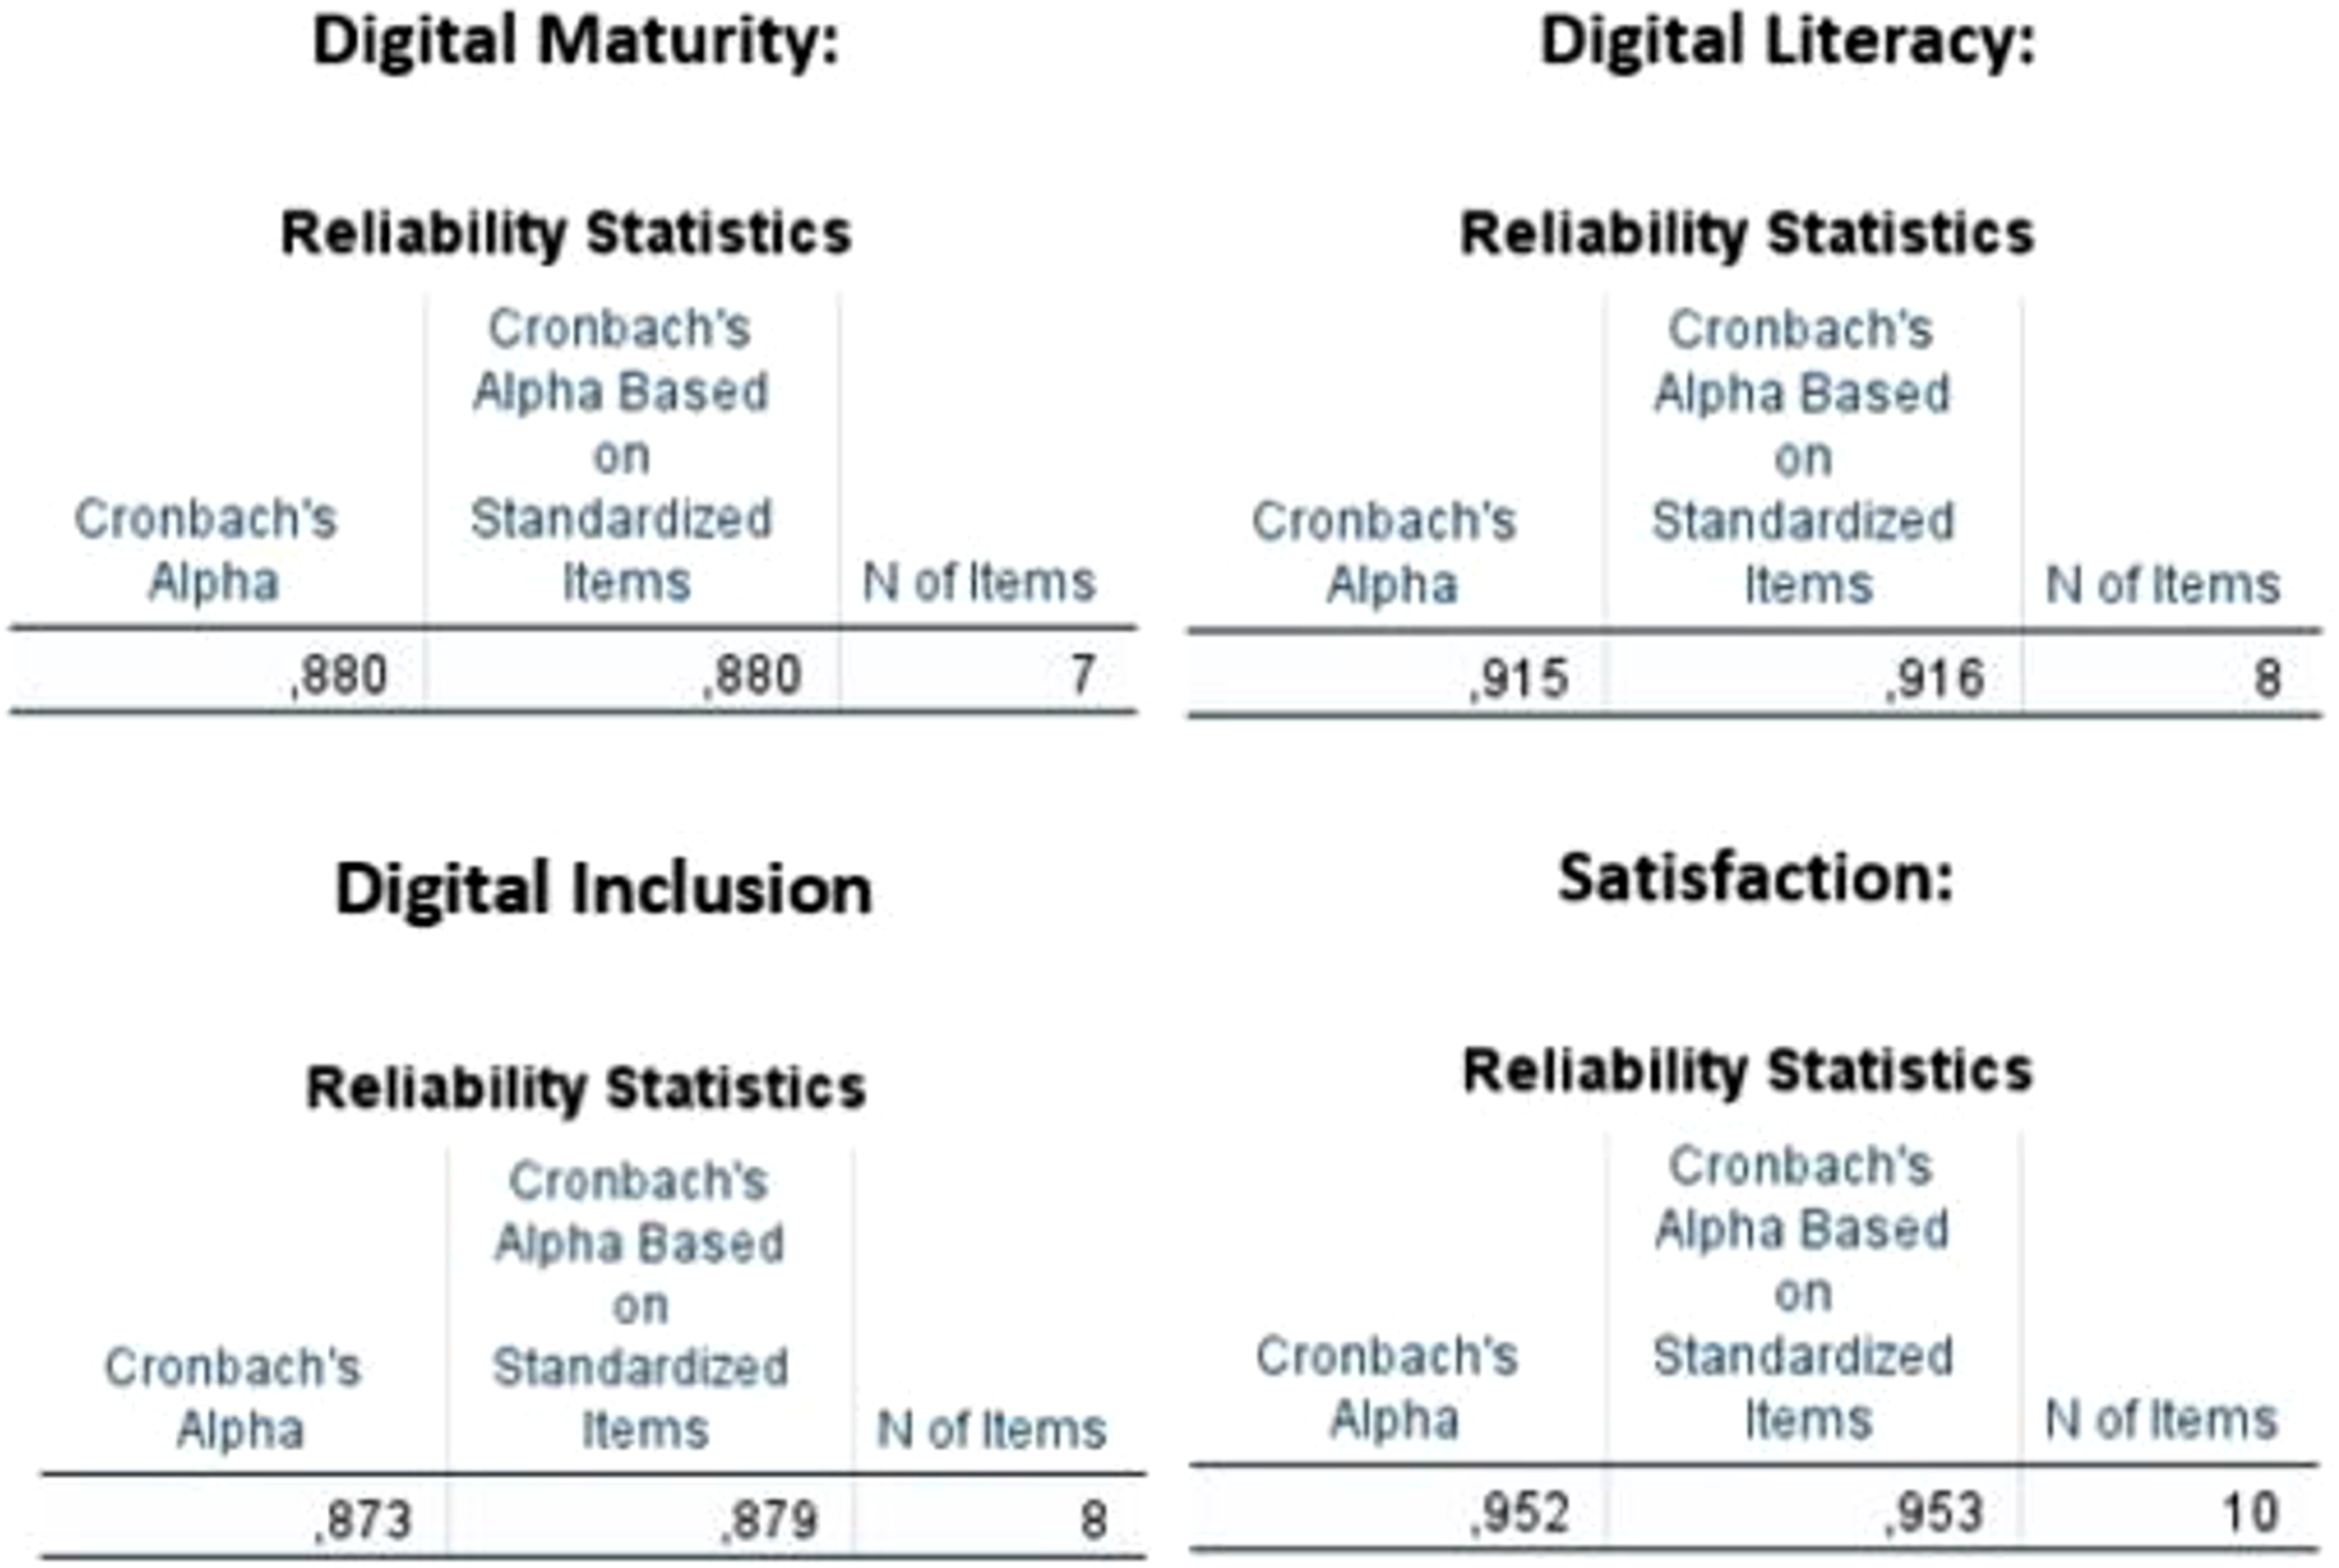
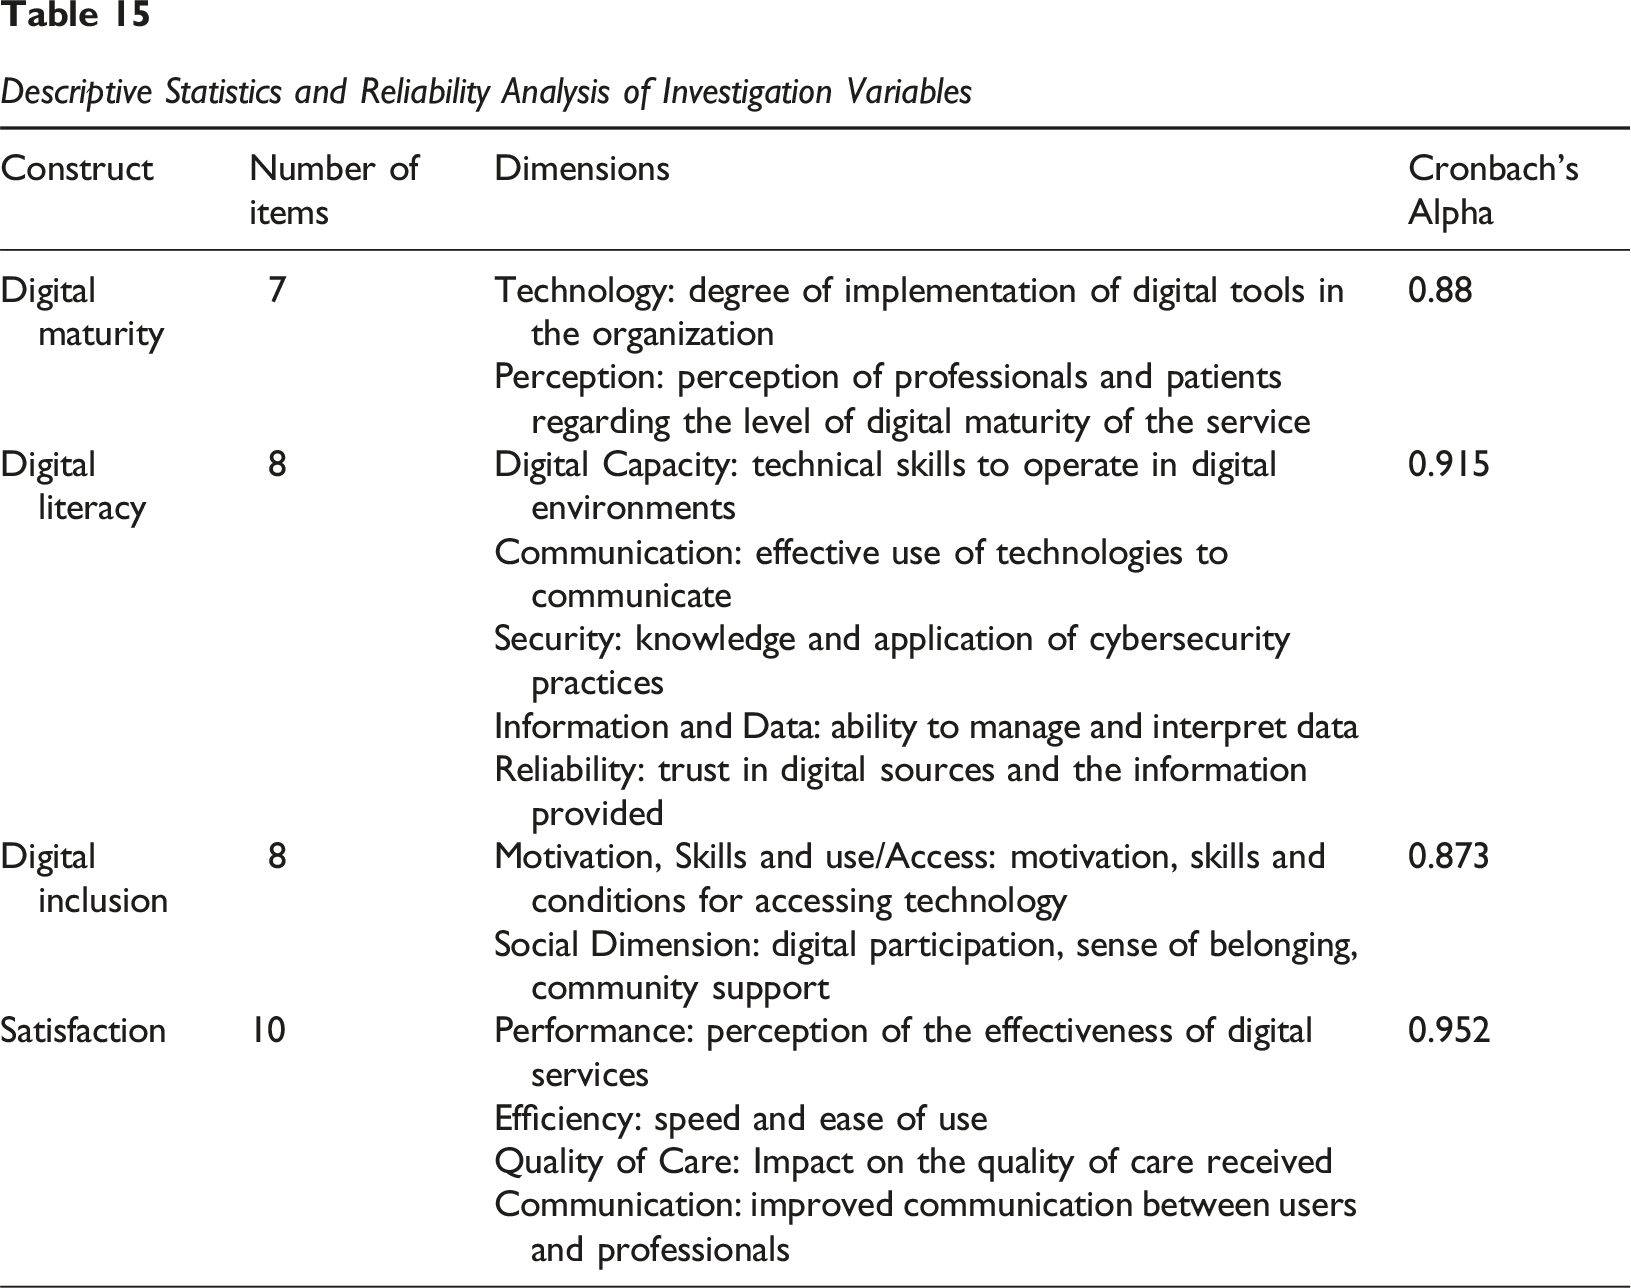
Table 15 shows the Cronbach’s Alpha and Composite Reliability values for Digital Literacy, Digital Maturity, Satisfaction, and Digital Inclusion. Digital Literacy: With a Cronbach’s Alpha of 0.880, the Digital Literacy construct demonstrates excellent internal consistency reliability. This indicates that the 5 items used to measure digital literacy are highly consistent and effectively measure the same underlying concept. Digital Maturity: Showing a Cronbach’s Alpha of 0.941, the Digital Maturity construct exhibits exceptional internal consistency reliability. The 7 items within this construct are very well correlated with each other, suggesting a highly cohesive measurement of digital maturity. Digital Inclusion: With a value of 0.900, the Digital Inclusion construct also shows excellent internal consistency reliability. The 5 items consistently contribute to the measurement of digital inclusion. Satisfaction: The Satisfaction construct obtained a Cronbach’s Alpha of 0.893, indicating excellent internal consistency reliability. The 5 items comprising this construct are highly consistent in evaluating stakeholder satisfaction. Descriptive Statistics and Reliability Analysis of Investigation Variables
All constructs in the model demonstrate excellent levels of internal consistency reliability, with all Cronbach’s Alpha values significantly above the 0.70 threshold, and mostly above 0.80. This provides a robust foundation for the validity of the measurements used in this investigation, indicating that the scales are consistent and reliable in measuring their theoretical concepts.
Structural Model Evaluation (AMOS)
This table summarizes the global fit indices for successive refinements of the structural model tested in AMOS. Each version reflects an iteration aimed at improving model fit through modifications such as removing low-loading indicators or adjusting error covariances. The indices reported include Chi-square (CMIN), Degrees of Freedom (DF), Chi-square/DF ratio (CMIN/DF), Root Mean Square Error of Approximation (RMSEA), Comparative Fit Index (CFI), Tucker-Lewis Index (TLI), and Normed Fit Index (NFI). The best fitting model is highlighted in model.fit.23.pdf, which meets or approaches standard thresholds for acceptable model fit.
Following the assessment of the measurement model, Structural Equation Modelling (SEM) was employed using AMOS to test the proposed hypotheses and evaluate the model’s overall fit to the observed data. A total of 20 versions of the model were iteratively tested and refined, as shown in Table 16. Early model versions (e.g. model.fit.FV1 to FV6) demonstrated extremely poor fit, with χ2/df ratios exceeding 300 billion and uniformly low fit indices (CFI = 0.764) Through systematic refinement including the removal of poorly performing items and modification of covariance paths substantial improvements were achieved. Fit indices gradually improved across versions, with model representing the optimal solution: CMIN/DF = 4.463 (acceptable; under 5) RMSEA = 0.057 (good fit) CFI = 0.901 (acceptable) TLI = 0.859 and NFI = 0.877 (close to threshold) Comparison of Global Fit Indices Across Successive Structural Model Iterations
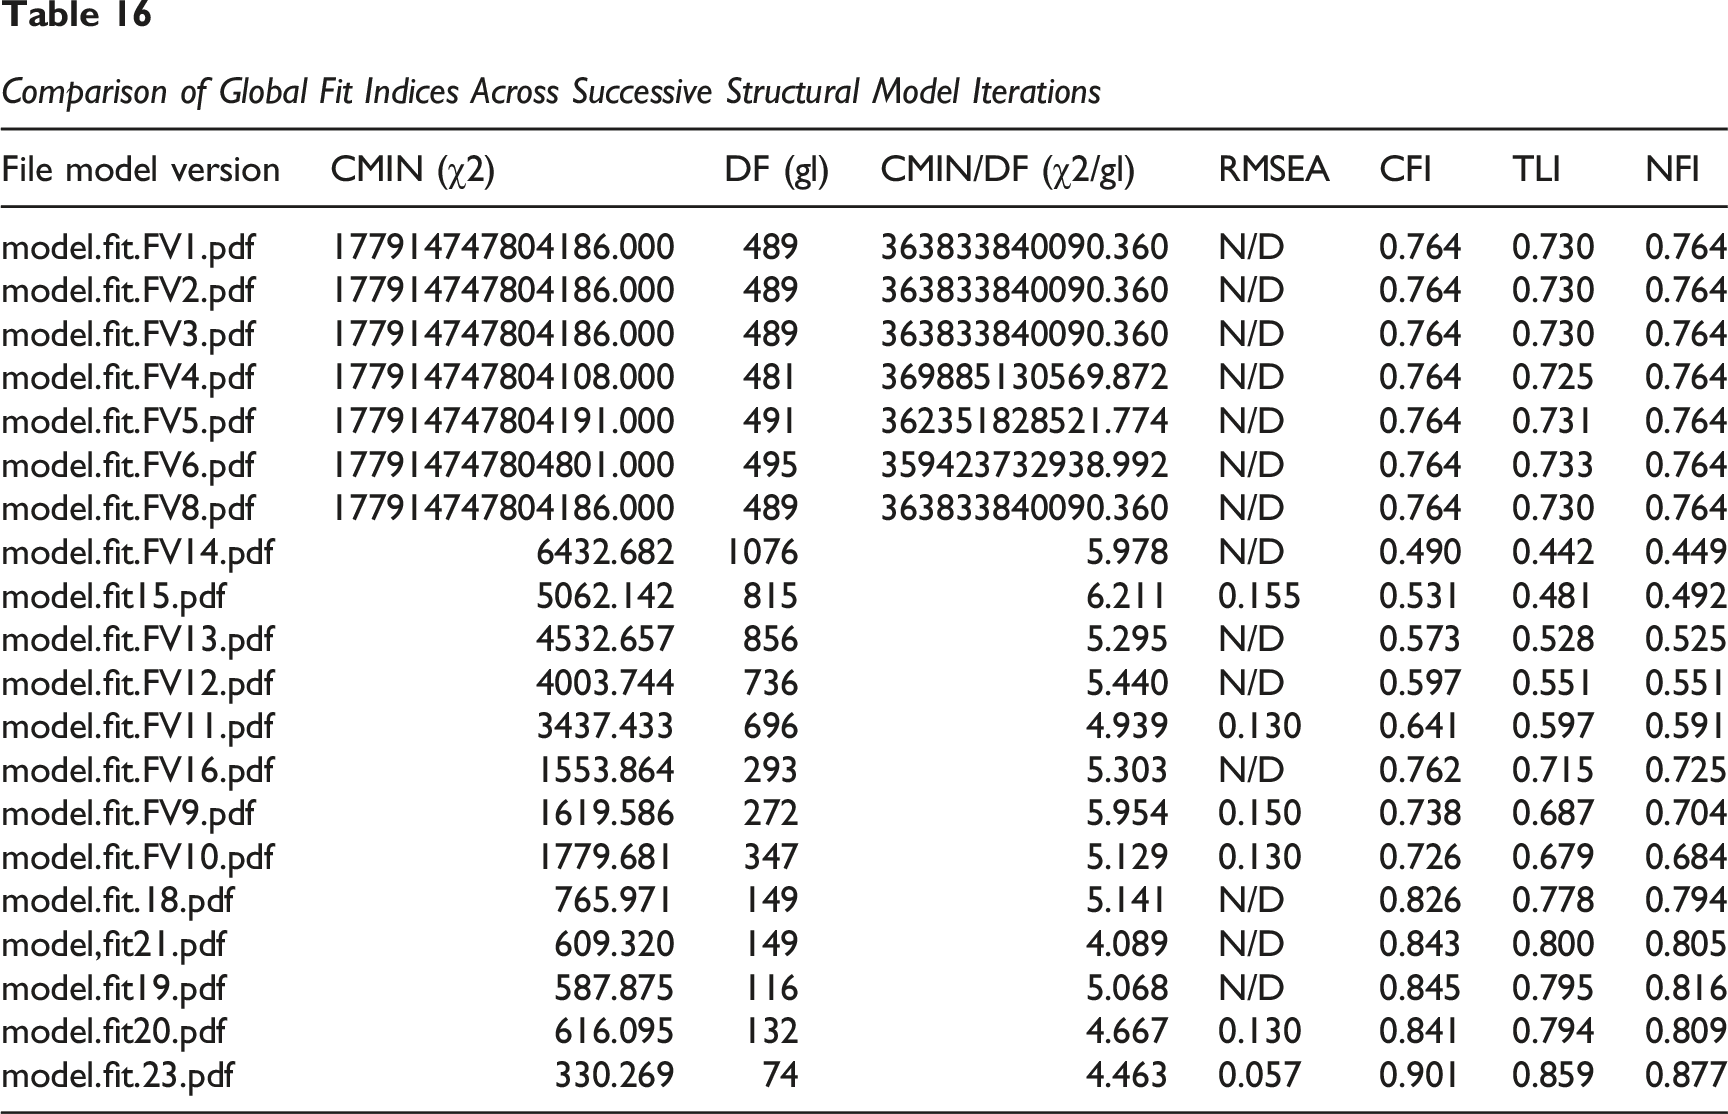
These results indicate that the model achieves an acceptable level of global model fit and was retained for final hypothesis testing. The progressive improvements across model versions highlight the importance of careful model re-specification in SEM. While the final model does not achieve needed fit on all indices (e.g. TLI slightly below 0.90), it meets key thresholds for RMSEA and CFI and offers a theoretically coherent and statistically acceptable representation of the conceptual framework. This outcome supports the reliability of subsequent path analysis and hypothesis testing based on the model.
Figure 4 presents the final structural model, illustrating the estimated paths between constructs (Digital Literacy, Digital Maturity, Digital Inclusion, and Satisfaction), as computed in AMOS. So, it presents the final structural model obtained through SEM using AMOS (model.fit.23.pdf), incorporating the best model fit across all iterations (CMIN/DF = 4.463, RMSEA = 0.057, CFI = 0.901, TLI = 0.859, NFI = 0.877). The standardized path coefficients between constructs are displayed on the arrows, representing the strength and direction of the relationships hypothesized in the conceptual model. Final structural model (AMOS output)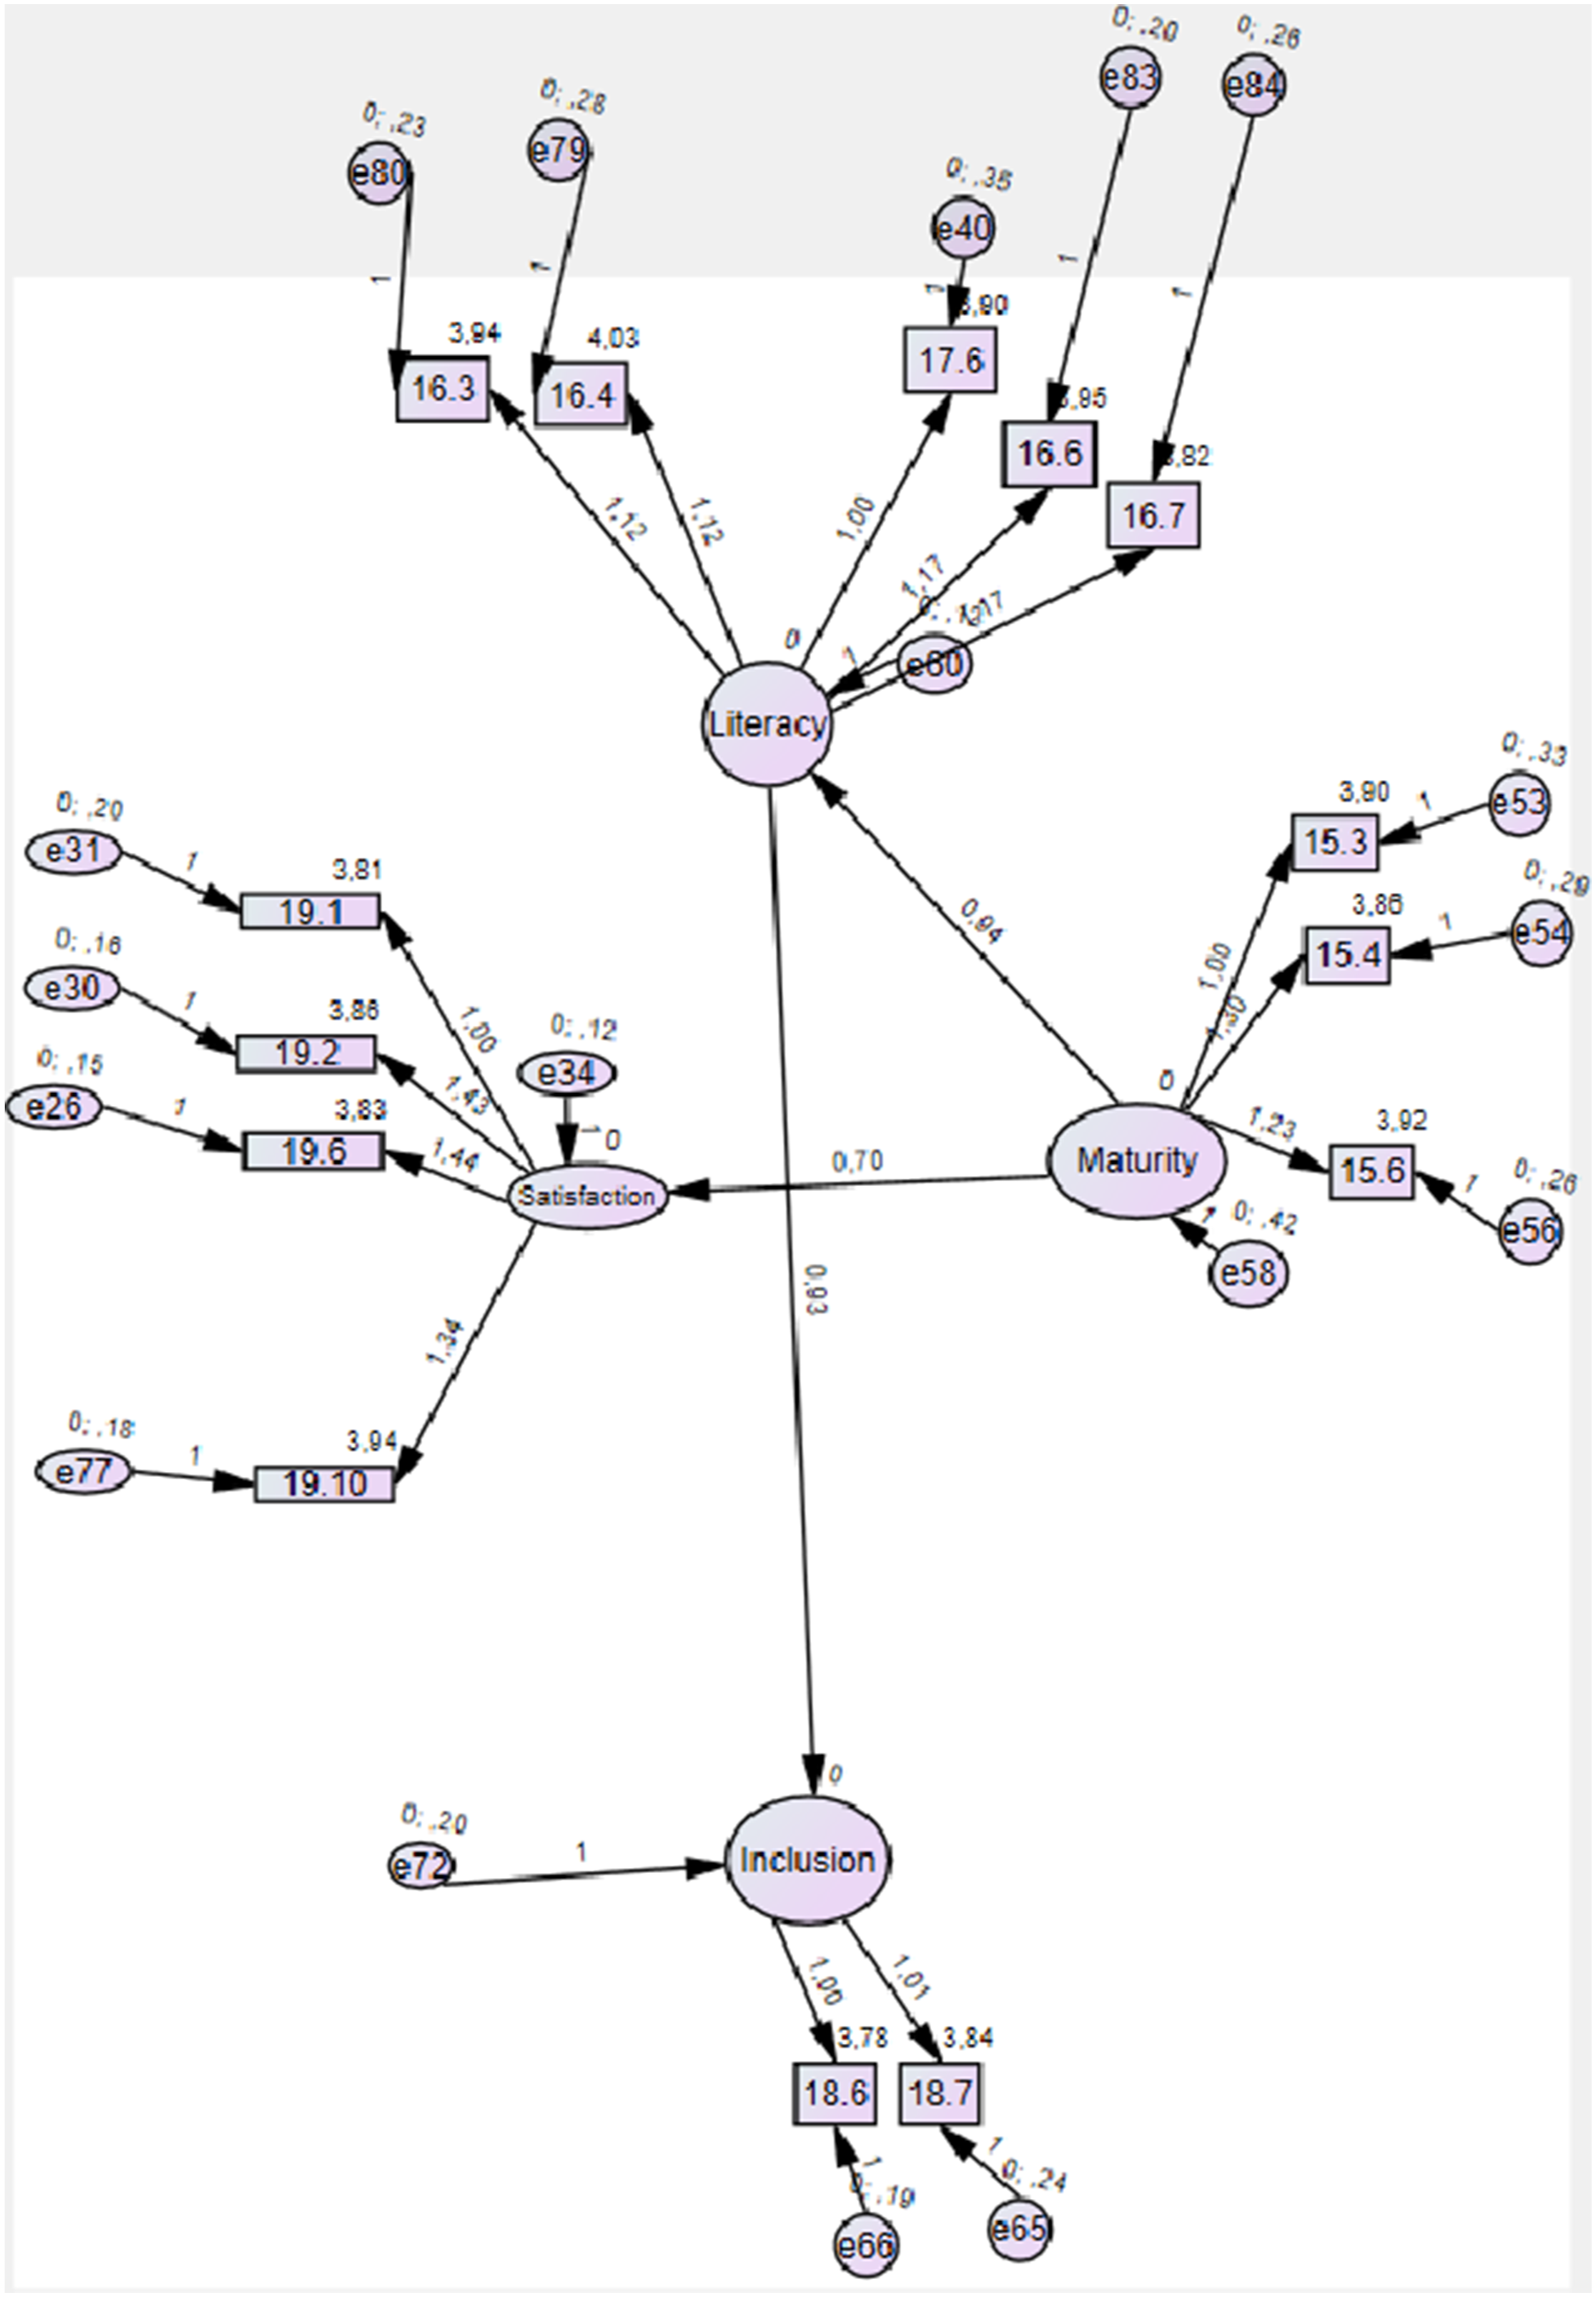
Hypothesis Testing
Comparison of Global Fit Indices Across Successive Structural Model Iterations
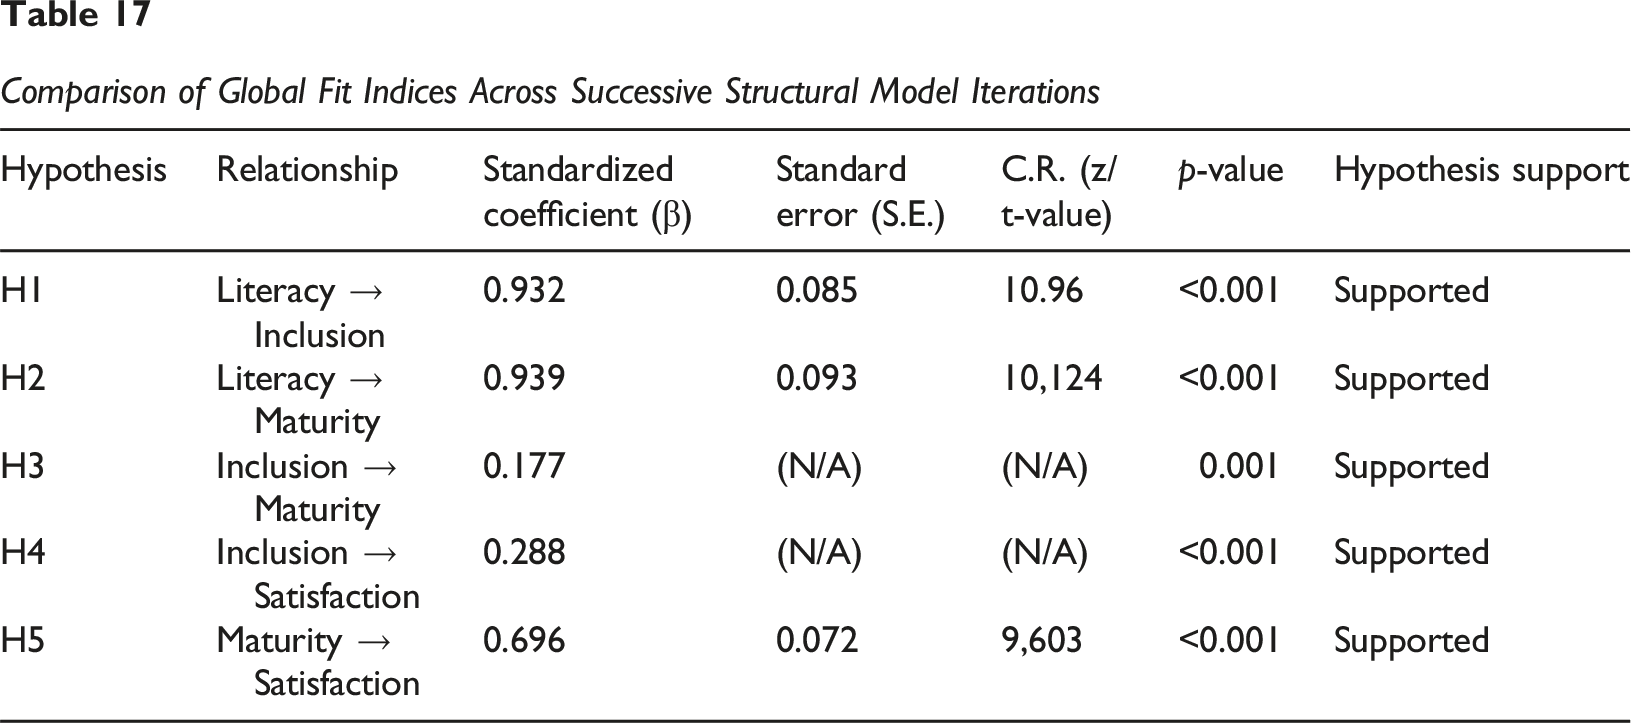
Detailed Discussion of Each Hypothesis: H1: Digital literacy positively influences digital inclusion. The results revealed that Digital Literacy has a positive and highly significant influence on Digital Inclusion (β = 0.932, p < 0.001). This indicates that a higher level of digital literacy is associated with greater digital inclusion of individuals in healthcare organizations. Hypothesis 1 is supported. H2: Digital literacy positively influences digital maturity. As hypothesized, Digital Literacy exerts a positive and highly significant influence on Digital Maturity (β = 0.939, p < 0.001). This finding suggests that the higher the digital literacy, the greater the digital maturity of the organizations. Hypothesis 2 is supported. H3: Digital inclusion positively influences digital maturity. The data indicate that Digital Inclusion positively and significantly influences Digital Maturity (β = 0.177, p = 0.001). Although the effect is less pronounced than that of Digital Literacy, the contribution of digital inclusion to maturity is statistically confirmed. Hypothesis 3 is supported. H4: Digital inclusion positively influences satisfaction. It was observed that Digital Inclusion exerts a positive and highly significant influence on Satisfaction (β = 0.288, p < 0.001). This result suggests that feeling digitally included contributes to greater overall satisfaction. Hypothesis 4 is supported. H5: Digital maturity positively influences satisfaction. According to the hypothesis, Digital Maturity has a positive and highly significant influence on Satisfaction (β = 0.696, p < 0.001). This is a substantial effect, indicating that the digital evolution of organizations directly impacts satisfaction. Hypothesis 5 is supported.
Regarding the
The mediating role of inclusion beyond technical access the results strongly support that Digital Inclusion is the ‘missing link’ in the satisfaction equation. It is not enough to provide access to technology; the user must feel competent within that digital environment. This aligns with the ‘Healthcare for Information’ philosophy, where information is only power if the user knows how to navigate it. Our model shows that Literacy predicts Inclusion, and only then does Inclusion predict Satisfaction. Therefore, satisfaction in digital health is a psychological and healthcare outcome, not a technical one.
About the practical implications for information professionals and Policy Makers For information managers and healthcare leaders, these results provide a clear mandate: Infrastructure investment must be matched by ‘Information Healthcare’ budgets: User-Centric Design: Systems must be designed not for ‘technical maturity’ but for ‘literacy accessibility’. Support Structures: Healthcare providers should implement ‘digital navigators’ or Digital literacy workshops for patients, ensuring that the Process pillar of Donabedian’s framework is robust. The Satisfaction Metric: Satisfaction should be monitored as a key performance indicator (KPI) of digital transformation success, shifting the focus from ‘how many systems we implemented’ to ‘how many patients can effectively use them’.
Conclusion
This investigation aimed to explore the interrelations among Digital Literacy, Digital Maturity, Digital Inclusion, and Satisfaction within the context of healthcare services, utilizing a conceptual model rooted in the Donabedian framework and validated through empirical evidence. Through a survey of 212 participants and the application of Structural Equation Modelling (SEM), we sought to understand how patients’ digital capabilities influence organizational readiness and perceived satisfaction.
The results from the measurement model assessment revealed robust psychometric properties, with Composite Reliability (CR) exceeding 0.70 (0.854–0.924) and Average Variance Extracted (AVE) surpassing 0.50 (0.663–0.753), confirming excellent internal consistency and convergent validity. While the model fit indices were generally acceptable (χ2/df = 4.463, CFI = 0.901, TLI = 0.859, RMSEA = 0.046), the discriminant validity analysis highlighted significant empirical overlap between constructs, particularly between Digital Literacy, Inclusion, and Satisfaction. This suggests that, in the studied population, these dimensions are perceived as deeply interconnected facets of the same digital experience.
Regarding structural relationships, the findings suggest that the Digital Maturity of an institution acts as a vital catalyst for individual Digital Literacy. However, it is Digital Inclusion that ultimately dictates the levels of Satisfaction. This indicates that possessing advanced systems does not guarantee success if there are no support mechanisms to ensure that no patient is left behind. From an Information Science perspective, user satisfaction is intrinsically linked to the ease of access and the perceived utility of digital health information.
These results carry profound ethical and social implications. In an era of rapid digital transformation, there is a moral imperative to move beyond purely technical metrics. If satisfaction depends on a patient’s ability to navigate complex ecosystems, then a lack of inclusion creates a ‘digital fracture’ that exacerbates existing health inequalities. True progress in healthcare must be measured not by the sophistication of internal systems, but by their capacity to include every citizen. Ultimately, this study underscores that digital tools must be designed and implemented as inclusive public goods, ensuring that organizational readiness translates into a meaningful, equitable, and positive experience for the end user.
Theoretical and Practical Implications
Theoretically, this investigation contributes to the literature by testing a comprehensive model that integrates literacy, maturity, inclusion, and satisfaction in the digital health context, expanding the application of the Donabedian framework beyond its original service quality conception. The results highlight the critical importance of Digital Literacy and Inclusion as fundamental links to patient satisfaction but also reveal the need for a more nuanced understanding of the interplay between organizational maturity and individual digital capabilities. From a practical standpoint, the findings offer valuable insights for policymakers and healthcare practitioners. The emphasis on Digital Literacy and Inclusion as direct predictors of satisfaction reinforces the need to invest in digital upskilling programs and accessible infrastructures that ensure all individuals can fully benefit from digital health services. The finding that Digital Maturity impacts Literacy and Inclusion suggests that healthcare organizations should prioritize developing their own digital capabilities and infrastructures as a prerequisite for fostering literacy and inclusion among patients.
Limitations and Future Research
Whilst the study employs a convenience sample, the robustness of the validated instruments such as the DHLI and SERVQUAL and the application of Structural Equation Modelling (SEM) provide significant statistical validity to the findings. These elements establish a firm foundation for future longitudinal studies within specific institutions. However, a notable limitation of this investigation lies in the observed discriminant validity issues, which may indicate a conceptual or empirical overlap between certain constructs, particularly Digital Literacy. While reliability and convergent validity remain satisfactory, this overlap suggests that the theoretical distinction between these constructs requires further examination. Furthermore, the cross-sectional nature of the study precludes definitive causal inferences. In summary, this investigation provides a valuable empirical framework for digital transformation in healthcare services. While it underscores the vital role of digital literacy and inclusion in patient satisfaction, it also highlights the necessity of refining the measurement and conceptualization of specific constructs.
To build upon these findings with greater precision, future research should: Refine Construct Definitions: Re-examine the conceptual and operational definitions where discriminant validity was questionable, perhaps by refining measurement items or exploring alternative models, such as higher-order constructs. Implement Longitudinal Designs: Conduct studies over extended periods to investigate the dynamic and causal nature of the relationships between these variables. Broaden Generalizability: Expand the sample to diverse geographical or demographic contexts to enhance the broader applicability of the results.
Footnotes
Funding
The authors received no financial support for the research, authorship, and/or publication of this article.
Declaration of Conflicting Interests
The authors declared no potential conflicts of interest with respect to the research, authorship, and/or publication of this article.