
Abstract
Reference Publication Year Spectroscopy (RPYS) is a bibliometric method originally introduced to reveal the historical roots of research topics or fields. RPYS does not identify the most highly cited papers of the publication set being studied (as is usually done by bibliometric analyses in research evaluation), but instead it indicates most frequently referenced publications – each within a specific reference publication year. In this study, we propose to use the method to identify important researchers, institutions, and countries in the context of breakthrough research. To do so, we focus on research on physical modeling of Earth’s climate and the prediction of global warming as an example. Klaus Hasselmann (KH) and Syukuro Manabe (SM) were both honoured with the Nobel Prize in 2021 for their fundamental contributions to research on physical modeling of Earth’s climate and the prediction of global warming. Our results reveal that RPYS is able to identify most important researchers, institutions, and countries. In our example, all the relevant authors’ institutions are located in the United States. These institutions are either research centers of two US National Research Administrations (NASA and NOAA) or universities: the University of Arizona, Princeton University, the Massachusetts Institute of Technology (MIT), and the University of Stony Brook. The limitations of our approach to identify important researchers, institutions, and countries in the context of breakthrough research are discussed.
Keywords
1. Introduction
Research is denoted as being breakthrough if it leads to discoveries with an enormous impact on future science [1]. Such discoveries are frequently connected to revolutionary changes of theory [2]. Starting initially as claims of truth within frontier knowledge, discoveries usually become core knowledge later on that are characterized by universal consensus in a field [3,4]. Research leading to breakthroughs is as a rule the result of creative solutions by researchers to complex problems [5]. The identification of research that can be called breakthrough using bibliometric methods has been undertaken by various researchers [6–8].
Although bibliometric methods have hitherto been used in some studies to analyse breakthrough research [1,9,10], the standard approach to identification is qualitative: the reading of papers by peers in a certain field [11–13]. The awarding of the Nobel Prize is a good example of using peers (in a peer review process) to identify groundbreaking research: Members of institutions awarding the prize meet to vote on potential nominees for the Nobel Prize fields. Only researchers with the most significant benefits to humankind in the fields relevant to the prize are in the position to receive the prize. Since some time is usually necessary to assess the benefits for humankind, the Nobel Prize is, in most cases, awarded many years after research has been done [14].
Although scientific breakthroughs are usually well known to researchers in a field, it is frequently unclear which researchers, institutions, and countries have actively participated in research that leads to breakthroughs. In this study, therefore, we propose a bibliometric approach that can be applied for identifying these researchers, institutions, and countries. The approach is based on a bibliometric method that has been developed by Marx et al. [15] to identify the historical roots of topics or fields: Reference Publication Year Spectroscopy (RPYS) [16,17]. In this article, we used RPYS-CO (RPYS based on co-citations) which is a derivative of RPYS. RPYS-CO was first introduced in connection with the history of the greenhouse effect [18] and was later successfully tested in theoretical chemistry [19] and climate change and tea production [20].
In this study, we developed an approach for identifying researchers, institutions, and countries involved in revolutionary science. We tested the methods using research on the physical modeling of Earth’s climate and the prediction of global warming as an example to do so. Klaus Hasselmann (KH) and Syukuro Manabe (SM) were both honoured with the Nobel Prize in 2021 for their fundamental contributions to the physical modeling of Earth’s climate and the prediction of global warming. We show how our approach enables a broader contextualisation of the field KH and SM contributed to.
2. RPYS
Citation analysis is usually based on counting the number of citations a focal paper has received. RPYS instead focuses on cited references, that is, publications that have been cited by a set of selected publications. Since it is the objective of RPYS to explore the historical roots of research topics or fields, the compilation of the publication set representing certain topics or fields is the first step in RPYS. This is the most important step in RPYS: Historical roots can only be determined if papers explicitly dealing with a topic or field are considered. The consideration of too many peripheral publications in the publication set would lead to mistakes and a lack of clarity when identifying historical roots. However, RPYS is rather robust with regard to missing publications In the second step of RPYS, the cited references of the publications in the set are analyzed. Cited references which have been cited many times from the publications in the field- or topic-specific set of publications can be denoted as historical roots of the field or topic.
RPYS can be undertaken using the Cited References Explorer programme (CRExplorer, www.crexplorer.net) [21,22]. Since the introduction of RPYS by Marx et al. [15,16], the method has been frequently applied in different contexts: Historical roots have been identified, for example, in women’s studies [23], innovation in creative industries [24], iMetrics (bibliometrics) in China [25], the concept of health equity [26], critical social psychology in Brazil [27], social network analysis [28], and modern plastic surgery [29]. Historical roots of a journal have been investigated, for example, by Haunschild [30], and the roots of an eminent single researcher by Leydesdorff et al. [31].
Some studies have investigated whether the results of RPYS correspond to assessments by peers: Do peers identify the same publications as RPYS? Congruent results have been reported by Vosner et al. [32] for the field of nursing informatics, by Yeung [33] for carotid artery stenting which is a treatment option for carotid artery stenosis, and by Kokol et al. [34] for the application of bibliometrics in medicine. The latter authors concluded, for example, that ‘RPYS proved to be an accurate method, which was able to identify most of the recognised historical roots of the application of bibliometrics in medicine’ (p. 10). The results of these studies are especially important for the application of RPYS since they demonstrate that RPYS leads to valid results. Thus, the results indicate that the method can be used to identify historical roots in research fields and topics.
RPYS-CO is based on a set of cited references which are co-cited with one or more selected papers. Using co-cited papers is an advantage because they are related to each other (more or less). We focused in this study on the citation environment of specific papers by selecting all co-cited papers and investigated these papers as cited references using RPYS-CO. Since the specific papers should be prominent seminal works, we used corresponding marker or tracer papers for research on physical modeling of Earth’s climate and the prediction of global warming. We assumed that papers co-cited with the selected papers are potential candidates for being relevant in the historical context of this topic.
As a first step of RPYS-CO, the citing papers of a specific paper (a ‘marker paper’) are downloaded from an appropriate literature database (e.g., Clarivate’s Web of Science, WoS). The focus of interest in applying the RPYS-CO is the references cited by the citing papers. These references are papers, which have been co-cited with the marker paper. In cases where there is more than one marker paper, the cited references of the publication set are co-cited with at least one of the marker papers.
RPYS and RPYS-CO usually focus on single publications that have been frequently cited in a field- or topic-specific publication set: One is interested in the identification of core publications or historical roots. In this study, the use of the RPYS-CO approach has another focus: It is not single publications but the complete ensemble of publications cited. We interpret the complete ensemble as the contributing publications to a certain breakthrough in a field: Without the various research from the contributing publications, the breakthrough would not have been possible. Since contributing publications are assigned to affiliations, affiliations can be analyzed with respect to researchers, institutions, and countries. Frequently emerging researchers, institutions, and countries can then be interpreted as the most active and contributing units to a certain breakthrough.
3. Methods
3.1. Research on the physical modeling of Earth’s climate and the prediction of global warming
Since the availability of powerful computers from around 1970, climate modeling has become a rapidly increasing branch of climate change research. Quantitative climate models simulate the interactions of major climate system components (i.e., atmosphere, land surface, ocean, and sea ice) taking account of the incoming energy from the sun. Scientists use climate models to understand the complex climate system of the Earth, to test their hypotheses and to draw conclusions on past and future climate. Climate models vary in complexity, ranging from simple radiant heat transfer models to coupled atmosphere–ocean–sea ice global climate models (GCMs). Predictions of climate models have become most important for strategies regarding adaption and mitigation of global warming.
KH and SM were awarded jointly the Nobel Prize in Physics in 2021: The prize was awarded ‘for groundbreaking contributions to our understanding of complex systems’ [35] with one half jointly to SM and KH ‘for the physical modeling of Earth’s climate, quantifying variability and reliably predicting global warming’ [35] and the other half to Giorgio Parisi ‘for the discovery of the interplay of disorder and fluctuations in physical systems from atomic to planetary scales’ [35] (not considered in the analyses of this study).
3.2. Dataset used
For the RPYS-CO analysis in this study, we used seven seminal papers with the Web of Science (WoS) document type ‘article’ as marker papers, which were published by KH and SM as marker papers. We selected these papers as follows: We retrieved papers by KH and SM published between 1960 and 1980 by author searching in the WoS and ranked them by citation counts. To focus on the most relevant papers from the authors, we checked the papers with high citation counts for their relevance to climate modeling in connection with global warming. From these papers, we selected six relevant papers for this study. Because of its great relevance, we additionally selected the more recent paper by Cubasch et al. [36] that deals with greenhouse warming computations in our set of marker papers (see Table 1). The paper (1) deals with climate modeling and (2) has gained a comparatively high citation impact (360 citations until recently).
Seven marker papers for the RPYS-CO analysis.
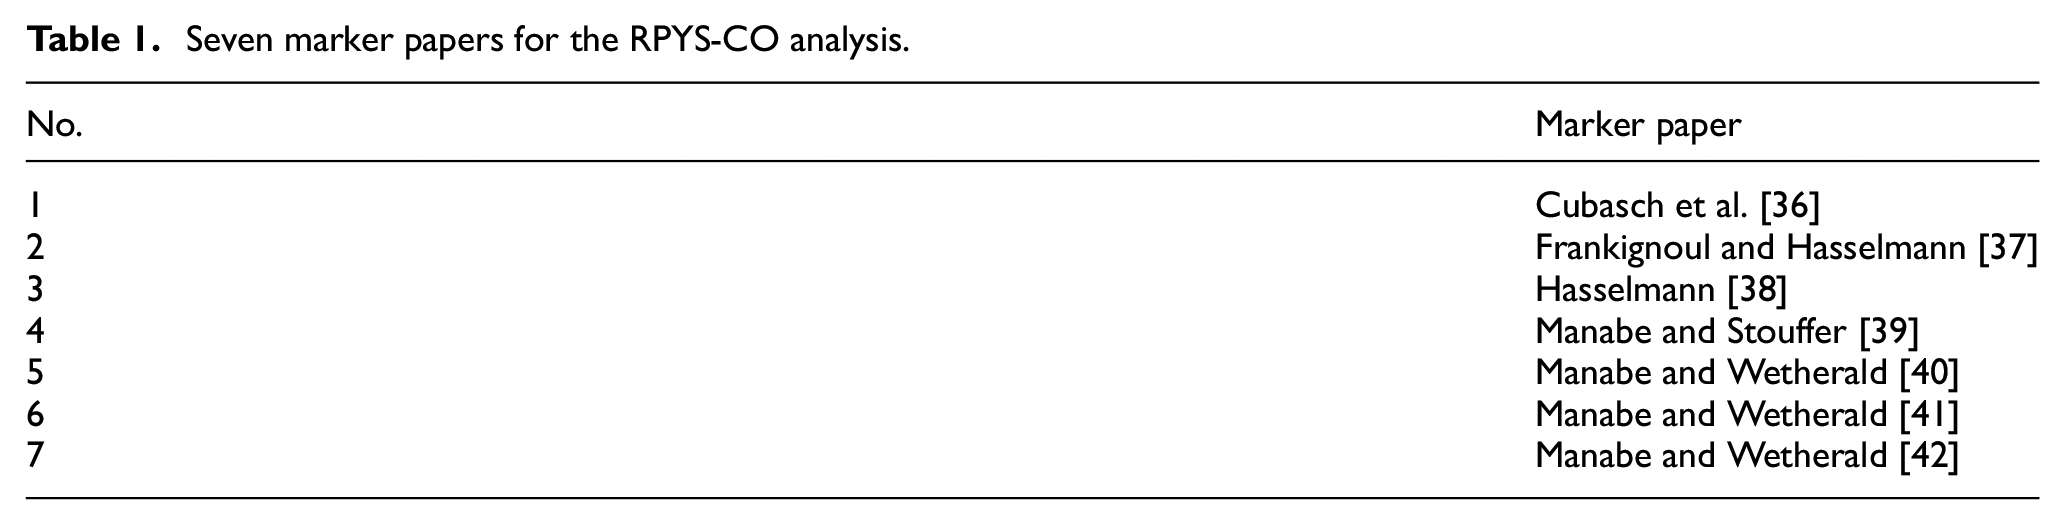
As the selection of the marker papers for our case study reveals, the identification of the marker papers requires combining bibliometric experience with expert knowledge in the research field analyzed. It does not exist a standard procedure which can be simply followed.
The seven marker papers in Table 1 have been cited by 4,340 publications that are indexed in the WoS (date of search: 2 November 2021). We downloaded these citing publications from the WoS and imported them into CRExplorer. We extracted 233,586 non-distinct cited references from the 4,340 publications. The number of distinct cited references is 115,377. We removed all cited references (n = 88,714) that were published after 1980 to focus on the time of the invention under study and earlier time periods. We used the automatic clustering and merging using CRExplorer with a Levenshtein threshold of 0.75. The CRExplorer computes the Levenshtein similarity between variants of cited references. For any two cited references, the Levenshtein similarity is between values of 0 and 1. The value 0 corresponds to ‘totally different’ and 1 to ‘identical’ [22].
We used volume and (starting) page number in the clustering and merging process to have an exact match between potential variants of the same cited reference. Only 195 cited references were merged. To reduce noise in the spectrogram, we removed all cited references (n = 25,038) that were cited less than five times. Our experiences with many other datasets of similar size in RPYS studies have shown that a threshold of five yields a clearer peak structure [43]. We additionally removed the marker papers (six of them were published until 1980), so that they could not distort the results. We finally retained a set of 1,424 cited references that we used for the analyses in this study.
We extracted the digital object identifiers (DOIs) from the cited references and searched the DOIs in the WoS. We used the built-in analyse function of the WoS for obtaining the statistics. Although the DOIs were assigned in retrospect, many cited references have DOIs. Out of all 1,424 cited references published between 1686 and 1980, 72.1% (n = 1,026) of the cited references had a DOI. However, not all DOIs could be found in the WoS. More importantly, not all retrieved cited references in the WoS had affiliation information attached to them. For our dataset including all 1,424 cited references, where 1,026 have a DOI, 922 of those DOIs could be found in the WoS, but 29.4% (n = 271) of them do not have affiliation information in the WoS. This affected the country and institutional analyses since information on affiliations was available for only around 70% of the cited references that could be found in the WoS.
However, the analyses on the author-level were not affected. In the case of the top-10 cited references from each reference publication year, 200 DOIs from 357 cited references were found in the WoS but 63.5% (n = 127) of them did not have affiliation information attached to them. In the case of the top-5 cited references from each reference publication year, out of 229 cited references, 151 had a DOI. We found 117 of them in WoS. The proportion of cited references without affiliation information in the WoS is slightly higher with 64.1% (75 out of 117 cited references did not contain affiliation information).
Our workflow is summarised in Figure 1.
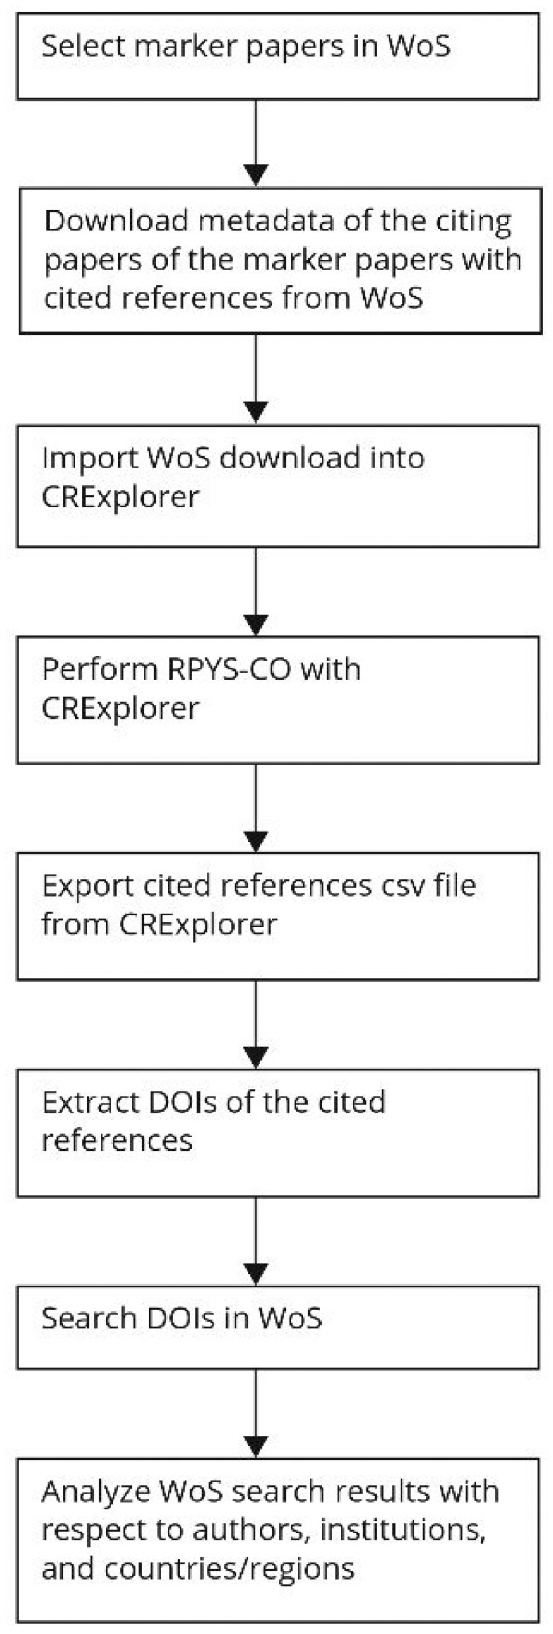
Flowchart that summarises our workflow.
3.3. Software
We plotted the RPYS spectrogram that is presented in this study using R [44] with the R package ‘BibPlots’ [45]. In addition to the static plot in this article, we produced an interactive RPYS graph [43] using the R package ‘dygraphs’ [46].
4. Results
In the next two subsections, we present two different views of the RPYS-CO results: Subsection 4.1 presents a quantitative and subsection 4.2 a qualitative view on important researchers, institutions and countries in the context of research on physical modeling of Earth’s climate and the prediction of global warming.
4.1. Important researchers, institutions, and countries from our RPYS results
We present the results of three quantitative analyses in this subsection. First, we analyzed important researchers, institutions, and countries using our full RPYS-CO dataset (i.e., all cited references that were referenced at least five times). Second, we restricted the analysis of these entities to the top-10 cited references of each reference publication year. Third, we restricted the analysis to the top-5 cited references of each reference publication year. In the following, we show only the top entities from the analyses. The full lists are available as Supplemental Information (see https://s.gwdg.de/q7jUGm).
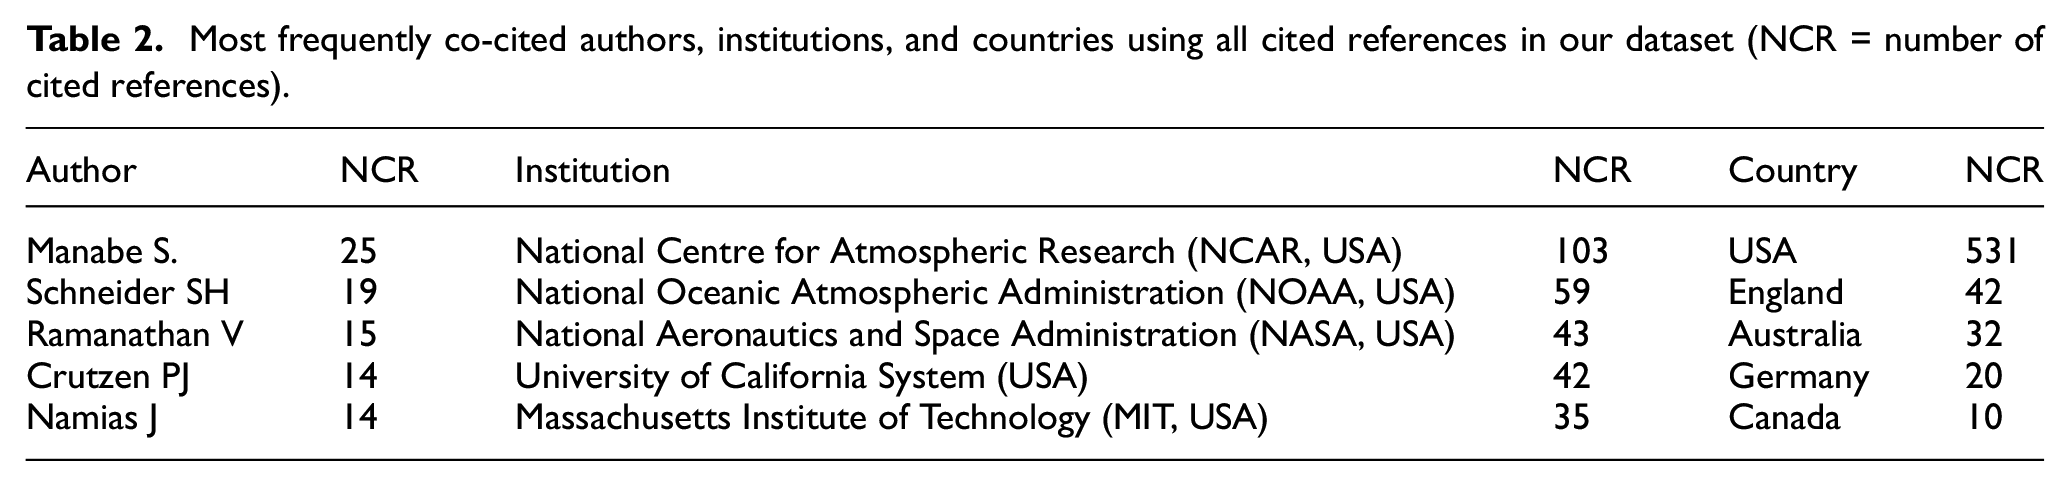
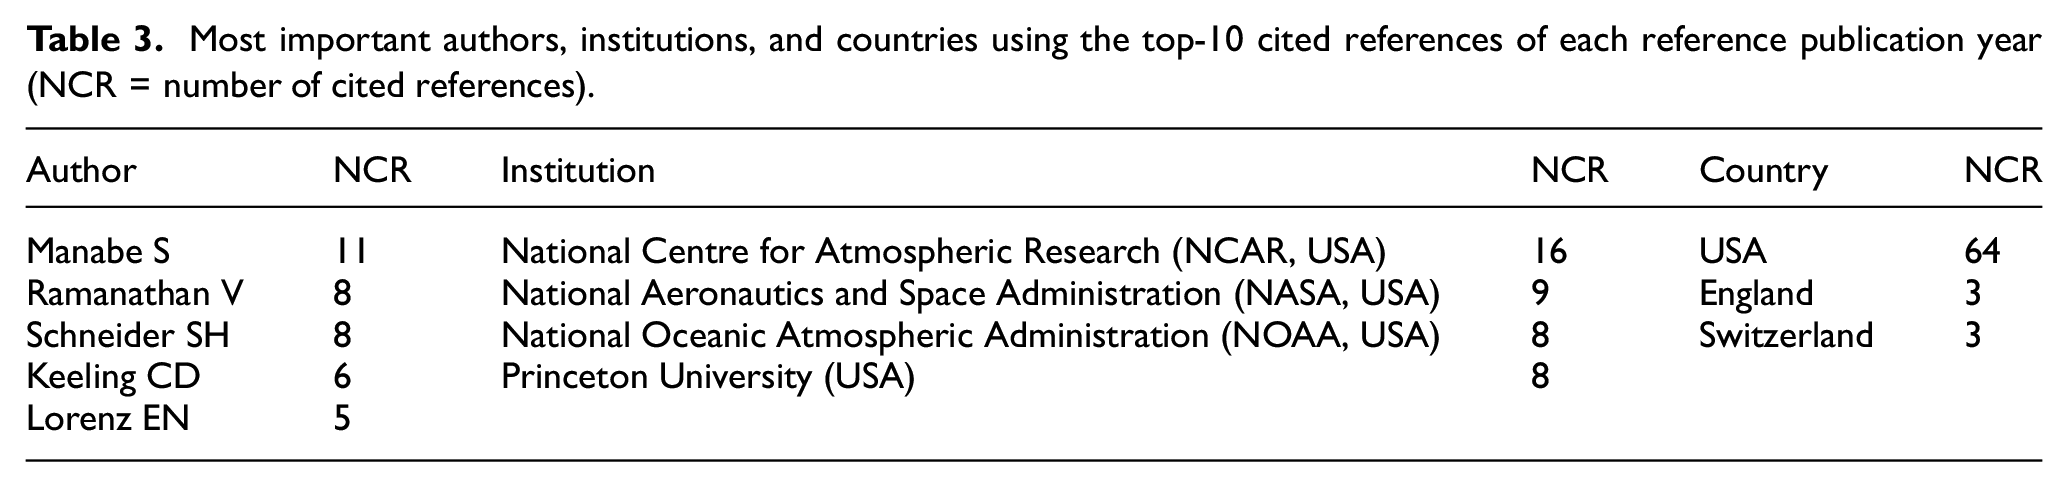
Table 2 shows the most important authors, institutions, and countries of authors using all cited references in our dataset. Note that ‘Fed. Rep. Ger.’, ‘West Germany’, and ‘Germany’ were merged into the country name ‘Germany’. Table 3 shows the same set of information after restricting our dataset to the top-10 cited references of each reference publication year, and Table 4 shows the corresponding analyses when using only the top-5 cited references of each reference publication year.
Most frequently co-cited authors, institutions, and countries using all cited references in our dataset (NCR = number of cited references).
Most important authors, institutions, and countries using the top-10 cited references of each reference publication year (NCR = number of cited references).
Most important authors, institutions, and countries using the top-5 cited references of each reference publication year (NCR = number of cited references).
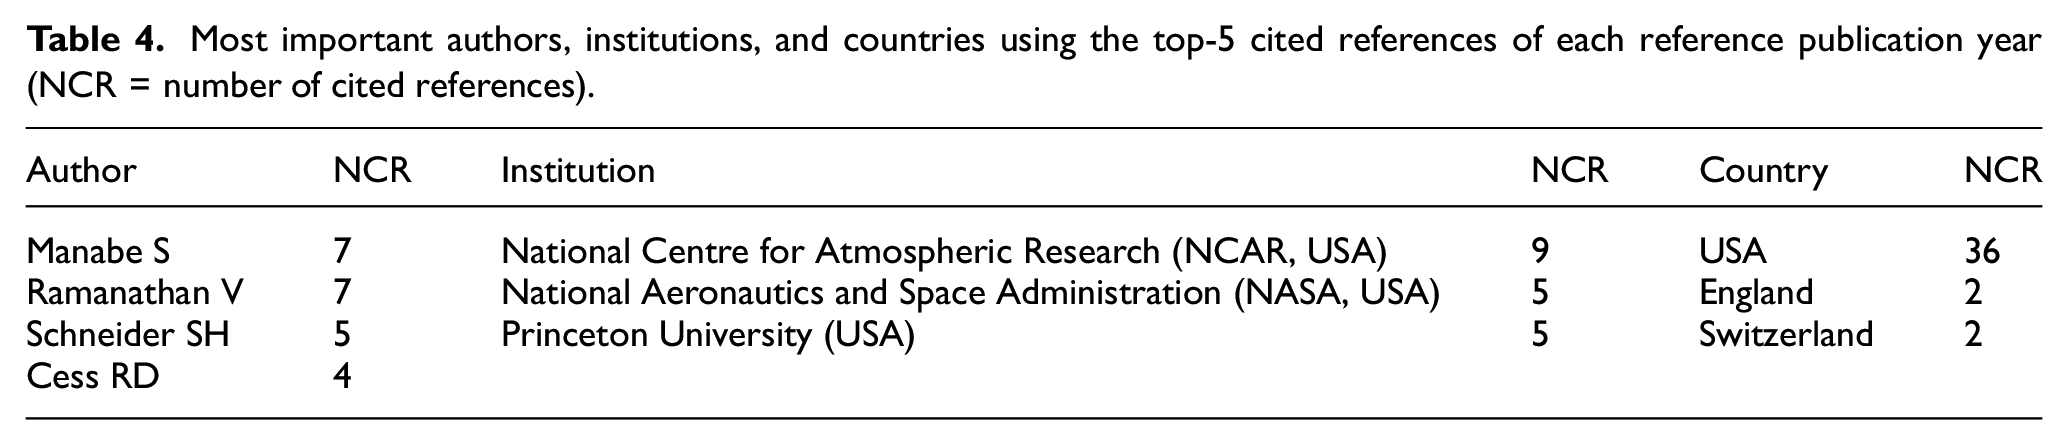
Tables 2–4 reveal three authors most frequently co-cited with the marker papers, which appear in each of the tables: SM, Veerabhadran Ramanathan and Stephen H. Schneider. Explanations to SM as one of the physics Nobel laureates in 2021 have been given above. The results in the tables reveal that some of his papers are strongly related to the selected marker papers and are frequently co-cited with them. KH, however, does not appear among the top co-cited references of this analysis. Probably, the marker papers by KH were cited in this context, and his other contributions were not co-cited frequently enough with any of the marker papers.
Veerabhadran Ramanathan (1944) at Scripps Institution of Oceanography (University of California in San Diego) and member of the US National Academy of Sciences has contributed to many areas of atmospheric and climate sciences, including the development of general circulation models and the detection of climate change. In 1975, he discovered the strong greenhouse effect of cholorofluorocarbons (CFCs). Before this discovery, carbon dioxide was widely seen to be the only greenhouse gas causing global warming. Stephen H. Schneider (1945–2010, since 1992 at Stanford University and member of the US National Academy of Sciences) made fundamental contributions to the understanding of human effects on Earth’s climate. He showed that human beings are active agents of climate change. He was one of the first to appreciate the importance and power of climate modeling. One of his research topics relates to the statistical properties of climate model simulations, seeking to separate anthropogenic climate change signals from the noise of natural climate variability – the signal-to-noise problem [47]. Jerome Namias was an American meteorologist, responsible for weather forecasting for the Allies during World War II in Northern Africa. As Chief of the Extended Forecast Division of the US Weather Bureau (now the National Weather Service), he developed the 5-day forecast in the 1940s, and month and season forecasts in the 1960s. Robert D. Cess published on atmospheric feedback mechanisms and appeared as a co-author of Veerabhadran Ramanathan.
The appearance of Charles David Keeling (originator of the Keeling curve which shows the increase in the carbon dioxide concentration in the atmosphere), Paul Josef Crutzen (chemistry Nobel laureate in 1995 for his work on atmospheric chemistry, particularly on the decomposition of atmospheric ozone), and Edward Norton Lorenz (discoverer of the butterfly effect, that is, the sensitive dependence of complex systems, such as climate on initial conditions) indicate the broad perspective when analyzing all co-cited references or all top co-cited references of each reference publication year. The contributions of these scientists are so fundamental that they can be expected to appear in bibliometric analyses of the history of climate change research.
In the 1970s and early 1980s, the vast potential of numerical models of the climate system was becoming increasingly obvious. During the 1970s, however, only very few research centers were able to perform such modeling. Therefore, the top-ranked institutions are a small number of large national research centers, all of which are located in the United States (NCAR, NOAA, NASA). The famous Hadley Centre in England did not appear because it was not founded until 1990 (it was initially named the Hadley Centre for Climate Research and Prediction, and was later renamed). There is a long tradition of climate research not only in England but also in Switzerland. Therefore, besides the United States, England and Switzerland also appeared among the top-ranked countries of authors of the co-cited references.
The statistical analyses based on all co-cited references or all top co-cited references of each reference publication year, respectively, detect a multitude of papers that address (more or less) climate modeling. The latter are historical or fundamental works of climate research that do not focus on climate simulations (e.g., the works of Edward Lorenz, the discoverer of the butterfly effect). To focus more specifically on the immediate intellectual environment of the beginning of climate modeling, we have additionally analyzed distinct peaks in the RPYS-CO spectrogram. The peaks that we interpret in the next section reveal the most important publications that are directly related to the seven marker papers.
4.2. Qualitative analysis of the RPYS-CO
We applied RPYS-CO and retrieved the spectrogram of all co-citations of the seven marker papers (see Figure 2).
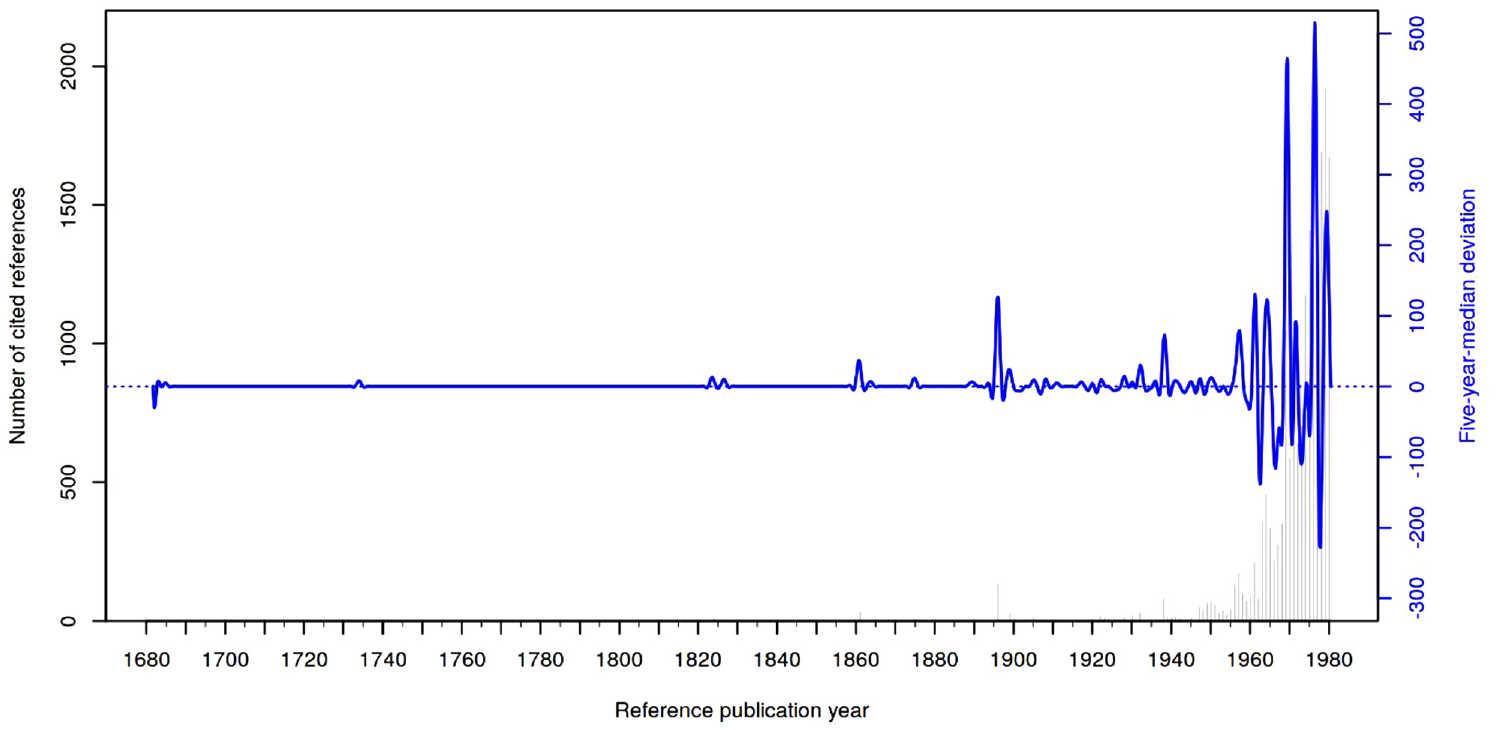
RPYS-CO spectrogram of the seven marker papers listed in Table 1. The marker papers are not included in this spectrogram (online figure at https://s.gwdg.de/tflsR5).
The most frequently co-cited publications, which appear as distinct peaks in the median deviation curve of the RPYS-CO spectrogram of Figure 2, can be broadly categorized as follows:
Historical works relating to the discovery of the greenhouse effect which are most important for the history of global warming [48–55].
Papers published since the 1930s and dealing with the carbon dioxide theory of climate change [56–58] and effects of various parameters (e.g., ocean currents, solar cycles) on the mean temperature of the atmosphere [59–61]. Budyko [62] is not directly related to global warming. Edward Lorenz is the discoverer of the butterfly effect. The work by Lorenz [63] is fundamental for the prediction of future weather and climate (without a distinct peak in the spectrogram).
Papers published between 1960 and 1980 deal with climate models and calculations of the mean Earth temperature as a function of the concentration of greenhouse gases, particularly of carbon dioxide. The papers focus on climate models [64], aerosols [65], ice ages, feedback mechanisms, man-made greenhouse gases and radiative convection [66–69], and models of the influence of CO2 on the atmospheric temperature [70–72].
As can be expected, most papers published between 1960 and 1980 belong to the narrow periphery of the marker papers published by KH and SM and are closely related to their works. They can be interpreted as the intellectual environment of the beginning of climate modeling. Besides KH and SM, in particular, Veerabhadran Ramanathan, Richard Wetherald, and William Sellers, can be seen as further pioneers of climate modeling.
The contributions of Veerabhadran Ramanathan to climate modeling have been mentioned above. Richard Wetherald (1936–2011) appears as a co-author of SM on three of the seven marker papers that we used in this study. He was an American climate scientist who made fundamental contributions to climate modeling. William D. Sellers (1928–2014) was an American meteorologist and climate scientist who created one of the first climate models. He was one of the first who discussed the effect of atmospheric carbon dioxide on Earth’s climate. Sellers [64] paper entitled ‘A global climatic model based on the energy balance of the earth-atmosphere system’ exactly hits the topic of climate modeling. In this article, a relatively simple numerical model of the energy balance of the Earth’s atmosphere is applied. Besides Budyko [62], Sellers [64] caused the distinct 1969 peak in the spectrogram (see Figure 2).
Rasool and Schneider [65] discuss the effects of large increases in atmospheric carbon dioxide and aerosols on the global climate. The papers by Hays et al. [68] and Cess [66] deal with the causes of ice ages and with atmospheric feedback mechanisms, respectively. With these topics, the papers have a weaker connection with climate modeling. Wang et al. [67] deal with the man-made greenhouse effect. The study used a one-dimensional radiative-convective model to simulate the effect of increased atmospheric trace gas concentrations on the Earth’s surface temperature. Ramanathan [69] presents a simplified radiative-convection model of the radiative transfer in the Earth’s atmosphere.
Ramanathan et al. [71] simulate zonal and seasonal effects on surface temperature caused by increased atmospheric carbon dioxide, based on radiative transfer model calculations. Manabe and Stouffer [72] present a sensitivity study of the effects of carbon dioxide on Earth’s climate based on a global climate model. The paper hits the topic of climate modeling but it was not used as a marker paper in this study: It received a relatively low citation count (93 citations until March 2022). Newell and Dopplick [70] discuss ‘questions concerning the possible influence of anthropogenic CO2 on atmospheric temperature’. The authors simulated estimates of the atmospheric temperature changes due to a doubling of carbon dioxide concentrations with a static radiative flux model.
The results of the qualitative analyses in this section show that the intellectual base of research by KH and SM is very narrow. All research-focussed institutions of the top co-cited papers in our dataset are located in the United States: the Goddard Space Flight Center (NY) and Langley Research Center (Hampton, VA) of the National Aeronautics and Space Administration (NASA), and the National Center for Atmospheric Research of the National Oceanic and Atmospheric Administration (NOAA) in Boulder (CO). The two US National Research Administrations (NASA and NOAA) have a long-lasting tradition with regard to research related to climate change. In addition to these US institutions, the following well-known universities are most important: the University of Arizona (Tucson, CO), Princeton University (NJ), the Massachusetts Institute of Technology (MIT) in Cambridge (MA) in cooperation with the Scott Air Force Base (IL), and the University of Stony Brook (NY).
5. Discussion
RPYS is a bibliometric method originally introduced to reveal the historical roots of research topics or fields [15,16]. The method aims to mirror the knowledge base of a specific field by analyzing the cited references within the papers of the relevant publication set (rather than the citations of the papers themselves). RPYS does not identify the most highly cited papers of the publication set under study (as usually done by bibliometric analyses in research evaluation), but rather the most frequently referenced publications – each in its specific reference publication year. The most frequently cited references are presented in graphical and tabular forms.
The RPYS method provides an (objective and quantitative) answer to questions concerning seminal papers and historical roots and is based on Galton’s [73] principle ‘wisdom of the crowd’ [74]. Individual scientists in the field can answer such questions only subjectively, but the entire scientific community with knowledge in the target field can deliver a reliable view. Whereas RPYS analyses have mainly focused on single seminal papers and the historical roots of research fields, we used in this study the method for identifying associated papers with breakthrough research or revolutionary science. We were specifically interested in developing and testing a method for identifying researchers, institutions and countries involved in revolutionary science. This science usually does not occur ‘out of the blue’ but is (deeply) embedded in previous and current research activities that are reflected in publications [75]. According to Yan et al. [76], ‘the source of novelty is often reflected in the new combination of existing knowledge and generation of new ideas’ (p. 896). This view of novelty (or breakthrough) as a recombination of existing knowledge is in the tradition of Schumpeter [77]: Research processes result ‘in novelty when knowledge is combined “differently” or when “new combinations” are carried out’ [78]. Recombined novel research is in the unique position to push knowledge frontiers [78] which are research topics of particular interest to researchers in a field [79].
In this study, we used research on the physical modeling of Earth’s climate and the prediction of global warming as an example to demonstrate the usefulness of our new RPYS approach. We identified associated papers of research by KH and SM who were honoured with the Nobel Prize for their fundamental contributions to research on the physical modeling of Earth’s climate and the prediction of global warming. Frequently co-cited references of research by KH and SM (and associated papers) can be seen as seminal publications for research on the physical modelling of Earth’s climate and the prediction of global warming.
The results of the quantitative reference analyses (i.e., of all co-cited references of the marker papers or only of the top co-cited references) and of the qualitative reference analysis (i.e., the co-cited peak references in the RPYS-CO spectrogram) show that the close intellectual environment of research by KH and SM is rather narrow. Veerabhadran Ramanathan, Richard Wetherald, and William Sellers can be seen as further pioneers of climate modeling. Other notable researchers are Robert D. Cess, Thomas G. Dopplick, James E. Hansen, Andrew A. Lacis, Mengshui. Lian, Tengfei Mo, Reginald E. Newell, S. Ichtiaque Rasool, Stephen H. Schneider, Ronald J. Stouffer, Wei-Chyung Wang, and Yuk L. Yung (in alphabetic order). All authors’ institutions of the top co-cited papers are located in the United States. These institutions are either research centers of two US National Research Administrations (NASA and NOAA) or universities: the University of Arizona, Princeton University, the (MIT), and the University of Stony Brook.
This study has three main limitations: (1) The choice of marker papers determines the set of cited references that are analyzed. One could choose to use more or less or different marker papers than we did. This might lead to different results. (2) The analyses of countries, institutions, and authors of the cited references can be done on different parts of the dataset. Either one uses all cited references from the RPYS analyses or a certain subset (e.g., top-5 or top-10 cited references from each RPY). A smaller subset might be too restrictive and a larger subset (or even the full set of cited references) might dilute the resulting analyses. Therefore, we performed quantitative analyses using three different datasets and an additional qualitative analysis to compare the results from different analyses. (3) About 30% of the cited references in our dataset do not have affiliation information in the WoS and could not be included in our analyses. This is a significant reduction of the dataset by missing affiliation data. On one side, since we do not assume a systematical bias that led to the missing data, we do not expect completely other results without missing data. On the other side, we cannot be certain that the results would be the same with a dataset without missing data. Therefore, we recommend further research that tries to compare the results based on datasets with and without missing data. Another topic for future research may be the development of methods and search for datasets with the objective to reduce the share of missing data.
6. Conclusion
In this study, we used climate change and global warming research as an example to demonstrate our proposed method for the identification of most important researchers, institutions, and countries in breakthrough research. In principle, the method can be used for the investigation of any (revolutionary) research topic in any discipline. Since the Nobel Prize is usually awarded for breakthrough research, the method can be used to investigate important researchers, institutions, and countries in the context of rewarded research. As long as the publications of this research are covered in citation indexes, the proposed method can be applied.
Footnotes
Declaration of conflicting interests
The author(s) declared no potential conflicts of interest with respect to the research, authorship, and/or publication of this article.
Funding
The author(s) received no financial support for the research, authorship, and/or publication of this article.