
Abstract
Since the introduction of the reference publication year spectroscopy (RPYS) method and the corresponding programme CRExplorer, many studies have been published revealing the historical roots of topics, fields and researchers. The application of the method was restricted up to now by the available memory of the computer used for running the CRExplorer. Thus, many users could not perform RPYS for broader research fields or topics. In this study, we present various sampling methods to solve this problem: random, systematic and cluster sampling. We introduce the script language of the CRExplorer that can be used to draw many samples from the population data set. Based on a large data set of publications from climate change research, we compare RPYS results using population data with RPYS results using different sampling techniques. From our comparison with the full RPYS (population spectrogram), we conclude that the cluster sampling performs worst and the systematic sampling performs best. The random sampling also performs very well but not as well as the systematic sampling. The study therefore demonstrates the fruitfulness of the sampling approach for applying RPYS.
Keywords
1. Introduction
Thor et al. [1] introduced the CRExplorer – a programme that can be used to investigate the roots of research fields and topics. For example, the programme has been used by Rhaiem and Bornmann [2] to reveal the historical roots of the new topic in scientometrics of academic efficiency assessments or by Yeung [3] identifying seminal works that built the foundation for functional magnetic resonance imaging studies of taste and food. The CRExplorer facilitates the so-called reference publication year spectroscopy (RPYS) [4]. This statistical method is based on a field- or topic-specific publication set including cited references (CRs). RPYS visualises CR counts by referenced publication years (RPYs, not to be confused with the method RPYS); years with high counts (especially early years) point to underlying cited publications that might be interpreted as historical roots or landmark papers of a field or topic.
Since the introduction of the RPYS, the method faces the problem of processing large data sets that are based on broader topics or fields. The hardware capacities of conventional computers running the CRExplorer are frequently not sufficient enough to process large data sets. To tackle this problem in using the software, we introduce in this article the technique of drawing several samples from a large data set and to produce RPYS results based on these samples. The study is based on a large data set that has been produced by Haunschild et al. [5] to identify the early roots of climate change research [6]. As we will demonstrate in this study, some sampling methods lead to results that are very close to the results from the complete climate change data set (the population).
By using samples to draw conclusions on populations, the study connects to the recent discussion in the Journal of Informetrics around the paper ‘sampling issues in bibliometric analysis’ published by Williams and Bornmann [7]. Both authors demonstrate the relevance of the sampling concept for bibliometric analyses (in the context of inference statistics). Some authors have commented on the paper by questioning the relevance of the sampling topic for the field. In this article, however, we will demonstrate the fruitfulness of this concept for bibliometric studies.
In section 2, we describe the climate change data set that we used in this study to demonstrate the various RPYS sampling methods. The three different sampling methods that are implemented in the CRExplorer are also explained in this section: random, systematic and cluster sampling. Section 3 starts with the RPYS based on the complete climate change data set, that is, the population data set (section 3.1). The results of the population RPYS constitute the outcome which should be reached by the sampling methods: the closer the RPYS of the sampling method is to the population RPYS, the more appropriate is the method for replacing the population RPYS. The results of the population RPYS revealing the historical roots of climate change research are explained in detail. Sections 3.3, 3.4, and 3.6, in section 3, present the RPYS results based on the different sampling methods.
All subsections in section 3 presenting the RPYS results based on the population and sample data are followed by corresponding subsections, in which the script language of the CRExplorer is explained for performing the specific RPYS. The explanations are provided in detail so that the reader learns how to use the language.
2. Data set and methodology
2.1. Climate change publications
Our analyses are based on the Web of Science (WoS, Clarivate Analytics) custom data of our in-house database derived from the Science Citation Index Expanded (SCI-E), Social Sciences Citation Index (SSCI) and Arts and Humanities Citation Index (AHCI) produced by Clarivate Analytics (Philadelphia, PI, USA). We used in this study a publication set containing most of the relevant literature regarding climate change research. The set was compiled using a sophisticated method known as ‘interactive query formulation’. A set of key papers was retrieved and a reformulated search query based on the keyword analysis of key papers was constructed [8]. The search was restricted to the publication years 1980–2014 and to the document types ‘article’ and ‘review’. A detailed description of the search process for retrieving the relevant publications on climate change can be found in Haunschild et al. [5].
In total, the publication set (the population) comprises 222,060 publications and 10,932,050 CRs in 4,004,082 distinct CR variants. An earlier RPYS study by Marx et al. [6] has analysed the RPYs before 1971. The restriction to RPYs before 1971 reduced the number of distinct CR variants to 239,887. This reduction of the number of cited references (NCRs) made the RPYS analysis feasible. The CRs published between 1970 and 2014 comprise 6,594,657 CRs in 3,728,879 distinct CR variants. The main memory requirements rise with the number of unique CR variants, which makes it impossible to analyse the RPYS using the full climate change data set on a current standard computer. Thus, the data set is well suited to demonstrate different sampling methods in this study.
2.2. Sampling methods
If a data set contains numerous CRs from many publications, the full data set cannot be completely imported in the CRExplorer because of restrictions by the available main memory on the computer of many users. To tackle this problem, the user has the option to draw one of the following three types of samples from the full data set. The samples are based on different methods for selecting a subset from the original set of all CRs (the population) [9]:
Random sampling: The sample of CRs is randomly selected from the population where every possible combination of n CRs from the population has the same chance of being selected. For example, if the user wants to import a sample of 100 CRs out of the population of 400 overall CRs, CRExplorer randomly selects 25% of all CRs.
Systematic sampling: Systematic sampling is a very popular sampling method [9], whereby elements are selected from an ordered sampling frame. Here, a given number of CRs is used to select the sample uniformly distributed over the list of all CRs of the citing publications. For example, if the user wants to import 100 CRs out of 400 overall CRs, CRExplorer systematically selects 25% of the list of all CRs by picking the first, fifth, ninth and so on.
Cluster sampling: Cluster sampling is not a sampling frame which is based on individual units but on clusters of units. Thus, clusters of units are sampled instead of individual units. The CRExplorer randomly selects 1 year from the citing publication years which lie between two given years set by the user of the programme. Then, all CRs in the papers published in this year are selected as a sample and are imported. The results of Bornmann and Mutz [10] reveal that the restriction on all CRs from a recent citing year leads to very similar results as the consideration of all CRs from several citing years in references analysis.
3. Results
3.1. Population analysis
The results of the RPYS based on the population data that are shown in Figure 1 (the population spectrogram) serve as baseline for the comparison with the results based on the three sampling methods. The figure presents the NCRs for each RPY. Frequently occurring RPYs show up as distinct peaks within the RPYS spectrogram. The highest peak in Figure 1 with the most CRs is visible for RPY = 2000.
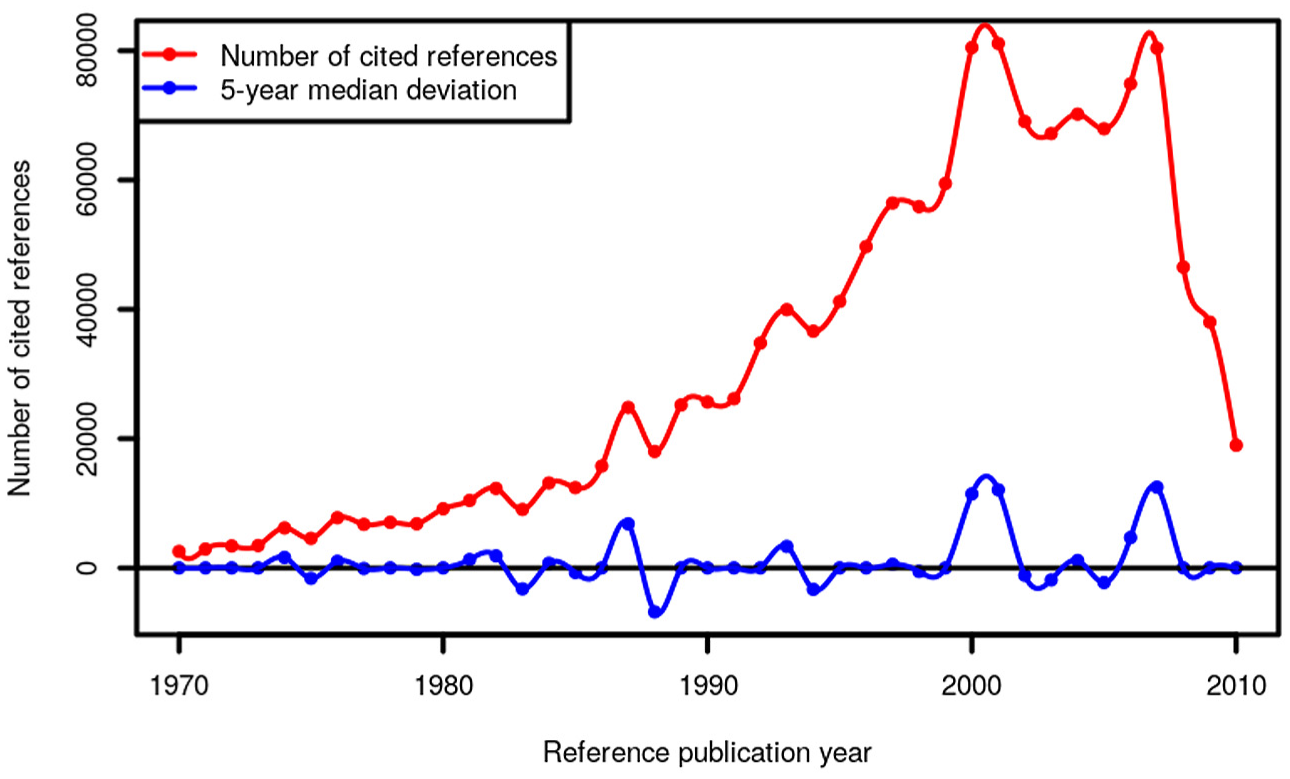
Annual distribution of CRs throughout the period 1970–2010 which have been cited in climate change publications (published between 1980 and 2014).
For this study, we restrict the RPYS analysis to the RPYs from 1970 to 2010 and use the results for comparison with the RPYS results from various sampling methods. We connect with this focus to the study by Marx et al. [6], who analysed the very early roots of climate change research. Thus, the results of the RPYS are of interest not only in the comparison of samples and population but also for revealing landmark publications in climate change research from the past which have been published more recently.
The RPYS in Figure 1 shows not only the NCRs (in red) but also the 5-year median deviation (in blue). Thus, the blue line is the deviation of the NCRs in each year from the median for the NCRs in the two previous, the current and the two following years. This deviation from the 5-year median provides a curve smoother than the one in terms of absolute numbers. Using the 5-year median deviation curve, peaks in the data can be identified more easily than with the absolute numbers, since each year is compared with its adjacent years. Although we have calculated the RPYS until 2014, we show the spectrogram in Figure 1 only until 2010 to ensure a referencing window of at least 3 years. The spectrogram features nine more or less pronounced peaks at the following RPYs: 1974, 1976, 1982, 1984, 1987, 1993, 2000/2001, 2004 and 2007. Table 1 lists the CRs that occur most frequently within the peak RPYs.
Most frequently CRs, their titles and NCR values from selected RPYs in Figure 1.
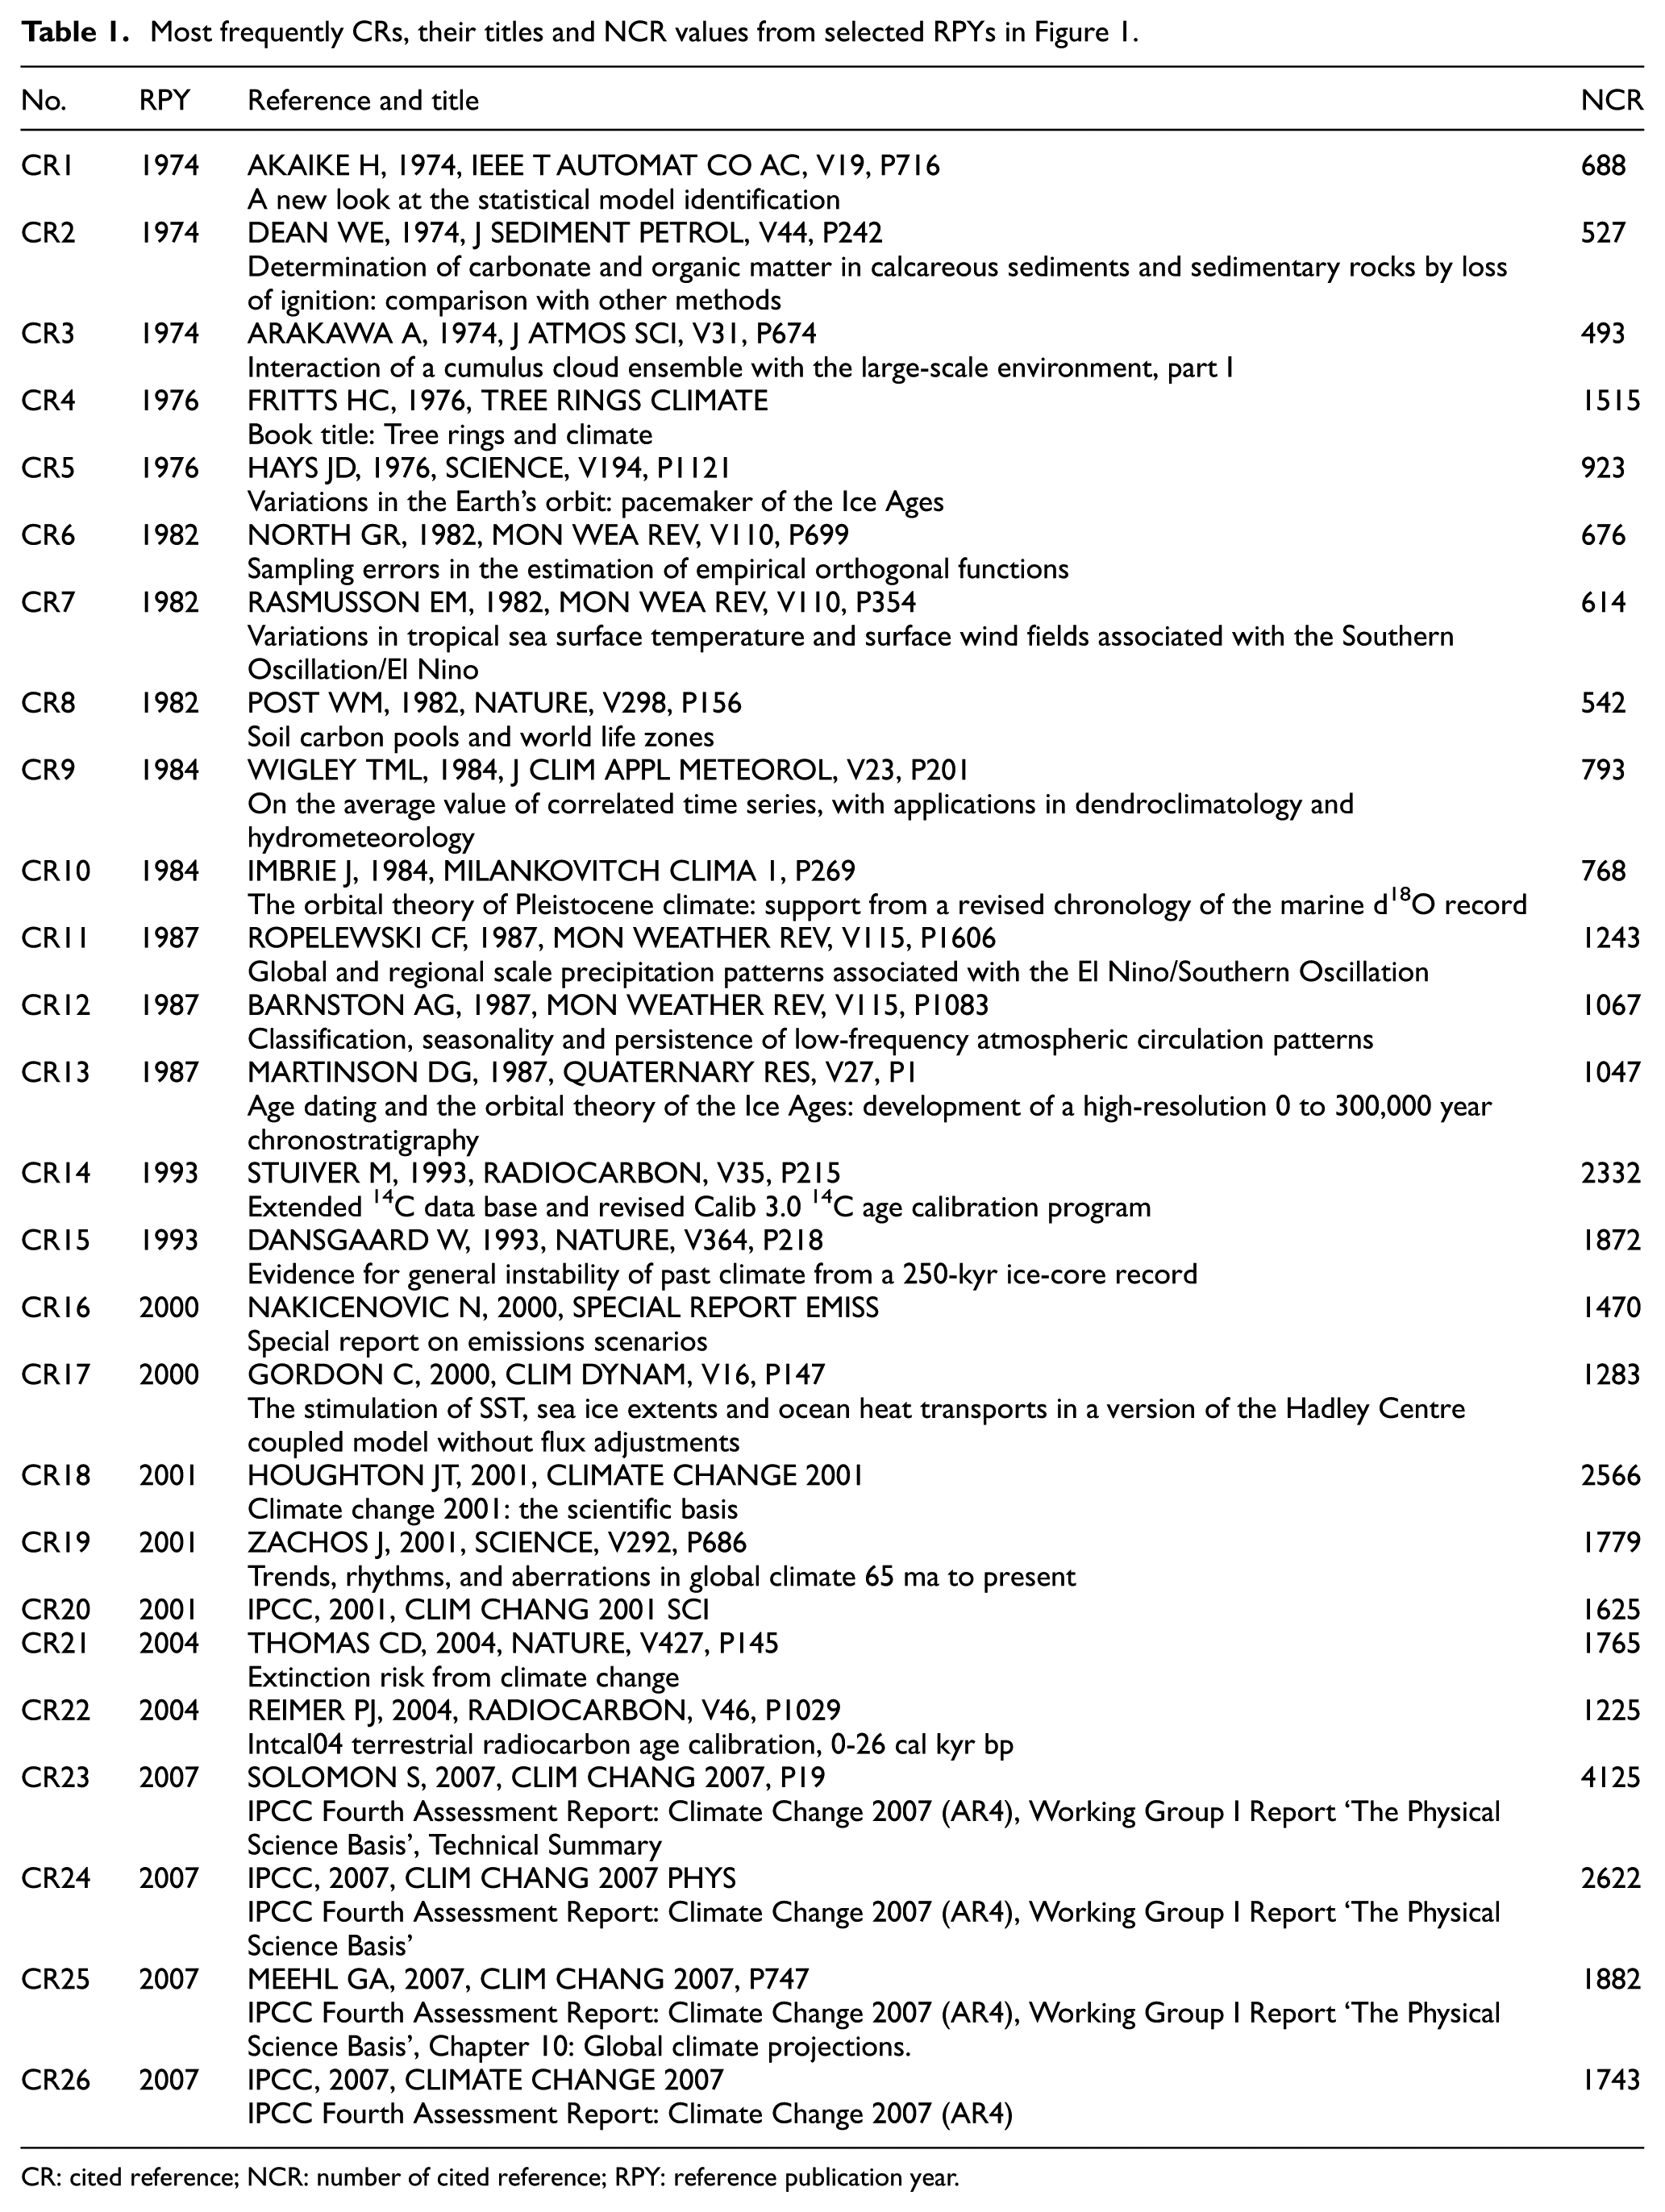
CR: cited reference; NCR: number of cited reference; RPY: reference publication year.
The 26 CRs in Table 1 can be categorised into four different groups of climate change research papers. Nine CRs (CR4, CR5, CR9, CR10, CR13, CR14, CR15, CR19, and CR22) can be assigned to the disciplines paleoclimatology and dating techniques. The corresponding papers deal with the orbital theory of the Ice Ages, the instability of the climate of the past and dendrochronology in connection with climate change research. Six CRs (CR3, CR6, CR7, CR11, CR12, and CR17) are concerned with meteorology. The publications mainly present measured data or modelling results with regard to the atmospheric and oceanic circulation systems. These two sets of CRs are distributed more or less equally over the selected time span. Since the year 2000, however, the Intergovernmental Panel on Climate Change (IPCC) reports increasingly appear as the most frequently CRs. Seven CRs (CR16, CR18, CR20, and CR23-CR26) are part of IPCC reports, mostly related to the scientific basis of climate change and emission scenarios of greenhouse gases. Finally, there are four CRs (CR1, CR2, CR8, and CR21) that deal with various other issues in climate change research, for example, biological and statistical studies about effects from climate change.
We use the spectrogram in Figure 1 and the most frequently cited publications in Table 1 to judge the reliability of the different sampling methods’ results, which are presented in the following sections.
3.2. Using the script language for the population analysis
We employed the script language of CRExplorer to produce the results in Figure 1 and Table 1. The language can be applied instead of using the menus of the graphical user interface of CRExplorer. A separate JAR file is necessary to use the language (this file can be downloaded from http://www1.hft-leipzig.de/thor/crexplorer/CitedReferencesExplorerScript.jar). We started by analysing the CRs in all climate change papers on a machine with 512 GB of main memory (RAM, random access memory). The CRE and CSV files which are necessary for a RPYS analysis of all CRs published between 1970 and 2014 can be produced using the following CRExplorer script.
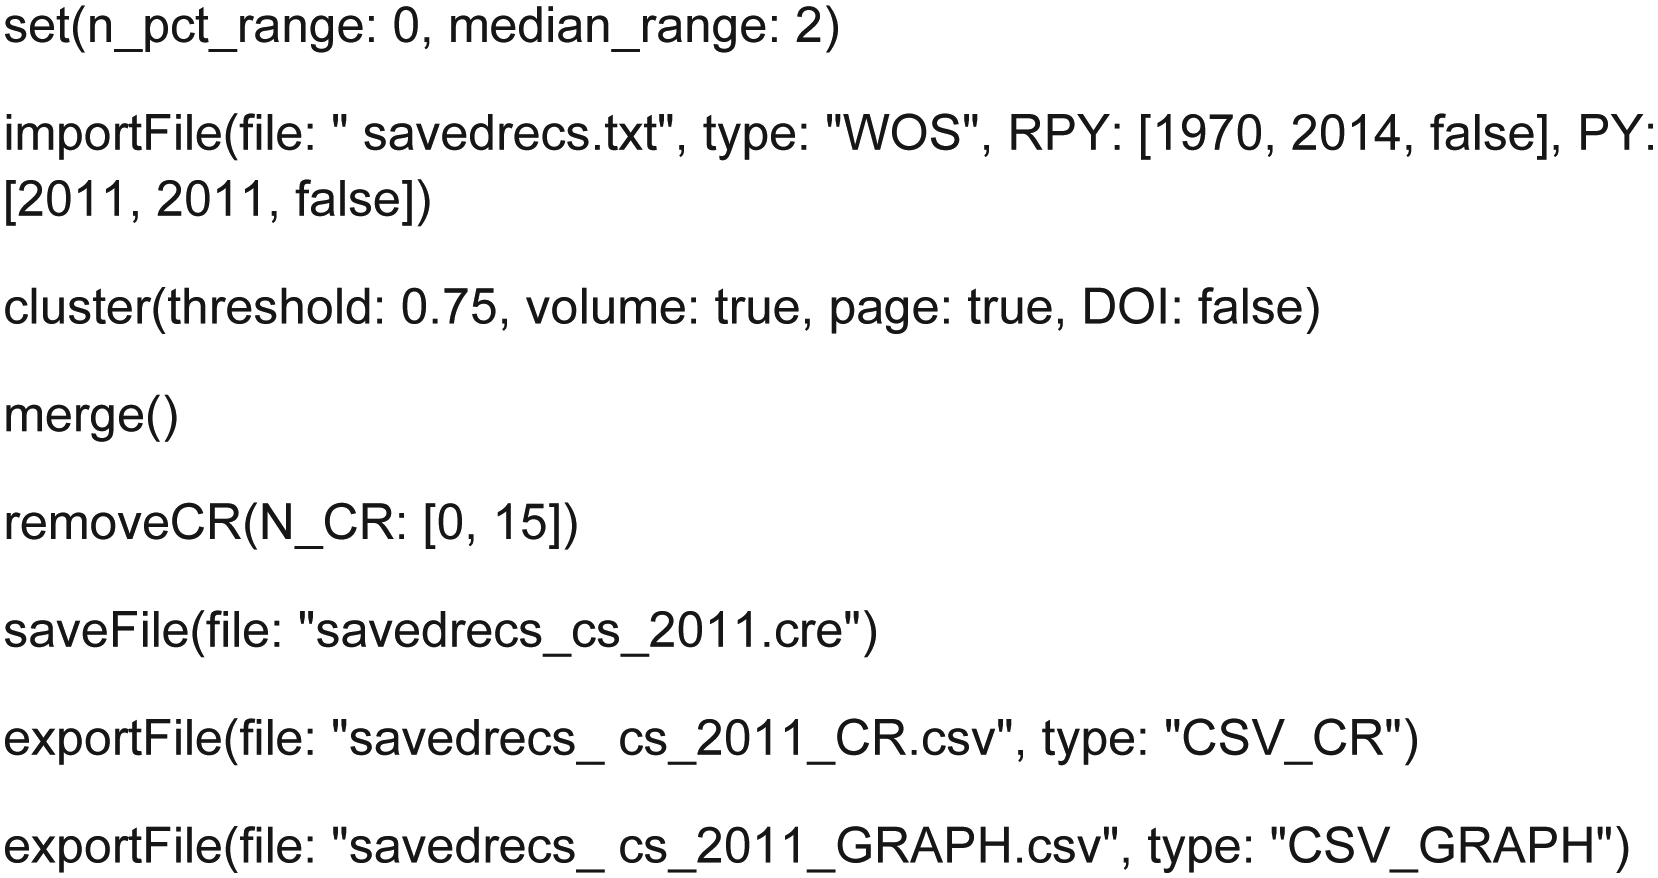
CRExplorer script to analyse the CRs in the WoS file savedrecs.txt.
Listing 1 imports the WoS file with the complete climate change data. Furthermore, it identifies variants of the same CR in the data set, clusters them and merges their occurrences (NCRs) [1]. Three export files are saved in different formats.
The
The function
With the function
The functions
3.3. Random sampling
In an attempt to cover a range from a small to a large number of samples, we performed seven different random sample RPYS analyses using 10, 50, 100, 500, 1000, 2500, and 10,000 samples with 50,000 CRs in each sample. Figure 2 shows the results of the merged samples in comparison with the population spectrogram (full RPYS). As the samples are of different size, they had to be scaled. We used f = max(NCRsample, RPY)/max(NCRfull, RPY) as a scaling factor. The samples do not fully reproduce the population spectrogram but most of the relevant peaks also occur in all of the samples. It seems that a few (10 or 50) random samples are sufficient to obtain a first impression of the RPYS.
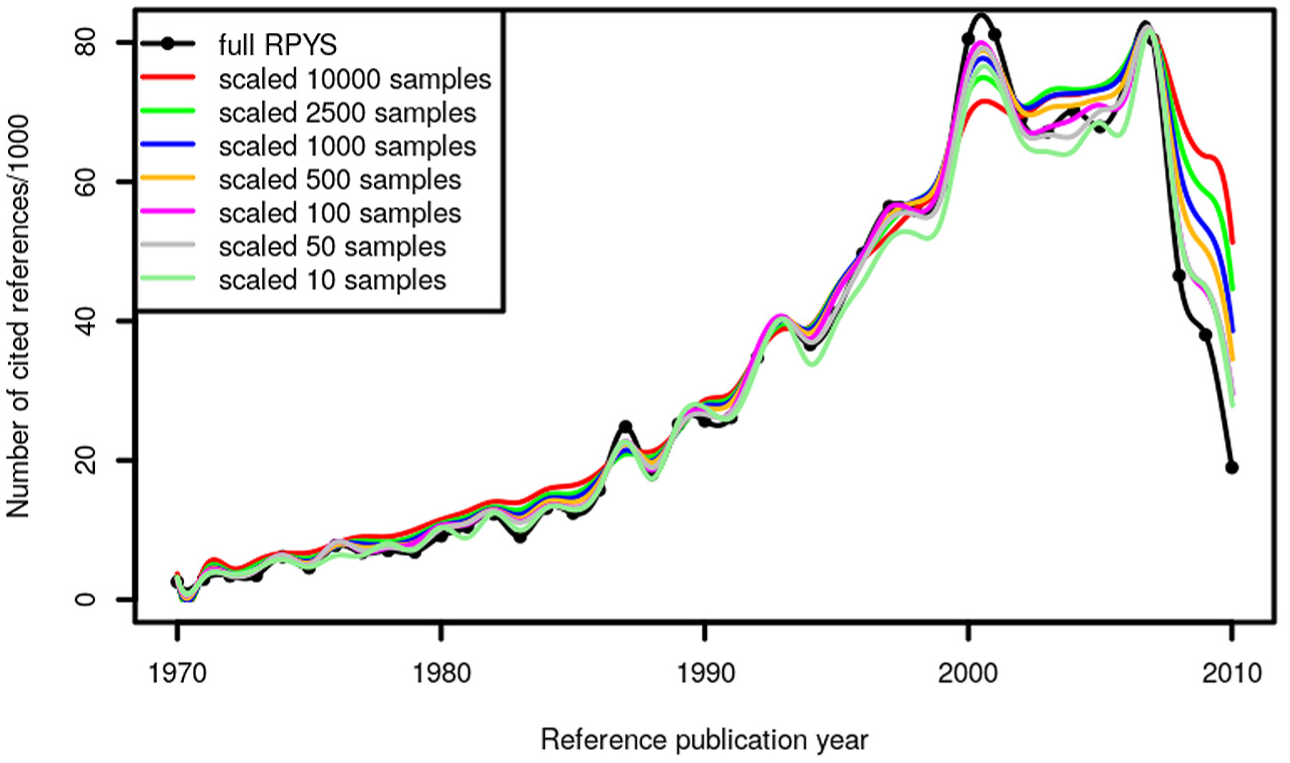
Annual distribution of random samples of the CRs throughout the period 1970–2010 which have been cited in climate change publications (published between 1980 and 2014).
The differences between the samples can be seen more clearly in Figure 3 where the difference between each sample and the RPYS with 10,000 samples is shown. The random sampling seems to converge rather slowly with the sample size, but the RPYS with 500 samples seems to be a good compromise between accuracy and computational time. Each sample needed approximately 1 min of computational time on our Intel® Xeon® E5-2640 with 2.6 GHz so that 500 samples can be calculated within a day or overnight. In total, 10,000 samples of 50,000 CRs each needed about a week on the same PC. Due to the slow convergence of the random sampling, we present the most important references under the peaks for the results from 10,000 samples in Table 2.
Most frequently CRs from selected RPYs with their NCR values using 10,000 random samples.

CR: cited reference; RPY: reference publication year; NCR: number of cited reference.
Deviation of the randomly sampled RPYS results from the RPYS based on 10,000 samples.
A comparison of the CRs in Table 2 with those in Table 1 shows that the same CRs occur as relevant peak papers in the sampling procedure as well as in the population analysis. However, the order of the peak papers is different for RPYs 1987 and 1993. In the case of eight CRs (CR4, CR10, CR17, CR19, and CR23-CR26), even the NCR value of the sampling result agrees with the result from the population RPYS analysis.
3.4. Systematic sampling
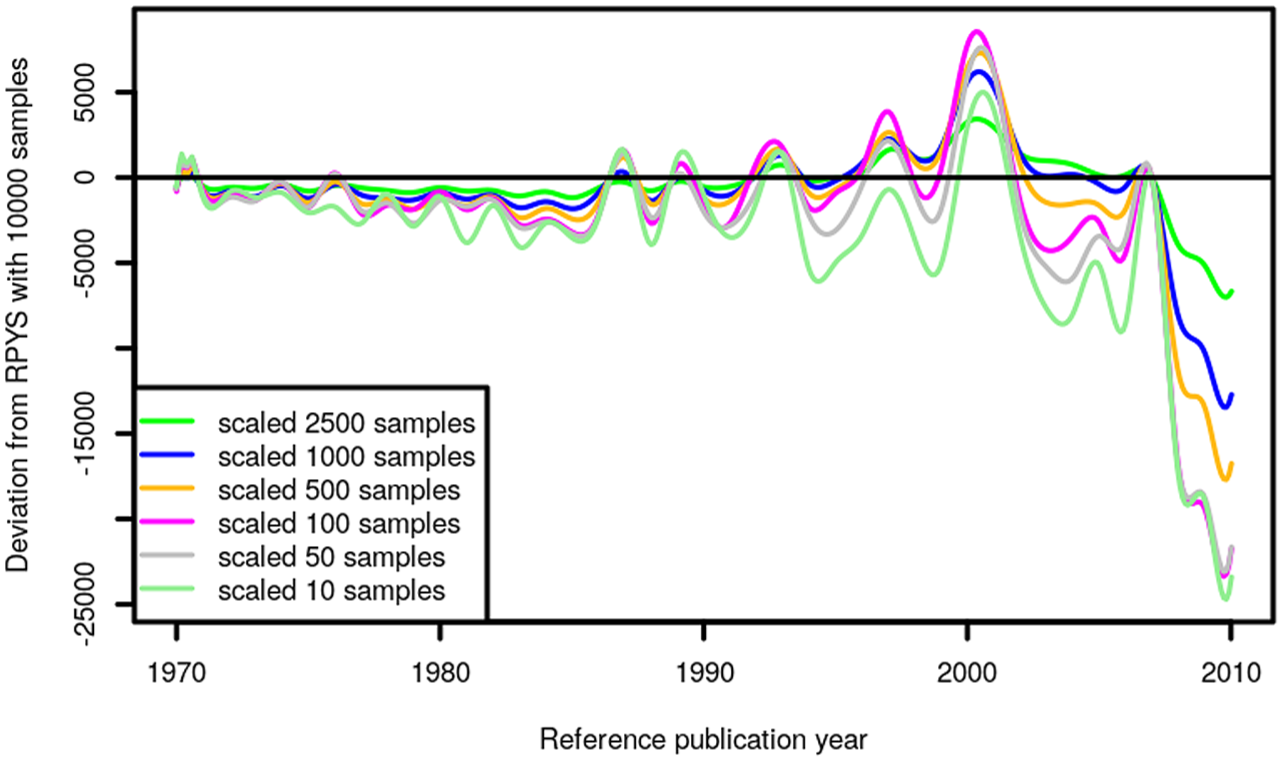
Analogously to the random sampling, we calculated seven different RPYSs of different sample sizes. The scaled sampling RPYS results and the population spectrogram are shown in Figure 4. Essentially all peaks except the small peak in 2004 are reproduced by all samples. Also in the case of the systematic sampling, a small sample size seems to be enough to resemble the most important features of the population spectrogram.
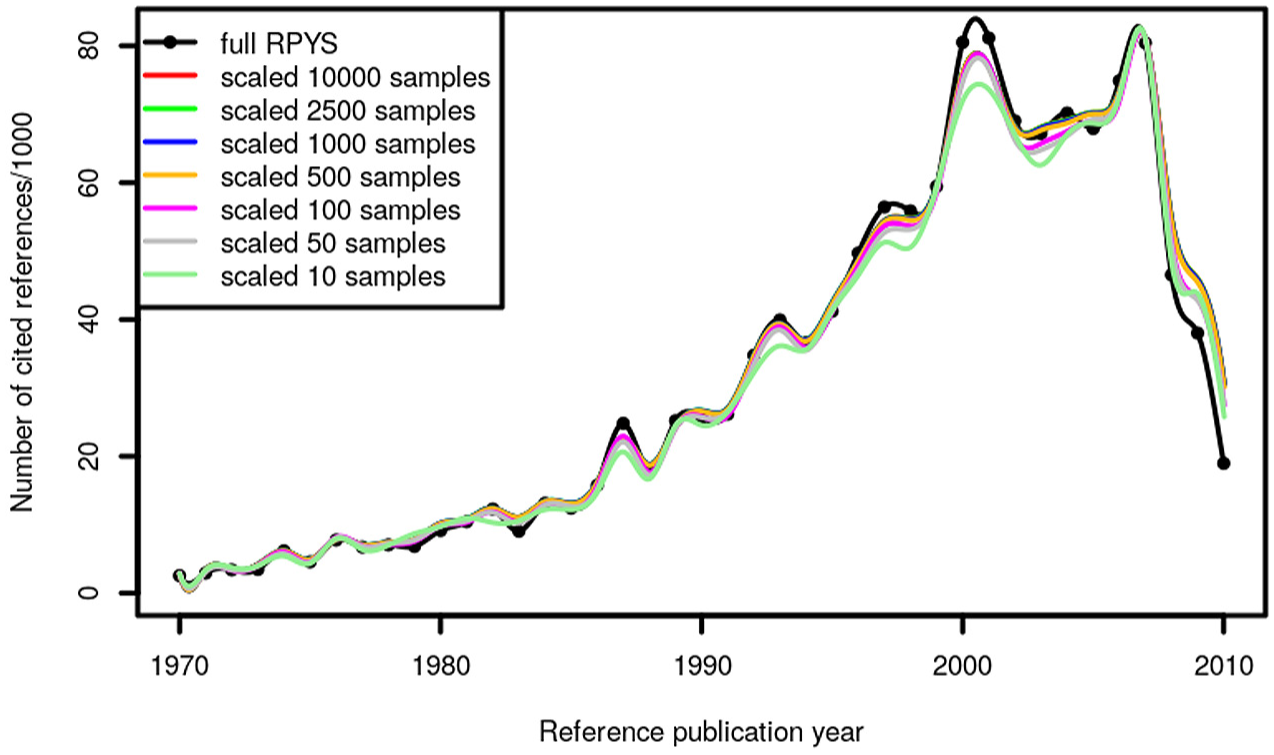
Annual distribution of systematic samples of the CRs throughout the period 1970–2010 which have been cited in climate change publications (published between 1980 and 2014).
The differences between the RPYS with 10,000 samples and the RPYS results with smaller sample sizes are displayed in Figure 5. In the case of the climate change literature, the systematic sampling converges faster than the random sampling. The difference between the RPYS result of 500 samples and larger samples seems to be insignificant. However, smaller sample sizes do not seem to be sufficient to resemble the RPYS accurately.
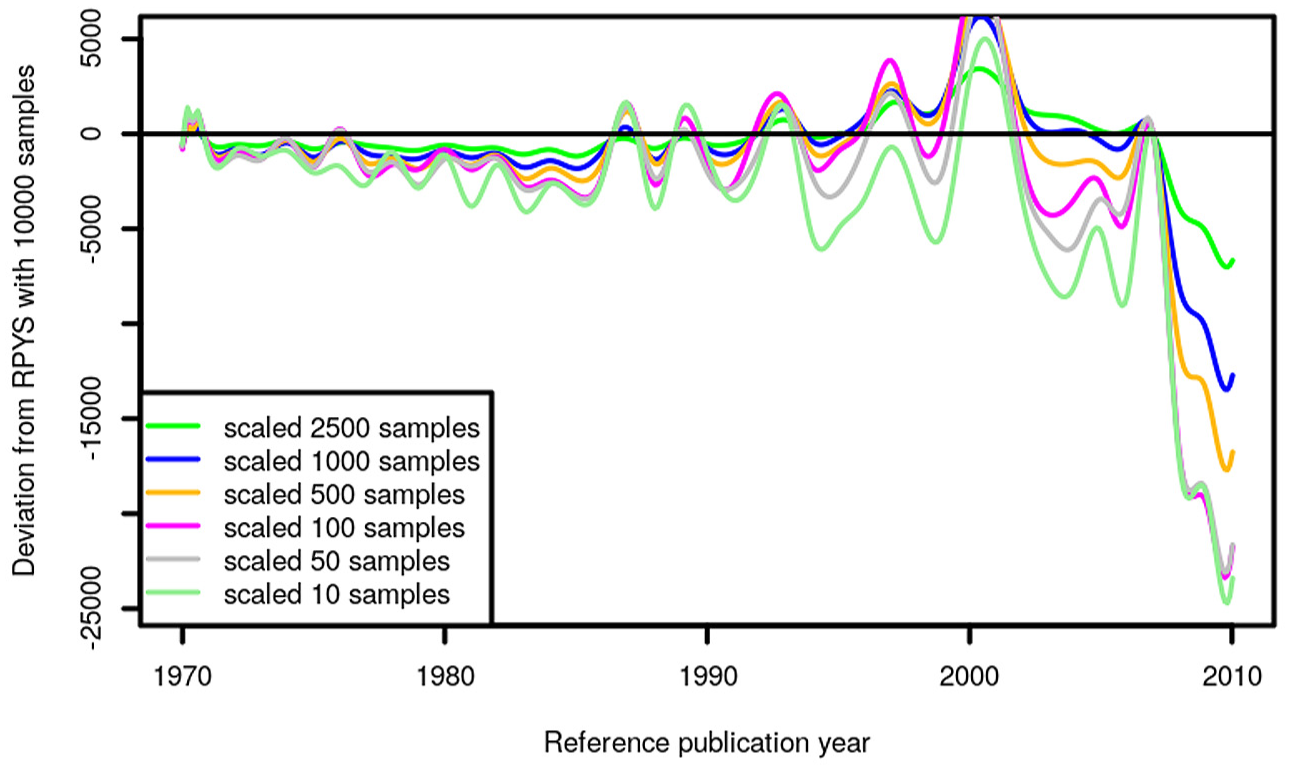
Deviation of the systematically sampled RPYS results from the RPYS based on 10,000 samples.
The most frequently occurring CRs according to 500 systematic samples for the peak RPYs are shown in Table 3.
Most frequently CRs from selected RPYs with their NCR values using 500 systematic samples.
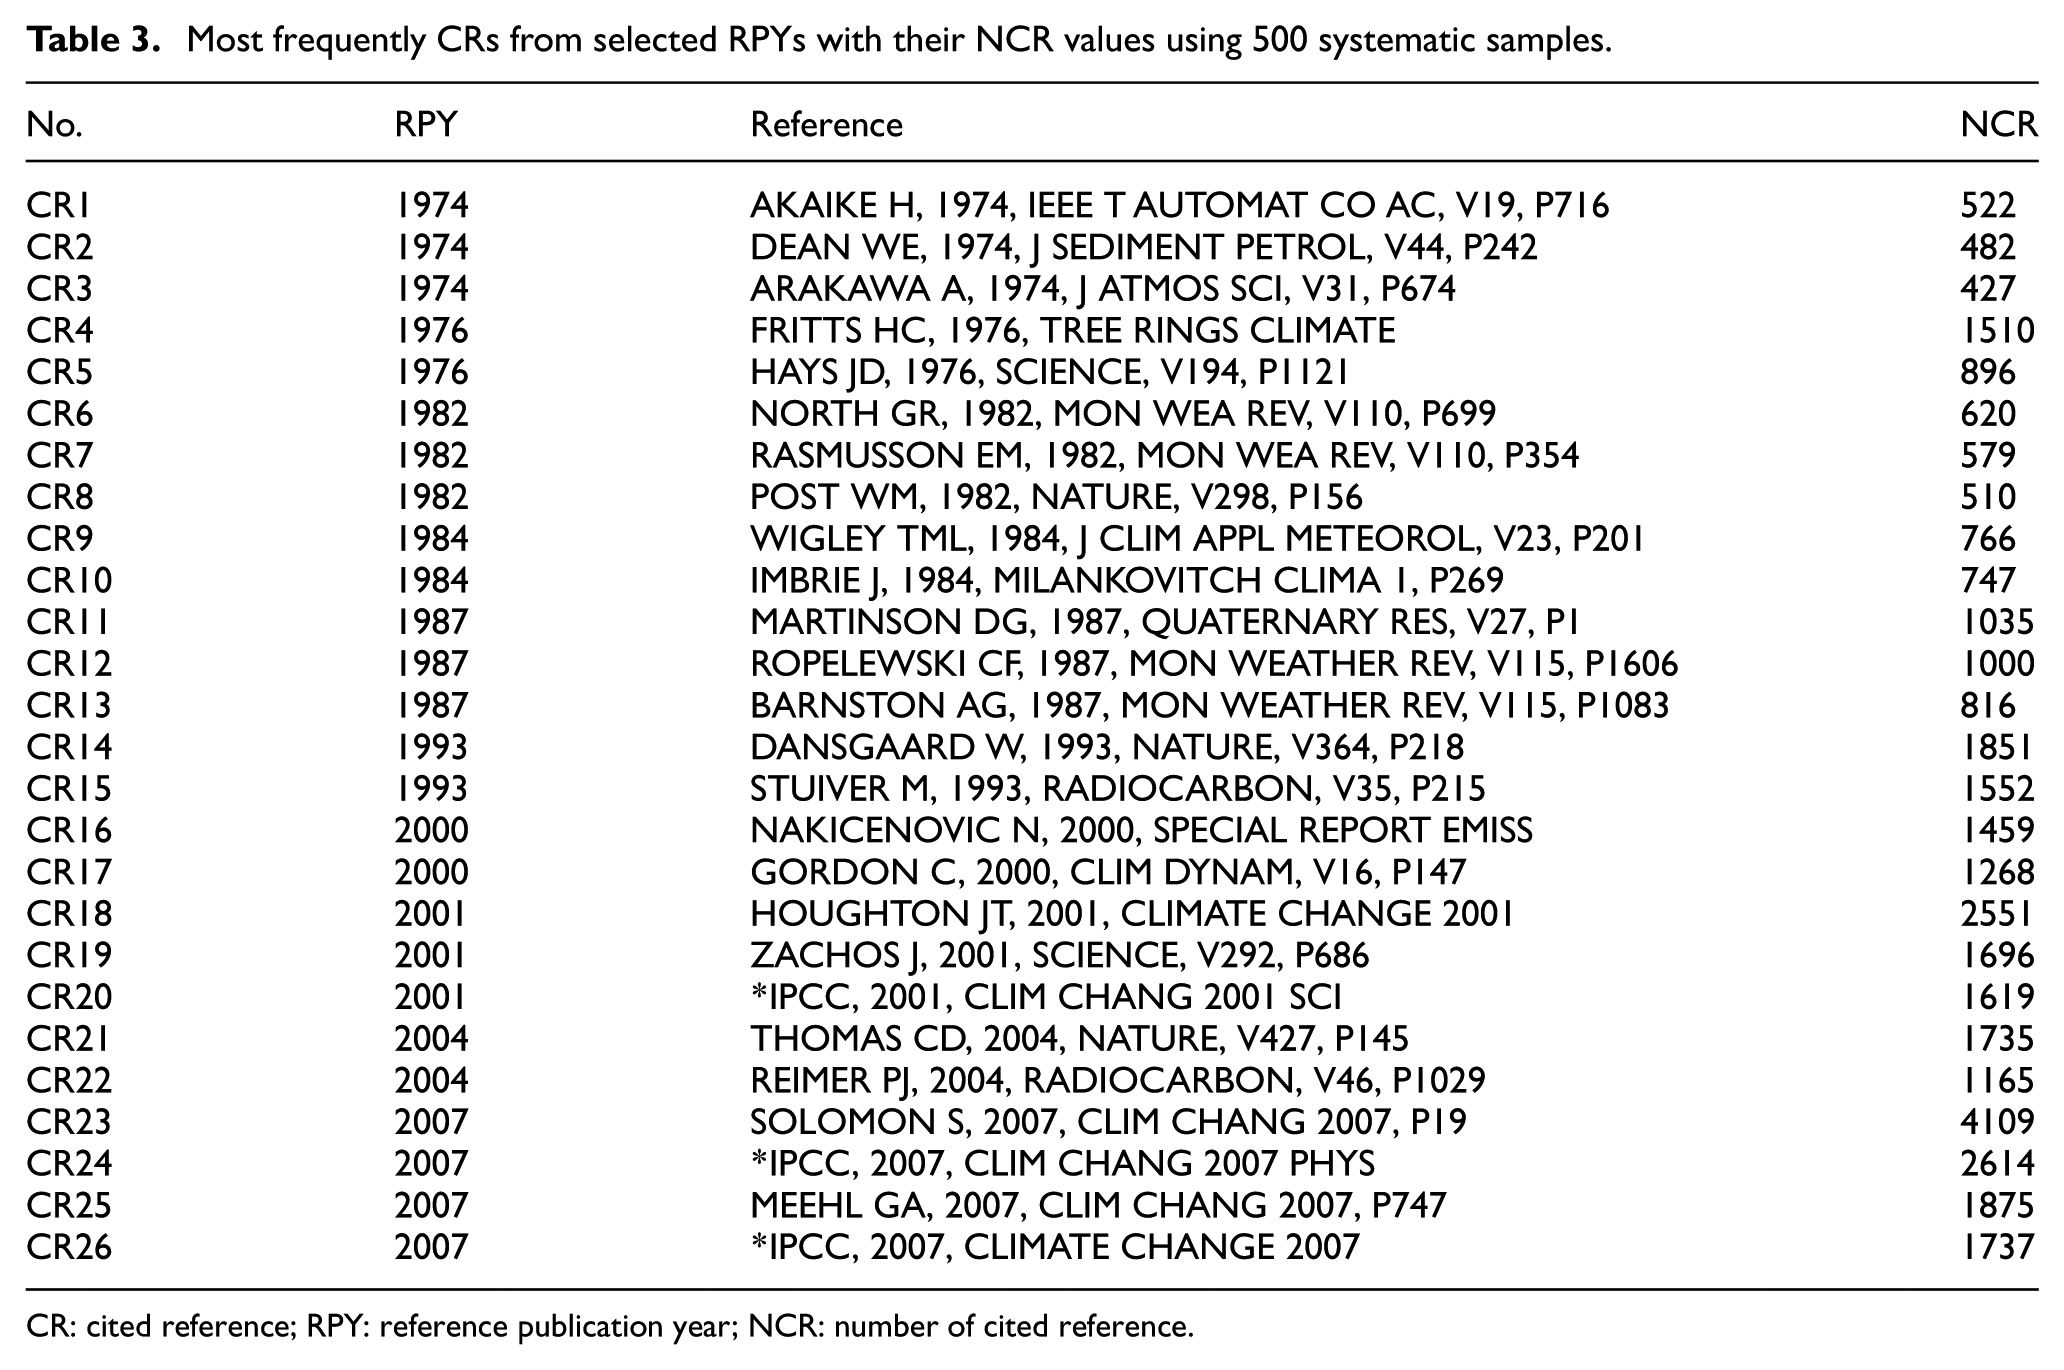
CR: cited reference; RPY: reference publication year; NCR: number of cited reference.
A comparison of Tables 1 and 3 shows that all top papers of the population RPYS also appear as top papers in the RPYS from 500 systematic samples. Only the order of the top papers is different for RPYs 1987 and 1993. The ordering of the top papers is the same as in the population RPYS for all other RPYs. Even the NCR agrees quite well in most cases. Mainly, the reference Stuiver M, 1993, is significantly underestimated in terms of the NCRs. It seems from our results that the systematic sampling with 500 samples each can be used to approximate the population spectrogram very well.
3.5. Using the script language for random and systematic sampling
The script language can be extended using the Java programme language. Every user can expand the capabilities of the CRExplorer by writing such extensions. One CRExplorer extension is available at https://github.com/andreas-thor/cre/blob/master/crs/packages/Loop.crs:
Most functions from Listing 2 were already explained in the comments regarding Listing 1. The extension
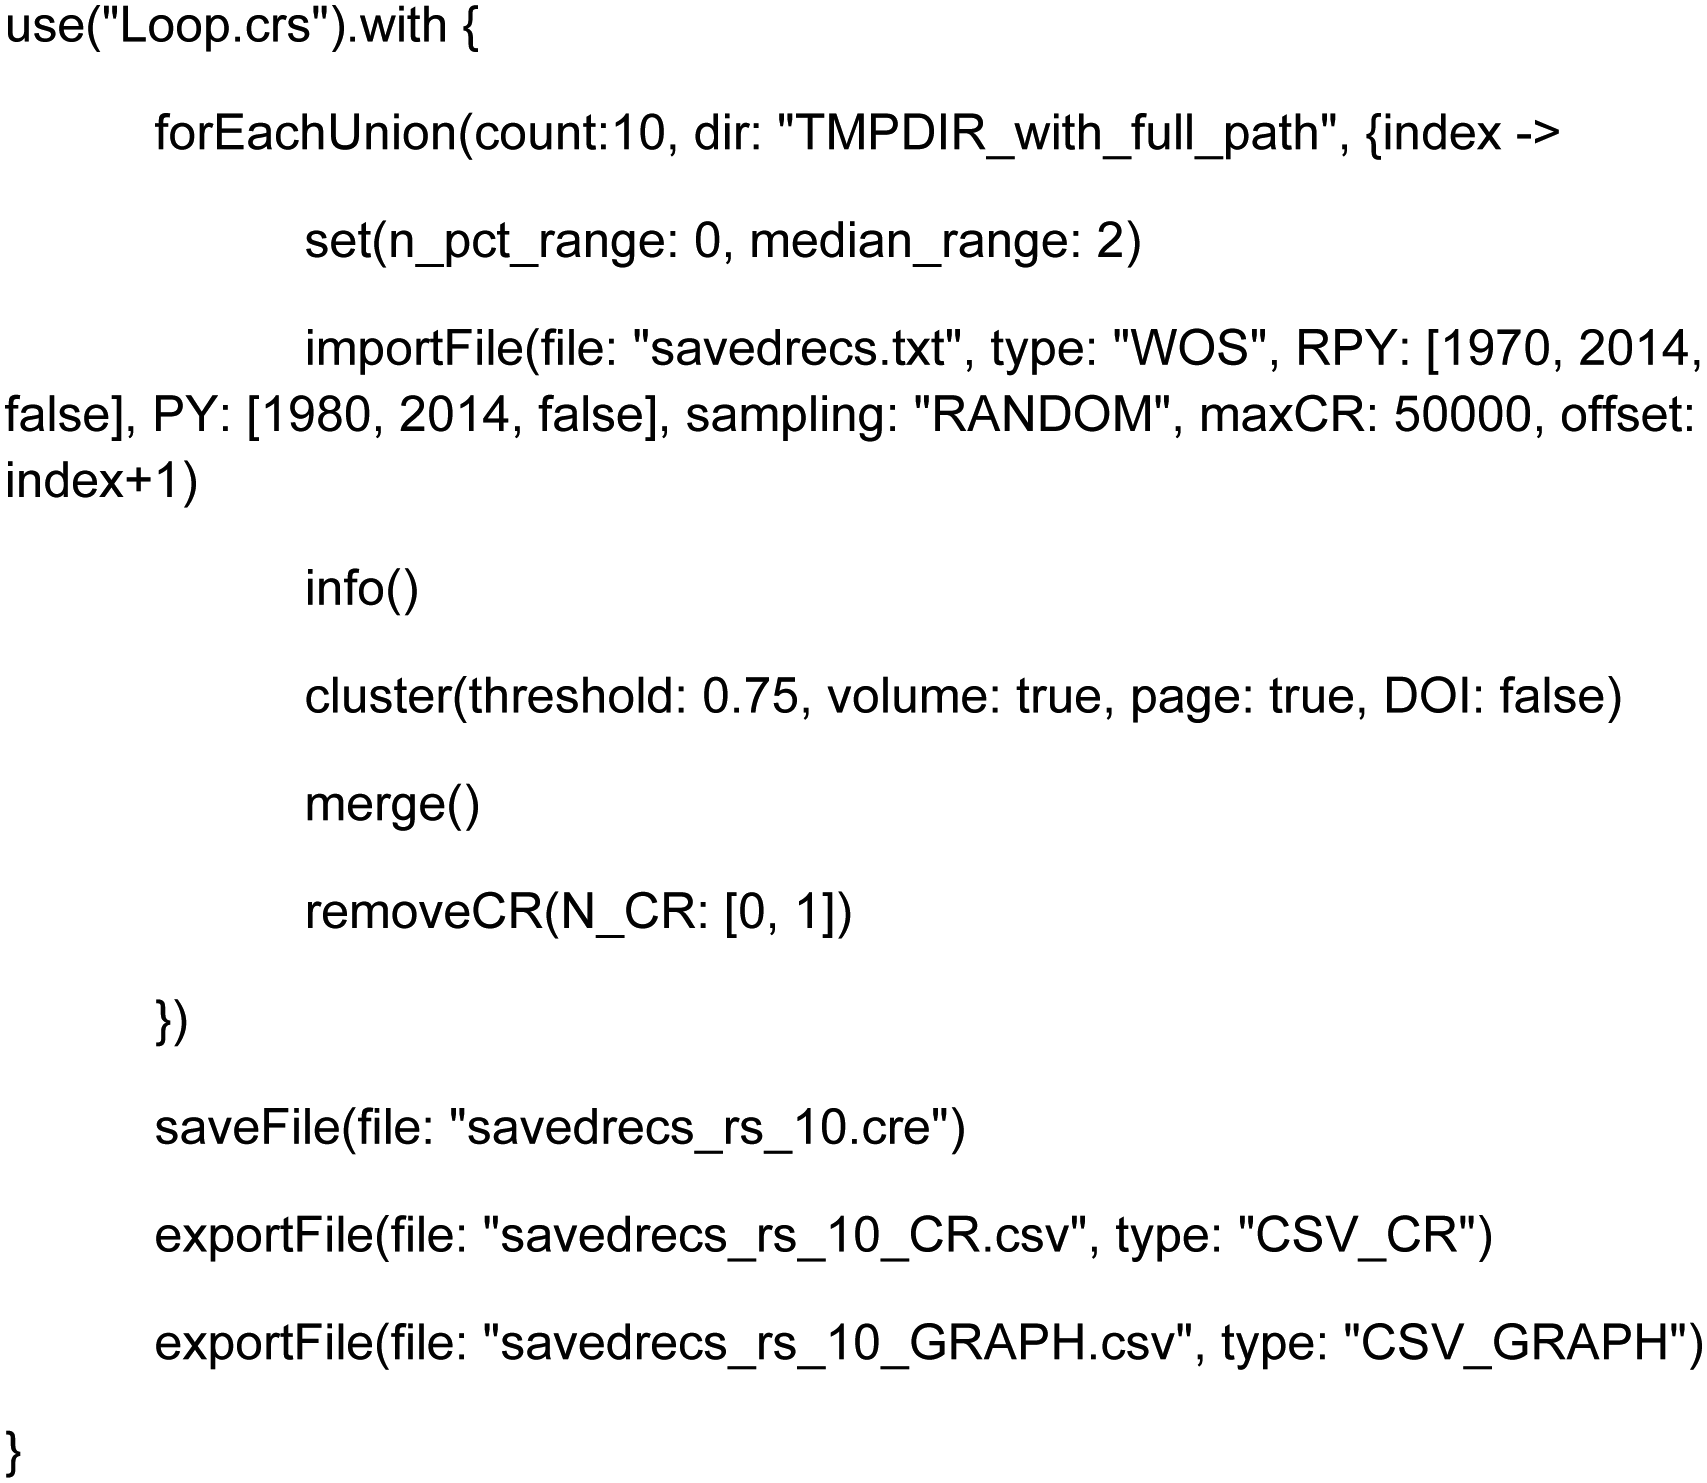
CRExplorer script to analyse 10 random samples of 50,000 CRs from the WoS file savedrecs.txt.
The argument
We conducted a series of merging tests determining the number of samples we were able to merge with a certain amount of RAM. The results are shown in Table 4. However, the number of samples and the amount of RAM should be seen as guiding values as they may differ between publication set types and sampling methods. Especially, the values obtained for the random sampling of course strongly depend on the random samples drawn.
Amount of RAM necessary to merge a certain number of samples with 50,000 cited references each.
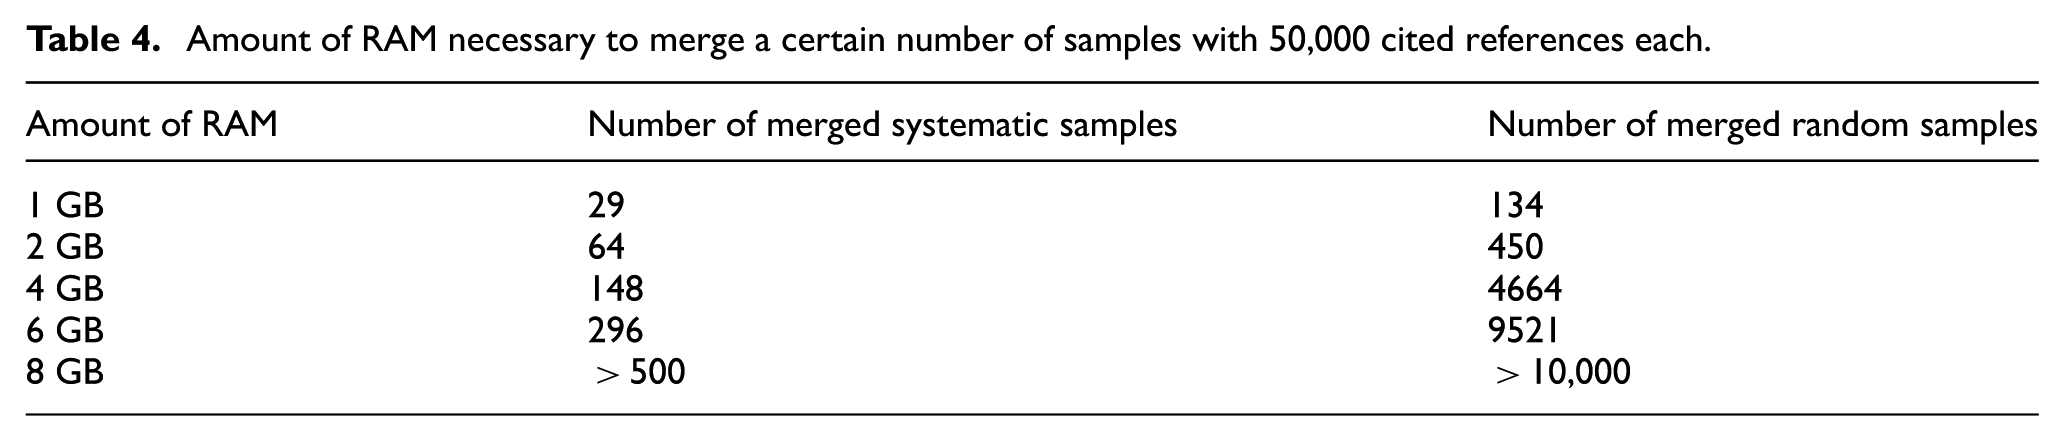
Suppose the user has less than 8 GB of RAM available but still would like to merge 500 systematic samples of 50,000 CRs each, one can also merge in batches, for example, merging four batches of 125 samples each is possible with 4 GB RAM. However, the resulting CR variants might differ somewhat as they might be determined differently in the various merging steps. In the case of cluster sampling, 2 GB were enough to analyse the publication year 2011 and it was possible to process the publication year 2014 with 4 GB RAM.
The function

The number of CRs of each sample (NCRsample) and of the population (NCRfull) can be determined via the function

3.6. Cluster sampling
For cluster sampling, the CRExplorer randomly selects 1 year from the given set of citing publication years. Then, all CRs from the papers in this year are selected and imported. As an exploration of the cluster sampling, we used the publication years 2011, 2012, 2013 and 2014 and compared the corresponding spectrograms with the population spectrogram (see Figure 6). All cluster sample spectrograms in the figure resemble only the peak in 2007 quite well. No other peak is reproduced properly. The shoulder in 2009 is much too pronounced in the cluster sampling RPYS results in comparison with the population spectrogram.
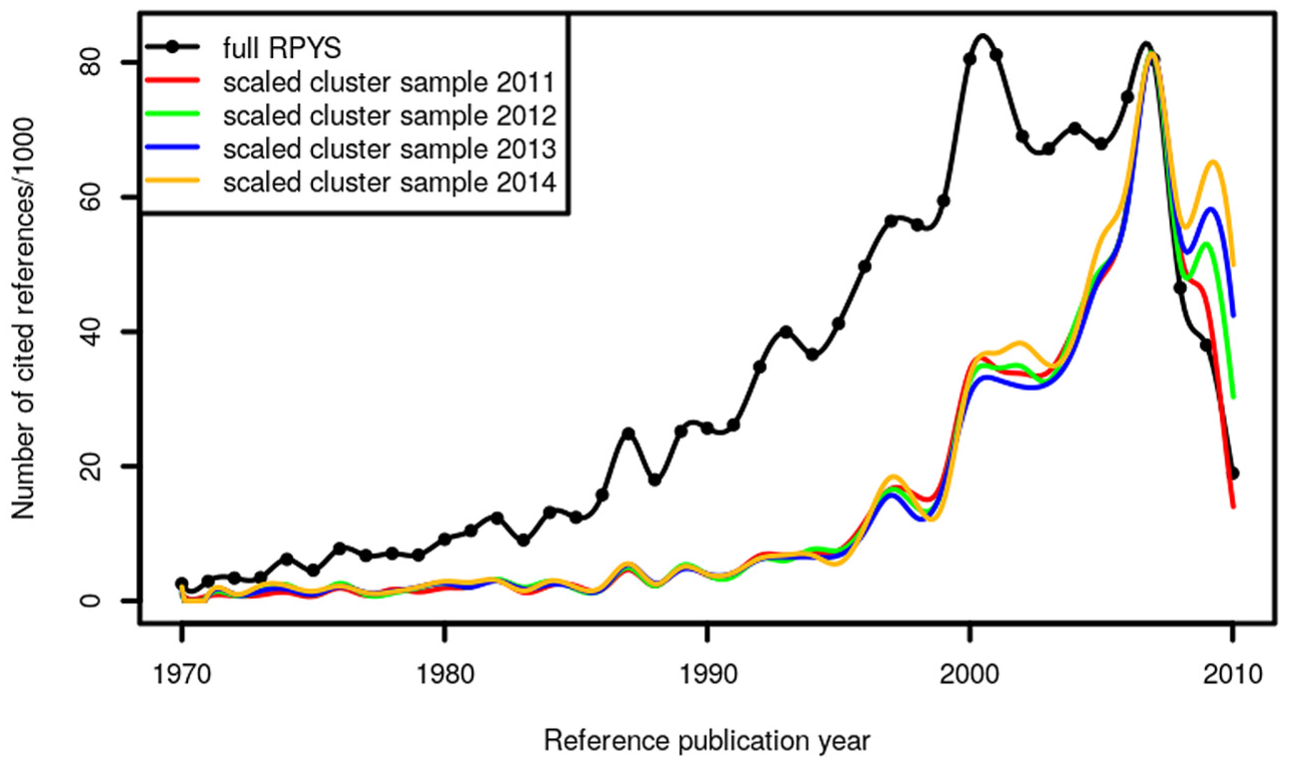
Annual distribution of cluster samples of the CRs throughout the period 1970–2010 which have been cited in climate change publications (published between 2011 and 2014).
It seems from these results that the cluster sampling should not be recommended for RPYS. It should be explored in future studies, whether the cluster sampling approach is appropriate for other publication sets. We could imagine, for instance, that this approach is feasible for research topics that have been started only a few years ago. In these cases, the CRs in the single citing years might be so uniform that the cluster sampling could work.
3.7. Using the script language for cluster sampling
The cluster sampling was performed using CRExplorer scripts like the one in Listing 3. First, the CRs of the citing year 2011 were imported into the CRExplorer. Second, the CRs were clustered using volume and page number but not DOI. Third, the equivalent CRs were merged. Finally, CRs that are referenced 15 times or less were removed from the data set, and the resulting CRE and CSV files were saved.
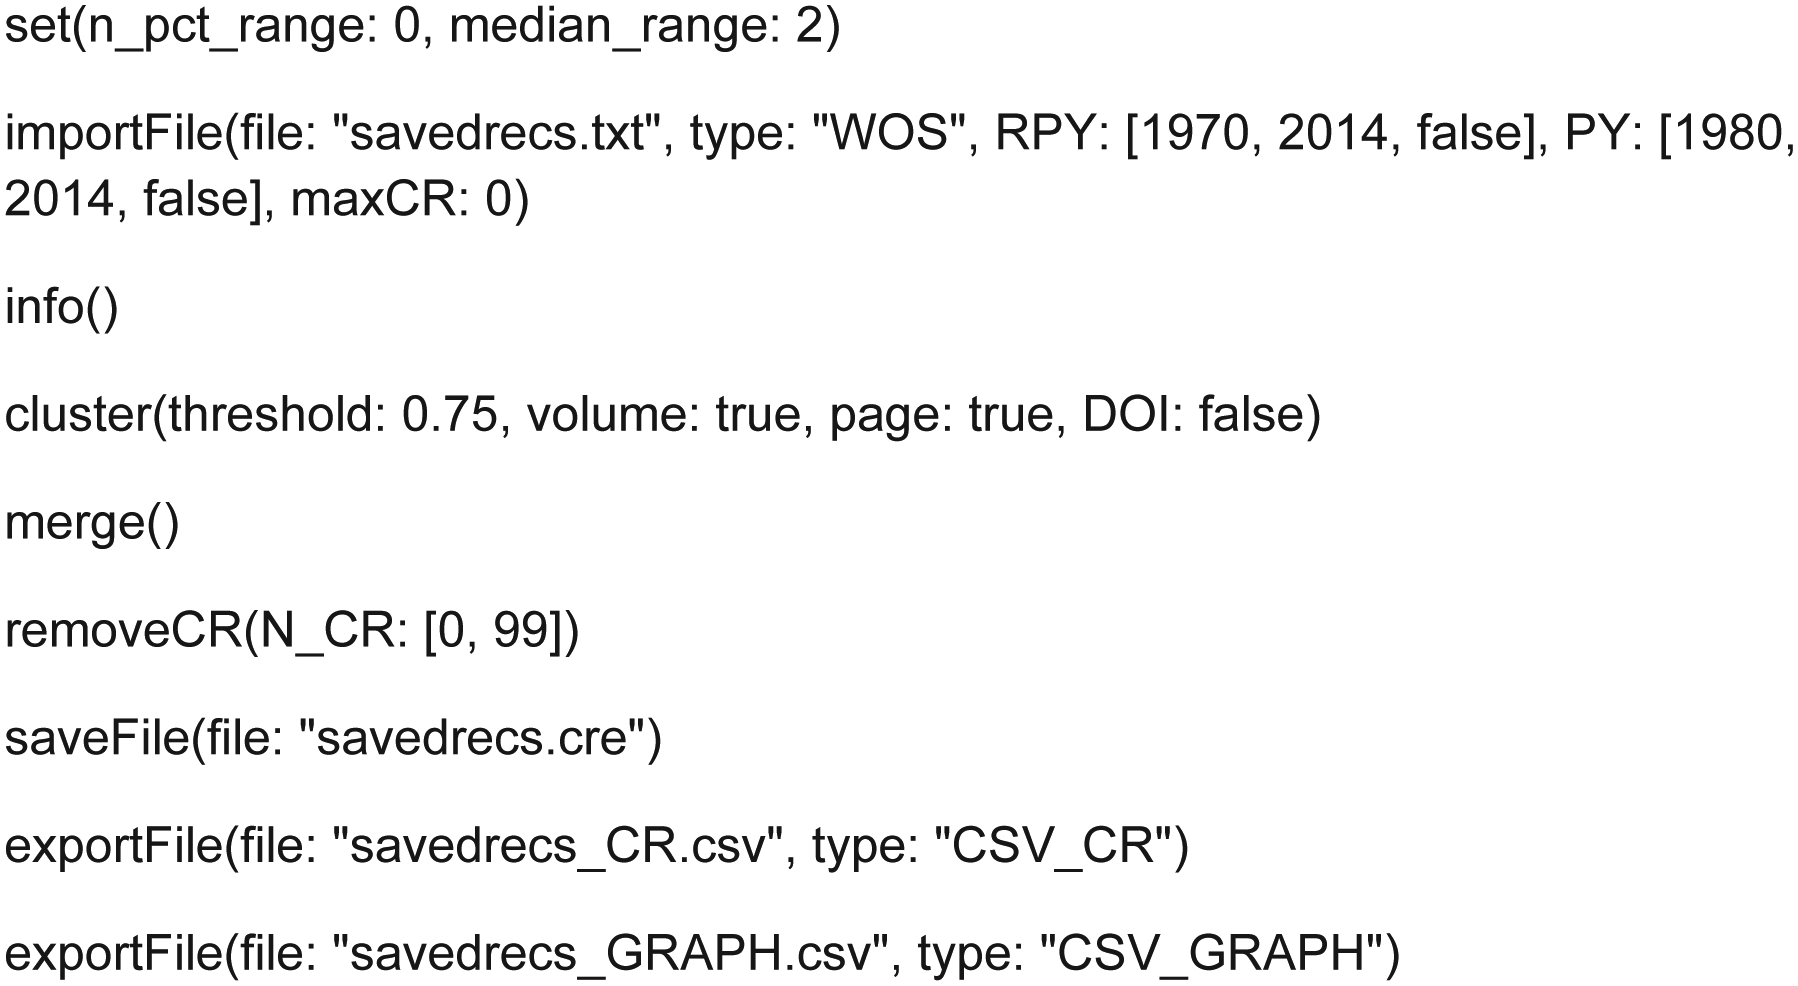
CRExplorer script to perform a cluster sample from the WoS file savedrecs.txt.
In this study, we selected the publication year specifically in order to use the appropriate number of CRs to be removed after merging according to our proposed rule of thumb (see section 3.7). Alternatively, one can use
4. Discussion and conclusion
Since the introduction of the RPYS method (and the corresponding programme CRExplorer), many studies have been published revealing the historical roots of topics, fields and researchers [4–15]. The application of the method was restricted up to now by the available memory of the computer used for running the CRExplorer. This meant that many users could not perform RPYS for broader research fields or topics. In this study, we present various sampling methods to solve this problem. The study therefore demonstrates the fruitfulness of the sampling approach for bibliometric studies. Some comments following the paper by Williams and Bornmann [7] questioned the usefulness of this approach for bibliometric studies.
The statistical analysis of large data sets with the CRExplorer becomes more prevalent, since it has become possible with the new programme version to import data from CrossRef (see https://www.crossref.org). The user of CrossRef gains free access to meta-data of publications that can be (1) downloaded as files and imported in the CRExplorer or (2) directly imported by using the CRExplorer search interface for CrossRef data. Especially the use of the search interface allows fast access on comprehensive CR data from publications.
In this study, we introduce the script language of the CRExplorer, which can be used to draw many samples from the population data set (see also the handbook of the programme at www.crexplorer.net). The language can be applied instead of using the menus in the programme. Script languages are standard in statistical software to automate the process of empirical analysis. Once a script has been produced for a given data set, the script can be used for further similar data sets. Scripts fulfil an important function in the replicability and reproducibility of empirical studies. If script, data set and programme for a published study are available, the results in the manuscript can be reproduced (and possible errors identified). Although replicability and reproducibility are essential components of the open science movement [16], scripts are scarcely available for popular bibliometric software, such as VOSviewer or CitNetExplorer. The script language of the CRExplorer improves reproducibility and replicability of RPYS analyses. Unfortunately, only a minority of journals explicitly welcomes replication studies, according to Yeung [17]. Furthermore, performing the same (or an analogous) action multiple times (e.g., drawing 10,000 samples) is made feasible via the script language of the CRExplorer.
Based on a large data set of publications from climate change research, we compare RPYS results using population data with RPYS results using sampling data. We show RPYS results for three different sampling techniques: random sampling, systematic sampling and cluster sampling. From our comparison with the full RPYS (population spectrogram), we conclude that the cluster sampling performs worst and the systematic sampling performs best. The random sampling also performs very well but not as well as the systematic sampling. Merging 500 systematic samples of 50,000 CRs each reproduces the population RPYS rather accurately, and also the same peak CRs are found in the sampled spectrogram as in the population spectrogram. Merging 10,000 random samples also results in the same peak CRs as obtained from the population RPYS results.
It is unknown if our findings can be transferred to other research fields than climate change. Studying different publication sets might make it necessary to increase the sample sizes or the number of samples drawn, or it might be possible to obtain good RPYS results with smaller sample sizes or number of samples. We would like to encourage other studies to check which sample sizes and number of samples are needed to approximate the population spectrogram accurately enough.
Footnotes
Declaration of conflicting interests
The author(s) declared no potential conflicts of interest with respect to the research, authorship, and/or publication of this article.
Funding
The author(s) received no financial support for the research, authorship, and/or publication of this article.