
Abstract
There is an established research agenda on dissecting an article’s components and their association with a journal’s prestige. However, journals’ titles and their overview, aim and scope (i.e. journal’s mission statement – JMS(s)) have not been investigated with the same diligence. This study aims to conduct a comprehensive outlook of titles and JMSs’ lexical structure and identify significant differences between journals prestige and type of access and their JMS content in the field of business, management and accounting (BMA), considering the field’s experience in developing and applying mission statements. Titles and JMSs’ structural analysis reflected current and critical discussion in BMA: a predilection for counterintuitive findings and information and communication technology (ICT) tools. JMSs expressed primarily target customers and markets. JMSs from reputable journals showed a higher betweenness for key-terms related to rigorous features. In contrast, JMSs of lower reputable journals highlighted indexing attributes. The Wilcoxon rank-sum and the Kruskal–Wallis tests showed significant differences in the JMSs’ median diversity regarding the journal’s type of access and best quartiles.
1. Introduction
How should we name our new journal? What could be the title, statement and scope differentiation content to brief our audience? Are those features described clearly and richly enough? Bottom line, does all of that have any association with bibliometric performance (output and citations)? Leading journals (e.g. Scientometrics, Journal of Information Science,Academy of Management Journal, or Research Policy) possess a cemented cumulative advantage [1], and these questions are not vertical priorities for their editors and administrators. Granted, publishing space in such journals is scarce, especially for researchers outside premier institutions in developing countries [2–4]. However, the landscape has been changing. Between 2019 and 2020, the bibliographic database Scopus added 820 new journals [5,6]. Six percent of the journals were classified into the subject area of business, management and accounting (BMA) [5,6]. While new periodicals are emerging, readers and authors are eager to look around for journals with a clear and attractive title and statement/scope that eventually will catch or fit their attention, research interests and subsequent use [7].
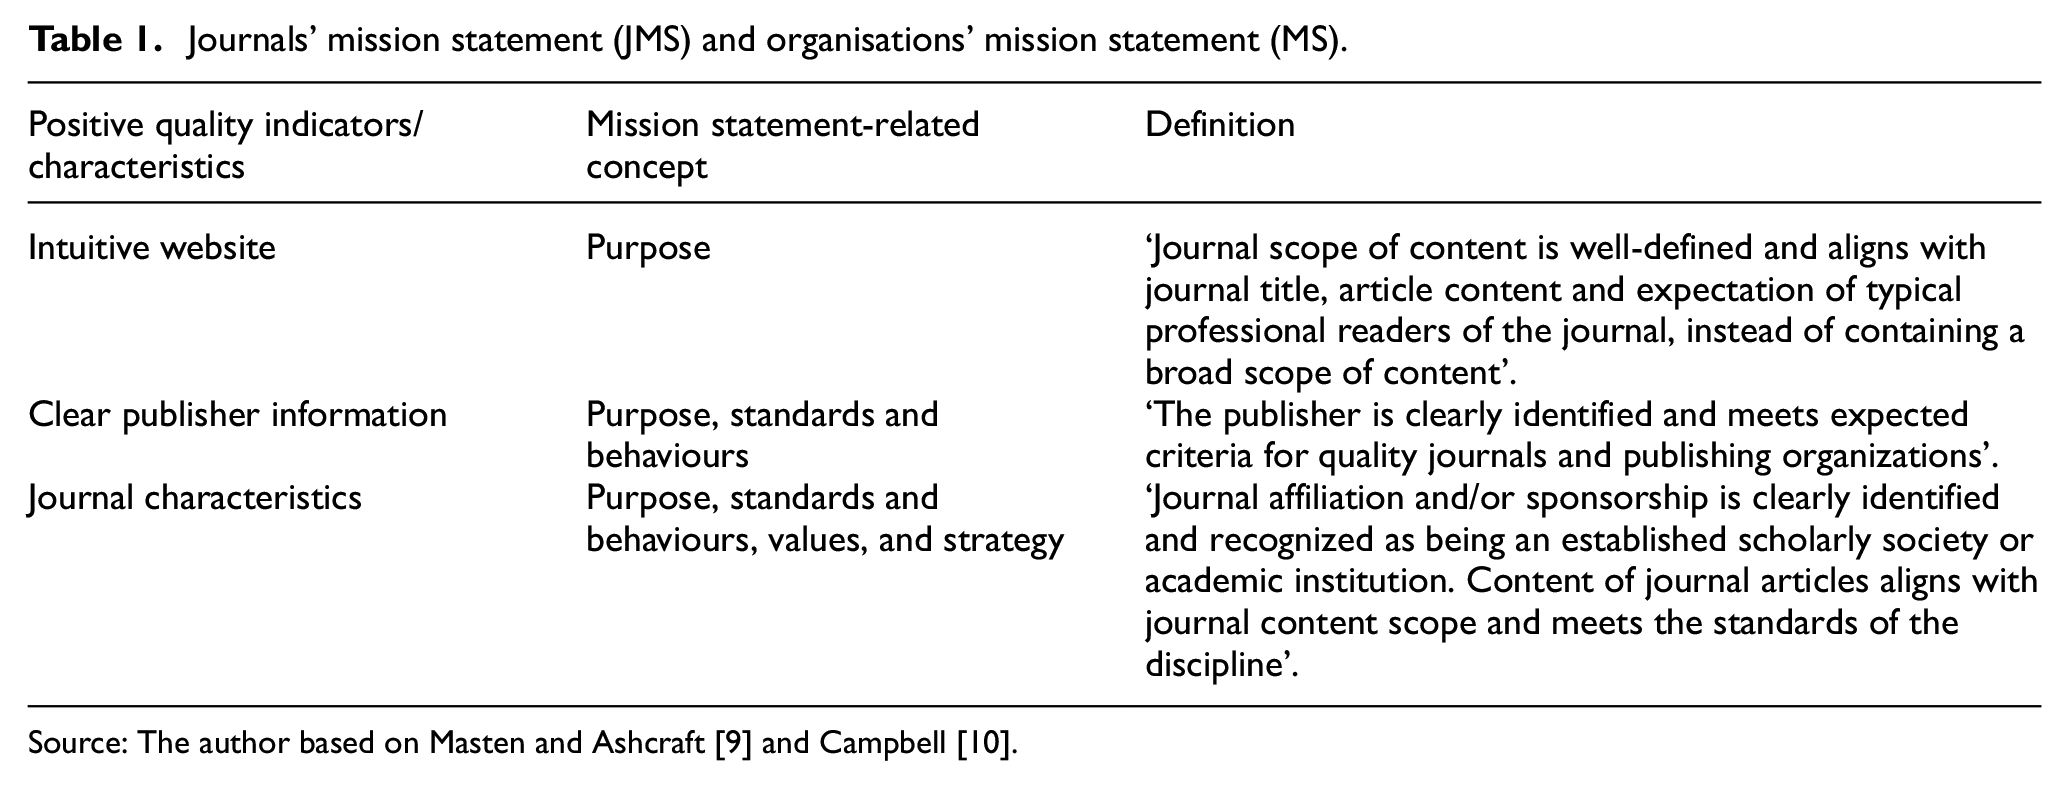
When it comes to choosing a journal probably to publish a researcher’s work from developing countries, some shortcuts can be considered – looking at journal rankings [6], indexation [8] or manuscript-journal matching services (e.g. Elsevier’s or Wiley’s journal finder and Springer’s journal suggester). Masten and Ashcraft [9] outlined the proper characteristics to avoid predatory and identify credible journals, such as (1) intuitive website, (2) clear editor and editorial board information, (3) clear publisher information, (4) clear archiving and indexing and (5) clear identification of the journal affiliation/sponsorship. This study focuses on the factors directly related to the questions outlined at the beginning of this introduction: an intuitive website, clear publisher information and journal characteristics, hereafter a journal’s mission statement (JMS) (Table 1).
Journals’ mission statement (JMS) and organisations’ mission statement (MS).
Mission statements (MSs) originated in the United States in the 1960s as a strategic planning framework [11]. Since this time, it gradually spread among practitioners around the Western hemisphere. The MS implementation in firms and universities nurtured a fertile agenda since the 1980s [12]. Over 40 years of research on MSs and their association with organizational performance have highlighted the study of MS as the most used tool for strategic planning worldwide [13]. Therefore, considering the relevance of the study of MSs for BMA, it was considered the research field most related to MSs. It is worth mentioning that journals of other disciplines (e.g. physics) are mature and well-structured, in some cases, surpassing those just consolidating in social sciences [14,15]. Consequently, the selection of BMA over Science, technology, engineering and mathematics (STEM) disciplines is grounded on the relevance of MS research to the strategic planning field, and BMA in general, nor so in the scientific maturity (i.e. consensus) of a given discipline and its journals [16].
As mentioned, there is well-established research on MS contents and its association with organisational performance [12,13,17–28]. The MS content should express at least four key concepts, namely, purpose (why the organisation exists), values (what it believes in), standards and behaviours (the rules/norms that shape its operations) and strategy (long-term planning and pathway for achieving its purpose) [10]. Those key concepts are aligned with those of the JMS. Table 1 proposes how MSs and JMSs are interrelated (e.g. The Intuitive website content characteristic of the JMS is related with the Purpose concept of the MS, since in it ‘the journal scope of content is well-defined and aligns with journal’s title, article content and expectation of typical professional readers of the journal, instead of containing a broad scope of content’).
Among the findings related to MSs and organisational performance, it could be highlighted that MSs with central content features, such as readability (i.e. clarity and brevity), lexical diversity, among others (e.g. mention of values/beliefs, social responsibility, lack of financial goals and positive language) are positively related to financial-innovation performance in organisations [19,20,23,29–32].
In the field of informetrics, however, there is an established agenda that seeks to disentangle the relationship between articles title, keywords or abstract content (i.e. length, informativeness, accuracy, readability, presence of colons/question marks and changes over time) and their properties (i.e. length of the article and number of tables/figures), number of authors and performance (i.e. downloads or citations count) [7,33–44].
However, journal titles and JMSs are overlooked by that research stream, despite their importance in describing a journal’s main topics, history, disciplinary incidence, publication frequency, preferred epistemology (i.e. empirical or theoretical) and methods, alternative scholarly communications (e.g. letter to editors, essay and reviews), audience, geographical scope, membership, among other features. Furthermore, little research on readability and lexical diversity has been conducted, regardless of their importance for understanding the performance and reflecting credibility and communication competence in written messages [45–47].
Consequently, this study seeks to contribute to two research questions (RQs):
RQ1. How are the titles and JMSs’ content (i.e. frequent key-terms, readability and lexical diversity) structured in BMA?
RQ2. Are there significant differences between journal prestige and type of access and JMSs’ content in BMA?
Semantic networks will be used for analysing the structure of titles and JMSs. Readability and lexical diversity metrics will be used for analysing JMSs’ attributes. Titles were excluded from the latter analysis considering that titles per se are too short for exploring their lexical diversity or readability compared with JMS. On that count, this study contributes to a structural assessment of journal titles and JMS quality in terms of readability and lexical diversity. It also adds to the literature on strategic planning and scholarly communication meta-knowledge [48]. Results and open access data sets could help research institutions and editorial strategic planning activities to launch new journals or improve the JMS of existing periodicals. Following this introduction, we present the data, methods, and software used. Then, we present the discussion of the results. Finally, we outline the conclusions, limitations and further research agenda.
2. Methodology
2.1. Data
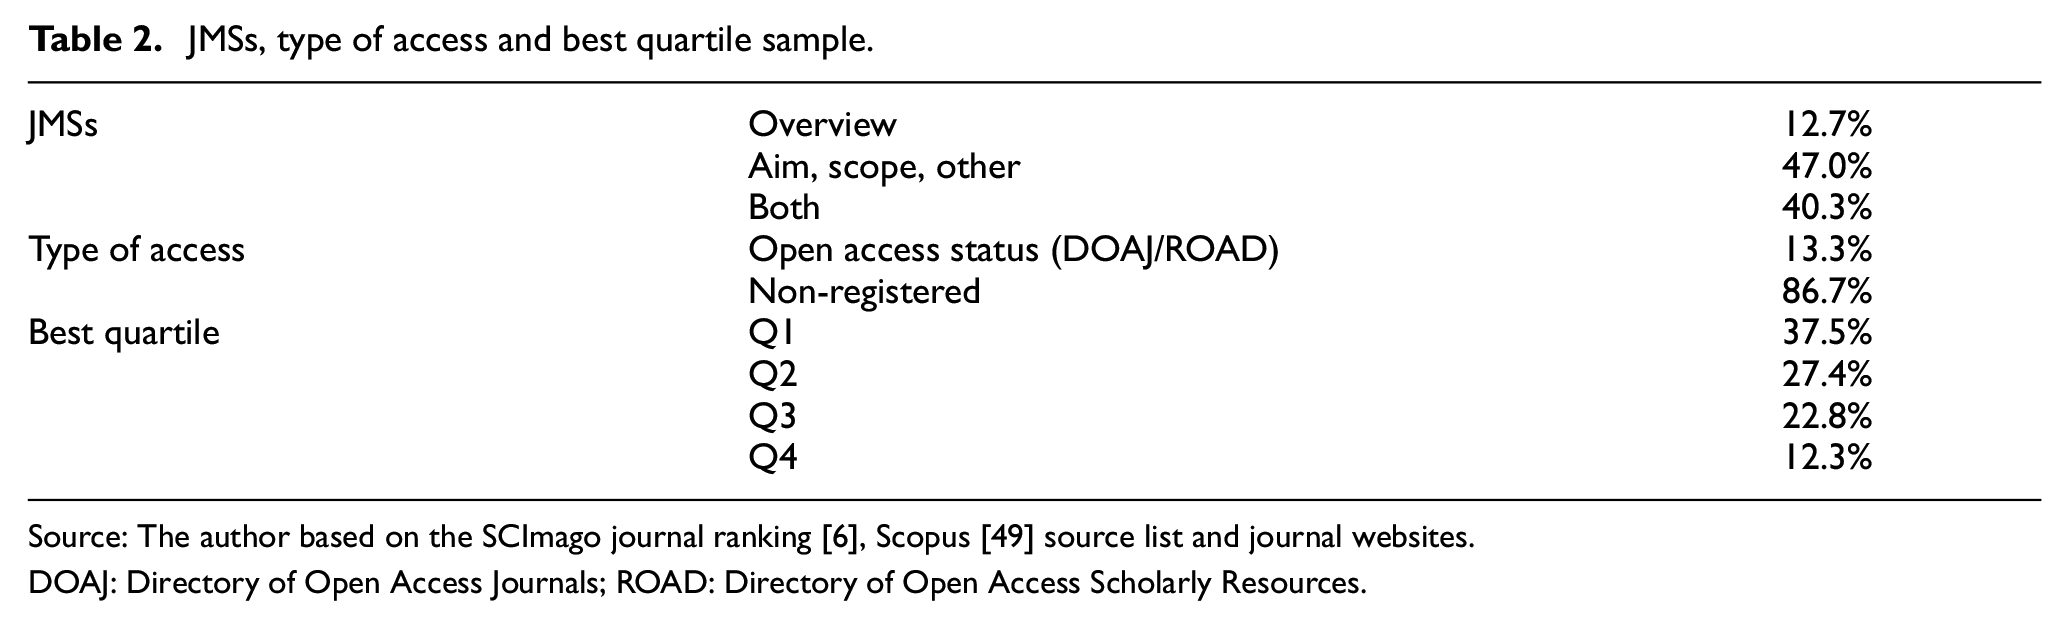
Scopus was chosen over Web of Science (WoS) [15] due to its broader journal coverage and participation of researchers from developing countries. The SCImago journal ranking [6] and the Scopus [49] source list were chosen as baseline lists for collecting the JMSs and additional information. The journals considered for the final sample were those active as of 2019 indexed in at least one of the BMA categories (i.e. accounting, business and international management, industrial relations, management information systems, management of technology and innovation, marketing, organisational behaviour and human resource management, strategy and management, tourism, leisure and hospitality, and miscellaneous). A group of three research assistants curated by hand the JMSs from the journal websites. Websites had either an overview (12.7%), additional information (e.g. journal’s aim, mission, objective and scope) (47%), or both (40.3%). When the two options related to the JMS were available, both were sourced and merged into a single JMS. The total sample was composed of 1502 JMSs.
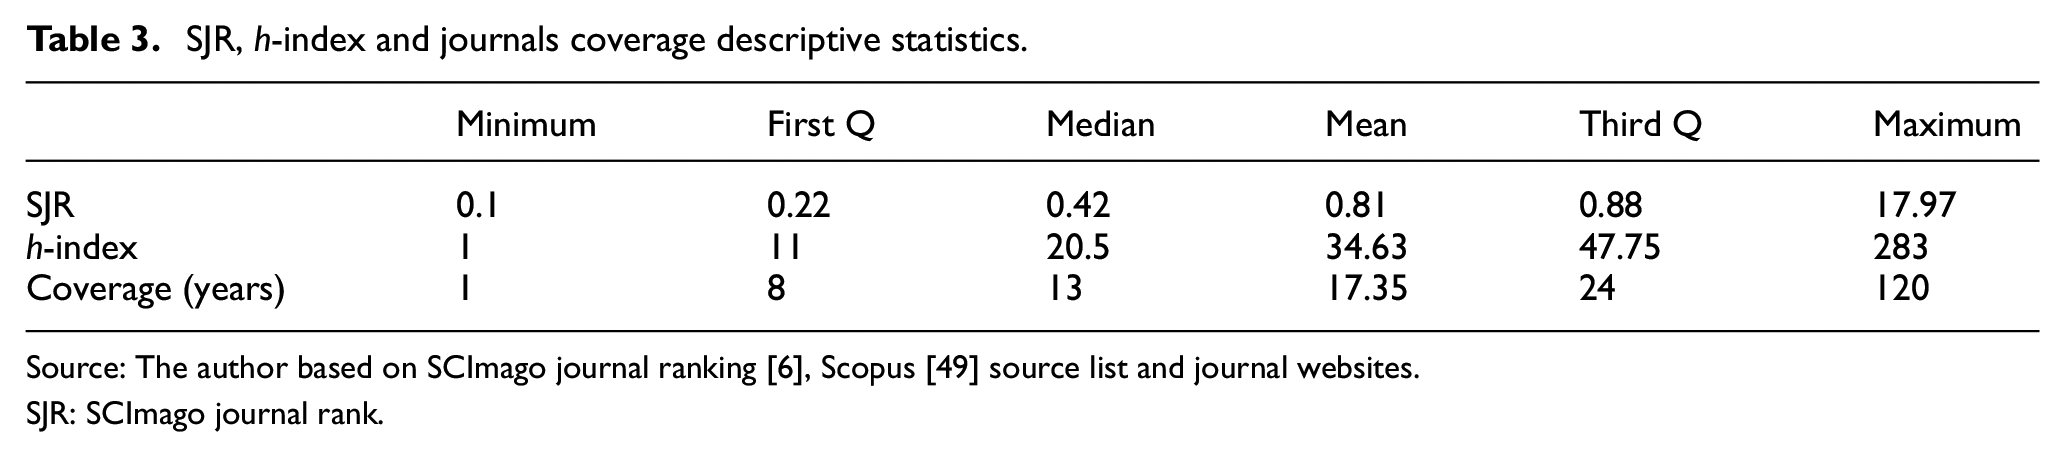
The SCImago Journal Rank (SJR) best quartiles were considered a proxy for journal prestige and bibliometric performance [50]. Type of access was classified in two statuses: registered either in the Directory of Open Access Journals (DOAJ) or the Directory of Open Access Scholarly Resources (ROAD) or non-registered [51,52], henceforth, OA and non-OA. Journals’ type of access was considered a crucial group considering the current structural changes in the scholarly communication dynamics due to the open access science agenda, particularly for countries with scarce resources to access reputable journals [53–55]. Table 2 presents JMSs, type of access, and best quartile subgrouping and its corresponding percentage. Table 3 displays descriptive statistics of the SJR, h-index and journals’ coverage. The complete data set is available in the following permanent link: https://doi.org/10.34848/FK2/WLB6EH.
JMSs, type of access and best quartile sample.
Source: The author based on the SCImago journal ranking [6], Scopus [49] source list and journal websites.
DOAJ: Directory of Open Access Journals; ROAD: Directory of Open Access Scholarly Resources.
SJR, h-index and journals coverage descriptive statistics.
Source: The author based on SCImago journal ranking [6], Scopus [49] source list and journal websites.
SJR: SCImago journal rank.
2.2. Methods and software
For the titles and JMSs’ structure, semantic network analysis was used. For the JMSs’ content analysis (i.e. readability and lexical diversity), the Flesch–Kincaid grade level and Yule’s K were employed. Semantic networks aim to examine the relationship among symbols’ shared meaning [56]. First, each journal’s title and JMS were passed to tokens (i.e. ‘(T) or that word on a single line of a single page of a single copy of a book’ [57]). Then, punctuation, stop words and little-informative words (e.g. journal) were removed. Next, a co-occurrence matrix was assembled to compute the number and direction of co-occurrences of tokens (e.g. in the last phrase, the token ‘co-occurrence(s)’ co-occurred twice with the tokens ‘matrix’ and ‘tokens’; both co-occurrences were directed from ‘co-occurrence(s)’ to ‘matrix’ and ‘tokens’). Finally, a directed-weighted semantic network was assembled based on the co-occurrence matrix. As a result, one can formally explore both the titles and JMSs’ key-terms underlying structure using network analysis metrics at the macro-, meso- and micro-levels [58].
At the macro level, the metrics considered were density and average path length, at the meso level, modularity and betweenness centrality at the micro level. Density indicates how connected the title and JMS key-terms are (i.e. the number of connections that exist compared with the number of potential connections that could exist). The equation for the density calculation is (source: Scott [59])

where L is the number of links, and n is the number of nodes. The average path length illuminates the average number of steps along the shortest path for every pair of nodes (i.e. key-terms) in a network. It can also be understood as a measure of information flow efficiency (i.e. the closer to 1, the more efficient). The equation for the average path length calculation is (source: Gozzard et al. [60])

where

where gij is the shorter path that links nodes pi, and gij (pk) is the shorter path that links nodes pi and pjpk. The higher the value, the higher its betweenness.
Readability indices compute the clarity of texts intending to drop unnecessary complexities. One of the most used indices is the Flesch–Kincaid grade level (FKGL) [63]. It approximates the American school equivalent grade needed to comprehend a given text at the first reading [64]. For instance, this paragraph’s FKGL is 9, meaning a person of about 15–16 years would understand it with no difficulty. The equation for the FKGL calculation is (source: Kincaid et al. [64])

where 0.39, 11.8 and −15.59 values are the FKGL equation’s constants.
Based on Twedie and Baayen’s [65] review on the assessments of the lexical richness of texts, Yule’s (65) K was considered for analysing lexical diversity. The larger the Yule’s K result, the more repeated words and less vocabulary richness was detected in a text. Conversely, the lower the results, the higher the lexical diversity. For instance, one of the highest Yule’s K for a JMS in the sample was: ‘The International Journal of Educational Organization and Leadership inquiries into the nature and processes of effective educational administration and leadership’. The equation for calculating Yule’s K is (source: Yule [66])

where 104 value is a Yule’s K constant.
3. Results
The median number of characters for journal titles and JMSs was 35 and 1952, respectively. Short journal titles (i.e. three characters) such as 4OR become informative once one visits its website (4OR: Quarterly Journal of Operations Research); otherwise, it is not. Journals with the median number of characters, such as Journal of Accounting and Economics or European Sport Management Quarterly, provide more helpful information for readers/authors. An example of a JMS with the median number of characters is that of Biotechnology Law Report (i.e. 159 characters), which states: ‘Delivering critical, authoritative analysis of biotech patents and litigation, regulatory and legislative activity, and trade-related aspects of biotechnology’. Also, there is no significant correlation between journal titles and JMSs’ character length (r = −0.039; n = 1,502; p = 0.12). Thus, excessively short journal titles are not always accompanied by a larger or a comprehensive and informative JMS.
Figure 1 presents the titles semantic network layout, top-20 frequent key-terms and network metrics. A random directed-network with the same number of nodes (n = 608; wiring probability = 0.05) was generated as a comparing benchmark (i.e. density = 0.025, average path length = 2.56, clusters = 11 and modularity = 0.152). The same was done for the following two JMSs’ networks. Compared with the random network, the titles’ network showed a lower density, similar average path length and higher modularity.
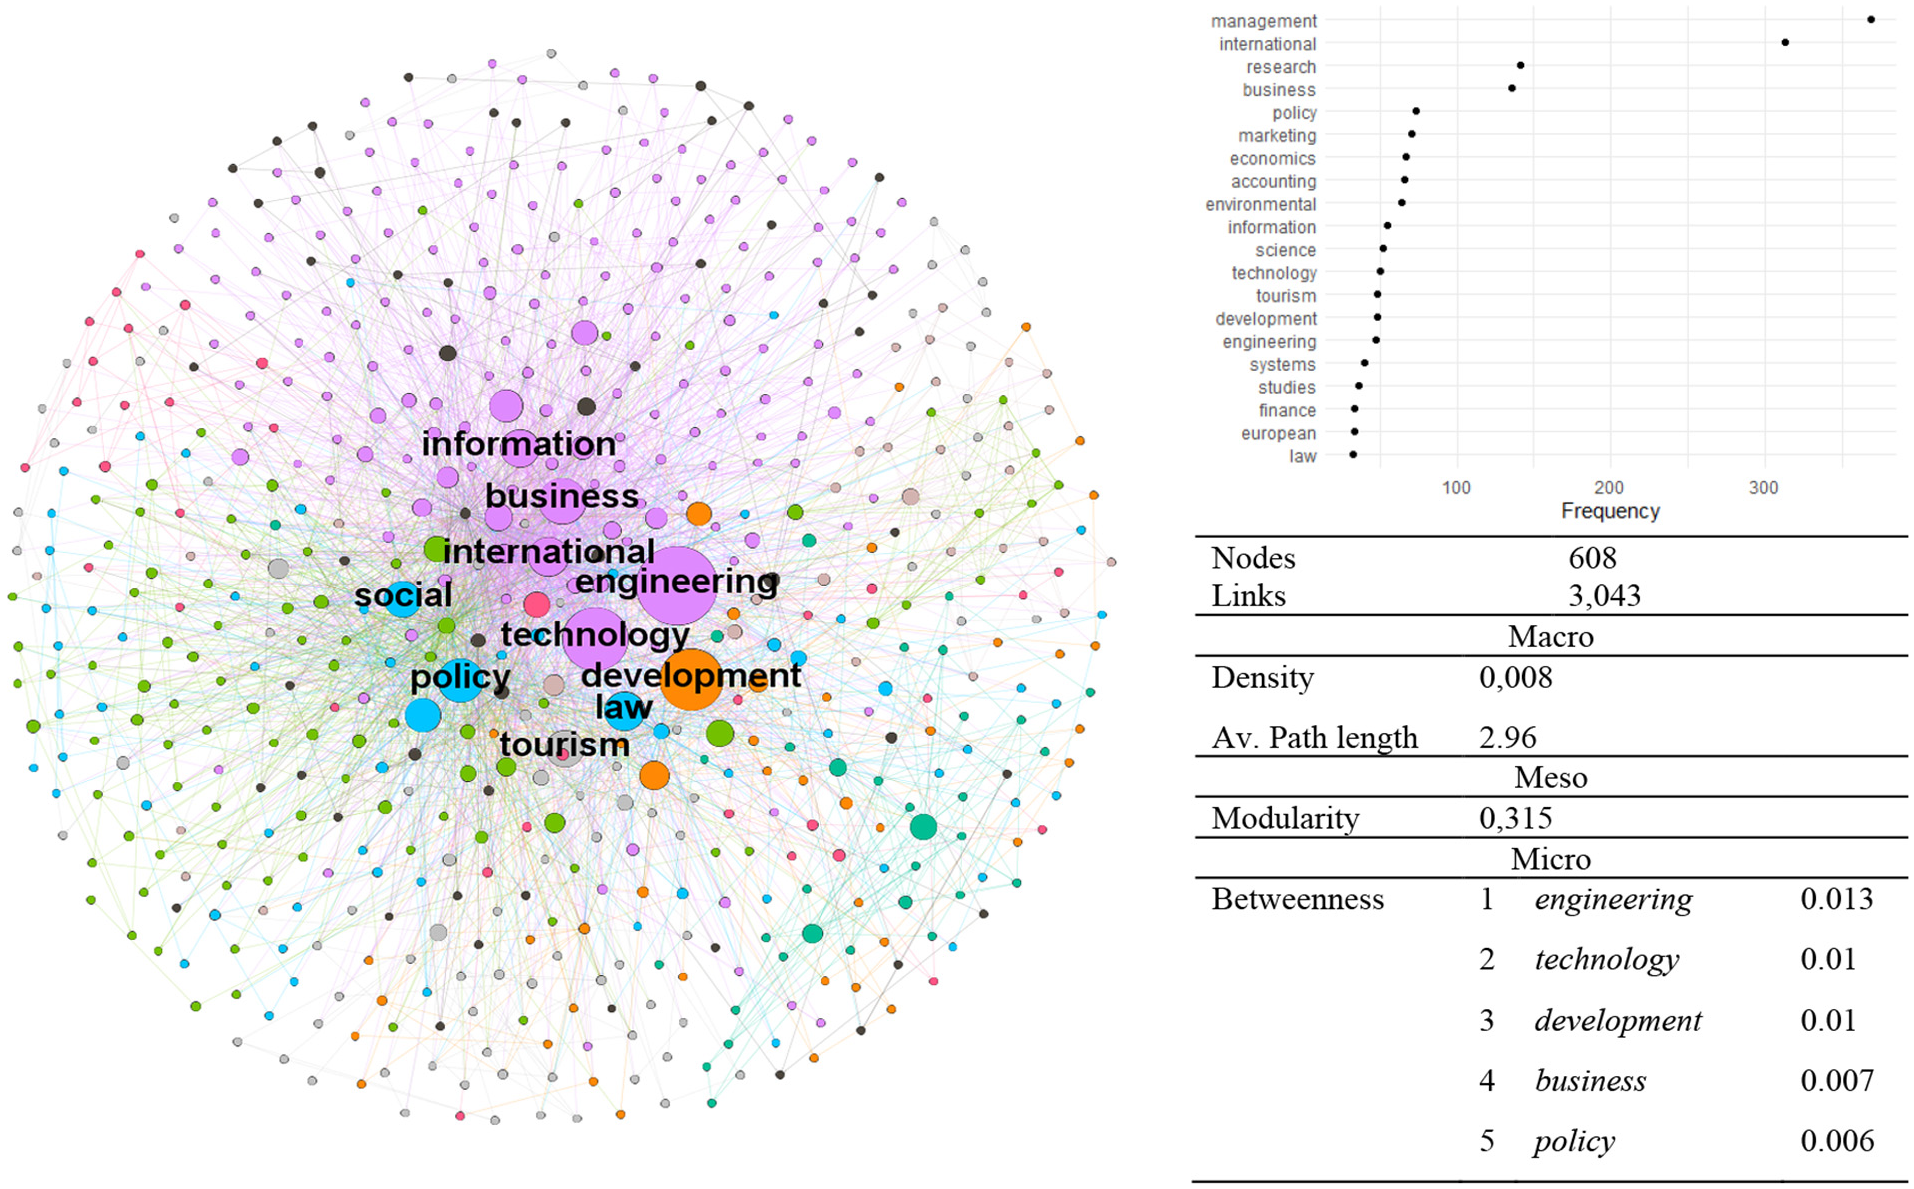
Semantic network – titles (left side); top-20 most frequent tokens (top-right); macro, meso, micro (top-5) metrics table (bottom-right). Network layout algorithm: Fruchterman and Reingold [71].
The average path length shows that any key-term would have to contact ≈3 key-terms on average to reach another key-term. Modularity algorithm [61] identified 21 clusters, although three clusters grouped ≈60% of the key-terms: pink (32%) related to marketing and strategic and supply chain management; green (22.2%) related to economics and finance; blue (13.3%) related to sustainability sciences. The modularity score suggests a higher interconnection within clusters and loose connections between clusters. Journal titles contain each field’s distinctive jargon/language and share it moderately with other BMA fields. Key-term bridges between clusters are not strictly from BMA, such as the cases of engineering (e.g. Nuclear Engineering and Design; Ecological Engineering; Journal of Water Process Engineering), technology (e.g. Bioresource Technology; Journal of Quality Technology; Journal of Hospitality and Tourism Technology) or development (e.g. Entrepreneurship and Regional Development; Energy for Sustainable Development; Career Development Quarterly). They seem to establish comprehensive dialogues between (sub)fields.
Due to processing restrictions and contrasting JMSs of highly reputable and emerging journals, Figures 2 and 3 present JMSs’ analysis of the top and bottom 10% journals according to their SJR.
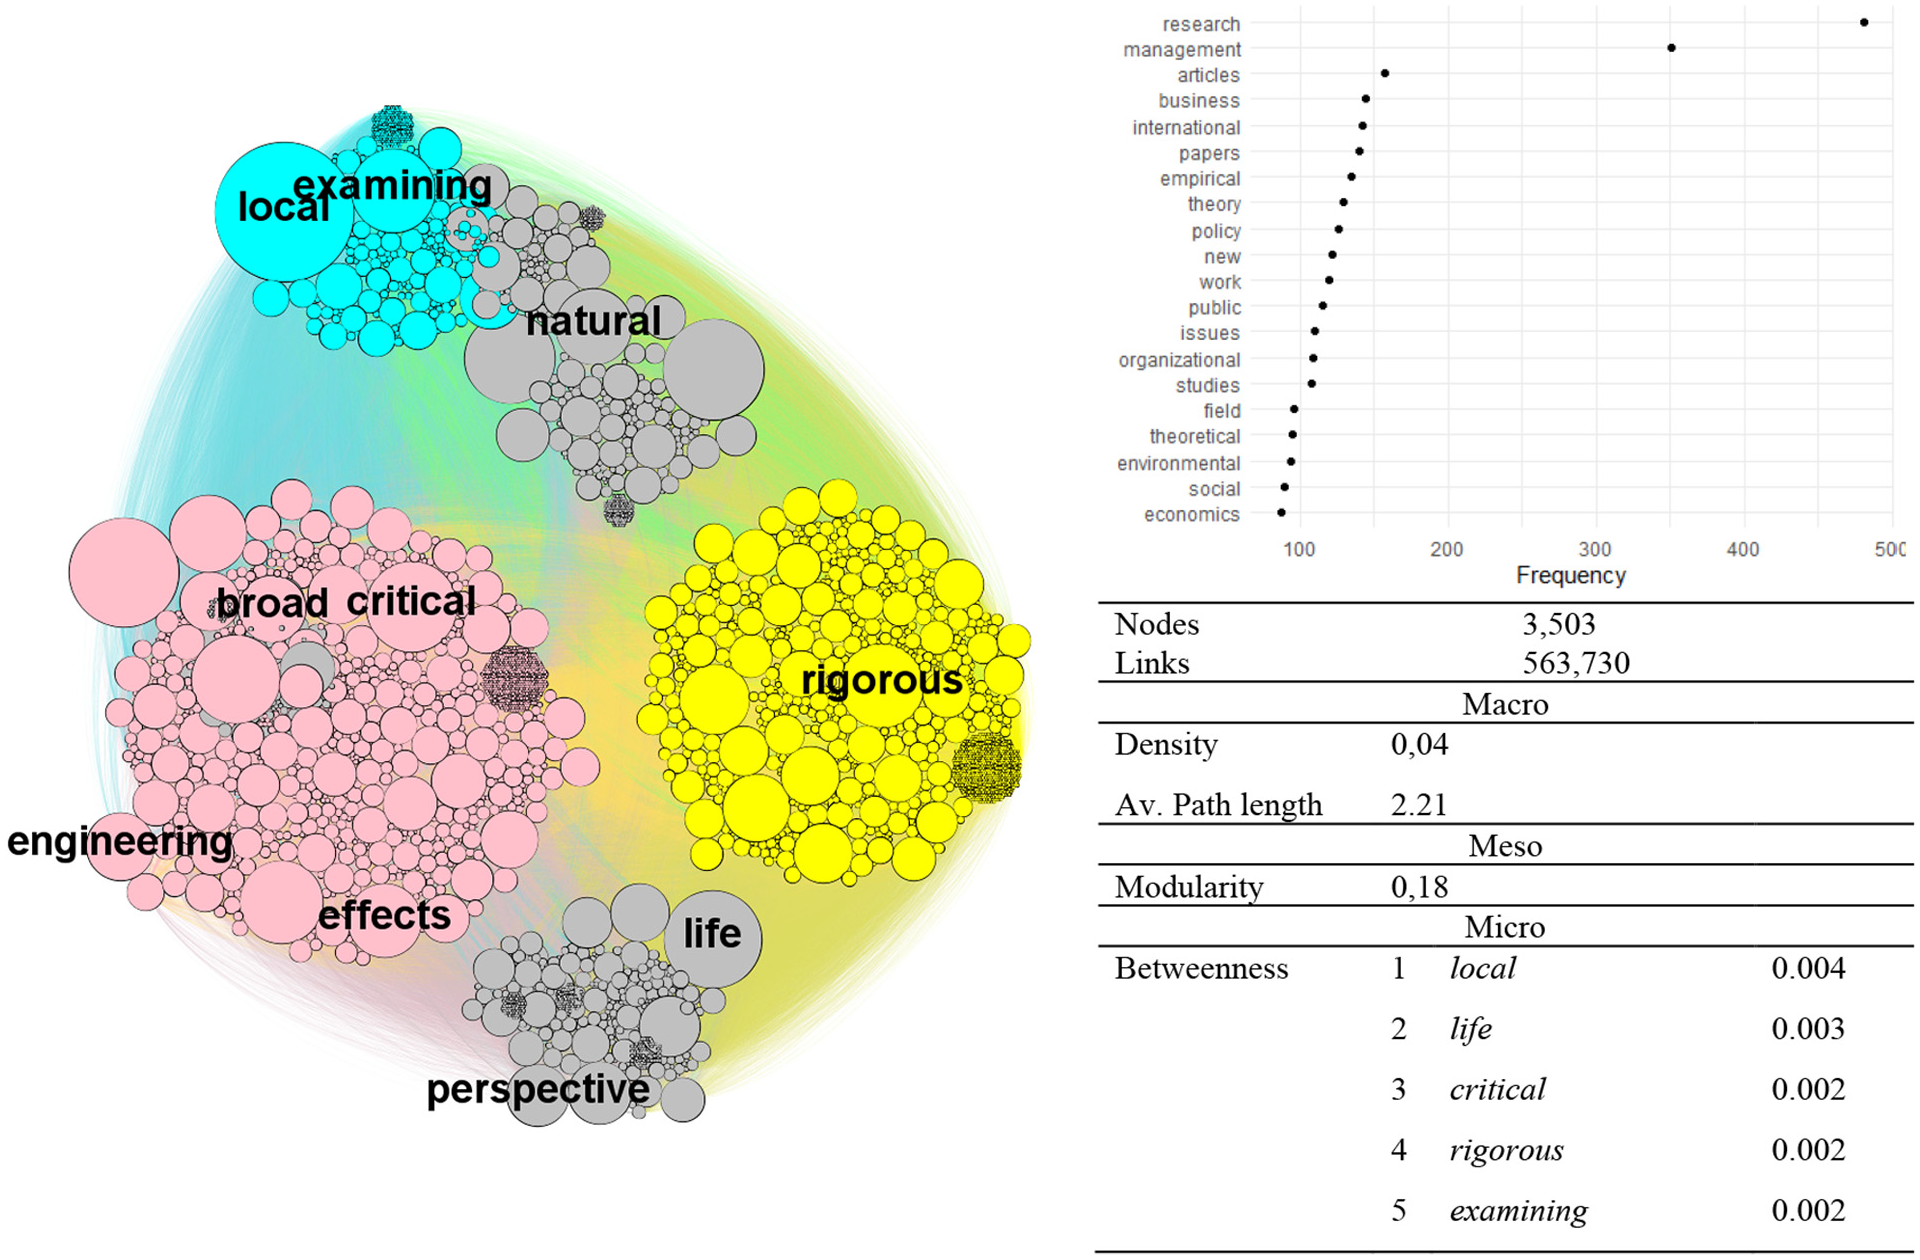
Semantic network – JMSs top 10% in the SJR (left side); top-20 most frequent tokens (top-right); macro, meso, micro (top-5) metrics table (bottom-right). Network’s layout algorithm: circular graph [72].
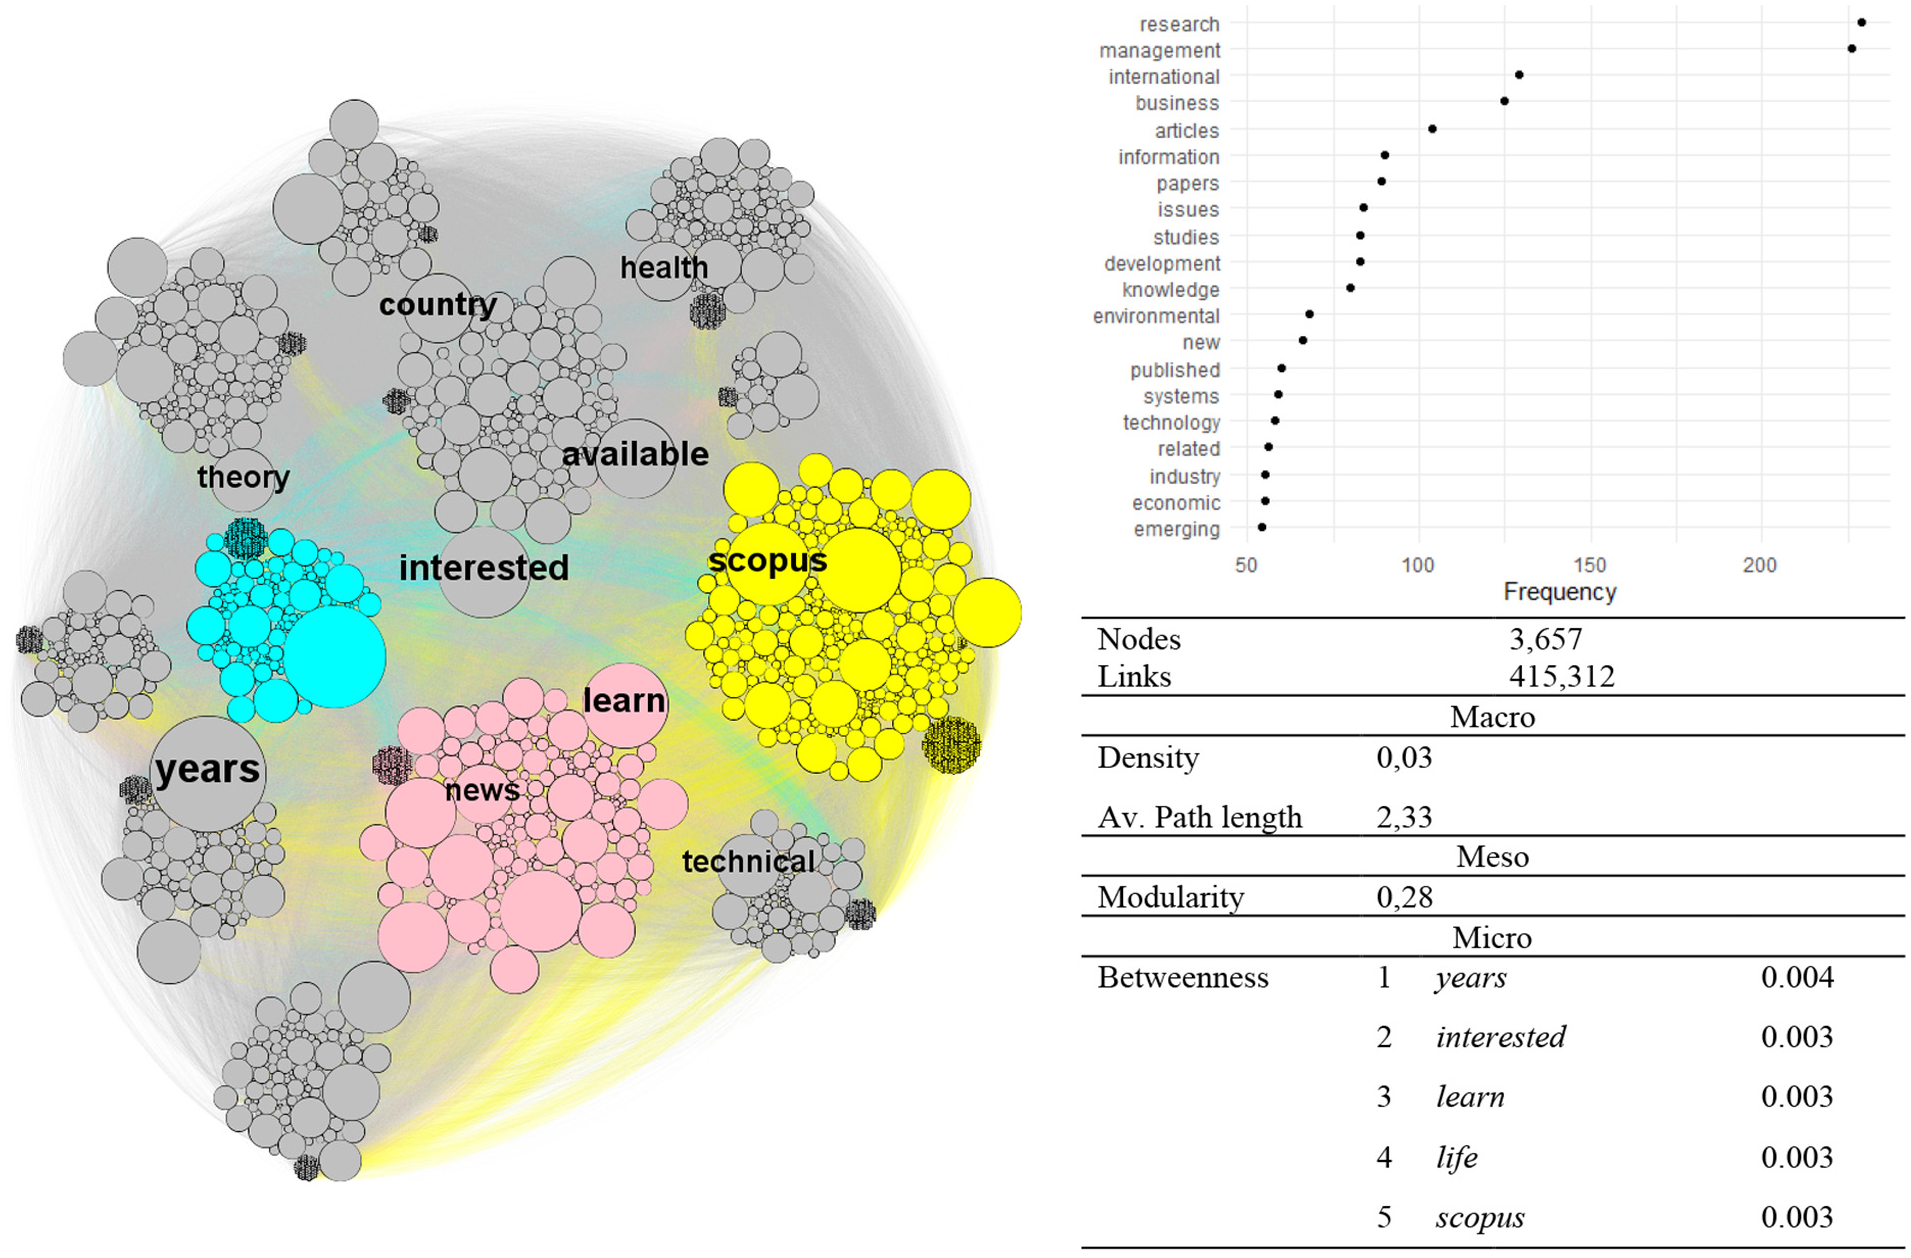
Semantic network – JMSs bottom 10% in the SJR (left side); top-20 most frequent tokens (top-right); macro, meso, micro (top-5) metrics table (bottom-right). Network’s layout algorithm: circular graph [72].
A random directed network with the average number of nodes of the following two networks (n = 3580; wiring probability = 0.05) was generated as a comparing benchmark (i.e. density = 0.025; average path length = 2.12; clusters = 10; modularity = 0.061). First, the top 10% JMSs showed similar density, average path length and clusters compared with the random network, although higher modularity. The bottom 10% JMSs’ network metrics were similar to that of the top 10%. In sum, both networks’ macro scores were not different from those of a random network; however, they both differentiated themselves with a higher modularity score.
Both JMSs’ networks density and average path lengths were similar. In that line, any key-term of both networks would have to contact ≈2 key-terms on average to reach another key-term (e.g. there are, on average, two ‘middlemen’ between two random type tokens). The number of clusters identified was 9 and 10, respectively. Regarding the top 10% JMSs’ network, the three most crowded grouped 67% of the key-terms: blue (31%) related to what the journals seek in manuscripts (e.g. new/original/leading/innovative, conceptual/theoretical/empirical and rigorous); pink (28%) related to the professional/practical applications/methods (e.g. modelling, methodology, relevance and demonstrate) and audiences (e.g. students, professionals, policy-makers, leaders, non-governmental, scientists and researchers); and grey (10%) related to the social-environmental and geographical reach of the research (e.g. ecosystems, socioeconomic, municipal and communities).
However, in the bottom 10% JMSs, the three most crowded grouped 52% of the key-terms: pink (22%) related to what the journals seek in manuscripts (e.g. original/case/wide/important/innovative); green (16%) related to journal attributes/focus and methodological preferences (e.g. peer-reviewed and quantitative/philosophical/multi-disciplinary) and blue (15%) related to private institutions processes/results (e.g. business, industry(ies), production/products/innovations and trade).
The modularity score of the top 10% was lower than the bottom 10 JMSs. Therefore, there is a loose interconnection within clusters and higher interconnectedness between clusters. In other words, the JMSs’ jargon/language in the top 10% is broadly shared with other JMSs (i.e. JMSs showed no systematic differentiation when expressing what JMSs seek and research applications and audiences).
Conversely, the modularity score of the bottom 10% JMSs suggests a higher interconnectedness within clusters and more loose between clusters. Thus, JMSs’ jargon/language is also shared with other JMSs (i.e. JMSs showed a moderate differentiation when expressing what JMSs seek and journal attributes and methodological preferences).
In the top 10% JMSs, key-term bridges between clusters were related to a geographical scope (e.g. region, communities, and national and international levels) and critical type of scholarly communication (e.g. critical evaluation, critical management studies, critical essays and other types of communications). Both JMSs’ networks share the key-term: life. Life was a widely used key-term, from biological sciences (e.g. life sciences) to marketing-related concepts (e.g. product life cycle).
In the case of the bottom 10% JMSs, the key-terms with the highest betweenness were years (e.g. the advance of the discipline in a temporal framework or the journal’s coverage or timely contribution to the field); interested, as in the interests of the journal regarding a manuscript attribute or the public interested (e.g. manuscripts that break the field; state of the art research; academics and practitioners as target audience); learn (e.g. learn from the discipline or when the disciplines learn from other actors). Also, it is crucial to notice that indexing (i.e. Scopus) is an essential intermediate feature in the JMSs of the bottom 10%.
Table 4 presents the summary statistics for JMSs’ FKGL and Yule’s K. Overall, the JMSs’ readability and lexical diversity are lower. There was a small-significant correlation between FKGL and Yule’s K (r = 0.1; n = 1,502; p = 6e-5). Thus, increases in readability were positively – although slightly – correlated with increases in lexical diversity. The median FKGL indicates that half of the JMSs have a readability score over 19, which means that a person would need ≈19 years equivalent to the US grade level to understand a text in a first reading. The median Yule’s K shows that half of the JMSs have a higher lexical diversity score than ≈222. Compared with best-selling books such as the Harry Potter novels, which have a Yule’s K of 69.38–77.12 [73], JMSs showed poor lexical diversity.
Summary statistics for FKGL and Yule’s K.
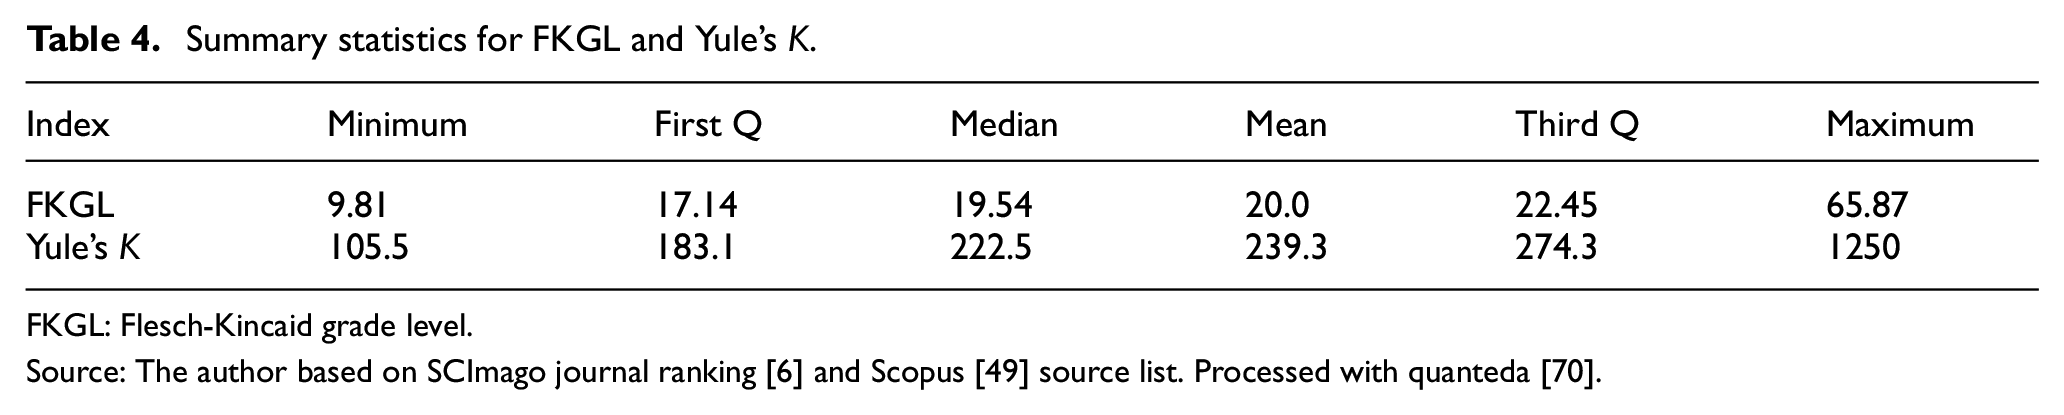
FKGL: Flesch-Kincaid grade level.
Figures 4 and 5 present two world heat maps showing the median FKGL and Yule’s K of the JMSs for 54 countries according to the country of publishers with available data. The colour gradation goes from yellow to red. The yellow band expresses the lowest FKGL or Yule’s K median score. In contrast, red is the highest median score.
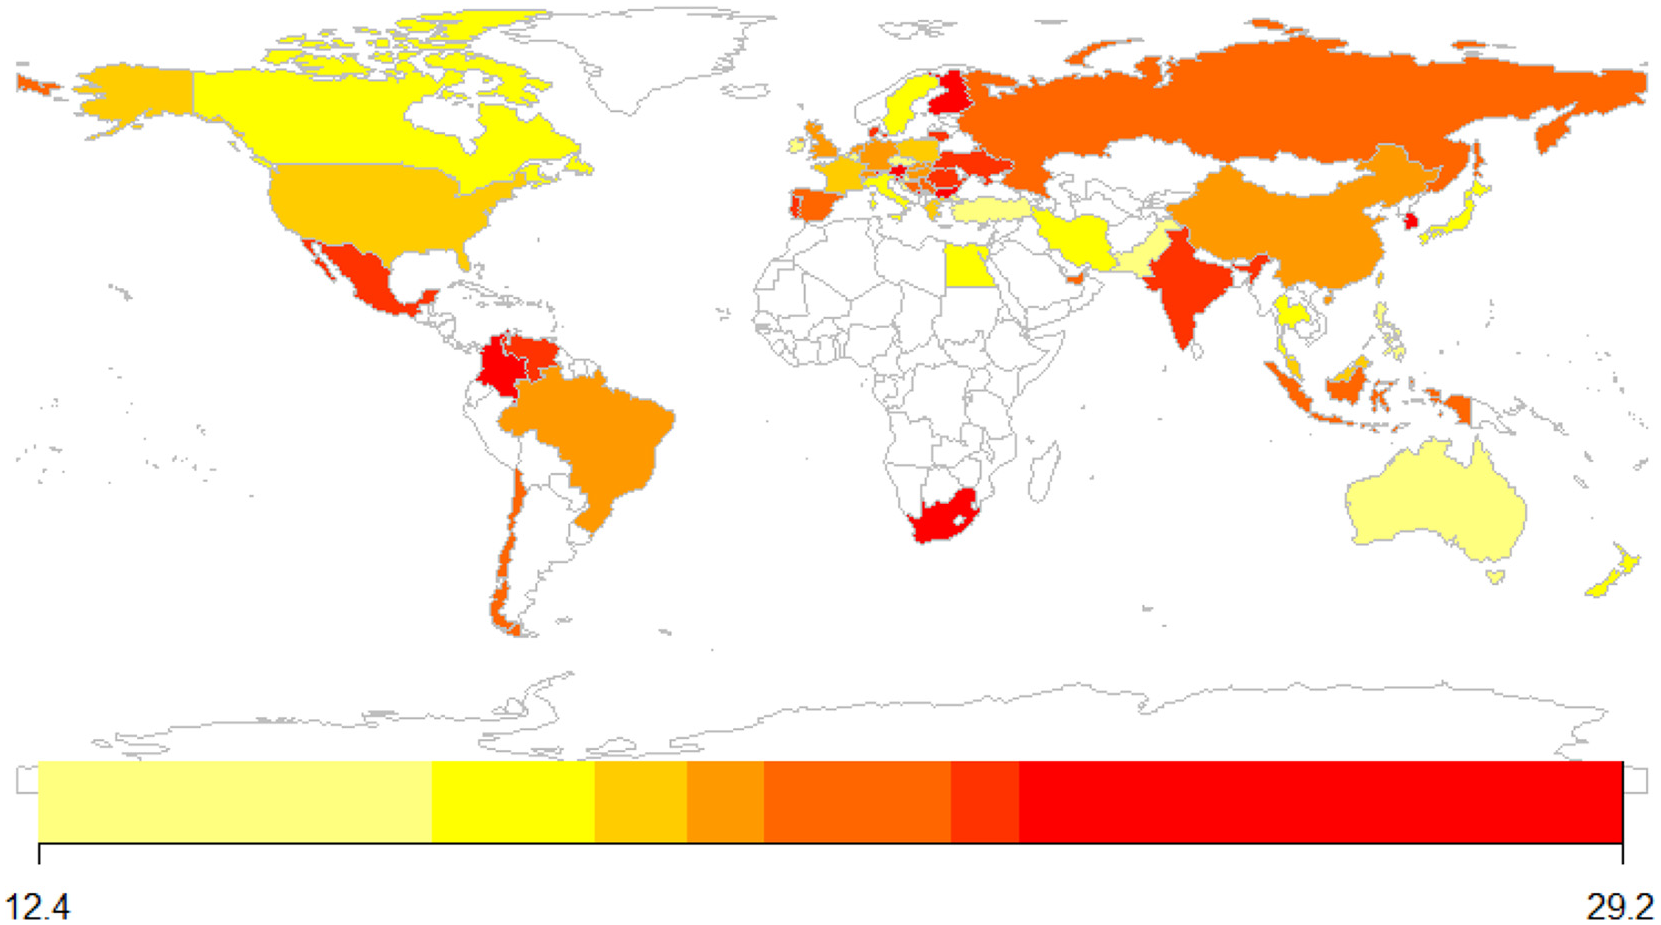
World map – median JMSs’ FKGL according to the country of publishers.
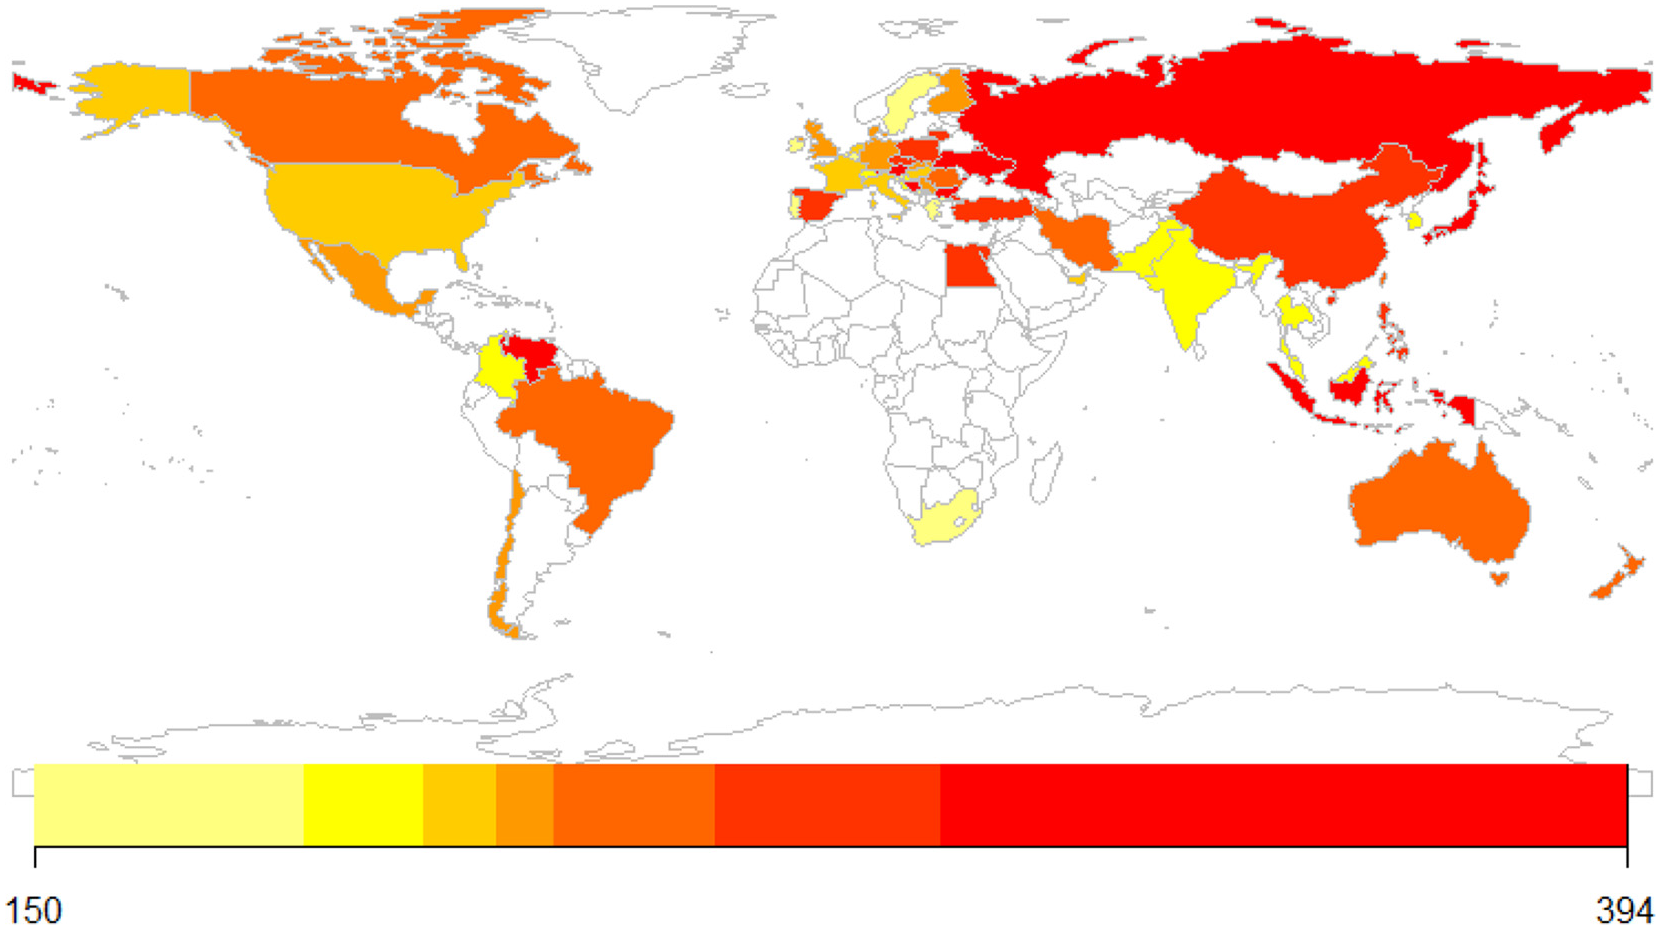
World map – median JMSs’ Yule’s K according to the country of publishers.
As expected, there is consistency in the readability of JMSs of publishers located in the English-speaking world (e.g. England, Ireland, the United States, Canada, Australia and New Zealand). It also was evident for other countries such as Sweden, Italy, Pakistan, Iran and Japan. However, Ibero-American countries (e.g. Spain, Portugal, Colombia, Brazil and Mexico) have the lowest readability.
Fewer JMSs from non-English-speaking countries showed a higher lexical diversity (e.g. Colombia, India, Finland, Pakistan and Thailand) than English-speaking countries (e.g. Australia). The United States and Canada are among the few countries with both higher readability and lexical diversity. Conversely, publishers in countries like China, Russia, Ukraine and Spain showed JMSs with lower readability.
None of the Shapiro and Wilk [75] tests for FKGL and Yule’s K conducted for each OA and best quartile groups resulted in a p > 0.05. Considering that FKGL and Yule’s K were not normally distributed, the Wilcoxon rank-sum and the Kruskal–Wallis tests were used to determine significant differences between OA and non-OA, and best quartile groups (i.e. Q1, Q2, Q3 and Q4) in terms of readability and lexical diversity [76].
Results showed that the median FKGL in the OA group was 19.6 (interquartile range (IQR) = 6.53), whereas the median in the non-OA group was 19.5 (IQR = 5.16). The Wilcoxon test showed that the difference was non-significant (p = 0.19; eta squared[H] = 0.03). However, the median Yule’s K in the OA group was 229 (IQR = 110), whereas the median in the non-OA group was 222 (IQR = 89.8). The Wilcoxon test showed that the difference was significant (p = 0.02; eta squared[H] = 0.05).
There were statistically significant differences between the best quartile groups in terms of JMSs’ readability (p = 6e-3; eta squared[H] = 6e-3). Pairwise Dunn’s test between best quartile groups confirmed that the difference between Q2 (median = 20; IQR = 5.4) and Q4 (median = 19; IQR = 6.13) groups was significant (p = 3.51e-3). There were also statistically significant differences between best quartile groups in JMSs’ Yule’s K (p = 3.25e-7; eta squared[H] = 0.02). Pairwise Dunn’s test between best quartile groups showed significant differences between Q1 (median = 214; IQR = 84) and Q3 (median = 227; IQR = 92.2) (p = 0.017) and Q1 and Q4 (median = 246; IQR = 125) (p = 1.48e-7). Significant differences are also showed between Q4 and Q2 (median = 222; IQR = 87.8) (p = 5.75e-4; eta2[H] = 0.006) and Q4 and Q3 (median = 227; IQR = 92.2) (p = 1.95e-2) groups.
In essence, findings answered RQ2 affirmatively. Hence, significant differences were found: (1) between OA and non-OA JMSs’ diversity (a higher median for OA group), (2) between best quartile groups JMSs’ readability (a higher median for Q2 than Q4) and (3) between best quartile groups JMSs’ diversity (a higher median for Q1 than Q3 and Q4; for Q2 than Q3 and Q4; and for Q3 than Q4).
4. Discussion
The titles’ network structure showed a lower density, which reveals an open-type network structure. That was also noticeable in the JMSs’ networks. An open-type structure has its advantages and disadvantages. For example, open structure networks enable the flow of diverse, new and non-redundant information [77]. However, closed structure networks are information-redundant but more efficient when extending control and implementing sanctions [78]. It reflects current discussions on the purpose of BMA, regarding an incentive system that rewards novelty (i.e. non-redundancy) over truth (i.e. heading towards an accumulated and progressive consensus) and applies few punishments for counterintuitive but erroneous findings [79].
The higher betweenness centrality of key-terms such as engineering and technology may be associated with the increasing role of information and communication technologies (ICT) tools in organisations’ processes and research methods (e.g. Big Data), particularly in the cluster related to marketing and strategic and supply chain management [79–81]. Despite engineering being a term belonging to another knowledge domain, specific engineering topics have gained outstanding popularity in BMA, for instance: engineering change management (ECM) [82]. ECM could be defined as managing the modifications made to a particular product (component(s)) after it has already entered into production, from tangible products, designs or services [83]. ECM’s major research areas are Hamraz et al. [82]: (1) pre-change stage, aimed to reduce the engineering change (EC) impact; (2) in-change stage, impact analysis of handling with ECs; (3) post-change stage, learning for future ECs based on its sources and impacts. In addition, several emerging research areas have been identified, such as Hamraz et al. [82]: pre-change stage, in-change stage and post-change stage. The general view of engineering-related frameworks places its scope in multiple economic sectors, organisations, and tangible/intangible products at different stages of production, which could be partly an explanatory factor for the higher betweenness centrality of engineering in BMA. Besides, the fraction of key-terms composing the sustainability science-related cluster supports the reported success of sustainability science concepts since the 80s, its explosive growth, the diverse geographical origin of its contributors and its emphasis on management (e.g. of social or ecological ecosystems) [84].
JMSs’ subsamples showed that the key components (i.e. most crowded clusters) for a JMS were: (1) what the journals seek – and want to publish, in a way – in submitted manuscripts; (2) professional/practical applications/methods; (3) audiences; (4) the social-environmental and geographical reach of the research; (5) journal topics associated with mostly private institutions processes/results. Seminal work by Pearce and David [85] proposed eight key components of a comprehensive MS: (1) the specification of target customers and markets; (2) the identification of principal products/services; (3) the specification of a geographic domain; (4) the identification of core technologies; (5) the expression of commitment to survival, growth and profitability; (6) the specification of key elements in the company’s philosophy; (7) the identification of the company self-concept; (8) the identification of the firm’s desired public image.
Contrasting those key components with those found in the JMSs’ networks, JMSs are mainly reflecting four Pearce and David [85] key components: (1) the specification of target customers and markets is associated with the (a) audiences and (b) journal topics associated with mostly private institutions processes/results components, (2) the identification of principal products/services to offer (i.e. article content) is associated with the component related to what the journals seek in submitted manuscripts, (3) the identification of a geographic domain is associated with the social-environmental and geographical reach of the research and (4) the identification of core technologies (i.e. means for ends) is associated with the professional/practical applications/methods. In addition, there are several key MS components sidelined from the main JMSs’ components detected. To synthesise, JMSs could explore key components such as how the journal plans to grow and maintain its relevance and sustainability; its main reason/purpose as philosophy, self-concept and the public image that it is developing or seeks to achieve in the future [9].
Key-terms with higher betweenness associated with identifying principal products/services to offer such as critical type and other attributes of scholarly communication (i.e. critical and interested) also reflect a current fixation of the BMA-related fields with interesting theories and counterintuitive facts [86]. Pillutla and Thau [87] argued that focus had produced adverse effects: since the priority is to show something interesting, there is no incentive or mandate to share data for replication or triangulation, let alone expending resources testing intuitive phenomena to head towards a consensus or theory robustness [88–90]. Apart from that, there is a noticeable discrepancy among the most frequent and highly intermediate key-terms. International can be found among the top-5 most frequent terms in the titles and JMSs’ networks, and, at the same time, local was the key-term with the highest betweenness among the top 10% JMSs. The betweenness of local reflects an inherent feature of the social sciences: it is local in scope and relies on national publishers [14].
Furthermore, an exploratory search on Google’s Books Ngram Viewer shows that international and local– and other related terms – increased jointly between 1800 and 1980 (Figure 6). Although, since the mid-1990s, their use dropped. Other terms (e.g. global), meanwhile, started to emerge [91]. Thus, the betweenness score and frequent use of a local and international agenda seem to be replaced by a global perspective when considering a broader context (e.g. global and cross-cultural issues; competitiveness; environmental change; political economy; supply chain).
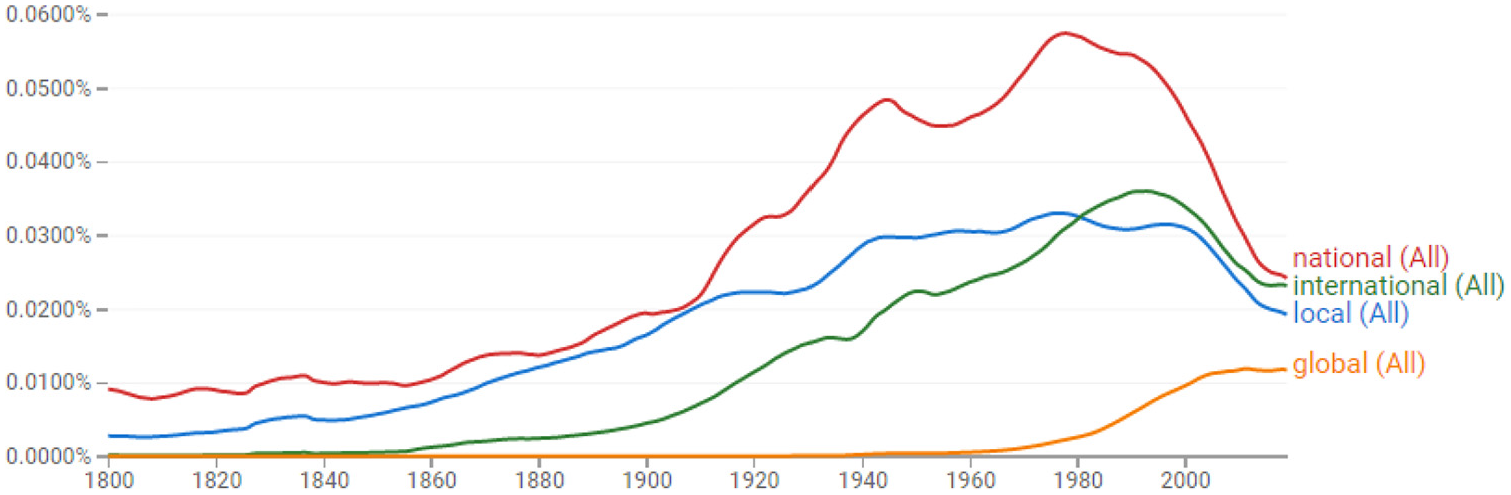
Google’s Books Ngram Viewer results for international and local.
The top 10% JMSs highlighted the betweenness of rigorous (e.g. research; articles; contributions; peer review; sound theory), which was not detected among the bottom 10% JMSs. Both JMSs’ subsamples mentioned the journal indexing, yet mentioning Scopus and years in the bottom 10% JMSs was a central attribute. Leading journals do not need to announce their indexing since their historical reputation is widely acknowledged. Emergent journals seem to use these indexing and timely factors as hooks for contributors and could be associated with the MS key component to identifying the firm’s desired public image [85]. Institutions also incentivise researchers to publish in Scopus’ indexed journals – excessively, in some cases – creating structural problems in the quality of BMA research output in developing countries [92–95]. The higher betweenness of learn in the bottom 10% JMSs supports its high frequency in the MS of universities worldwide, particularly in the small ones [18].
Despite the relatively higher readability and diversity of JMSs from countries from the English-speaking world, results are consistent with those arguing that academic and business and economics-related written pieces are far from a text understandable by a general audience [96,97]. After analysing 709,000+ research paper abstracts, Plavén-Sigray et al. [98] found that science readability decreases over time. As for 2015, 22% of abstracts have readability beyond college graduate English-level.
The following sections were developed by contrasting this study’s findings with those presented in section ‘Introduction’. Since the latter studies were developed by analysing article titles, abstracts and keywords, not JMSs, further interpretations should mind that limitation.
There are no significant differences in the readability of the JMSs of OA and non-OA. It contrasts findings for OA journals in psychology, where Plain Language Summaries (PLS) (i.e. non-technical language briefs for a wider audience) are being used to accompany traditional abstracts, which happen to have significantly higher readability than traditional abstracts [99]. However, the latter results shall be interpreted cautiously since only two journals that used PLS were assessed. By comparison, the median lexical diversity of JMSs in the non-OA group was significantly different and higher than in the OA group. Most non-OA group publishers are associated with the academic publishing oligopoly, such as Elsevier or Taylor & Francis [14]. Therefore, the JMSs of for-profit publishers reflect the experience in using lexical diversity in strategic communications.
In that line, consider a group of non-English-speaking developing countries with higher JMSs’ lexical diversity (i.e. India, Colombia, Pakistan and Thailand). Over half of the journals are non-OA. Thus, our results suggest that emerging non-OA journals (mean year coverage: 7 years) in developing economies adopt a diverse JMS style for differentiating and communicating with new audiences to potentially increase their participation in the non-OA market. That has to be contrasted with the increasing output dynamic and the vulnerability to predatory publishing of developing countries as a central challenge for research quality evaluation [92–94].
JMSs’ median readability was significantly different and higher only for Q4 journals than Q2. It supports Didegah and Thelwall’s [36] findings on no significant association between abstract readability and impact. It seems to depend on disciplinary jargon. Furthermore, abstracts are difficult to read in general since research papers are targeted to specific and specialised audiences. In specific cases, chemistry and medicine have shown the lowest readability, and mathematics and space sciences have the highest [100].
JMSs’ lexical diversity was significantly different and higher in Q1 and Q2 journals than in Q3 and Q4. Findings are in line with those from prestigious astrophysics journals, in which case a trend towards long article titles with high lexical density (i.e. the amount of information conveyed by the titles) was found [41]. Evidence from leading humanities journals [39] pointed towards an increasing informativity of article titles. However, sciences and social sciences titles had a higher informativity attribute. Such differences could be explained by De Solla Price’s [101] classic distinction between hard, soft and non-sciences. Thus, hard sciences require more substantive words in a paper’s title to draw its central thesis, contrasting with the loose/flexible-like trait prevailing in the humanities and social sciences. Also, findings in a leading journal on human behaviour [7] stated that article titles with precise attributes (i.e. a hyphen or a colon separating different ideas or at least two words different from the keywords) accumulated more citations. Concretely, the higher JMSs’ lexical diversity of journals with high/moderate prestige could be partly explained by the disciplinary necessity to convey higher amounts of information at communicating with their stakeholders and their scientific distinction (i.e. harder or softer), an attribute highlighted in the top 10% of JMSs (i.e. rigorous) but notably absent in the bottom 10% key-terms with the highest betweenness.
5. Conclusion
Journal titles and JMSs are two essential information pieces that express a journal’s main topics, history, disciplinary incidence, publication frequency, preferred epistemology (i.e. empirical or theoretical), methods, audiences, among other components. This study conducted a comprehensive outlook of the content structure of titles and JMSs and identified significant differences between journal prestige and journal type of access groups and JMSs’ content.
Findings showed that both titles and JMSs have an open-type network structure, enabling the flow of new information yet making that process less efficient than a closed structured network. Both titles and JMSs reflect current BMA discussions (e.g. a that is interesting and counterintuitive findings predilection, increasing use of ICT tools in methods and industry and a widespread incursion of sustainability sciences). Compared with the MSs’ literature, JMSs were restricted to the specification of target customers and markets; identifying principal products/services to offer; identifying a geographic domain; and identifying core technologies, leaving aside several MS components, such as how the journal plans to grow and maintain its relevance and sustainability, its main reason/purpose as philosophy, self-concept and the public image that it is developing or seeks to achieve in the future.
Reputable journals showed a distinctive key-term betweenness related to articles’rigorous features, while the publication hook in lower reputable JMSs was the Scopus indexing. There is a tension between the frequent use of international and local betweenness. In the broader framework, both international and local are being less used over the past 20 years, while the notion of global is increasing. Both titles and JMSs’ readability and lexical diversity are low, a phenomenon confirmed in multiple and interdisciplinary studies. However, the group of leading editorials composing the non-OA group showed JMSs with higher lexical diversity. There were no significant differences between best quartile groups regarding readability, but several significant differences emerge when exploring lexical diversity.
Results are supported by previous research aimed to understand the diversity of article titles and their association with impact. This study’s restrictions could rely on the limitations of readability and diversity indices since they cannot differentiate each reader’s previous knowledge nor motivation. Further studies could source journals’ information from different sources (e.g. WoS, Dimensions and Google Scholar) and disciplines for comparison (e.g. BMA vs STEM disciplines). Moreover, additional article components and text properties (e.g. titles, abstracts, keywords, number of figures/tables, references, length, text sentiment dimensions: negative, positive, uncertain, litigious, constraining, superfluous or interesting tones) and their potential associations with journal’s use and impact in multiple spheres (e.g. views, downloads and altmetrics) could also be incorporated.
Footnotes
Acknowledgements
The author thanks Katherine Delgado, Juan Hernández and Iván Quintero for their valuable research assistance. The author also thanks the support of the Universidad del Rosario’s School of Management and Business. Finally, the author also thanks Dr Julia Jensen for editing a draft of this manuscript.
Declaration of conflicting interests
The author(s) declared no potential conflicts of interest with respect to the research, authorship and/or publication of this article.
Funding
The author(s) received no financial support for the research, authorship and/or publication of this article.