
Abstract
The COVID-19 pandemic profoundly disrupted educational opportunities for English learner-designated (EL) students. To address these disruptions districts across the nation received unprecedented levels of federal and state funding. This study examines how California school districts responded to challenges faced by EL-designated students in the post-pandemic period, focusing specifically on how Local Educational Agencies utilized Local Control and Accountability Plans (LCAPs). A comprehensive document analysis of 30 randomly selected LCAPs and an analysis of financial data revealed that despite unprecedented challenges and substantial additional funding, California school districts did not fundamentally alter their EL planning and spending approaches. Most districts failed to prioritize EL-specific spending, employing vague language or funding general categories that did not appear to directly target EL needs. Actions aligned with California’s EL Roadmap were rare and unevenly distributed, with districts serving smaller EL populations particularly unlikely to allocate proportional resources. The study suggests current planning and funding instruments like the LCAPs may be limited in their ability to generate targeted planning or ensure district accountability for EL-student services.
The COVID-19 pandemic profoundly affected the educational opportunities and life chances of millions of students across the United States and around the world, and was especially hard on students of color and those from low-income backgrounds (Carbonari et al., 2024; Domingue et al., 2022; Kuhfeld et al., 2022). These students reported lower test scores and higher absenteeism, arguably undoing nearly two decades of progress toward educational equity in the United States (Carbonari et al., 2024; Santibañez et al., 2024). Multilingual learners, officially known as English learner or English learner–designated students (ELs) 1 were one of the most impacted groups. Multilingual learners represent 10.6% of students in U.S. public schools (Irwin et al., 2024)—a higher proportion than a decade ago (9.4%) (U.S. Department of Education, 2024). In some states, EL-designated students represent a much higher share of total enrollment. In California, the subject of this study, close to 40% of students enter school classified as an EL (Santibañez & Umansky, 2018).
To address the educational consequences of the pandemic, states received unprecedented levels of additional funding and support through several congressionally approved pieces of legislation. States also provided their own funding to supplement federal funds. Advocates were concerned at the height of the pandemic that the wide discretion schools had to offer services to ELs during school closures had made it more difficult to ensure they complied with their legal obligations to ELs and their families (Muniz, 2020)—despite additional funding (U.S. Department of Justice & U.S. Department of Education, n.d.). Now, more than five years after the pandemic first hit U.S. schools, we have yet to fully understand the scope of these efforts and their potential for addressing EL-specific needs.
This paper examines how districts responded to the challenges faced by EL-designated students after the pandemic. To do this, we focus on how California Local Educational Agencies (LEAs) used the Local Control Funding Formula (LCFF) and Local Control and Accountability Plans (LCAPs) to tackle issues specific to ELs. We also examine financial records from the California Department of Education’s (CDE’s) Standardized Account Code Structure (SACS) to better understand how LEAs used Elementary and Secondary School Emergency Relief (ESSER) funds. We ask the following research questions: (1) How do districts’ EL student percentages relate to their funding composition and expenditure reporting practices, post-pandemic? (2) Is the targeted funding destined for EL-specific actions proportional to EL enrollment and priorities? (3) What actions were taken by school districts in California to address EL needs post-pandemic? We apply an ecological systems lens to examine the importance of aligning policy and practice across multiple levels—from state mandates to classroom implementation.
Our key findings can be summarized with the old proverb of “the more things change, the more they stay the same.” Despite facing one of the largest crises ever confronting EL-classified students and receiving more funding, districts did not seem to fundamentally alter how they plan and spend for these students in ways that are evident for an outside observer (or the general public). A review of 30 randomly selected LCAPs found that most districts did not prioritize EL-specific spending, often using vague language or funding general categories that may not have directly or exclusively targeted EL needs. Actions aligned with the California EL Roadmap were rare and unevenly distributed, and districts with smaller EL populations were particularly unlikely to allocate proportional resources, reinforcing earlier research showing limited specificity and equity in district planning for ELs. This could reflect real limits to what districts write on the LCAP and what they end up doing in practice, given valid concerns about flexibility in spending and changes in circumstances as the school year progresses.
Taken together, our findings point to broader challenges with state and county-level guidance, and highlight the limitations of the LCAP as a policy tool for translating priorities—like those in the California EL Roadmap—into concrete, trackable actions that can be monitored or evaluated over time. LCAPs, if more clearly structured and systematically analyzed, have the potential to serve not only as compliance documents but also as valuable sources of policy insight—revealing how districts respond to changing EL demographics and whether they implement evidence-based supports for multilingual learners. However, it’s also possible that the LCAP is simply not the tool that generates this kind of targeted planning or that can be used to hold districts accountable for their actions. Although assessing the effectiveness of the LCAP itself is beyond the scope of this study, our findings suggest that even during a period of extraordinary disruption, district planning for EL students through the LCAP process remained largely unchanged.
Our study adds to our understanding about how and whether educational systems at multiple levels influenced learning opportunities during the pandemic. Our paper contributes to understanding these dynamics by examining funding allocations and district actions, and how systemic responses shaped educational equity for a vulnerable student population in the aftermath of an unprecedented educational crisis.
Literature Review: EL Student Outcomes and State of Supports and Services During and Post-Pandemic
Across the nation, learning outcomes for EL-classified students, including test scores, English language proficiency, and chronic absenteeism, worsened between the years immediately prior to the pandemic and the latest year available. Although there is no definitive study to show whether the mode of instruction had any bearing on EL student outcomes, it is worth noting that multilingual learners, along with other low-income students and students of color, were disproportionately more likely to attend fully online or hybrid education models than more advantaged peers, even well into the first year of the pandemic (2020–2021). Numerous studies have indicated that students in schools that remained online for longer had shorter instructional days, lower engagement with online resources, and fewer opportunities for socialization (Baruch, 2023; Chetty et al., 2020). Extended periods of online learning appear to have been detrimental to student academic outcomes, behavior, feelings of well-being, and social-emotional learning for all students (Duckworth et al., 2021). Online learning appears to have been particularly disruptive for EL-classified students, who were given fewer opportunities to use English and develop oral and written proficiency (Hsin et al., 2022). These reduced opportunities may have translated into lower English proficiency growth rates (Baruch, 2023; Sahakyan & Cook, 2021; Sahakyan & Poole, 2023). In this section, we provide a brief summary of prior research in this area.
Impacts on ELA and Math Test Scores
It is generally accepted that, on average, student achievement fell considerably during the pandemic, and then began to slowly recover after 2021–2022 (Cohodes et al., 2022). All groups were affected, but low-income students and students of color saw their scores decline the most (Kuhfeld et al., 2022). There is no national data on EL-designated students to paint a nationwide picture, nor do we have enough studies to gain a wider understanding of the effects of the pandemic on this population (Cohodes et al., 2022), but evidence from California suggests these students fared comparatively worse than others. An analysis of three interim assessments—the NWEA MAP Growth, Renaissance Learning Star, and Curriculum Associates i-Ready—showed that by winter 2021, the scores for EL students in grades 4–8 were lower than their pre-pandemic levels by the equivalent of 3.8 months in English language arts (ELA) and 3.1 months in mathematics. (The number of points by which these scores were lower are converted to months using standard psychometric techniques.) In contrast, the scores for non-EL students were lower by numbers that translate into 2.3 and 2.4 months of learning loss in ELA and math, respectively (Pier et al., 2021). This “learning lag” (difference between current and pre-pandemic levels) for ELs was higher than what was observed among other high needs student populations. These lags continued several years after the pandemic. The Smarter Balanced Assessment Consortium (SBAC) Summative Assessments data from 2023 showed persistent achievement gaps, with only 10.9% of EL students meeting or exceeding state standards in ELA—a figure substantially below the state average of 46.7% (Hough & Chavez, 2024). These results suggest that pandemic-related disruptions to traditional instructional delivery methods have had lasting implications for EL students’ academic progress (Pier et al., 2021; Reed et al., 2022).
Impact on Linguistic Proficiency and Reclassification
With respect to linguistic proficiency, there is a dearth of published research on this topic, but it is generally perceived that demonstrated (assessed) linguistic proficiency among EL-classified students declined since 2020, although not across all domains nor evenly across grade levels. Between 2019–2020 and 2020–2021, growth in English language proficiency measured by the ACCESS for ELLs assessment—an English language proficiency assessment used by 41 states (WIDA, 2022)—declined across nearly all grades and all four language domains of listening, speaking, reading, and writing (Sahakyan & Cook, 2021). The most dramatic declines were in speaking, followed by listening and writing, with smaller but still meaningful declines in reading, especially in older grades. In California, where students were among the most likely in the nation to remain in remote learning for longer periods of time, results in the linguistic test of proficiency, ELPAC, have not yet reached pre-pandemic levels. In 2023–2024, only 14.6% of EL students who took the ELPAC scored proficiency (Level 4) compared to 16.4% in 2018–2019. More concerningly, 52.5% of EL students in 2023–2024 placed in Levels 1 or 2 (the two lowest levels of proficiency) relative to 45.8% in 2018–2019.
Declines in language development coincided with weaker academic outcomes among English learner students. Several large districts reported early in the pandemic that English learner students experienced a larger increase in failing course grades than non–English learner students (Alvarez et al., 2020; Office of Research and Strategic Improvement, 2020). Analyses of a small sample of English learner students from a large-scale national progress monitoring assessment found that English learner students’ growth in reading and mathematics was similar to that of non–English learner students as of fall 2020–2021 (Renaissance, n.d.). However, by winter 2020–2021, their growth in reading and mathematics had slowed relative to non–English learner students’ growth (Hsin et al., 2022; Renaissance, n.d.).
There is no national data on how EL reclassification was impacted after the pandemic, but as previously discussed, data from California shows a dramatic decline in reclassification rates during the 2020–2021 school year, followed by a gradual recovery. In Texas, EL student reclassification rates also declined. Researchers cited several factors to explain this drop including a revised standardized achievement test (TELPAS) that is used as one criterion in reclassification decisions; revised reclassification guidelines that allowed for TELPAS to be used as the sole criterion (instead of only one of various criteria); and pandemic-induced disruptions of typical reclassification meetings, processes, and decisions (Hsin et al., 2022).
Impact on Social-Emotional and Behavioral Outcomes
EL students confronted significant economic and health challenges during the pandemic that affected their attendance and engagement with school, their social-emotional outcomes, and their well-being more generally. Latinx communities—and most EL-classified students in the nation are of Latinx origin—were among the hardest hit in terms of health and economic instability (Hamilton et al., 2021). One survey found 41% of low-income students of color reported providing care for someone else in their household, and 62% reported being financially affected by the pandemic (Hamilton et al., 2021). A Council of the Great City Schools (CGCS) report (Uro & Lai, 2019), based on a survey of school administrators, found that it was common for older ELs to have had to support younger siblings in navigating remote learning and to help them connect to digital platforms. In instances where a parent (or both) lost their jobs, EL students may have had to find employment to help support their family. And lastly, students who are English learners regularly have more English proficiency than their immigrant parents, and during the pandemic had to deal with social service agencies, school, and the like when no interpretation services were offered (Uro & Lai, 2019).
Unsurprisingly EL student attendance was severely affected during the pandemic. In a 2022 Government Accountability Office (GAO) national survey of teachers, teachers of ELs were more likely to report their students had inconsistent participation in online learning and were absent more often than non-ELs (GAO, 2022). The most recent data from California (2022–2023) shows that the chronic absenteeism rate among EL-classified students was close to 28%—much higher than the rate for non-ELs at 24% (Santibañez et al., 2024). The pandemic appears to have shifted EL chronic absenteeism, which went from not being a problem that disproportionately affected this population to being a significant issue, particularly among some EL subgroups such as long-term English learners (Santibañez et al., 2024). In Houston, chronic absenteeism among all students increased 88% over the average rates for 2017–2018 and 2018–2019, but more than doubled—climbing 158%—among English learners (Lehrer-Small, 2021). These findings are troubling given that EL students’ achievement tends to be more negatively impacted from missing school than is the case for non-EL students (Gershenson et al., 2015; Gottfried & Kirksey, 2017).
Pandemic Disruptions to EL Services and Supports
EL-classified students face the dual challenge of learning English and the same curricular content as their English-only peers. To succeed, ELs had been entitled to a range of supports and services such as targeted English-language-development (ELD) instruction within or outside of the general education classroom, instructional support from a qualified teacher who uses sheltering or bilingual strategies designed to help ELs understand core academic classes, or modified materials that integrate instruction in language and content simultaneously (U.S. Department of Education, Office for Civil Rights, 2015). 2 Along with access to teachers trained in language development and modified course content, ELs require well scheduled, intentionally scaffolded, and appropriately delivered programs and supports (August & Shanahan, 2007; Boals et al., 2015; Nordmeyer et al., 2021; Takanishi & Menestrel, 2017).
Although most scholars and educators generally agree that the pandemic significantly disrupted services for ELs, there were some bright spots. For example, the pandemic changed the ways in which ELD and other teachers collaborate with each other—because all teachers and district staff were working remotely it became easier for ESL/ELD specialists and general education teachers to co-develop lessons or co-teach. It also changed how schools and parents engaged with each other—teachers in EL district offices, in collaboration with relevant departments, created videos to guide EL parents on helping their children with online learning (Uro & Lai, 2019).
Despite these positive practices, pandemic-induced disruptions in the programs, supports, and other critical elements of ELs’ education likely exacerbated existing inequalities (Bacher-Hicks et al., 2023; Hamilton et al., 2021) The move to remote learning had severe consequences for close to 5 million EL-classified students in the United States who often faced limited access to digital devices or the internet, lacked a complete understanding of English resources, and in many cases were unable to work independently without support from their teachers (Korman et al., 2021; Mitchell, 2020). The lack of in-person instruction reduced exposure to social language experiences that improve language proficiency for ELs (DeRosia et al, 2021; U.S. Department of Education, Office for Civil Rights, 2015).
School-based supports, such as assignment to specially trained ELD teachers and classes as well as access to modified course content, provide important scaffolding for English learners’ academic development and entry into the education mainstream (Reed et al., 2022). When schools remained closed for in-person instruction for a long time, these services and supports were severely diminished or limited for ELs. Schools with fewer percentages of EL-classified students and rural districts found it especially difficult to provide continuity in EL services (Garcia-Arena & D’Souza, 2020). A survey of teachers and administrators indicated a lack of such support services, finding that only 39% of English-learning students interacted at least weekly with ELD teachers and less than one third received integrated ELD services during instruction (Reed et al., 2022; Vizcarra, 2020). ELs, just like students with disabilities, homeless students, and students in foster care, may not have received accommodations to which they were entitled, which may have affected opportunities to learn (Domingue et al., 2022).
Remote learning challenged parents from all backgrounds to become de facto educators or educational facilitators for their children. But this burden fell especially hard on linguistically diverse families of English learners, many of whom depend on overwhelmed schools to make web-based learning accessible to them. One survey of 589 families and 575 teachers from summer 2020, for example, found that only 39% of the Spanish-speaking families surveyed felt prepared to support a child learning from home—compared to fully half of all English-speaking families surveyed (U.S. Department of Education, Office for Civil Rights, 2015). Other research suggested that in California, non-English-speaking parents struggled to support their children with schoolwork and communicate effectively with schools—and schools with them (GAO, 2022; Lazarín & Sugarman, 2020; Reed et al., 2022; Uro & Lai, 2019; Williams & Buenrostro, 2021).
Even seemingly simple actions, such as providing access to technology to EL students and their families, proved to be significantly more challenging than first anticipated by many school districts. Districts learned that requiring a government-issued ID to deliver or receive equipment—rather than just a signed form or the student’s name and school assignment—presented a significant barrier for some EL families (Uro & Lai, 2019).
Pandemic Disruptions to Linguistic Assessments
Districts serving ELs may also have had interrupted or delayed linguistic assessments for ELs, which could have impacted their reclassification possibilities. According to a study of Learning Continuity Plans in California during 2020–2021, although close to 95% of districts had specific plans and actions to continue to serve ELs (e.g., what types of assessments would be administered and tools to assess oral language skills, which are usually assessed by teachers on a 1:1 basis), schools with higher proportions of ELs tended to have more specific plans than those with lower proportions of ELs (Reed et al., 2022).
Multilingual Learners in California and the State Policy Context
About 1.1 million students, or 20% of total enrollment in California public schools, are currently designated as an English learner. The vast majority of ELs (82%) speak Spanish, followed by Chinese languages (Mandarin or Cantonese, 2.1%), and Vietnamese (2.1%). These trends have remained more or less constant in the past decade, although the proportion of Spanish speakers is decreasing (it was 85% 10 years ago), while the proportion of other languages, particularly Arabic and Chinese languages, is increasing (Leger et al., 2023).
Despite growing numbers of EL students at the national level, California has experienced the opposite: the number and proportion of EL-classified students in public elementary and secondary schools has slightly decreased since before the pandemic (see Figure 1). Although California has seen a drop in overall enrollment, the proportion of EL-designated enrollment has decreased even more. There are various reasons for this, some of them structural (i.e., lower demographic growth, declines in the number of students whose primary language is not English). And some of them relate to policy changes, such as a move to online linguistic assessments in 2021; to a general drop in those being assessed during the pandemic; and to a decrease in the number of students being reclassified.
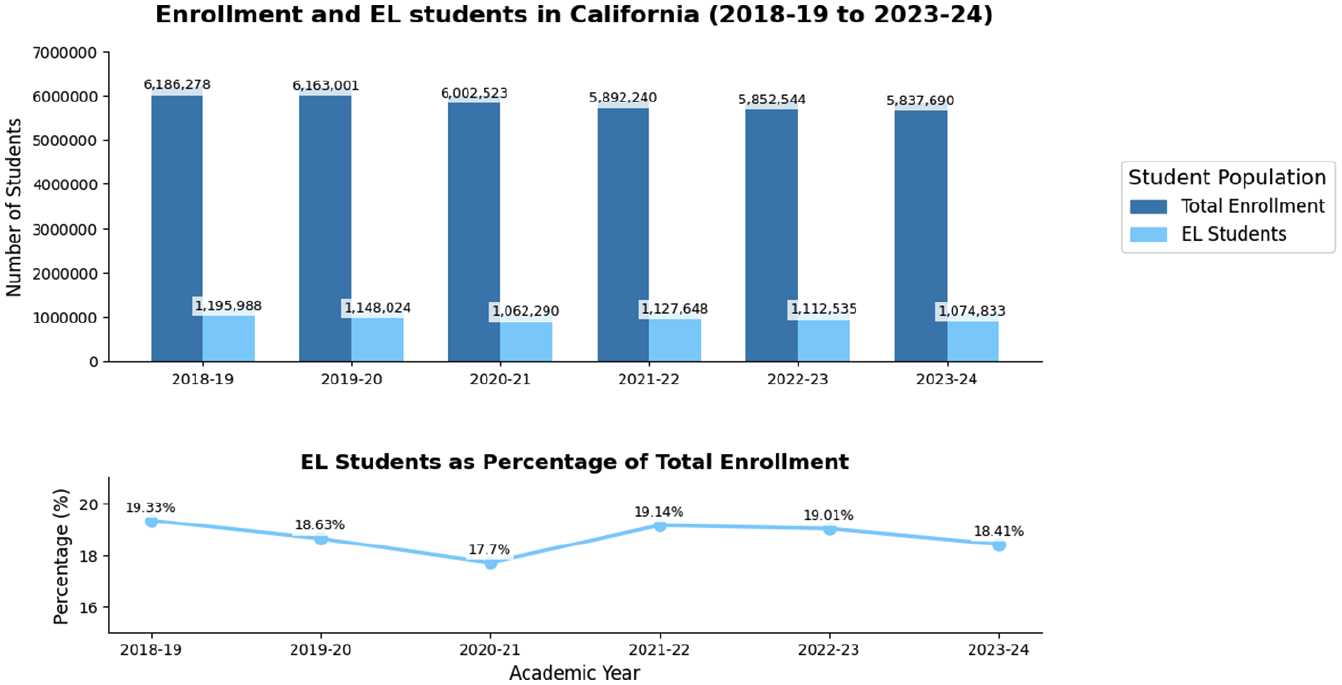
Trends in EL Enrollment (2018–2019 to 2023–2024).
These trends pose several challenges for districts as they seek to support multilingual learners through a range of services and supports. First, the decreased number of ELs may make it difficult for some districts to reach “critical mass” of ELs to justify more dedicated services (Obeso et al., 2023). Second, the number of students who are initially testing in the “novice” range has increased from around 59% in 2018–2019 to 74% in 2023–2024 (see Figure 2). This means that more students are entering classrooms with very low levels of English language proficiency, which may make it even more challenging for teachers to deliver instruction in traditional classrooms without dedicated ELD resources and support. Third, these low levels of initial English language proficiency coupled with lower levels of reclassification (see Figure 2) suggest students may stay designated longer, also increasing the need for dedicated district and school supports.
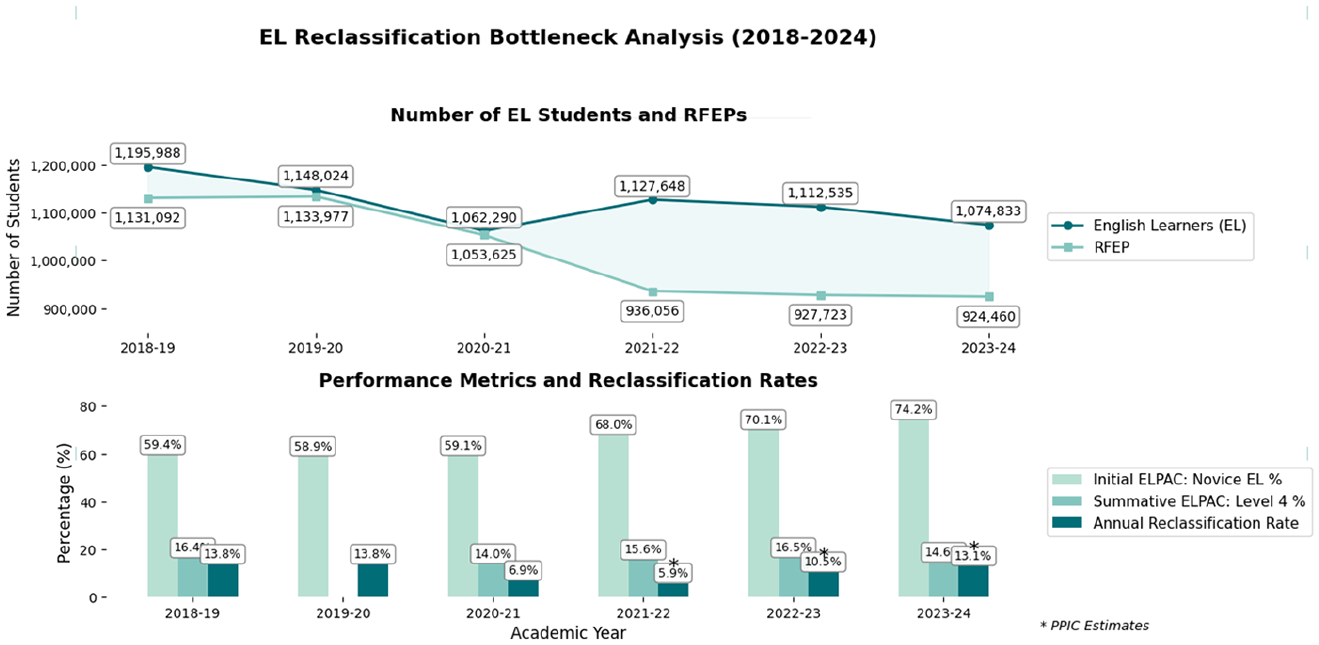
EL Reclassification Bottleneck Analysis (2018–2019 to 2023–2024).
Proportionality in Actions and Funding: Conceptual Framework
The education system is an interconnected network of actors in which state policy informs school districts, which in turn organize learning and instructional opportunities, which in turn guide schools that deliver that instruction and support students (Spillane et al., 2019). How state educational policy is implemented relies heavily on interpretation (meaning and sensemaking) of local actors and the will and capacity they have to enact such policies (Reed, et al., 2022). Districts respond to state guidelines by either going beyond the minimum requirements or merely complying with the minimum requirements (Reed et al., 2022).
From an ecological systems perspective (Bronfenbrenner, 1979; Darling, 2007), EL students experienced disruptions across multiple contexts. The pandemic affected their microsystems (classroom and home language environments), mesosystems (connections between home and school), and macrosystems (broader policy responses). Similarly, the ecology of equity framework (Bishop & Noguera, 2019) helps explain how these disruptions disproportionately affected ELs, as existing system inequities were amplified during remote learning when EL development opportunities were limited. In this paper we focus mainly on the macrosystem by examining how schools and districts used local policy instruments to prioritize (or not) multilingual student needs.
The Role of the LCAP
In California, the policymaking process—and the way in which all of the actors’ (state and local officials, educators, parents, communities) values and priorities are manifested—runs primarily through local control funding. Local control funding was adopted in California in 2013 to make school finance more equitable in the state and brought with it a requirement for districts to create budgets with input from a broad group of stakeholders and, under state priorities, set their own accountability standards (metrics) for student outcomes (Marsh & Hall, 2018). Local control funding in California is implemented through the use of the Local Control Funding Formula (LCFF), which the state uses to allocate financial resources to LEAs. There are two main parts to this allocation: the base grant, which provides LEAs with a base revenue determined by the average daily attendance of enrolled students, and a second part, which consists of supplemental and concentration grants. Supplemental grants give an additional 20% on top of the base grant for every high needs student. In addition, in districts with a share of high needs above 55%—known as concentration districts—each additional high needs student generates additional funding beyond the 55% threshold at 65% above the base grant—referred to as the concentration grant (LaFortune et al., 2023). High needs students include low-income students, ELs, and students in foster care.
Unlike other states like New York or Maryland, California grants LEAs a lot of leeway in how to spend LCFF funds (Wolf & Sands, 2016). Even though high needs students generate additional funding, these funding streams are unrestricted in the sense that they can be spent “school-wide”—that is, not necessarily on the student populations that generate them (Hill & Ugo, 2015; Wolf & Sands, 2016). However, LCFF does require districts to spend funds on actions that “increase or improve” services for high needs students in proportion to the increased funding these students generate (Hill & Ugo, 2015). The way the state ensures that equity considerations are front and center and that LEAs are held accountable for improving student outcomes is through the Local Control Action Plan (LCAP). LCAPs are three-year plans (updated annually) that are subject to county approval, which contain the vision, plans, strategies, and expenditures to be based on and organized around local goals, but with reference to and measurement of the eight state priorities (Humphrey et al., 2017).
Marsh and Hall’s (2018) study of state-mandated democratic participation provides a useful framework to examine the role of LCAPs in manifesting district values and priorities through their stated action (and funding tied to those actions). The requirement that districts develop yearly LCAPs as part of the LCFF is premised on the belief that shifting resource decisions away from the state to local arenas will result in more effective local policy (Marsh & Hall, 2018).
LCAPs are developed by district administrators and require input from representative groups such as parent and EL advisory groups and other community members, and school board deliberation and approval. By developing these plans in consultation with community and school stakeholders, LCAPs should, in theory, help districts and their communities make data-informed funding decisions and set academic goals. Studies of LCAP processes, however, find limited community and stakeholder engagement in two-way dialogue and even lower participation among LCFF targeted groups (Humphrey et al., 2017; Lavadenz et al., 2022; Marsh & Hall, 2018). Nevertheless, because LCFF provides districts with supplemental funds based on the number of EL students enrolled in their district, the LCAP is the only publicly available accountability tool to determine how funds are allocated to serve this population (Lavadenz et al., 2022).
English Learner Proportionality in the LCAP
Studies of LCFF and LCAPs have consistently found that most of these plans tend to reflect compliance, rather than innovation, and offer limited descriptions of program actions and services. This makes it difficult to gauge how these programs and services serve the intended population (Reed et al., 2022). Several analyses of LCFF spending and LCAP plans find that although districts with high needs students do receive significantly more funds via LCFF’s supplemental and concentration grants, these funds do not always reach the schools or the populations that generated them (Hill & Ugo, 2015; Lavadenz et al., 2018, 2022; Silberstein & Roza, 2020). A 2017 study by Georgetown’s Edunomics Lab found that schools with the highest numbers of high needs students received considerably less funding than they generated—their sample included large districts like Los Angeles Unified and Long Beach Unified and smaller districts like Oakland and Santa Ana (Roza et al., 2017). The state itself does not track the use of these additional LCFF funds or schools where the funding is spent (LaFortune et al., 2023).
Districts are generally nonspecific about how they differentiate curricular implementation and support and other actions for EL-classified students (Humphrey et al., 2017). In some cases, the issue was tied to lack of specificity in the targets being sought. In their review of 24 three-year LCAPs from districts with low performance for ELs written in 2017 and covering the years from 2017 to 2020, the Center for Equity for English Learners (CEEL) at Loyola Marymount University found that 92% of the reviewed LCAPs (N = 22) had ratings of “weak” or “no evidence” in EL outcomes and academic achievement—meaning that almost none of the plans had set out specific EL goals that would be later tied to funding actions. Moreover, the review found that many of the actions either were not tied to any research evidence or were insufficiently detailed to understand the potential impact on EL students. For example, professional development was almost always described in general terms and not in ways that would indicate what kinds of training it would include (i.e., ELD, culturally relevant pedagogy, literacy instruction, etc.). LCAPs also initially did not disaggregate long-term ELs (LTELs) or newcomer ELs (i.e., foreign-born students who have been in U.S. schools for less than three years). Although most LCAPs now at least acknowledge that these are distinct populations with varying needs (Lavadenz et al., 2022), most do not outline services or goals that are unique to these subgroups. Actions focused on the continuation of staff, or additional staff to serve ELs, including EL coordinators, bilingual teachers on special assignment (TOSAs), or bilingual paraprofessionals, were tied to funding without any description or differentiation that would allow the community to understand how these actions are tied to specific EL instruction/curriculum (Lavadenz et al., 2018). Parent engagement practices were often vague and did not specify or include existing engagement structures such as district English learner advisory committees (DELACs) (Lavadenz et al., 2022). In fact, most plans included actions targeting “all” high needs students, with no description of how each of these groups would be addressed—perhaps as a way to give LEAs more flexibility.
Still, determining whether a funding or action affects a certain group of students requires specialized knowledge that is not easily obtained or generated. One way to begin is to use the concept of “proportionality”: LCFF has an obligation to ensure funds are spent on the students that generate them. This proportionality is at the heart of LCFF’s commitment to equity (Li et al., 2023). This equity obligation, or proportionality requirement, can be fulfilled entirely quantitatively by budgeting an amount equal to or greater than the amount of LCFF supplemental and concentration funds to programs and services for high needs students; or, it can be met by increasing or improving services for high needs students in an amount equal to or greater than the proportion of a district’s supplemental and concentration grants. Previous research has shown that districts often fail to meet this proportionality requirement or meet it superficially by reclassifying school or district-wide actions that do not directly contribute to meeting the needs of high needs students or by arbitrarily inflating the funding going toward high needs targeted actions without facing serious scrutiny from county offices of education (Li et al., 2023).
The proportionality requirement ensures that districts could be held accountable for not spending additional funds on the students that generate them. Thus, an analysis of what proportion of these grants is spent on high needs students (as a proportion of district enrollment) could constitute a first check of whether or not LEAs are meeting their equity obligation.
In the case of multilingual learners, the matter is further complicated by the practice LEAs have of describing actions that target all students, without much description or differentiation among them. As previously mentioned, if a district spends on extended day and mentions “English learner, foster youth, and low-income students” as the target group of these actions (thus contributing to fulfill its proportionality requirement), how can we judge whether ELs can benefit from this action? We would first need to know the proportion of ELs that participate in the action (direct proportionality). Second, we would need to know whether direct participation in this action benefits EL-designated students. Although the first part of this justification can potentially be known, the second part would have to be based on some expert or evidence-based judgment of impact. This standard of judgment is ideal, but clearly beyond the scope of what most LEAs can do. This helps explain why most reviews find serious weaknesses in how LCAPs manifest district priorities around EL-designated students (Lavadenz et al., 2018; 2022). Despite their limitations, LCAPs are one of the only tools that manifest EL-specific priorities and strategies and are thus valuable instruments to analyze how LEAs think about EL needs and services.
Framework to Guide Analysis of EL-Specific Actions
We use the English Learner Roadmap as a guide to determine which actions can be deemed EL-specific and have an evidence base to support their implementation. Adopted by the California State Board of Education in 2017, the EL Roadmap is a research-based landmark policy intended to guide districts in how to better educate EL-classified students. It is aligned with the state priorities embedded in LCFF (basic services, student achievement, state standards, parental involvement, school climate, etc.). The roadmap has four principles, each with corresponding guidance: (1) assets-oriented and needs-responsive schools, (2) quality instruction and meaningful access, (3) system conditions to support effectiveness (including assessments and data systems), and (4) alignment and articulation across systems (including career/college-ready learning, seal of biliteracy, and engaging in continuous improvement efforts to understand what programs and actions work best to accomplish district EL-specific goals).
California’s EL Roadmap includes all of these elements that uniquely distinguish teaching and learning for ELs. Therefore, it is a useful tool to codify LCAP actions and can serve as a useful framework to classify actions as being (potentially) beneficial to ELs. For example, under Principle 1 (assets-oriented schools) LEAs are urged to see ELs as distinct groups and move away from one-size-fits-all approaches to instruction and family engagement; under Principle 2 (quality of instruction and access) LEAs are encouraged to give ELs access to the full curriculum along with specialized services. Access to bilingual/biliterate development is encouraged under this principle. Principle 4 encourages LEAs to seek partnerships with after-school and community organizations to meet the unique needs of ELs, which in the case of some EL populations like newcomer youth could include issues related to immigration, trauma, extra linguistic support, and others as needed.
Data and Methods
Data
To answer our research questions, we randomly selected 30 unified school districts in California and downloaded their 2023–2024 Local Control Accountability Plans (LCAPs). Per current legislation, each year in California, LEAs, including school districts, prepare the LCAP, have it approved by the LEA’s governing board, and make it available on the LEA’s website between July 1 and October 8. LCAPs are valid for three years but must be revisited every year. As such, the LCAPs provide an unfiltered and direct perspective on how school districts understand and address their needs and priorities and monitor them yearly through self-imposed goals, actions, and resource allocations.
State funding via the LCFF is the largest source of revenue for LEAs, accounting for, on average, almost 76% of total revenue in our sample; however, it’s not the only source of revenue. In their LCAPs, LEAs also report their expected federal funds that stem from recurring allocations of the Elementary and Secondary Education Act (ESEA) such as Title I through Title IV. Title III, specifically, is designed to support ELs and recently arrived immigrant students. These federal funds, including Title III allocations, reported in the LCAP, represented 7.8% of total revenue for our district sample in the 2023–24 academic year.
The federal government provided substantial one-time allocations during the period we analyze through the Elementary and Secondary School Emergency Relief (ESSER) funds. 3 To incorporate ESSER funds into our analysis, we examined the CDE’s Standardized Account Code Structure (SACS) system for the 2023–2024 school year. These reports provide detailed expenditure data by resource code, object, and function. 4 Using this data, we identified how much each LEA in our sample spent from ESSER II and ESSER III funds during the 2023–2024 school year, as well as the specific functions for which these funds were allocated.
To extract the relevant variables from the LCAPs and the SACS’s financial reports, we used an application programming interface (API). Taking advantage of the consistent structure across LCAPs, our code, which included a clear and detailed prompt, enabled the API to automate the extraction process. First, for the LCAPs, we extracted financial variables that provided a budget overview of the unified school districts, such as total revenue, type of funds, and, of particular interest for our analysis, the LCFF allocation. As mentioned in the previous section, the LCFF refers to the formula used by the state of California to allocate financial resources to LEAs; parts of this allocation, supplemental and concentration grants, are based on the LEA’s number of high needs students (i.e., EL students, students who qualify for free or reduced-price meals, and foster youth students).
For the second group of variables, we focused on extracting information from the 2023–2024 Contributing Actions Table in the LCAPs. In this section, LEAs list actions to increase or improve services for their high needs students, indicating the actions’ scope, unduplicated student group(s) benefiting, location, and the planned expenditure allocation. According to the instructions provided to LEAs for preparing the LCAPs, the planned expenditure on these actions should correspond proportionally to the amount those students generate under the LCFF. We extracted all the actions and accompanying descriptors in this table for every unified district in our sample. Finally, we extracted variables that describe school characteristics, such as the district’s number of schools, enrolled students, and percentage of EL-classified students. As a relevant highlight, the average percentage of ELs in our sample, 18.8%, is very close to the state average for unified school districts of 18.7% for the same academic year, according to online data publicly available in the CDE’s DataQuest platform. For the SACS financial reports, we developed similar code to primarily extract the fund and resource codes, the expenditure amounts, and their corresponding function codes from the submitted financial reports.
Methods
To examine the relationship between districts’ EL student percentage and their funding composition (RQ1), we categorized districts in our sample into three groups based on the percentage of enrolled EL students: Low EL (less than 10%), Medium EL (between 10% and 25%), and High EL (more than 25%). We chose these thresholds so that our Medium EL category would align closely with the average EL percentage (18.7%) among unified school districts while ensuring that each group would be large enough for meaningful comparisons. For each EL group, we examined key budget variables including the percentage of total revenue from LCFF, LCFF supplemental and concentration (S&C) funds, federal funds, ESSER expenditure, and per-student funding allocations to control for district size. We also calculated the percentage of each district’s planned expenditure budget reported in their LCAP to assess transparency in expenditure reporting across different EL groups.
To assess funding proportionality relative to EL enrollment (RQ2), first, we identified and calculated total planned expenditures for actions specifically targeting EL students. We then created a proportionality ratio by dividing the percentage of LCFF S&C funds spent on these actions by the district’s EL student percentage. This approach allowed us to determine whether districts are spending proportionally relative to the EL population, with ratios above 1.0 indicating higher than proportional spending or “effort” and ratios below 1.0 suggesting lower relative spending or “effort.” We calculated ratios for both EL-specific and EL-inclusive actions to provide a more nuanced understanding of resource allocation patterns.
For the analysis of districts’ actions addressing EL-specific needs post-pandemic (RQ3), we conducted a systematic review of the contributing actions tables for the LCAPs. Districts reported 701 actions to increase or improve services for high needs students, and we identified 13 major thematic categories. Actions were first coded according to these thematic categories, and then by unduplicated high needs group(s) to distinguish EL-specific interventions. We assessed the alignment of EL-specific actions with California’s EL Roadmap principles using a framework that mapped action characteristics to the four core principles: (1) assets-oriented and needs-responsive schools, (2) quality of instruction and meaningful access, (3) system conditions that support effectiveness, and (4) alignment and articulation across systems.
As for the SACS financial records, we extracted the function codes from the Expenditures by Function section of these files to understand how districts utilized ESSER funds during the academic year. However, we do not include ESSER expenditures in the analysis for RQs 2 and 3, because ESSER funding was not directly allocated based on the number or percentage of English learners. Moreover, as illustrated in Figure 3, the function-level expenditure data does not allow us to determine which student groups ultimately benefited from ESSER-funded activities. LEAs had much greater flexibility in how they used ESSER funds compared to LCFF S&C funds, which require annual reporting tied to specific student groups. Over half (approximately 53%) of ESSER expenditures in 2023–2024 went toward staff-related costs, including certificated salaries (22.3%), classified salaries (19.6%), and employee benefits (11.4%). Another 15.8% was spent on capital outlay, which includes long-term investments such as facilities upgrades, ventilation systems, and technology infrastructure. Although these types of expenditures may benefit all students, including English learners, the data does not provide enough specificity to assess whether these funds were used to support EL-specific actions. For this reason, we exclude ESSER expenditures from the analysis for RQs 2 and 3.
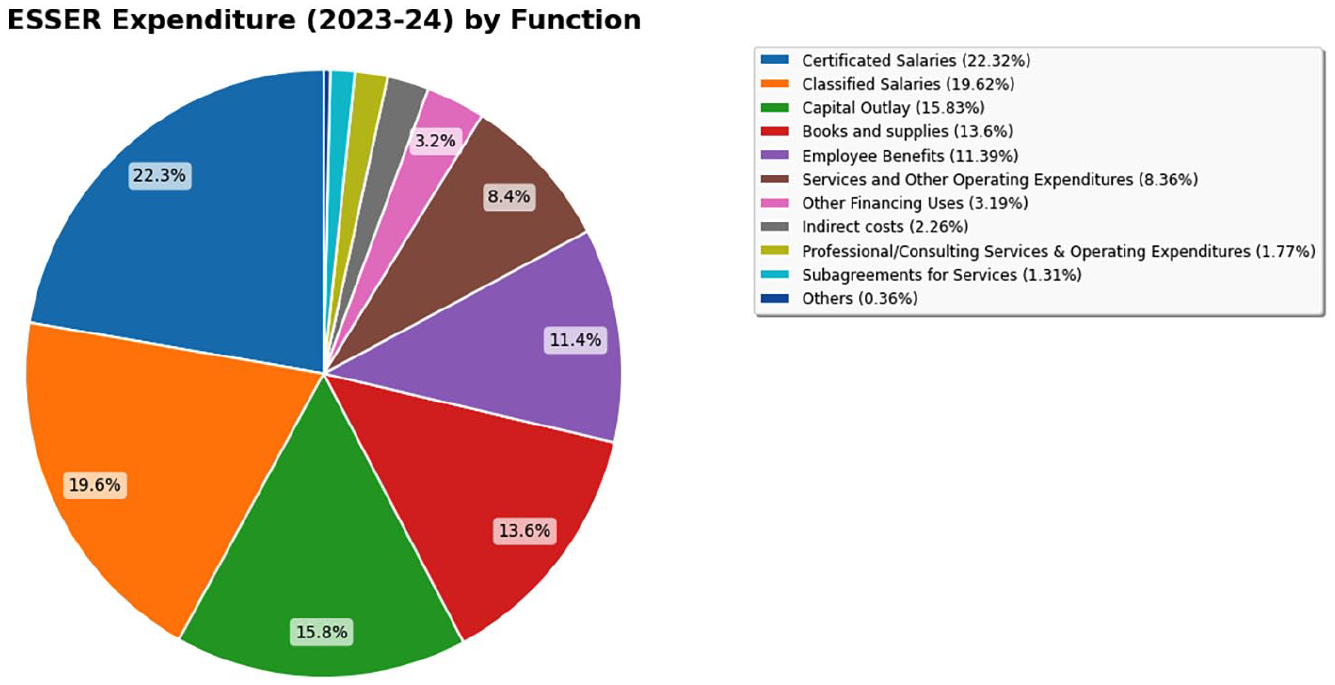
Federal Funding (ESSER) Expenditures.
Results
Table 1 presents an overview of our sample’s demographic and budgetary characteristics, disaggregated by EL group (i.e., low, medium, or high proportion of EL students). Our sample of 30 unified school districts has, on average, 12 schools and about 7,619 students per district, of whom 18.8% are classified as English learners. 5 Despite the class size difference, the average proportion of EL students in our district sample is comparable to that of Los Angeles Unified (20.1%) and the statewide average (18.4%) for the 2023–2024 school year, according to the CDE’s DataQuest. Within the sample, Low EL districts tend to be smaller and operate fewer schools than those with Medium or High EL concentrations. However, as Table 1 shows, it’s worth noting that the districts serving the highest proportions of ELs are not necessarily the largest in terms of total student enrollment.
Sample Characteristics, Based on 2023–2024 LCAP and SACS Data.
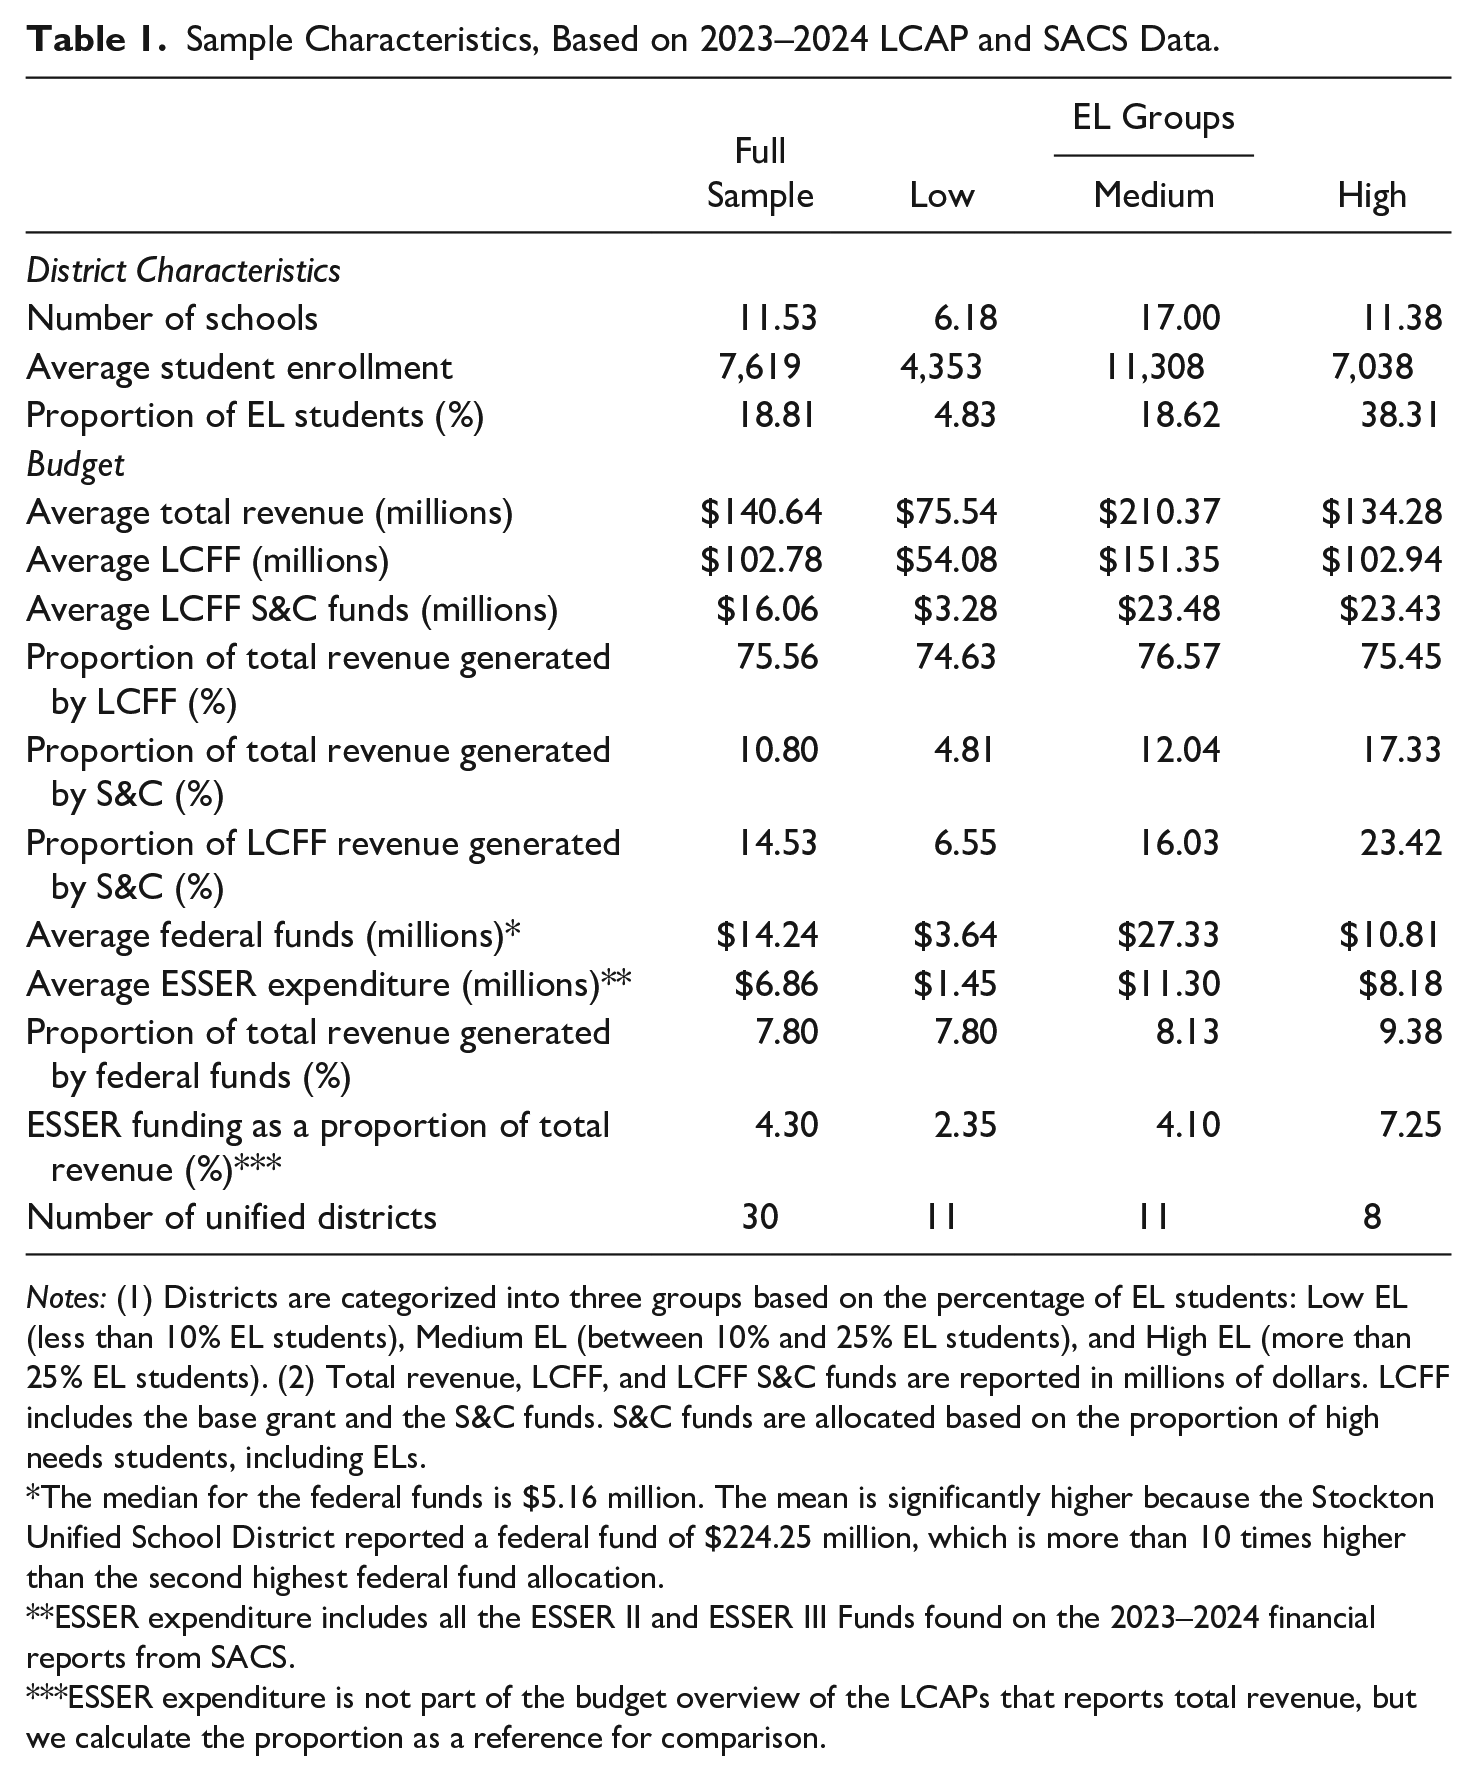
Notes: (1) Districts are categorized into three groups based on the percentage of EL students: Low EL (less than 10% EL students), Medium EL (between 10% and 25% EL students), and High EL (more than 25% EL students). (2) Total revenue, LCFF, and LCFF S&C funds are reported in millions of dollars. LCFF includes the base grant and the S&C funds. S&C funds are allocated based on the proportion of high needs students, including ELs.
The median for the federal funds is $5.16 million. The mean is significantly higher because the Stockton Unified School District reported a federal fund of $224.25 million, which is more than 10 times higher than the second highest federal fund allocation.
ESSER expenditure includes all the ESSER II and ESSER III Funds found on the 2023–2024 financial reports from SACS.
ESSER expenditure is not part of the budget overview of the LCAPs that reports total revenue, but we calculate the proportion as a reference for comparison.
Our sample of districts received, on average, about $100 million in state revenue through the LCFF, of which $16 million was from supplemental and concentration grants (LCFF S&C). 6 As for federal funds, also extracted from the LCAP’s Budget Overview, our sample reported an average allocation of $14.24 million. However, the median federal allocation of $5.16 million is a more reliable indicator, because the average is skewed by one district that reported receiving $224.25 million, which is more than 10 times higher than the second largest federal allocation in our sample. We consider this district as an outlier. Finally, average ESSER expenditures, calculated from SACS’s financial records (because ESSER is not included in the total revenue reported in the LCAPs), is equal to $6.86 million, which is equivalent to 48.17% of the reported average federal funds and 42.7% of the LCFF S&C allocation.
RQ1. How Do Districts’ EL Student Percentages Relate to Their Funding Composition and Expenditure Reporting Practices Post-pandemic?
We begin this section by establishing the relationship between the proportion of English learner students in these districts and key budget and expenditure variables. High EL districts derive a significantly larger share of their total revenue from LCFF S&C funds—17.3% compared to just 4.8% for Low EL districts and 12% for Medium EL districts (Table 1). Similarly, the percentage of LCFF revenue derived from LCFF S&C follows this same trend across EL groups. These findings reflect the targeted nature of LCFF S&C funding, designed to allocate additional resources to districts serving higher proportions of high needs students, including English learners. In contrast, the percentage of total revenue generated by the overall LCFF formula does not mirror this pattern, because there’s less than a one-point difference across EL groups, ranging between 74.6% and 76.6%. As shown in Table 1, Medium EL districts tend to enroll more students on average, resulting in base grant allocations that outweigh the relative contributions of LCFF S&C. However, in Table 2, when we control for differences in district size, estimating per-student allocations, the targeted approach of LCFF S&C funding emerges even more clearly, translating into relatively higher per-student funding for High EL districts.
Average Funding Allocations by EL Group, 2023–2024.
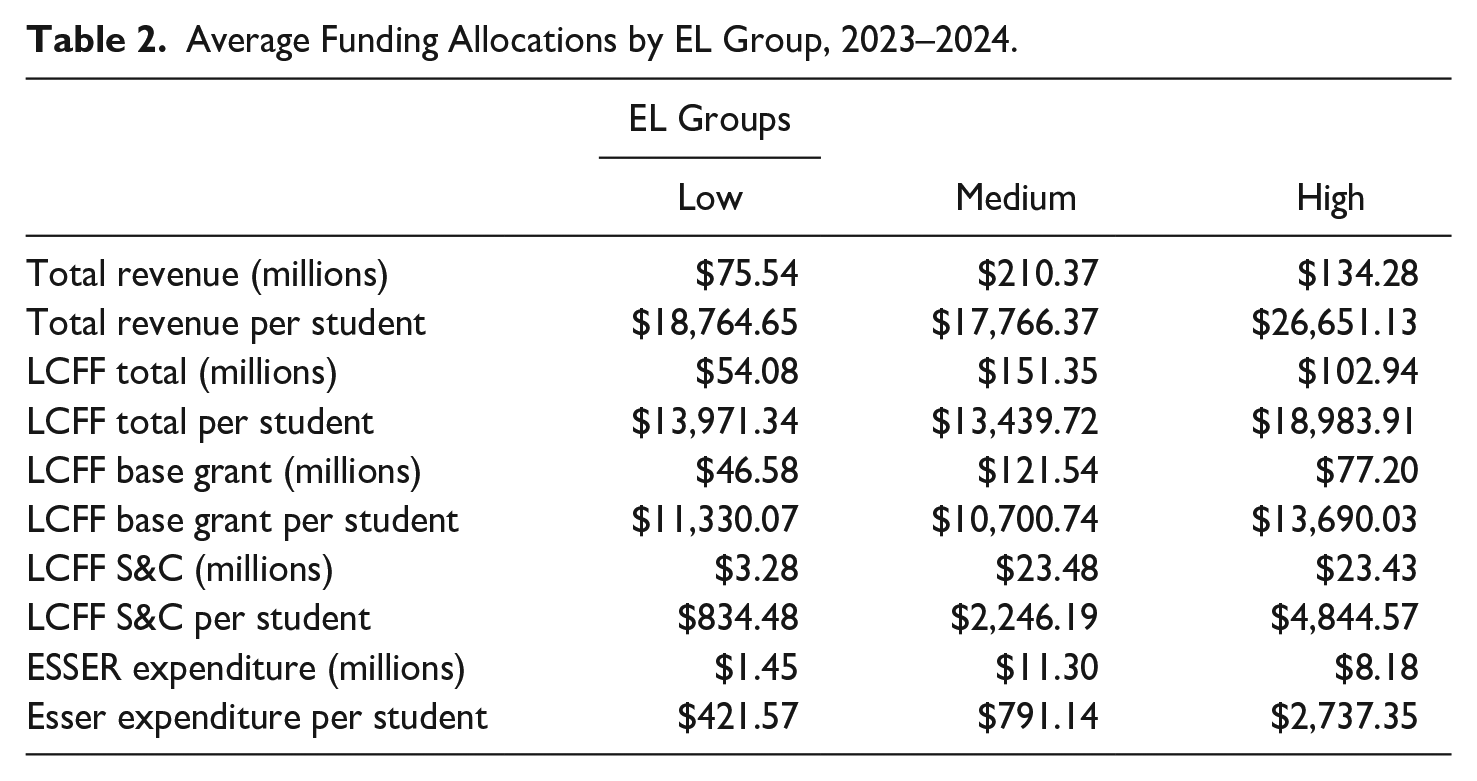
Next, we calculated how much of the districts’ planned expenditure budget for the academic year is captured—in terms of actions—within the LCAP. On average, districts only disclose how they will spend 41% of their planned expenditure budget in the LCAP, because many districts choose to exclude employees’ salaries and benefits. High EL districts report 55.1% of their planned expenditure budget—better than the reporting average—while Medium and Low EL districts report only 39.7% and 33.7%, respectively. As previously discussed, LCFF requires districts that receive S&C funds to spend on these funds and keep or increase service levels for students—these numbers suggest there is indeed a higher level of compliance among these districts with reporting the use of S&C funds than for districts receiving fewer funds through this channel.
ESSER expenditures follow a similar pattern to LCFF S&C funding, with districts serving higher proportions of English learners receiving significantly more on a per-student basis: $2,737.35 in High EL districts compared to just $421.57 in Low EL districts and $791.14 in Medium EL districts. Although ESSER funds were allocated based on Title I formulas that account only for low-income student counts, LCFF S&C allocations are based on the number of socioeconomically disadvantaged students, EL-designated students, and students in foster care. The shared emphasis on socioeconomic disadvantage likely contributes to the observed overlap, because districts with High EL concentrations also tend to serve large numbers of low-income students. Still, unlike LCFF S&C funds, which are subject to specific reporting requirements tied to high needs student groups, ESSER funds were designed with broad flexibility. 7
RQ2: Is the Funding Destined for EL-Specific Actions Proportional to EL Enrollment and Priorities?
LCFF requires LEAs to spend funds on actions that “increase or improve” services for high needs students in proportion to the additional funding these students generate. This equity obligation, known as the “proportionality requirement,” is measured in LCAPs through two key variables in the Contributing Actions Table Summary: the Total Percentage to Increase or Improve Services and the Planned Percentage to Increase or Improve Services. By comparing these, we can determine if LEAs have met or exceeded their minimum obligation to increase or improve services for high needs students. However, previous research, and our own review of the contributing actions, reveal that LEAs often include actions in their plans that are designed to benefit all students, not exclusively unduplicated high need student groups. As previously noted, many LEAs do this to comply with the proportionality requirement (Li et al., 2023). Moreover, because our focus is on multilingual learners, we need a measure of proportionality that specifically captures services directed toward this student population. As we discussed in the previous sections, ELs benefit from general learning and teaching that benefits all students but also from specific services that attend to their unique linguistic and cultural needs.
To generate a measure of “effort,” we distinguish the funds that go toward EL-specific actions separately from those that target all high needs students (using the categories in the EL Learner Roadmap framework). Then, we divide this figure by the LCFF S&C to measure what percentage of funding pays for EL-targeted expenditures. Finally, we calculated the ratio between this spending percentage and the district’s EL student percentage to assess whether districts are spending proportionally on EL students relative to their EL student population. This ratio is our measure of “effort.” For example, if a district spends 30% of its LCFF S&C funds on EL-specific actions and has a student population of 20% English learners, the ratio would be 1.5, indicating the district spends 50% more on EL-targeted services than expected based purely on EL enrollment. A higher ratio reveals greater “effort” than a lower ratio. However, because outlier districts can skew the average ratio, we calculate a weighted measure of effort that weighs each district’s effort by their relative contribution to the LCFF S&C total. (In other words, the ratios are adjusted based on district total high needs student enrollment.)
Results are shown in Figure 4. (Full results can be found in Table A1 in the online appendix.) The weighted average for all districts is 0.20, indicating that, on average, districts do not prioritize EL-specific actions in S&C spending.
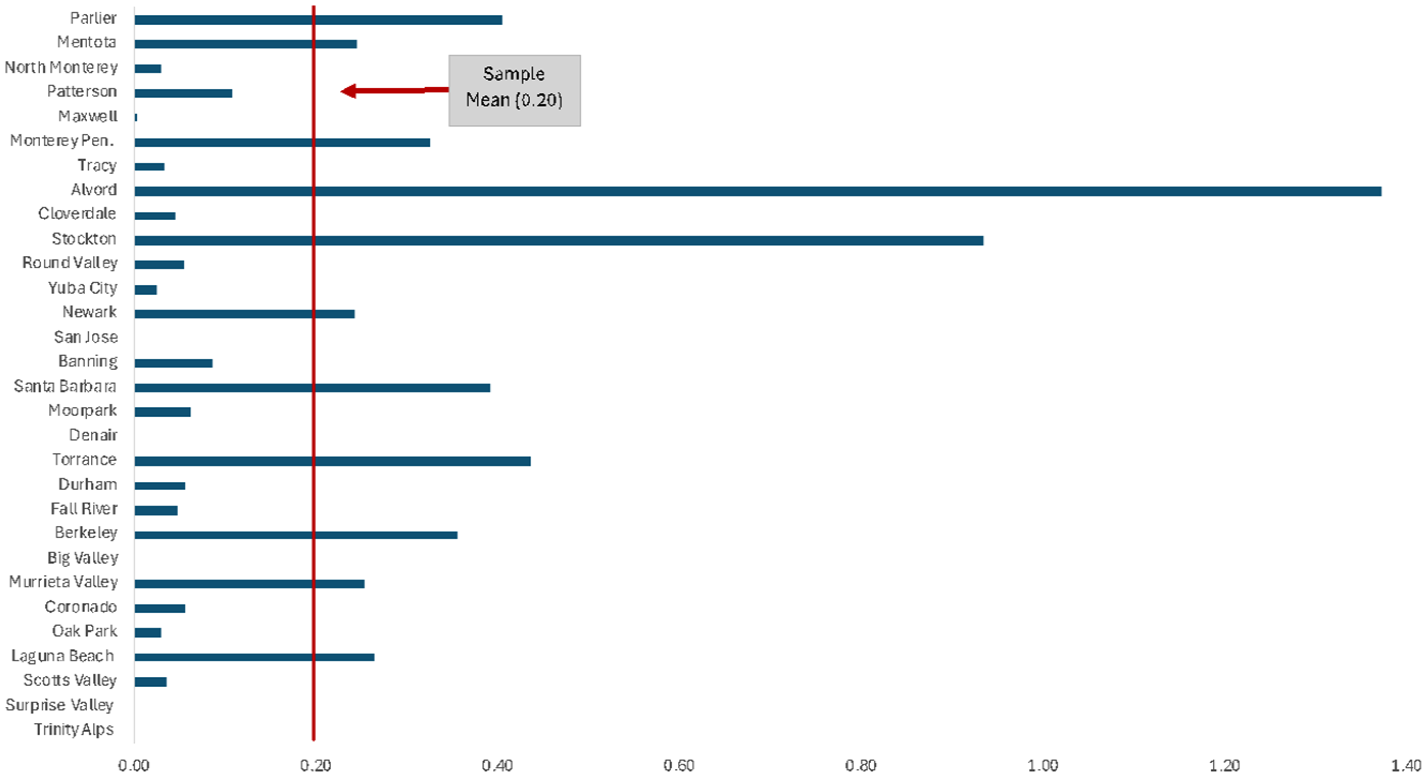
EL-Specific Proportionality Ratio: Weighted Average by District.
The total number of EL-specific actions, relative to the total number of actions these districts lay out in their LCAPs, vary among districts but are generally few. Although this is a crude measure of whether districts prioritize EL spending, it is noteworthy that, on average, only about 12% of the actions specified in the LCAP are EL-specific actions (see Table A1 in the Online Appendix).
One additional finding that stands out from this analysis is the negative relationship between EL “effort” (measured by the EL-specific proportionality ratio [simple average] and the size of the EL group in a district [EL proportion]) (see Figure 5). Districts with more ELs propose lower amounts of EL-specific funding. Again, it is possible that these districts are disproportionately spending more on actions that benefit all high needs students (including ELs). As previously mentioned, High EL districts are not usually the largest districts, but are medium-sized districts that may not have enough infrastructure or capacity to plan specifically for ELs. Case studies of a small group of districts has found that greater concentrations of EL-classified students in districts can make it easier for district administrators to plan supports and services specifically for these students—for example, one California school with an especially large population of newcomer EL-classified students was able to develop newcomer-specific programming because it had sufficient resources (Obeso et al., 2023). This same study, however, found that having a higher proportion of EL-classified students did not always make it easier for schools and districts to support these students—especially when districts had a diverse EL population (in terms of language).
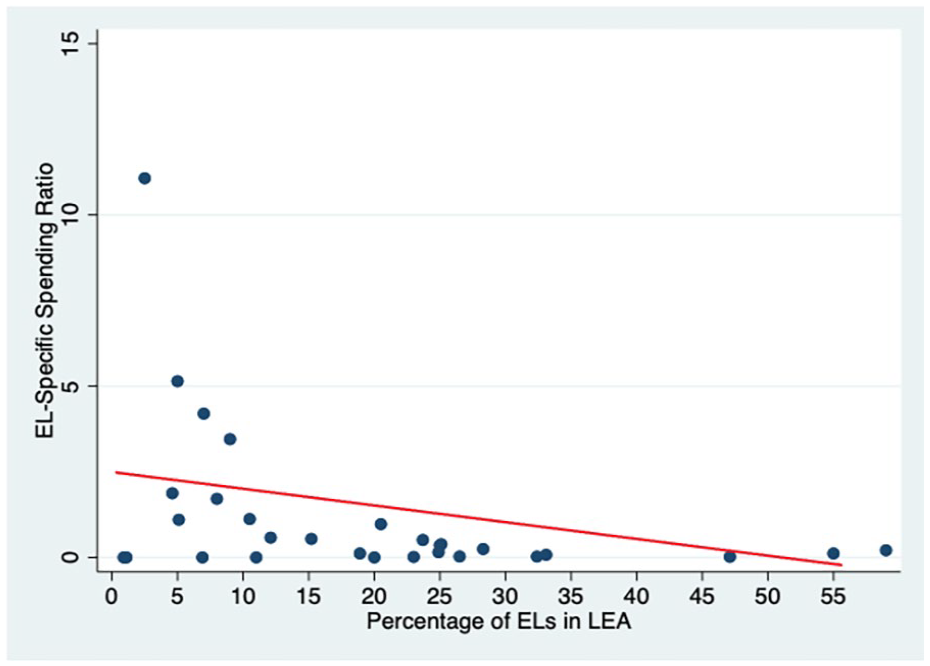
Correlation Between EL Spending Ratio (“Effort”) and Proportion of EL Students in District.
RQ3: What Actions Were Taken By School Districts in California to Address EL-Specific Needs Post-pandemic?
The previous section suggests that districts spent little on EL-specific actions in 2023–2024, and that this spending was not proportional to their EL enrollment. It is possible that districts chose to spend on actions that benefit all high needs students, including EL-designated students. If this is the case, the lack of EL specificity does not need to be an issue as long as those more general actions are thought to be specifically beneficial for ELs as well. This section takes a closer look at all of the actions included in the LCAPs of this sample of districts to understand whether this could be the case. To classify the actions that could be uniquely beneficial for ELs among more “generic” actions, we use the California EL Roadmap. Previous research from before the pandemic found that LCAPs are not aligned to the EL Roadmap, to the extent that they could be (Lavandez et al.,, 2022).
We grouped the 701 actions in the sample LCAPs into 12 major thematic categories, based on the overall behavior that was being targeted (e.g., attendance) or activity (e.g., parental engagement or curriculum/instruction) (see Table 3). We then classify this action by those serving all high needs groups or serving EL students specifically. Districts can specify the subgroups targeted by each action, and we use this information. However, we found some instances of actions that were clearly EL-specific (e.g., “improve needs of EL students”) but that were nevertheless categorized as serving all students. In these cases, we reclassified the action as being EL-specific. We identified 82 actions—11.7% of the total—specifically targeting EL students, including actions to support students (N = 18), actions related to curriculum and instruction (N = 14), actions related to parent and family engagement (N = 12), and those related to professional development (N = 11).
LCAP Actions to Plan Supplemental and Concentration Grant Spending, 2023–2024—30 Selected Districts.
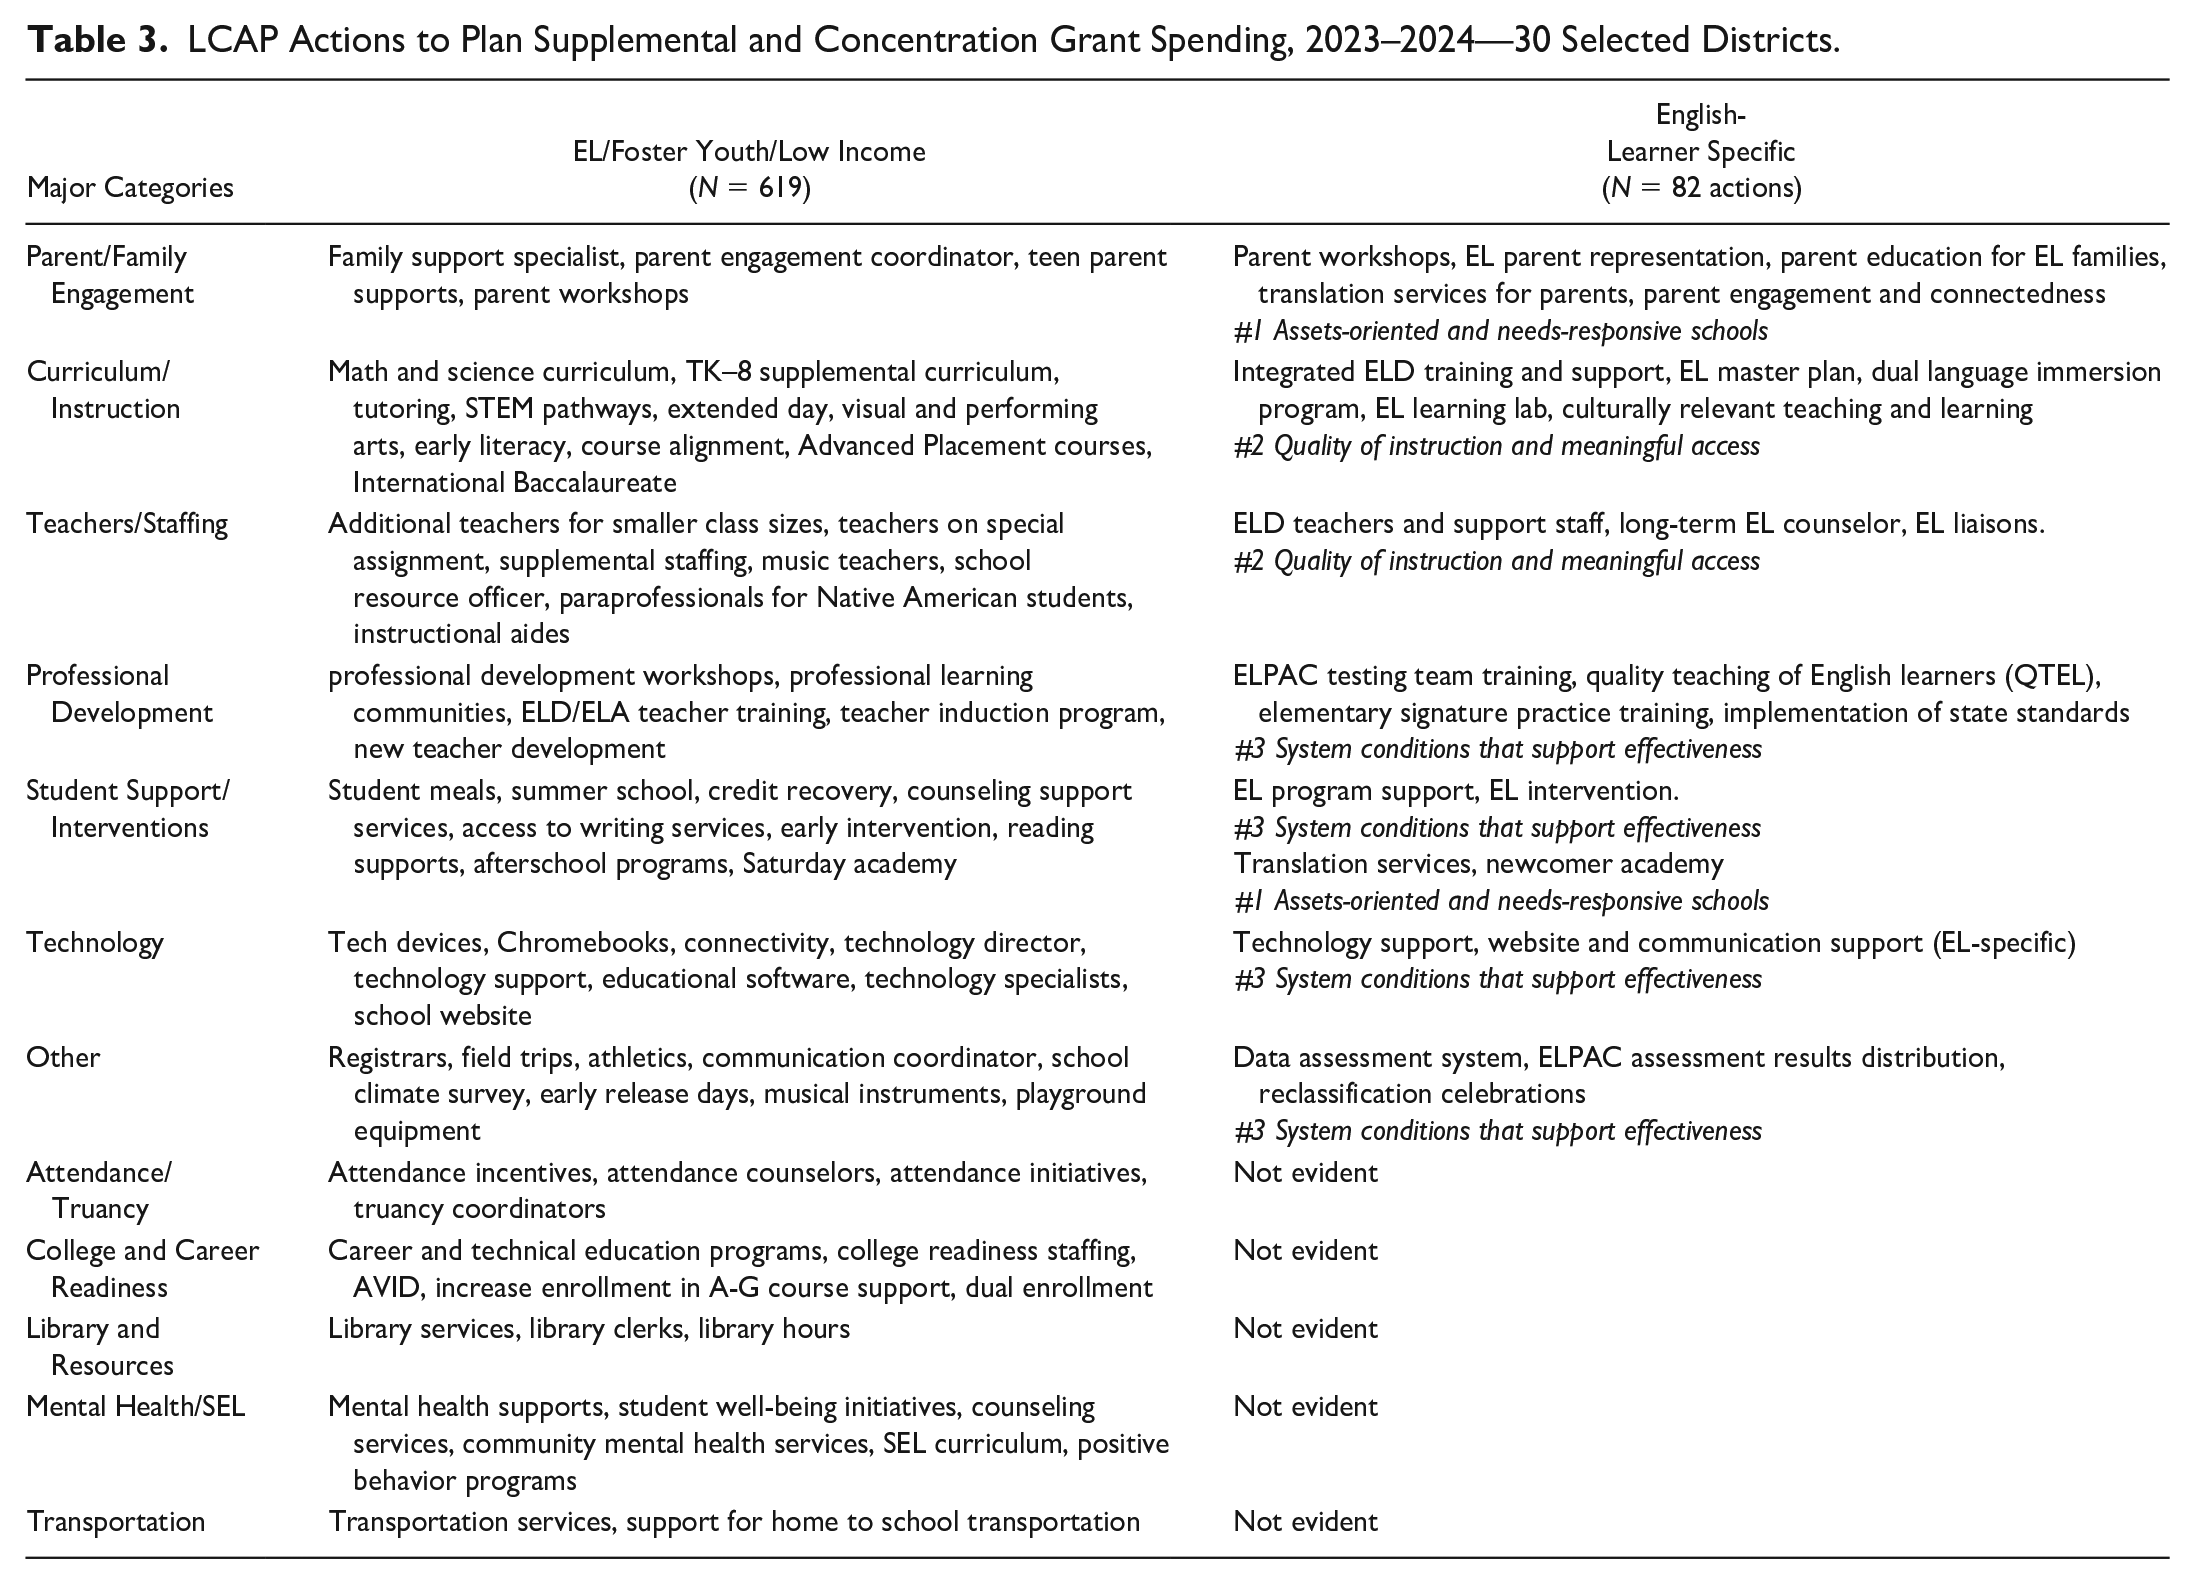
The EL-specific actions in these seven categories show varying degrees of EL specificity and alignment with California’s EL Roadmap principles, but in general, in terms of both the number and content of actions, we found that most districts planned LEA-wide or school-wide actions serving all student groups (including non–high needs students), rather than addressing the unique challenges faced by each group.
Most actions fall under Principle 3 of the EL Roadmap (system conditions to support effectiveness). We found limited evidence of actions supporting Principles 1 and 2, and no actions supporting Principle 4 (alignment and articulation across systems, particularly regarding program evaluation and cross-grade coordination). The lack of actions supporting Principle 2 (quality of instruction and meaningful access) could make sense if we recall that in California, since 2022, all teachers have an embedded EL authorization in their teaching credential. This means that unless they have significant numbers of EL-designated students, districts may be reluctant to spend on EL-specific professional development. We also found few actions supporting Principle 1 (assets-oriented and needs-responsive schools), which is more difficult to understand given the breadth of research supporting these kinds of practices for EL-designated students. Given the significance of pandemic disruptions and learning losses for EL-designated students, this approach may not effectively meet their specific needs and support their success as outlined in California’s EL Roadmap framework.
Discussion
Around 10% of students nationwide are designated ELs. In California, at any given time nearly 20% of students are designated ELs. The vast majority of these students are multilingual U.S. citizens who enter this designation because they speak a language other than English at home and have not yet demonstrated the required level of English language proficiency on standardized tests of language arts (among other reclassification criteria). EL-designated students face exclusionary practices and must overcome significant obstacles in their academic trajectories (Callahan, 2018; Paris & Alim, 2014; Santibañez & Umansky, 2018; Umansky & Porter, 2020).
EL students and their communities were significantly affected by the COVID-19 pandemic. EL services and supports at the school level were severely disrupted with the shift to online/remote learning in the vast majority of schools in California, and in many schools across the country. Around the nation and in California, EL test scores dropped significantly in both ELA and mathematics in numbers that surpassed trends among other high needs students (Pier et al., 2021; Reed et al., 2022). EL linguistic proficiency suffered too, as did chronic absenteeism, which up until the pandemic had not been a serious concern for this student population (Santibañez et al., 2024).
To deal with the extraordinary challenge of managing school closures and maintaining learning continuity during the pandemic years, districts received unprecedented levels of funding and support through the federal and state governments. This study aims to understand how these funds were spent on EL-designated students and whether districts changed their budget planning practices to prioritize this student population. California is a useful case study for this question. Its decentralized finance system—in place now for over a decade—supports a more detailed analysis of how ELs are being spotlighted (or not) in district planning documents.
The small number of research studies looking at LCAP plans prior to the pandemic had found that LCAPs tend not to spend proportionally on the high needs students that generate a significant proportion of these funds, and that districts tend to be vague in describing their actions, even when they target students with unique needs such as ELs (Armas et al., 2015; Lavadenz et al., 2018, 2022; Hill & Ugo, 2015; Humphrey et al., 2017; Olsen et al., 2016; Silberstein & Roza, 2020). In addition, the small number of studies that has looked specifically at EL spending and planning before the pandemic found that the vast majority of LCAPs did not include many EL-specific actions; when they did, these actions were weakly linked to the evidence base and to promising practices as detailed in EL frameworks such as the California EL Roadmap (Lavadenz et al., 2022; Olsen et al., 2016).
Our findings are in line with much of the work done pre-pandemic. Using a random sample of 30 LCAPs, this study finds that the majority of LCAPs did not prioritize EL-student spending. Except for one of the districts we analyzed, all districts had low levels of EL funding “effort,” which did not reach proportionality. This is an indication that either ELs are not being prioritized or districts were spending in categories that are broad enough to accommodate other student needs as well. Research has consistently found that effective instruction for multilingual learners (ELs) uses unique, specialized instructional strategies, family engagement practices, and other differentiated supports (Goldenberg, 2020, 2015; Lopez & Santibañez, 2018; Takanishi & Menestrel, 2017; Paris & Alim, 2014; Santibañez et al., 2021; Villegas & Lucas, 2002). Some LCAPs did include EL Roadmap–aligned actions such as integrated ELD training and support, translation services for parents, newcomer academy, and EL liaisons. Most actions, however, either did not align to EL Roadmap practices (e.g., technology support, data assessment systems, etc.) or were too vague to understand how they could be deployed to support EL student needs (e.g., parent engagement and connectedness). In addition, we found a negative relationship between EL “effort” and EL district enrollment. This means that districts may need to reach a critical mass of EL students to be able to spend more specifically (and closer to proportionally) on their needs. This is also in line with previous research findings that larger districts or districts in which ELs make up a significant group find it easier to implement and plan supports for this subgroup (Obeso et al., 2023).
This analysis suggests that even though ELs faced a considerable learning and absence crisis after the pandemic, districts seemed to continue doing “business as usual” in terms of how they plan and budget to support EL-designated students. This could signal structural limits to these planning exercises—districts may prefer to be vague and retain maximum flexibility—or it could also indicate that districts, particularly those with small populations of ELs, may not know how to plan for EL-specific funding or elect not to make it a priority. Our analysis is limited by how districts choose to describe actions in the LCAP; it is also possible that we misclassify some actions that address EL-classified students specifically, even though they are not labeled as such by the district. Nevertheless, it is noteworthy that one of the largest crises ever facing EL-classified students did not seem to change how districts plan for these students. The size of the funding pie increased, but the way districts planned and distributed the funding seems to have remained more or less the same.
Using an ecological systems lens, our findings highlight how decisions at different levels—from state funding formulas (macrosystem) to district resource allocation (exosystem) to school-level implementation (microsystem)—collectively impact EL student outcomes. Effective policy interventions must address all of these system levels if they are to translate into specific actions in the classroom. State education agencies need to establish clearer guidelines requiring districts to specify how their proposed actions will address EL-specific needs, particularly those exacerbated by pandemic disruptions, and how these actions align with the California EL Roadmap’s evidence-based practices for multilingual learners. Although districts require flexibility to respond to their local contexts and changing EL demographics, this flexibility must be accompanied by stronger system-level guidance and support. Even though California has a highly decentralized system of education, the necessity to guarantee the rights of ELs means schools cannot be left alone to address the complex needs of these students; rather, county and state education agencies should provide the frameworks, technical assistance, data, and accountability measures to help translate increased funding into effective practices for multilingual learners.
Limitations
This analysis has several limitations. First, we examine only one LCAP year (2023–2024). Although these documents constitute three-year plans, they have to be updated annually, which means some of the actions here could change. Second, we did not perform an analysis of LCAPs over time that would allow us to conclude more forcefully that EL priorities changed (or did not change) pre- and post-pandemic. Our comparison is based on our analysis relative to what was found in the literature pre-pandemic. Lastly, as previously discussed, districts can plan certain actions in the LCAP and then do something different. Moreover, they could write these actions in ways that are deliberately vague to give themselves flexibility should conditions or priorities later change. Many districts plan their LCAPs without much input from parents, stakeholders, and the larger community—and even less input from LCFF targeted groups (Humphrey et al., 2017; Lavadenz et al., 2022; Marsh & Hall, 2018). Most districts also do not face serious scrutiny from the County Offices of Education regarding their planning and spending practices (Li et al., 2023). It is possible that the LCAP needs to be rethought as a policy tool to ensure that funds for high needs populations like ELs actually reach them and that the state or county can demand adequate accountability to encourage districts to think more deeply and engage better with relevant stakeholders to ensure the needs of EL students are being addressed.
Conclusion
Despite facing one of the largest crises ever confronting EL-classified students and receiving more funding, districts did not seem to fundamentally alter how they plan and spend for these students. Our analysis suggests LCAPs could be used differently—not as compliance documents that districts must submit with little follow-up and no feedback, but as valuable data sources that systematically inform education policy. LCAPs could be coded and analyzed at scale to identify patterns in how districts address the needs of vulnerable student populations. The rise in AI-assisted means to code and analyze large amounts of text makes this a real possibility. For multilingual learners specifically, this systematic analysis could reveal whether districts with changing EL demographics are adjusting their strategies appropriately, which practices aligned with the California EL Roadmap are being adequately funded, and, over time, which of these practices are effectively leading English learners to reclassification.
Our analysis also suggests, however, that the LCAP may not be well-suited for driving targeted planning. Given districts’ need for flexibility and the ability to adjust plans in real time, many district officials may be unwilling or unable to include detailed, specific actions in the LCAP beyond broad categories. This lack of specificity limits the state’s capacity to monitor whether its guidance—such as the California EL Roadmap—is being implemented at the school and classroom level. In California’s highly decentralized system, this tradeoff may seem acceptable; however, it ultimately weakens the state’s ability to use funding mechanisms, redistribution, and local accountability processes to ensure more equitable outcomes and services for its most marginalized students.
Supplemental Material
sj-docx-1-tcz-10.1177_01614681251378290 – Supplemental material for Exploring the Impact of COVID-19 on District Spending for English Learners
Supplemental material, sj-docx-1-tcz-10.1177_01614681251378290 for Exploring the Impact of COVID-19 on District Spending for English Learners by Lucrecia Santibañez and Marlene Saint Martin in Teachers College Record
Footnotes
Declaration of Conflicting Interests
The authors declared no potential conflicts of interest with respect to the research, authorship, and/or publication of this article.
Funding
The authors received no financial support for the research, authorship, and/or publication of this article.
Supplemental Material
Supplemental material for this article is available online.
Notes
Author Biographies
References
Supplementary Material
Please find the following supplemental material available below.
For Open Access articles published under a Creative Commons License, all supplemental material carries the same license as the article it is associated with.
For non-Open Access articles published, all supplemental material carries a non-exclusive license, and permission requests for re-use of supplemental material or any part of supplemental material shall be sent directly to the copyright owner as specified in the copyright notice associated with the article.