
Abstract
This paper investigates the long-term impacts of the federal Home Owners’ Loan Corporation (HOLC) mortgage risk assessment maps on the spatial dynamics of recent income and racial distributions in California metropolitan areas over the 1990-2010 period. We combine historical HOLC boundaries with modern Census tract data and apply recently developed methods of spatial distribution dynamics to examine if legacy impacts are reflected in recent urban dynamics. Cities with HOLC assessments are found to have higher levels of isolation segregation than the non-HOLC group, but no difference in unevenness segregation between the two groups of cities are found. We find no difference in income or racial and ethnic distributional dynamics between the two groups of cities over the period. At the intra-urban scale, we find that the intersectionality of residing in a C or D graded tract that is also a low-income tract falls predominately upon the minority populations in these eight HOLC cities. Our findings indicate that neighborhoods with poor housing markets and high minority concentrations rarely experience a dramatic change in either their racial and ethnic or socioeconomic compositions—and that negative externalities (e.g. lower home prices and greater segregation levels) emanate from these neighborhoods, with inertia spilling over into nearby zones.
Introduction
A recent study by the Federal Reserve Bank (Emmons 2020) has reported that over the period 1994-2019 the average increase in overall real housing wealth for Hispanic and Blacks Americans has outpaced that of white Americans. Inflation adjusted growth in housing wealth stood at 487% for Hispanic households, 155% for Black households, and 97% for white households. Despite these enormous differences, the average wealth gaps between white and Black (Hispanic) households remained at 25% (17%) by the end of the period.
Emmons (2020) offers two major reasons for the failure of the growth in housing wealth for non-white households to close the overall wealth gap with white households. First, much of the housing wealth growth was driven by population growth in the Black and Hispanic segments. Second, housing assets appreciated at lower rates than non-housing assets.
While these explanations accord with the dynamics of the wealth gap, they arguably do not exhaust all the forces at work in the housing market. Rothstein (2017) chronicles a long and widespread history of federal, state, and local policies in generating and maintaining segregation in the U.S. A critical question is whether one of the consequences of segregation has been chronic disinvestment in minority housing markets which, in turn, has reduced the average household housing wealth accumulation for minority versus white communities. According to Rothstein (2017):
“So the structural conditions established by 20th century federal policy endure to this day.”
In this paper we seek to unpack this endurance with a focus on a particular federal agency, the Home Owners’ Loan Corporation (HOLC). Through so called “Residential Security” maps, loan officers from the HOLC evaluated mortgage lending risk during the late 1930s. The HOLC maps have attracted enormous attention from scholars who have argued that the associated appraisal practices codified the practice of “redlining” (e.g. Jackson 1987; Faber 2017; Aalbers 2014; Krieger et al. 2020).
We are interested in the legacy impacts of these HOLC maps on modern urban socioeconomic dynamics, and we examine a number of research questions. Do cities that were subjected to HOLC based redlining display modern spatial dynamics in their ethnic and income distributions that are distinct from from those in comparable cities that did not have HOLC maps? Are HOLC legacy impacts seen at the city-wide scale? Are HOLC cities different in the level and type of segregation they now experience relative to cities without a history of HOLC maps? At the neighborhood scale, do tracts that were subject to HOLC redlining display different amounts and forms of changes in their ethnic composition and income levels relative to tracts that were not targeted for HOLC designations?
Drawing on new methods of spatial dynamics, we investigate the long term impacts of HOLC maps on the evolution of ethnic patterns and income distributions in Census tracts in California. We examine these questions at two spatial scales, one that allows for a comparison of cities that were subject to HOLC mapping and those that were not, and one that examines the question at a a more granular level of tracts within HOLC cities to contrast tracts that were graded from those that were not subject to HOLC assessments. We also investigate spatial spillovers in the legacy effects in the sense of whether the long run impacts of HOLC maps are limited to the original tracts or if neighboring tracts show differentiation in their dynamics relative to tracts who do not neighbor HOLC graded tracts.
In the remainder of the paper, we first provide the broader context for our work by reviewing the literature on the history of HOLC maps and their impacts on urban areas. Our methodological framework is presented in Section 3. Section 4 contains the results for our city-wide and intra-urban analyses. We provide a discussion and interpretation of these results in Section 5, and the paper concludes with a summary of the key findings and the identification of future research directions.
Background
HOLC History
The HOLC was a New Deal era initiative designed to salvage the U.S. housing market during the first mortgage crisis, and whose primary purpose was “marketing government bonds to provide capital to purchase delinquent mortgages.” More bluntly, HOLC was created to bail out the American mortgage finance system, stemming foreclosures by purchasing mortgages from private lenders, simultaneously freeing private capital for lenders and lowering payments for homeowners. Today, HOLC is well known for its Residential Security Maps, a set of choropleth maps created for large American cities in which neighborhoods were partitioned into a set of discrete zones, each of which assigned a categorical designation of creditworthiness rated from A (best) to D (worst). In this exercise, “creditworthiness” was primarily a function of the neighborhoods’ racial and ethnic composition, with minority neighborhoods and especially black neighborhoods rated poorly.
Despite HOLC’s singular recognition for mapping racialized lending, the organization’s goals from its inception were actually twofold: “(1) to relieve troubled financial institutions and purchase defaulting mortgages and (2) to provide relief directly to homeowners and offer fully amortized mortgages at a lower rate than their existing mortgages (Crossney and Bartelt 2005).” And these distinct aims were undertaken in two temporal phases: a ‘rescue’ phase from 1933-1935 during which HOLC provided generous refinancing for underwater mortgages (helping to free private capital), and a ‘consolidation’ phase from 1935-1951 during which HOLC sold off its housing inventory (Michney and Winling 2020). In recent years, scholars like Michney and Winling (2020) have reiterated the importance of this timeline, because HOLC’s infamous maps were created during its second operational phase, and therefore could not have been used to guide lending decisions.
Thus, while HOLC’s mapping activities have been widely criticized in this regard, its philosophy of racialized lending was neither novel nor original, but part of a larger initiative by the federal government to provide underwriting standards based on the prevailing social theory “that property values increased temporarily when African Americans moved in and then dropped precipitously” (Hillier 2005). The FHA, for example, described in its 1935 manual its expectation that “lenders to rate the neighborhood as well as the property, taking into consideration the stability of an area, its protection from ‘adverse influences,’ and access to transportation, utilities and services, and commercial institutions, among other factors” (Hillier 2005). Home owners’ loan corporation’s residential security designations fully embodied this notion, justifying their work through the lens of Chicago School neighborhood tipping: “if a neighborhood is to retain stability, it is necessary that properties shall continue to be occupied by the same social and racial classes.”
Because of the notoriety its maps have gained, HOLC today is viewed widely as original instigator of racial redlining, the practice of racialized lending practices in which red pens were used to draw circles around black neighborhoods as demarcators of non-funding zones. There remains considerable debate, however, regarding HOLC’s ultimate culpability in the widespread practice of redlining. Some scholars such as Hillier (2003) have argued that HOLC was an unlikely originator of redlining for several reasons, including that the practice of redlining predated HOLC’s City Survey Program in which the maps were created, and that very few lenders actually had access to HOLC’s maps. Causal attribution remains difficult, and the prevailing view among scholars is that “by federalizing longstanding discriminatory practices in the mainstream real estate industry and applying a veneer of social scientific methodology to property valuation, HOLC along with the Federal Housing Administration (FHA) helped to perpetuate a still-persistent belief among whites that the presence of African Americans invariably depreciates home prices” (Michney and Winling 2020, 151).
Regardless of whether racial redlining was instantiated, popularized, or justified by HOLC’s residential security maps, it is nonetheless clear that the corporation’s activities are the best documented source of a practice that continues to drive racialized inequality in the U.S., manifesting across a wide variety of outcomes, and the discovery and subsequent digitization of HOLC’s maps provides the most concrete avenue for studying the lingering effects of redlining.
The legacy of HOLC grading
Since the rediscovery of the HOLC maps in the 1980s, scholars have been deeply interested in the patterns of segregation they helped create, as well as the wide berth of unequal conditions facilitated by racial inequality in the mortgage market. A large body of work, for example, examines the relationship between redlined areas (often operationalized as those zones in HOLC’s maps graded “D”) and health consequences for residents and the ways redlining combined with existing patterns of segregation to leave “indelible patterns of social and environmental inequalities. These patterns are manifest in the distribution of environmental disamenities such as polluting industries, urban heat islands, and vulnerability to flooding, and they are also evident in the distribution of environmental amenities such as parks and trees (Grove et al. 2018).”
Evidence of health inequality stemming from redlining is widespread: Wilson (2020) finds that previously redlined areas have higher mean land surface temperatures, Nardone et al. (2020a) find greater rates of cancer, asthma, poor mental health, and people lacking health insurance, among neighborhoods that were previously redlined; the asthma effects of redlining appear particularly acute, as emergency room visits were 2–4 times higher in census tracts that were previously redlined. Further, Krieger et al. (2020) demonstrates that “net of age, sex/gender, and race/ethnicity, residing in a previously HOLC-redlined area imposed an elevated risk for late stage at diagnosis, even for residents of census tracts with present-day economic and racial privilege” and Nardone et al. (2020b) find increasing consequences for overall mortality and preterm birth as HOLC grade worsens.
Beyond health inequality, the legacy of redlining also continues to influence patterns of metropolitan segregation, even today. Using a difference-in-difference framework, Faber (2020) demonstrates that cities in which HOLC was active, segregation increased significantly compared to non-HOLC cities, and further that “HOLC placed cities on dramatically different trajectories in the 1930s, which is still evident today—a manifestation of a broader pattern of the ‘historically consistent, sequentially reinforcing practice of repression [of black Americans]’ (Faber 2020, 740).” Indeed, because racial segregation creates feedback mechanisms for other sources of inequality such as neighborhood effects (Sampson 2012) and the accumulation of wealth (Rothstein 2017), so too has redlining shaped the economic geography of American cities, as many of the neighborhoods that received the lowest ratings in the 1930s are still associated with poor economic conditions today (Park and Quercia 2020). Collectively, a growing body of work shows evidence that racial segregation in housing, and the differential effects segregation has had on wealth accumulation helps explain today’s variation in racial economic geography and social mobility (Aaronson et al. 2018b).
Spatial work
The recent wave of scholarship on redlining, and the effects of HOLC’s maps, more specifically, have been facilitated by a concerted effort to scan, georeference, digitize, and archive the original hard copies the residential security maps, which may now enter modern spatial analysis workflows (Ducre and Moore 2011; Marciano et al. 2013; Nelson et al. 2016). Together these efforts help facilitate spatially-explicit modeling frameworks such as those employed by Hillier (2003) and Faber (2020), but their contributions also help elucidate they cloudy relationship between HOLC, redlining, and causal attribution of today’s neighborhood conditions by creating new, open datasets that can be combined with other historical and contemporary data significantly broadening the scope of redlining research (Bakelmun and Shoenfeld 2020).
In addition to facilitating wider research on the effects of HOLC’s maps, the work in digital history and cartography also articulates a more nuanced take the “effect” of HOLC’s map making activities: that the production of maps contextualizes urban areas giving a new frame for residents and outsiders alike that alters how space is perceived. These authors argue view “space as a social product in which all aspects of life, whether economic, political or cultural, are negotiated through the operation of power relations,” contending that the map making process itself “can actively structure the process of neighborhood change, through actions such as speculation, blockbusting, milking, redlining, pushing predatory loans, and prescribing shrinkage” (Aalbers 2014, 528).
Together the views from digital cartography align with Hillier (2003) holding that, in effect, “HOLC’s maps constituted federal endorsement of standards that were already in practice,” and that this endorsement by a federal agency may have started a feedback mechanism whose presence is detectable, even if redlining did not originate with the Home Owners Loan Corporation. Faber (2021) articulates this phenomenon slightly differently, contending that “while the HOLC did not invent racism in real estate, its segregationist design serves as an example of how the institutionalization of social categories can create ‘durable inequality’ ”. In the sections that follow, we interrogate this question in detail, asking whether we can detect a significant departure in neighborhood dynamics (a) among cities in which HOLC maps were created versus those where they were absent, and (b) among neighborhoods within the same city given different designations in HOLC’s grading typology.
Methodology
We investigate the legacy impacts of HOLC grades at two different spatial scales. At the inter-urban scale, we examine whether HOLC designations resulted in different city-wide urban dynamics. That is, do HOLC cities display changes in ethnic and income distributions that are distinct from those in cities that were not subject to HOLC grading? Following this, we shift the focus to the internal dynamics within the eight HOLC cities and explore questions about the spatially explicit impacts of tract HOLC designation on the evolution of the tract and its neighbors.
Data
We focus on case of HOLC impacts for cities in the state of California, namely Fresno, Los Angeles, Oakland, Sacramento, San Diego, San Francisco, San Jose, and Stockton. During the implementation of the HOLC program, a threshold of 40,000 population was used to target specific cities. This resulted in eight cities in the state being mapped by the HOLC. We obtained the geospatial boundaries for these cities from the Mapping Inequality project at the University of Richmond (Nelson et al. 2016) who have done the valuable work of digitizing the original maps for all participating cities in the U.S.
We combine the HOLC boundaries together with Census data using the package
Inter-Urban Dynamics
Ethnic churn
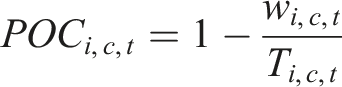
For each census tract and year we first measure racial composition as
We then develop a measure of ethnic churn that expresses the spatial dynamics in the distribution of minority tract composition. For each city, and year, we discretize the composition distribution into quintiles. A discrete Markov chain is then estimated for the time series of these quintiles using the package giddy (Kang et al. 2020)
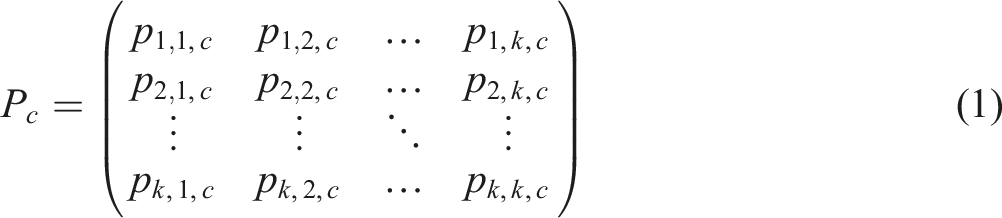
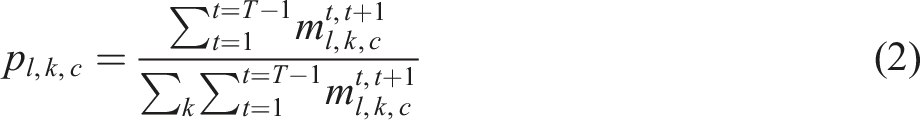
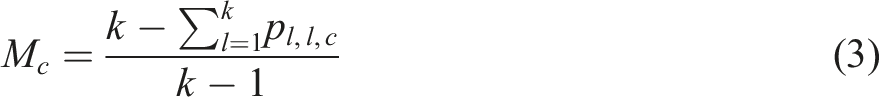
A standardized Markov mobility measure is obtained from

Income dynamics
In addition to ethnic churn, we also examine the question of different spatial income dynamics between the HOLC and non-HOLC cities in California. To do so, we utilize Tract Median Household Income (MHI) in each city, and similarly for what was done in measuring ethnic churn, we form the quintiles of MHI within each city and time period. A discrete Markov chain is estimated using these quintile time series, and a measure of spatial income dynamics is obtained by applying equation (4) to the estimated probability transition matrix for incomes.
Segregation
The third component of the inter-urban comparison considers differences in segregation between HOLC and non-HOLC cities. Two different measures of segregation are applied to each city and time period. The first is the index of dissimilarity
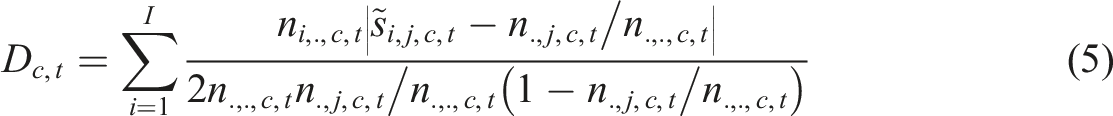
The second measure of segregation is the isolation index
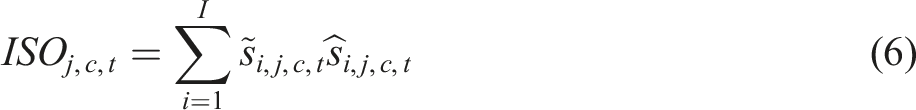
Isolation expresses how much a minority group is only exposed to members of their own group.
As Malmberg and Clark (2021) suggest, when used together, the dissimilarity and isolation indices can shed light on different dimensions of segregation, as it is possible that a measure of dissimilarity may not change over time, while isolation does. We use the PySAL package
Intra-Urban Dynamics
In our second set of analyses we shift to a more granular spatial scale by focusing on the 8 HOLC cities. These cities provide for a natural experiment in the sense that they contain tracts that received different HOLC grades as well as those that were not graded. This allows us to explore whether the trajectories of income and racial composition of tracts in these cities differed across the HOLC grade classes.
Income and ethnic churn dynamics conditioned on HOLC grade
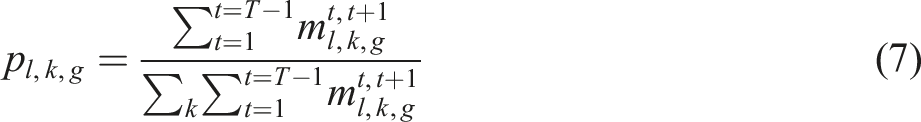
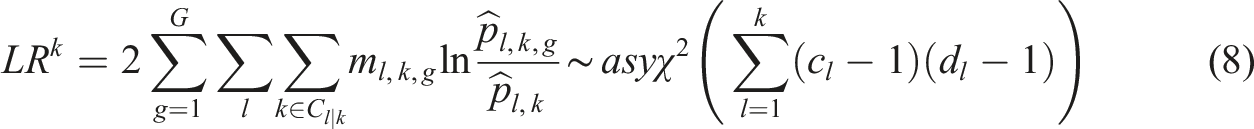
We rely on estimated Markov chains for the quintiles of both median household income and minority composition for each tract and city. Formal homogeneity tests are applied that pool the transitions from all eight cities and form strata of quintile transitions based on HOLC grades. More formally, we redefine the Markov chain from (2) as follows
Spatial spillovers
The same homogeneity framework can be adapted to test whether there are spatial spillovers in the dynamics of tract income and ethnic composition. This allows us to examine whether a tract’s income and ethnic dynamics are affected by the HOLC grade of neighboring tracts. Detection of any such spillovers would suggest spatial externalities arising from the HOLC designations. While the question of spatial dependence in the designation of the grades has been examined by Hillier (2005), the question of any contagion in effects of the HOLC grades has not been addressed.
To test for spatial spillovers of HOLC grade effects, we classify tracts according to their local spatial context using a categorical spatial lag from
Results
Spatial Distribution of HOLC Grades
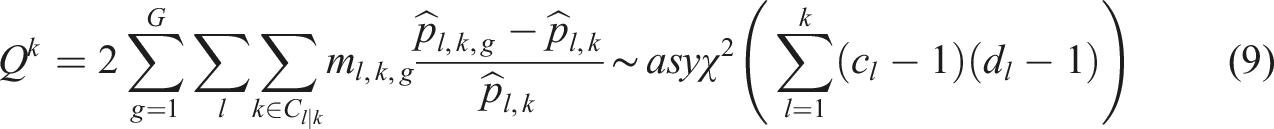
We begin with an overview of the spatial distribution of the HOLC grades in our study. There are two scales to consider. First is the selection of cities which HOLC maps were constructed. Recall from the previous discussion, cities had to have a population of at least 40,000 to be part of the HOLC program. Figure 1 shows the location of the eight HOLC cities within the state. These eight cites are Fresno, Los Angeles, Oakland, Sacramento, San Francisco, San Diego, San Jose, and Stockton. Home owners’ loan corporation cities in California.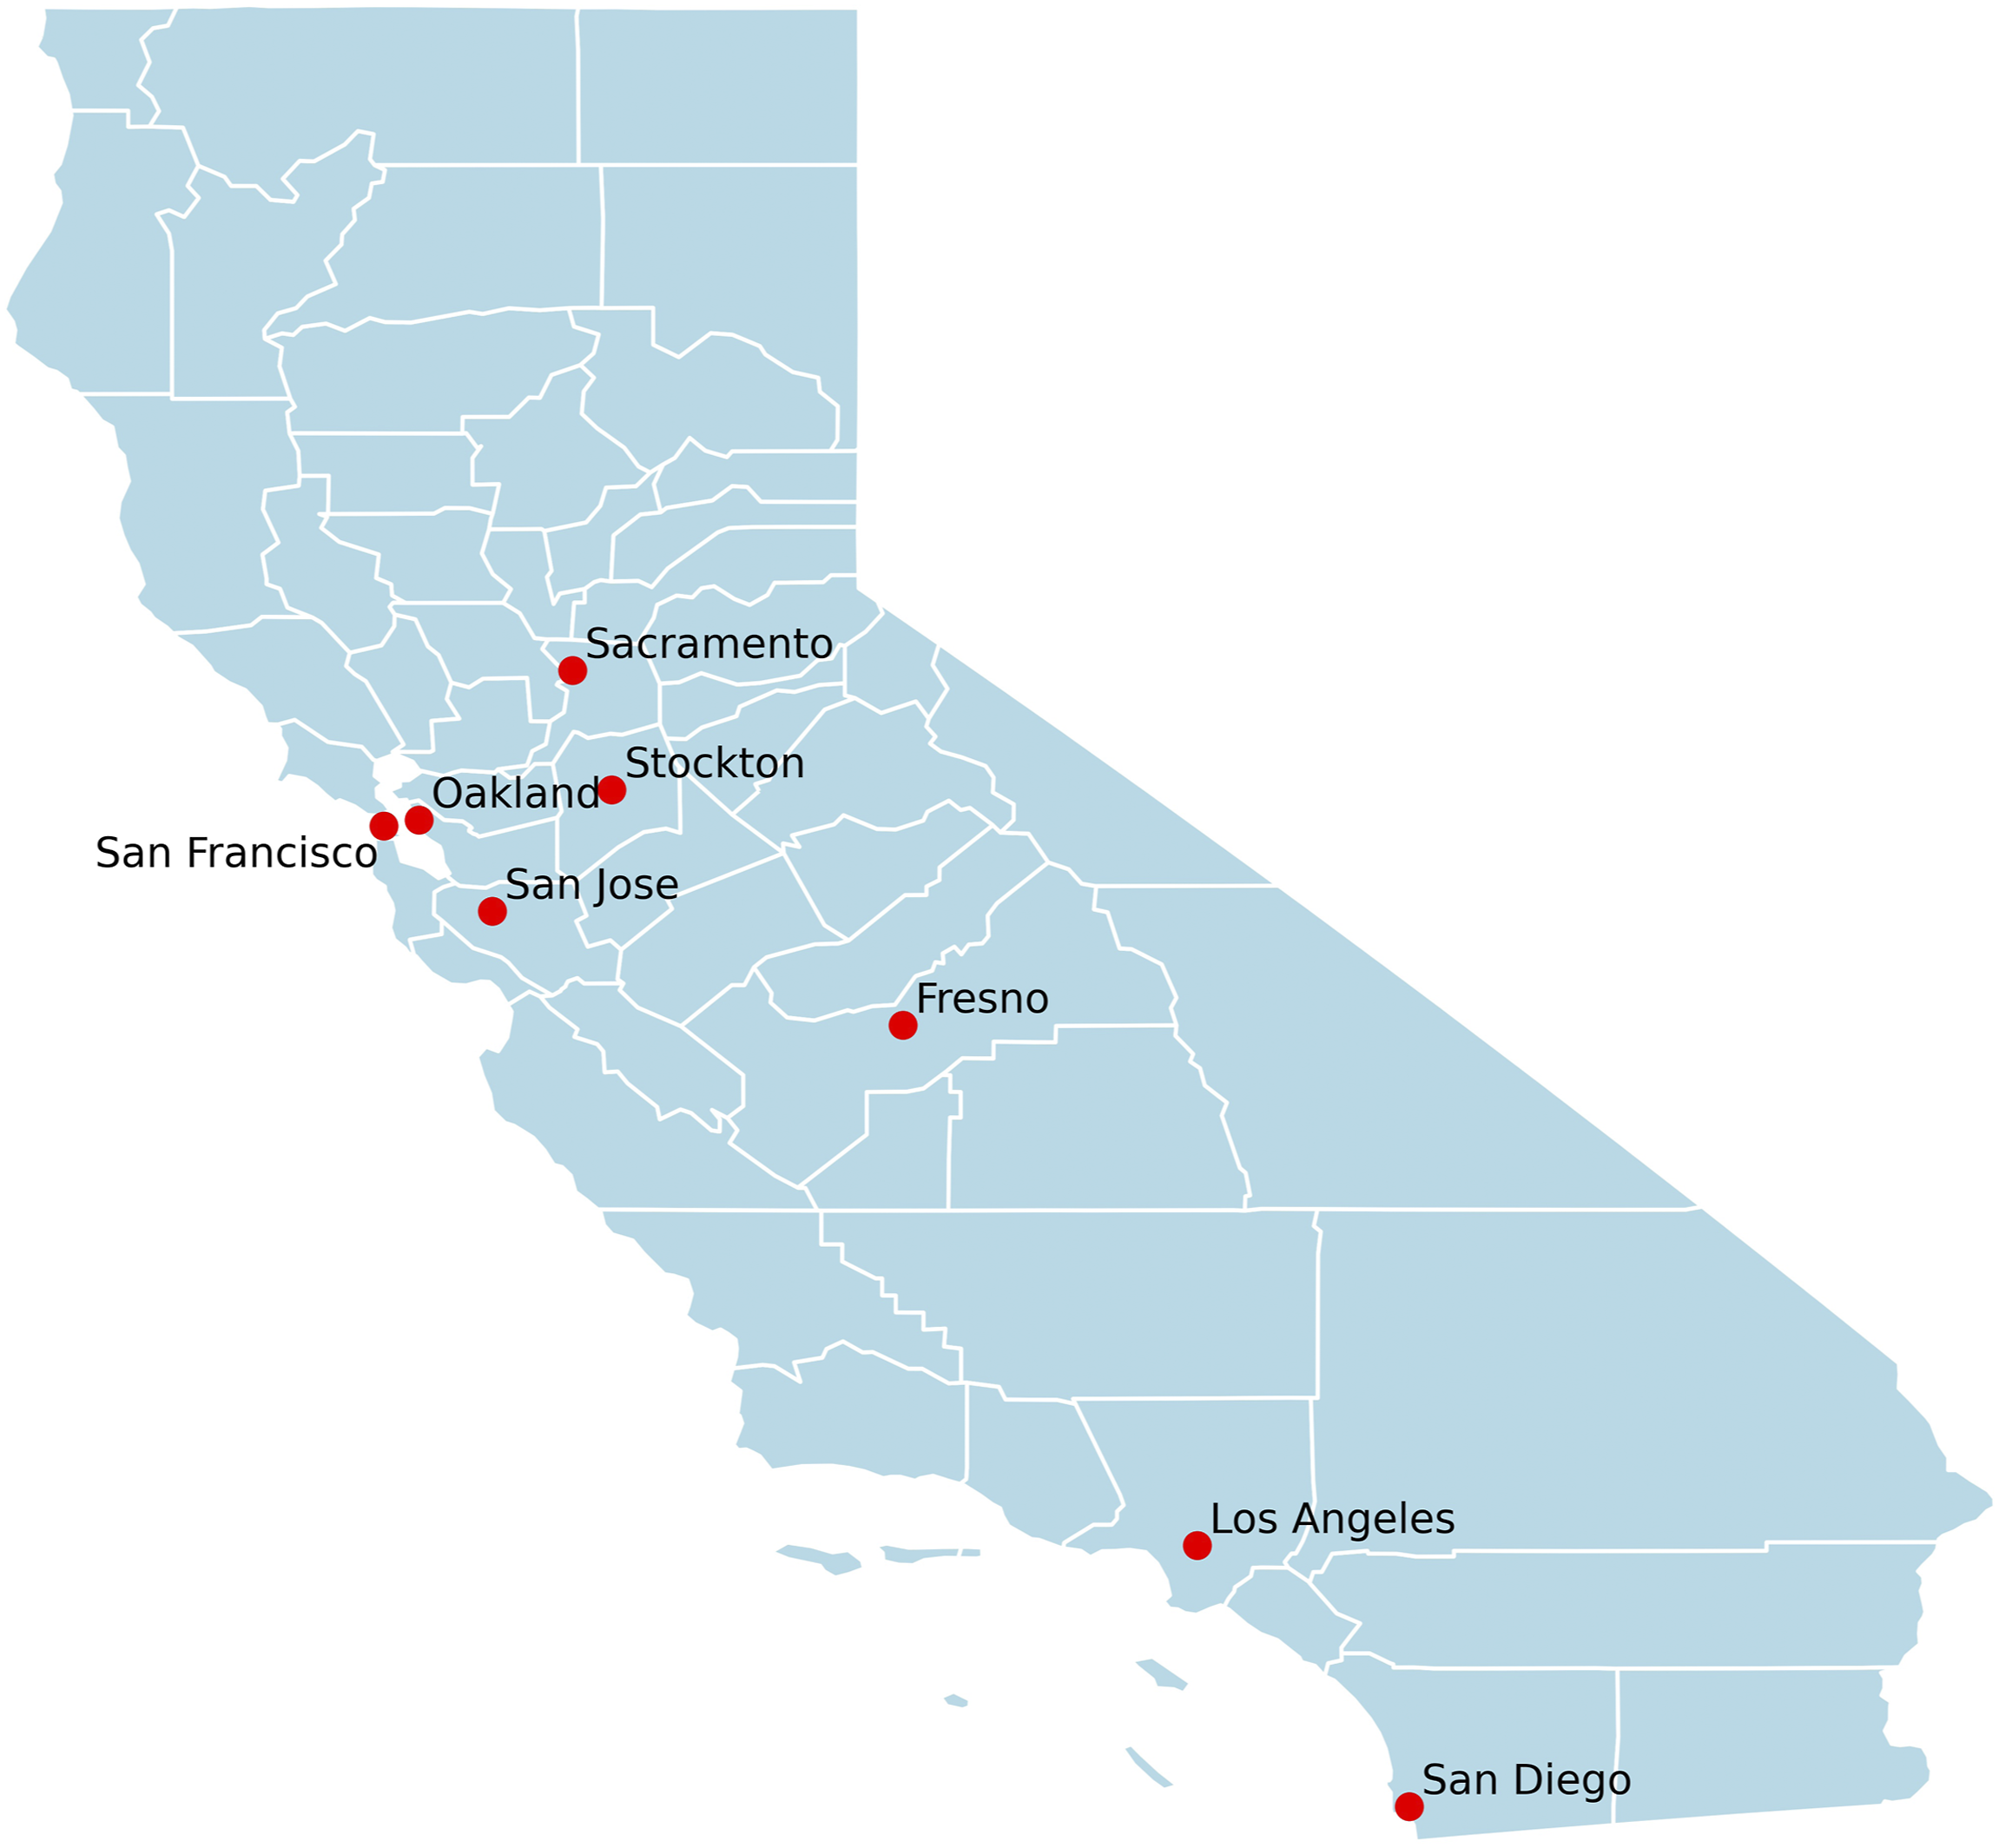
1930 Population Data for California Counties.
Across the eight HOLC counties there is much variation in size as well as racial composition. Los Angeles accounted for 40% of the state’s population at the time, while Sacramento and San Joaquin each housed only 2% of the state’s residents. The distribution of the minority populations also varies across these eight counties with the black populations being more prevalent in Alameda and Los Angeles counties, with location quotients of 1.34 and 1.50 respectively. Conversely, for the other non-white classification, this minority group is more prevalent in Fresno, Sacramento, San Francisco, San Joaquin, and Santa Clara. San Diego is the only HOLC city where the two minority groups are underrepresented.
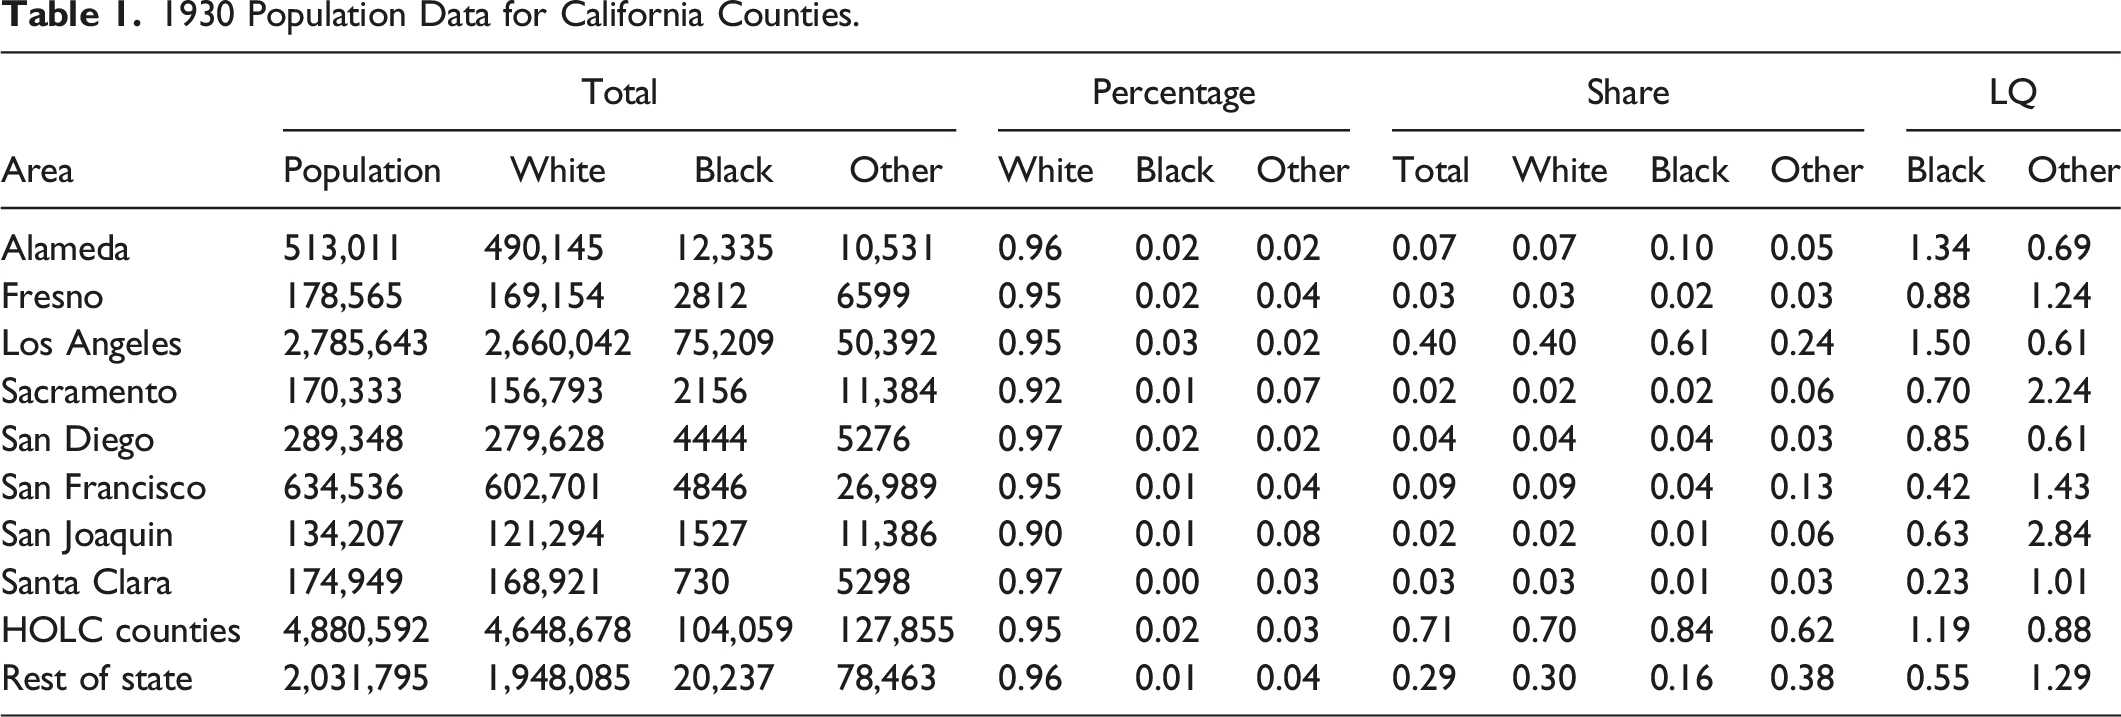
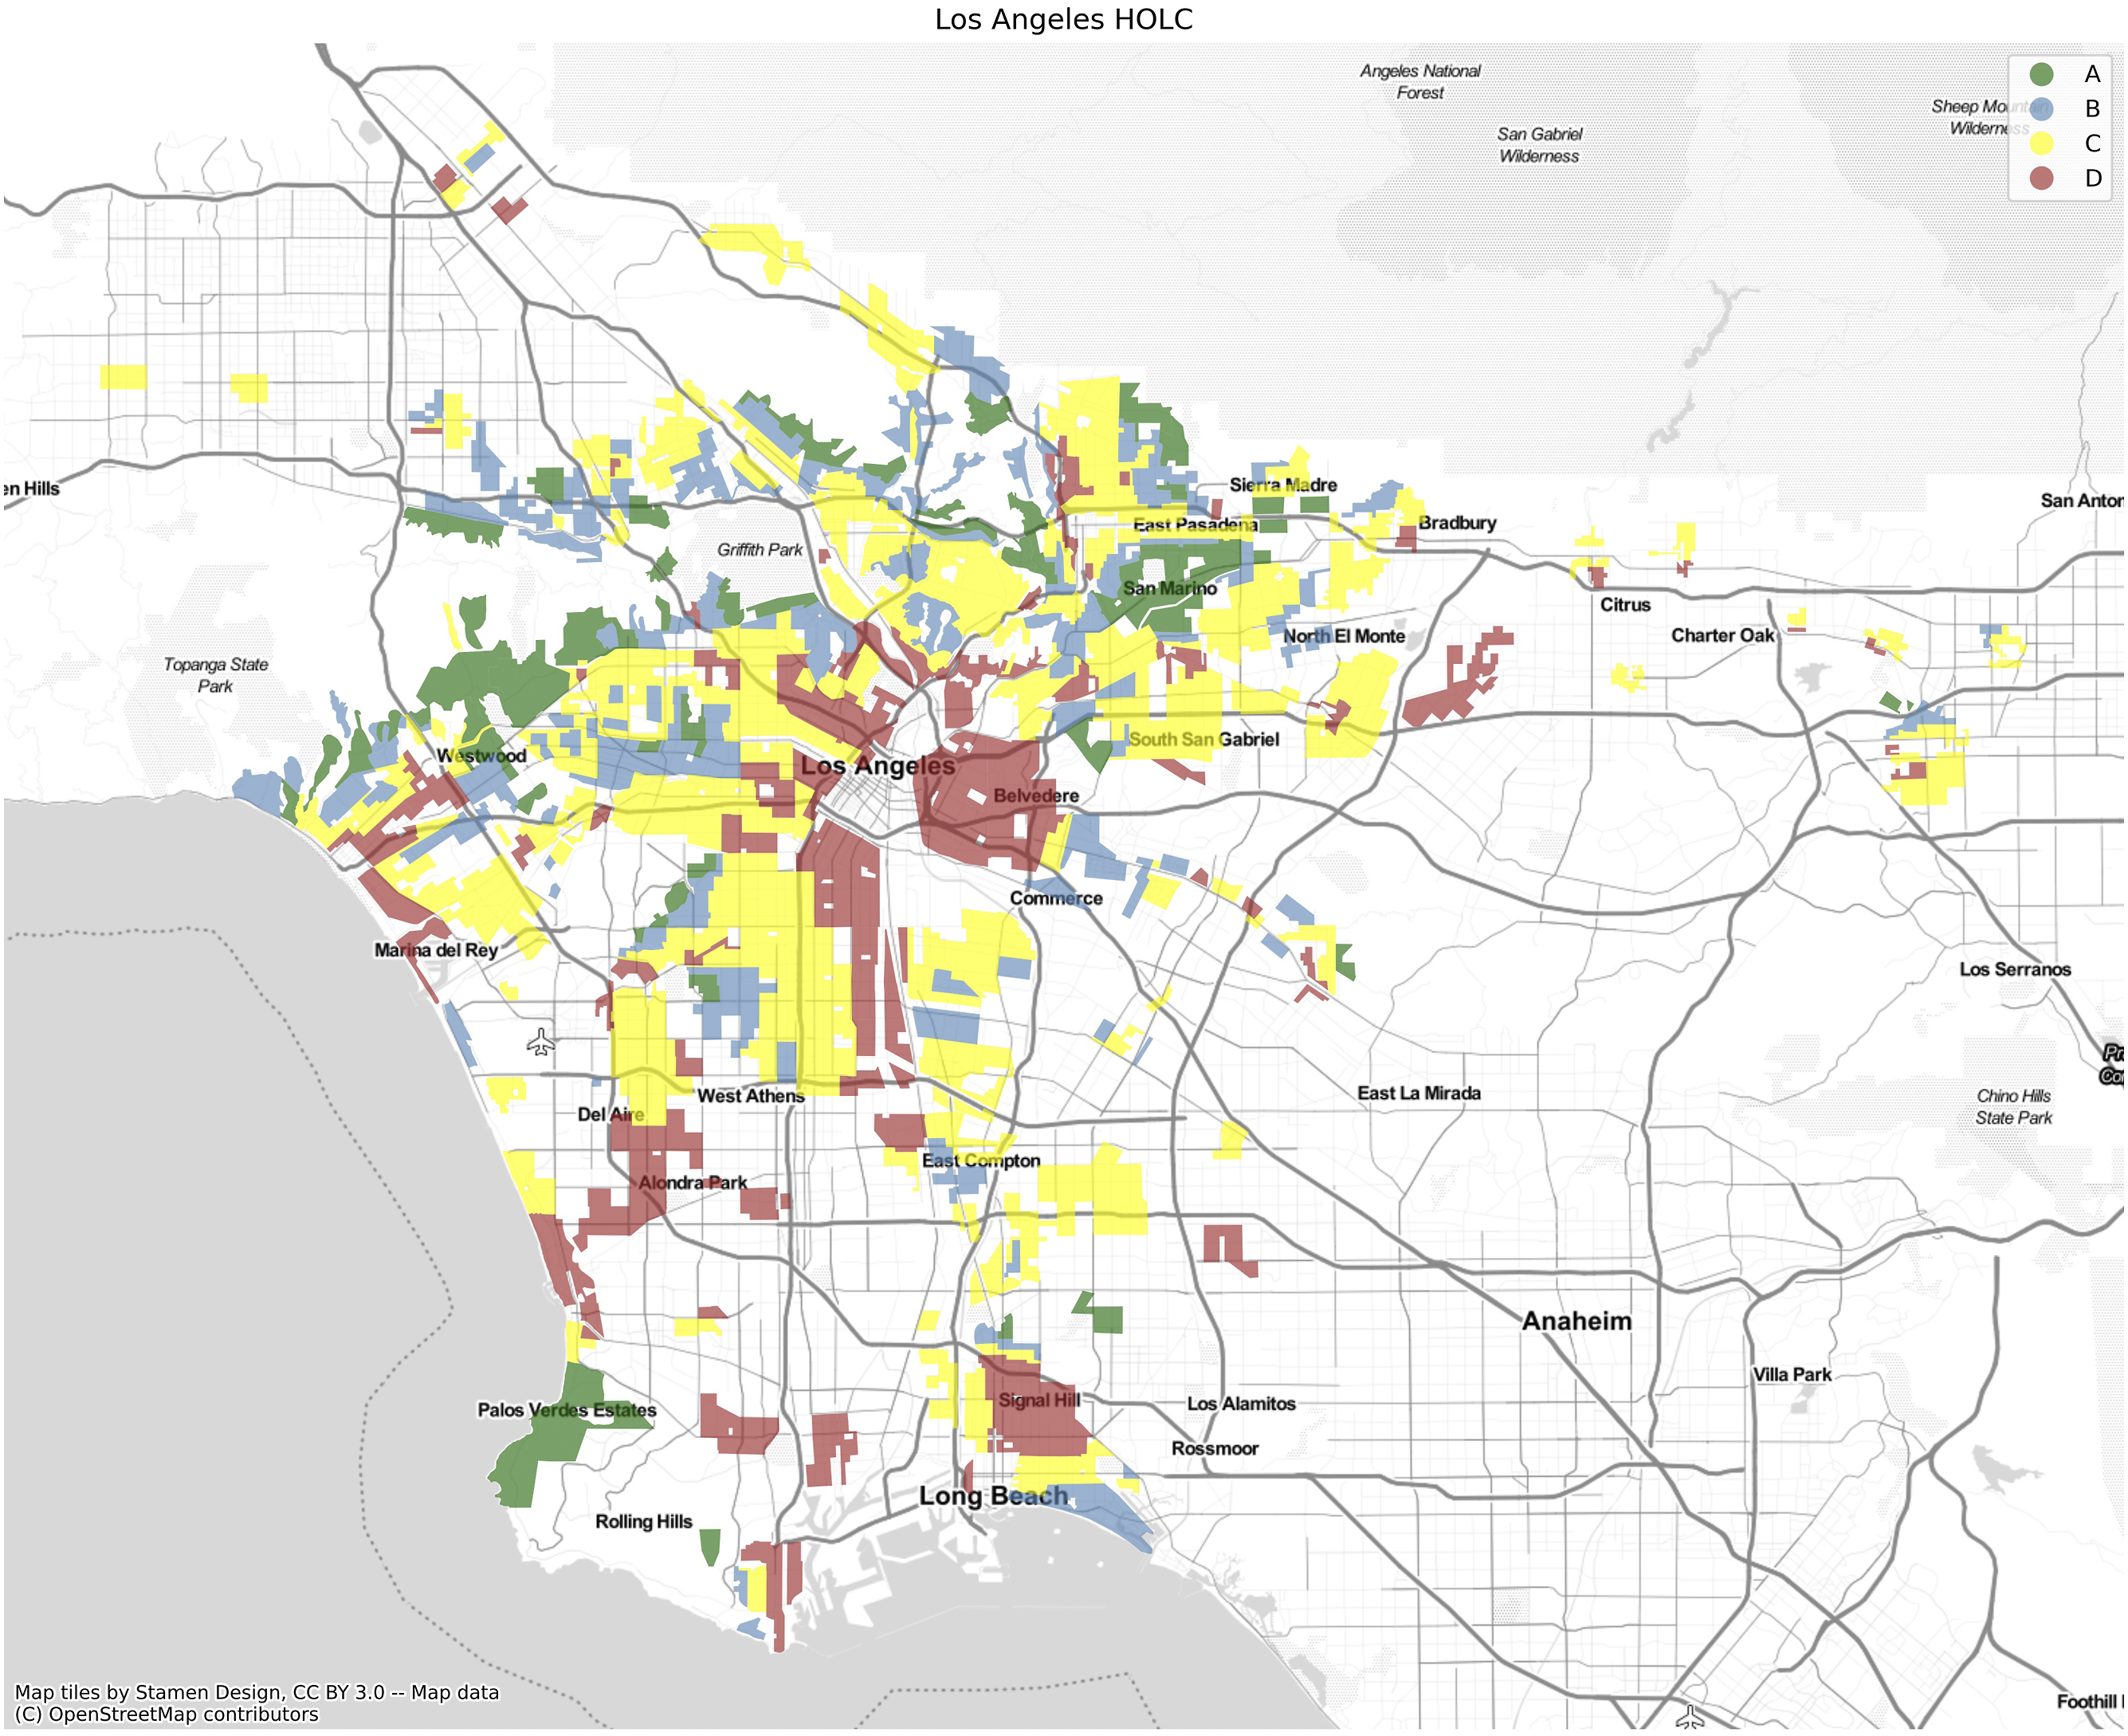
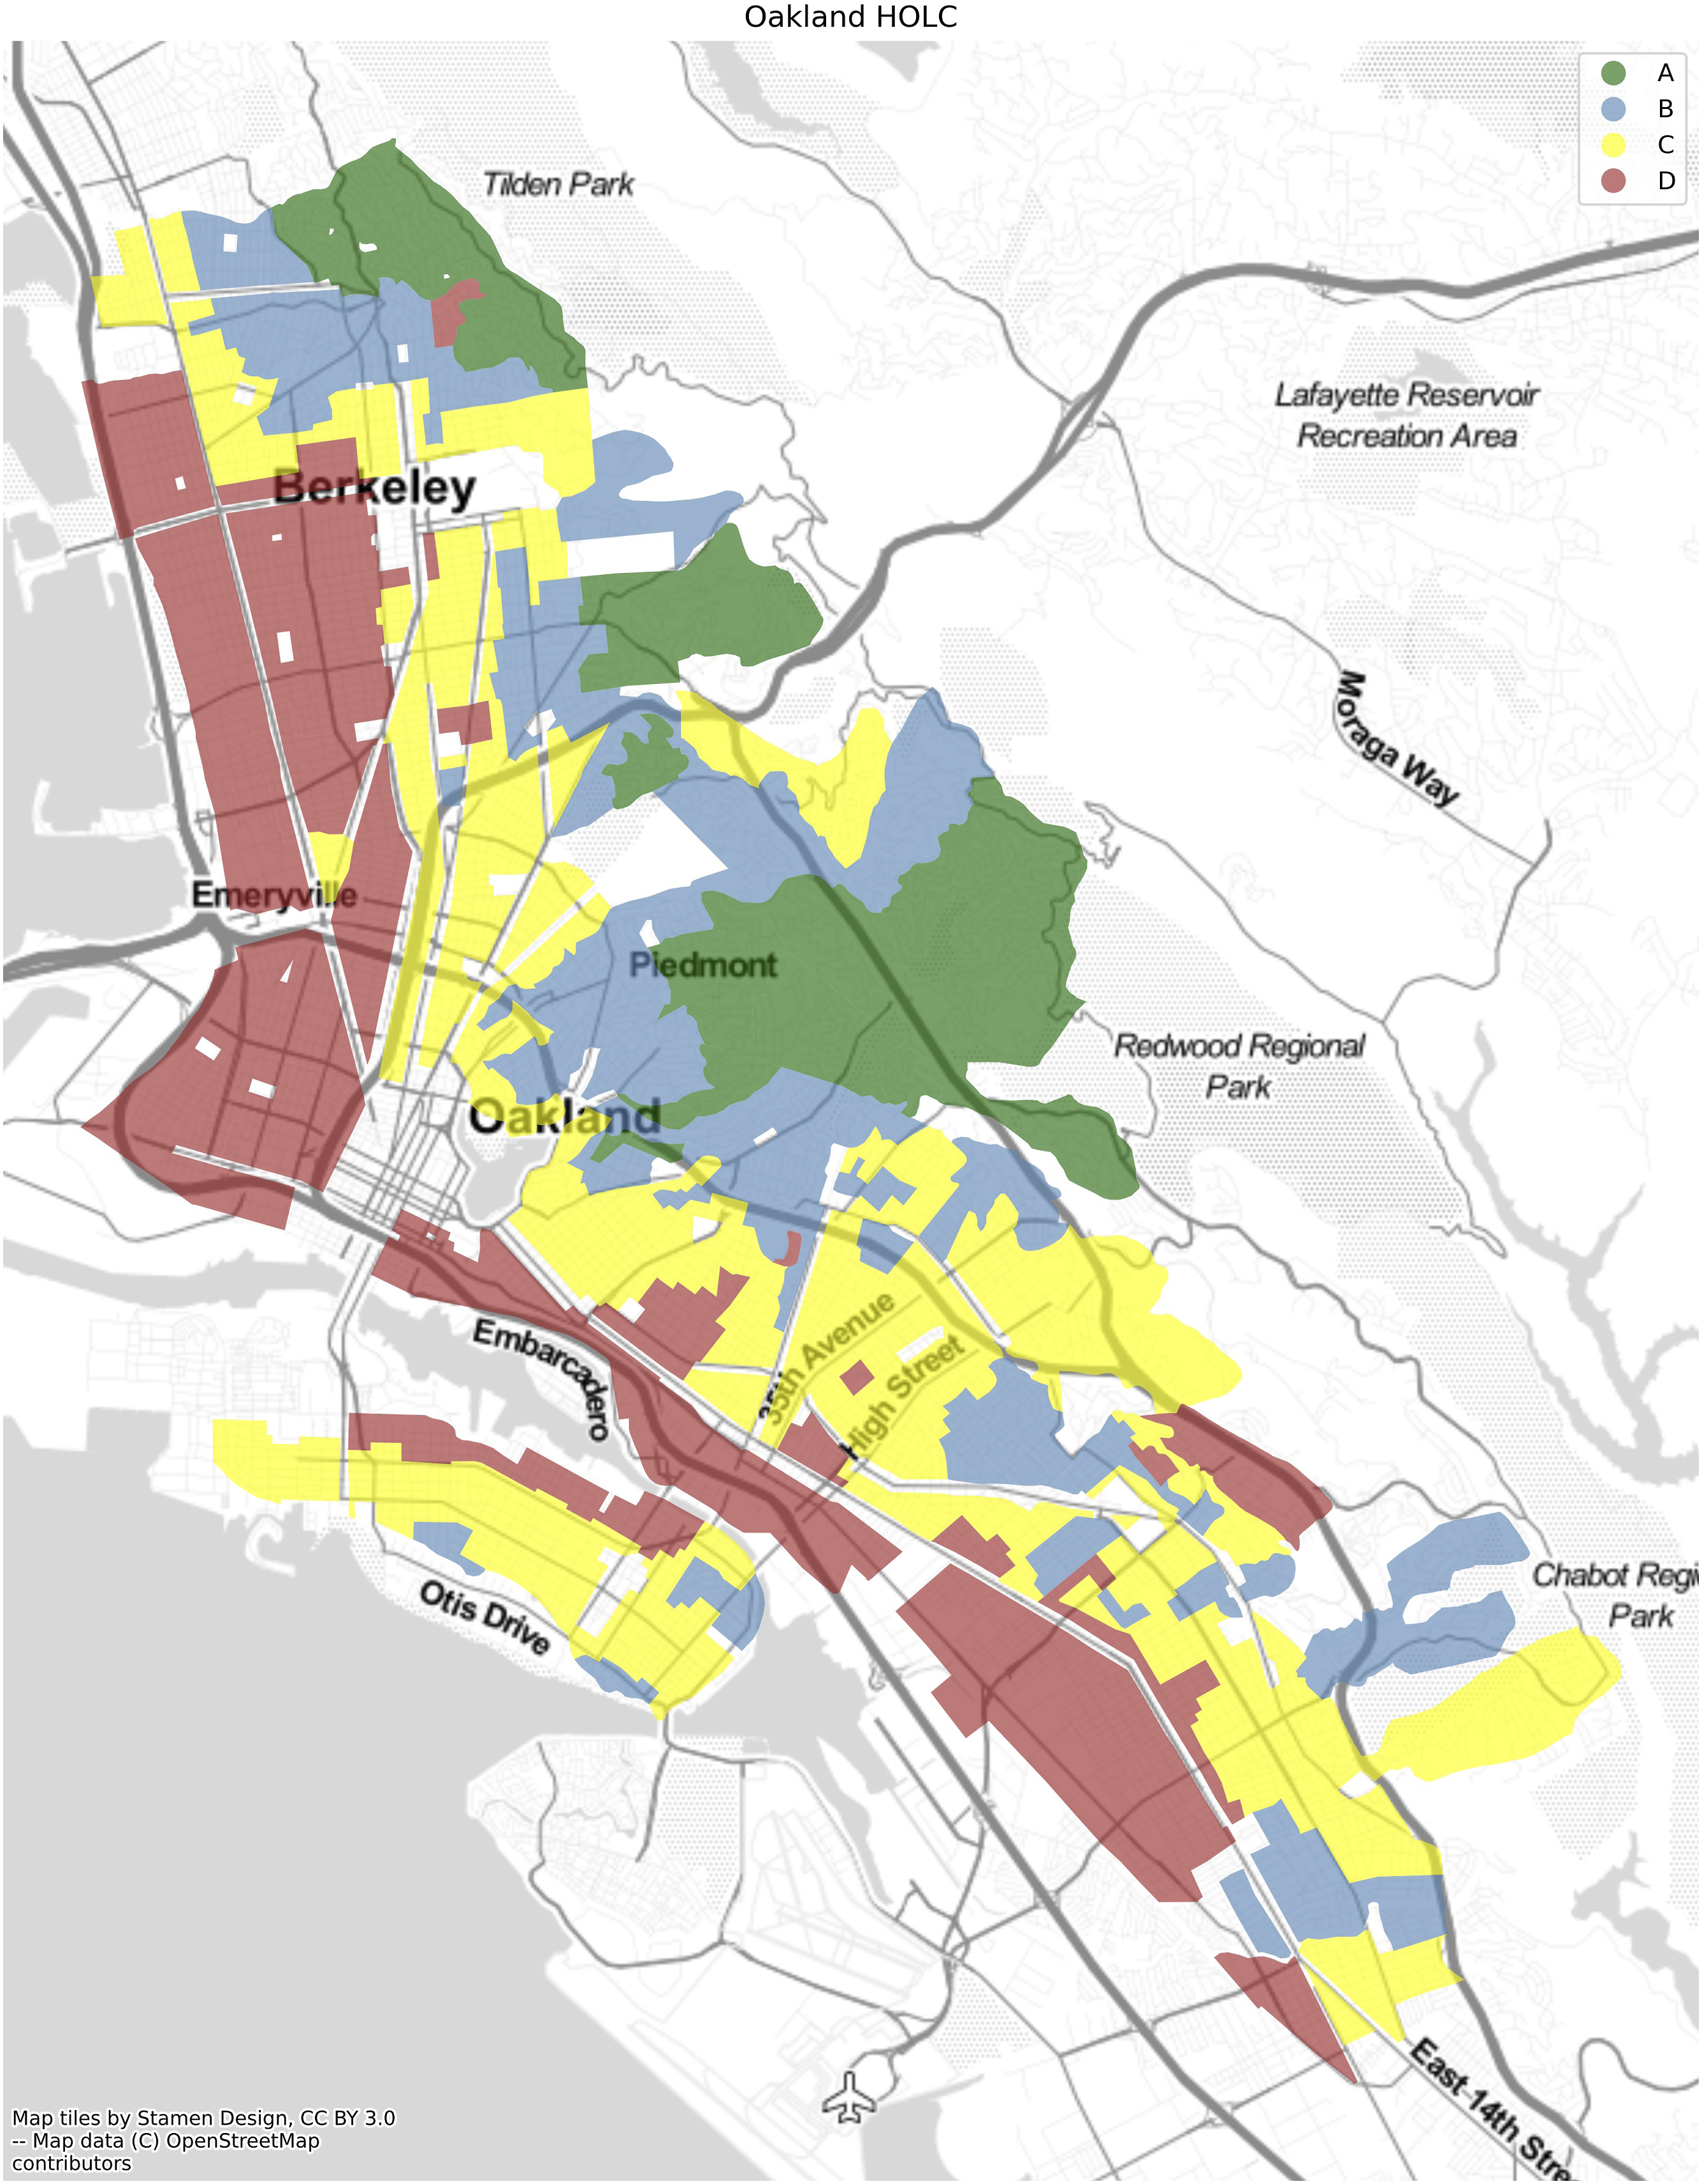
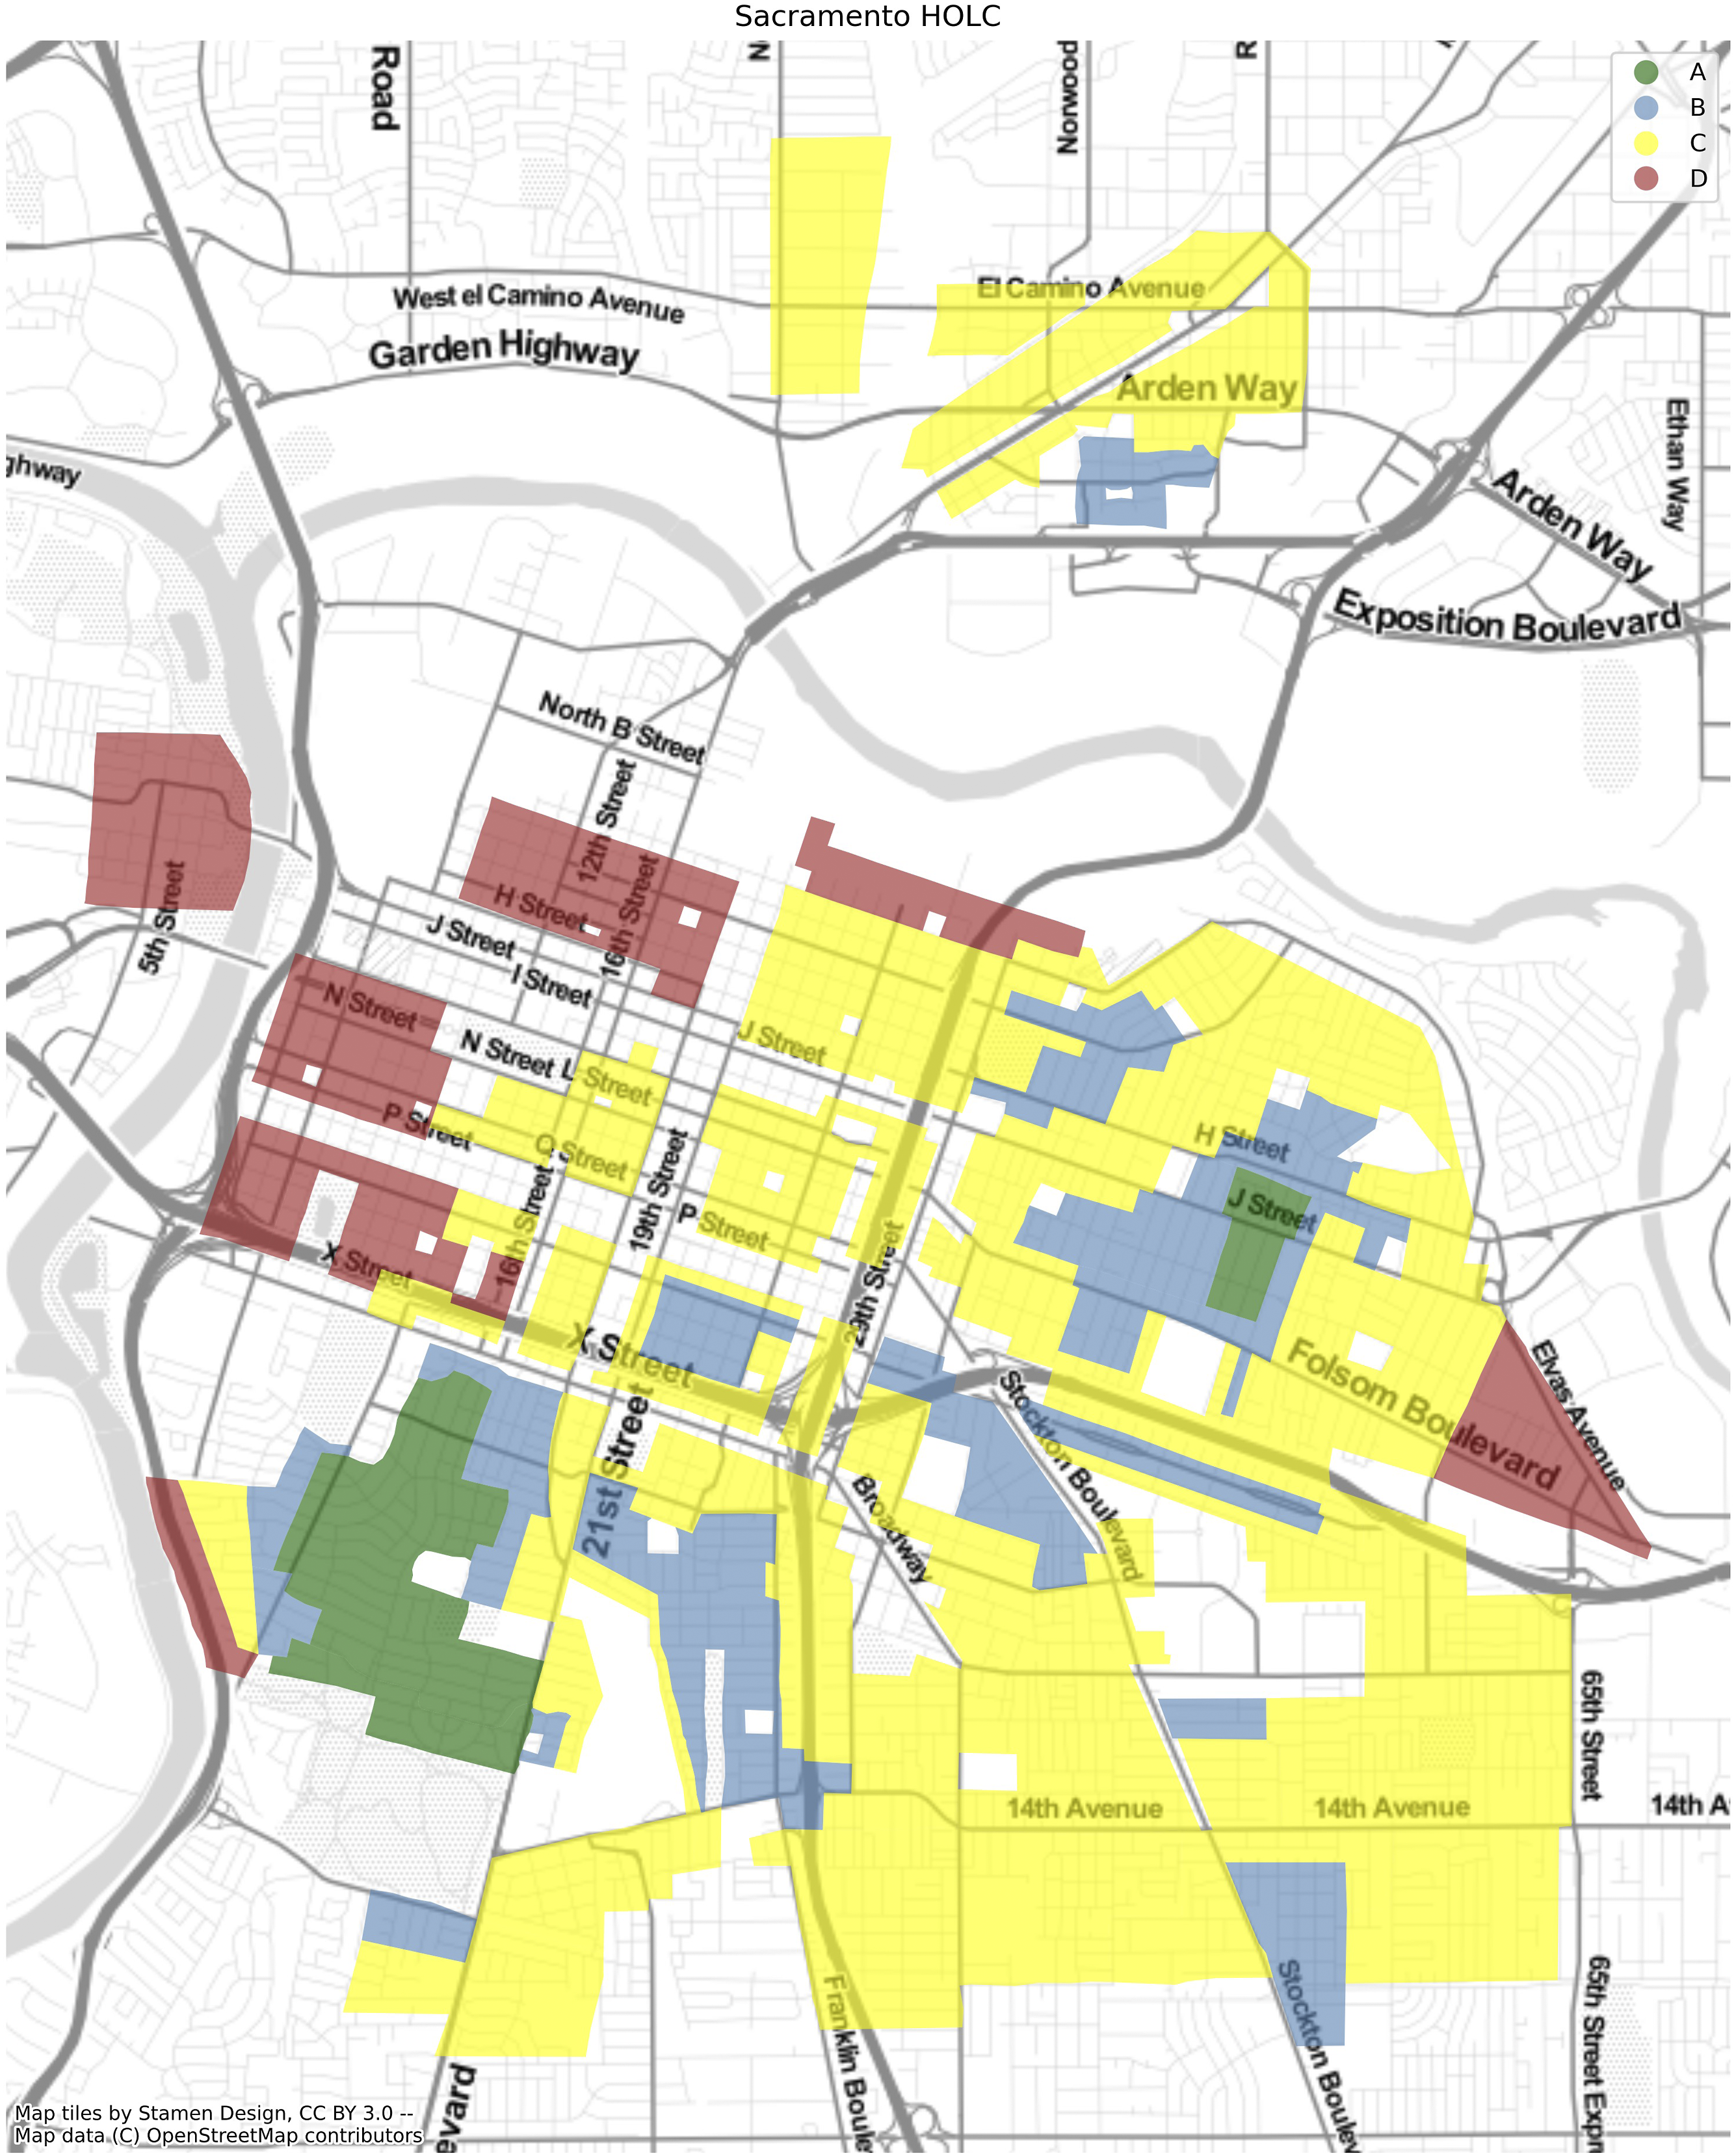
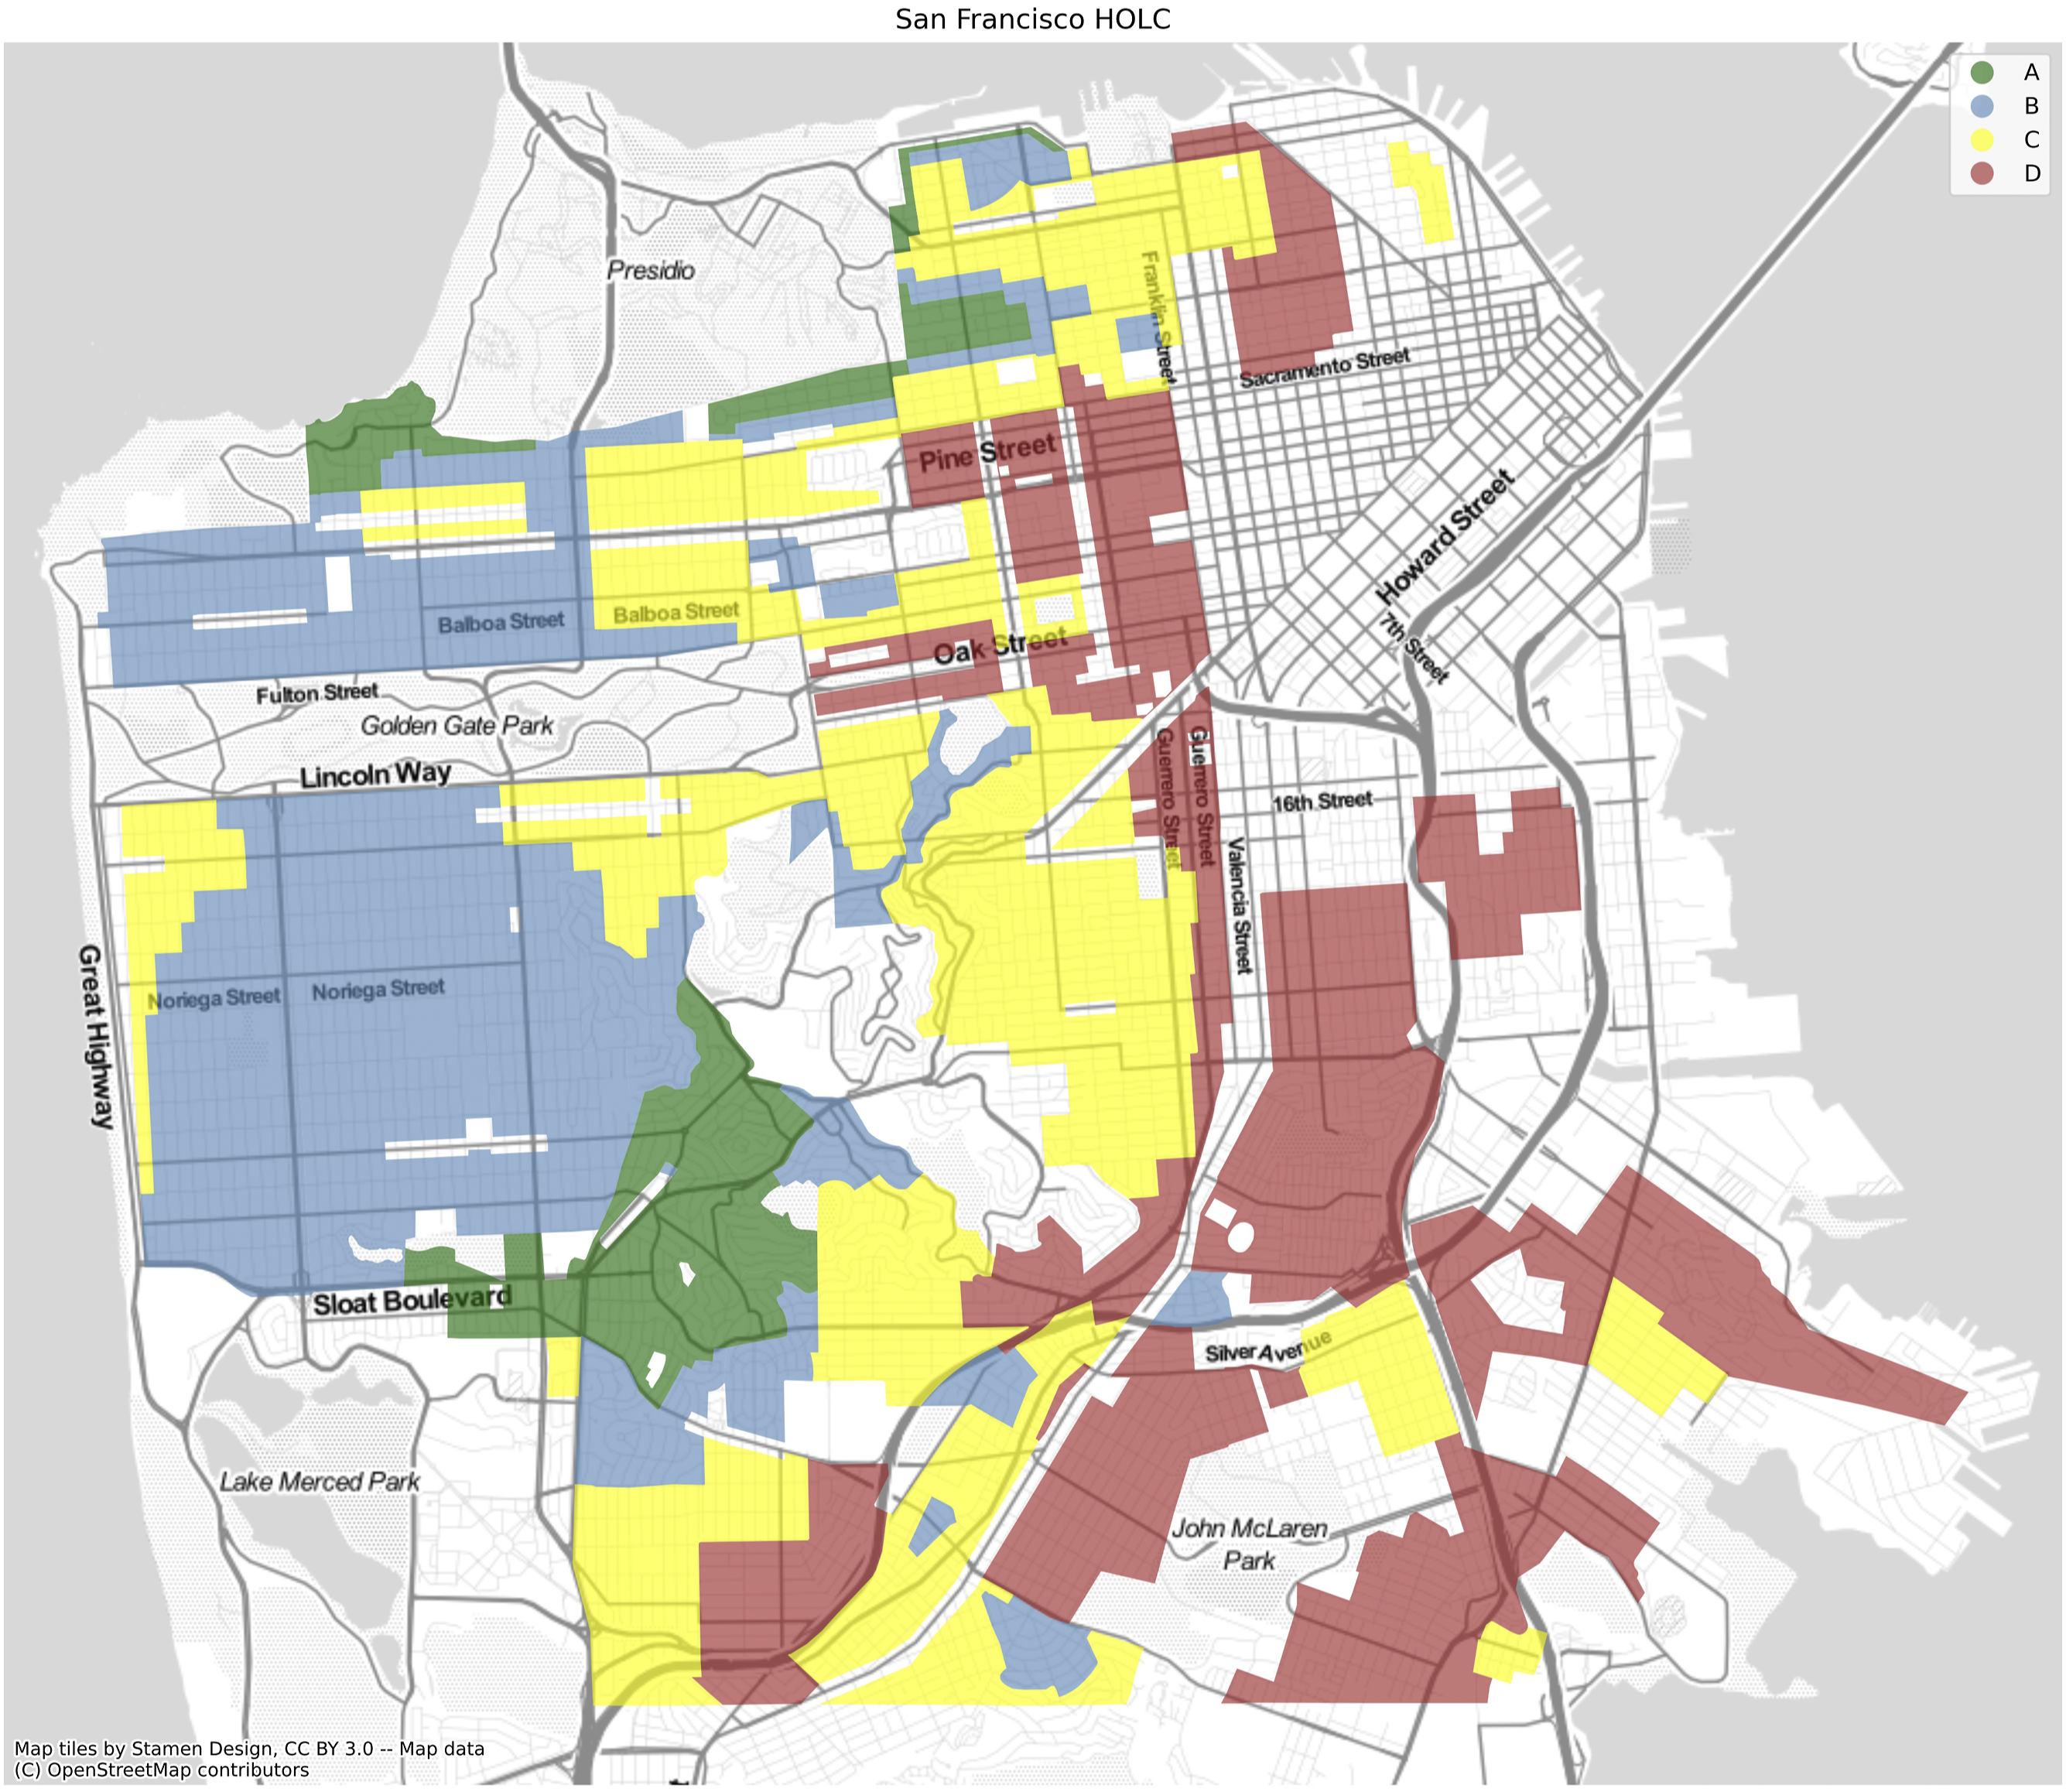
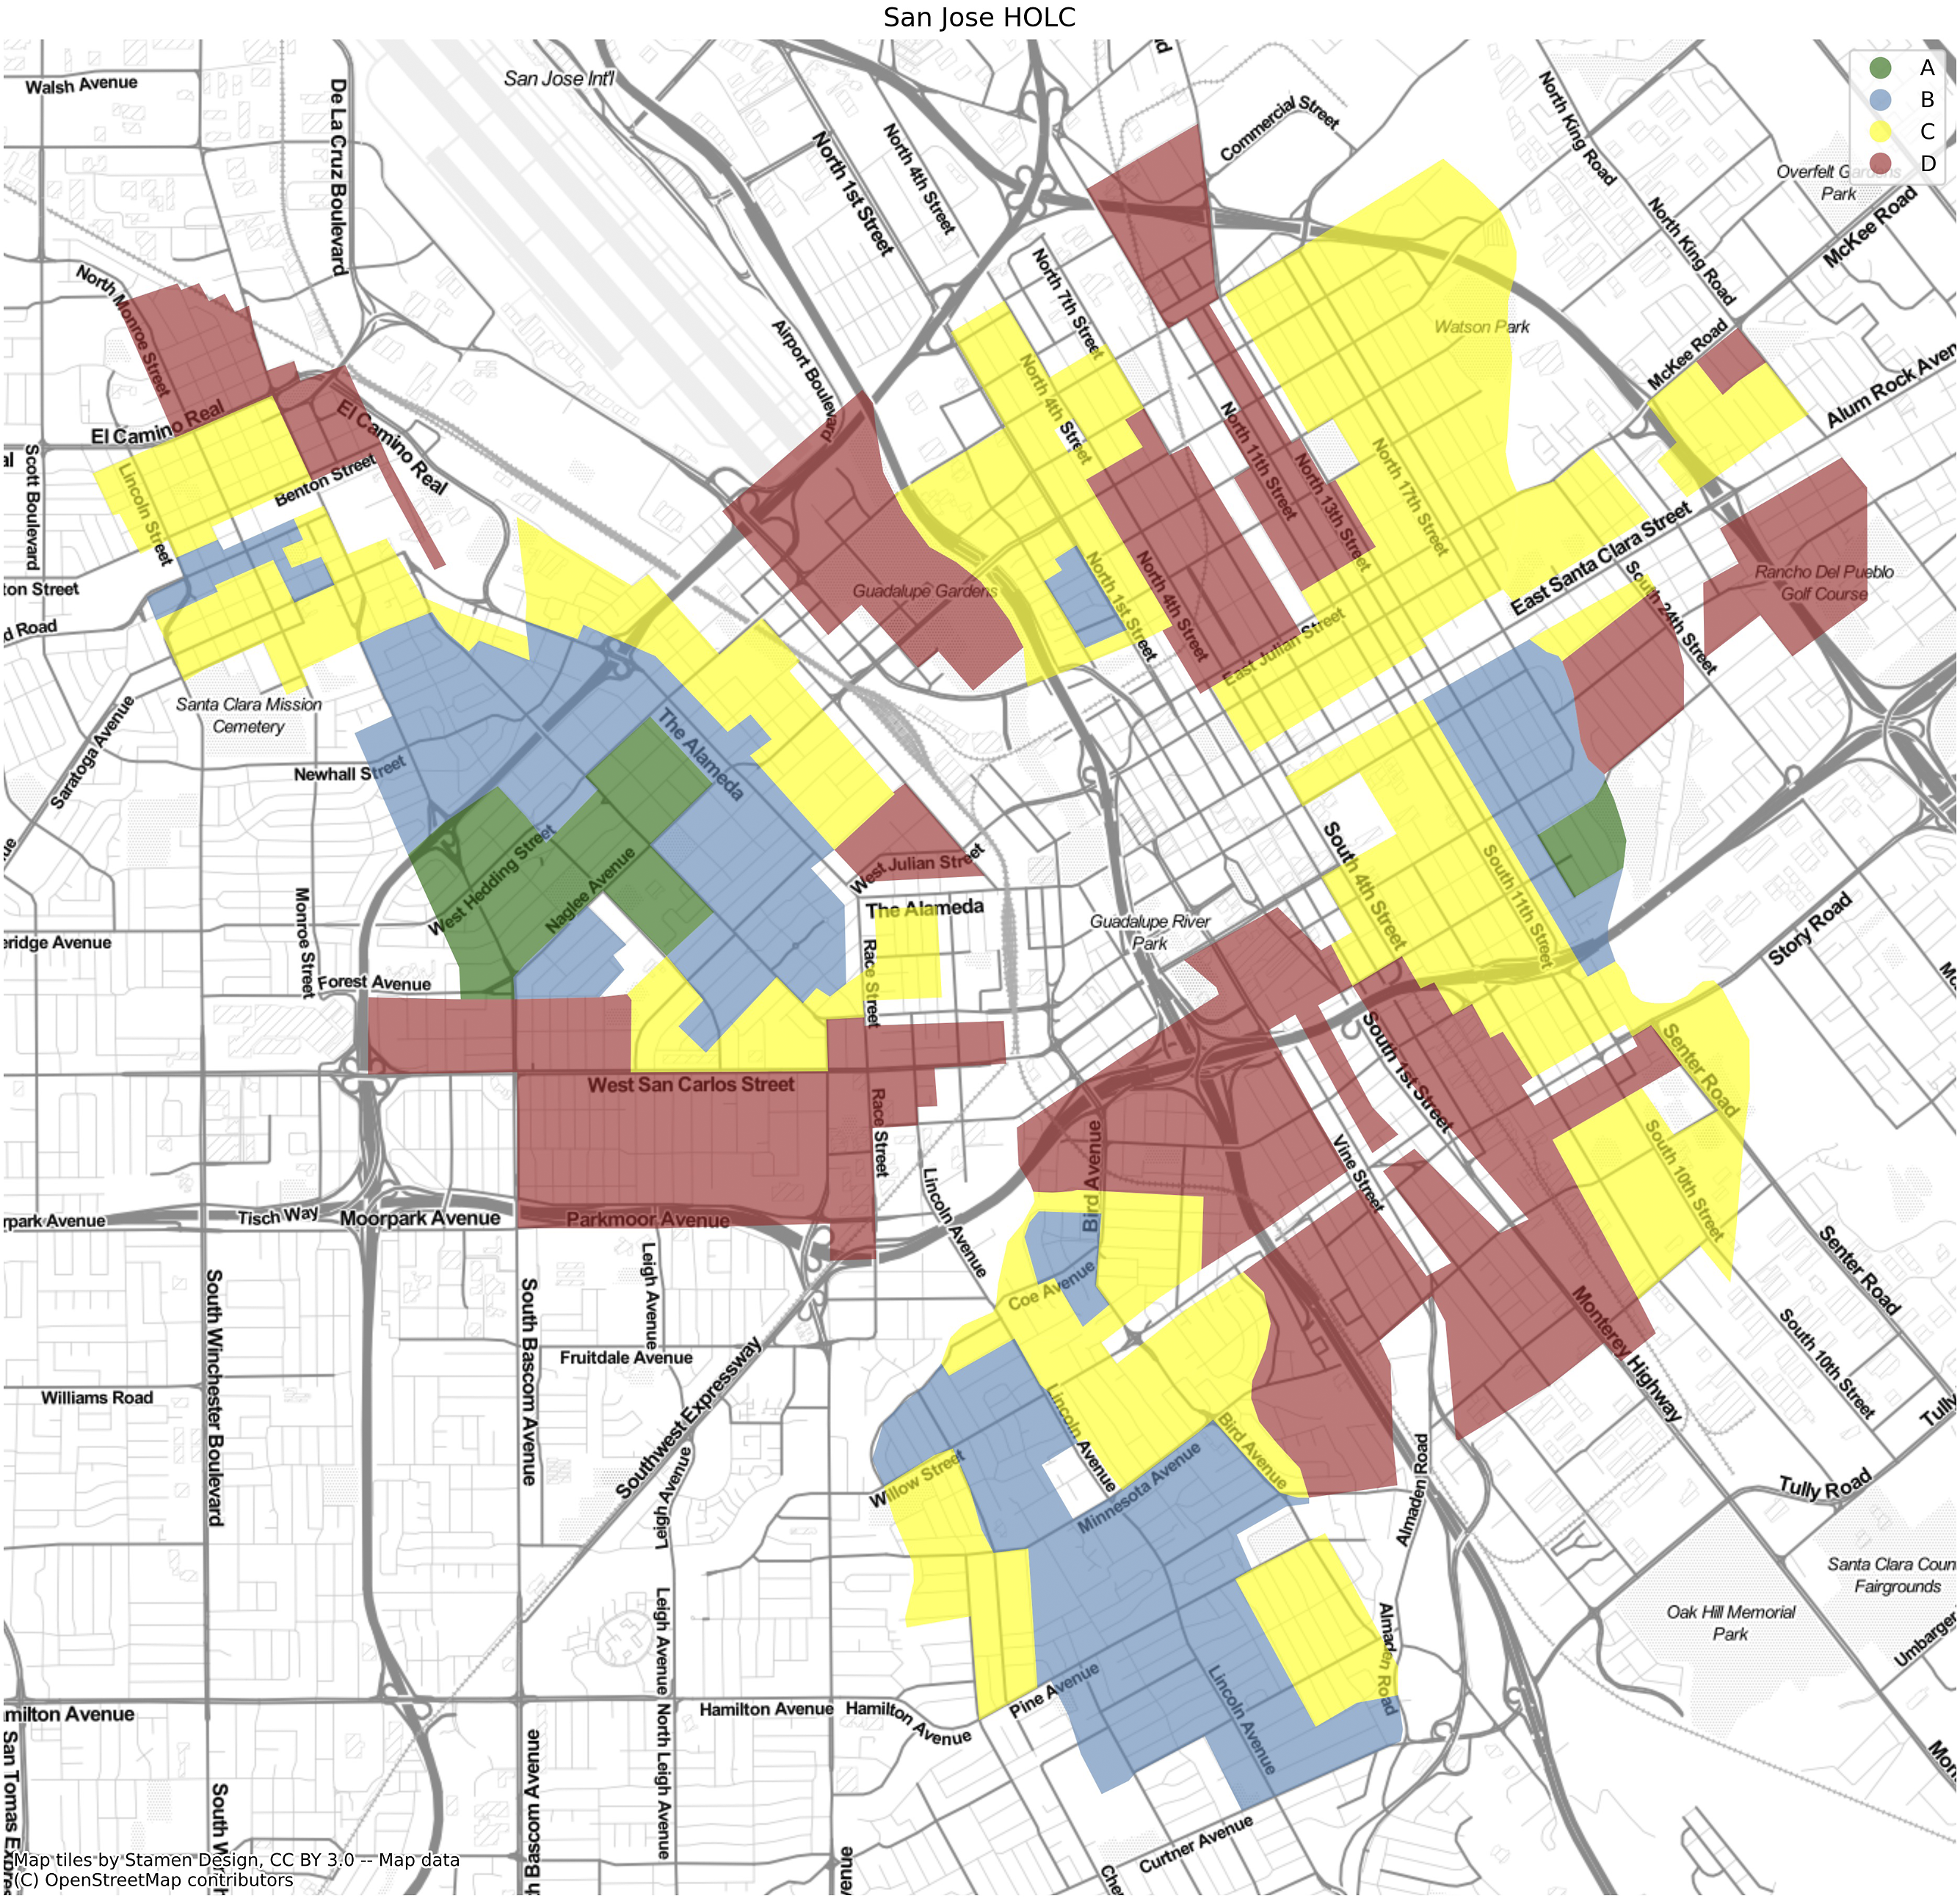
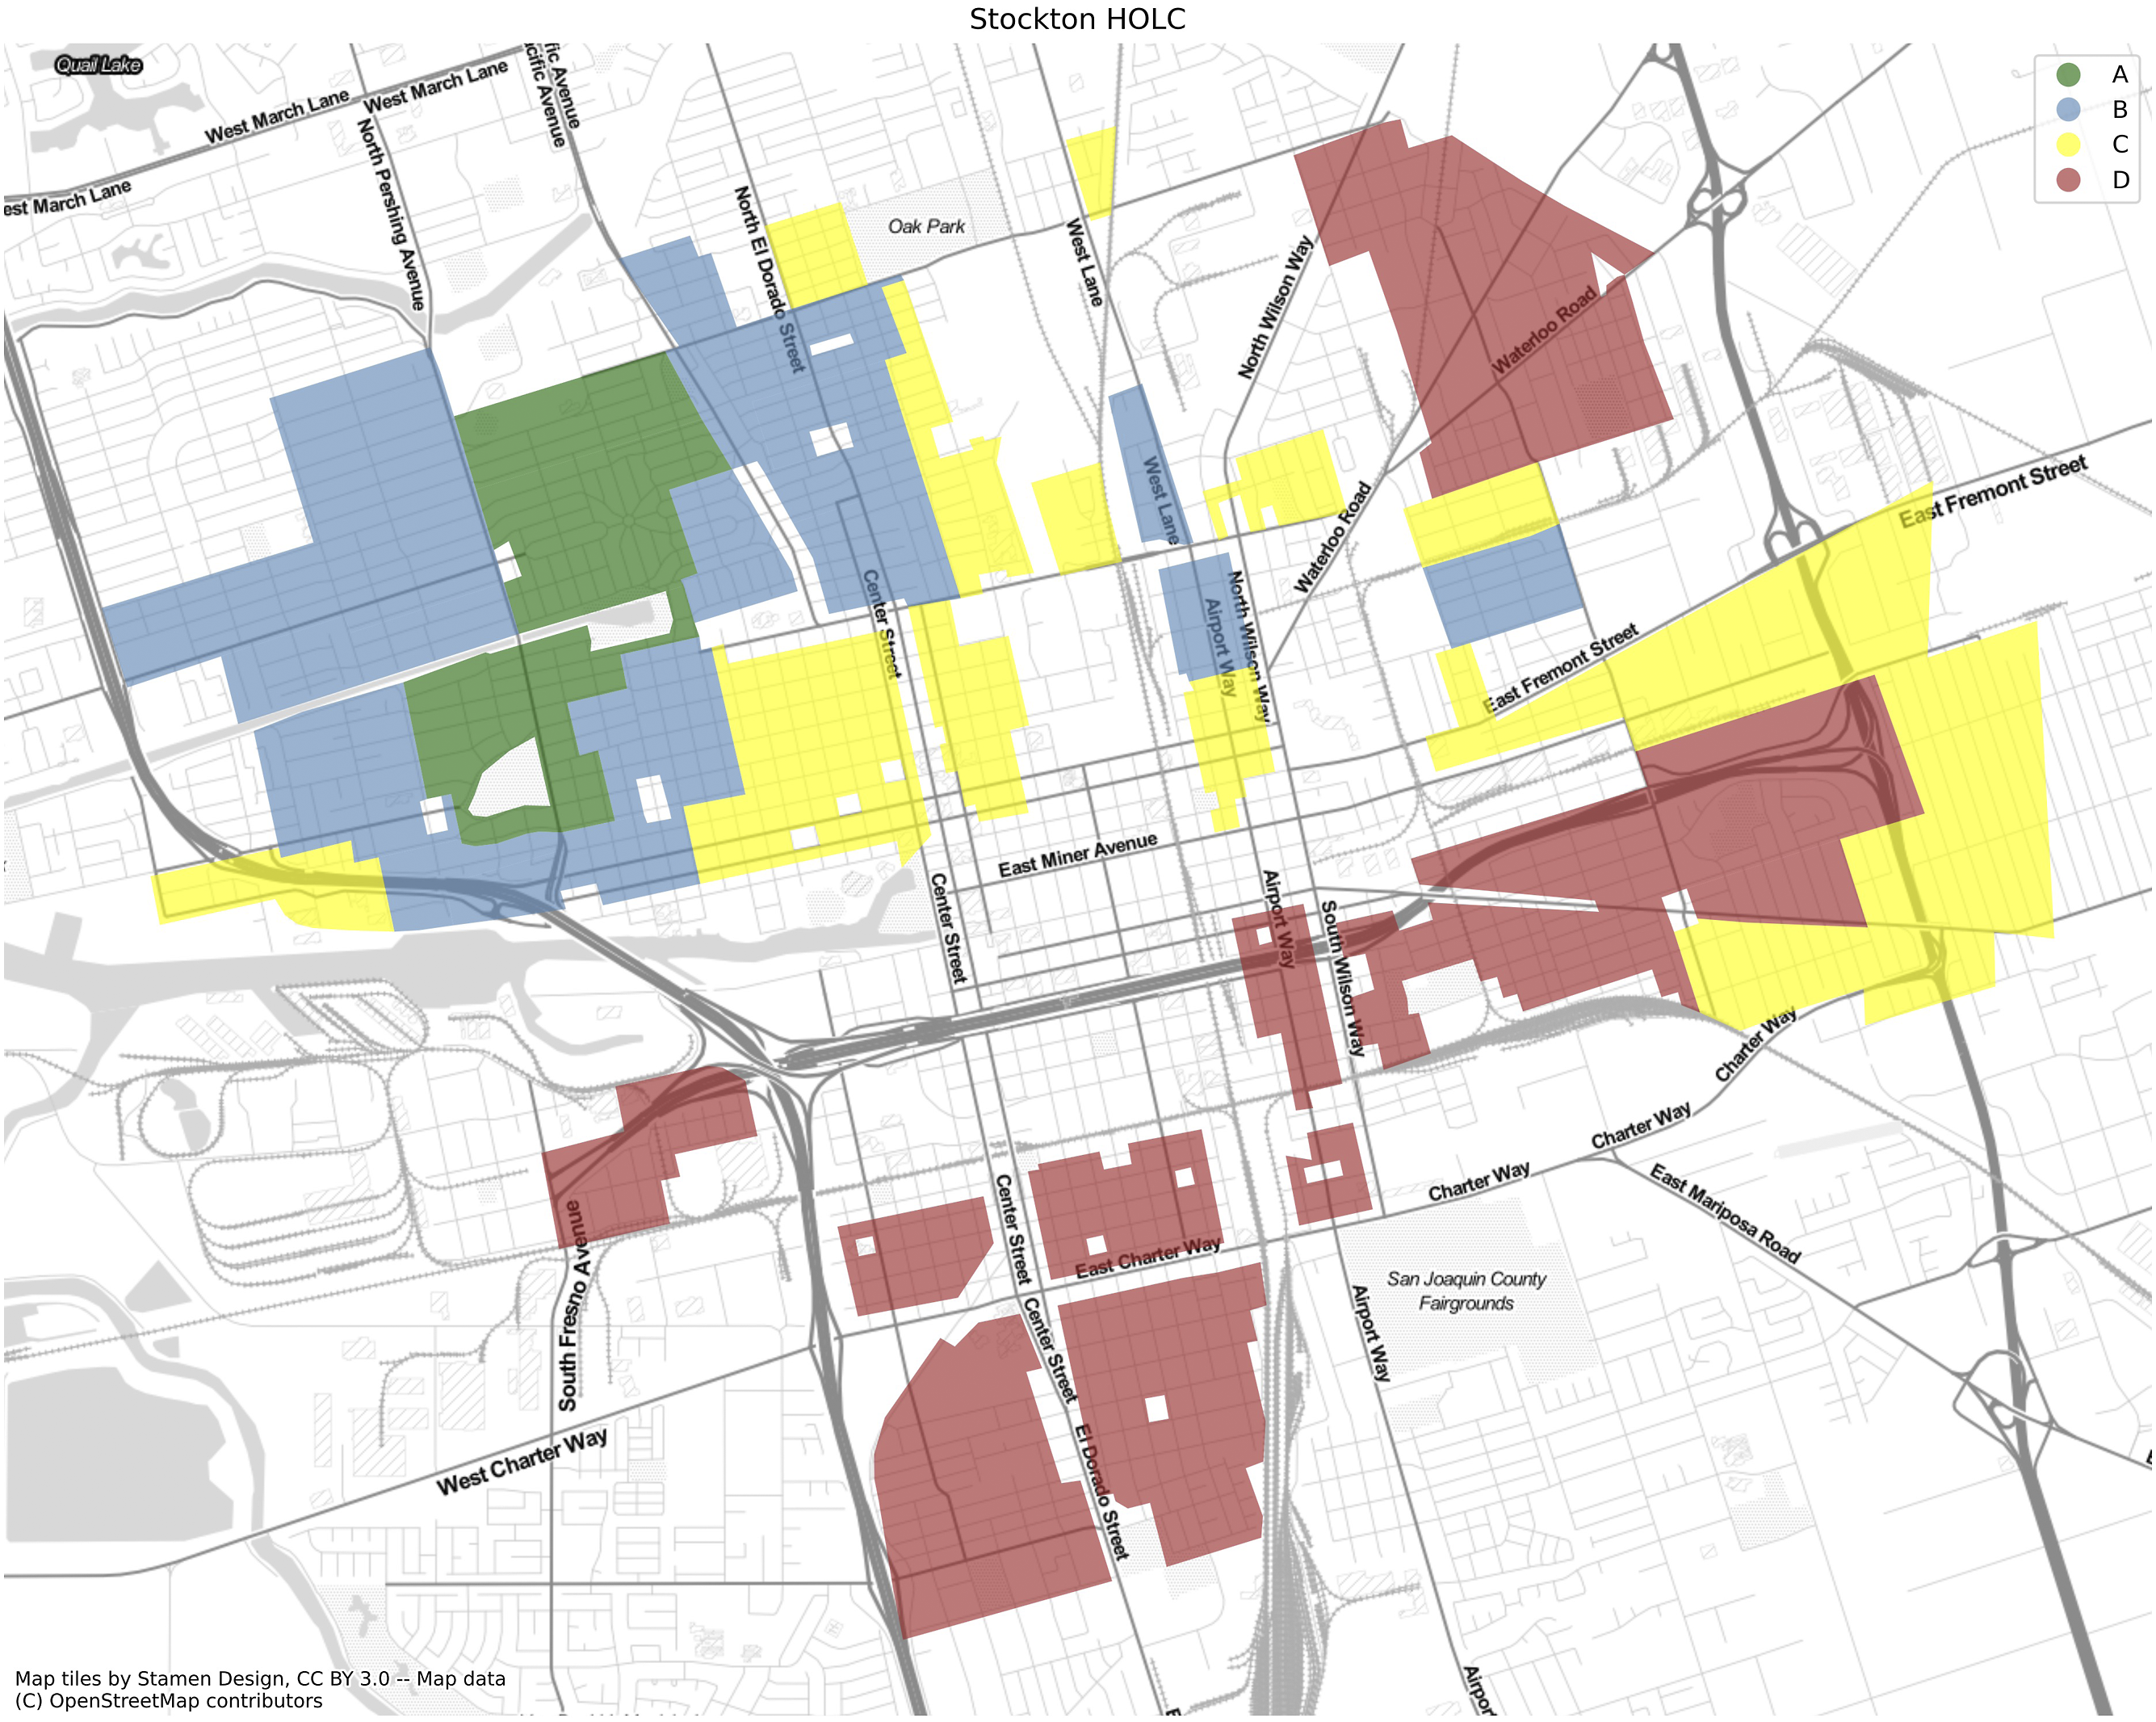
The second spatial scale we examine is at the intracity level. Figures 2–9 contain the HOLC maps for the eight California cities. Home owners’ loan corporation map: Fresno. Letters A-D correspond to home owners’ loan corporation Grade. Home owners’ loan corporation map: Los Angeles. Letters A-D correspond to home owners’ loan corporation Grade. Home owners’ loan corporation map: Oakland. Letters A-D correspond to home owners’ loan corporation Grade. Home owners’ loan corporation map: Sacramento. Letters A-D correspond to home owners’ loan corporation Grade. Home owners’ loan corporation map: San Diego. Letters A-D correspond to home owners’ loan corporation Grade. Home owners’ loan corporation map: San Francisco. Letters A-D correspond to home owners’ loan corporation Grade. Home owners’ loan corporation map: San Jose. Letters A-D correspond to home owners’ loan corporation Grade. Home owners’ loan corporation map: Stockton. Letters A-D correspond to home owners’ loan corporation Grade.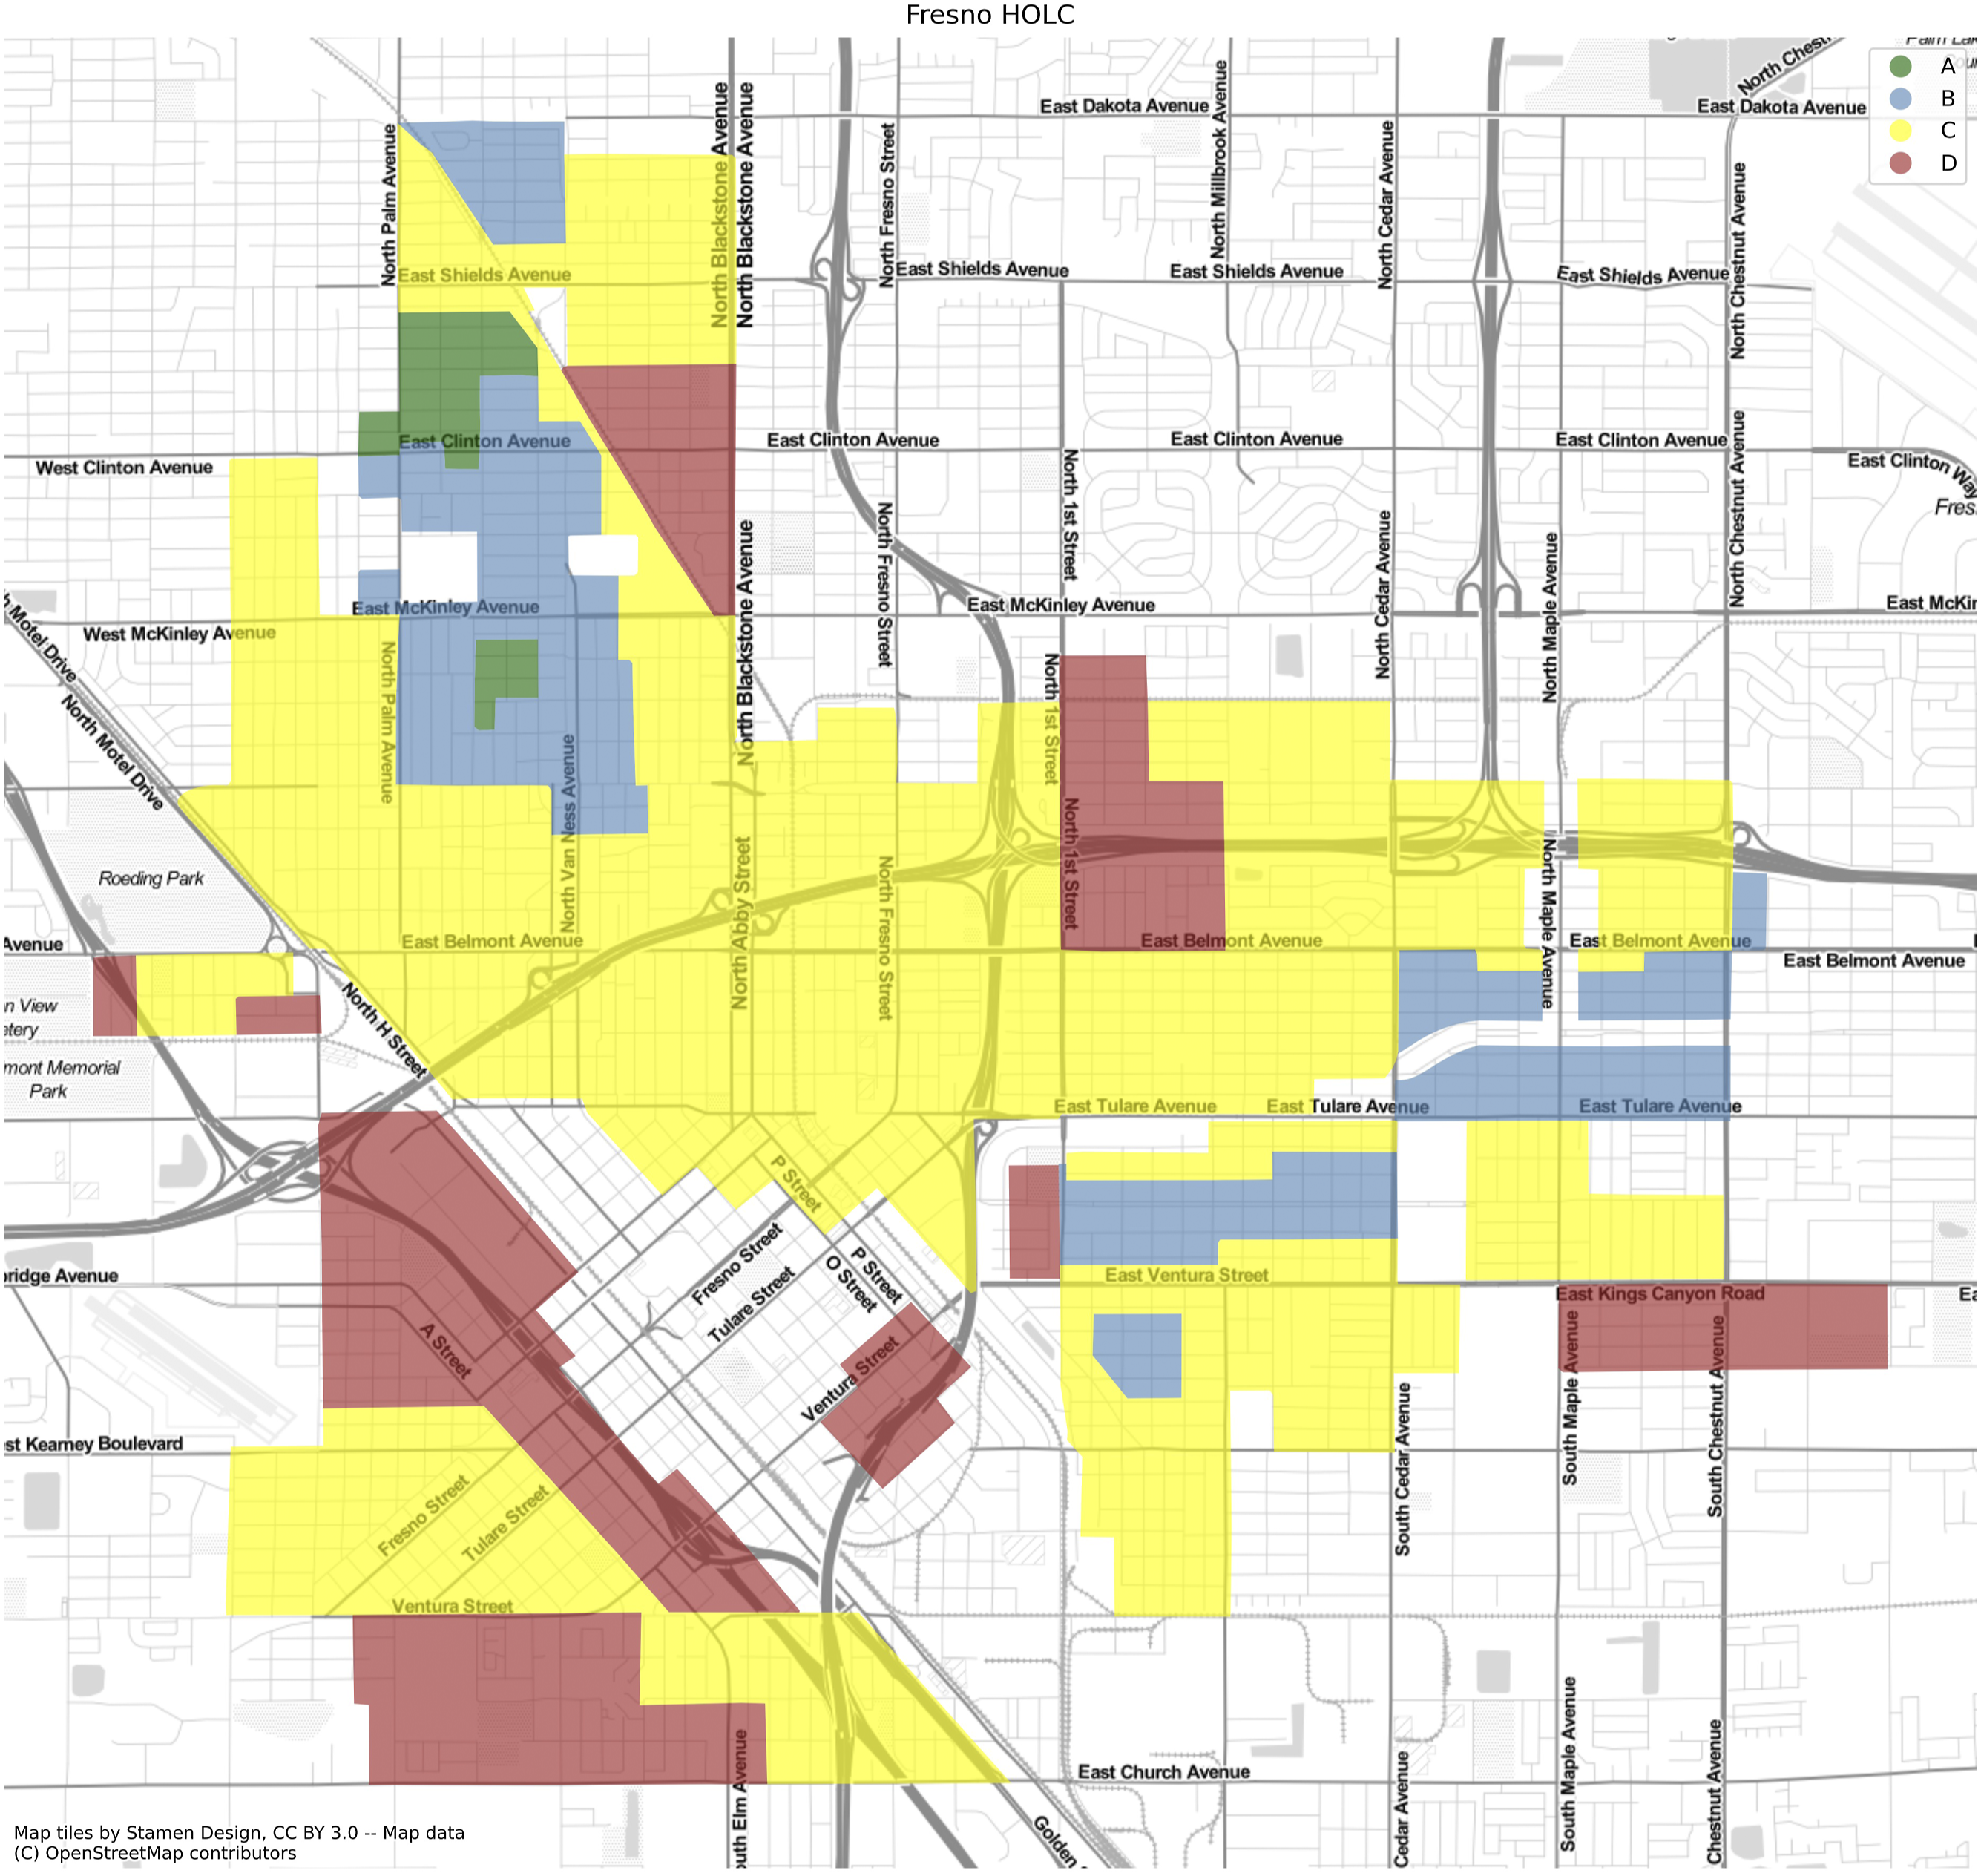
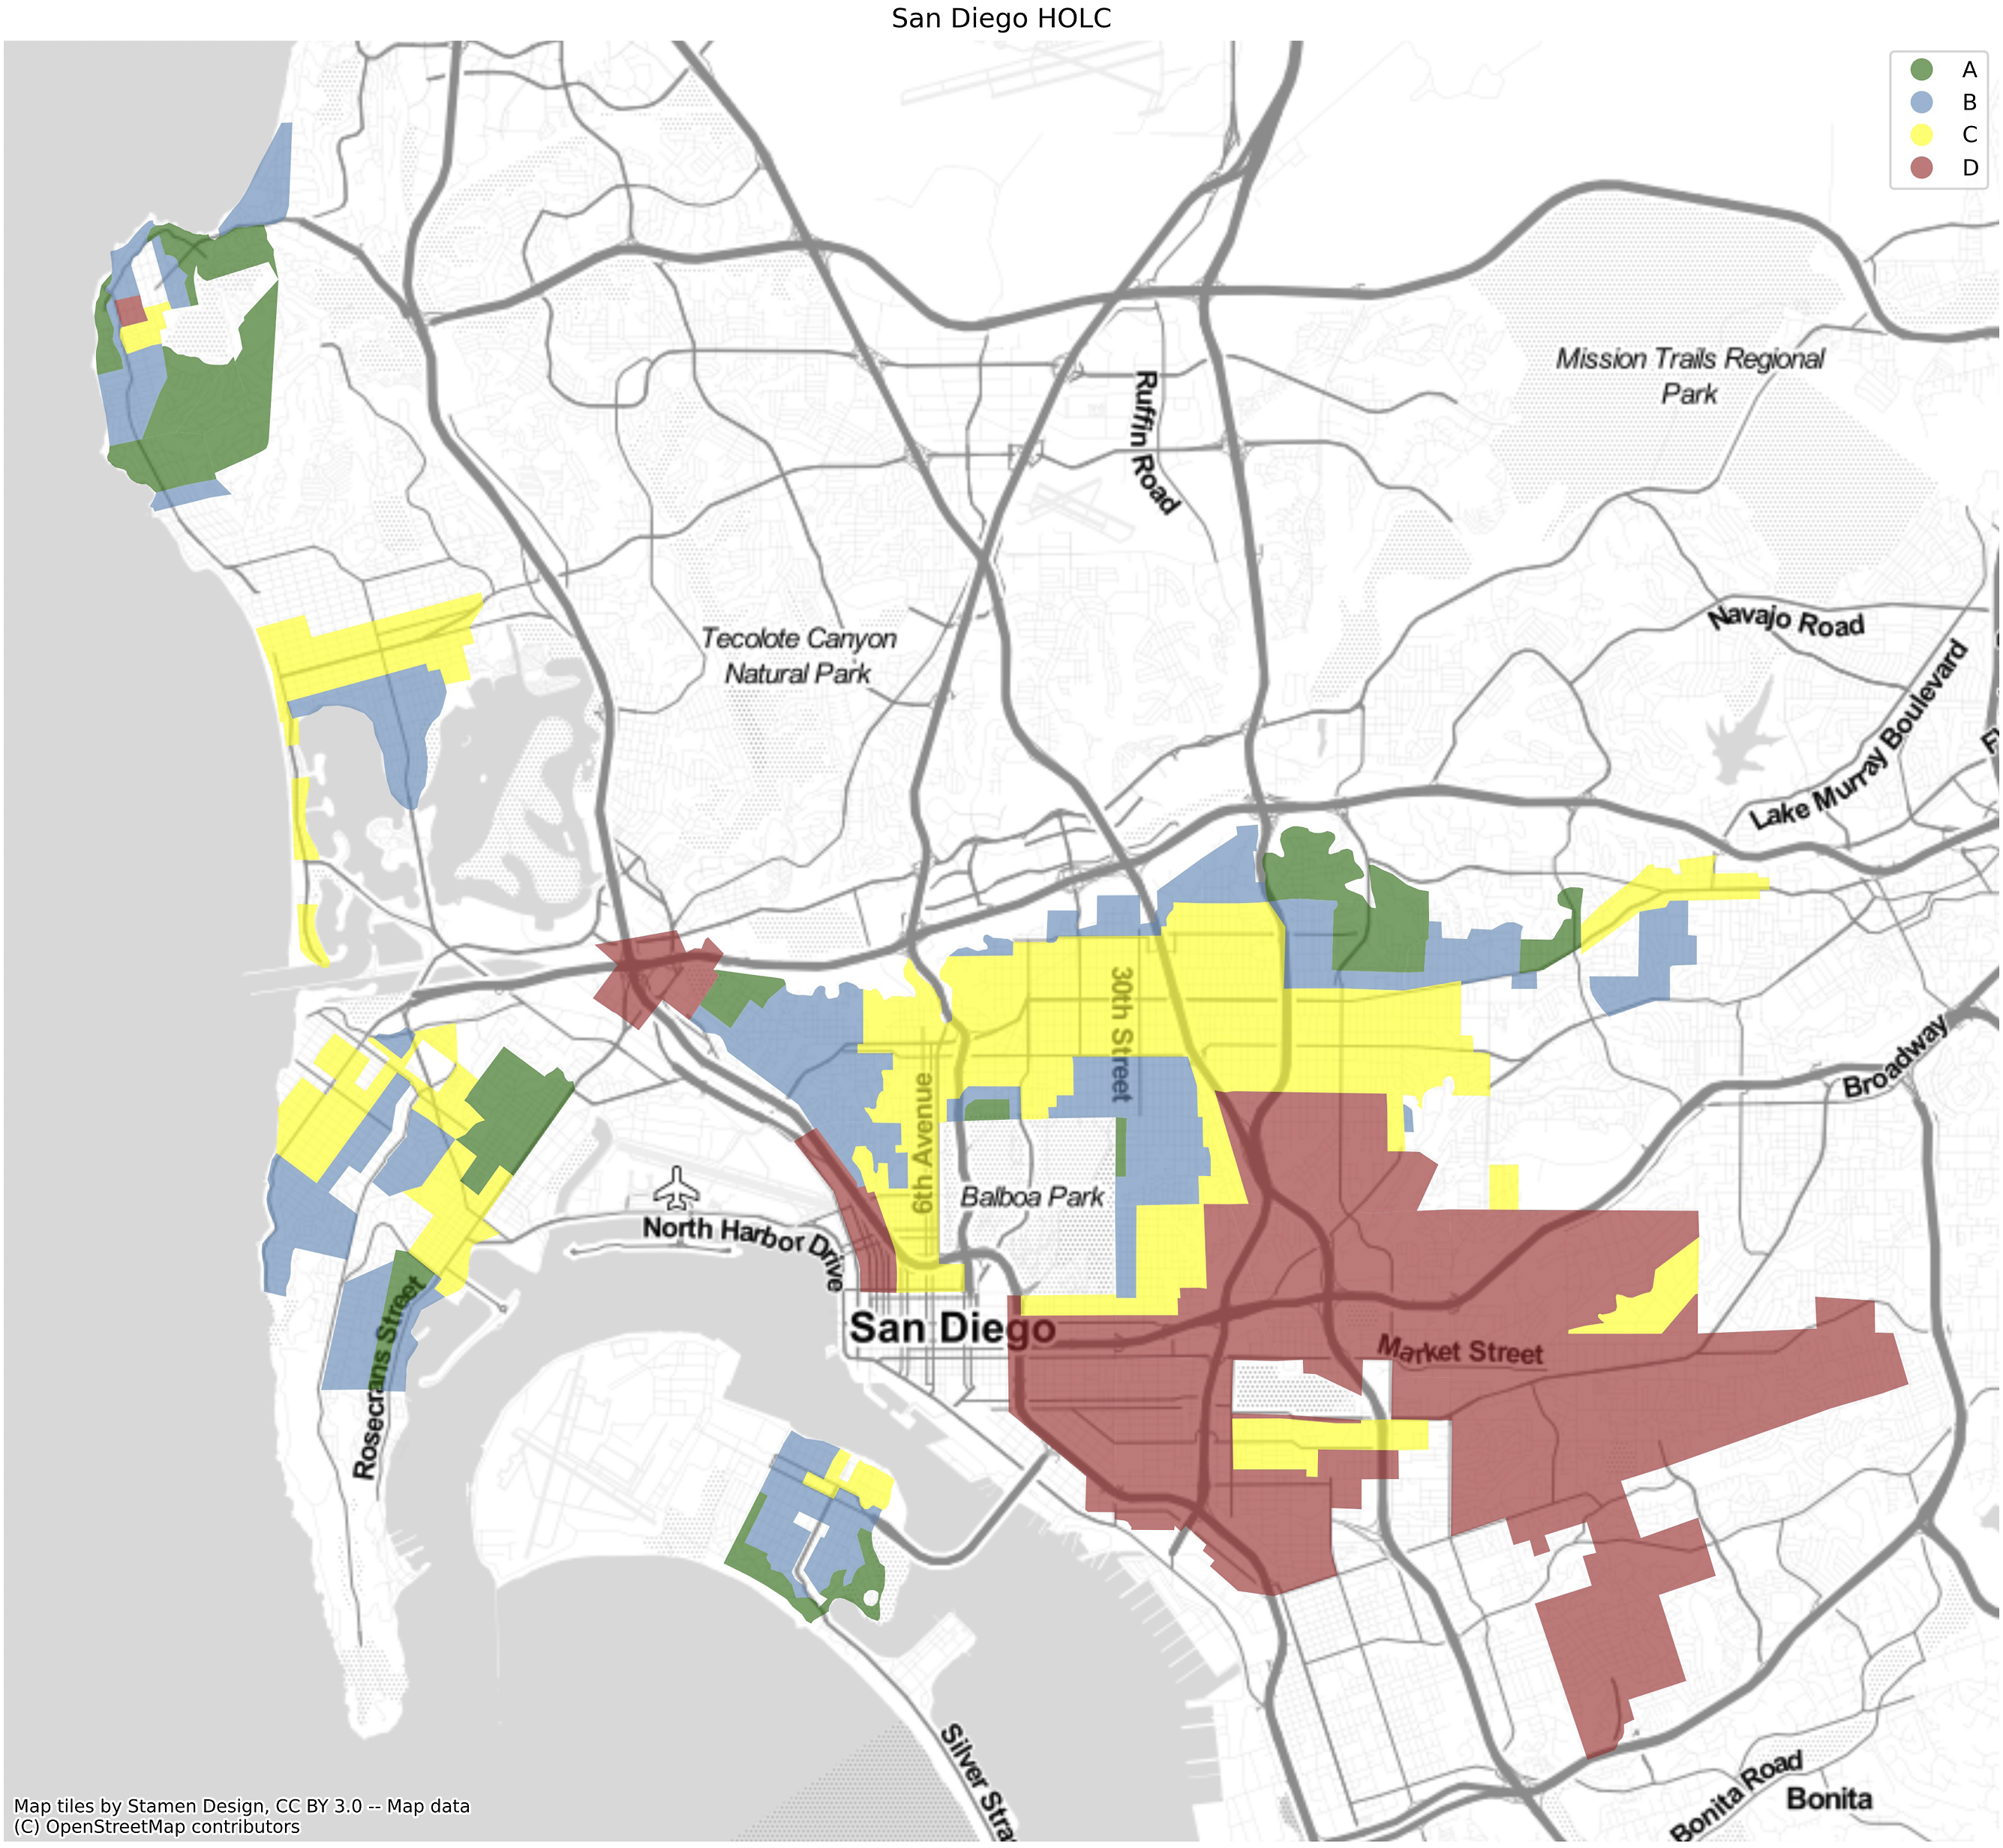
Within each city, the relative location of the HOLC graded tracts are summarized in Figure 10. For tracts of each of the 4 grades (A, B, C, D) and non-graded (N), we consider the probability that a neighboring tract is of a given grade level. As such each row is a conditional probability distribution that reports the probability that the tract with that row-level grade has a neighbor in each of the possible grade levels. The matrices are largely diagonally dominant, meaning that neighbors are more likely to be of a similar grade level. For example, in the case of San Diego, a tract with an A grade is more likely to have neighbors that are graded A or B than C or D (first row), while a tract that is graded D is more likely to have a neighbors that are graded C or D rather than A or B (fourth row). In general terms, the non-graded tracts are more numerous than the graded tracts due to the historical evolution of the cities evolving outwards from the HOLC tracts that are now more centrally located. As such, the N tracts have a much higher probability of having N neighbors than is the case for the other grades. Formal multicategorical join count tests for each of the eight cities reveal significant departures from randomness in the spatial grade distributions.
3
Spatial join probabilities by grade type. Each cell reports the probability of a tract with the row grade, having a neighboring tract with the column grade, by city.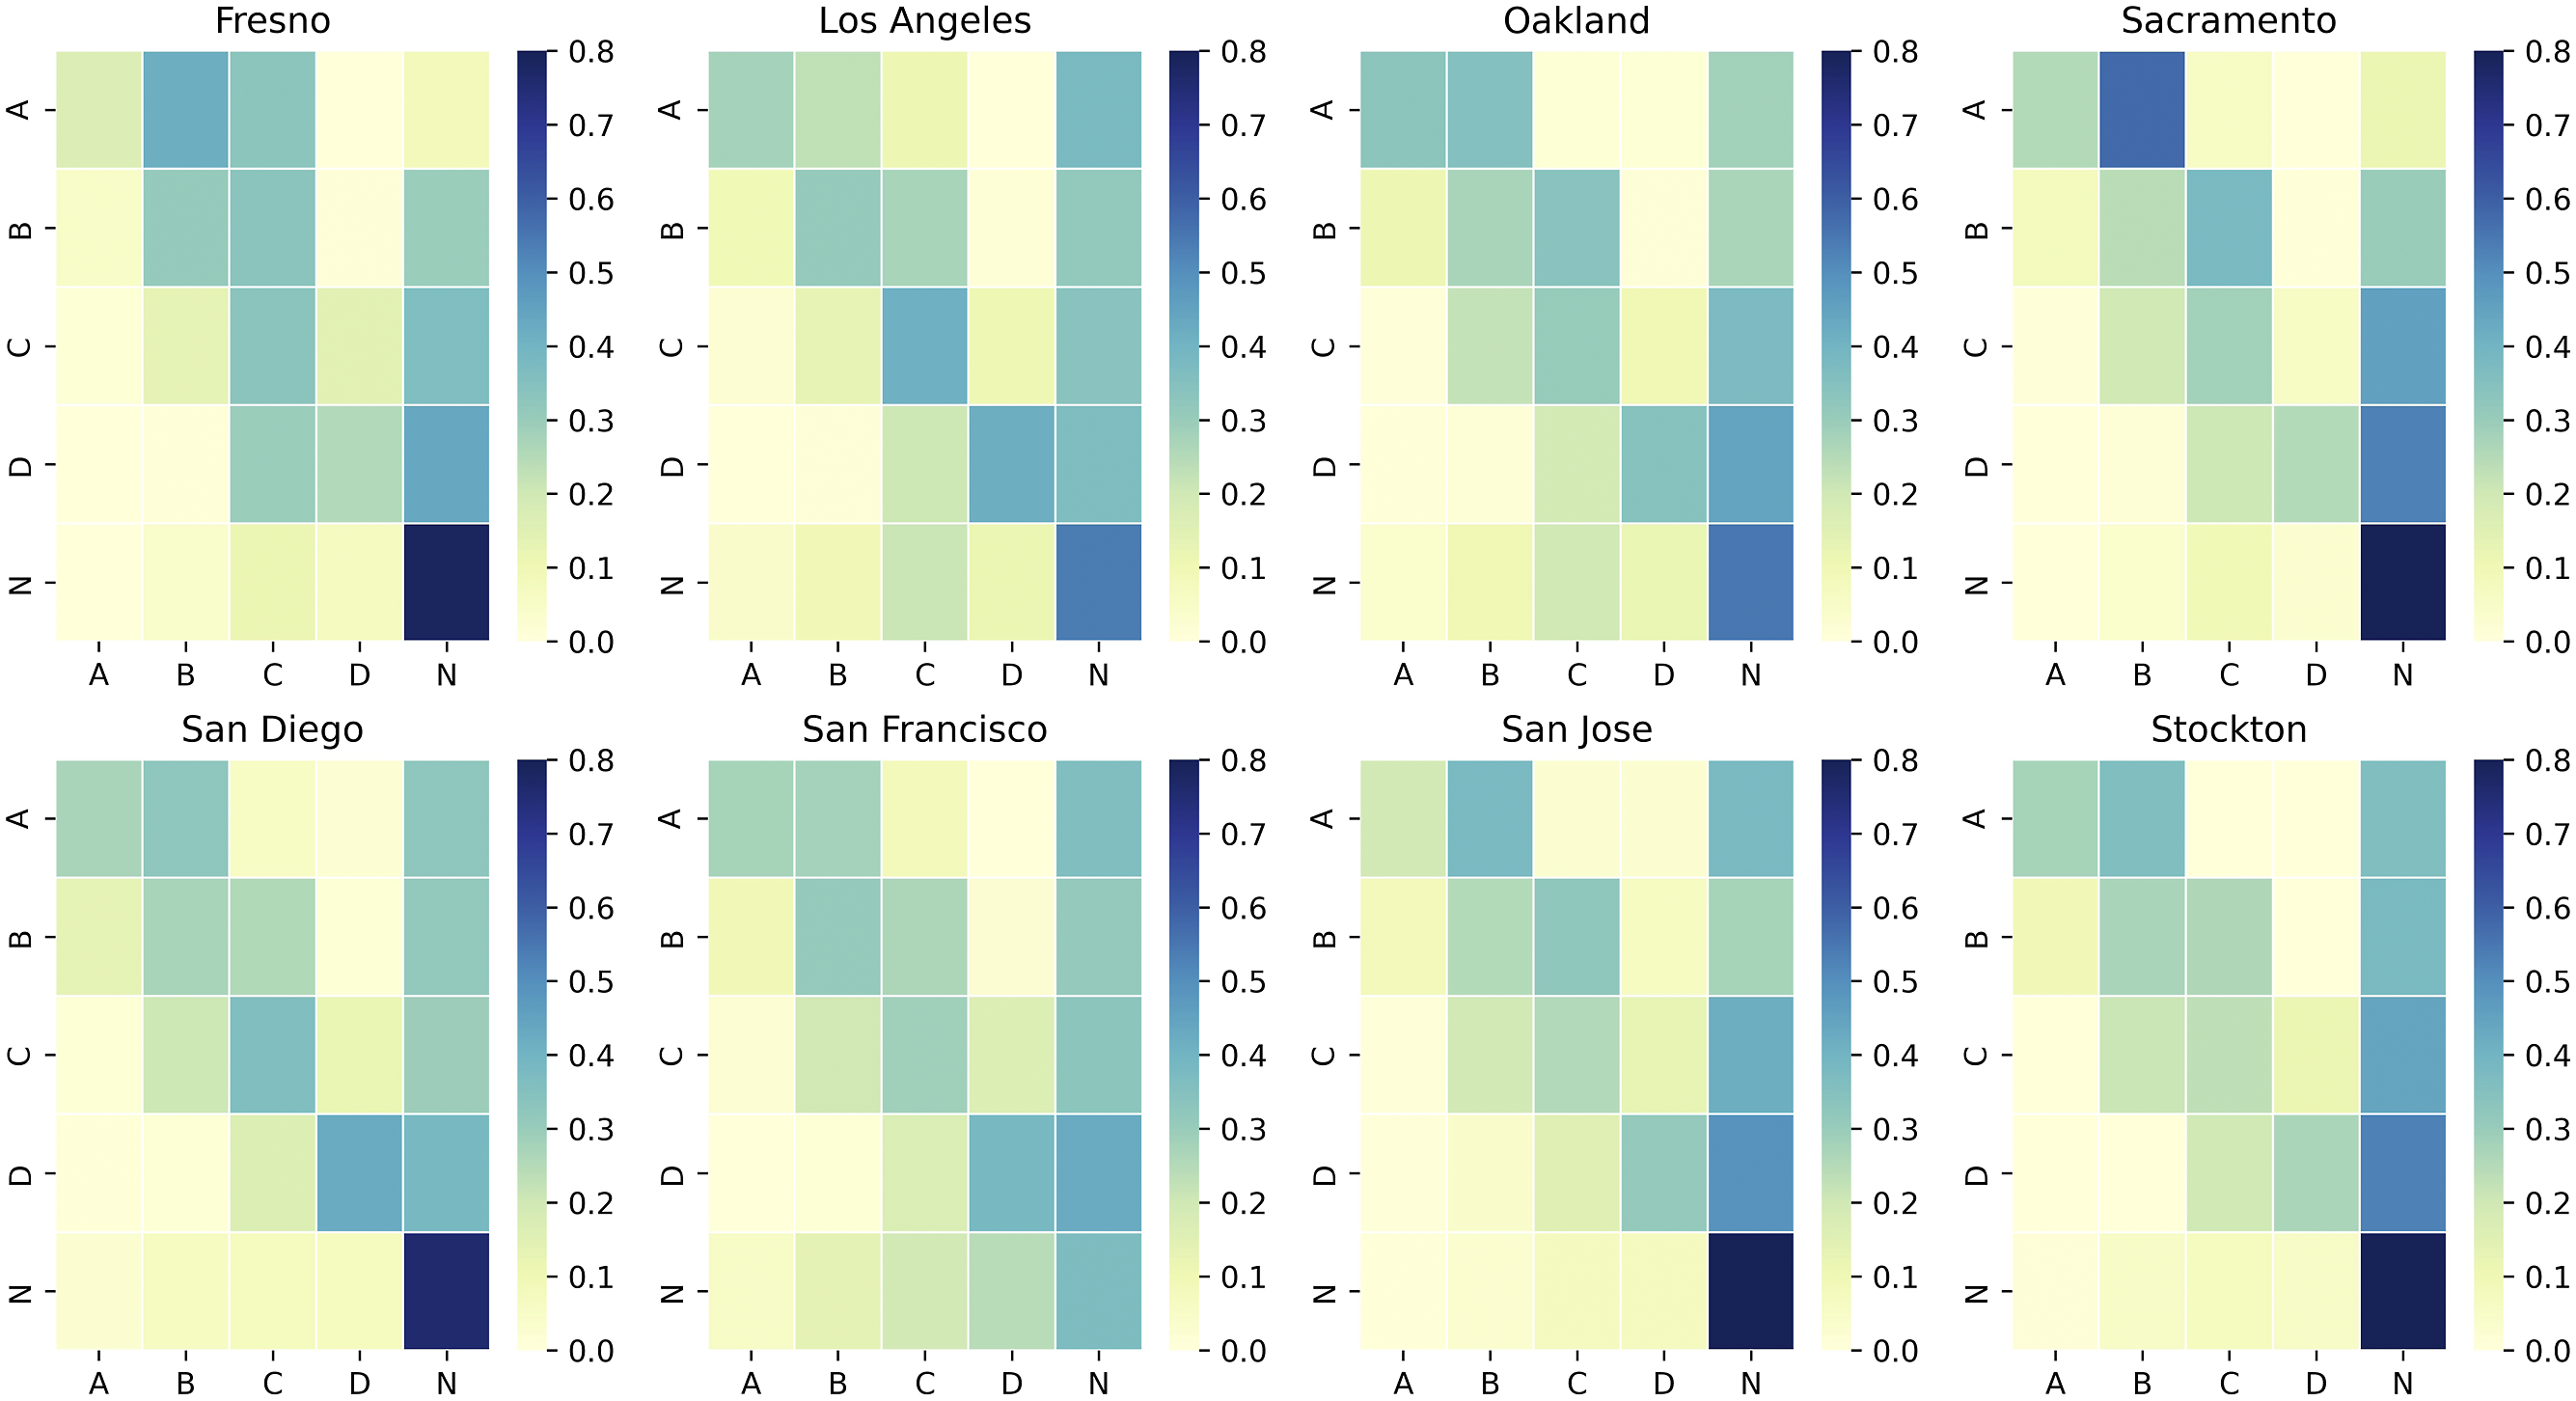
Given this historical context, we now shift attention to an examination of the modern spatial dynamics across and within these HOLC communities to examine the legacy effects of this program in California.
Inter-Urban Dynamics
To examine the modern spatial dynamics and how HOLC designations may have influenced these dynamics, we first focus on the county level analysis. Here we are distinguishing between those counties that had an HOLC city and those counties that were not subject to HOLC designations.
Racial churn
Figure 11 reports the measure of ethnic churn from (4). There is a clear pattern of the HOLC counties in the bottom half of the ethnic mobility rankings, with San Francisco and Los Angeles displaying the least amount of ethnic churn over 1990-2010. At the same time, there appears to be an association between the size of a county’s population and the ethnic churn measure as smaller counties dominate at the top of the mobility rankings, and mobility appears to lessen as county size grows. There are notable exceptions to this as Riverside County with a population of 2.2 million in 2010 is in the top third of the distribution and the small counties of Siskiyou and Modoc appear in the bottom third. Citywide dynamics in tract ethnic composition 1990-2010.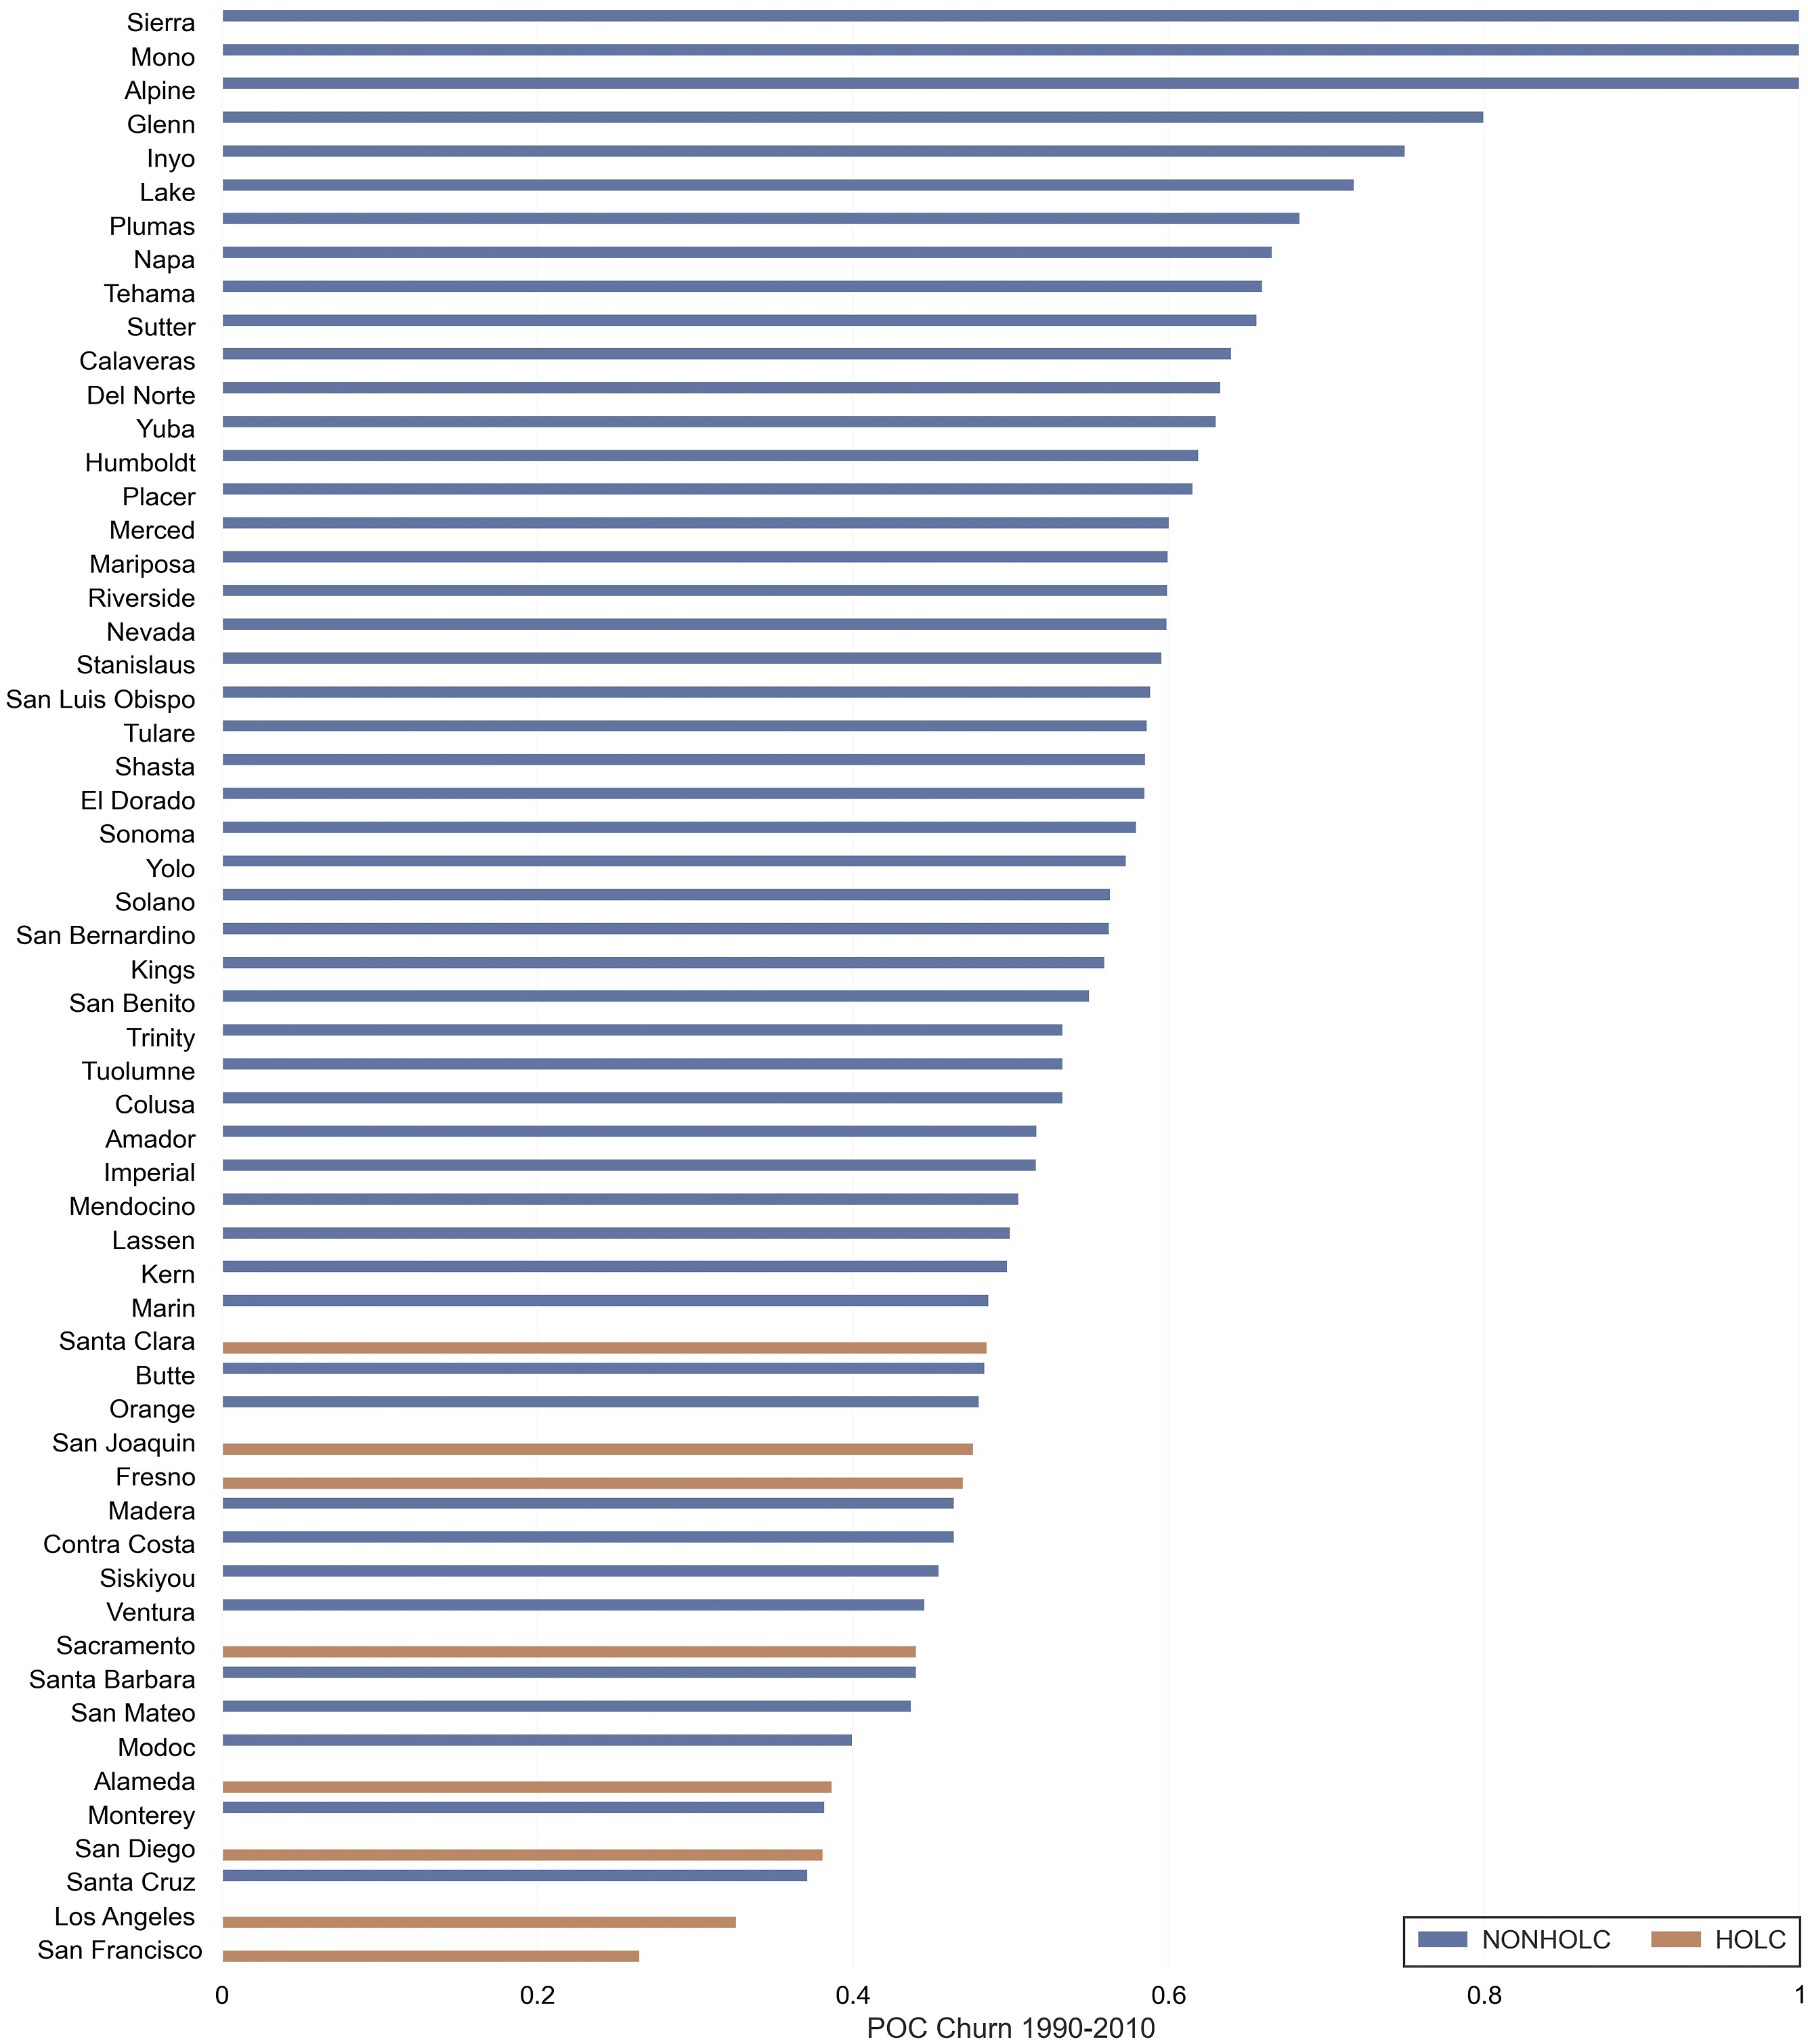
Interurban Level Model of Ethnic Churn.
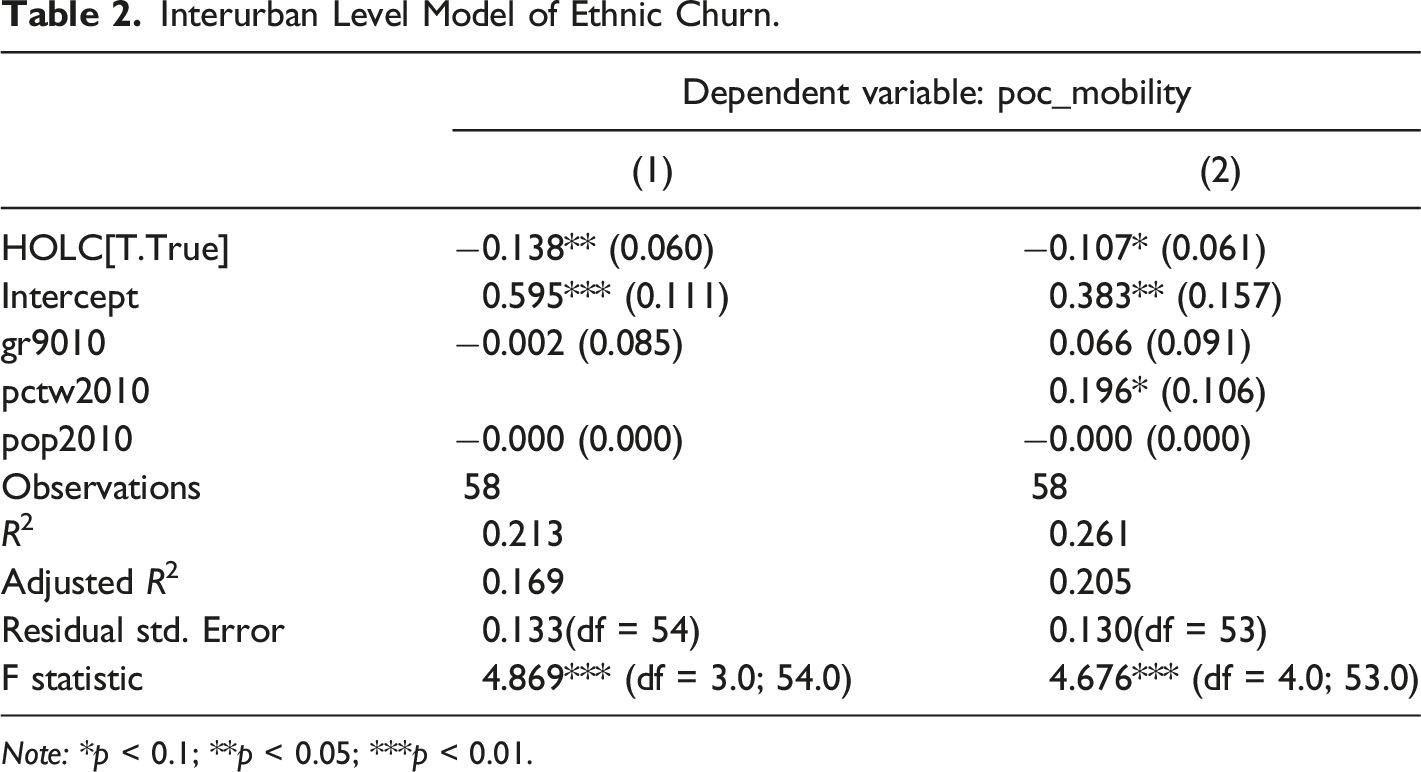
Note: *p < 0.1; **p < 0.05; ***p < 0.01.
Income dynamics
We next examine the inter-urban patterns in tract median household income dynamics. Figure 12 reports the income mobility rankings for the 58 counties. Again, the HOLC counties are at the bottom of the mobility rankings, only this time the pattern is more pronounced than was the case for ethnic churn dynamics. Citywide dynamics in tract median household income 1990-2010.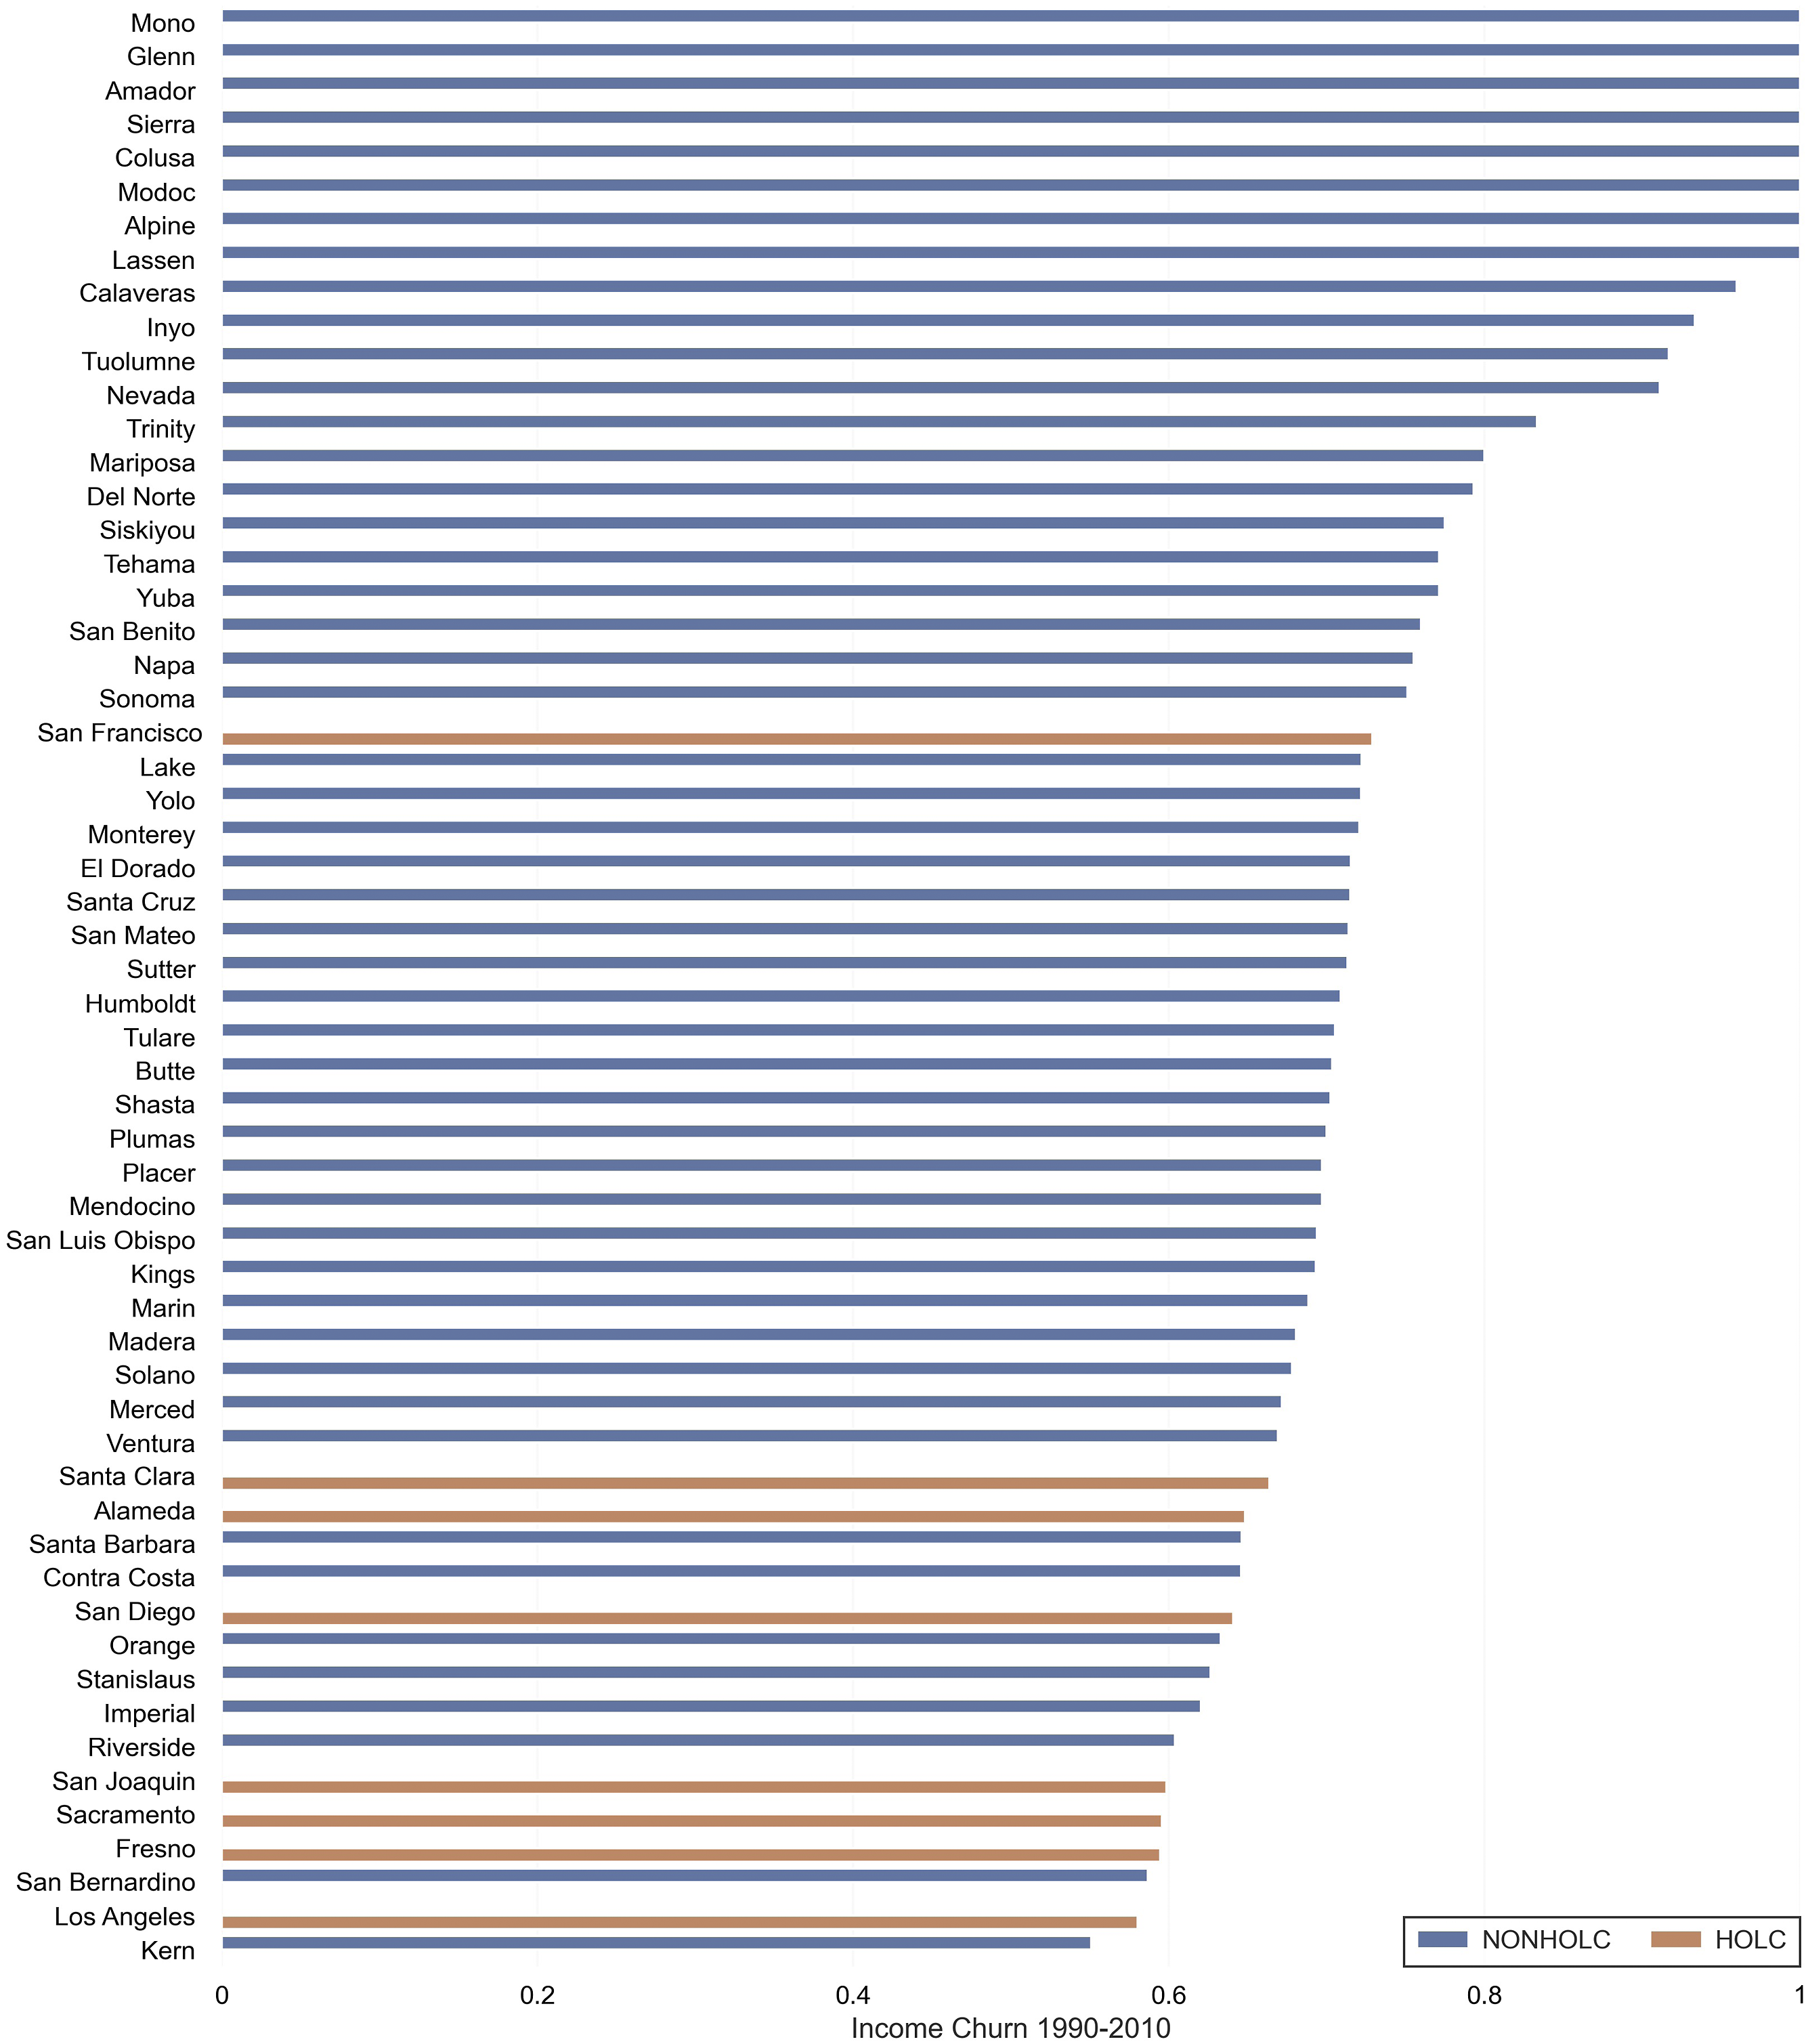
Interurban Level Model of Income Mobility 1990-2010.
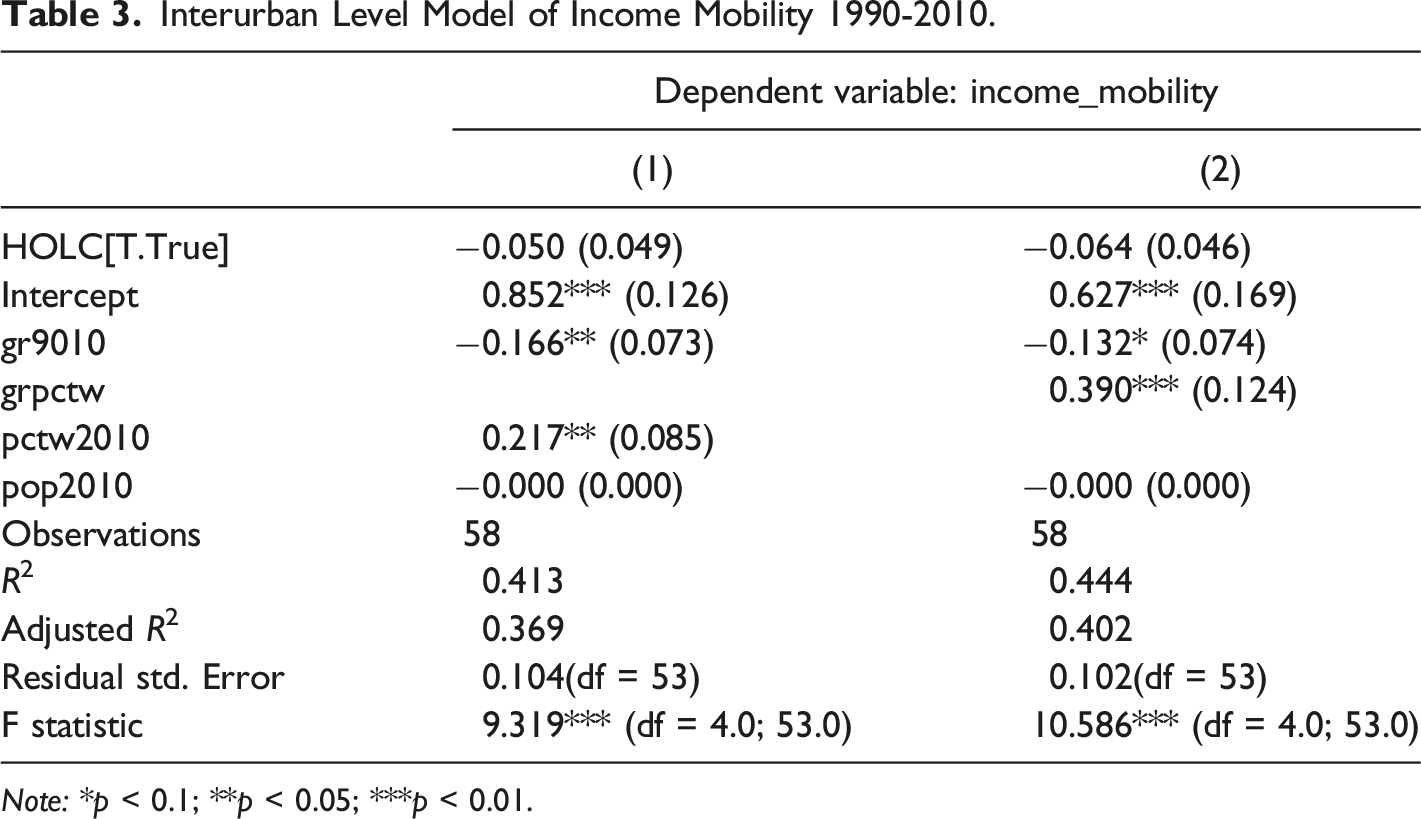
Note: *p < 0.1; **p < 0.05; ***p < 0.01.
Segregation
The third question we examine at the inter-urban scale is whether HOLC counties are more segregated than counties that did not have HOLC maps. Figure 13 shows the ranking of the counties on the dissimilarity index from (5). HOLC counties are all in the top have of the rankings with Los Angeles clearly separated from the HOLC group with the highest level of dissimilarity in the sample for 2010. Dissimilarity index, white versus non-white 2010.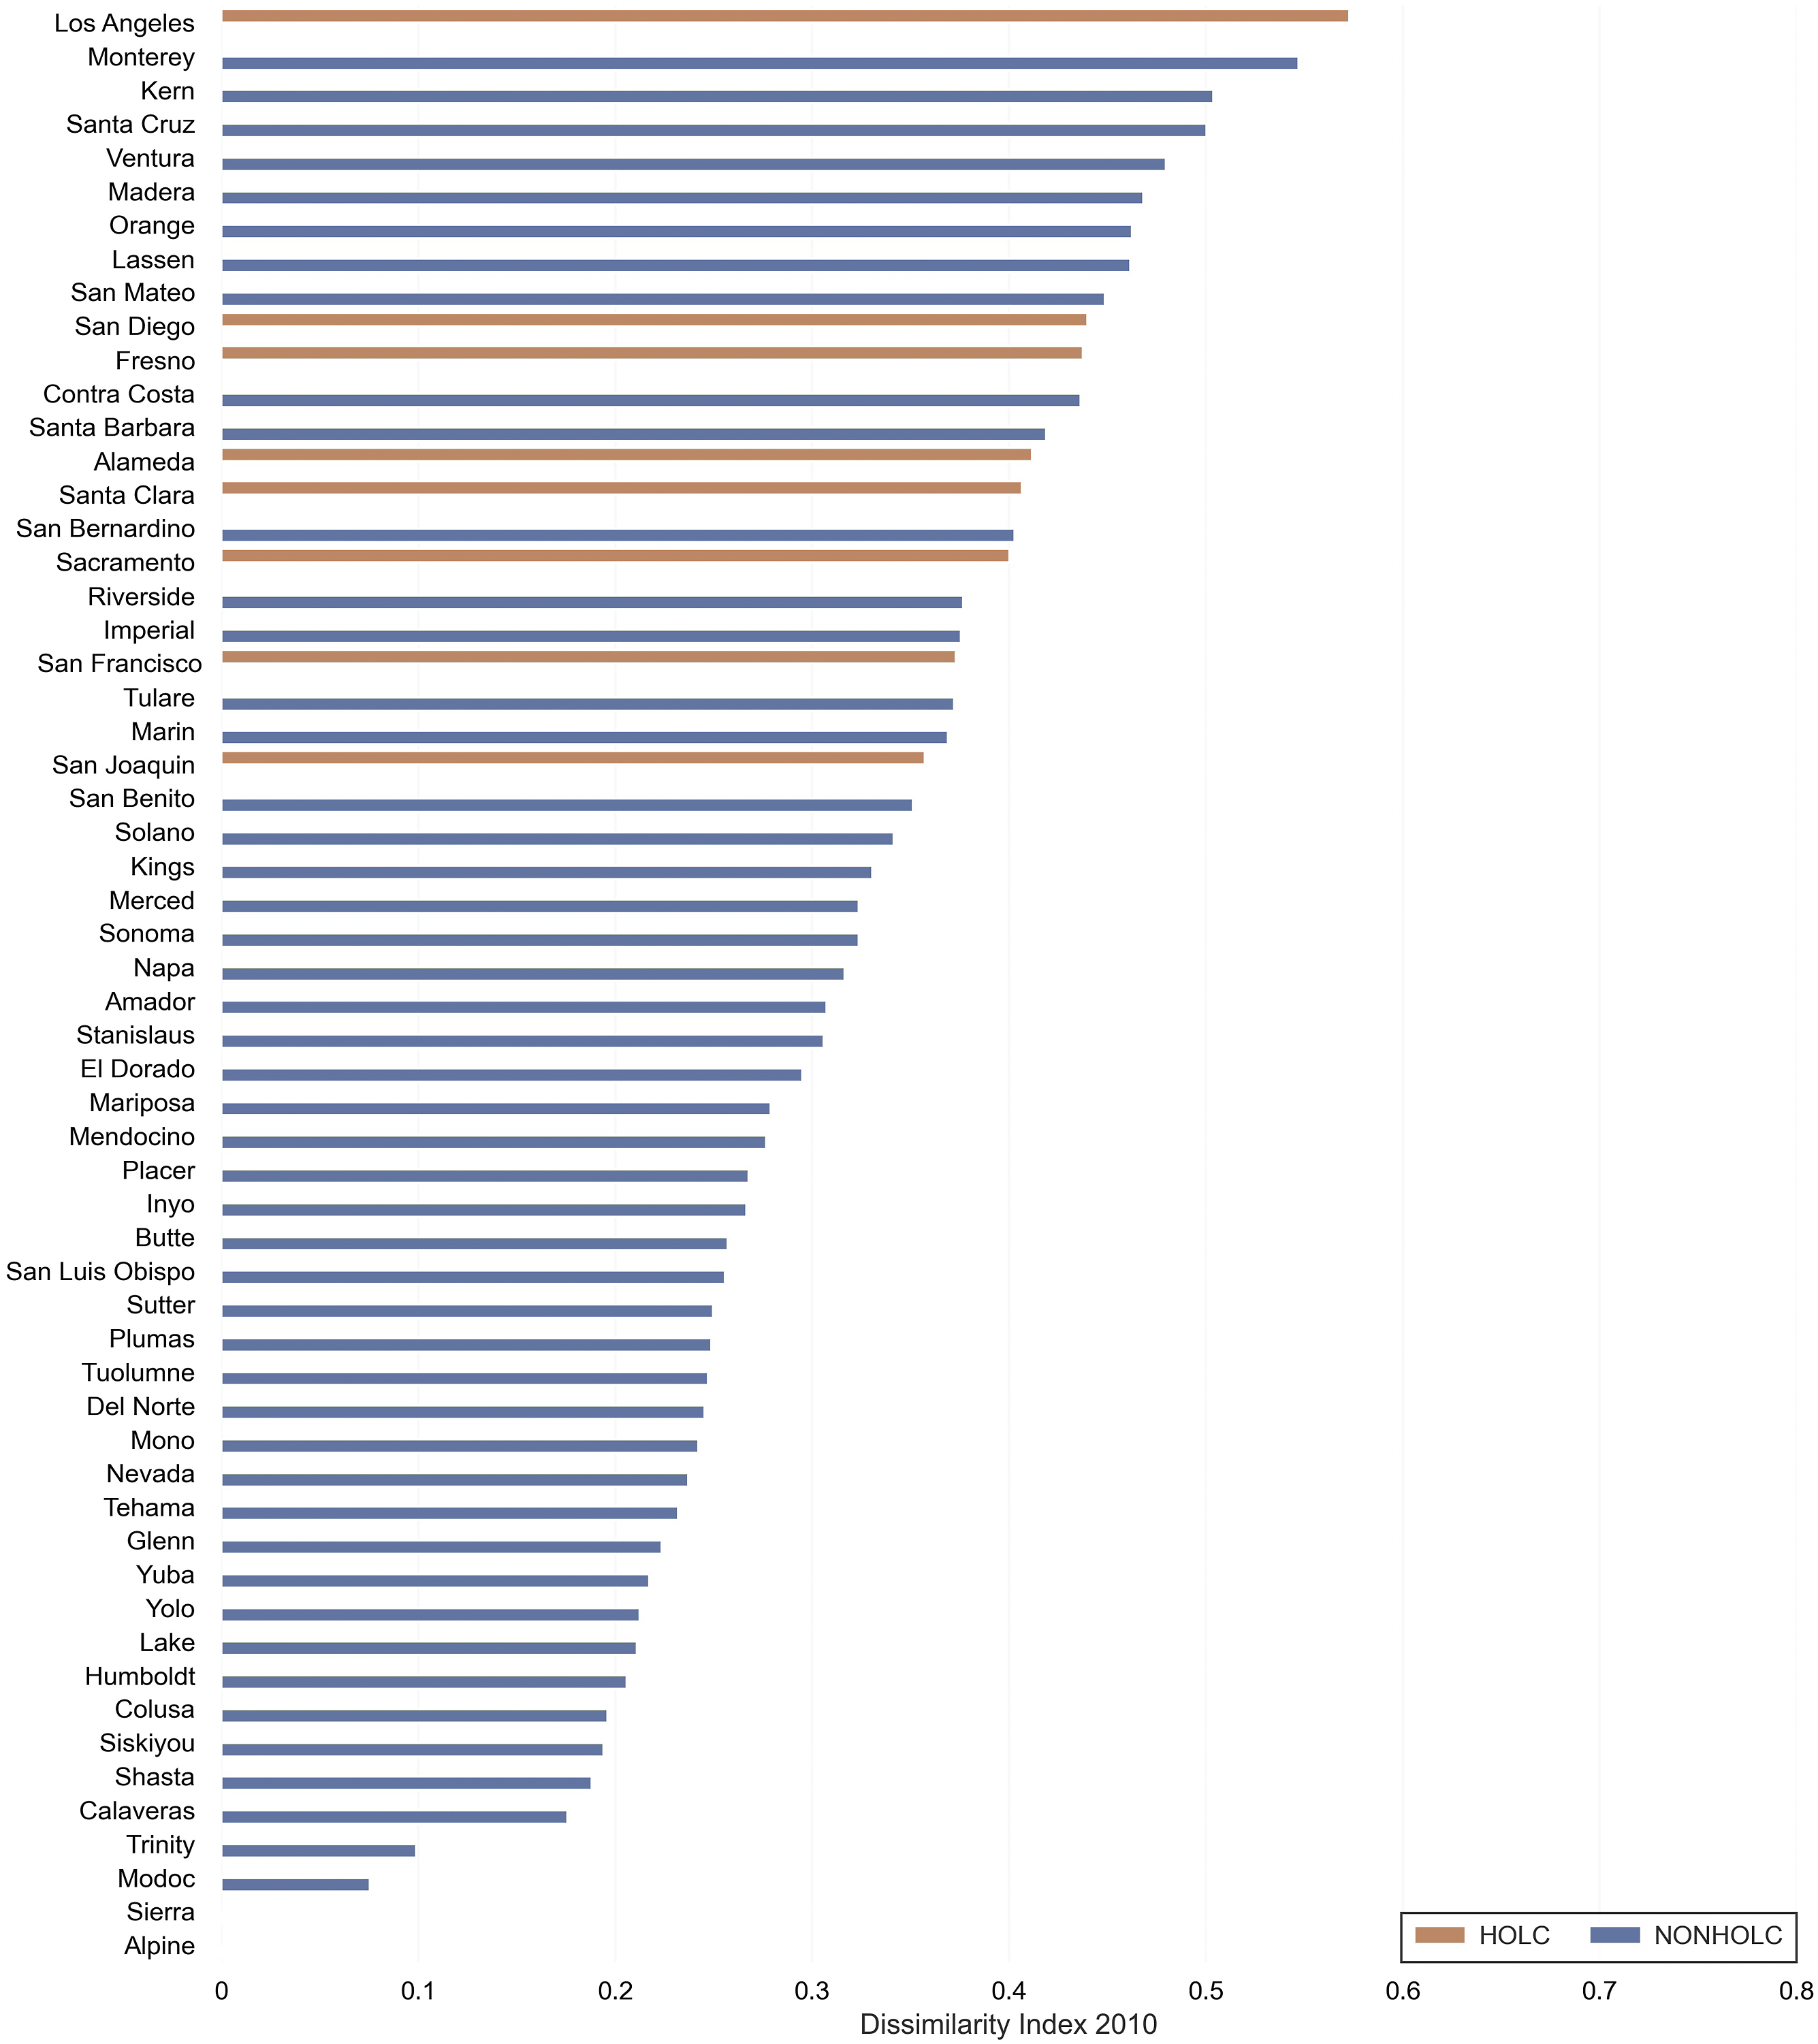
HOLC and Segregation 2010.
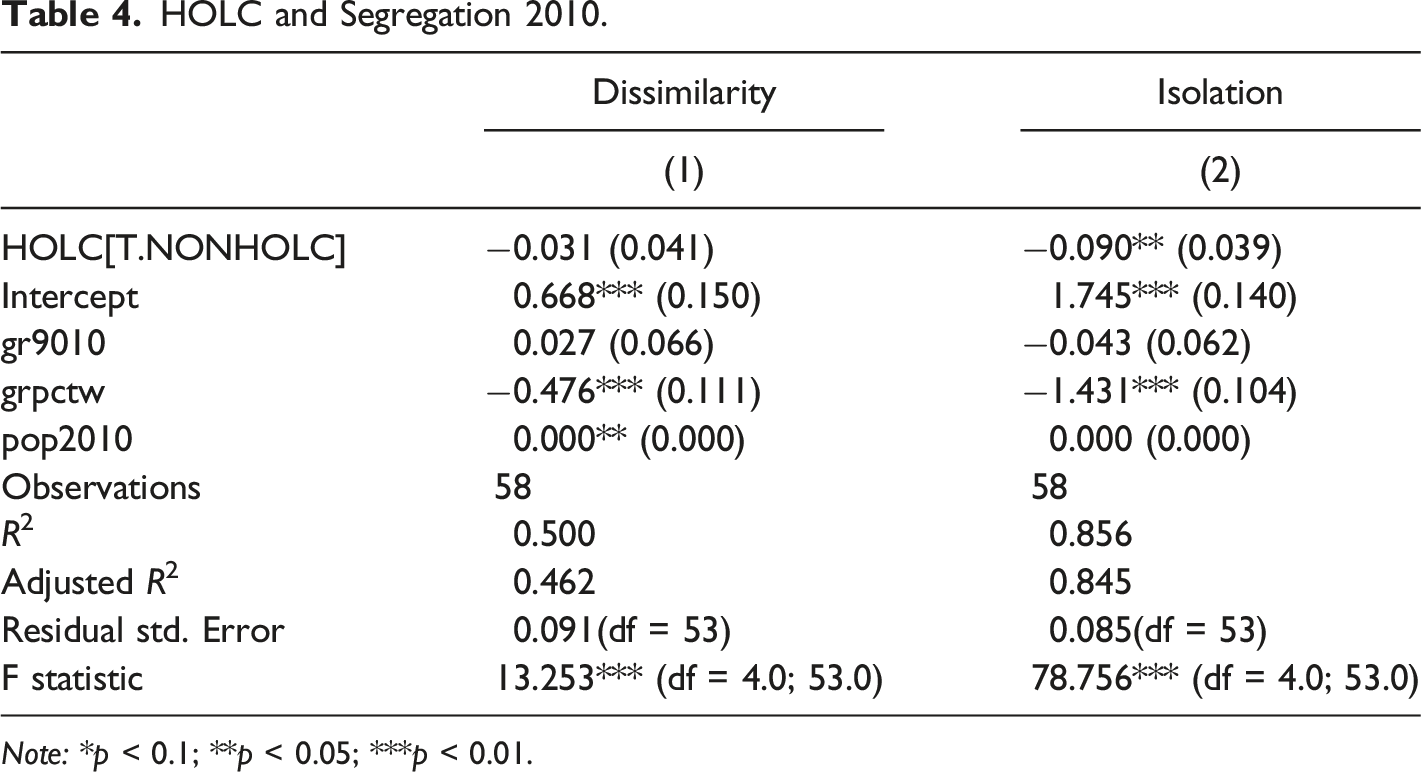
Note: *p < 0.1; **p < 0.05; ***p < 0.01.
We also examine isolation index of segregation from (6), the rankings of which are shown in Figure 14. Again, the HOLC counties are in the top half of the rankings, only now Los Angeles is second to Fresno in this measure of segregation. Model estimates in Table 4 reveal that size is not important to isolation segregation, while the growth rate in the white composition has a negative effect on both dissimilarity and isolation segregation. After controlling for these factors, we find that HOLC counties have statistically significant higher levels of isolation segregation, on the order of 0.09. Isolation index, white versus non-white 2010.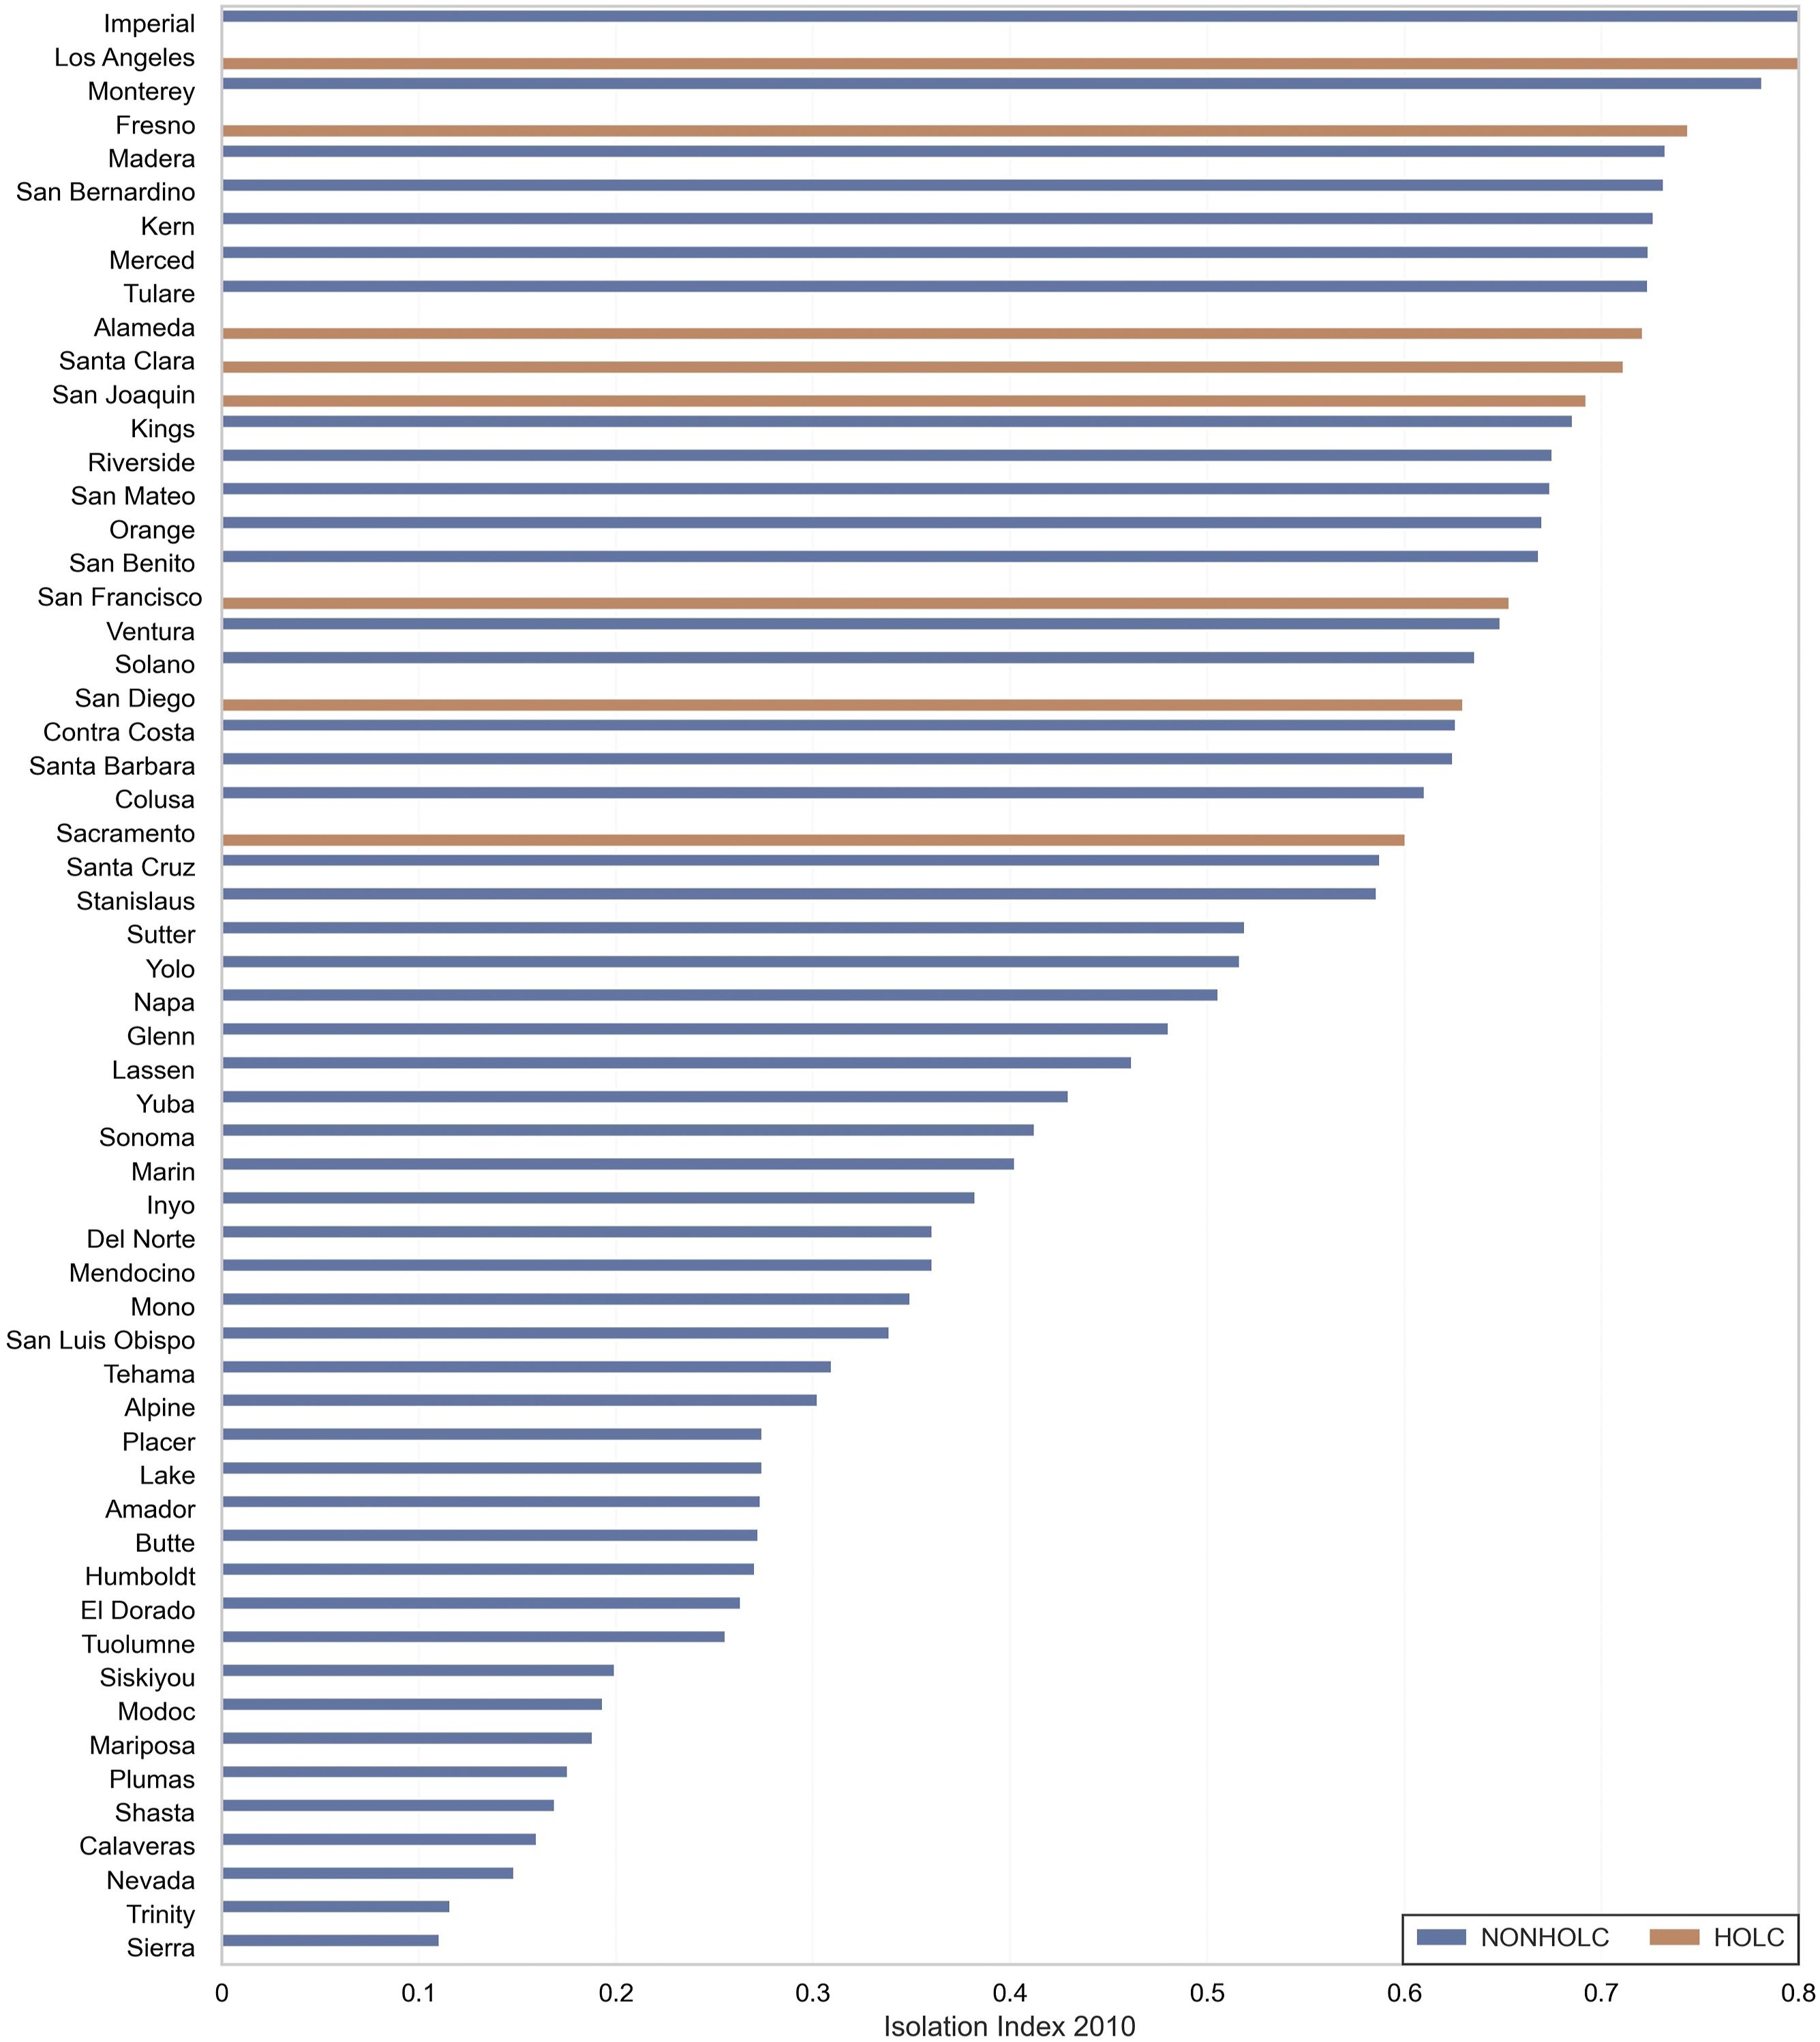
Intra-Urban Dynamics
We now turn our attention to the internal dynamics of the eight HOLC cities to contrast the experiences of tracts that have received different HOLC grades (or no grade at all). We test whether the ethnic churn and income dynamics are distinct between tracts with different HOLC grades. We then explore whether there are spillover effects on surrounding tracts that reflect spatial externalities due to HOLC designation.
Intra-urban ethnic composition dynamics
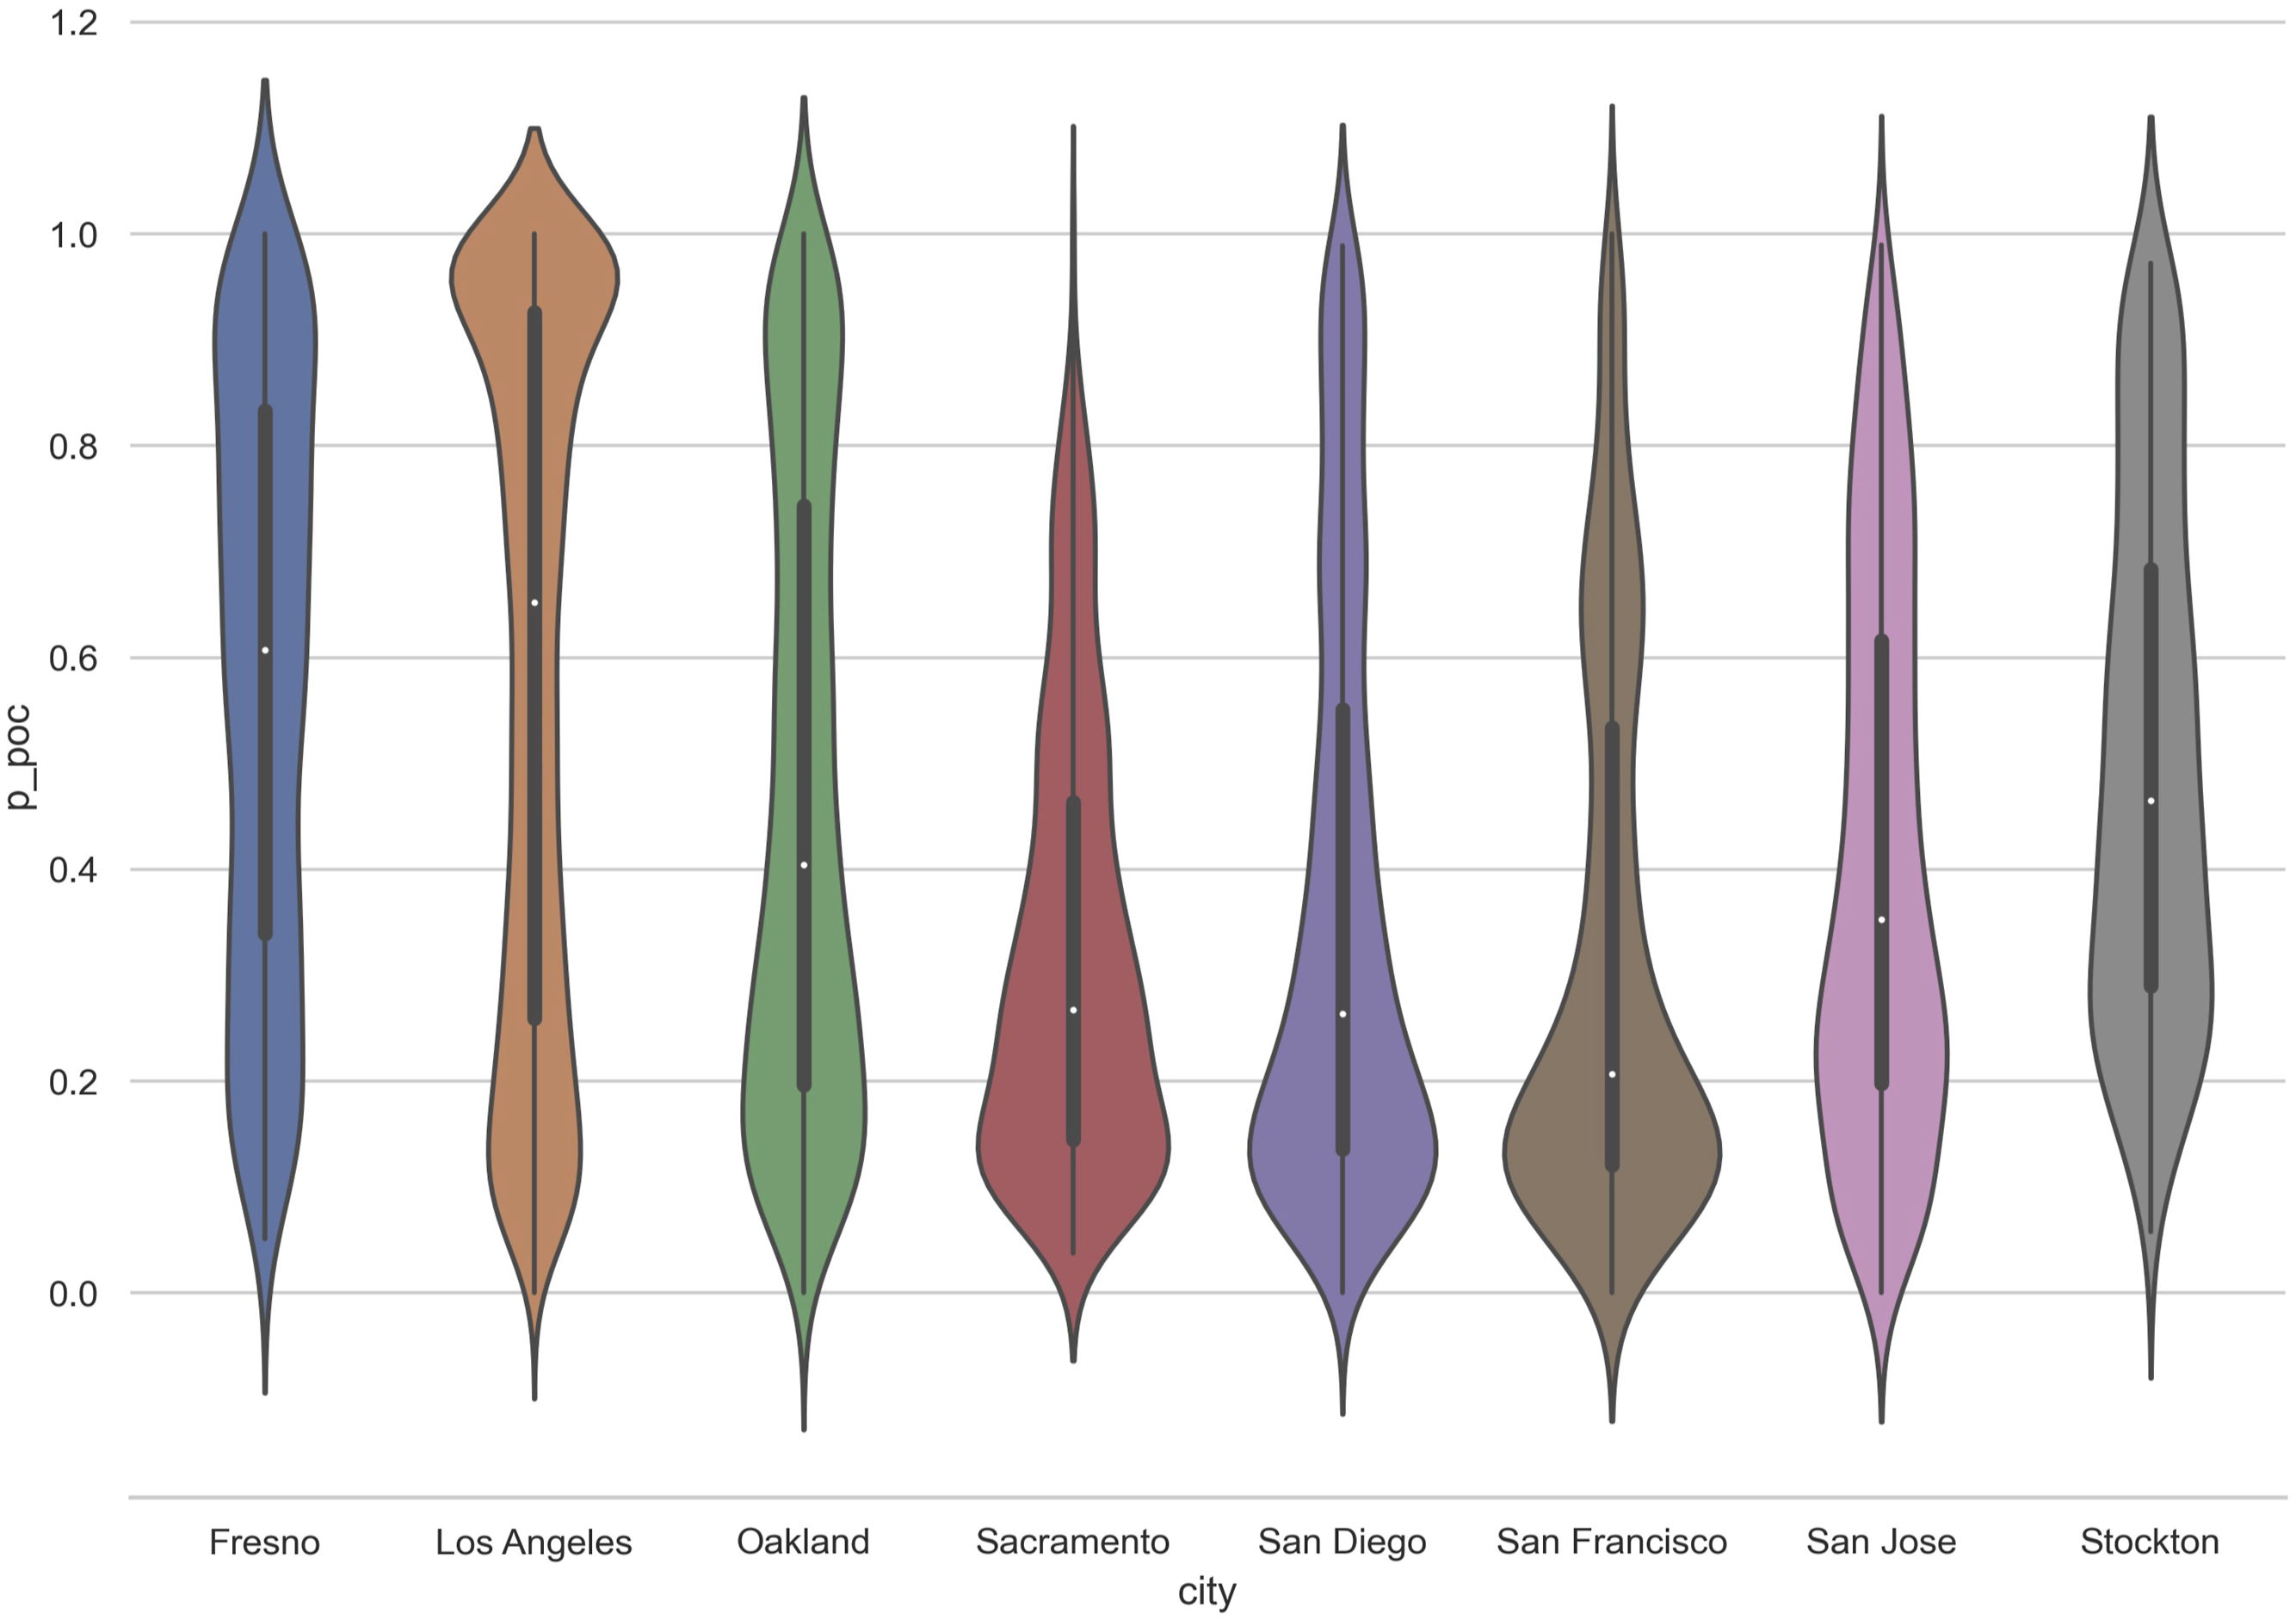
Figure 15 contains violin plots for the tract minority composition for the pooled set of HOLC cities in California. The violin plots combine a box plot with a kernel density estimate of the distribution, where the white dot is median value. The bi-modal distribution reflects strong spatial polarization of white and minority populations in these cities as the number of majority white or majority minority tracts dominate the more mixed tracts. Figure 16 splits these distributions out by each of the eight HOLC cities. The polarization is more evident in Los Angeles and, to lesser extents, Fresno and Oakland than compared to the other cities. San Francisco, San Diego, and Sacramento have markedly different distributions with white-majority tracks dominating the relatively fewer nonwhite-majority tracts. Pooled home owners’ loan corporation tract minority composition 2010. Tract minority composition 2010.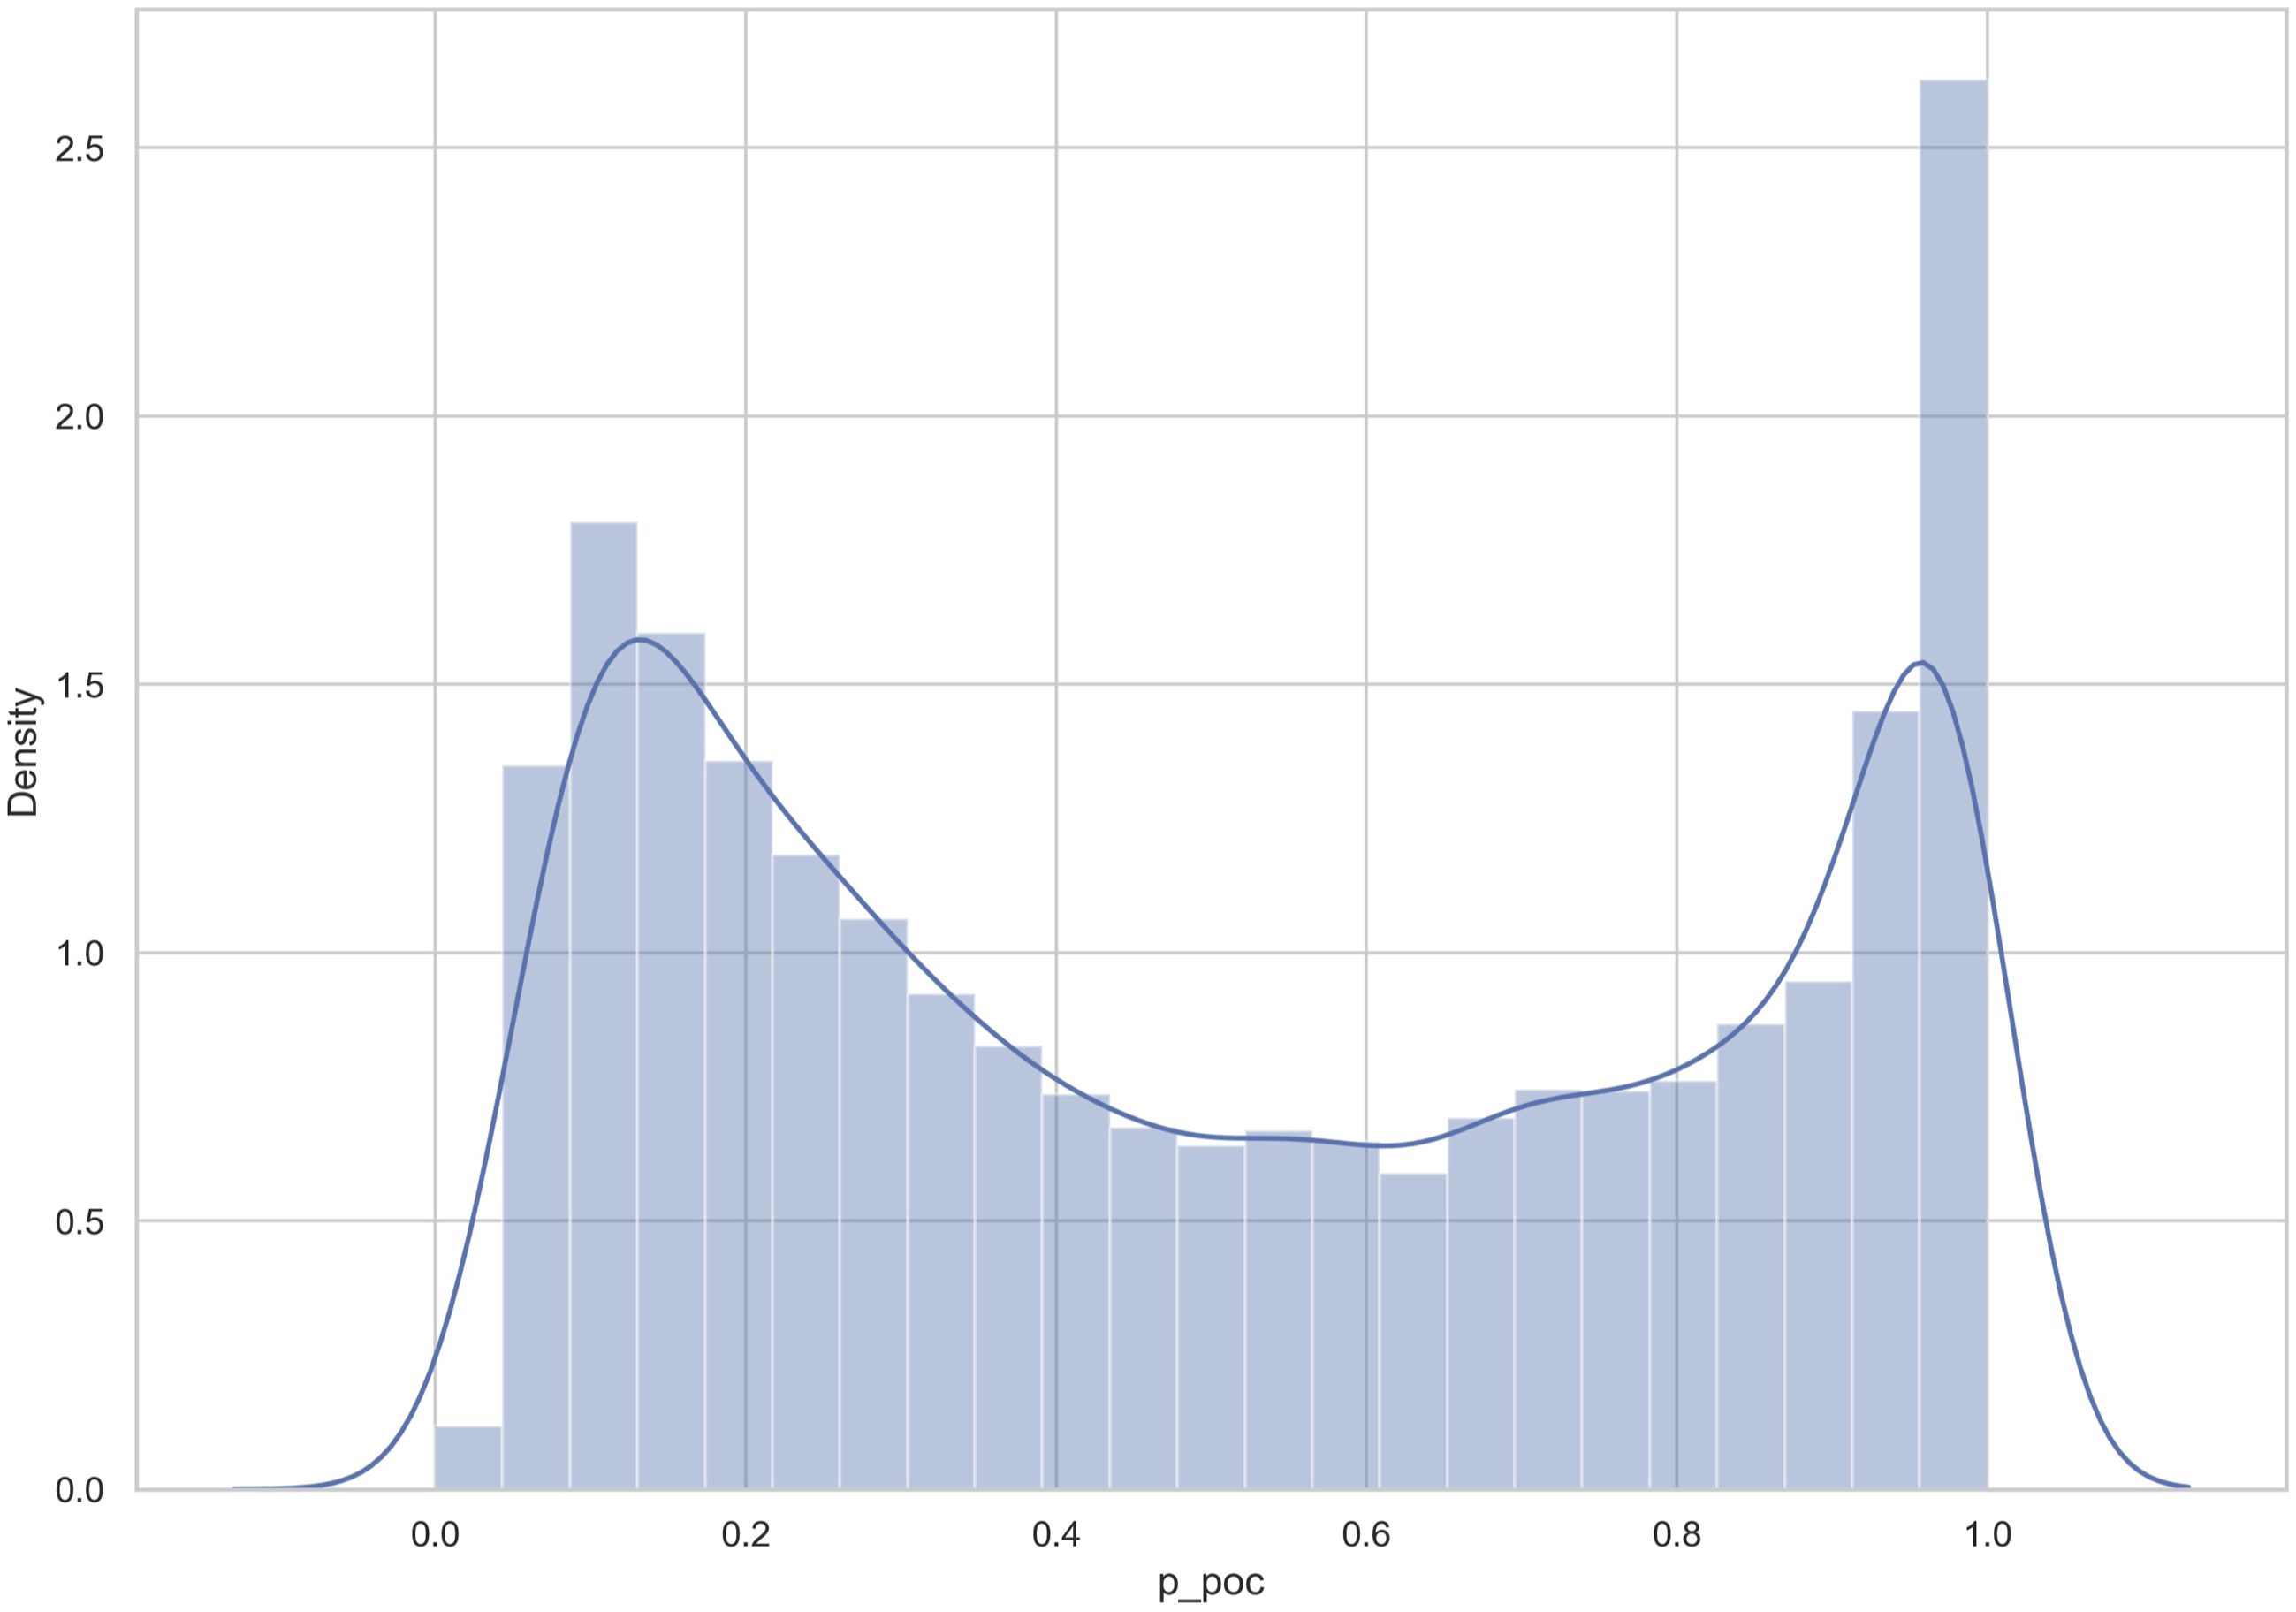
The distributions of tract nonwhite composition conditioned by HOLC grade are displayed in Figure 17. The non-graded tracts (N) reflect the bimodality seen in the overall distributions from Figure 15. However, there are striking differences in nonwhite composition across the tracts with different HOLC grades. The A-graded tracts are predominantly white in composition, with the B-graded tracts more bimodal than the A-graded tracts and an intermediate step to the C and D-graded tracts where the tract composition becomes more minority dominant. Pooled tract minority composition and home owners’ loan corporation grade 2010.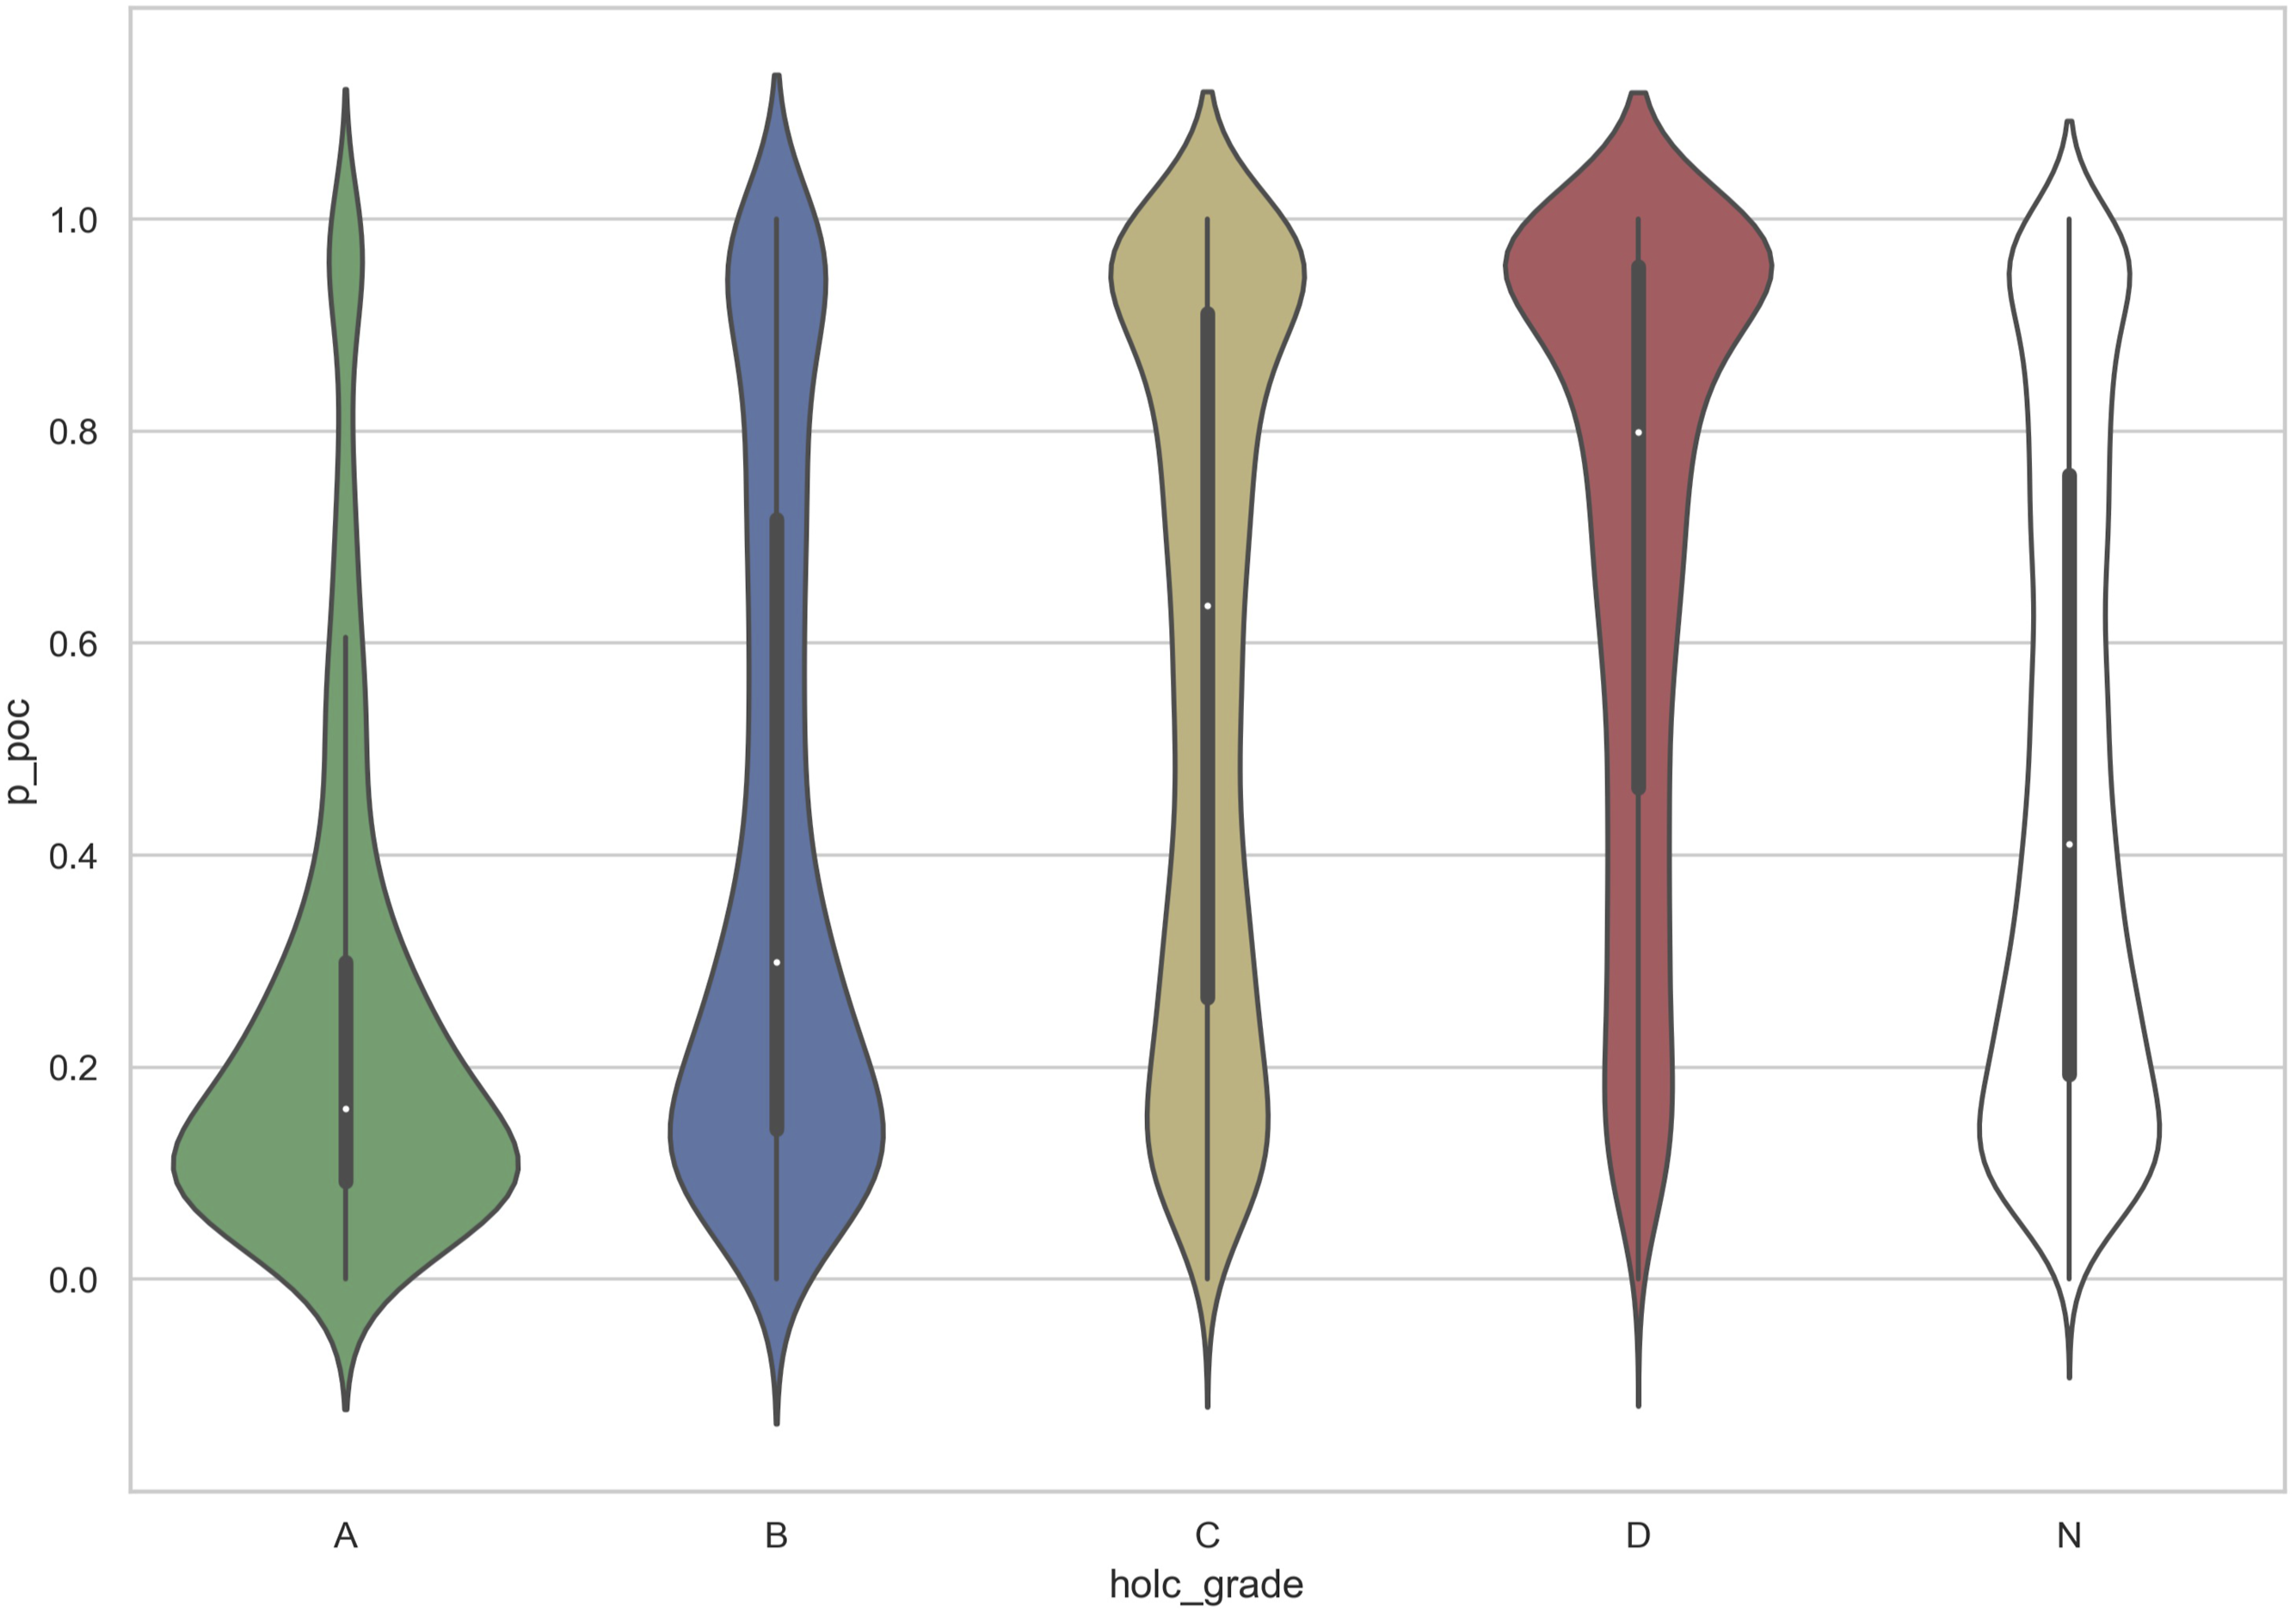
Figure 18 unpacks the pooled results from Figure 17 to contrast the D-graded tracts against other tracts in each of the eight HOLC cities. Doing so reveals substantial variation across the cities, as Los Angeles has polarized distributions for the tract ethnic composition for D-graded and all other tracts, while in Oakland, the D-graded tracts are polarized while all other tracts have a more uniform minority distribution. San Diego has still a different profile, as the D-graded and all other tracts have ethnic composition distributions that are the inverse of one another. City tract minority composition and home owners’ loan corporation grade 2010.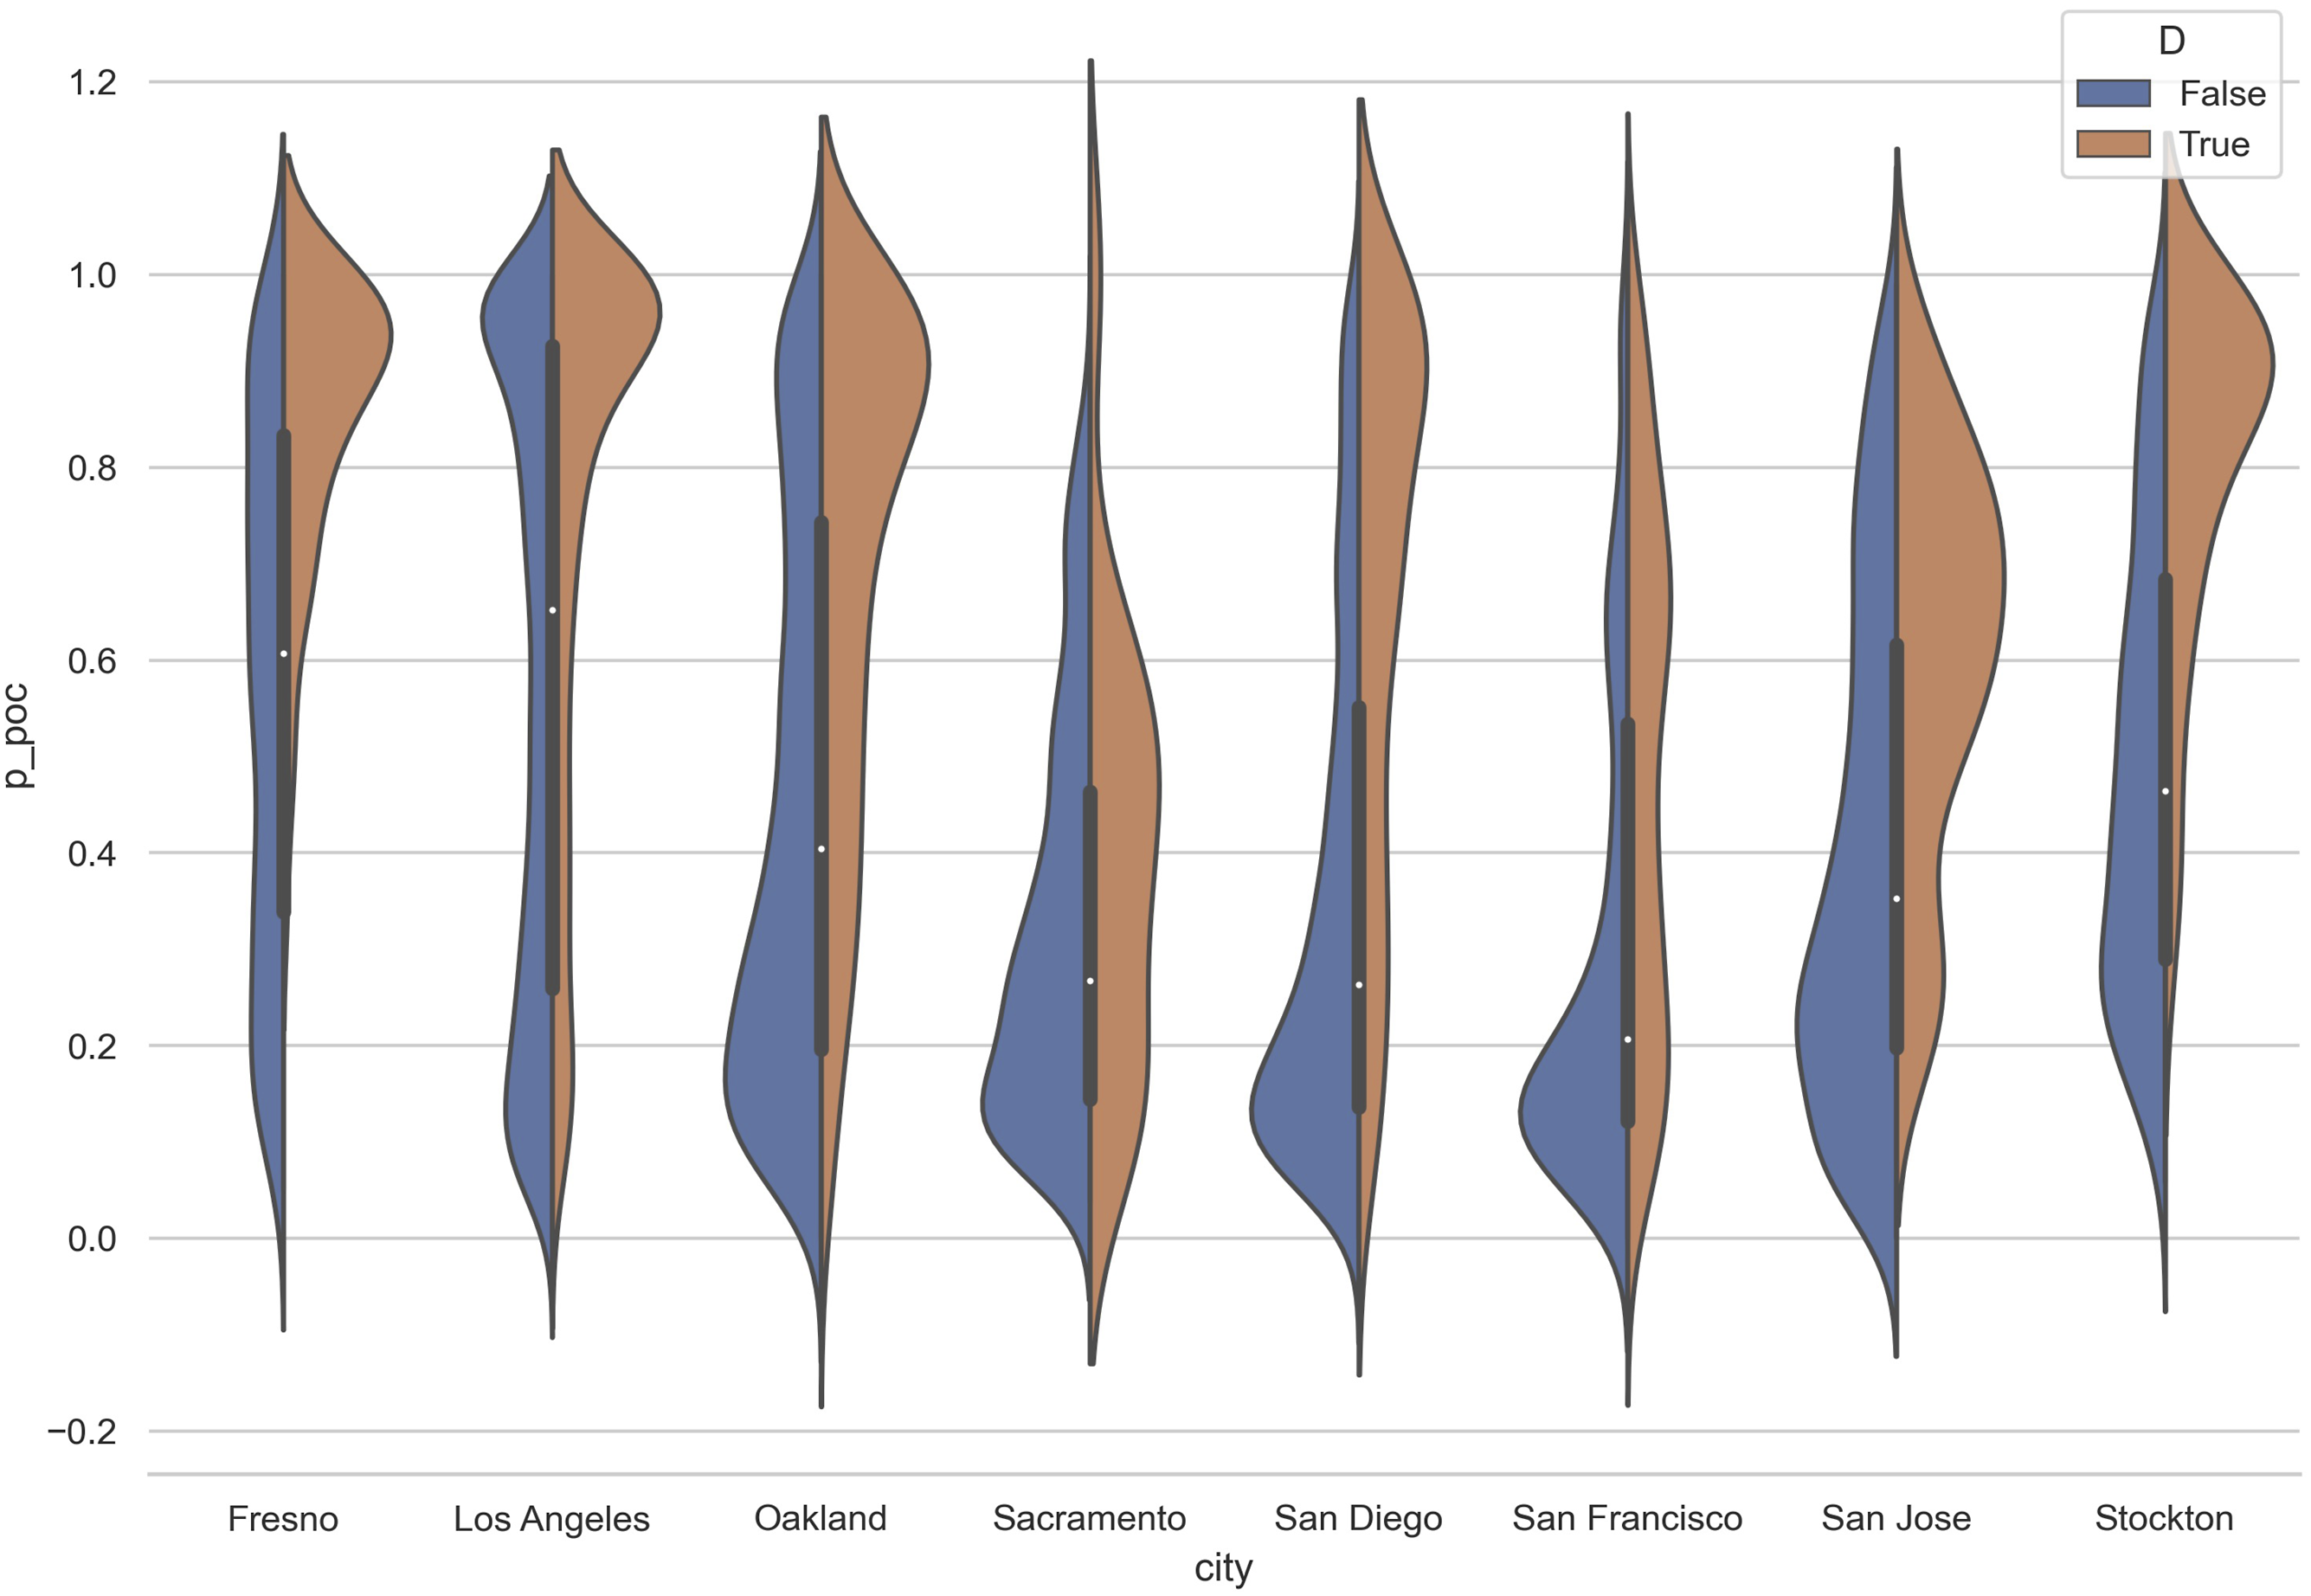
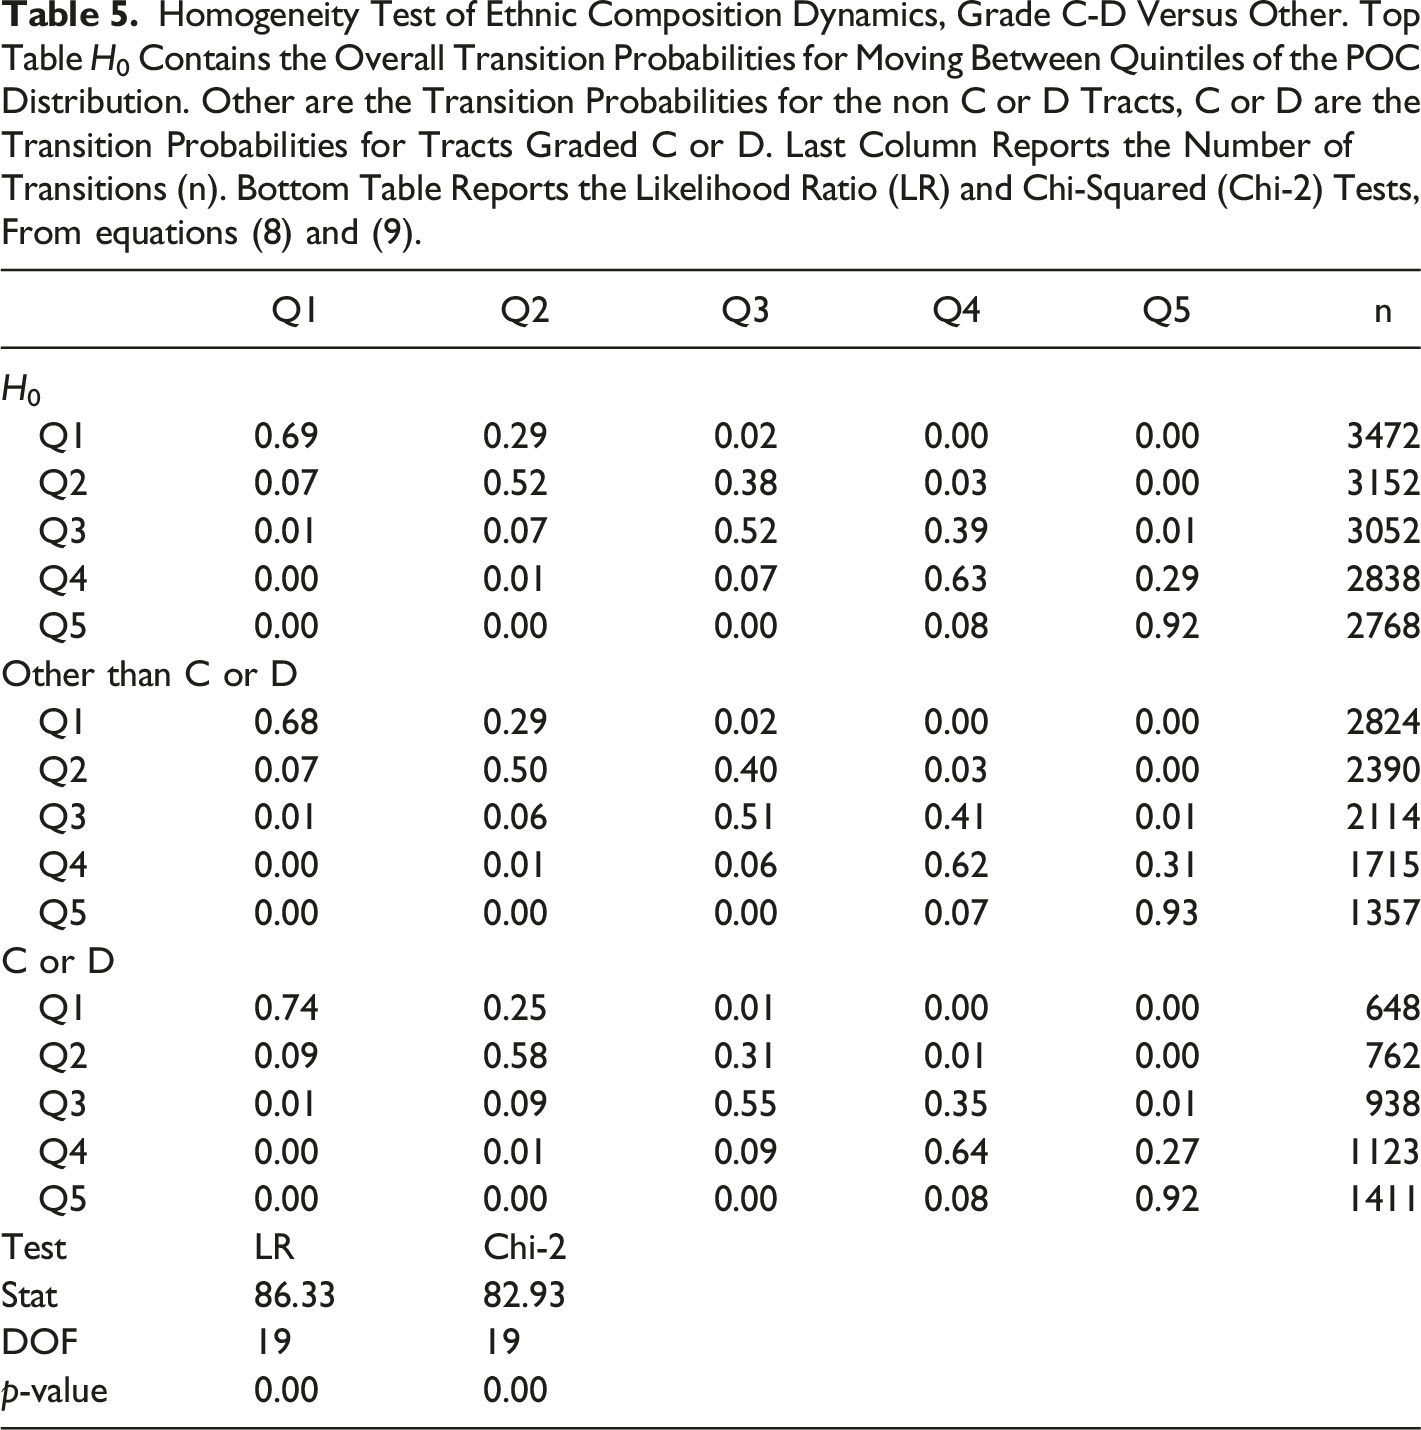
Homogeneity Test of Ethnic Composition Dynamics, Grade C-D Versus Other. Top Table H0 Contains the Overall Transition Probabilities for Moving Between Quintiles of the POC Distribution. Other are the Transition Probabilities for the non C or D Tracts, C or D are the Transition Probabilities for Tracts Graded C or D. Last Column Reports the Number of Transitions (n). Bottom Table Reports the Likelihood Ratio (LR) and Chi-Squared (Chi-2) Tests, From equations (8) and (9).
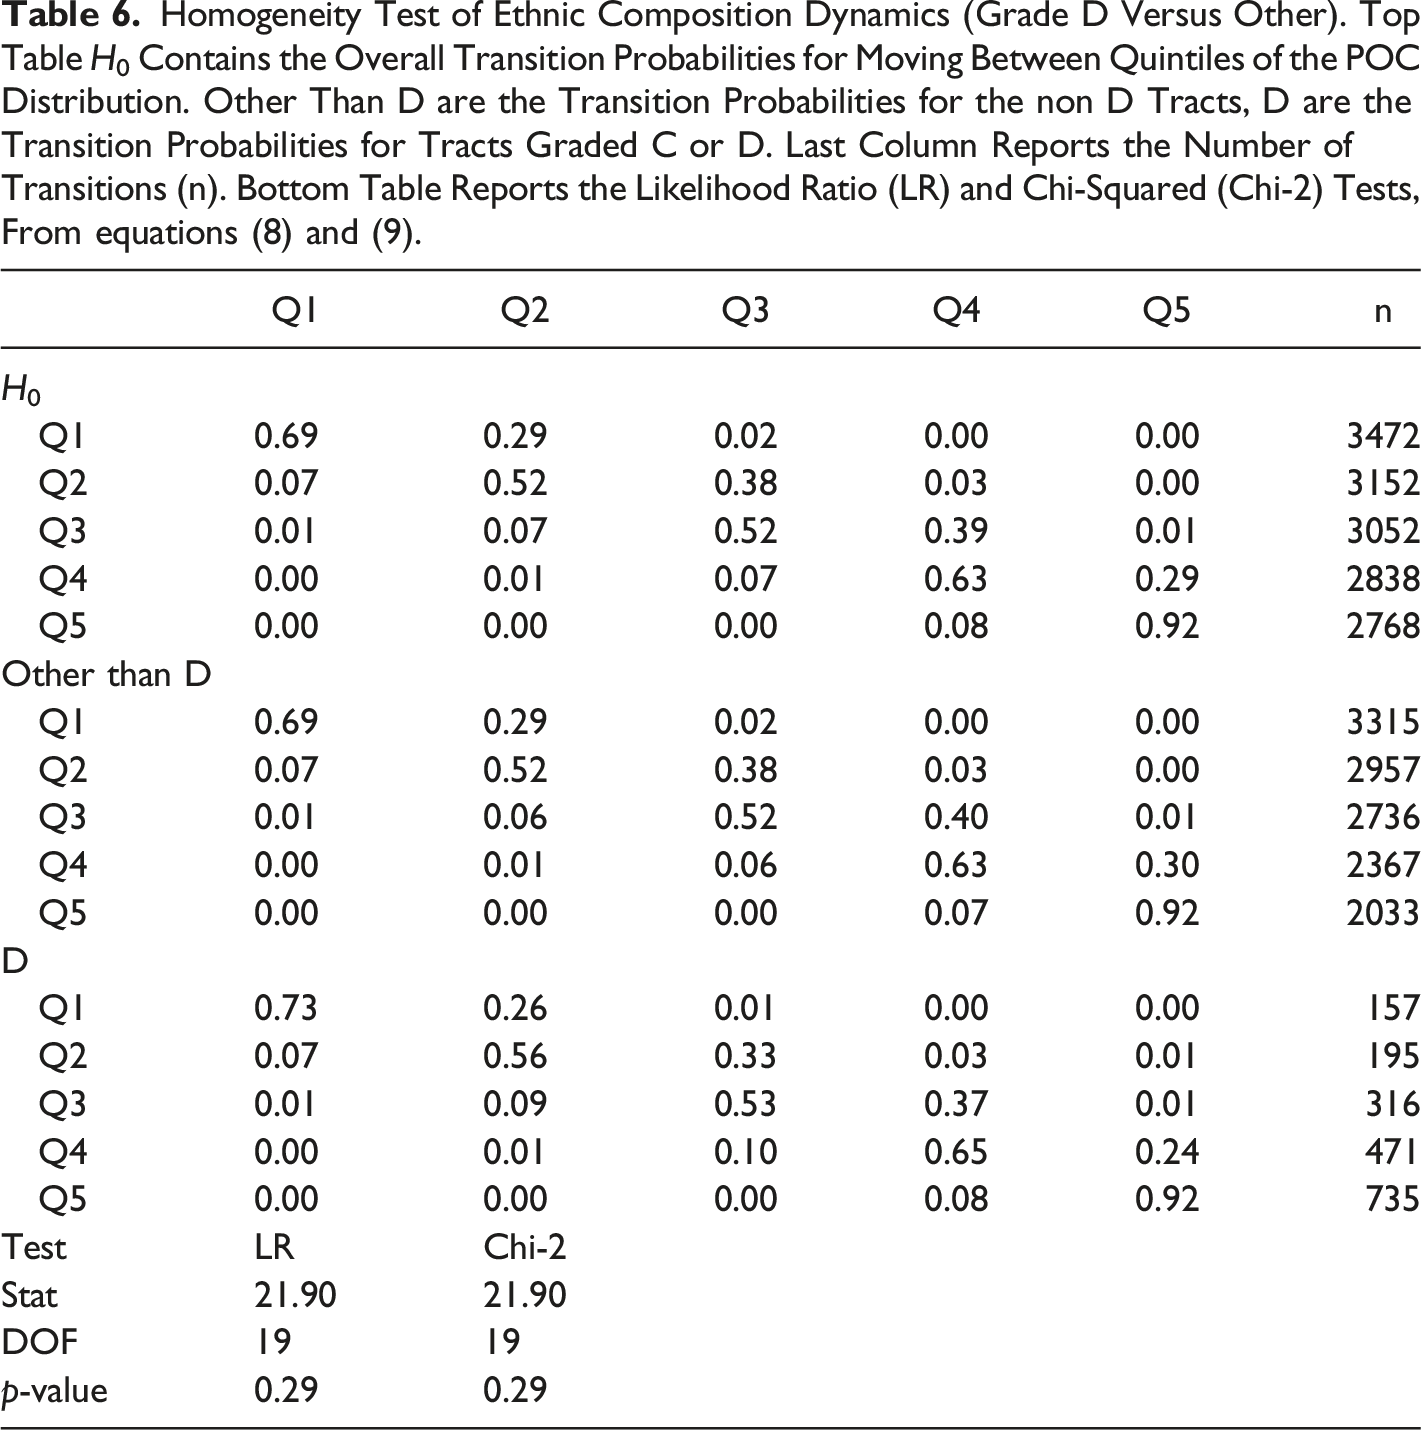
Homogeneity Test of Ethnic Composition Dynamics (Grade D Versus Other). Top Table H0 Contains the Overall Transition Probabilities for Moving Between Quintiles of the POC Distribution. Other Than D are the Transition Probabilities for the non D Tracts, D are the Transition Probabilities for Tracts Graded C or D. Last Column Reports the Number of Transitions (n). Bottom Table Reports the Likelihood Ratio (LR) and Chi-Squared (Chi-2) Tests, From equations (8) and (9).
Intra-urban household income dynamics
The distribution of tract median household income pooled across the cities in Figure 19 is highly right-skewed. This stands in stark contrast to the bimodal ethnic composition distribution seen earlier in Figure 15. Breaking this out by HOLC city in Figure 20 uncovers heterogeneity in this pattern with extreme skewness being seen in San Jose, Los Angeles, and Oakland, and the length of the right tail generally increasing with the median tract income across cities. Pooled home owners’ loan corporation tract median household income 2010. Tract median household income by city 2010.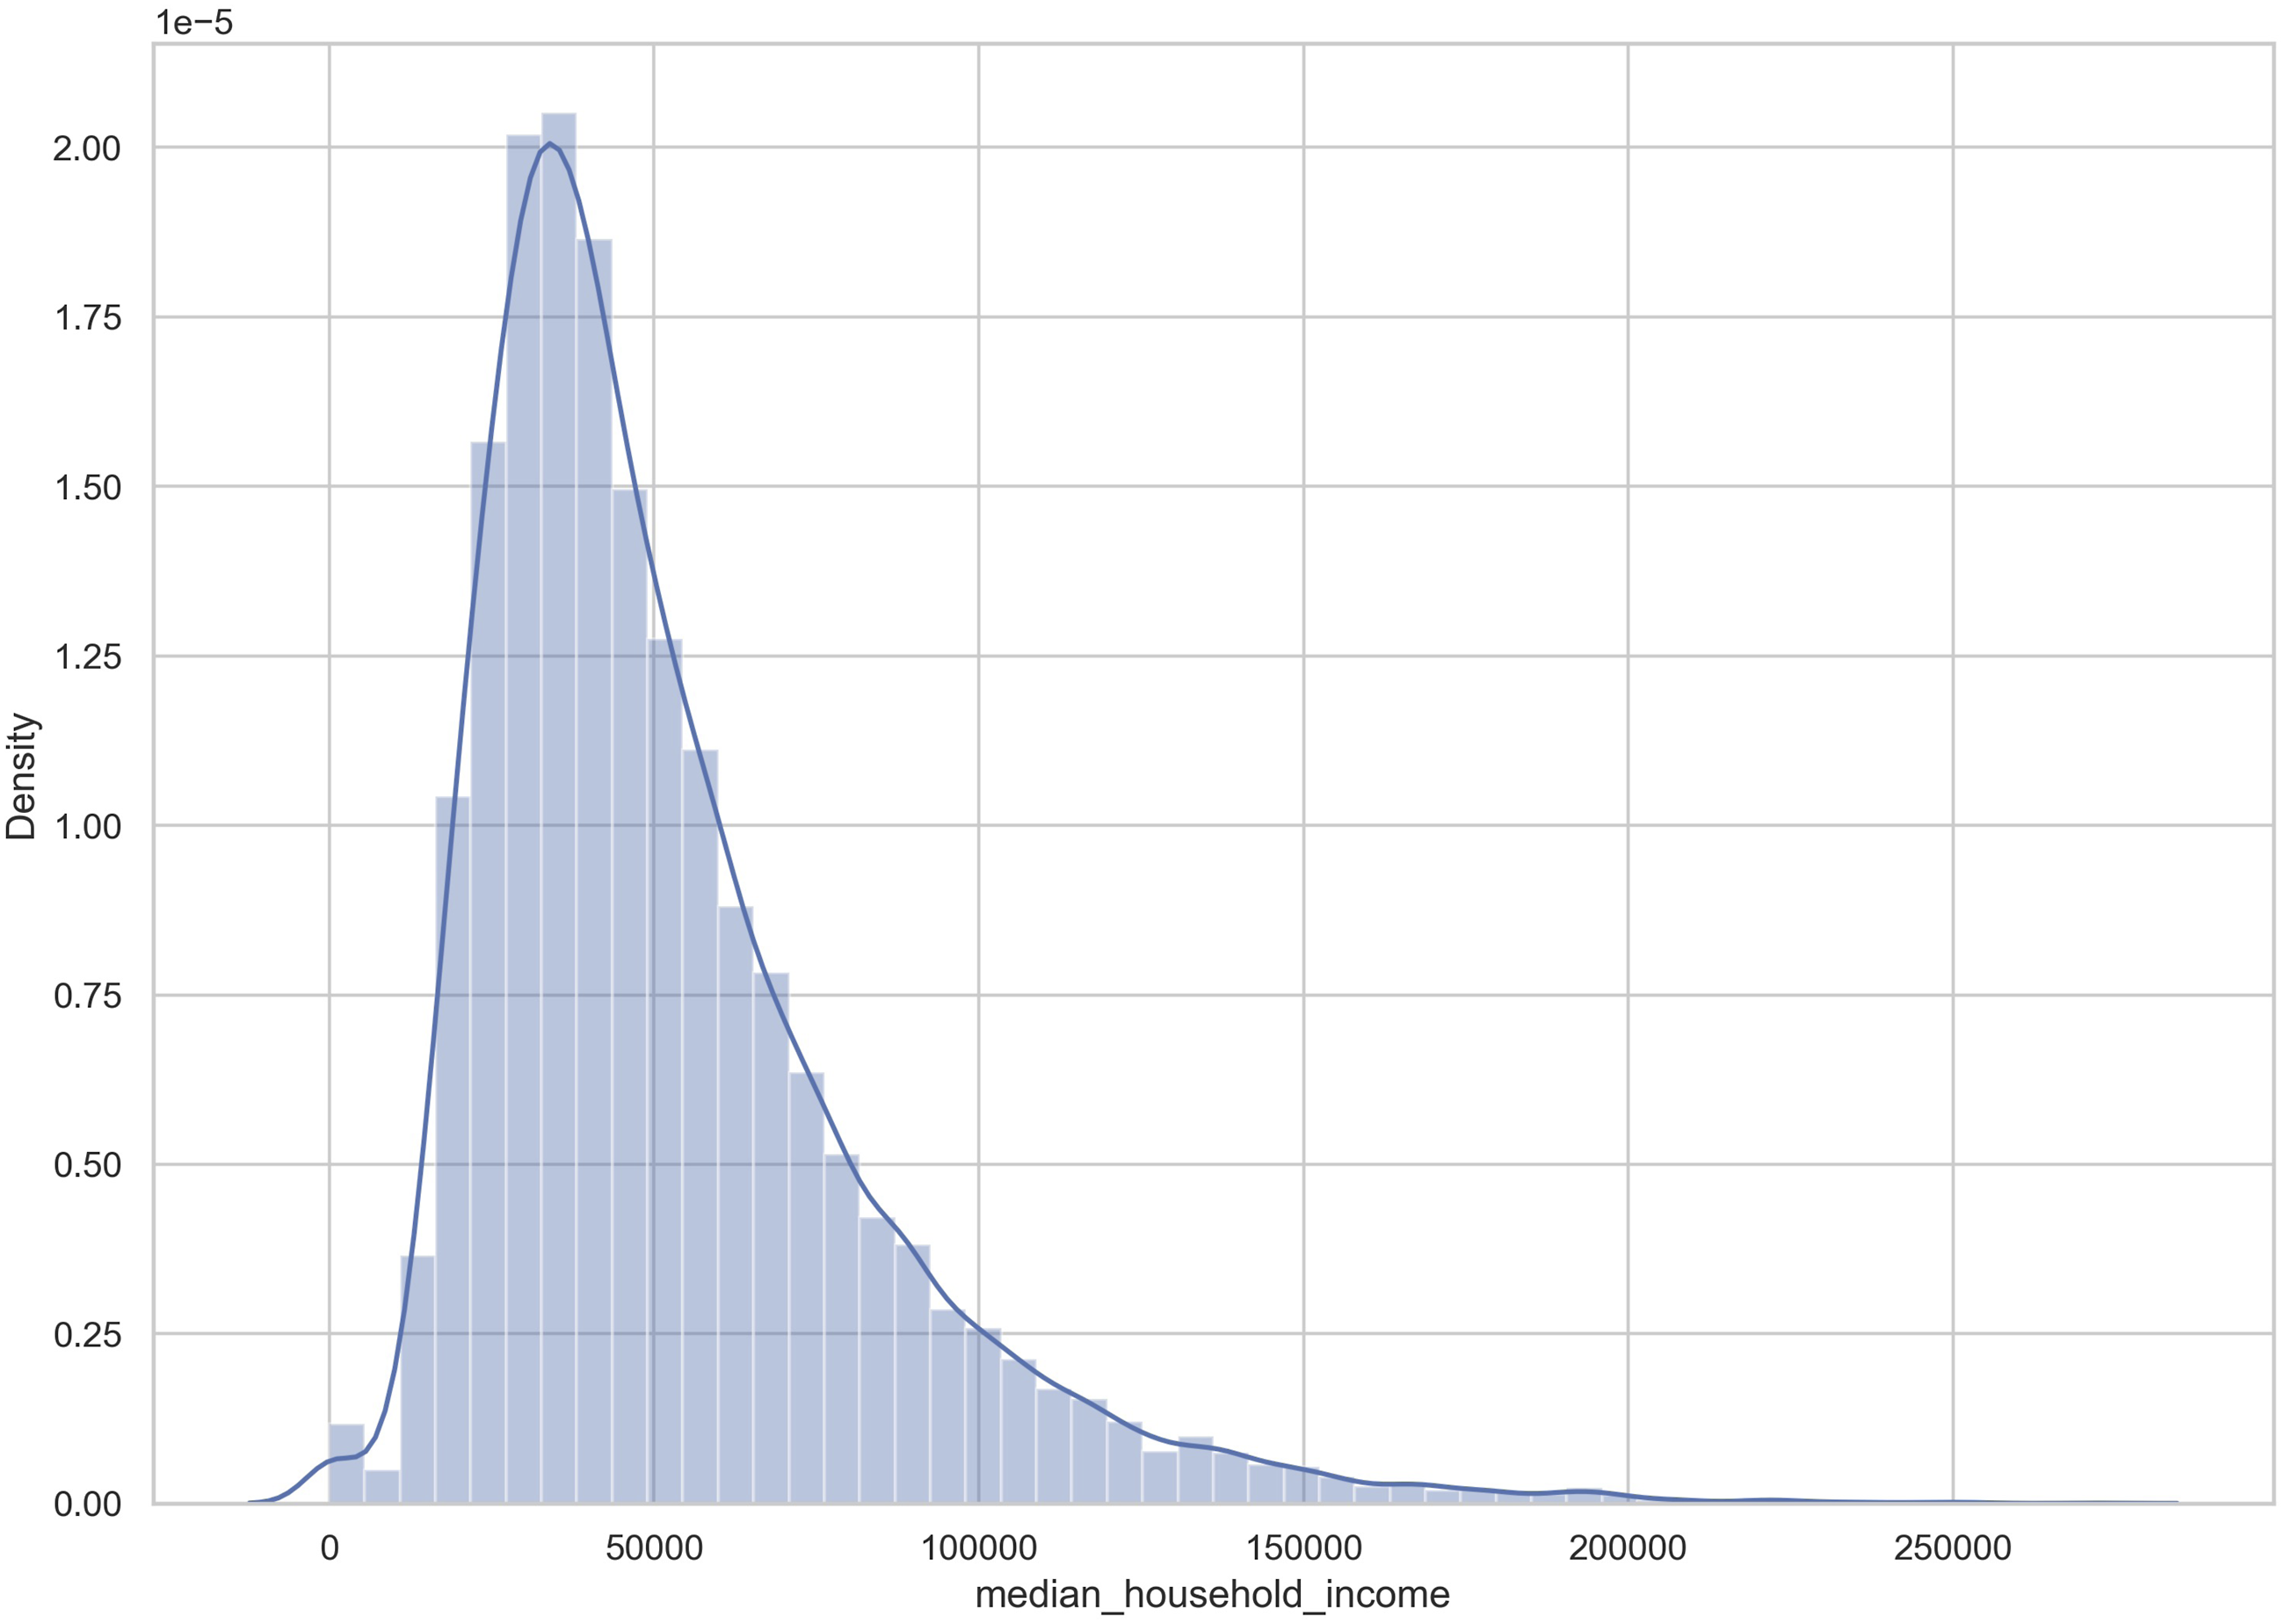
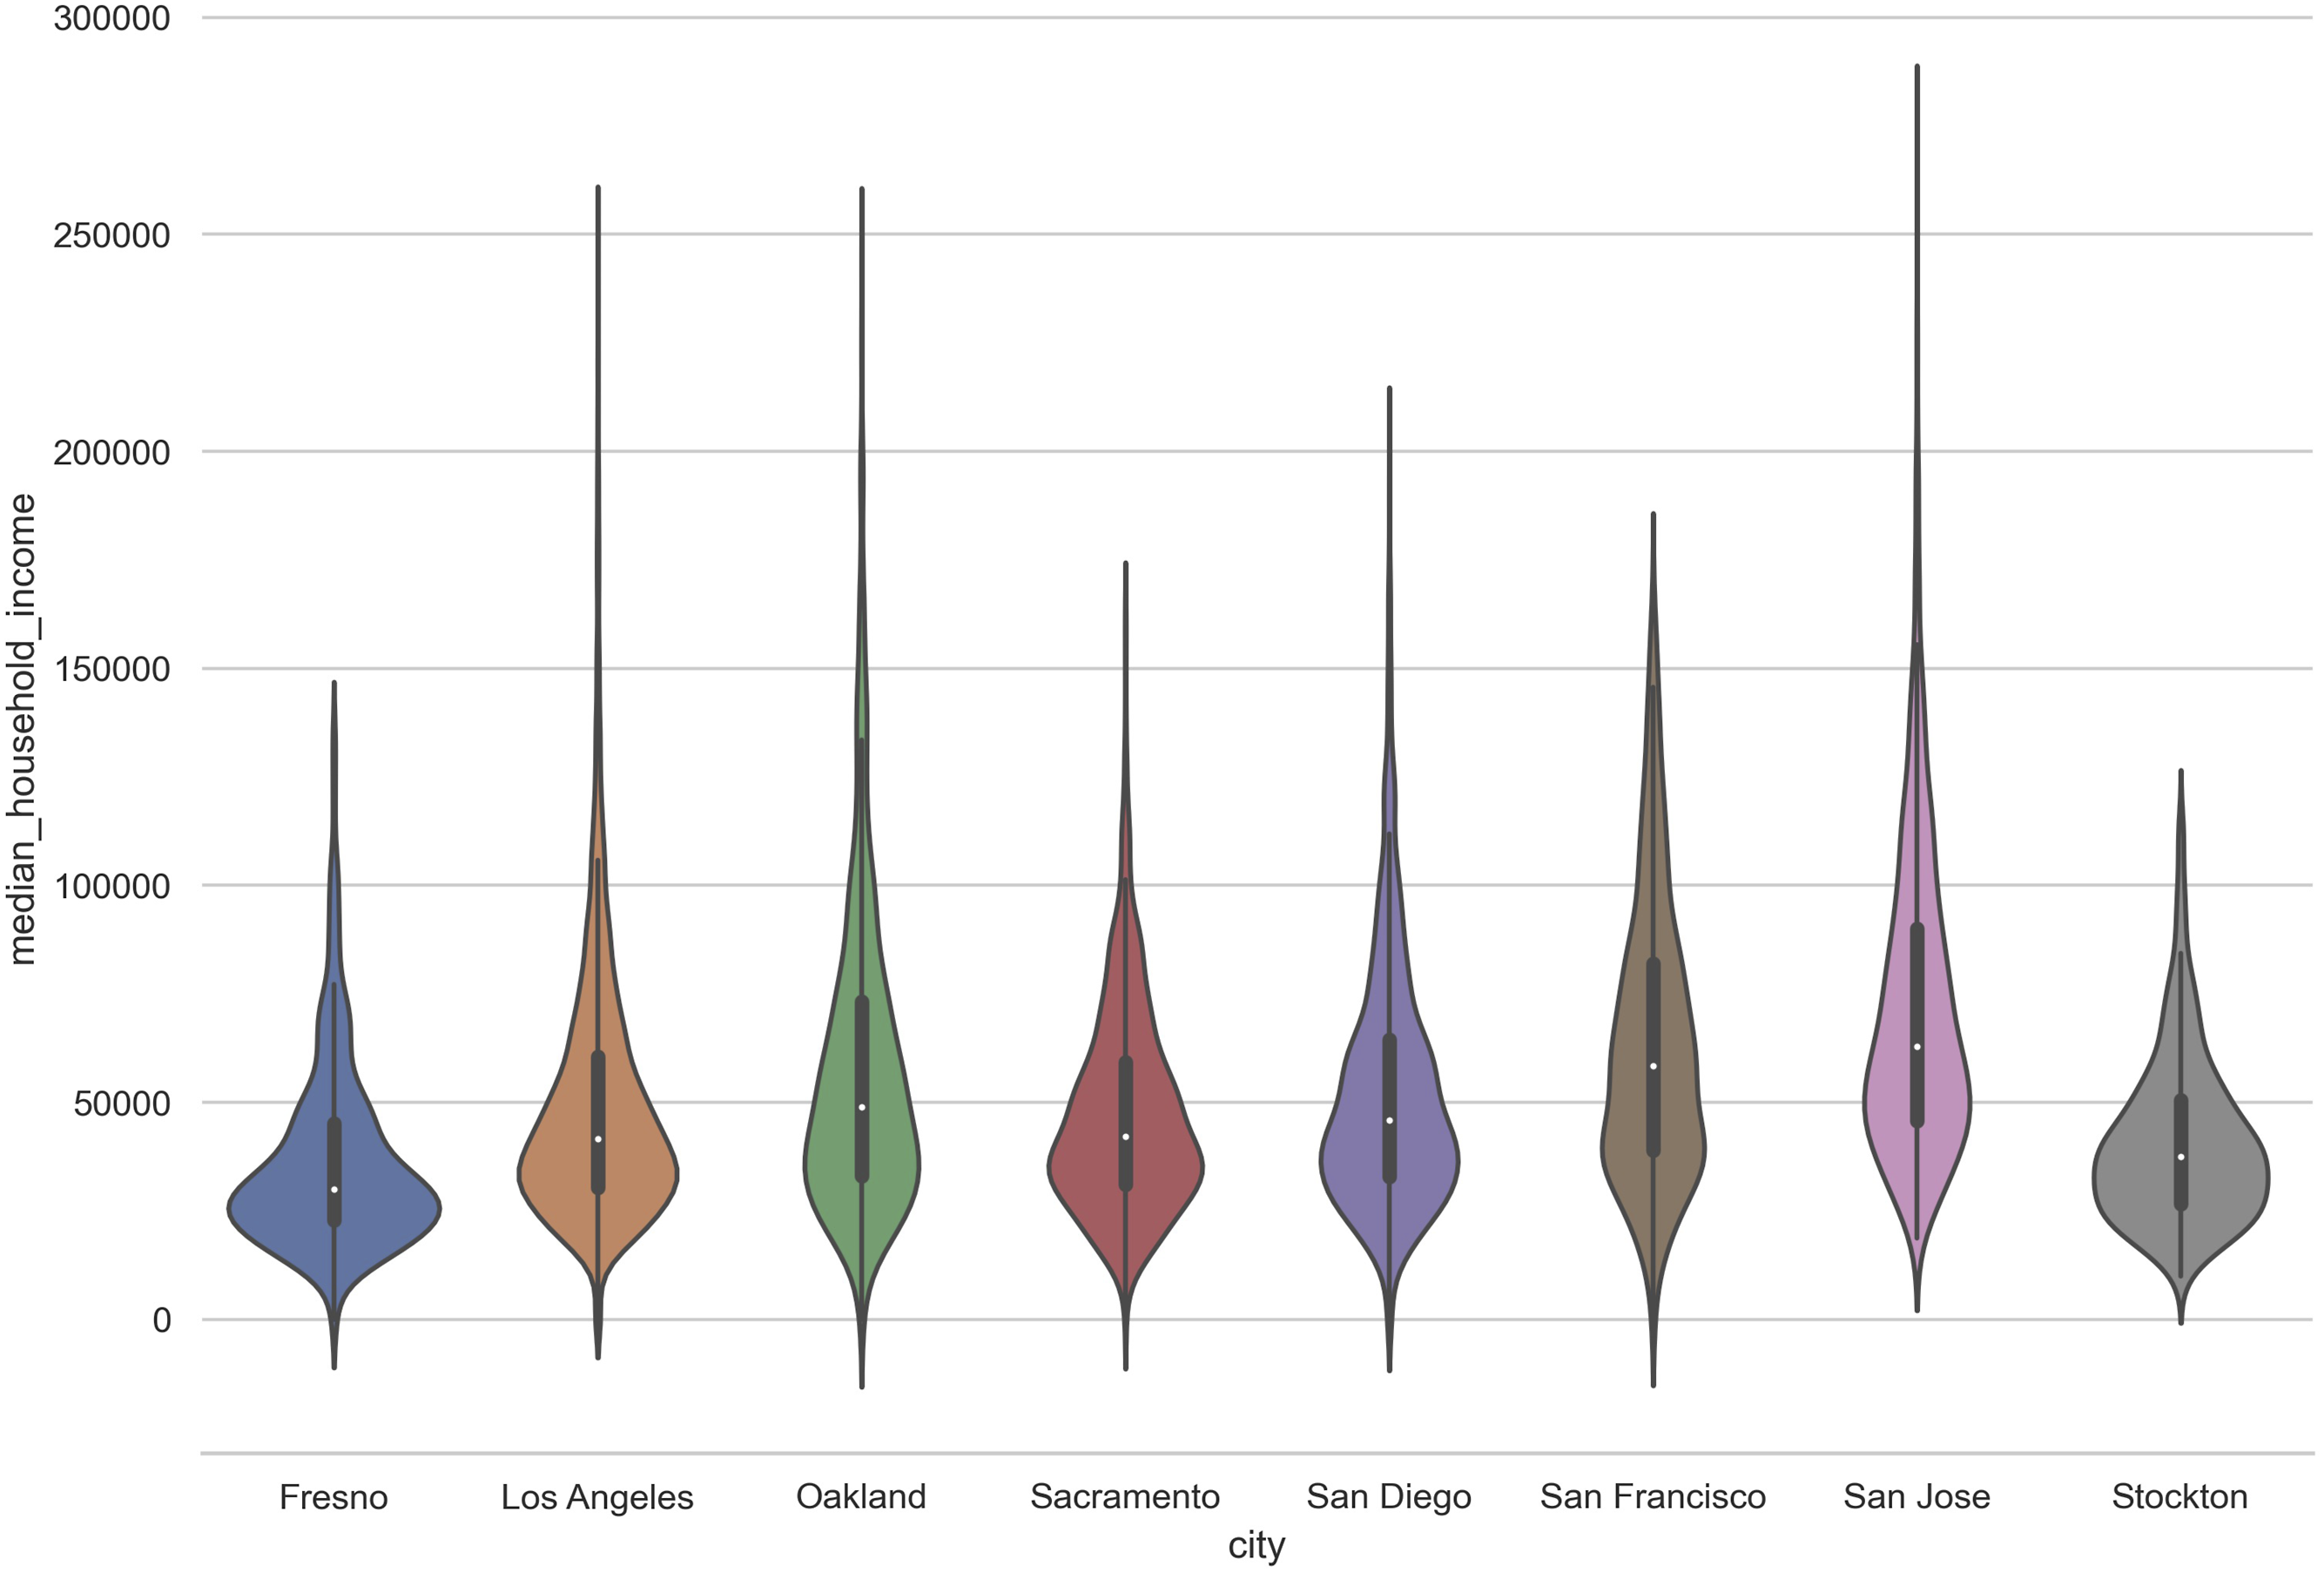
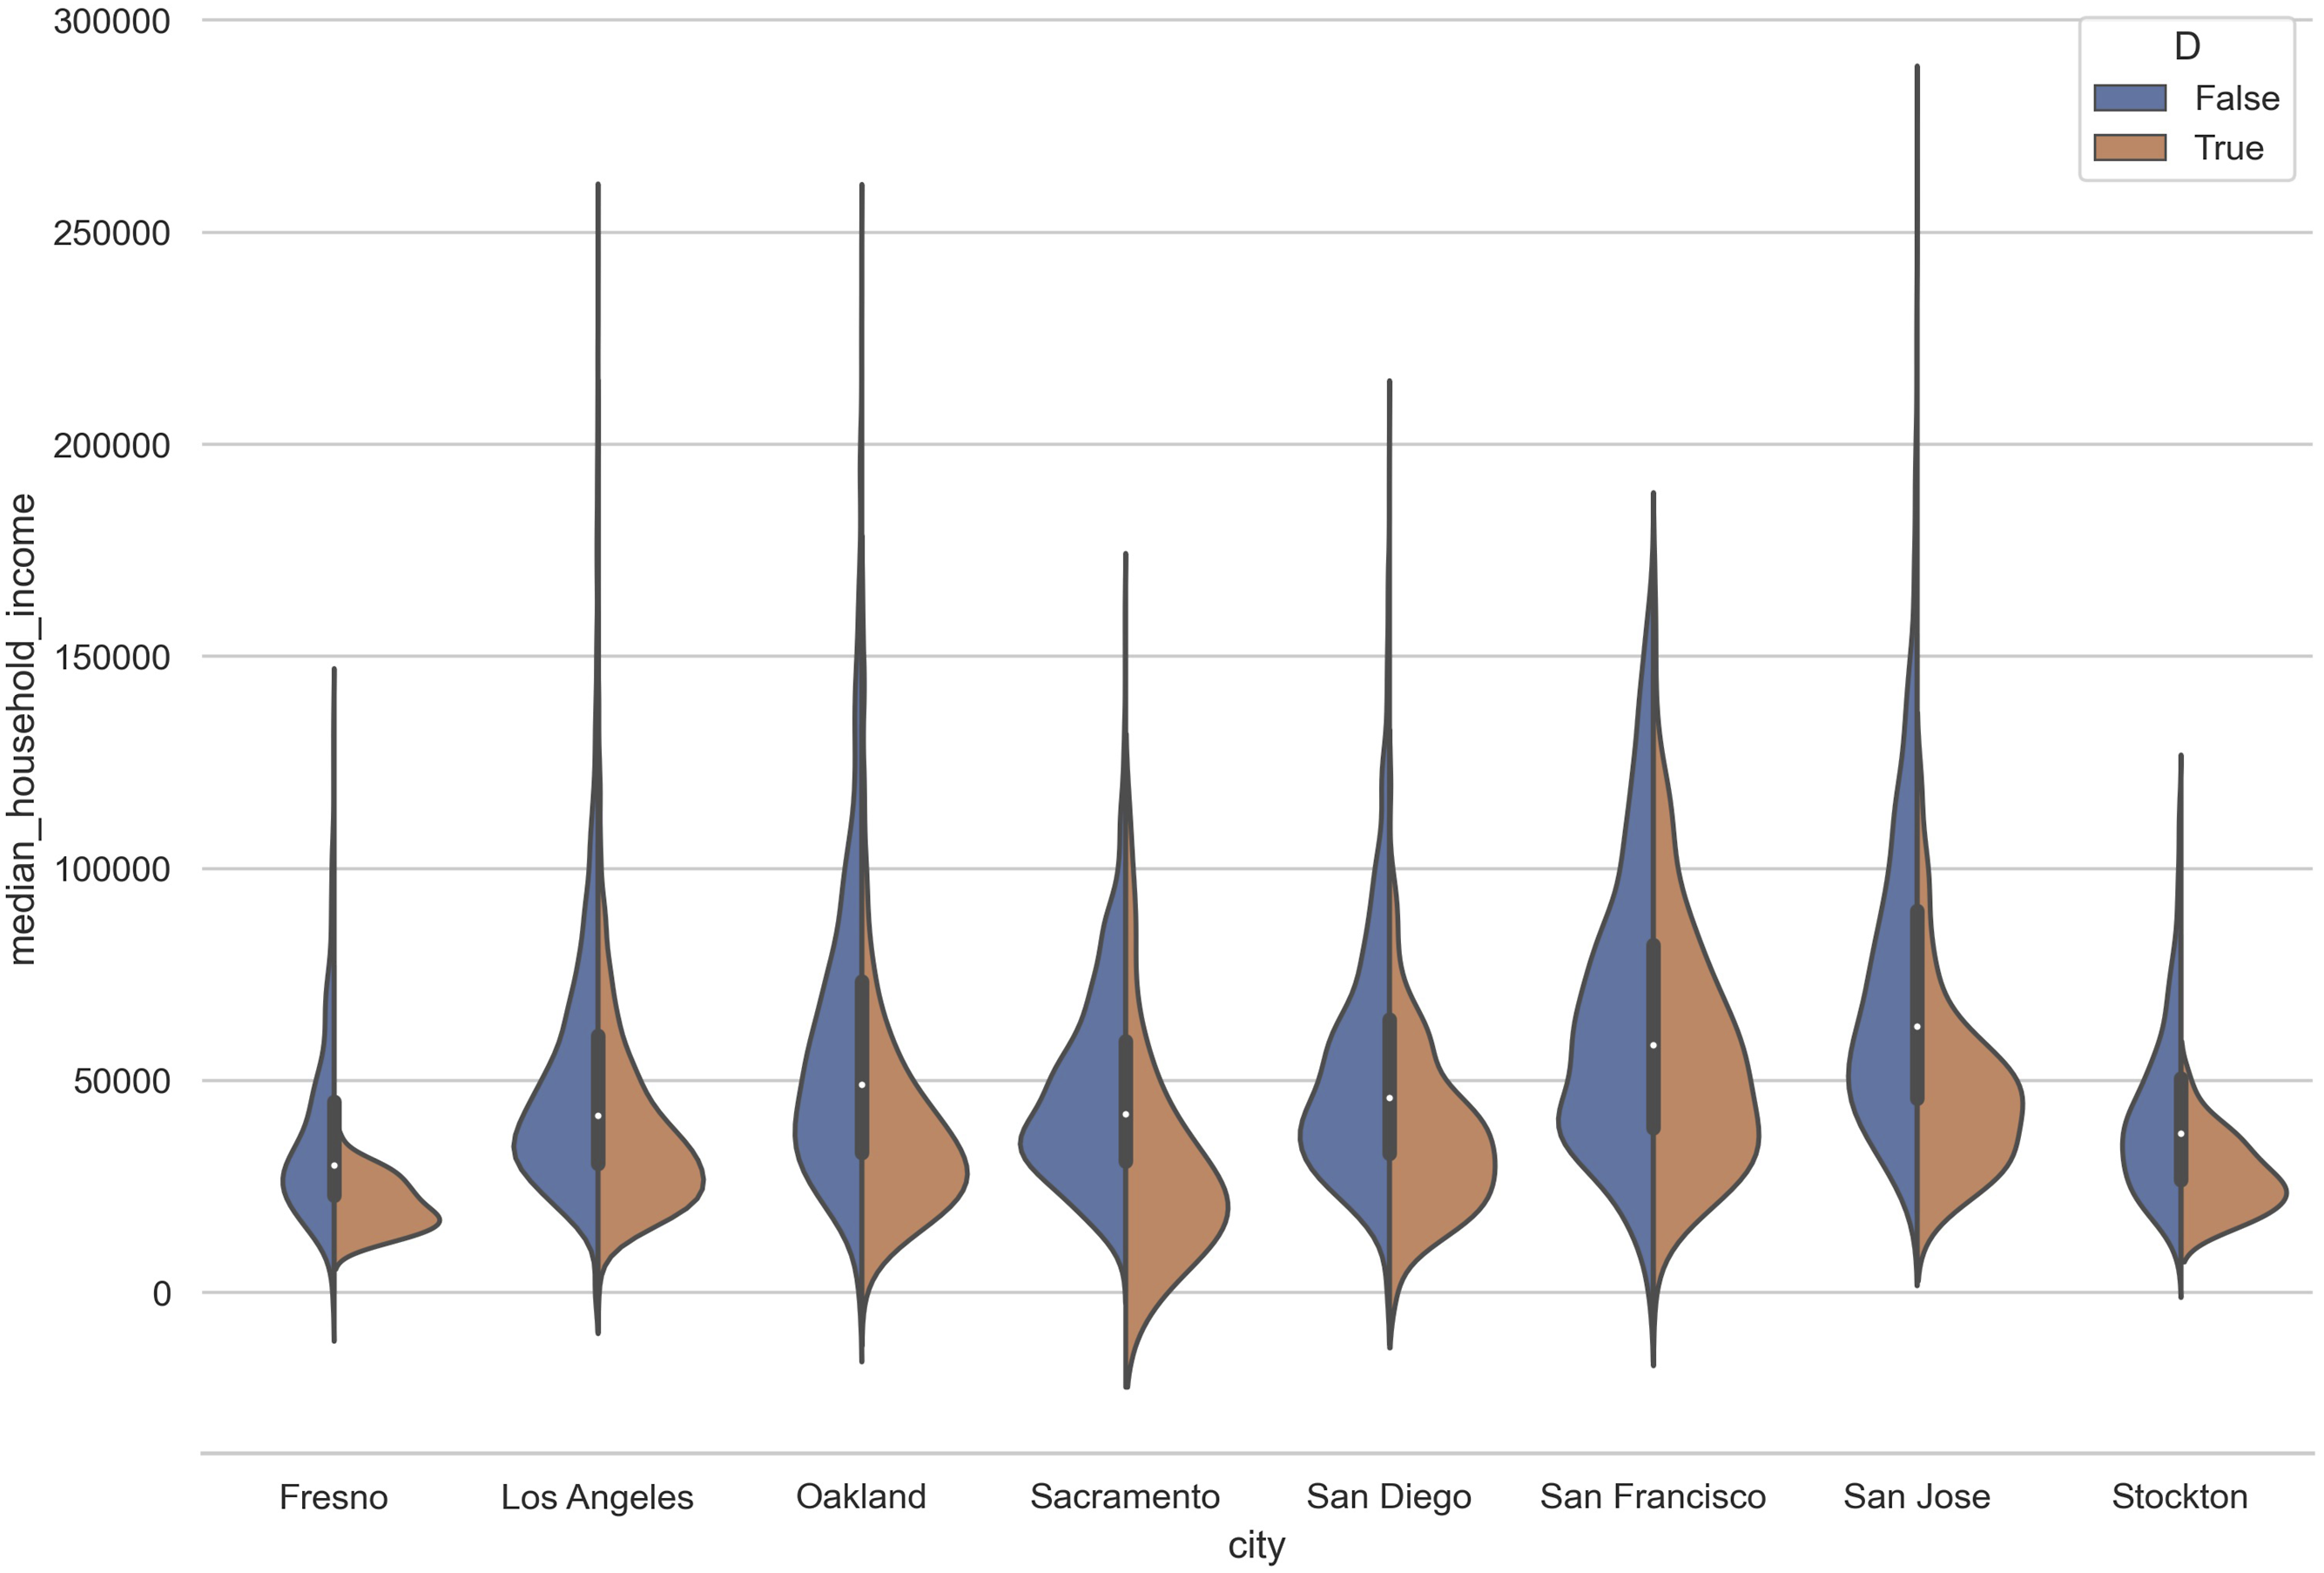
When conditioning the tract income distributions on HOLC grade in Figure 21, there is a clear shift upwards in the means of the distribution as the grades increase from D to A. Along with the shift in location, there is a widening of the distribution as the grade level increases as the mass of the D-graded tract income distributions are concentrated at the lowest median income levels. Figure 22 contrasts the tract income distributions between the D and other graded tracts for each of the cities. A common pattern emerges in the left (downward) shifting of the income distribution for the D-graded tracts across all cities. The right skewness for cities such as San Jose and San Francisco that was evident in Figure 19 can now seen to be due to the tracts that received other than D grades, as that pronounced right skewness is absent from the D-graded tract distributions in all cities. Pooled tract median household income and home owners’ loan corporation grade 2010. City tract median household income and home owners’ loan corporation grade 2010.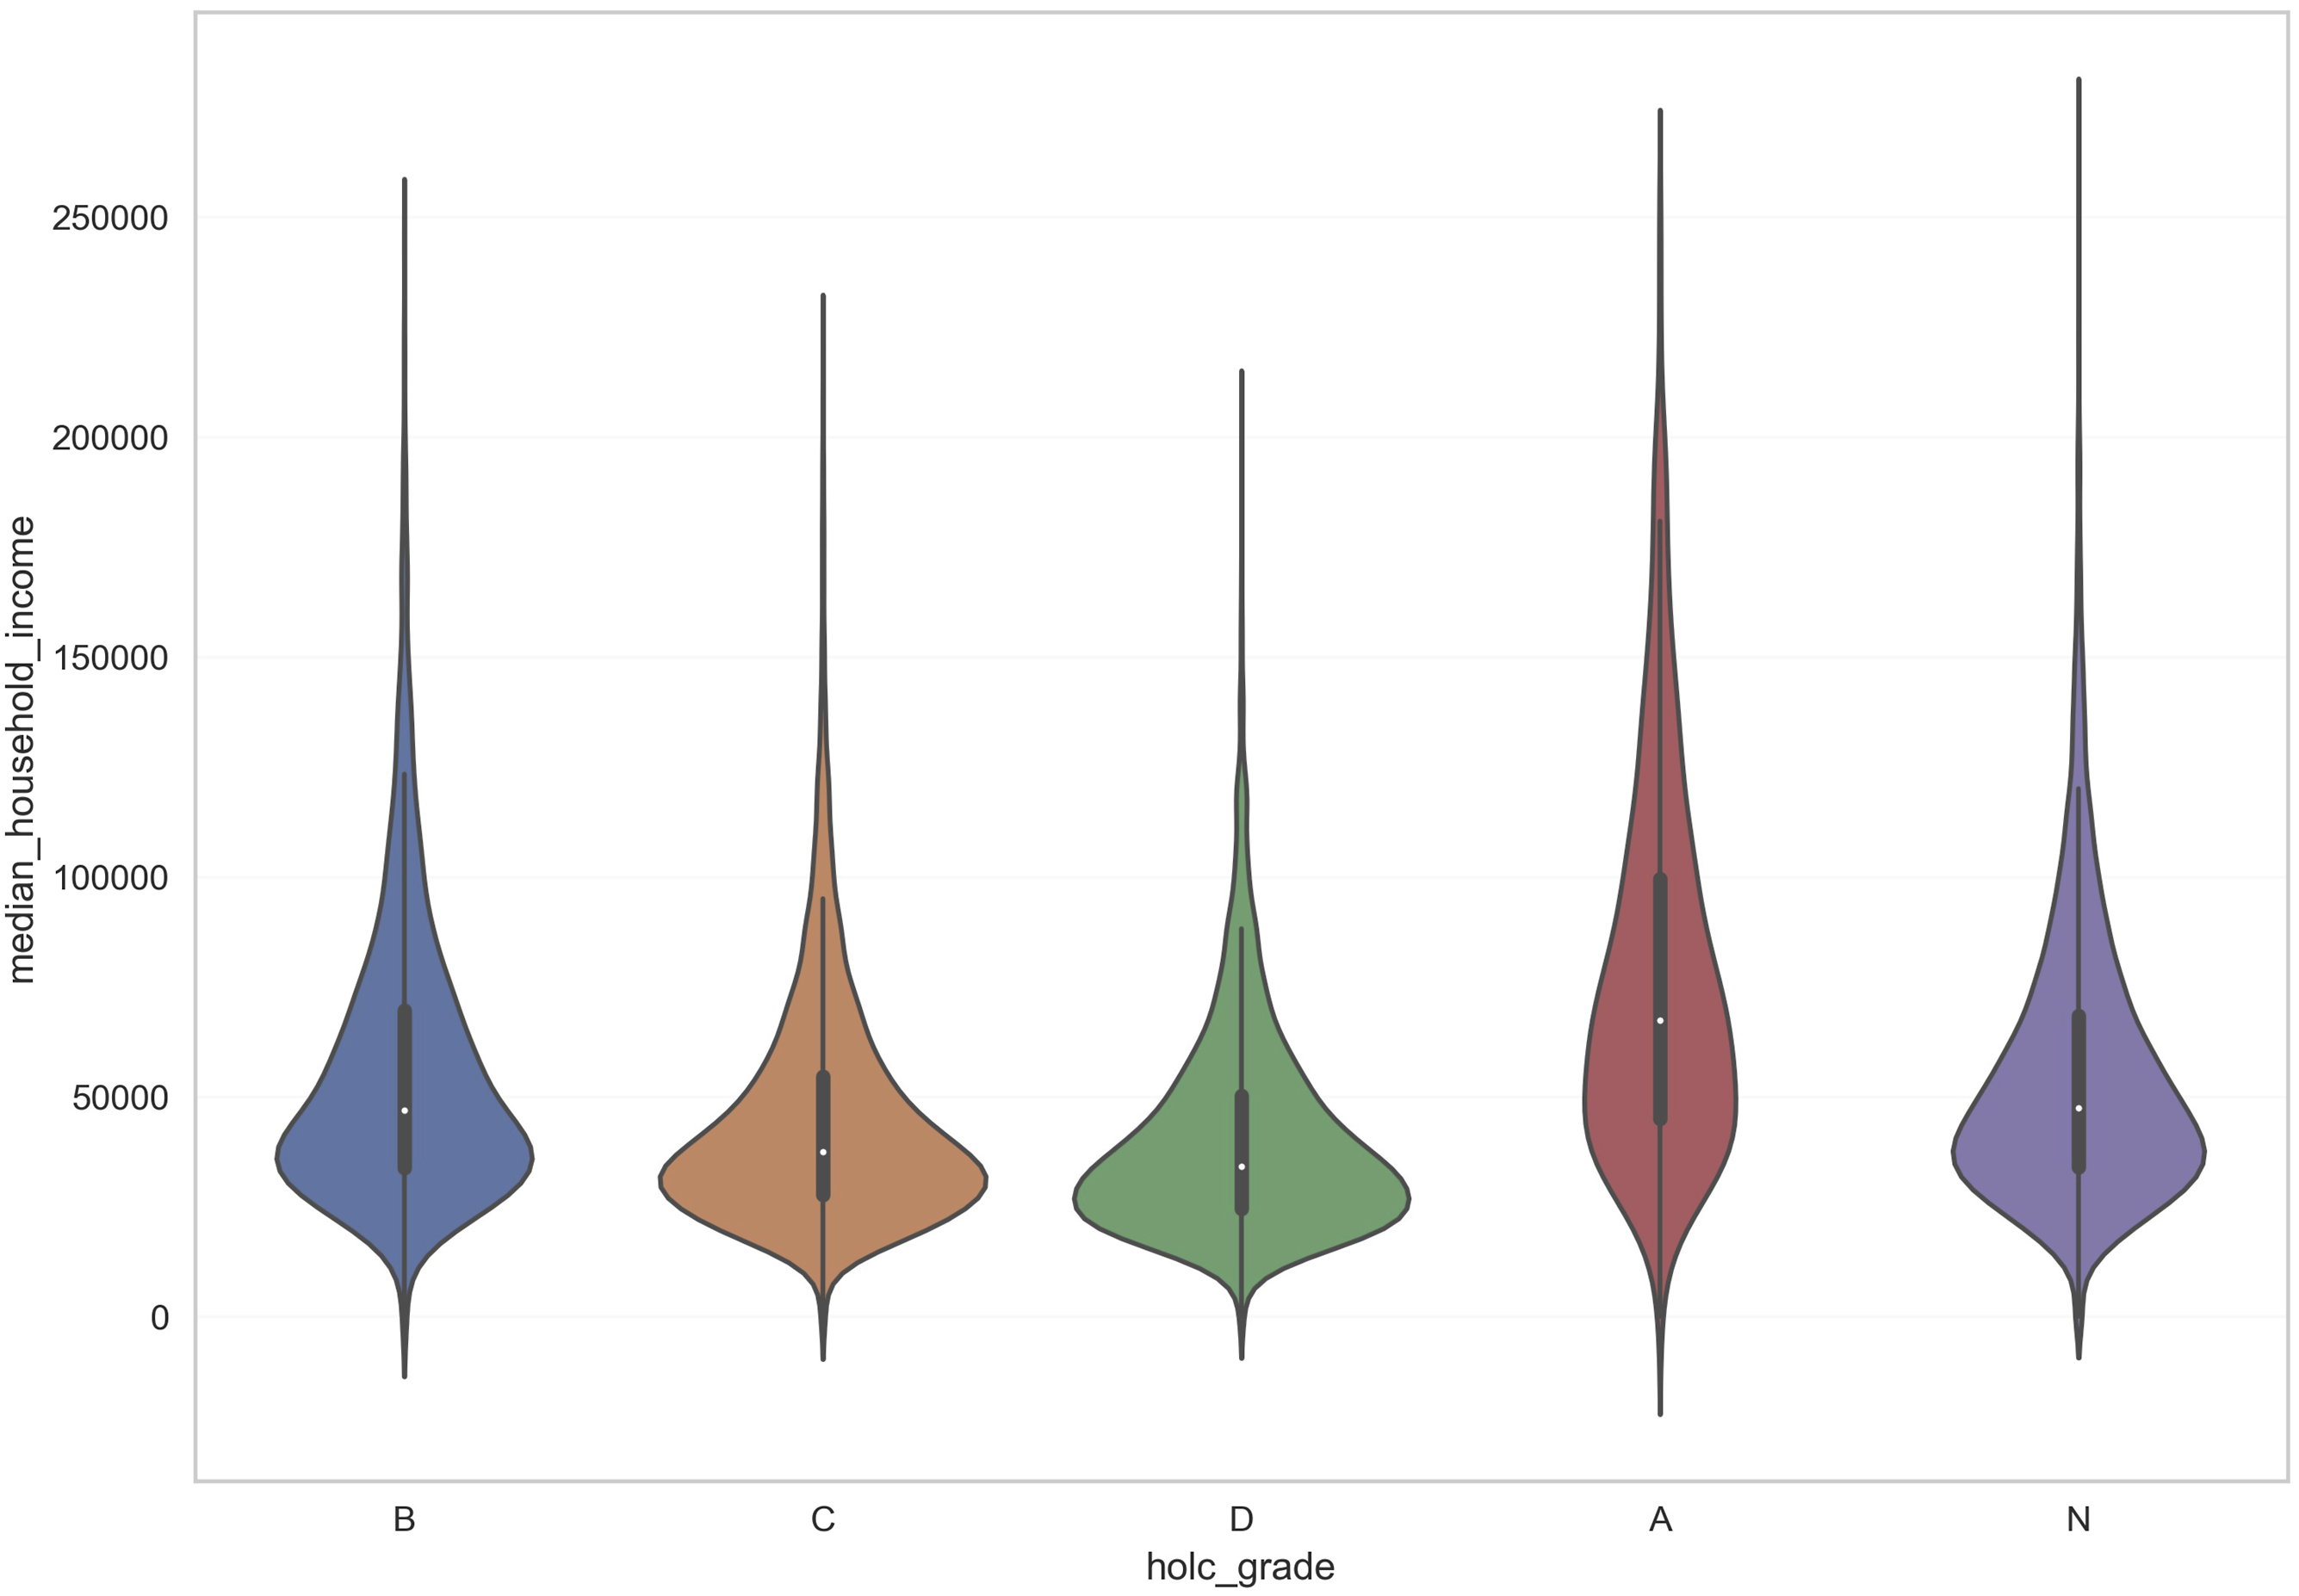
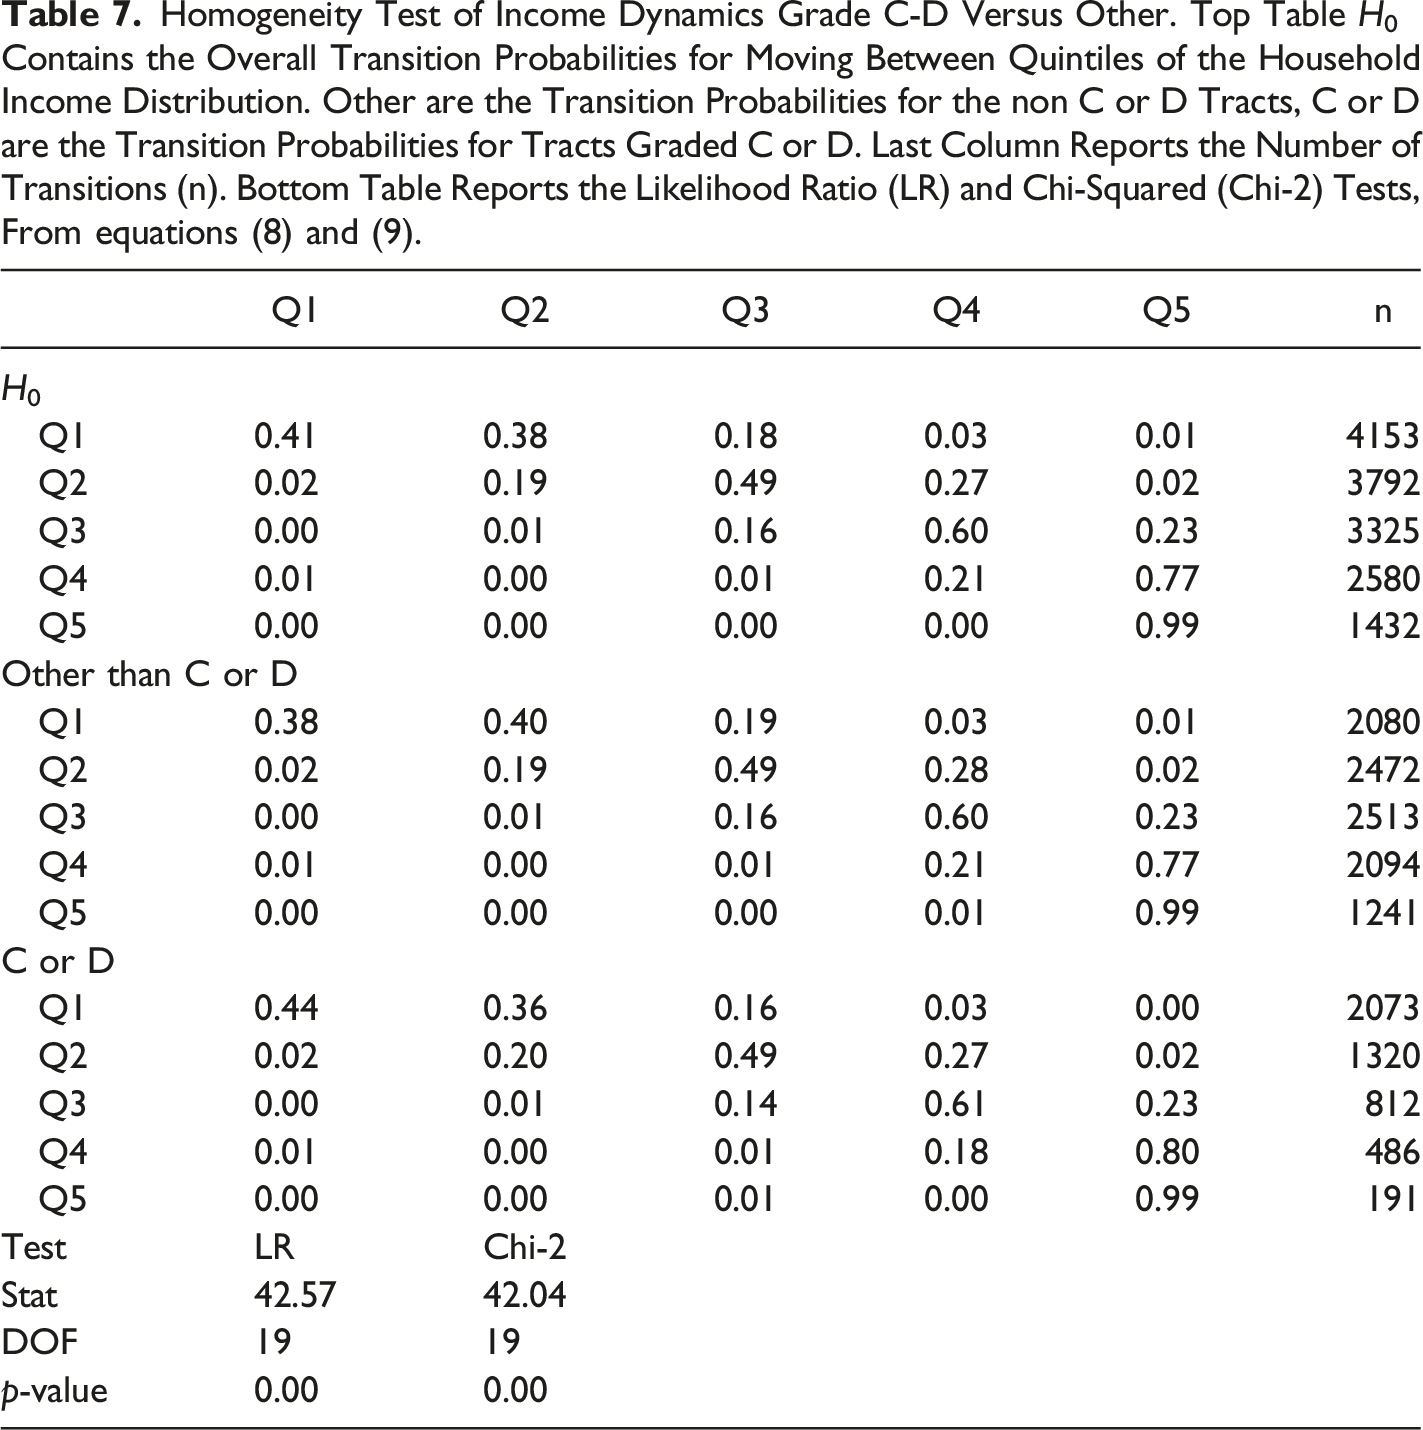
Homogeneity Test of Income Dynamics Grade C-D Versus Other. Top Table H0 Contains the Overall Transition Probabilities for Moving Between Quintiles of the Household Income Distribution. Other are the Transition Probabilities for the non C or D Tracts, C or D are the Transition Probabilities for Tracts Graded C or D. Last Column Reports the Number of Transitions (n). Bottom Table Reports the Likelihood Ratio (LR) and Chi-Squared (Chi-2) Tests, From equations (8) and (9).
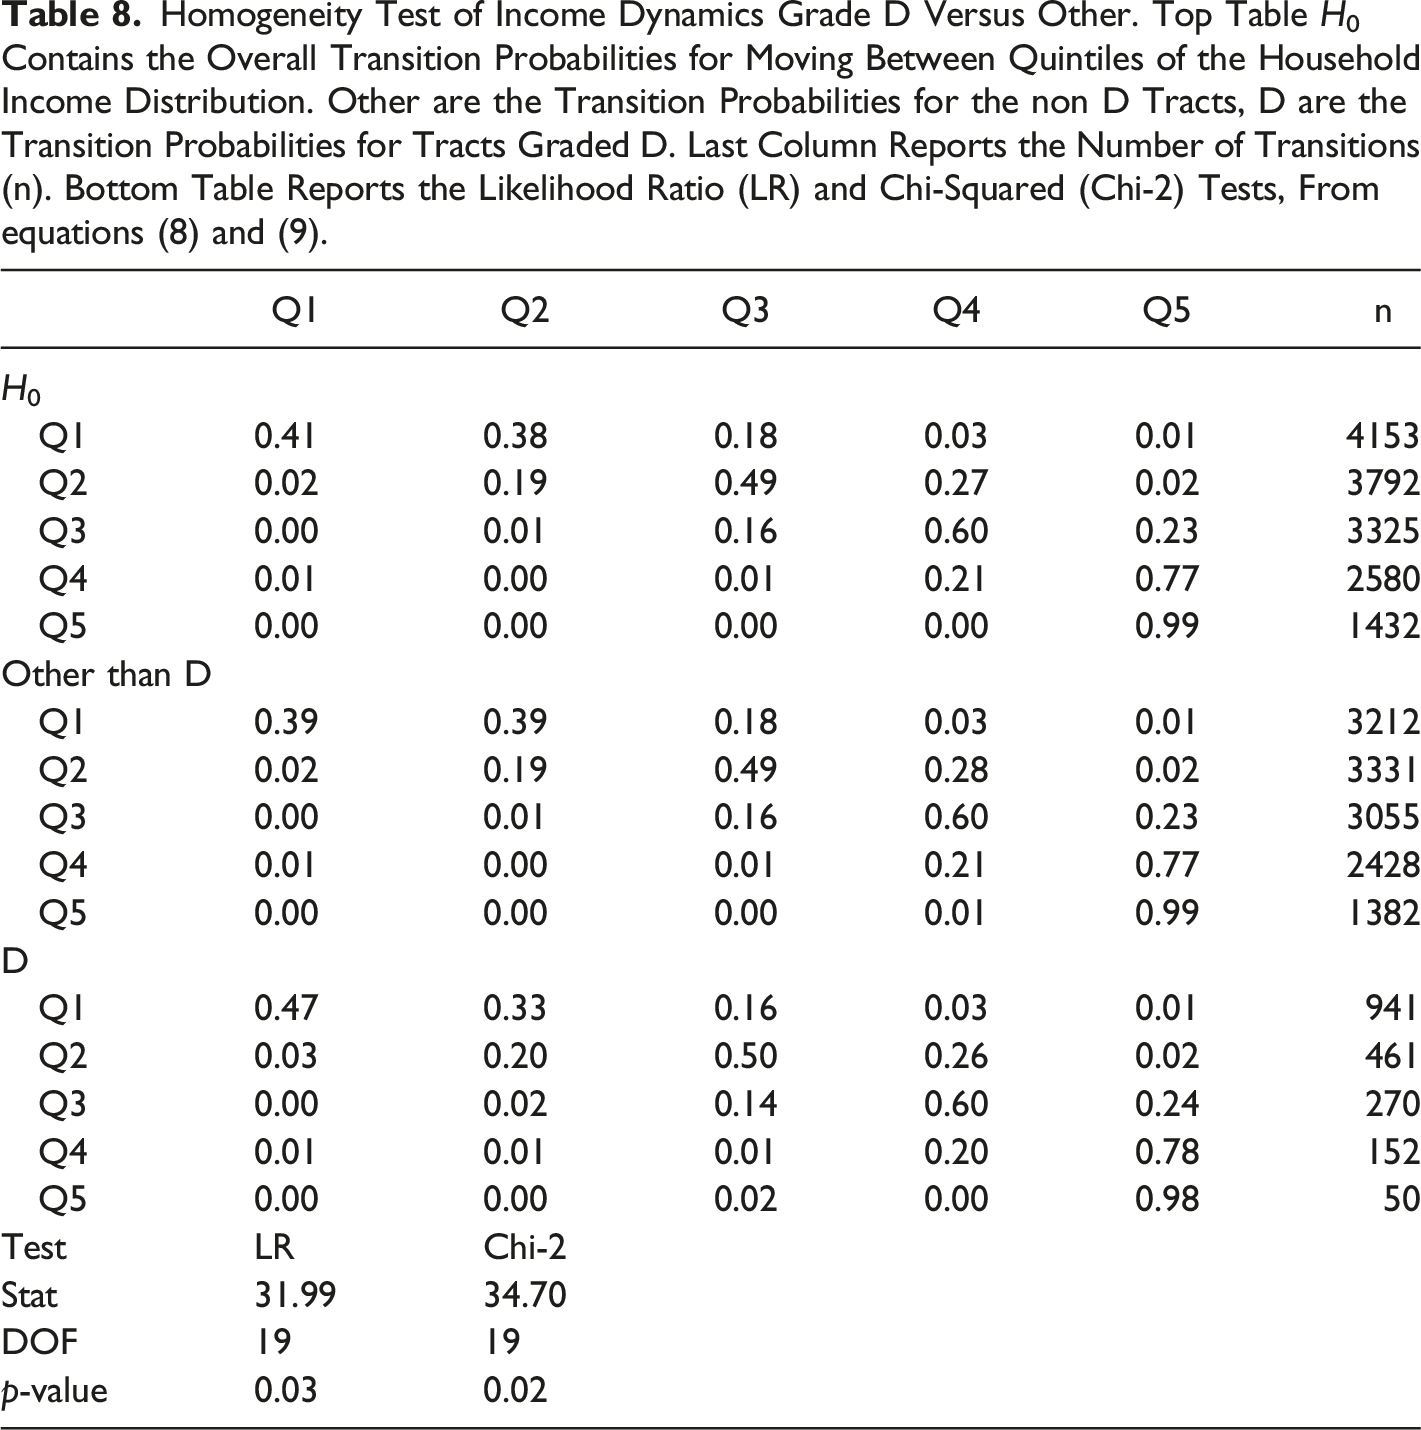
Homogeneity Test of Income Dynamics Grade D Versus Other. Top Table H0 Contains the Overall Transition Probabilities for Moving Between Quintiles of the Household Income Distribution. Other are the Transition Probabilities for the non D Tracts, D are the Transition Probabilities for Tracts Graded D. Last Column Reports the Number of Transitions (n). Bottom Table Reports the Likelihood Ratio (LR) and Chi-Squared (Chi-2) Tests, From equations (8) and (9).
Spatial spillovers
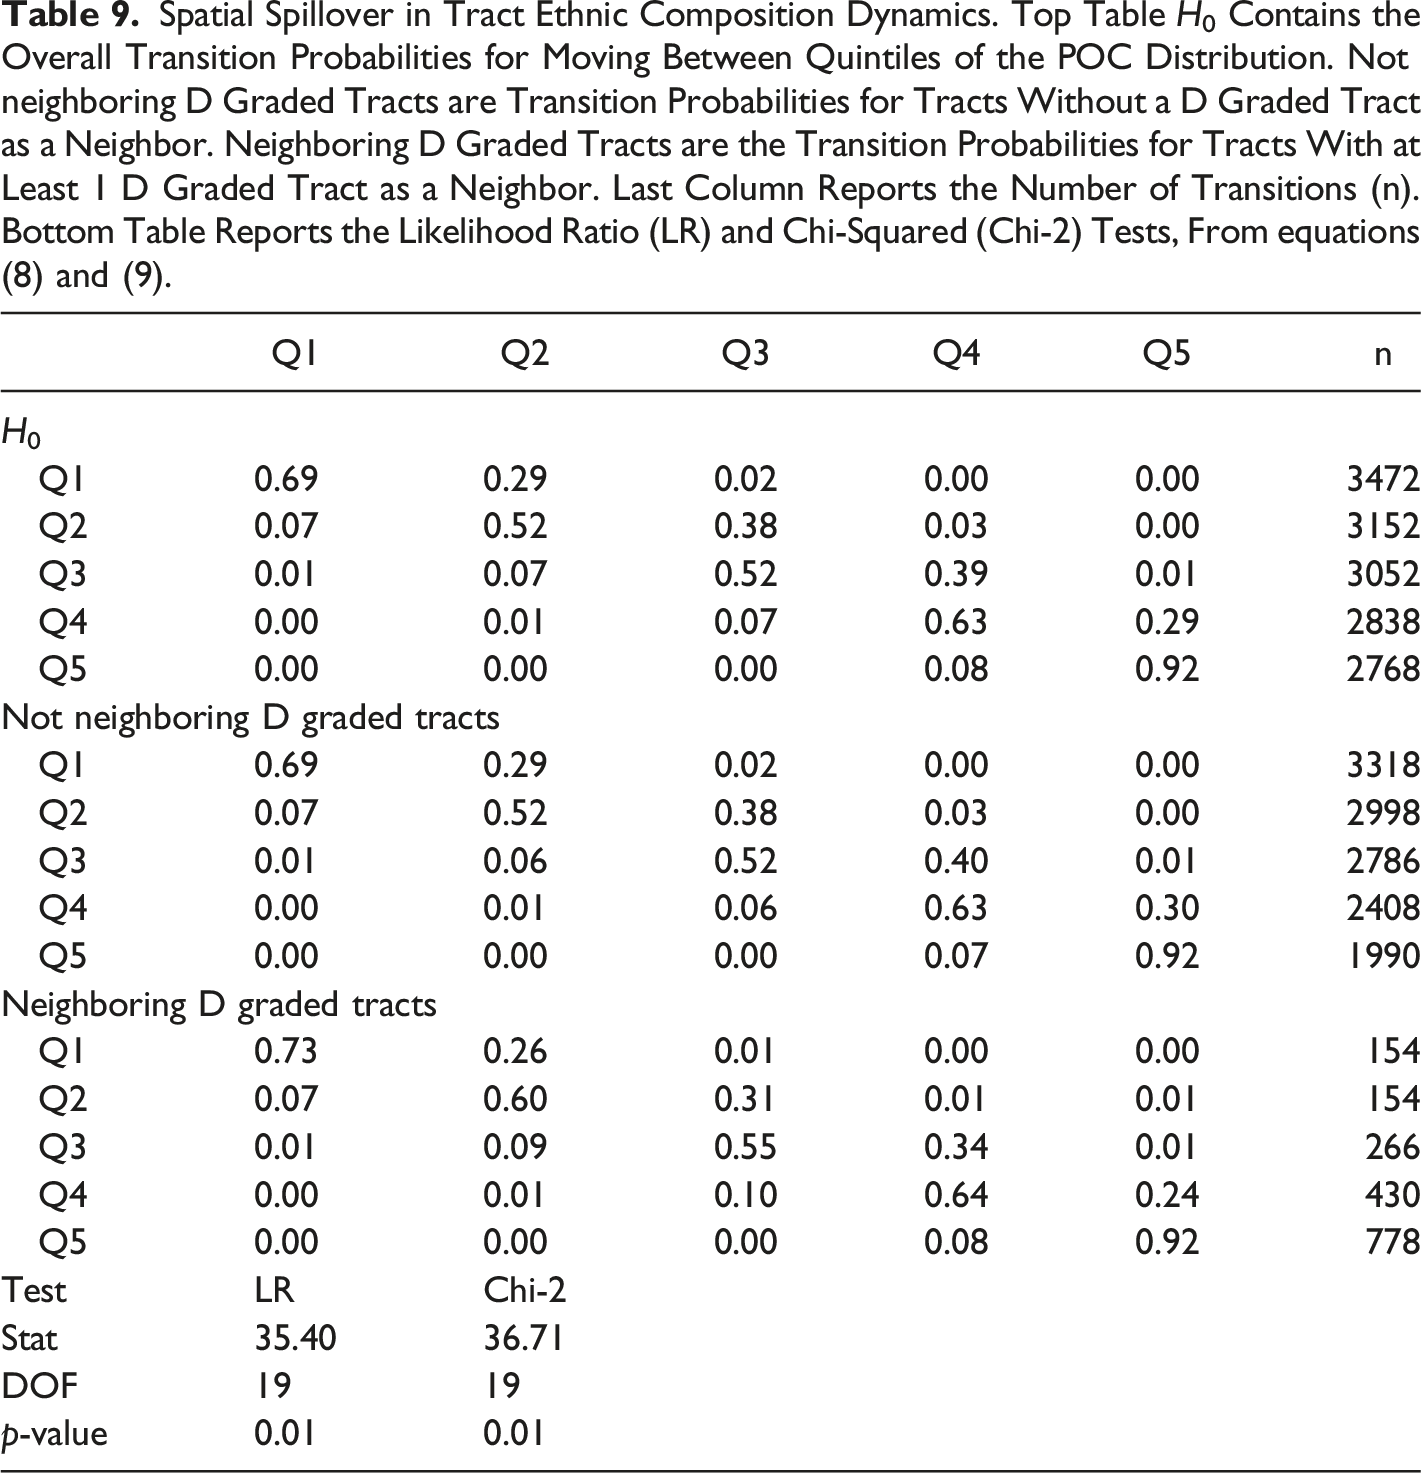
Spatial Spillover in Tract Ethnic Composition Dynamics. Top Table H0 Contains the Overall Transition Probabilities for Moving Between Quintiles of the POC Distribution. Not neighboring D Graded Tracts are Transition Probabilities for Tracts Without a D Graded Tract as a Neighbor. Neighboring D Graded Tracts are the Transition Probabilities for Tracts With at Least 1 D Graded Tract as a Neighbor. Last Column Reports the Number of Transitions (n). Bottom Table Reports the Likelihood Ratio (LR) and Chi-Squared (Chi-2) Tests, From equations (8) and (9).
Spatial Spillover in Tract Income Dynamics. Top Table H0 Contains the Overall Transition Probabilities for Moving Between Quintiles of the Household Income Distribution. Not neighboring D Graded Tracts are Transition Probabilities for Tracts Without a D Graded Tract as a Neighbor. Neighboring D Graded Tracts are the Transition Probabilities for Tracts With at Least 1 D Graded Tract as a Neighbor. Last Column Reports the Number of Transitions (n). Bottom Table Reports the Likelihood Ratio (LR) and Chi-Squared (Chi-2) Tests, From equations (8) and (9).
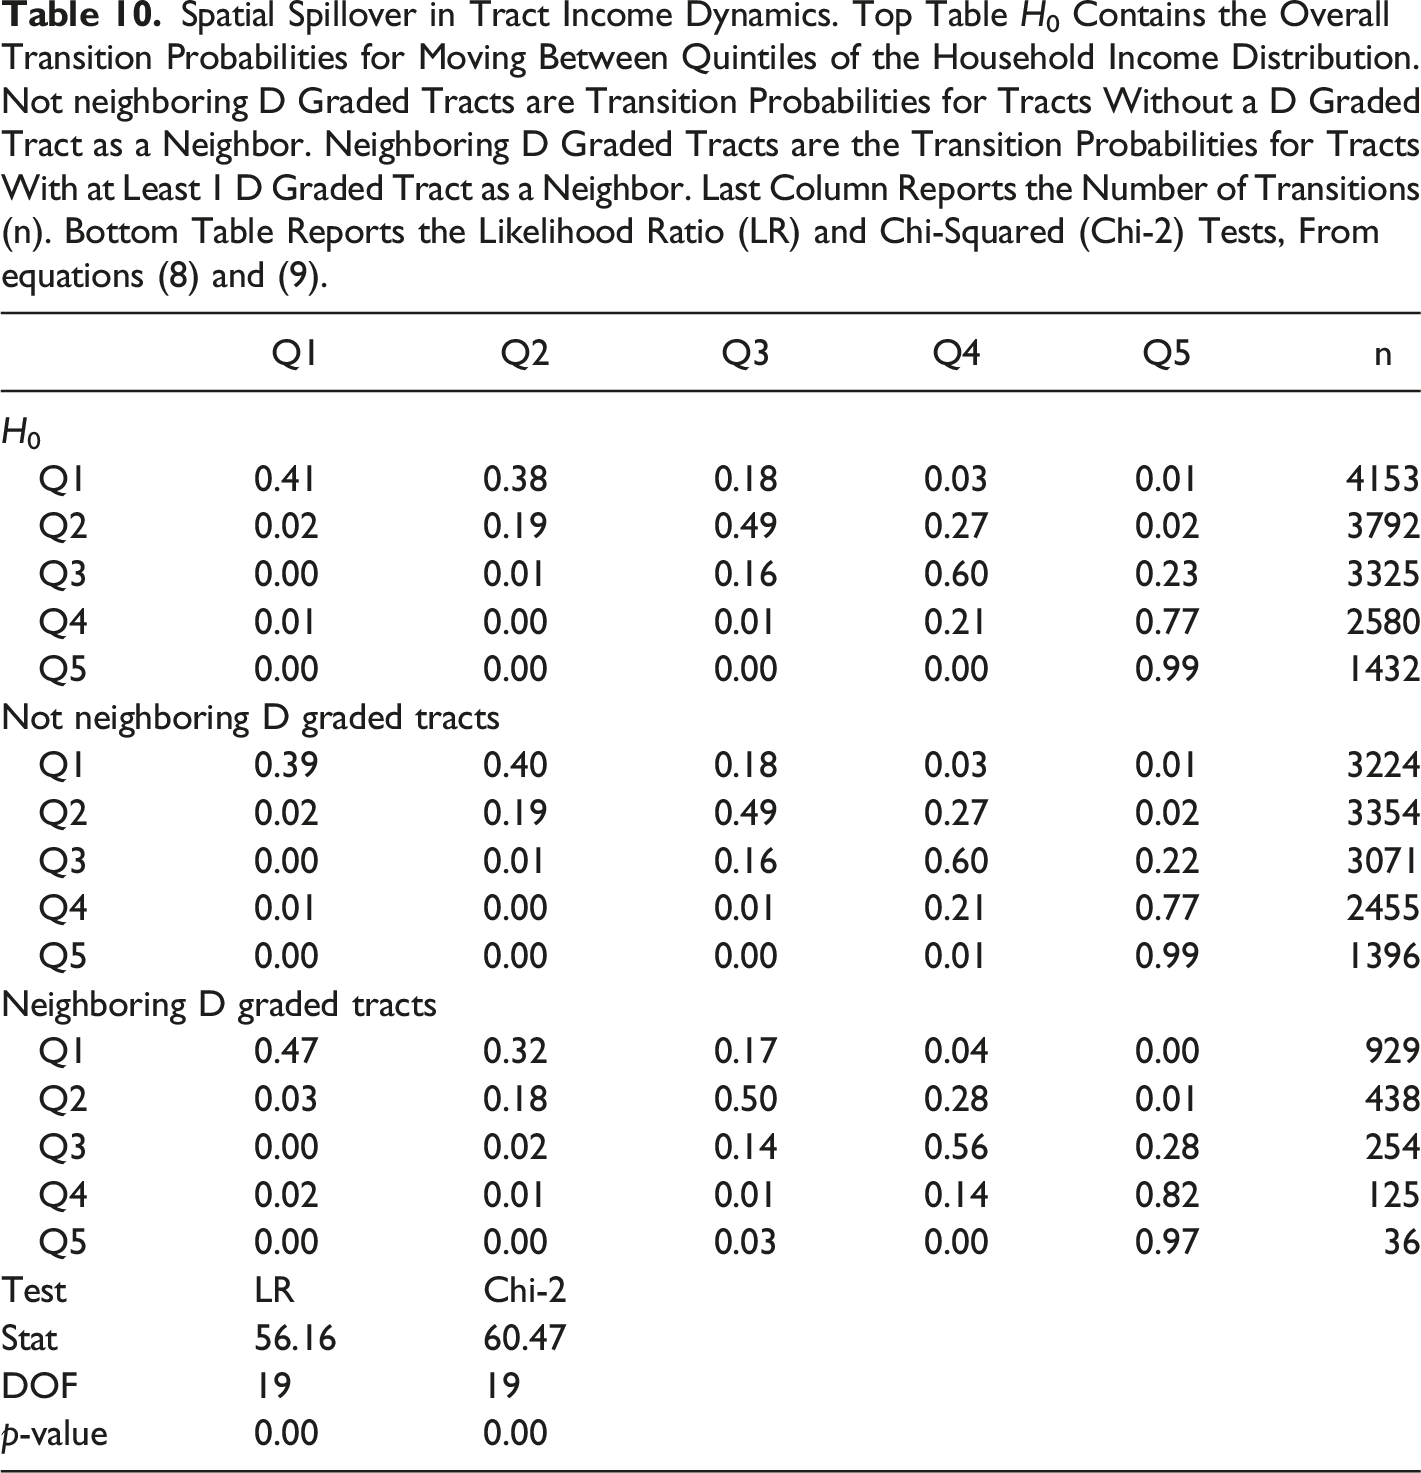
For income dynamics we also find spatial spillover effects, but the situation is reverse from the case of ethnic churn. Tracts bordering D-graded tracts experience more income mobility than their counterpart tracts that do not border D graded tracts. The one exception is the lowest income quintile in which tracts that neighbor D graded tracts display less mobility than tracts with similar income levels but different neighbor types.
Overall, we see that there is higher mobility in the tract income dynamics than is the case for ethnic compositional dynamics, and this is the case irrespective of the HOLC status of a tract’s neighbor.
Discussion
Our findings suggest that at both the city and tract scale, the ways spatial dynamics of ethnic composition and income distributions have differed across HOLC grades are both complicated and nuanced.
We find while the eight cities in California that were subject to HOLC maps in the 1930s rank at the bottom of all California counties with respect to the amount of ethnic churn over the 1990-2010 period, no statistically significant association between ethnic dynamics and HOLC status at the city-wide scale is seen. We also find no statistical association between the HOLC status of a city and the amount of dynamics experienced in its spatial income distribution. In contrast to the case for ethnic churn, for income dynamics we find that the growth rate in the white composition of a city matters. One possible explanation for this is that as the share of the population that is white increases, the minority groups who face structural impediments to upward mobility become a smaller share of the population. These changes would result in changes in the level of income mobility.
We do find that HOLC cities have higher levels of isolation segregation than the non-HOLC group, but no difference in unevenness segregation between the two groups of cities. This finding concurs with the work of Malmberg and Clark (2021) who also uncover cases where a dissimilarity index (measuring unevenness segregation) may not differ over time while an isolation measure would. In our case the difference is at one point in time, but suggests that the isolation of minority groups in the HOLC cities is higher than non-HOLC cities after taking into account city wide ethnic composition and city size. This result accords with the ”stuck in place” thesis (Sharkey 2013) whereby concentrated disadvantage induced by policies such as HOLC perpetuate stratification between minority groups and white populations across generations. We do find a negative association between the growth in the white share of a city’s population and the levels of both unevenness and isolation segregation. This aligns with previous research demonstrating a linkage between city wide ethnic composition and segregation (White 1986; Allen et al. 2015). And, by controlling for this, we still find a statistically significant difference in isolation segregation between HOLC and non-HOLC cities. The effect size of HOLC on isolation segregation is 9%.
The finding that recent spatial ethnic churn and geographic income mobility dynamics are not significantly different between the HOLC cities and non-HOLC cities stands in contrast to expectations based on previous research. Although the question of the spatial dynamics has not been explicitly examined prior to our work, existing literature has established a significant impact of HOLC maps on a host of outcomes (Bakelmun and Shoenfeld 2020; Aaronson et al. 2018a; Crossney and Bartelt 2005; Faber 2017, 2020, 2021). There are two possible explanations for our finding of no differentiation between HOLC and non-HOLC cities. The first reason is that the HOLC impacts may manifest at the tract level and not the city-wide scale. This could reflect the fact that the relative share of the HOLC city’s land use that were subject to these policies has declined over time as the cities have grown in size since the 1930s. 5
The second reason for our finding of a general lack of city-wide differences in modern ethnic and income dynamics is that cities that did not have HOLC maps may have seen other forms of segregation that were just as profound in their impacts as the explicit and legalized discrimination that the HOLC maps reflected. In a sense, the HOLC maps may be “saying the quiet part out loud”. The two reasons are not mutually exclusive and could both be behind our city-level empirical results.
At the intra-urban scale, our finding that the lower grade tracts are predominately minority in composition has been reported in other studies (Lee et al. 2020; Hillier 2003). Our comparative analysis unpacks substantial variation in this pattern across the eight HOLC cities. The overall highly skewed income distributions in these cities are driven by tracts that received other than C or D grades. More specifically, while we find white majority tracts all along the income distribution, they dominate in the upper tail of the distribution while minority tracts are absent from the upper tail but dominate the bottom of the income distribution. As such, both white and minority populations in these HOLC cities experience the negative consequences of income disparities, however, the prevalence of exposure to these disparities is greater for the minority populations.
The intersectionality of residing in a C or D graded tract that is also a low income tract falls predominately upon the minority populations in these eight HOLC cities. We find that the recent evolutionary dynamics of ethnic composition and income distributions for these tracts are distinct across tracts receiving different HOLC grades. Lower amounts of mobility in both distributions are experienced by C and D graded tracts suggesting that the legacy effects of chronic disinvestment in the housing markets (Aalbers 2014) in these tracts has led to a locking in of historical patterns into the modern era.
We also find that there are clear spillover effects of HOLC grades on ethnic and income dynamics for neighboring tracts. Minority tracts that neighbor D graded tracts experience more inertia in their ethnic composition dynamics than their counterparts not neighboring D graded tracts. This situation is generally reversed when considering tract income dynamics, where we find tracts with D graded neighbors display higher income mobility, with the exception of the poorest tracts. This has several implications. First, legacy effects of the HOLC may spillover into adjacent housing markets to lock racial and ethnic composition in place. Previous research (Hillier 2005) has shown a link between the role of spatial context in ethnic composition in whether a tract received a particular HOLC grade. Our results shed light on the role of spatial spillovers in the legacy of the effects associated with these historical grades. Second, the generally higher rates of tract income mobility suggests that class dynamics are more robust to HOLC legacies as some threshold income level is reached. For the poorest tracts, however, the lower income mobility associated with D graded neighbors may reflect the realization of a spatial poverty trap (Bowles et al. 2008).
As in any study attempting to link recent spatial patterns to events that occurred close to a century ago, there are limitations that need to be acknowledged. By design, we focused on the case of California cities to allow for a detailed investigation of spatial dynamics at two scales, inter and intra-urban. Because of this choice, the question of the generalizability of our findings to the rest of the country remains an open one. Given our focus on recent spatial dynamics, we are unable to control for any differences that may have existed between tracts prior to the assignment of the HOLC grades. It could also be that any differences in dynamics may have occurred in the period after the imposition of the HOLC policies and the beginning of our sample period. That said, we do not find any legacy impacts on modern city level dynamics for income or ethnic composition.
Conclusion
In this paper we examined the legacy of the HOLC residential security maps from the perspective of spatial and social dynamics. In the last two decades a great deal of research has examined racial inequality in the housing market and the ways that practices like redlining and fair access to credit have continued to shape racial inequality across a wide range of outcomes today. The HOLC “redlining” maps remain a focal point in this body of work, first because the recent availability of the residential security maps facilitates convenient research designs and second because findings of HOLC’s complicity in creating racialized housing markets imply a direct role of the federal government in helping to create these conditions.
Despite the interest in HOLC’s role and the large volumes of research that suggest its activities may have helped lock-in racialized lending practices, there remains a great deal of uncertainty regarding how much influence HOLC may have had in the ultimate landscape of mortgage lending, or whether the residential security maps are simply the best concrete artifact of a racist and deeply-entrenched practice in the American finance system. Thus, using a lens of neighborhood change, we sought in this paper to understand how the presence of HOLC activity in a city, as well as the specific designations of creditworthiness it assigned to neighborhoods, helped shape the way those places evolved over the next half century. Unlike other work that examines the legacy impacts of HOLC’s activities, our spatio-temporal research design asks not whether conditions in cities today are simply different as a result of HOLC’s maps, but whether HOLC’s activities (using California cities as a test case) altered the trajectories of neighborhood patterns of economic mobility and racial segregation. Further, our work examined whether the neighborhoods that HOLC deemed least creditworthy, those rated as “C” and “D” (as well as the neighborhoods proximate to those receiving low grades), bear lasting consequences of those designations in their patterns of economic mobility and ethnic churn.
As with many other studies of the HOLC, our results are both intriguing and full of nuance. From a broad perspective, our findings indicate that neighborhoods with poor housing markets and high minority concentrations rarely experience dramatic change in either their racial and ethnic or socioeconomic compositions—and that negative externalities emanate from these neighborhoods, with inertia spilling over into nearby zones. Put differently, we find that neighborhoods characterized by high levels of racial and socioeconomic segregation rarely escape those conditions, but we also find that attributing the cause of these dynamics to outside actors like HOLC cannot be done with confidence. Although we find clear evidence that segregated neighborhoods are likely to get “stuck in place” (Sharkey 2013), we find no detectable difference in the income and ethnic dynamics among HOLC and non-HOLC counties. We take this to mean that it may simply be that HOLC identified places where markets were already stagnating, and while the “C” and “D” grades certainly did not help these neighborhoods overcome preexisting issues of spatial stigma, neither can we say that the grading itself is the proximate cause of neighborhood stagnation. Thus, our tentative conclusion in this respect is that those counties for which HOLC residential security maps exist likely represent a sub-sample of American cities in which segregation and racist lending practices irrevocably altered the evolution of predominantly black neighborhoods, and the presence of these maps is simple an explicit representation of a process implicit throughout the country.
In future work we intend scrutinize this conclusion by extending our analysis in several directions. First, we plan to investigate the question of how generalizable our results are as we apply the methods developed in this paper to the complete set of HOLC cities in the United States. Increasing the sample size of cities will afford us more granularity in both the inter-urban and intra-urban analyses. Further, while representative of the country in many ways, California is also a national outlier in some respects, and it is possible that some of our results are driven by conditions unique to the American West, such as an abundance of developable land and high volumes of Hispanic and Latino immigration. Economic geography may also play an important role in the evolution of urban housing markets across the country, and it is possible that broader macroeconomic trends such as deindustrialization, the rise of the gig economy, and the prominence of the technology sector may lead to additional nuanced patterns as regions like the Midwest, northeast, and deep south are incorporated into the analysis. As archival census data continue to be digitized (Manson et al. 2020), it may also be possible to increase our temporal sample size as well, providing more observations in the sequence for each location, and providing insight into neighborhood dynamics in the periods immediately proceeding HOLC’s designations.
In addition to data augmentation we plan to widen the scope of our empirical investigation to incorporate additional methods for local analysis such as local indicators of neighborhood change (LINC) (Rey et al., 2011) and local indicators of mobility association (LIMA) (Rey, 2016) which help provide a more granular insight into the dynamic processes of neighborhoods at smaller geographic scales. Further, we plan to keep interrogating the distinction between HOLC and non-HOLC cities, for example by using geodemographic clustering as a way to develop synthetic “controls” for sample selection of HOLC’s activities (Singleton and Spielman 2014; Knaap et al. 2019).
Footnotes
Declaration of Conflicting Interests
The author(s) declared no potential conflicts of interest with respect to the research, authorship, and/or publication of this article.
Funding
The author(s) disclosed receipt of the following financial support for the research, authorship, and/or publication of this article: This work was supported by the National Science Foundation; BCS 1759746.