
Abstract
To examine the robustness of their results against omitted variable bias, management researchers often compare the Impact Threshold of a Confounding Variable (ITCV) with control variable correlations. This paper describes three issues with this approach. First, the ITCV and control variable correlations are measured on mathematically different scales. As a result, their direct comparison is inappropriate. Second, a fair comparison requires a rescaled version of the ITCV known as “the unconditional ITCV.” Third, even the interpretation of the unconditional ITCV is complicated by the presence of multiple omitted variables, numerous control variables, and correlations between the omitted and control variables. We illustrate these issues with simple computer-generated data, a Monte Carlo simulation, and a practical application based on a published dataset. These results suggest that rules of thumb based on ITCV and control variable correlations are misleading and call for alternative ways of running, interpreting, and reporting the ITCV.
Causal claims represent the pinnacle of all empirical endeavors in the social sciences. Yet, to claim that a predictor X causes an outcome Y, researchers must invoke a crucial assumption: No omitted variables must exist (e.g., Antonakis, Bendahan, Jacquart, & Lalive, 2010; Busenbark, Yoon, Gamache, & Withers, 2022; Hill, Johnson, Greco, O’Boyle, & Walter, 2021). This assumption is inherently unverifiable and can rarely—if ever—be expected to hold precisely in observational studies. Against this backdrop, management researchers have recently turned to sensitivity analyses, that is, statistical techniques that quantify the robustness of their regression results against deviations from the no-omitted-variable-ideal. The Impact Threshold of a Confounding Variable is one such technique (ITCV; Frank, 2000).
In its most basic form, the ITCV calculates the minimum correlations an omitted variable would need to feature with both the predictor and outcome of interest to turn their significant estimated relationship into a non-significant one. Simply put, the ITCV does not test whether an omitted variable exists; rather, it calculates the explanatory power a hypothetical omitted variable needs to alter an inference. Researchers can then rely on theory, subject-matter expertise, and empirical evidence to argue whether an omitted variable featuring such correlations could exist.
To aid their judgments about the size of the ITCV, management scholars often rely on a simple rule of thumb: If the ITCV is larger than the control variables’ correlations, then omitted variable bias is negligible. This logic—which we discuss in the section “ITCV in Management Studies”—seems intuitive. Control variables are often modeled because they cause both the predictor and the outcome of interest (e.g., Hünermund & Louw, 2023; Mändli & Rönkkö, 2023). That is, control variables represent the “potential omitted variables” that researchers happen to observe. Thus, if control variables are good proxies for the omitted variables and if control variables exhibit correlations lower than those implied by the ITCV, then an omitted variable is also unlikely to feature such large correlations (see, for example, Aguinis, Bergh, & Molina-Azorin, 2023; Busenbark et al., 2022; Larcker & Rusticus, 2010).
Despite its intuitive appeal and widespread use, this paper clarifies that this “ITCV rule of thumb” builds on an incorrect interpretation of the ITCV. As we formalize in the section “Does the ITCV Rule of Thumb Work?”, the ITCV—at least in its default version calculated by statistical software available at the time of writing (Narvaiz et al., 2024; Xu, Frank, Maroulis, & Rosenberg, 2019)—does not represent a product of zero-order correlations whenever control variables are modeled. As such, it cannot be compared directly to control variable correlations, at least in general (see also Busenbark, Frank, Maroulis, Xu, & Lin, 2021; Cinelli & Hazlett, 2020).
To overcome this problem, researchers can rely on a rescaled version of the default ITCV known as “the unconditional ITCV” (Xu et al., 2019). In the section “The Unconditional ITCV,” we present this statistic to the management field. We also clarify that the difference between the default and unconditional ITCV is not a methodological minutia but a concrete concern for empirical researchers. First, the unconditional ITCV is always smaller than the default ITCV. As a result, comparing the latter with control variable correlations can lead to overly optimistic assessments about the robustness of an inference to omitted variables. Second, the difference between the default and unconditional ITCV can be sizable if the control variables explain substantial variance in the predictor and outcome of interest.
Despite its merits, then, the unconditional ITCV is no panacea. In the section “Interpreting the Unconditional ITCV: Extensions”, we show that even the contrast between the unconditional ITCV and control variable correlations must be carefully interpreted if multiple omitted variables exist, numerous control variables are modeled, or the omitted and control variables correlate (cf. Diegert, Masten, & Poirier, 2022).
While we formally prove all these results in the online Supplemental Materials, we take a more reader-friendly approach in the main text, presenting mainly the intuition behind our results thanks to graphic explanations (cf. Kennedy, 2002) and stripped-down empirical examples based on computer-generated data. To further highlight the practical relevance of our findings in realistic settings, we also report an empirical application based on published data in the section “ITCV and Control Variable Correlations in the Wild.” There, we showcase how different ways of interpreting the ITCV and contrasting it to control variable correlations can lead to dramatically different conclusions about the robustness of researchers’ estimates.
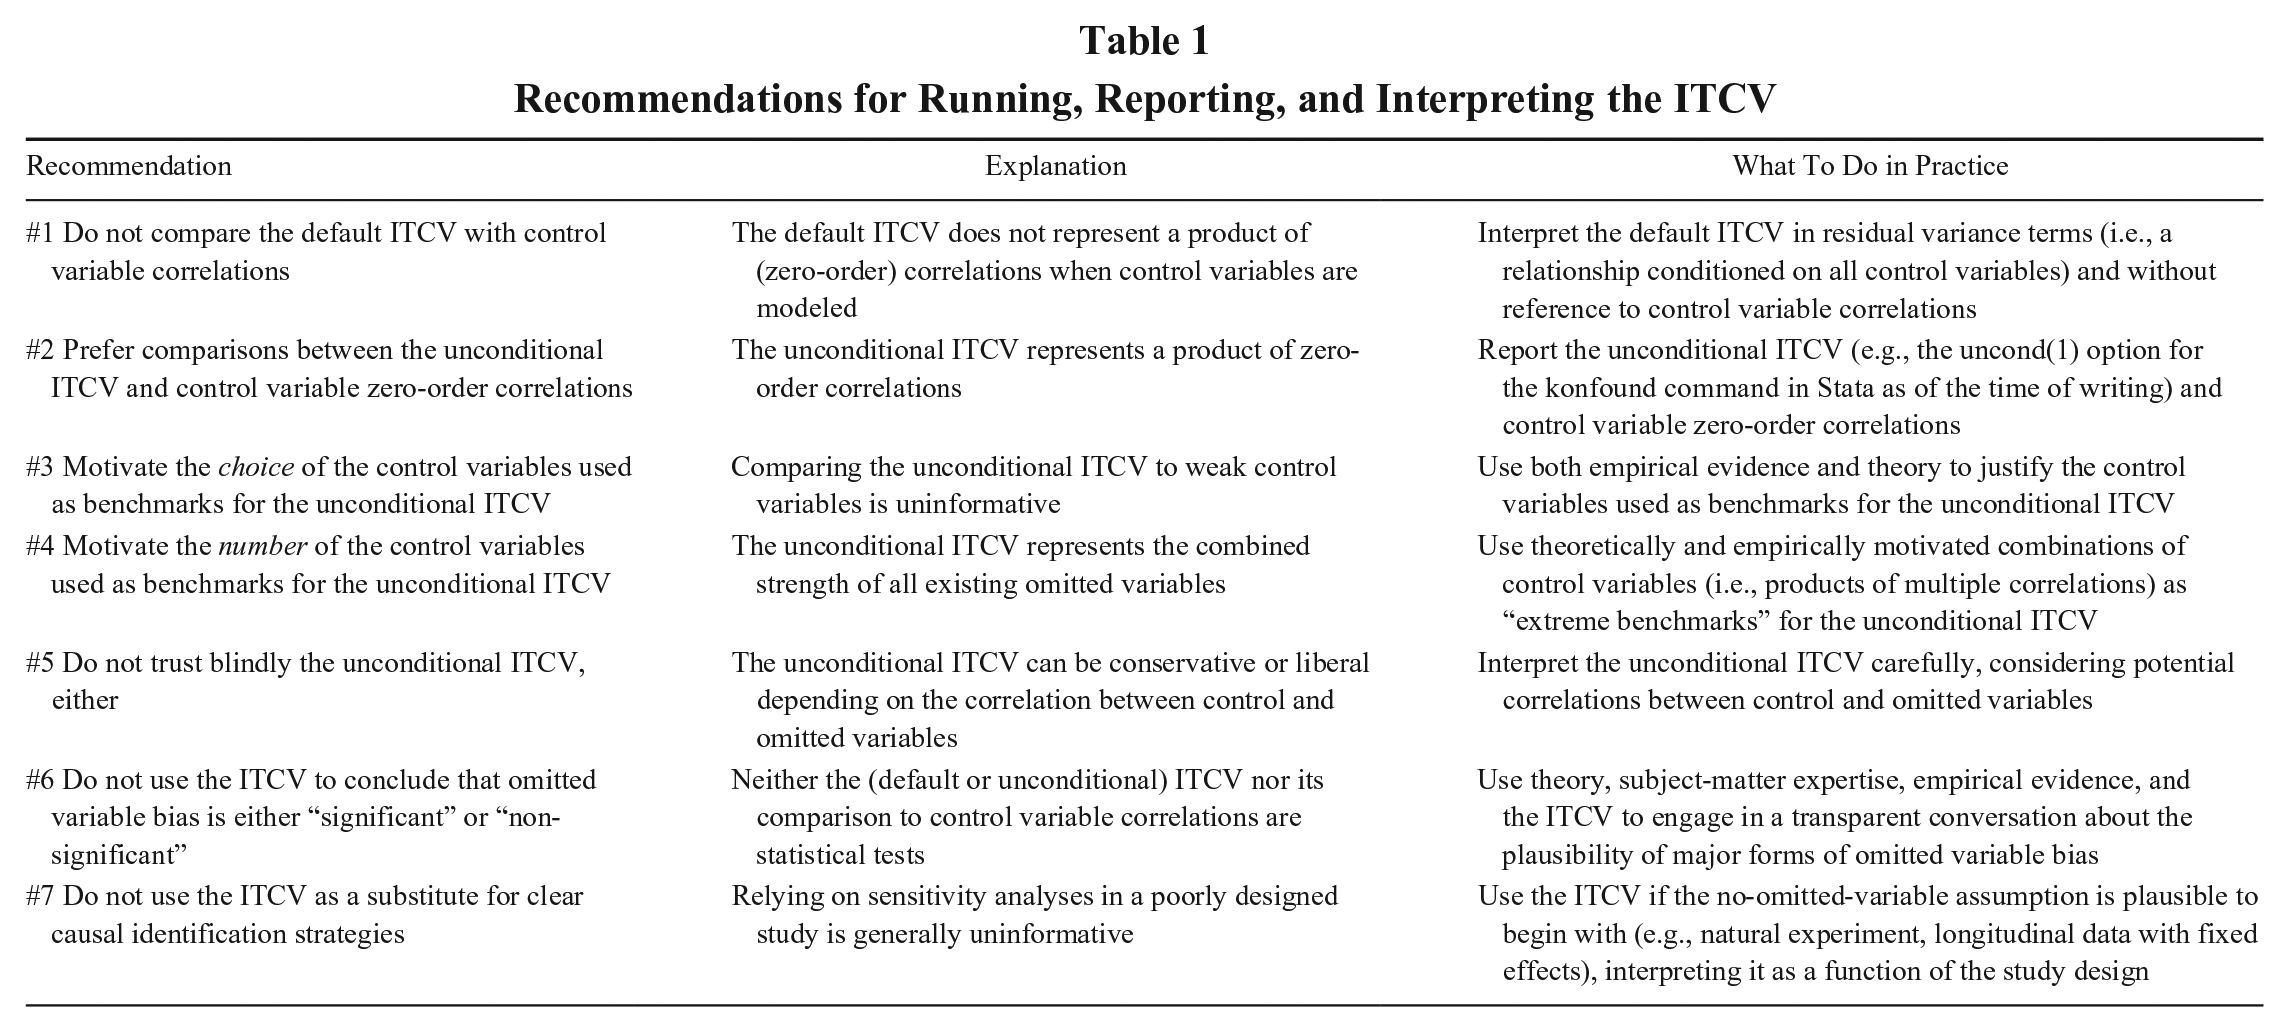
In sum, our results echo the warning inscribed on uncharted territories in some medieval maps: hic sunt dracones (“here be dragons”). Much like explorers venturing into unknown regions, management researchers must face several dangers when using the ITCV and control variable correlations to navigate complex empirical landscapes. If overlooked, these perils can mislead scholars about the robustness of their results. Worse, they risk offering statistically unjustified excuses for not taking omitted variable bias seriously, thus misleading theory development and practice. We urge our field to tread carefully and abandon seemingly straightforward rules of thumb in favor of a more principled use of the ITCV, which we summarize in Table 1 (see also Busenbark et al., 2021; Cinelli & Hazlett, 2020; Frank, Lin, Xu, Maroulis, & Mueller, 2023; Wulff et al., 2023). As we argue in the “Discussion” section, only a rigorous use of the ITCV can serve science well and complement causal identification strategies based on plausibly exogenous variation, careful statistical modeling, and researchers’ subject-matter expertise.
Recommendations for Running, Reporting, and Interpreting the ITCV
ITCV in Management Studies
Consider a simple running example we use throughout the paper. Suppose some researchers are interested in estimating whether a predictor of interest, X (e.g., a leadership style), causes an outcome of interest, Y (e.g., leader effectiveness). Crucially, we assume that the causal relationship between X and Y is none in the population, but that both predictor and outcome are affected by an unobservable variable, Q (e.g., leader intelligence). For instance, it might be that more intelligent leaders tend to employ a specific leadership style (e.g., charismatic leadership, Antonakis, Bastardoz, Jacquart, & Shamir, 2016) and also better supervise their employees (Cavazotte, Moreno, & Hickmann, 2012). We draw 1,000 observations from this exemplary data-generating process described in the note to Table 2.
Interpreting the ITCV in a Model Without Control Variables
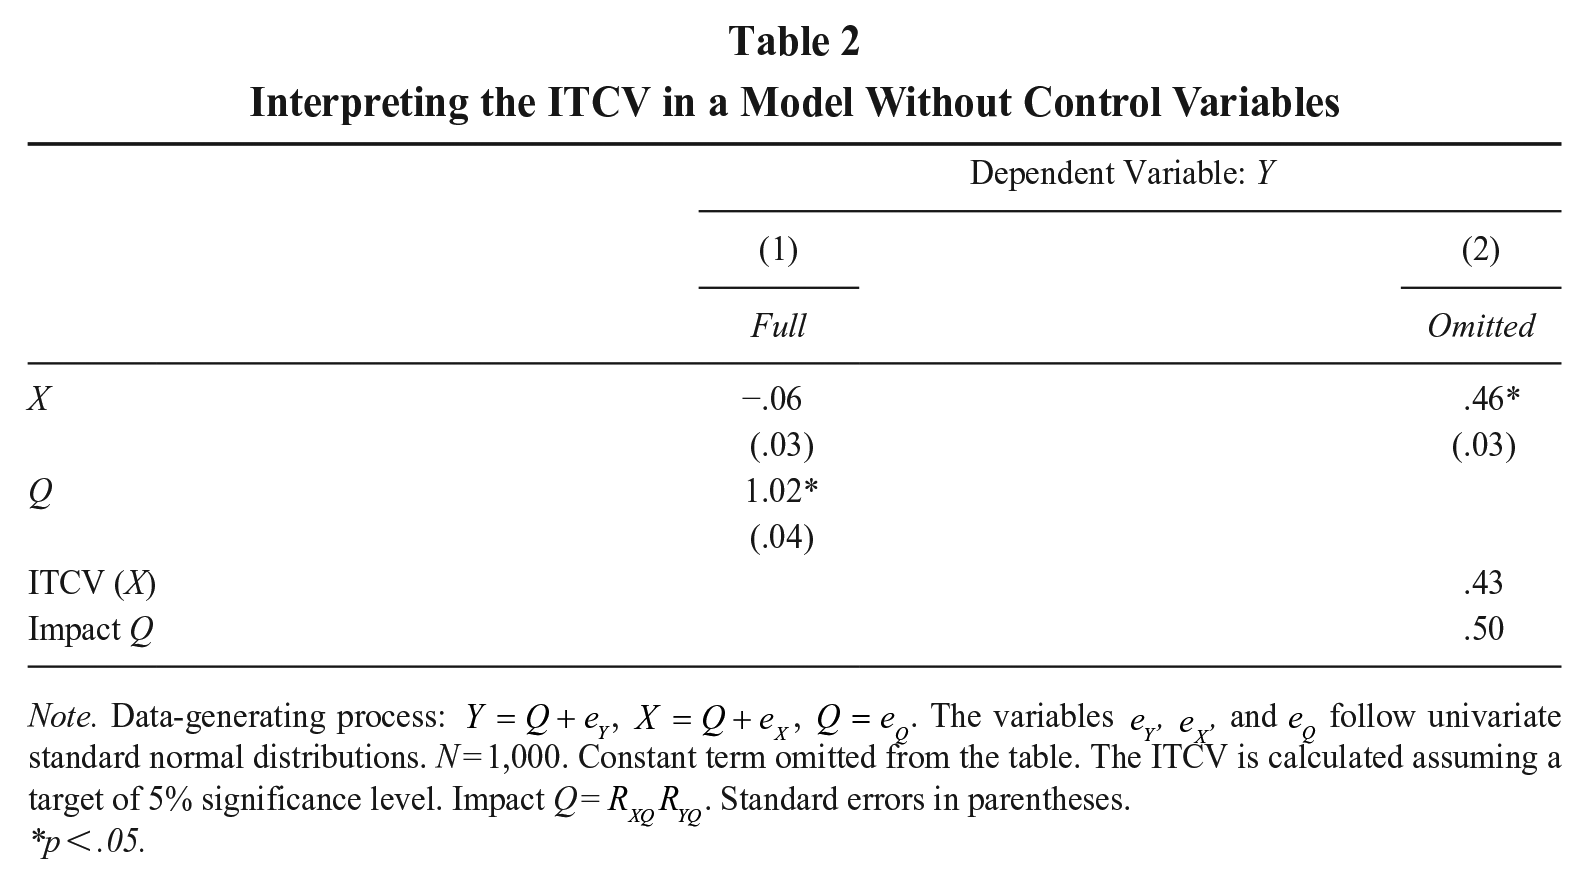
Note. Data-generating process:
p < .05.
Without knowing Q, can the researchers of our example correctly estimate the null effect of X? Unfortunately, the answer is no. Simply regressing Y on X leads to the incorrect conclusion that X affects Y positively (
Without observing Q, the researchers of our example cannot possibly see that their estimate is incorrect. However, they can at least quantify the vulnerability of their inference to omitted variable bias thanks to the ITCV (Frank, 2000). The ITCV is a sensitivity analysis quantifying how strong a hypothetical omitted variable needs to be to disrupt the researchers’ inference. The ITCV follows a simple intuition. Knowing that the strength of omitted variable bias is governed by how much Q affects both X and Y, one can characterize the biasing effect of the omitted variable in a single metric known as “impact,” that is, the product of the correlation between Q and X multiplied by the correlation between Q and Y (i.e.,
In a model with a single left-hand side variable, the interpretation of the ITCV is straightforward. For instance, the ITCV for the regression of Y on X of Table 2 is .43 (ITCV calculated with the konfound command in Stata [Version 18]; Xu et al., 2019), suggesting that an omitted variable with an impact of at least .43—or, equivalently, a correlation of at least
The “ITCV Rule of Thumb”
The simplicity of the ITCV contributes to explaining its recent success in published management articles (see Supplemental Material E). Yet, it masks a daunting question. As empirical researchers cannot possibly measure the impact of the omitted variable, how can they decide if an ITCV is “small enough” to signal a serious omitted variable problem?
To answer this question, management methodologists have suggested comparing the ITCV to the impact of control variables included in a regression model, that is, the product of the correlations featured by the control variables with both the predictor and outcome. The proposed rule of thumb is simple. If the ITCV is larger than the impact exhibited by all (or at least most) of the control variables included in the regression model, then omitted variable bias can be regarded as a minor concern (e.g., Aguinis et al., 2023; Busenbark et al., 2022). 1
This practice is getting traction in leading empirical management outlets, like Academy of Management Journal, Journal of Management, and Strategic Management Journal. As of January 2024, of the 47 empirical articles published in top journals that cite the seminal article on ITCV (i.e., Frank, 2000) and calculate an ITCV, 42 articles benchmark it against the impacts or the correlations exhibited by control variables. Thirty-nine articles rely on this comparison to also make explicit conclusions about the robustness of their results to omitted variable bias (see Supplemental Material E). Some rely on this “ITCV rule of thumb” somewhat cautiously (e.g., “[a]ssuming that we have a reasonable set of control variables, this [i.e., comparing the ITCV to the control variables’ correlations] suggests that the results are not likely driven by a correlated omitted variable”; Hubbard, Christensen, & Graffin, 2017: 2262), while others do so more openly (e.g., “the test [i.e., comparing the ITCV to the control variables’ correlations] revealed that a potential omitted variable would likely not be a significant concern in our models”; Andrus, Scoresby, Lee, Rainville, Smith, & Syed, 2023: 26).
Does the ITCV Rule of Thumb Work?
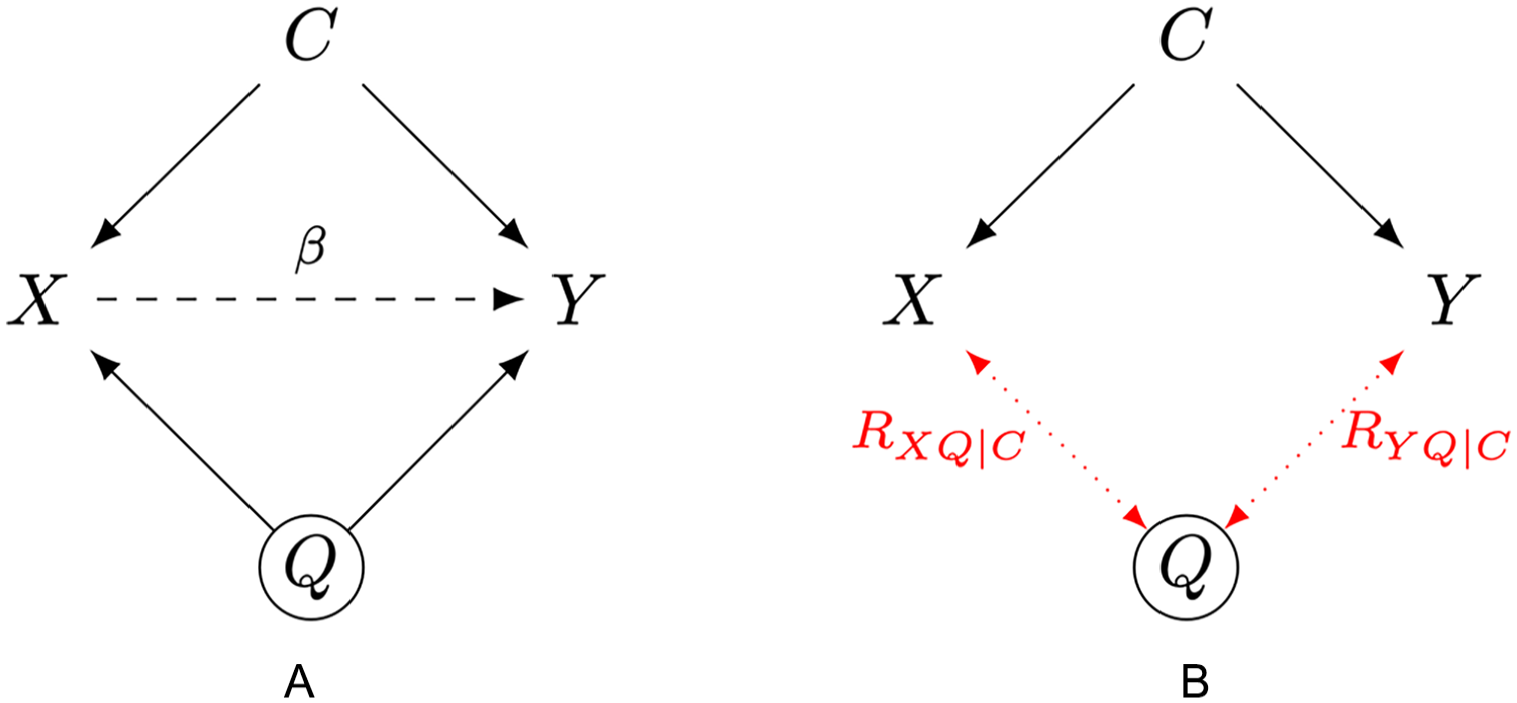
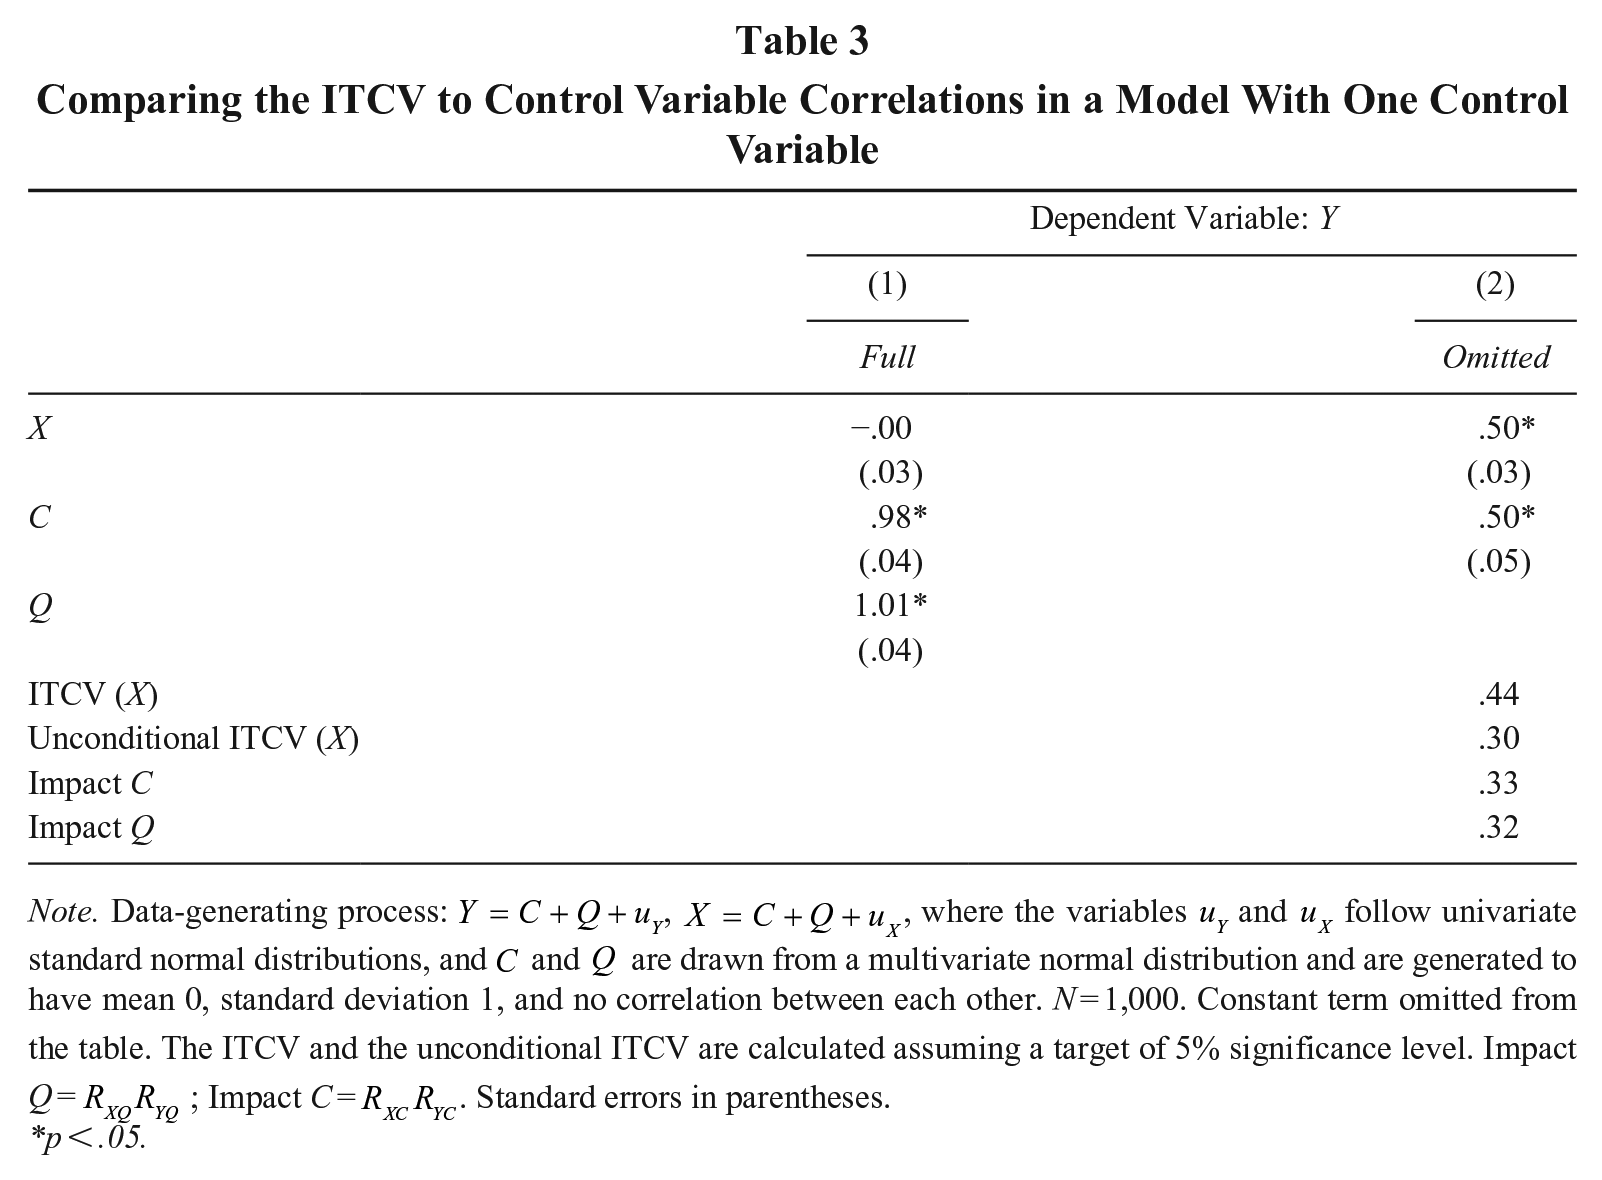
The “ITCV rule of thumb” is straightforward, but does it really work? To answer this question, let us consider again a predictor, X (e.g., a leadership style), and an outcome, Y (e.g., leader effectiveness), with no causal relationship in the population, as well as an unmeasured variable, Q, that affects them both (e.g., leader intelligence). Following Cinelli and Hazlett (2020), let us assume that there is also an observed variable, C, affecting both the predictor and the outcome. For instance, C may represent a contextual factor that pushes leaders to use a specific leadership style and makes followers perform better (e.g., organizational culture). Crucially, we assume that C and Q affect X and Y identically. For simplicity, we also assume no correlation between C and Q. We draw 1,000 observations from this data-generating process represented in Figure 1a (see also Table 3’s note).
Interpreting the ITCV: One Omitted Variable & One Control Variable
Comparing the ITCV to Control Variable Correlations in a Model With One Control Variable
Note. Data-generating process:
p < .05.
Consider a regression model where C is controlled for, while Q is not. Unsurprisingly, this model returns an estimated effect for X of .50, which is far from the correct null effect (Table 3). From the way the data is generated, we know that Q causes a major omitted variable bias. We also know that C is as impactful as Q, that is, both variables exhibit identical correlations with the predictor and the outcome (aside from fluctuations due to the finite sample). Calculating the ITCV should, thus, tell us what we see clearly from our vantage point: An omitted variable roughly as impactful as the control variable C—that is, Q—is enough to alter inference. As a result, the ITCV should be smaller than the product of correlations exhibited by C.
However, comparing the ITCV with the control variable’s correlations leads to an unexpected conclusion. The ITCV (.44) is visibly larger than the impact of C (.33), leading us to the incorrect conclusion that an omitted variable as impactful as C would not be problematic, and that omitted variable bias must only be a minor issue in this regression model.
Unpacking the Problem: Residual Versus Total Variance
Why is the comparison between the ITCV and the control variables’ correlations so misleading in the previous example? Cinelli and Hazlett (2020) were the first to elucidate this mishap, which revolves around the difference between the total variance of X and Y and their residual variance that remains available after controlling for C. This difference is easy to miss but crucial when interpreting the ITCV.
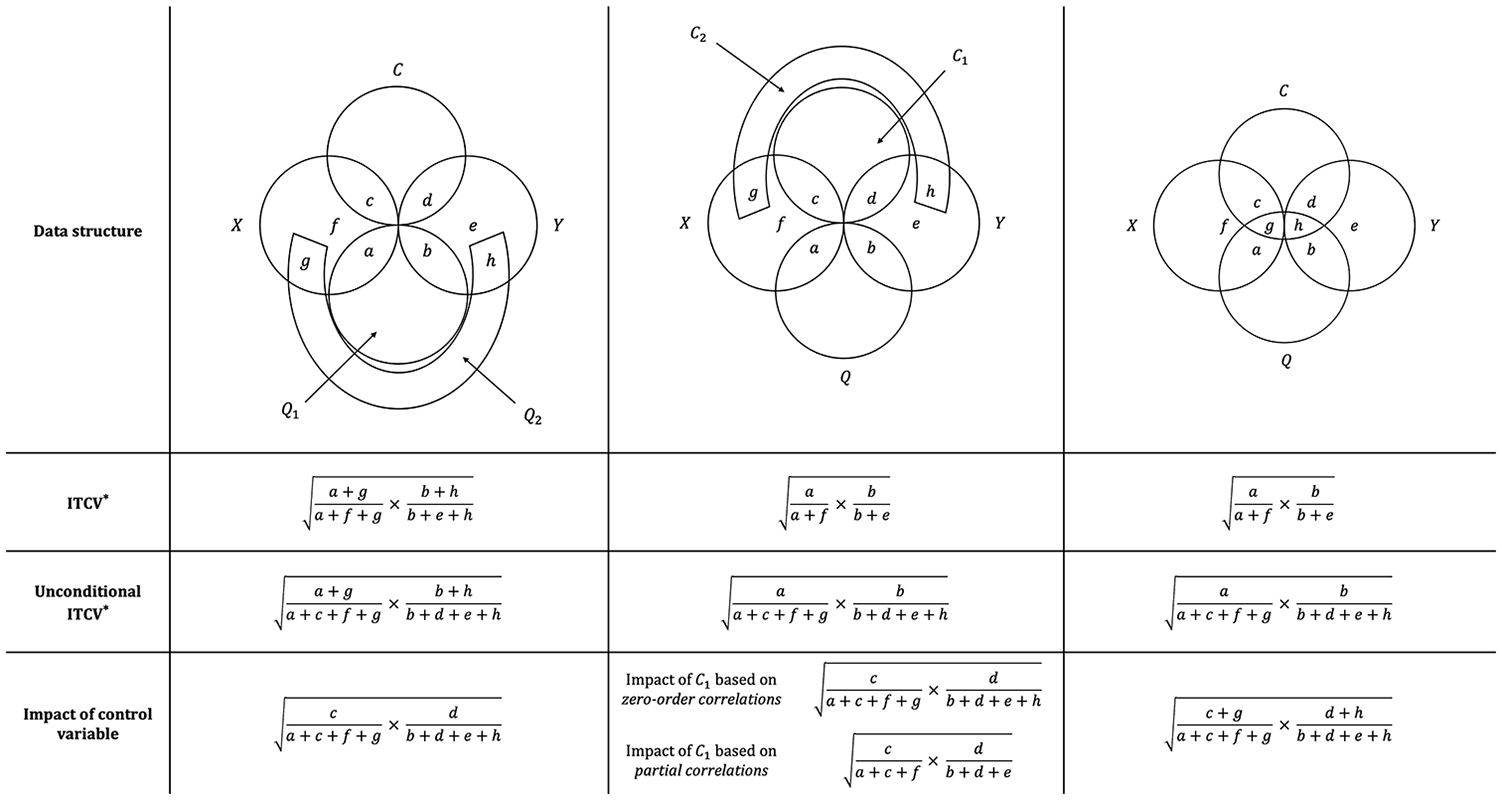
To intuitively understand this problem, consider Figure 2 (see Supplemental Material B for a formal explanation). In the Venn Diagram, each circle represents the total variance of the variables involved in the previous empirical example. Consider the correlation between C and X first. We know by data generation that C explains roughly 1/3 of the total variance of X. That is, the
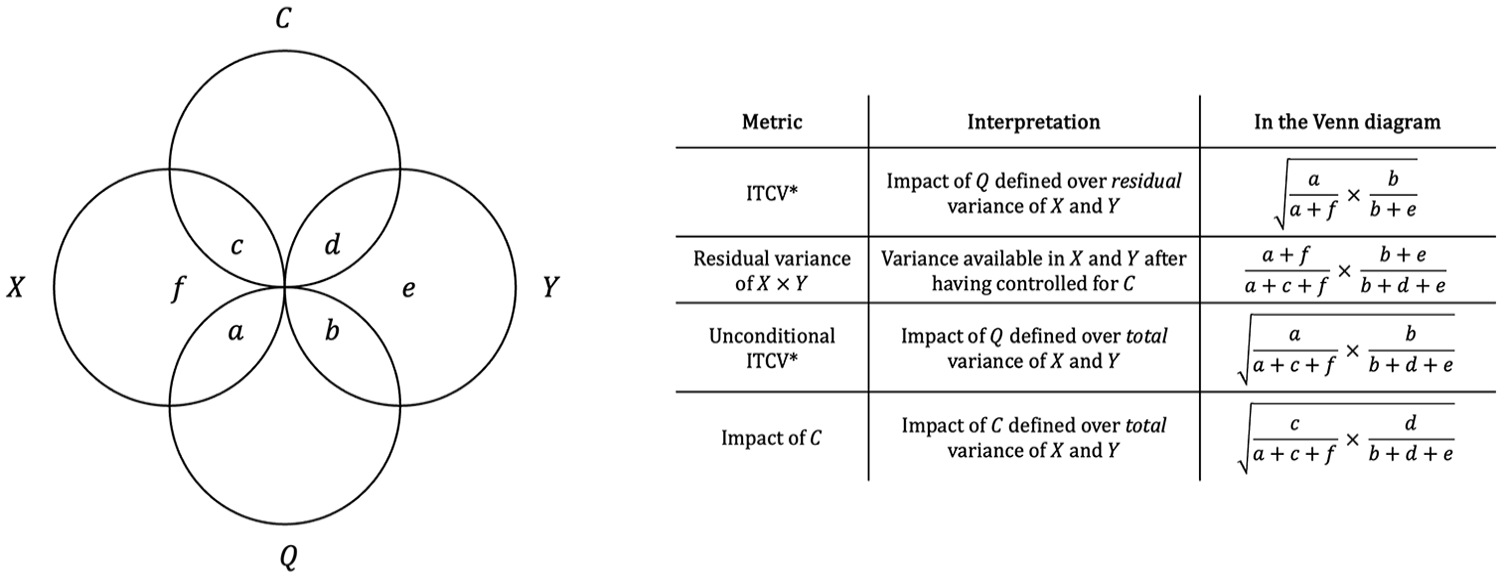
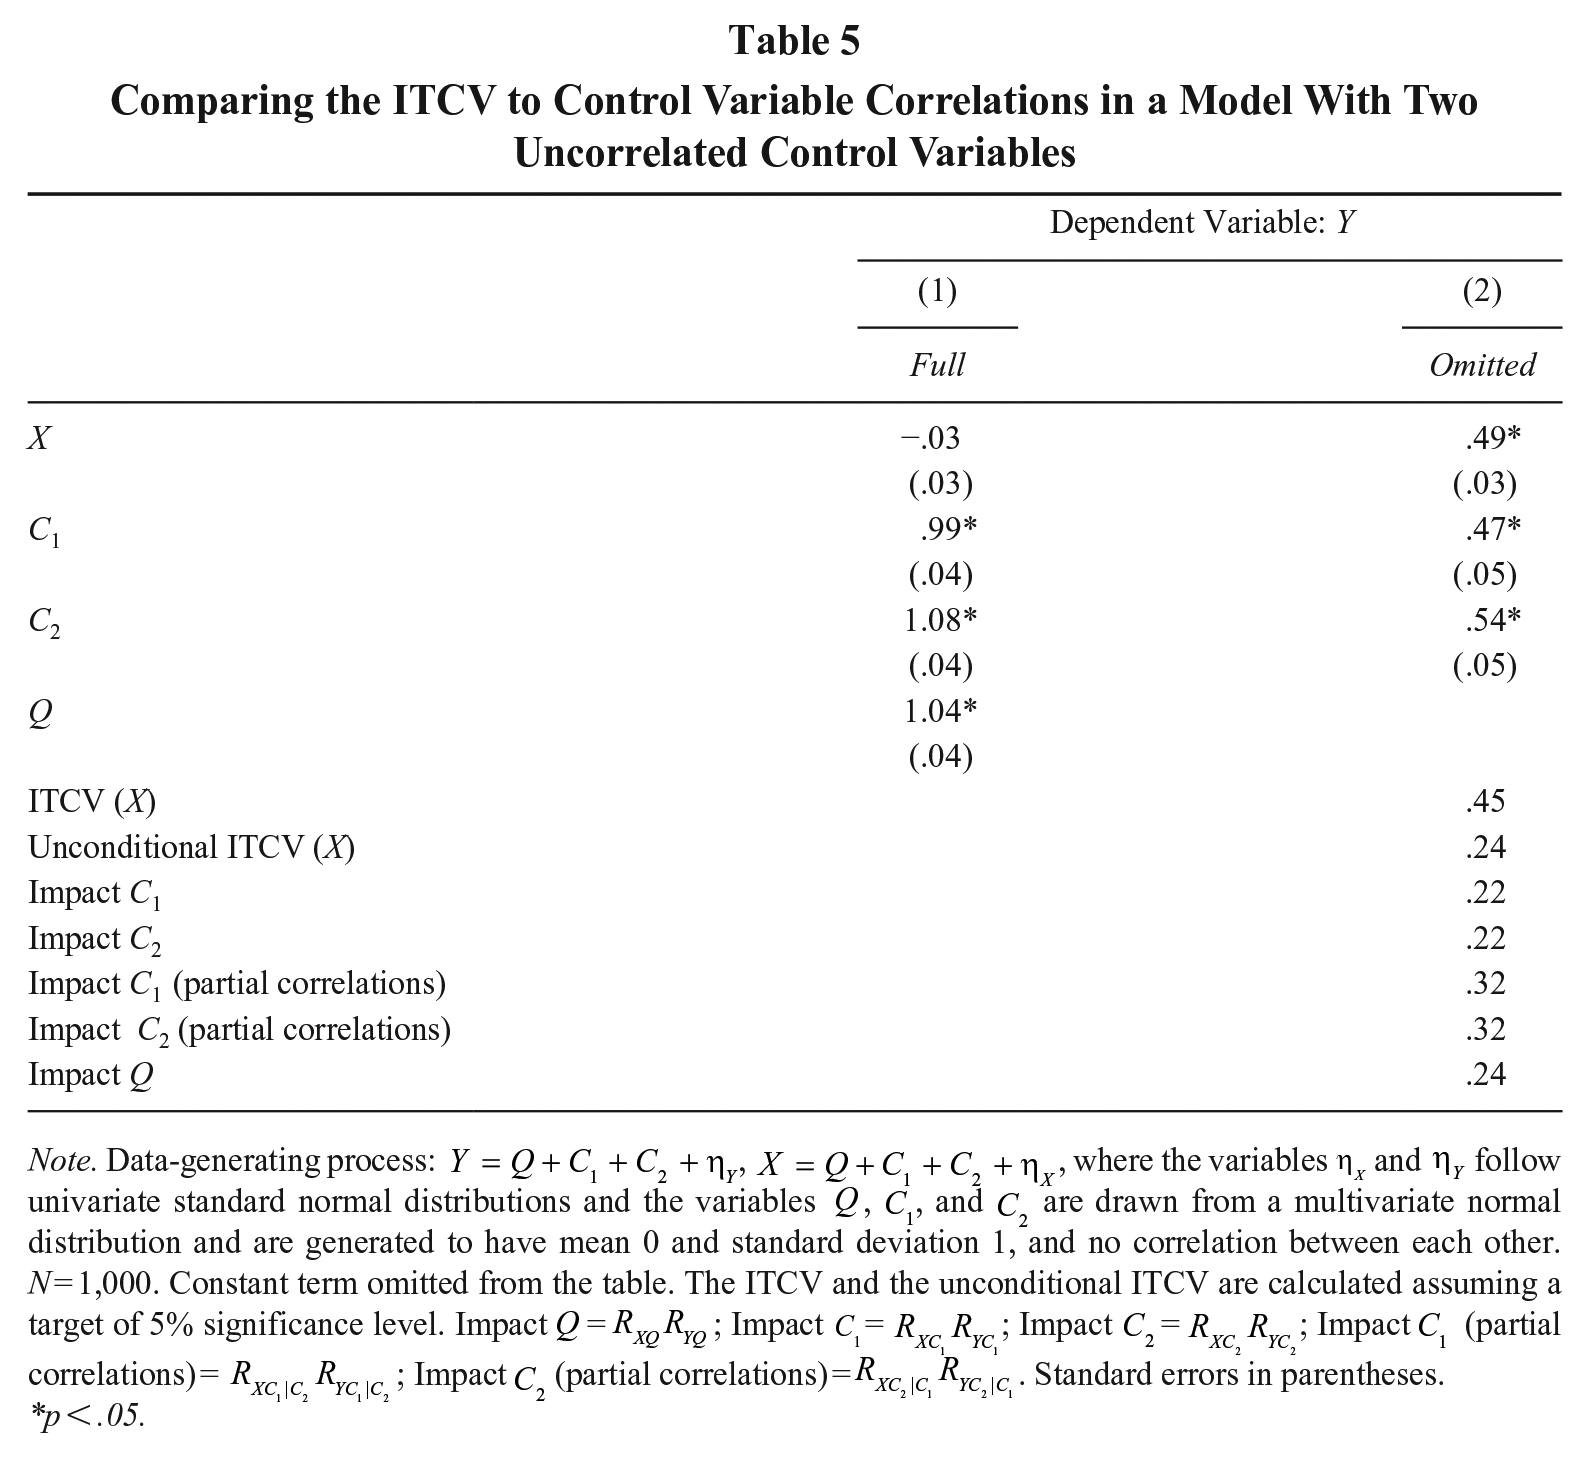
ITCV, Unconditional ITCV, and Impact of the Control Variable: One Omitted Variable and One Uncorrelated Control Variable Case
Now consider the ITCV. Without control variables, the ITCV represents the minimum product of correlations Q needs to feature with X and Y (i.e., the impact of Q) to alter inference; however, when C is controlled for, this interpretation changes. To see why, note that Q also explains 1/3 of the total variance of X in our example. Yet, this total variance is no longer available after controlling for C. By modeling C, we are effectively removing all the variation explained by C from the total variance of X. As a result, the maximum variance that the omitted variable Q can potentially explain in X is not 1, but 1 (i.e., the total variance of X) minus 1/3 (i.e., the variance of X explained by C) = 2/3 (i.e., the residual variance of X). An analogous logic holds for the variance of Y that Q can explain. In sum, the ITCV does not indicate that Q would need to explain 1/3 of the total variance of X and Y to alter inference (i.e., the area
But here is the catch. The ITCV and the impact of the control variable are quantified on different scales (Busenbark et al., 2021). The product of the control variable’s correlations is defined in terms of a “whole cake” (i.e., the total variance of outcome and predictor), while the ITCV is defined in terms of a “smaller cake” (i.e., the residual variance of outcome and predictor available after modeling the control variable). More formally, the impact of C is a product of zero-order correlations, whereas the ITCV is a product of partial correlations conditioned on all control variables (i.e., correlations net of the effect of C, see Figure 1b). This difference can mislead researchers into thinking that the ITCV is “too big” compared to the impact of control variables, as the size of the ITCV does not only reflect the robustness of one’s inference but also the difference between total and residual variance.
The Unconditional ITCV
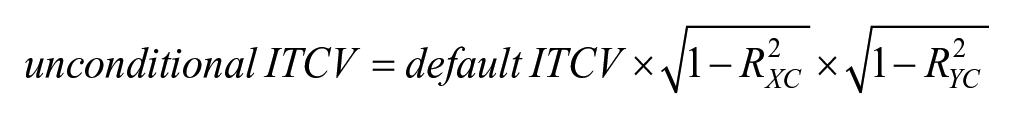
The scale difference between the ITCV and control variable correlations is an important conceptual issue. Fortunately, it is also easily solvable if the control and omitted variables are uncorrelated. The solution involves rescaling the ITCV as a product of zero-order correlations—the same scale as the impact of the control variables (see Cinelli & Hazlett, 2020, Equation 22; Frank et al., 2023, Equation 10). This rescaled version of the ITCV is sometimes called “the unconditional ITCV” (Xu et al., 2019).
To calculate the unconditional ITCV, researchers need to multiply the ITCV (which we label “default ITCV” from now on) by the product of the square root of the residual variances of the focal predictors, X and Y, that are available after controlling for the control variable, C. In formulas:
where
Figure 2 graphically illustrates this formula. The default ITCV quantifies the strength that Q needs to alter inference in residual variance terms (i.e., the area
In practice, the consequences of this rescaling procedure can be substantial. As the unconditional ITCV is necessarily smaller than the default ITCV, comparing the unconditional (rather than the default) ITCV to the impact of a control variable invariably leads to more pessimistic conclusions about the robustness of an inference. For instance, in the empirical example of Table 3, the unconditional ITCV equals .30, whereas the default ITCV equals .44. Only the unconditional ITCV is below the impact of C (.33), correctly suggesting that an omitted variable as impactful as C—that is, Q—would be enough to alter inference and, thus, that omitted variable bias is a major problem in the regression model we previously estimated.
Unconditional ITCV: Practicalities
Computing the unconditional ITCV by hand is straightforward for regression models containing only one control variable. Luckily, this calculation easily generalizes to more realistic scenarios featuring multiple control variables. In this case, the residual variances of X and Y are simply the variances that remain available after modeling all control variables. Formally,
The unconditional ITCV calculation is supported by statistical software, too. In Stata, it can be invoked by typing konfound [varlist], uncond(1) rather than using the default option (note: the unconditional ITCV has not yet been implemented in konfound 0.5.1 available for R at the time of writing, Narvaiz et al., 2024). Note also that, at the time of writing, Stata’s konfound does not calculate
Are the Default and Unconditional ITCVs All That Different in Realistic Empirical Scenarios?
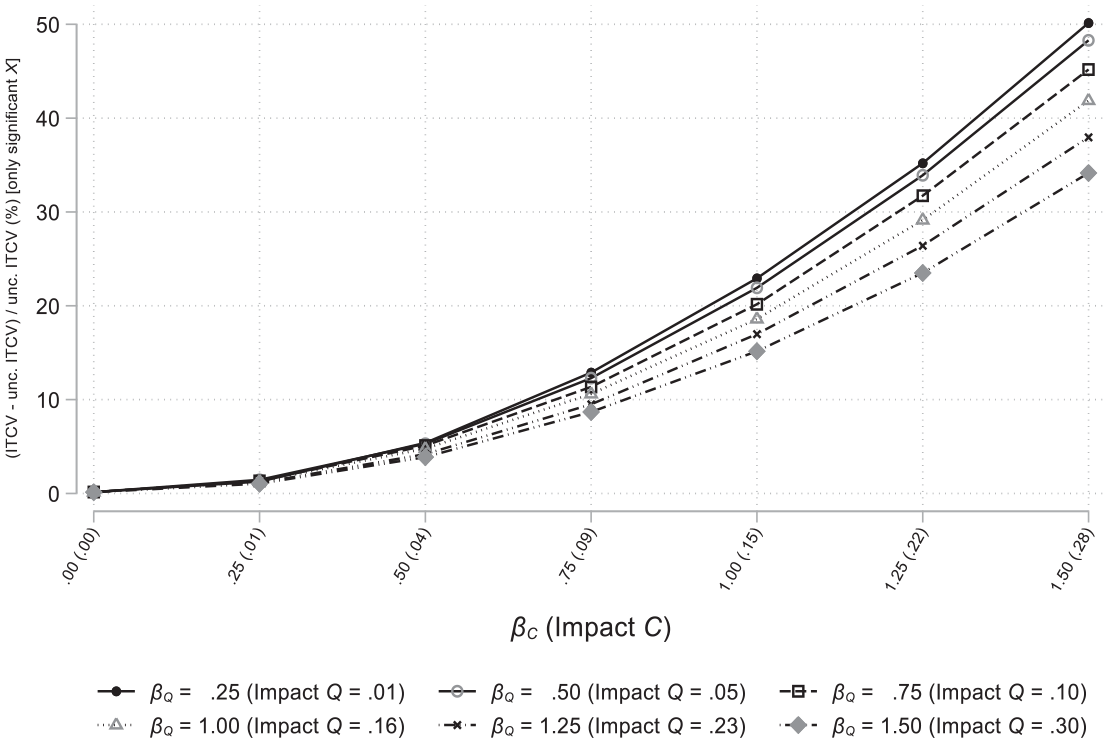
Is the difference between the default and unconditional ITCV a mere methodological detail, or should management researchers expect meaningful differences between the two statistics in applied settings? To answer this question, we design a Monte Carlo simulation following the data-generating process of Figure 1a. 3 Compared to the example in Table 3, we use a smaller sample size (N = 500). We also manipulate the effects of both the omitted and the control variables to produce average observed impacts across conditions bounded between 0 and .34. By doing so, we generate a range of ITCV values in line with the ones published in management studies, ensuring the realism of our simulation (see the review of Busenbark et al., 2022). For a detailed description of the simulation setting, see Supplemental Material C.
We present the simulation results in Figure 3 (note: we analyze only the replications where the estimated effect of X is significantly different from zero, as researchers would report an ITCV only in such cases). As expected, the effect of the omitted variable on X and Y—the main driver of omitted variable bias—has a minor influence over the relative difference between the default and unconditional ITCV. 4 On the contrary, the effect of the control variable plays an important role. While the two ITCV versions are almost identical when the control variable affects X and Y weakly, their difference becomes more consequential for larger effects. For instance, for an effect of the control variable corresponding to an observed impact around .30, the default ITCV can be almost 50% larger than the unconditional one.
Default Versus Unconditional ITCV: Monte Carlo Simulation Results
Should empirical researchers be alarmed by these results? The answer to this question depends on whether we interpret the control variable of our simulation as a single variable, C, or as a combination of multiple variables,
Interpreting the Unconditional ITCV: Extensions
Multiple Omitted Variables
So far, we assumed the existence of only one omitted variable. Yet, this assumption might be overly restrictive. For instance, leader intelligence might not be the only omitted variable biasing the relationship between leadership style and leader effectiveness we considered in our running example. Instead, other unobserved variables at the leader level (e.g., personality traits), contextual factors (e.g., societal culture), follower features (e.g., experience), and organizational characteristics (e.g., firm size) might also be at play. In this case, comparing the unconditional ITCV to a single control variable may be misleading.
To clarify this point, consider a predictor, X, and an outcome, Y, with no causal relationship, a control variable, C, and two omitted variables,
Comparing the ITCV to Control Variable Correlations When Two Omitted Variables Exist
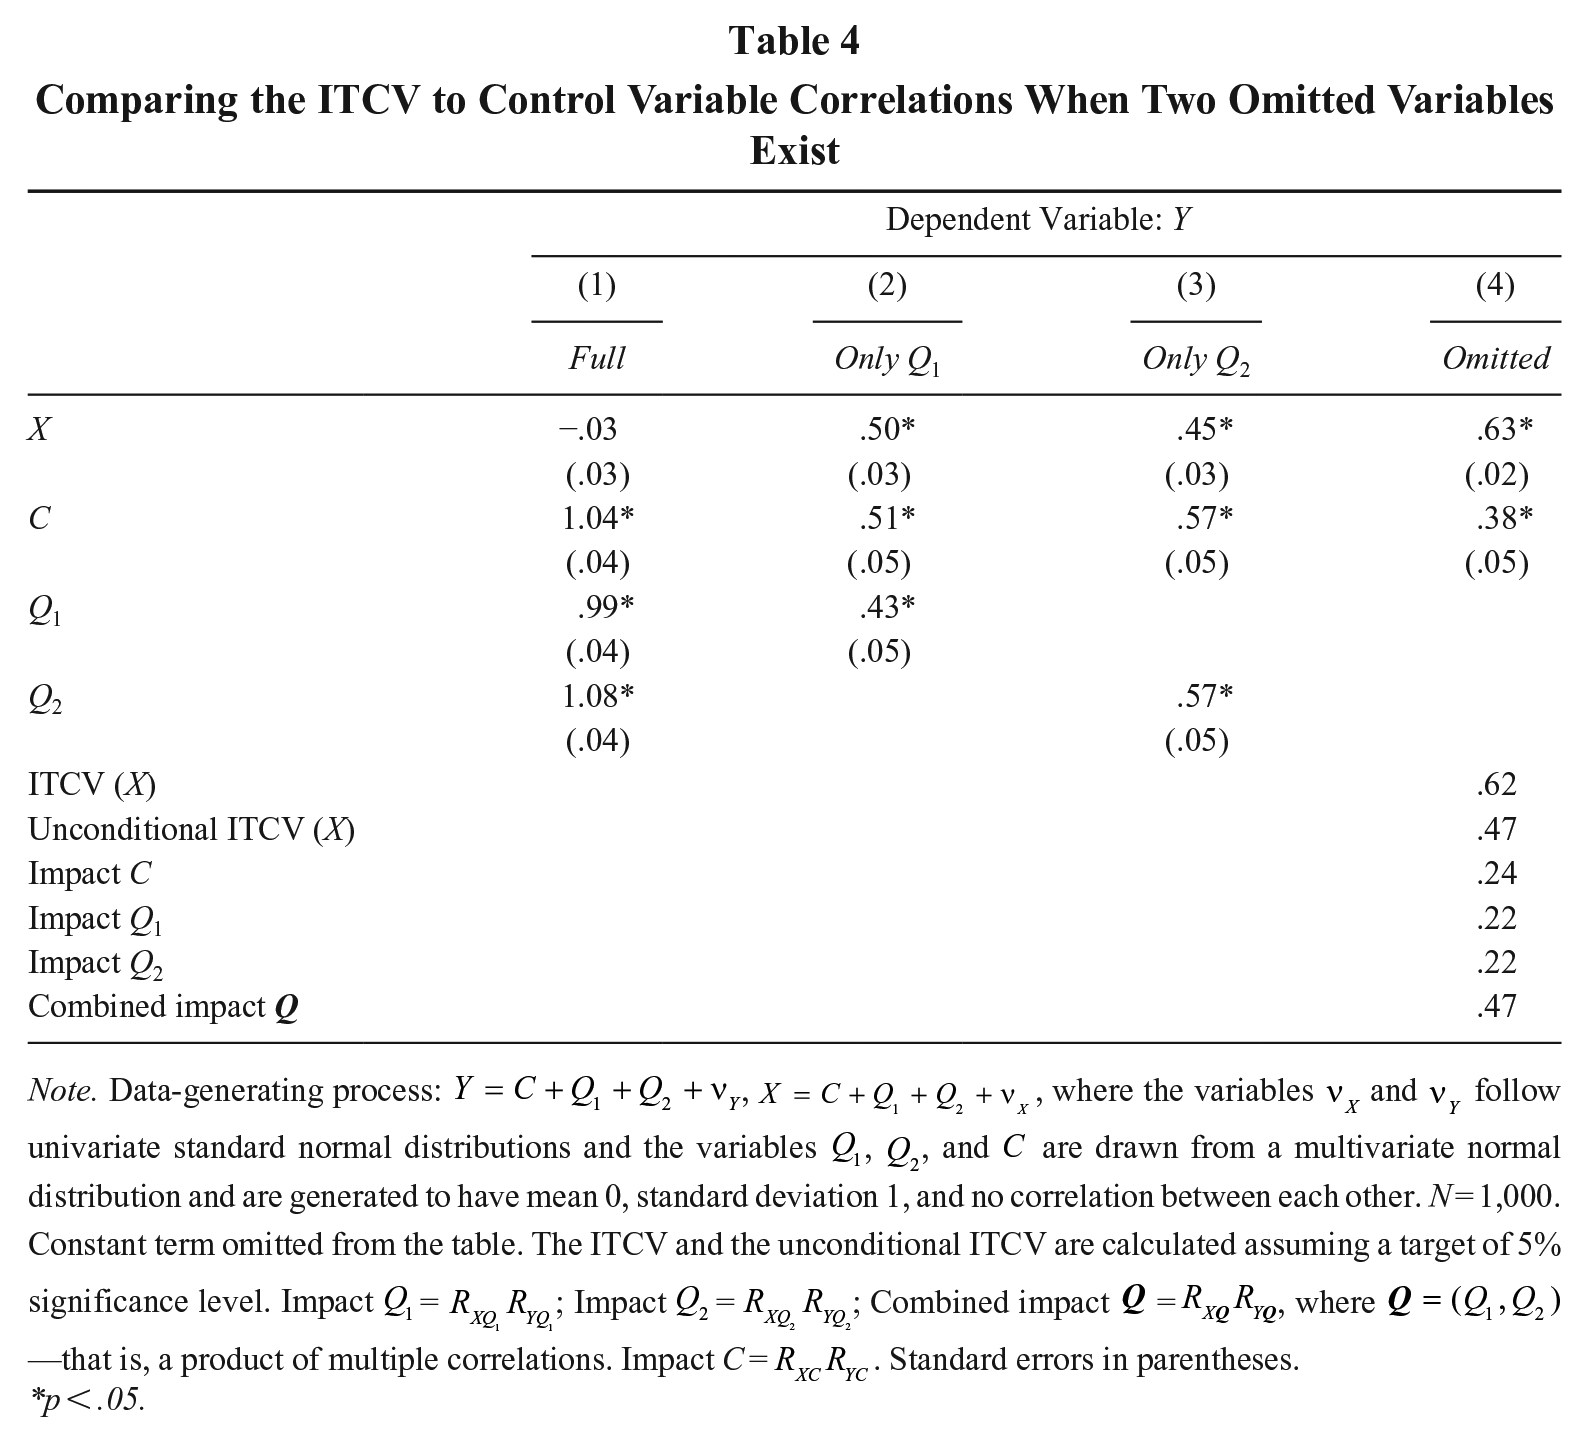
Note. Data-generating process:
p < .05.
Consider a regression model where only C is controlled for. Unsurprisingly, the estimated effect of X is far from the correct null effect (
What is going on here? This mishap has nothing to do with the total versus residual variance issue this time. The unconditional ITCV and the impact of C are perfectly comparable: they share the same scale (i.e., the total variance). The problem is that the unconditional ITCV does not quantify the explanatory power of a single omitted variable anymore. Instead, it measures the explanatory power that—if jointly featured by all omitted variables—would alter inference. Formally, the unconditional ITCV does not represent a product of zero-order correlations but a product of multiple correlations (see Supplemental Material D1; see also Frank, 2000). Therefore, comparing the unconditional ITCV with the impact of a single variable is unfair: the two statistics represent “slices of the same cake,” yet one slice is much bigger than the other (see Figure 4).
ITCV, Unconditional ITCV, and Impact of the Control Variable: Extensions
To better understand the problem, let us consider the example of Table 4. If taken individually, the omitted variables
In sum, this simple example brings about both good and bad news. On the one hand, the unconditional ITCV provides us with a quantitatively correct piece of information about the robustness of an inference irrespective of the number of omitted variables. On the other hand, the unconditional ITCV must be compared with impacts based on combinations of an appropriate number of control variables (or multiples of the same control variable; see Cinelli & Hazlett, 2020; Frank et al., 2023). The problem is that empirical researchers usually do not know how many omitted variables are at play in their setting. In turn, deciding whether to compare the unconditional ITCV to one, two, three, or maybe all control variables included in a regression model can be complex in practice.
Multiple omitted variables: Caveat emptor
As the previous example shows, comparing the unconditional ITCV with single control variables can lead to overly optimistic conclusions about the robustness of an inference. However, one should not over-extrapolate from the previous illustration.
First, the existence of multiple omitted variables might not always have the ill effects shown in Table 4. If the omitted variables correlate strongly and positively with each other, each additional omitted factor will explain a small amount of extra unique variance in X and Y, thereby engendering a limited added bias. In such cases, comparing the unconditional ITCV with single control variable correlations might be approximately fair. Moreover, the presence of multiple omitted variables might have paradoxical results, ending up reducing rather than increasing bias at times (Basu, 2020). In turn, comparing the unconditional ITCV with the correlations exhibited by many control variables might be too conservative, making it more difficult for researchers to (correctly) dismiss omitted variable concerns thanks to the ITCV.
Multiple Control Variables and Partial Correlations
To minimize the risks caused by multiple omitted variables, management researchers often include several control variables in their regression models. In those cases, it may seem sensible to compare the unconditional ITCV to the control variable partial correlations, that is, the correlations exhibited by each control variable conditioned on all other controls (cf. Busenbark et al., 2022; Larcker & Rusticus, 2010). Unfortunately, this intuition is incorrect.
To understand this problem, let us generate two uncorrelated control variables,
Comparing the ITCV to Control Variable Correlations in a Model With Two Uncorrelated Control Variables
Note. Data-generating process:
p < .05.
Unsurprisingly, the omission of Q in estimation leads to a biased estimated effect of X (
Why are partial correlations misleading? The unconditional ITCV represents a product of zero-order correlations. Thus, it correctly measures that an omitted variable explaining roughly 1/4 of the total variance of X and Y could alter inference. On the contrary, the impact of the control variables based on partial correlations is defined over the variance that remains available after modeling the other controls. For instance, the impact of
Multiple control variables and partial correlations: Additional considerations
Two additional points are worth mentioning. First, the impact of a control variable based on partial correlations cannot be directly compared to the default ITCV either (see Busenbark et al., 2021). Both statistics represent partial correlations, yet they condition on different variables. The default ITCV represents a product of correlations conditioned on all control variables. On the contrary, the impact of a control variable based on partial correlations represents a product of correlations conditioned on all other controls. Thus, these two statistics are not defined on the same scale and cannot be directly compared, as is sometimes done in published management articles (see Supplemental Material D2).
Second, the impacts of control variables based on zero-order (rather than partial) correlations remain the conceptually correct benchmark for the unconditional ITCV, even when the control variables correlate with each other. However, researchers need to be careful not to interpret the impacts of the control variables as measures of their causal effects but only as measures of their total explanatory power (for technical details and an empirical example, see Supplemental Material D3).
Correlations Between the Omitted and Control Variables
Let us finally relax the assumption of no correlation between the control and the omitted variable(s). This assumption might be unrealistic in practice, as control variables are normally modeled to reduce the endogeneity of the predictor of interest but are rarely believed to be uncorrelated to the omitted variables (cf. Diegert et al., 2022; Hünermund & Louw, 2023). Consider, for instance, the relationship between the leadership style and leader effectiveness of our running example. Imagine now some researchers who have measured leader personality traits, a potential cause of leadership style and effectiveness (Bono & Judge, 2004). Controlling for these personality traits is probably a good idea to limit omitted variable bias (Wulff et al., 2023), even if some of these traits might correlate—either positively or negatively—with the omitted variables (e.g., intelligence, see Anglim, Dunlop, Wee, Horwood, Wood, & Marty, 2022).
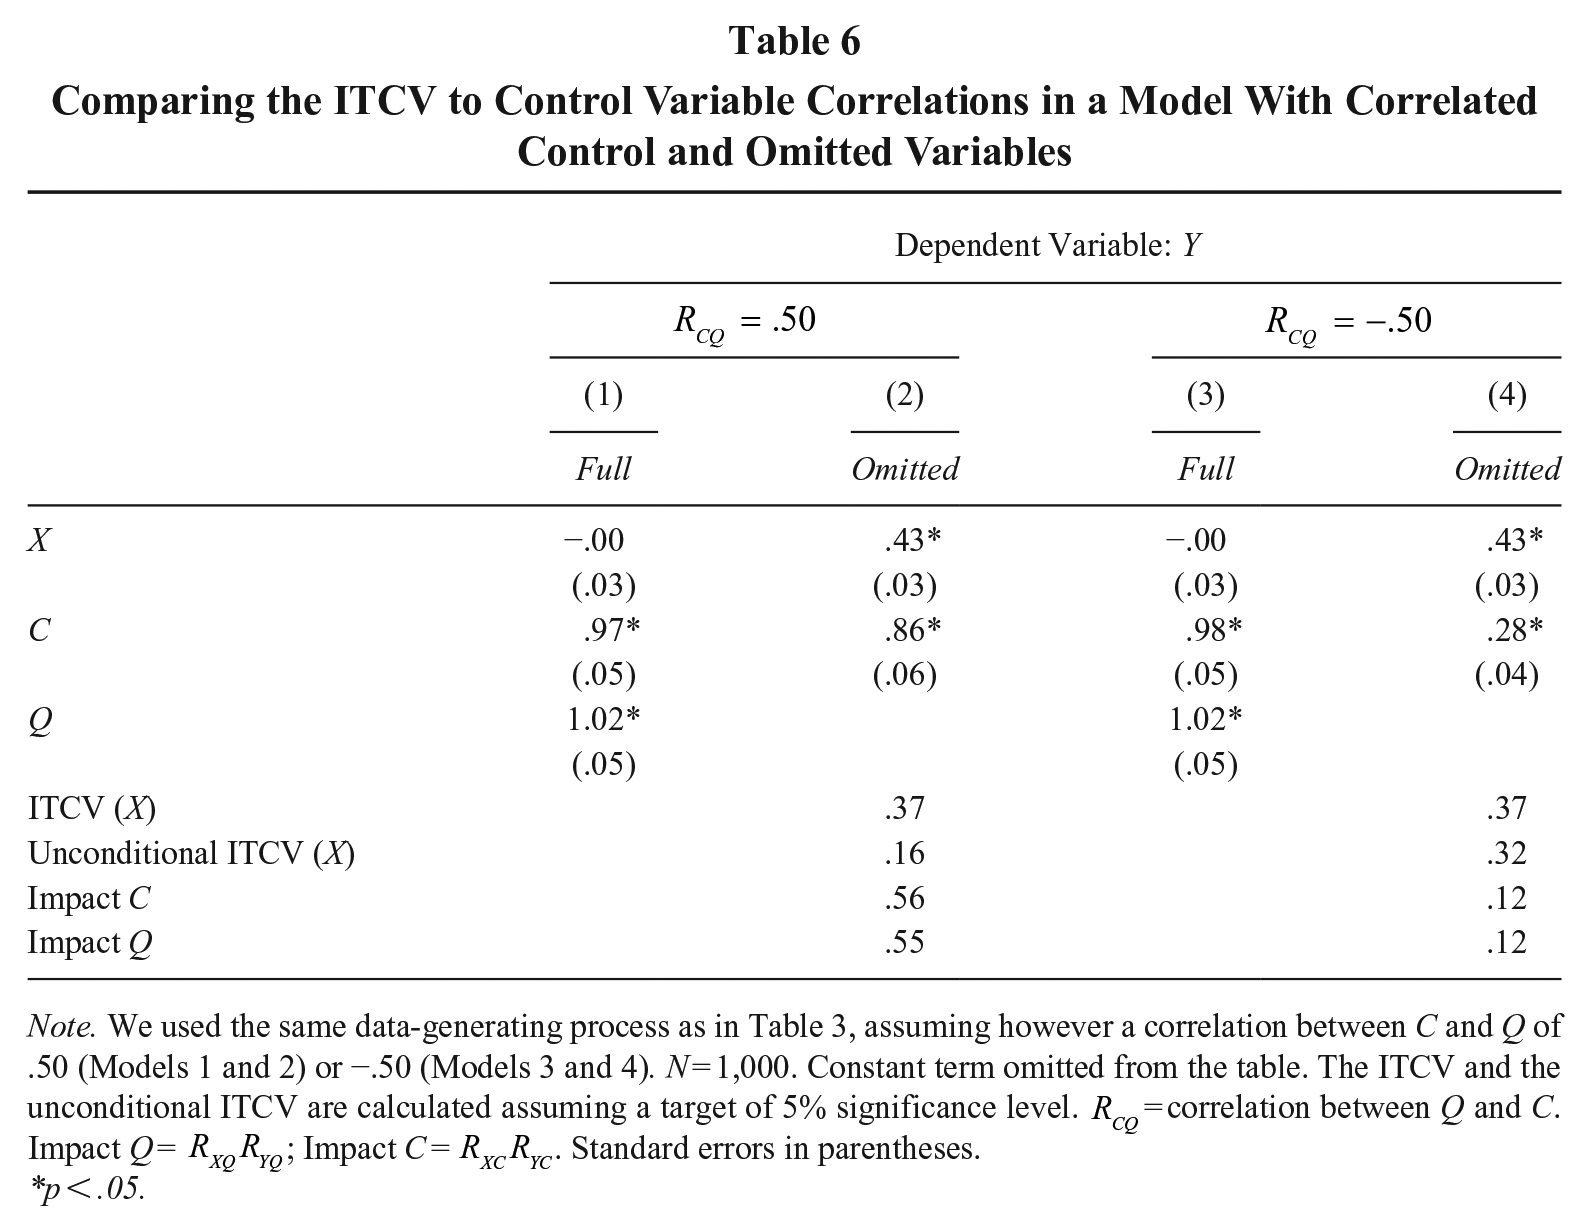
To show how our previous results change when allowing for such correlation, let us again consider a predictor and an outcome with no causal relationship, X and Y, as well as a control variable, C. However, let us specify two different numerical examples. In the first example, we simulate a positive correlation between Q and C of .50. In the second example, we specify a negative correlation of −.50. We again assume that X and Y have no causal relationship and generate Q and C to affect X and Y in the same way. We sample 1,000 observations from this data-generating process (see the note to Table 6).
Comparing the ITCV to Control Variable Correlations in a Model With Correlated Control and Omitted Variables
Note. We used the same data-generating process as in Table 3, assuming however a correlation between C and Q of .50 (Models 1 and 2) or −.50 (Models 3 and 4). N = 1,000. Constant term omitted from the table. The ITCV and the unconditional ITCV are calculated assuming a target of 5% significance level.
p < .05.
Unsurprisingly, omitting Q in estimation leads to a biased effect of X, irrespective of the sign of the C-Q correlation (
What is happening here? The mishap stems from the C-Q correlation, which breaks the link between partial and zero-order correlations we use to rescale the default ITCV in total variance terms (Frank, 2018). The problem is that, as soon as Q and C share some variance, part of the explanatory power of Q on Y and X gets erroneously attributed to C (i.e., a classic omitted variable bias problem). As a result, the unconditional ITCV (i.e.,
Consider the empirical example of Table 6. When C and Q correlate negatively, part of the variance explained by Q is “deducted” from C, thus decreasing the observed explanatory power of C compared to the zero C-Q correlation case. This smaller explanatory power increases the residual variance of X and Y, pushing the unconditional ITCV upwards. As a result, the comparison between the unconditional ITCV and the control variable’s correlations is overly liberal, overshooting the true impact of Q and understating omitted variable bias concerns. On the contrary, in the positive C-Q correlation case, part of the variance explained by Q is “incorporated” by C, thus increasing the observed explanatory power of C compared to the zero C-Q correlation case. The residual variance decreases, pushing the unconditional ITCV downwards. Hence, the comparison between the unconditional ITCV and the impact of C is overly conservative, undershooting the true impact of Q and, ultimately, overstating omitted variable bias concerns.
Correlations between the omitted and control variables: What to do, then?
The previous example underlines some challenges for the unconditional ITCV. In practice, however, the severity of these difficulties depends on the specifics of the empirical setting at hand.
First, the unconditional ITCV might remain practically informative if the correlations between control and omitted variables are smaller than in Table 6. In such cases, the explanatory power of the control variable will not be strongly affected by the omitted variable, influencing the unconditional ITCV only to a small extent. Second, the unconditional ITCV will tend to overstate omitted variable bias concerns (i.e., it will be conservative) if the correlation between control and omitted variables is positive. This scenario is probably realistic in many empirical applications, as it can be hard to imagine an omitted variable that positively affects X and Y yet correlates strongly and negatively with the control variable (or, equivalently, that negatively affects X and Y yet correlates positively with C).
Finally, researchers can revert to the default ITCV when they fear considerable correlations between omitted and control variables. The default ITCV is expressed in residual variance terms. As such, it is unaffected by the correlations between control and omitted variables. Thus, while researchers still cannot compare the default ITCV directly to the impacts of the control variables, they can tentatively use it to reason in an absolute sense about the robustness of an inference. 7
ITCV and Control Variable Correlations in the Wild
To showcase how our results apply to practice, we re-examine the results of Piazzai and Wijnberg (2019) published in Strategic Management Journal. We emphasize that our reanalysis has a merely pedagogical purpose and focuses only on a portion of the hypotheses and models of Piazzai and Wijnberg. As such, our goal is not to reappraise or criticize the authors’ conclusions. Instead, we merely illustrate how different ways of interpreting the ITCV and comparing it with control variables can lead to substantively different conclusions in applied scenarios.
Data and Methods
Piazzai and Wijnberg (2019) study oligopolist behaviors in a peculiar sector: The recording industry. Specifically, their first hypothesis suggests that when an oligopolist (i.e., a major record label) engages in product proliferation in a focal sector (i.e., it releases many new singles in a musical style), the rival oligopolists who are also operating in other sectors will tend to reduce their production in the focal sector (i.e., singles released). This idea builds on a game-theoretic argument suggesting that proliferation acts as a threat to the rivals.
The authors test this hypothesis by regressing the variable Own Singles (i.e., amount of singles released by a major in a musical style-year) on Proliferation (i.e., maximum amount of singles introduced by a rival in a musical style in the year before), as well as on several control variables (e.g., total number of singles released within the style-year by major or non-major companies, major performance based on Billboard charts) and year, genre, and major indicators. In a sample of more than 6,000 major-style-years in the U.S. recording industry from 2004 to 2014, they find a positive effect of Proliferation on Own Singles (average marginal effect = .01, p < .001, see Model 3, Table 2).
To replicate this result, we first downloaded Piazzai and Wijnberg’s (2019) dataset available at https://github.com/piazzai/smj-18-19552 under an MIT license. We do, however, deviate from their original analysis. Specifically, instead of relying on a quasi-Poisson generalized linear model with normal standard errors, we estimate a simpler OLS using log(1 + Own Singles) as a dependent variable. While such transformation should normally be avoided (Silva & Tenreyro, 2006; Villadsen & Wulff, 2021), it produces a virtually identical marginal effect of Proliferation as the Poisson regression in this case (.01, p < .001), and also makes it possible to compute the unconditional ITCV (which requires calculating R-squares).
Assessing Omitted Variable Bias
To quantify the fragility of the estimated effect of Proliferation, we compute the ITCV using a 10% alpha level. Let us first consider the conclusions one would draw when benchmarking the default ITCV against the impact of the control variables calculated using partial correlations. The default ITCV is .02, which is smaller than the impact of the strongest control variable, Demand (i.e., variance in demand in each style-year, impact .04). However, the ITCV is roughly on par with the impact of several other important controls, like Major Singles (i.e., total number of products introduced within the style-year by all majors, impact .02). These comparisons, thus, provide some confidence that the results are somewhat robust to omitted variable bias, at least under the assumption that the control variables represent important determinants of Proliferation and Own Singles.
However, relying on the unconditional ITCV and zero-order correlations returns much less optimistic results. First, the unconditional ITCV (.01) is smaller than the default ITCV. This difference comes as no surprise. The control variables modeled by Piazzai and Wijnberg (2019) explain 64% of the variance in Proliferation and 40% in Own Singles, thus considerably reducing the variance that an omitted variable could potentially explain. Second, the impact of most control variables based on zero-order correlations is drastically larger than the ones based on partial ones, given that some controls correlate strongly with each other (sometimes in the .50–.60 range). For instance, the zero-order impact of Demand (.30) is around 26 times larger than the unconditional ITCV, suggesting that an omitted variable with only 4% of the impact of Demand would be enough to overturn the results.
Instead of looking only at one control variable at the time, we could consider a benchmark for an omitted variable having the combined explanatory power of more than one control, for instance, Demand and Major Singles. At the time of writing, konfound does not support the calculation of this combined benchmark. However, this calculation is straightforward, requiring multiplying the
Empirical Conclusions
Our analysis shows the practical differences between various ways of interpreting the ITCV. Comparing the default ITCV to the control variables’ impacts based on partial correlations—a widespread yet formally incorrect practice—suggests that the causal relationship between Proliferation and Own Singles is relatively robust. Yet, contrasting the unconditional ITCV with impacts based on zero-order correlations returns less optimistic conclusions, implying that the estimates are hardly causally interpretable. Considering the combined impact of two control variables reinforces this pessimism.
Is this good or bad news? The ITCV does not allow conclusively answering this question per se; however, it permits engaging in a principled discussion about omitted variable bias. If researchers can convincingly argue that the remaining omitted variables—once combined—are far from as strong as the impact of any of the included control variables, they might read the estimated link between Proliferation and Own Singles as causal. Given the rich regression specification of Piazzai and Wijnberg (2019) and the strong correlations of the control variables they modeled, this conclusion might be defensible. Such a deduction could be strengthened if one is also ready to assume—and reasonably so, we would argue—that the unconditional ITCV exaggerates omitted variable concerns because the omitted variables correlate positively with the modeled controls. However, such an optimistic conclusion remains inherently unverifiable. It is, thus, up to authors, reviewers, and readers to carefully evaluate it thanks to theory, subject-matter expertise, and previously published empirical evidence.
Discussion
Our results highlight several subtleties related to the interpretation of the ITCV. A succinct way to summarize our findings is as follows. The default ITCV commonly reported by management researchers does not represent the minimum total strength a single omitted variable needs to disrupt inference. Instead, it characterizes the combined strength that all existing omitted variables must have—conditioned on all modeled control variables—to alter inference. Therefore, comparing the default ITCV to control variable correlations is inappropriate—a result well-understood in statistics (Cinelli & Hazlett, 2020) yet generally overlooked in management studies. 8 We thus invite abandoning the use of rules of thumb based on the ITCV and control variables, encourage a reconsideration of published results relying on them, and offer several alternative guidelines on how to run, report, and interpret the ITCV in a more principled way (see Table 1 for a summary of our recommendations).
Recommendations for Empirical Researchers
#1. Do not compare the default ITCV with control variable correlations
Our paper clarifies that the default ITCV and control variable correlations are measured on different scales. Thus, we recommend not comparing the default ITCV with (partial or zero-order) correlations exhibited by control variables to probe the robustness of an inference to omitted variable bias.
#2. Prefer comparisons between the unconditional ITCV and zero-order correlations
While our findings cast some doubts on how the ITCV is customarily interpreted in management studies, they do not imply that the ITCV is misleading per se, or that benchmarking it against control variable correlations is an inherently flawed intuition. However, for such a comparison to be sensible, some caution is required. First, we suggest relying on the unconditional ITCV—a rescaled ITCV that adjusts for the variance explained by the control variables—for example, uncond(1) option with konfound in Stata. Alternatively, we advise using sensitivity statistics that do so by default (Cinelli & Hazlett, 2020), or turning to alternative frameworks for sensitivity analysis (e.g., Robustness of Inference to Replacement, see Frank, Maroulis, Duong, & Kelcey, 2013). Moreover, we suggest comparing the unconditional ITCV to control variable zero-order (rather than partial) correlations.
Following our suggestion might have significant implications in practice. For instance, consider the recent literature review of Busenbark et al. (2022). This article concludes that “the causal inferences of most empirical relationships are unlikely biased from an omitted variable” (p. 32), after finding that management studies report impacts of the control variables that are generally lower than the default ITCV implied by the studied relationships. Our results suggest that this conclusion is premature, as the considerable difference between the controls’ impacts and the ITCV documented by Busenbark et al. may be an artifact of the failure to adjust for the residual variance explained by the control variables.
#3. Motivate the choice of the control variables used as benchmarks for the unconditional ITCV
Before comparing the unconditional ITCV to control variable correlations, researchers need to justify—both with statistical evidence and conceptual arguments—why the control variables used as benchmarks are important “observable omitted variables” in the first place. Failure to do so might mean comparing the unconditional ITCV to weak benchmarks, and giving false confidence in the robustness of one’s results.
Worse, failure to follow this suggestion might create perverse incentives for the researchers, including modeling control variables not to reduce omitted variable bias but rather to pass some rules of thumb based on the ITCV and control variable correlations (cf. Cinelli & Hazlett, 2020). This grim scenario might seem overly pessimistic, yet similar practices—like p-hacking, HARKing, and selective reporting—exist both in the social and the natural sciences (e.g., Brodeur, Cook, & Heyes, 2020; Head, Holman, Lanfear, Kahn, & Jennions, 2015; Murphy & Aguinis, 2019). Against this backdrop, researchers should justify both the inclusion of control variables in a regression model and their use as benchmarks for the ITCV (e.g., Hünermund & Louw, 2023; Li, 2021; Mändli & Rönkkö, 2023; Wysocki, Lawson, & Rhemtulla, 2022).
#4. Motivate the number of variables used as benchmarks for the unconditional ITCV
Researchers should openly discuss the number of variables used as a benchmark for the unconditional ITCV. Using only one control variable is intuitive but is valid only if one omitted variable exists. Such an assumption risks being nothing short of heroic in many empirical scenarios in management, wherein researchers often have a limited understanding of why workers, teams, or entire companies get “assigned” to a specific value of the predictor. Thus, we recommend also using combinations of different control variables to “stress test” the robustness of one’s estimates (see our empirical illustration or Equation 13, Frank et al., 2023).
On the flip side, we also recommend avoiding excesses of caution. In well-controlled regressions, comparing the ITCV to a combination of a couple of theoretically and empirically impactful control variables (or a single categorical variable with several levels) might be enough. On the contrary, relying on a combination of all right-hand side variables might be heavy-handed, especially in regressions with fixed effects or lagged dependent variables. 9
#5. Do not trust blindly the comparison between unconditional ITCV and control variable correlations, either
While valuable, the unconditional ITCV is no panacea. When control and omitted variables are correlated, comparing the unconditional ITCV with control variable correlations can be either too conservative or too lenient. We thus discourage a “too precise” assessment of the ITCV size. Instead, we invite researchers to either compare the unconditional ITCV with control variable correlations with much care or interpret the default ITCV without referring to control variables.
#6. Do not use the ITCV to conclude that omitted variable bias is either “significant” or “non-significant.”
The ITCV (both in its default and unconditional version) is not a statistical test with an asymptotic distribution and a rejection region. Thus, interpreting the ITCV or its comparison with control variable correlations as “tests for omitted variable bias” is simply incorrect. Instead, the ITCV provides quantitative evidence for empirically grounded deliberations about the plausibility of unobserved confounding. Such deliberations are inherently unverifiable and tentative, yet can be guided by theory, literature, and subject-matter expertise.
#7. Do not use the ITCV as a substitute for clear causal identification strategies
Our last—and most important—recommendation is simple: Sensitivity analyses like the ITCV do not absolve researchers from trying to solve omitted variable bias ex-ante (Cinelli & Hazlett, 2020; Diegert et al., 2022; Frank et al., 2023; Wulff et al., 2023). Think about two extreme scenarios. In one case, researchers analyze cross-sectional data obtained from a survey, wherein participants rate both the outcome and the predictor of interest, and the only control variables are the respondent gender, age, and tenure in the organization. In the second scenario, researchers analyze data from a natural experiment where the main predictor is as-if randomized (by nature, a law, or some unexpected events; see Sieweke & Santoni, 2020). Both teams of authors find that it would take an omitted variable with a correlation of .30 with both outcome and predictor to invalidate their inferences. Both teams find that the control variables’ impacts are nowhere near the (unconditional) ITCV. Which result would the reader trust the most?
The natural experiment is most certainly the more credible alternative. Therefore, the ITCVs found in these two scenarios should be interpreted differently. In the natural experiment, this sensitivity value is probably good news—it is hard to think of an omitted variable that correlates at .30 with a plausibly randomized predictor. Conversely, the same sensitivity value cannot be interpreted with the same optimism in the survey study. In this case, multiple omitted variables might exist both at the individual level and at the context level, and they might also emerge from methodological artifacts (e.g., common method variance; Antonakis et al., 2010; Podsakoff, MacKenzie, & Podsakoff, 2012). In turn, it seems possible that these multiple unobserved variables might be strong enough to overcome any ITCV and disrupt the researchers’ results.
Ultimately, a large ITCV merely indicates that an estimated coefficient is large and statistically significant. A sizable ITCV is, thus, good news only if the researchers controlled for the most impactful “potential omitted variables” in the first place. In other words, the ITCV can only complement—but not substitute—causal identification strategies based on a solid knowledge of the empirical setting at hand, some plausibly exogenous variation (i.e., natural experiments; see, for example, Flammer, 2015; Lonati, 2020), and principled statistical modeling (e.g., longitudinal models with fixed effects and time-varying controls, propensity score weighting; see Antonakis, Bastardoz, & Rönkkö, 2021; Narita, Tena, & Detotto, 2023).
Limitations and Future Research Opportunities
In closing, we acknowledge that, like any research effort, our work has some limitations. First, while we presented several examples in which comparing the ITCV with the control variables’ correlations leads to incorrect conclusions, we have discussed only a fraction of all possible parameterizations and causal structures that might emerge in applied settings. We thus hope that future research will investigate if and how the comparison between the ITCV and control variable correlations might perform when, for instance, altering the positioning or number of the variables involved in the causal structure, adding other control variables, changing the sign of the correlations we considered, or altering the effect sizes in our numerical examples.
Second, this paper focused on OLS regressions containing only main effects—the type of models for which the ITCV was formally developed (see Frank, 2000; Seltzer, Kim, & Frank, 2006). Yet, management researchers often work with moderated effects, nonlinear models (e.g., logit, Poisson), and longitudinal/hierarchical data. Moreover, empirical studies customarily estimate heteroskedasticity- and cluster-robust standard errors, whereas we only focused on normal ones. We hope future research will formally examine these additional cases, exploring whether our results and recommendations are generalizable.
Third, our paper focused on scenarios with no causal effects in the population, wherein researchers risk committing a Type I error when relying on the default ITCV and control variable correlations. Yet, future research could reverse the lenses, thereby exploring settings where a causal effect exists in the population, yet rules of thumb based on the ITCV and control variables might flag a significant estimated effect as problematic.
Fourth, our paper focused only on the ITCV, yet future methodological work could also explore the merits and limits of other tools for sensitivity analysis (for a review see, for example, Kawabata, Tilling, Groenwold, & Hughes, 2023), like sensemakr (Cinelli, Ferwerda, & Hazlett, 2020; Cinelli & Hazlett, 2020), the E-value (VanderWeele & Ding, 2017), or the recently proposed regsensitivity (Diegert et al., 2022). Future research could also focus on the Robustness of Inference to Replacement (i.e., another sensitivity analysis reported by the konfound program/package; Frank et al., 2013), investigating whether the issues we described in this paper could be avoided by benchmarking the Robustness of Inference to Replacement (rather than the ITCV) against control variables (Busenbark et al., 2021).
Last, we hope that future research will help management scholars to expand their methodological toolkit beyond sensitivity analyses for omitted variable bias (see Frake, Gibbs, Goldfarb, Hiraiwa, Starr, & Yamaguchi, 2023), introducing our field to sensitivity analyses for causal mediation (e.g., Imai, Keele, & Tingley, 2010; Lin, Nuttall, Zhang, & Frank, 2023), instrumental variable estimation (see, for example, Clarke & Matta, 2018), and difference-in-differences estimation (e.g., Rambachan & Roth, 2023). We are confident that a principled use of these tools will help empirical management research grow even more robust.
Conclusion
Hic sunt dracones. This sentence—an anachronism translatable as “here be dragons”—echoes the practice of drawing dragons and other monstrous creatures on ancient maps, to mark uncharted areas thought to be fraught with dangers. While management scholars are lucky not to encounter such dangerous beasts in their daily activities, they must nonetheless face their own “dragon”—omitted variable bias. To fight against this invisible danger, management researchers have increasingly turned to simple rules of thumb based on the Impact Threshold of a Confounding Variable (ITCV) and control variable correlations. Despite their intuitive appeal, such rules of thumb can be misleading, hiding their own unforeseen and unexplored “dragons.” In this paper, we begin to chart these dangers, suggesting that researchers abandon these practices. We also sketch an alternative roadmap both for researchers interested in using the ITCV in applied settings and for future methodological work. Rest assured, much remains to be explored. Still, we hope our paper will help management scholars fight against omitted variable bias with a new impulse and rigor.
Supplemental Material
sj-docx-1-jom-10.1177_01492063241293126 – Supplemental material for Hic Sunt Dracones: On the Risks of Comparing the ITCV With Control Variable Correlations
Supplemental material, sj-docx-1-jom-10.1177_01492063241293126 for Hic Sunt Dracones: On the Risks of Comparing the ITCV With Control Variable Correlations by Sirio Lonati and Jesper N. Wulff in Journal of Management
Footnotes
Acknowledgements
We thank John Antonakis, Kenneth Frank, Mikko Rönkkö, and the seminar participants of the Econometrics and Business Statistics Seminar at Aarhus BSS, Causal Data Science Meeting (2022), and Academy of Management Annual Meetings in Boston (2023) and Chicago (2024) for comments, suggestions, and helpful discussions. We also thank two anonymous referees and the Associate Editor for their detailed and constructive written comments.
Data Availability Statement
Supplemental material for this article is available with the manuscript on the JOM website.
Notes
References
Supplementary Material
Please find the following supplemental material available below.
For Open Access articles published under a Creative Commons License, all supplemental material carries the same license as the article it is associated with.
For non-Open Access articles published, all supplemental material carries a non-exclusive license, and permission requests for re-use of supplemental material or any part of supplemental material shall be sent directly to the copyright owner as specified in the copyright notice associated with the article.