
Abstract
Over the recent years, two perspectives on control variable use have emerged in management research: the first originates largely from within the management discipline and argues to remain frugal, to use control variables as sparsely as possible. The second is rooted in econometrics textbooks and argues to be prolific, to be generous in control variable inclusion to not risk omitted variable bias, and because including irrelevant exogenous variables has little consequences for regression results. We present two reviews showing that the frugal perspective is becoming increasingly popular in research practice, while the prolific perspective has received little explicit attention. We summarize both perspectives’ key arguments and test their specific recommendations in three Monte Carlo simulations. Our results challenge the two recommendations of the frugal perspective of “omitting impotent controls” and “avoiding proxies” but show the detrimental effects of including endogenous controls (bad controls). We recommend considering the control variable selection problem from the perspective of endogeneity and selecting controls based on theory using causal graphs instead of focusing on the many or few questions.
Introduction
Control variables are critically important for making causal claims in non-experimental management research and can be useful for increasing the precision and statistical power of experimental studies (Deaton & Cartwright, 2018; Hernández et al., 2004). 1 Controls should be chosen based on existing theory to rule out alternative explanations. But how should controls be chosen when this theoretical guidance is not clear? Should researchers “when in doubt, leave them out” (Carlson & Wu, 2012, p. 413) or “err on the side of caution by including more than fewer control variables” (Antonakis et al., 2010, p. 1092)? Recently, two distinct perspectives have emerged: the frugal perspective holds that if a researcher is not sure about whether a control variable should be included in a model, it should be left out (e.g., Atinc et al., 2012; Bernerth et al., 2018; Bernerth & Aguinis, 2016; Carlson & Wu, 2012). In contrast, the prolific perspective emphasizes that more controls are better than too few (Antonakis et al., 2010) as this reduces the probability of omitted variable bias.
The frugal perspective originates from Becker (2005) and is often summarized by the phrase “When in doubt, leave them out,” coined by Carlson and Wu (2012, p. 413). While this perspective is presented in many guideline-type articles (Becker et al., 2016; O’Neill et al., 2014; Schjoedt & Bird, 2014) within the management discipline, it seems mostly absent in the broader research methods literature. In contrast, the prolific perspective builds on the econometric concept of irrelevant regressors and the proof that including such variables will not bias regression coefficients (Wooldridge, 2013, p. 88). This perspective is also advocated in some general research methods texts. For example, Singleton and Straits (2018) recommend that “Circumstances seldom allow to control for all variables; researchers attempt to control the effects of as many as possible. The greater the number of variables that are controlled without altering a relationship, the greater the likelihood that the relationship is not spurious.” (p. 102).
The two perspectives have been noted in the literature (Bernerth et al., 2018, p. 154; Green et al., 2016, p. 422), but thus far, their merits have yet to be analyzed. This is what we do. Both perspectives largely agree that control variable selection is important, should be based on theory, and reporting should be more transparent. However, they differ in the overall recommendation on how liberally control variables should be included. The frugal perspective also proposes empirical rules that we argue are problematic. After introducing the perspectives, we show through two systematic reviews that the frugal perspective is getting more popular and that the prolific perspective has seldom been explicitly applied in management research. After that, we assess three specific empirical rules with a set of Monte-Carlo simulations. We find that dropping “impotent controls” and “avoiding proxies” can bias estimates, whereas including irrelevant variables has few negative consequences. We conclude that control variables should be chosen solely based on theory, and the empirical rules should be abandoned.
Control Variables in Management Research
Management research should make causal claims as they are important for society (Antonakis et al., 2010). This is challenging because causality cannot be observed directly (Hitchcock, 2010; Jaccard & Jacoby, 2020, pp. 153–154) but can only be inferred indirectly using appropriate research designs. To claim causality, researchers must demonstrate (a) an association between the assumed cause and effect, (b) the direction of influence, and (c) the elimination of alternative explanations (Antonakis et al., 2010; Singleton & Straits, 2018, Chapter 4). The third step is the hardest part. Experiments where rival explanations are eliminated by randomization are considered the gold standard (Antonakis et al., 2010; Heckman, 2008), but they are often costly or infeasible (Cameron & Trivedi, 2005, p. 96). Consequently, statistical models (e.g., regression) that use control variables to account for alternative explanations have become the dominant strategy in management research. Next, we describe the two perspectives on control variable selection.
The Prolific Perspective to Control Variable Inclusion
The main idea of the prolific perspective is that controls should be used liberally to prevent omitted variable bias. This is repeated in multiple econometrics books. For example, Cameron and Trivedi (2005, p. 93) state that “Too many regressors cause little harm, but too few regressors can lead to inconsistency,” Greene (2012, p. 178) says that “Omitting variables from the equation seems generally to be the worse of the two errors,” and there are many similar examples (e.g., Berry & Feldman, 1985, pp. 21–22; Schroeder et al., 2017, p. 71; Zax, 2011, p. 465). However, in the recent literature on control variables in management research, the prolific perspective has received little attention. The only explicit recommendation we found in the management literature is to “err on the side of caution by including more than fewer control variables” by Antonakis and coauthors (2010, p. 1092).
The prolific perspective has three main recommendations: (a) omitted variable bias should be avoided by including relevant controls, (b) inclusion of irrelevant controls has little negative consequences, but (c) overcontrolling by including endogenous controls should be avoided.
The recommendation related to omitted variables is straightforward: if a control variable is a cause of the dependent variable and is correlated with at least one of the independent variables, omitting the control has been proven to create endogeneity in the model, biasing estimates (Wooldridge, 2013, p. 88). Because omitted variable bias is a severe threat to inference, control variables that are causes of the dependent variable and correlated with the independent variables should be included.
There is also little harm in including irrelevant controls, which do not affect the dependent variable (Basu, 2020, p. 211). More specifically, the prolific perspective states that while irrelevant variables can reduce efficiency (precision of estimates; Wooldridge, 2013, sec. 2.5), “reduced efficiency […] is a cheap price to pay when consistency is at stake” (Antonakis et al., 2010, p. 1092). This is supported by the proof (Cameron & Trivedi, 2005, p. 93; Wooldridge, 2013, p. 87, Theorem 3.1) that estimates remain unbiased when irrelevant variables are included in a model. Thus, if there are potentially relevant control variables, it is safer to include them in the model; at worst, they turn out irrelevant. It is essential to add that in the econometrics literature, the concept of “irrelevant regressor” itself is applied to exogenous variables only (Wooldridge, 2013, p. 88). 2
Notably, econometrists do not recommend a “kitchen sink” (Greene, 2012, p. 179) perspective toward control variable use, where control variables would be wildly included in a model to prevent bias at all costs (Wooldridge, 2013, p. 88). For example, if a control variable is a mediator on a causal path, then (over-)controlling for this variable biases estimates of the total causal effect (Li, 2021) because it is endogenous (Antonakis et al., 2010, p. 1090). This part overlaps with the frugal perspective's recommendation of being cautious about controlling for potential endogenous variables, but it is featured a lot less prominently.
The prolific perspective can be summarized along the lines of Wooldridge (2013, pp. 98–99) as a trade-off between bias and variance: control variables that are potential omitted variables should be included to prevent inconsistent and biased estimates. The consequence of such inclusion is reduced efficiency, which can be mitigated by increasing sample size.
The Frugal Perspective to Control Variable Inclusion
Many recent guidelines (Aguinis & Vandenberg, 2014; Becker et al., 2016; O’Neill et al., 2014; Schjoedt & Bird, 2014) warn about including too many controls in models. This advice comes in two forms: (a) reasons to be cautious with including controls generally and (b) specific recommendations or rules for when controls should be left out.
Reasons to be Cautious With Controls
Perhaps the most intuitively appealing reason to be cautious with controls is the claim that “a model including control variables is no longer investigating the relationship between a predictor and a criterion, but rather the relationship between a new residual predictor and the criterion” (Bernerth & Aguinis, 2016, p. 231). This point can be illustrated with Venn diagrams (Breaugh, 2008), where a circle represents the total variance of each variable, and overlapping areas of the circles represent shared variance (or squared semipartial correlations; Cohen et al., 2003, sec. 3.3.2). In the left panel of Figure 1, the area a indicates the shared variance between the dependent variable Y and the focal predictor X. In the right panel, including a control C eliminates the shared variance that overlaps with the predictor (d), the dependent variable (c), and what they share (b), thus allowing us to estimate the unique shared variance (a) between X and Y. The key concerns in the frugal perspective are that the interpretation of X changes by using statistical control or that by including more controls, there is no variance left to explain as the size of area (a) reduces.
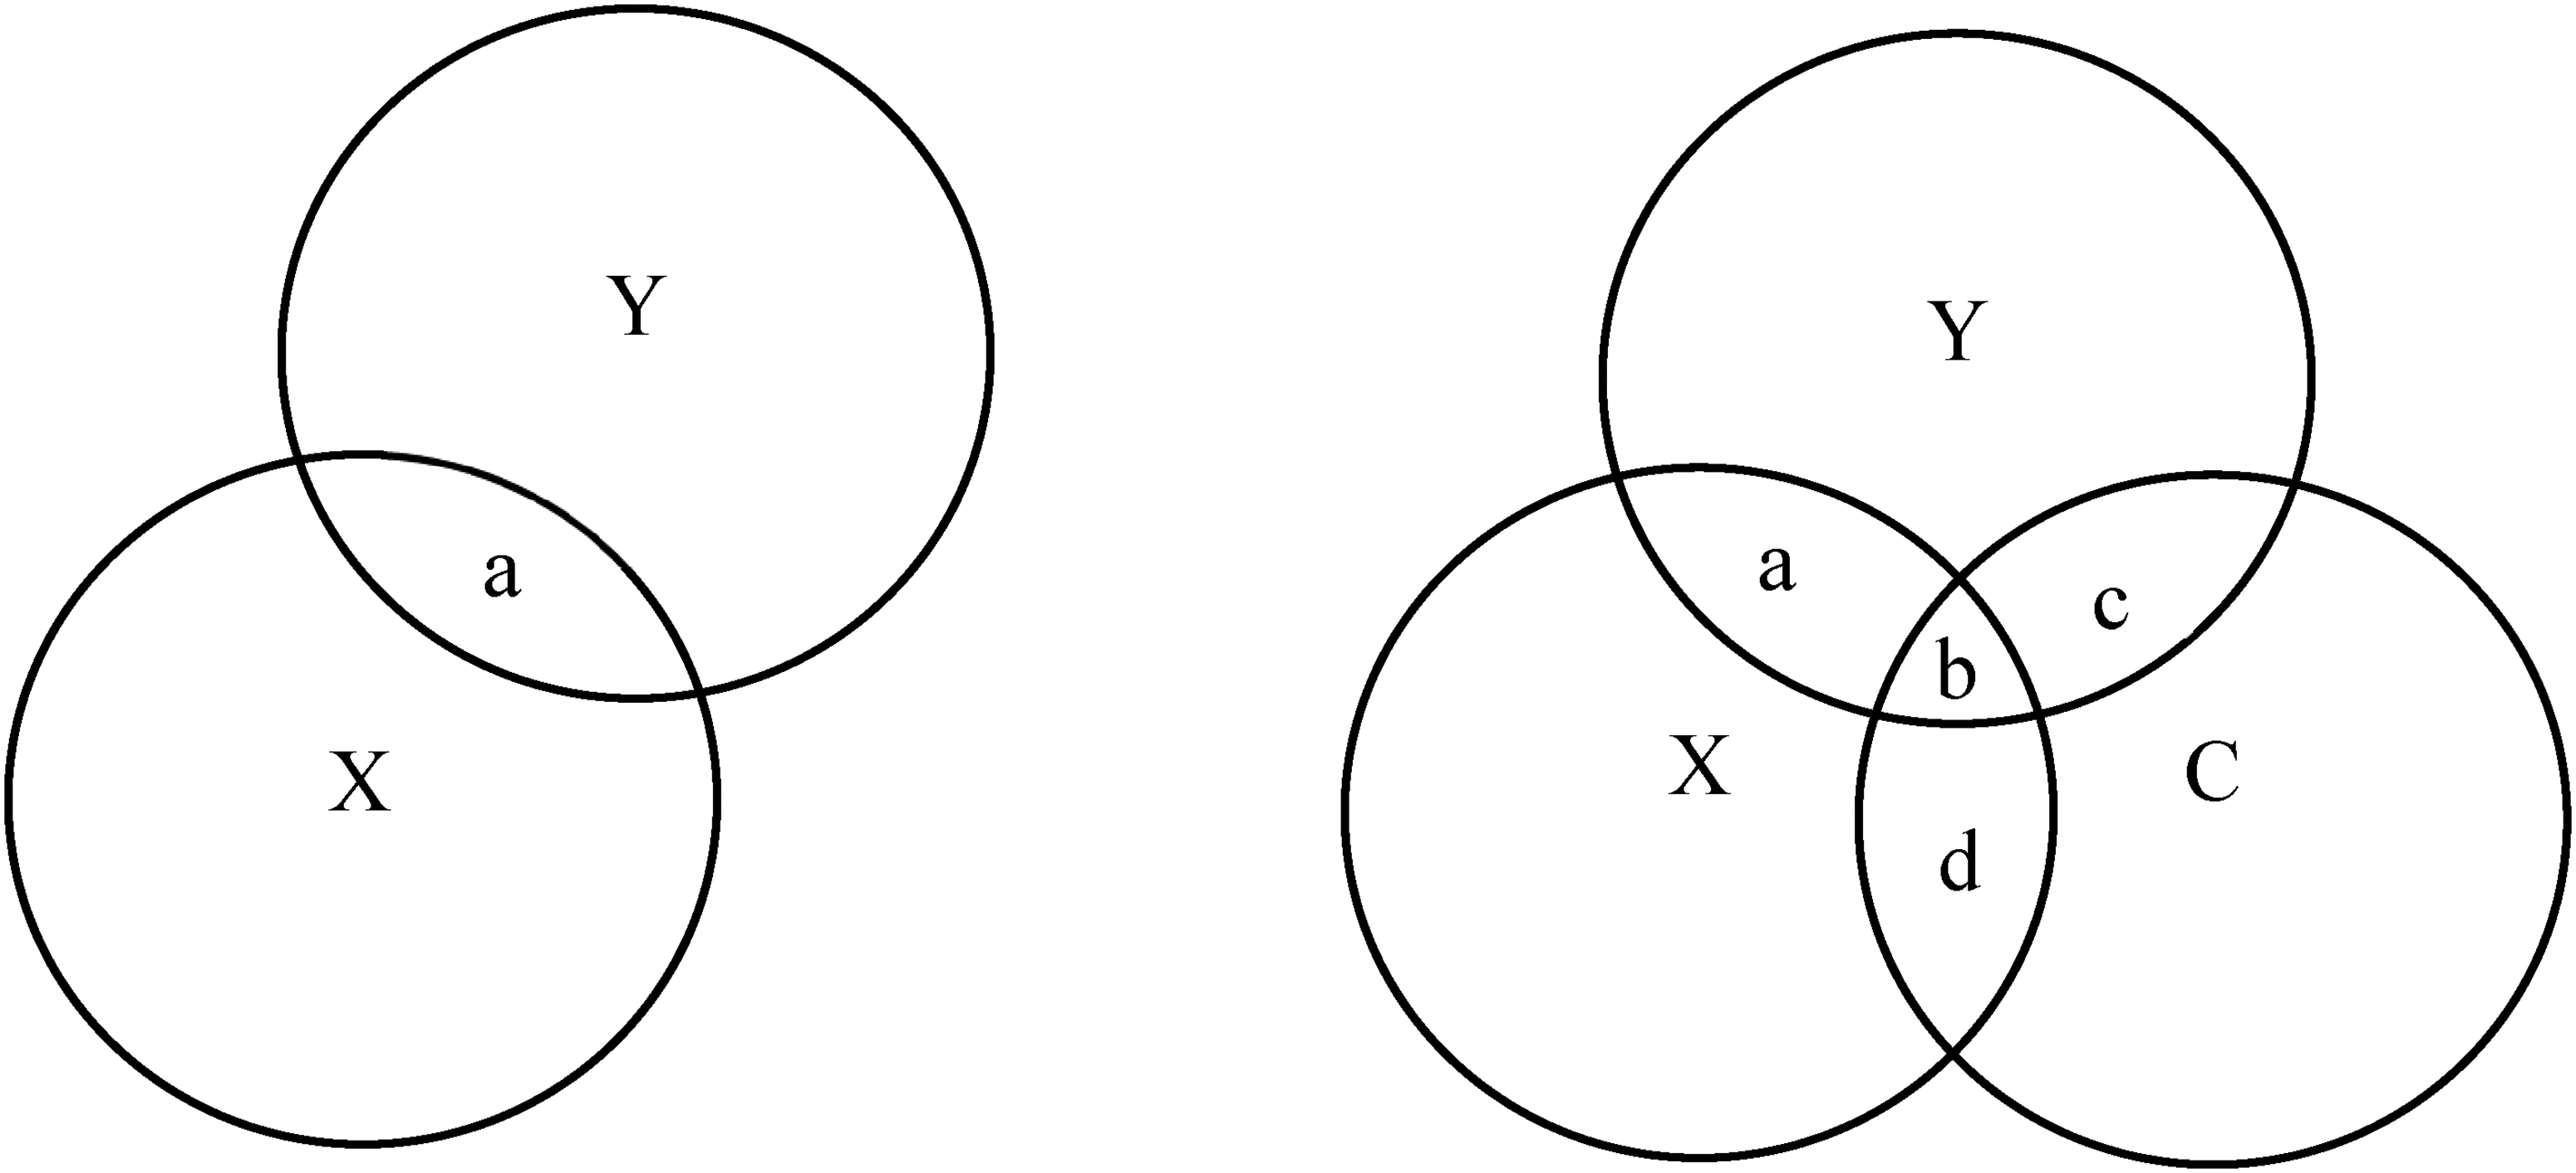
Venn diagrams explaining the shared variance between the independent (X) and dependent variable (Y), without and with a control variable (C). When controlling for C, the unique shared variance (a) between the independent (X) and the dependent variable (Y) decreases by (b).
The residual argument is technically correct but leads to an incorrect conclusion in this case: the core idea of regression analysis is that it enables to “keep other factors fixed” (Wooldridge, 2013, p. 77) by removing their variation from the analysis (Greene, 2012, p. 76). For example, suppose our primary variable of interest is CEO gender, and we wanted to study its effect on firm performance. If CEO gender correlates with industry and industry also affects firm performance, this produces a spurious correlation that needs to be controlled to claim a causal effect of CEO gender on firm performance. Controlling for industry, we estimate the effect of CEO gender on firm performance as if all firms were in the same industry. That is, we eliminate all between industry variance from both CEO gender and firm performance.
To understand why reducing variance this way is not a problem for interpretation, we can compare regression against other approaches for reducing variation, such as using matched samples or sampling just from a single industry (Morgan & Winship, 2007, Chapter 4). If regression assumptions hold (e.g., the effect does not vary between industries), controlling for industry is equivalent to reducing variation by studying just one industry or doing the same through matched samples (Morgan & Winship, 2007, sec. 5.3). Thus, arguing that statistical controlling changes the meaning of the variables would logically imply that the same applies when variance is reduced by sampling, which is not the case. Indeed, regardless of how it is done, be it with control variables, matching, or sampling, reducing variance due to extraneous factors is a solid research design principle (Singleton & Straits, 2018, pp. 36–39, 89, 101–102).
A related concern is that statistical adjustments create “fictional people.” This concern was raised by Breaugh (2008), who claims that this limits generalizability, citing Meehl (1970). However, Meehl (1970) did not argue that creating “fictional people,” which he uses as a less formal term for counterfactuals (p. 401), would be a problem or limit generalizability. Instead, he argues that causal inferences rest on their proper construction. 3 Counterfactuals are not a problem, and in fact, the current literature on causal analysis (Huntington-Klein, 2022; Morgan & Winship, 2007; Pearl, 2012) rests on them. That is, a causal effect is defined as a comparison between two potential outcomes, one in which a case received a treatment and another where the same case was not treated. Because we observe each case only as treated or untreated, one of the two potential outcomes is observed, and the other remains a counterfactual (“fictional person”) that must be estimated.
Breaugh (2008) further claims, citing Meehl (1970), that controlling for correlating variables would decrease real-world generalizability (p. 290). It is difficult to see how this conclusion would follow from Meehl's work, and it is not generally true. Consider the CEO gender example we discuss above. In this context, one might ask if it makes sense to try to separate the effects of CEO gender and industry, given that the two variables are correlated in practice. The answer to this is yes: firm boards would want to know the effect of hiring a female CEO holding industry constant because firms rarely switch CEO and industry at the same time. That is, it often makes sense to assume that some variables do not change because they are not a part of the decision that a firm, policy maker, or leader typically would take. In our example, controlling for the industry is a safe bet because the CEO gender effect is a within-firm effect, and firms rarely change their industry classifications, making the industry an exogenous variable. However, this does not mean that any variable is safe to control, an issue that we return to later.
Another concern relates to the precision of estimates. Becker et al. (2016) urge to remain cautious because “including large numbers of [control variables] reduces degrees of freedom, […] this will increase standard errors and potentially decrease the power of the test for a given independent variable” (p. 159). This is incorrect in two different ways. First, the variance of the regression estimates depends only on the total sample variation of the independent variables, error variance, and correlation between the independent variables (Wooldridge, 2013, Theorem 3.2) 4 and not on degrees of freedom. Second, adding controls can also decrease standard errors and increase statistical power by reducing error variance. This is why controls are often used in experiments (Deaton & Cartwright, 2018; Hernández et al., 2004).
The mechanism through which control variables can make estimates less precise is multicollinearity, which is also sometimes mentioned in this context (e.g., Nielsen & Raswant, 2018). This means that when control variables are highly correlated with the focal variables, it is challenging to identify which part of the total variance is explained by the focal variables and which part is explained by the control variables, decreasing the precision of the estimates (Greene, 2012, p. 130) and thus reducing statistical power. While omitting such controls would solve this problem, it also introduces omitted variable bias. Instead, if possible, researchers should increase precision by increasing sample size (Greene, 2012, p. 131; Wooldridge, 2013, pp. 94–98). 5
A final argument for being cautious about control variables relates to endogenous or bad controls. Bad controls (or confounders), contrary to good controls (or deconfounders), are control variables that bring estimates further away from their true population value (thus increasing bias) when included (Cinelli et al., 2022). A control variable is endogenous or bad if it depends on an independent variable of interest, the dependent variable, or shares an unobserved cause with the dependent variable (Angrist & Pischke, 2009, sec. 3.2.3; Antonakis et al., 2010; Cinelli et al., 2022). Becker et al. (2016, p. 159) refer to this as the uncertain association between control and other variables in a model. Although not explicitly discussing endogenous or bad controls, they mention that using controls could lead to spurious associations. Indeed, as Spector and Brannick (2011) discussed, adding an endogenous control into the model would bias estimates, and hence, such variables should not be used.
We give examples of bad controls to illustrate the point. Judge and Cable (2004) study the effects of height and future earnings and, among other things, control for weight. This is a bad idea because weight depends on height, making weight an endogenous control that compromises causal inference. Indeed, the effect of taller people earning more while holding their weight constant would not be a height effect but a combination of height and body composition effects (Breaugh, 2008). Another typical example of bad control is controlling for a mediator (Hünermund et al., 2024; Wysocki et al., 2022). Mediators are variables that lie in the causal path of the overall effect examined, thus mediating the relationship. For instance, Hull and Rothenberg (2008) examine the effect of innovation and corporate social performance on firm performance, controlling for sales. However, it is likely that increasing sales is one of the primary mechanisms through which new products can affect profitability and should not be controlled. Similarly, suppose we want to study the overall causal effects of leader–member exchange on employee performance. In that case, we probably should not control for employee's job satisfaction because this, too, is a likely mechanism. In these two cases, we would ask how much product innovation affects profitability if it does not affect sales and how much leader–member exchange quality affects employee productivity if it does not affect satisfaction. Both questions would be illogical if the overall causal effect is of interest (see also Wooldridge, 2013, pp. 205–206).
An important exception to the bad control rule is that if we want to study a specific causal mechanism instead of overall causal effects, we need to control for mediators to rule out other potential alternative mechanisms. For example, to understand how sales as a mediator affect the relationship between product innovation and profitability, we would have to control the level of competition and product quality (e.g., Cho & Pucik, 2005; Roberts, 1999). Similarly, to determine the mediating effect of employee satisfaction in the association amid leader–member exchange and employee productivity, we would have to rule out alternative mediators such as organizational commitment or role clarity (Martin et al., 2016).
Specific Recommendations to Leave Out Control Variables
Beyond the general recommendations to exercise caution when including controls, the frugal perspective also provides three specific recommendations: avoiding impotent controls, avoiding proxies, and running results with and without control variables, which we discuss next.
A control is said to be “impotent” when it has “little or no relationship with the [dependent variable] (e.g., |r|<.10)” (Becker et al., 2016, p. 160) and the specific recommendation is that such controls should be dropped. This recommendation is problematic because the correlation between two variables is a sum of a possible causal relationship and any spurious influences (Cohen et al., 2003, Chapter 12). That is, in a model with two predictors, the correlation between control C and dependent variable Y depends on the correlation between control C and the focal variable X as well as their standardized regression coefficients

Comparison of Four Scenarios that Produce Impotent or Irrelevant Controls.
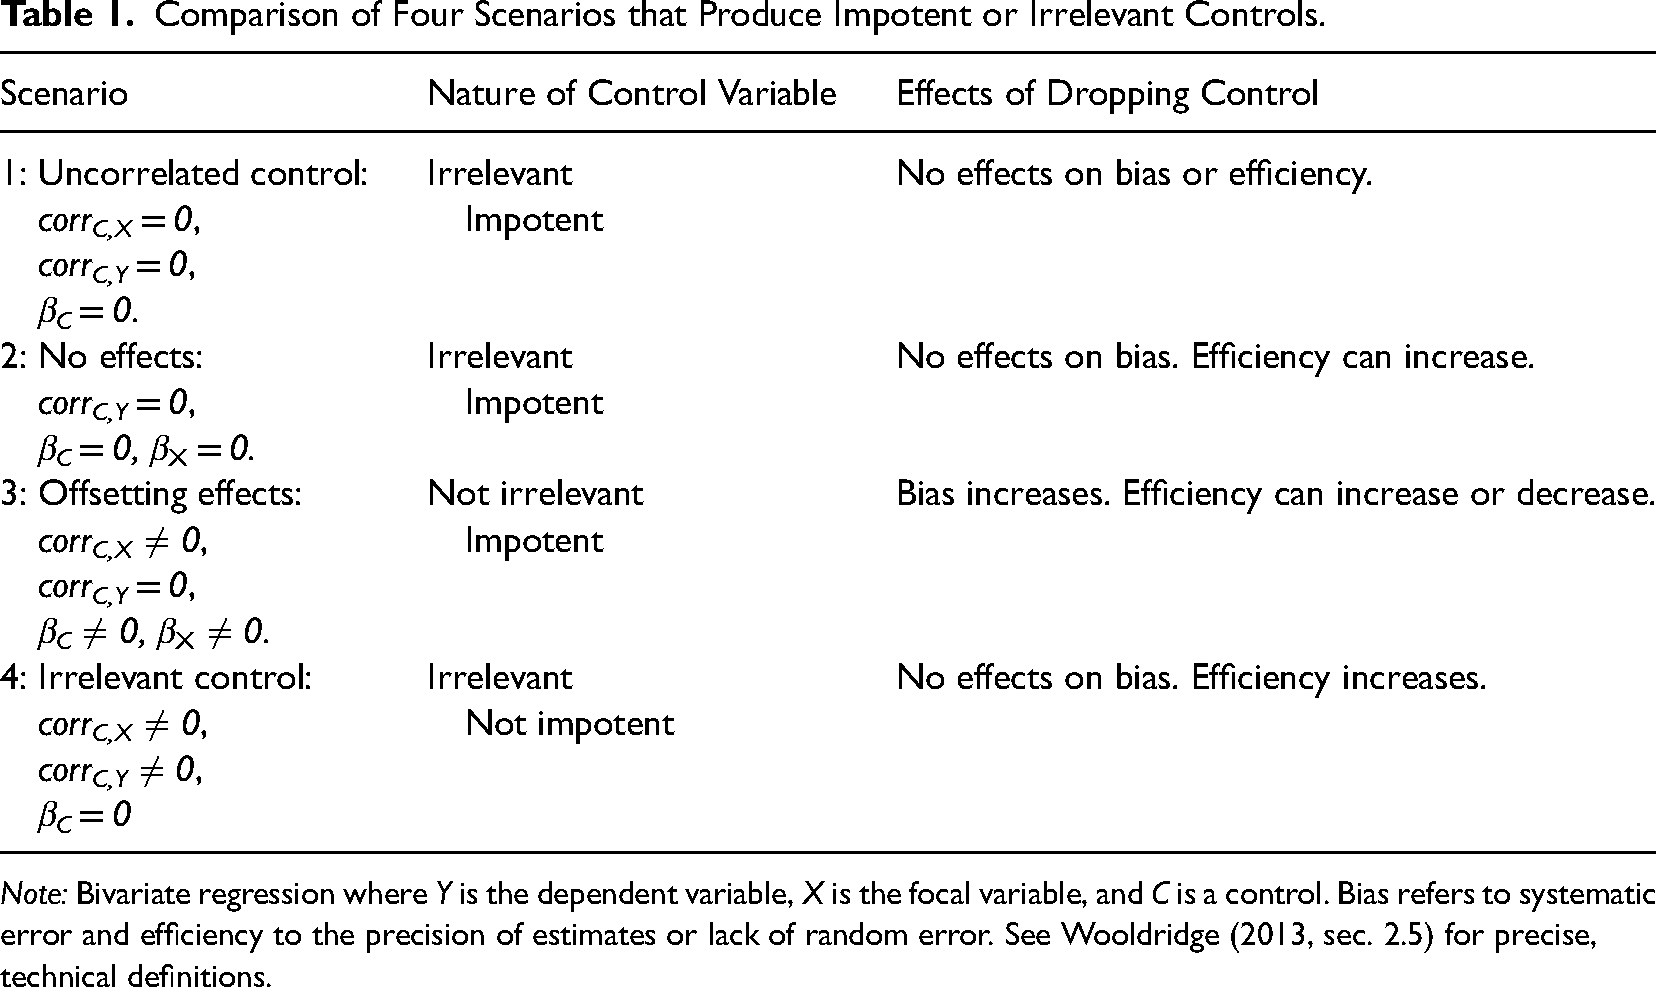
Note: Bivariate regression where Y is the dependent variable, X is the focal variable, and C is a control. Bias refers to systematic error and efficiency to the precision of estimates or lack of random error. See Wooldridge (2013, sec. 2.5) for precise, technical definitions.
The effects of dropping impotent controls differ from those of dropping irrelevant controls. As explained in the section on the prolific perspective, the omission or inclusion of irrelevant variables does not affect the bias of regression estimates. However, it may affect their efficiency (i.e., precision of estimates). In Scenario 1 in Table 1, there is no effect on efficiency, as neither the variance of error term nor the correlation between the independent variables is affected, and these are the only mechanisms through which efficiency can be affected (Wooldridge, 2013, Theorem 3.2). In Scenario 2, efficiency will increase if X and C are correlated, but it is of little use because there is no effect to be detected. In Scenario 3, sometimes called the classical suppression effect (Friedman & Wall, 2005; Lewis & Escobar, 1986; Smith et al., 1992), the causal effect of X and the spurious correlation due to C offset each other. Because C influences Y, its omission would lead to omitted variable bias. Scenario 4 is a typical example of irrelevant controls where excluding the control can be helpful to increase precision and statistical power (e.g., Wooldridge, 2013, p. 88). However, in this case, the control is not impotent and would be kept in the model if the impotent control rule was followed. To summarize, Table 1 shows that the “dropping impotent control” rule is either useless (Scenarios 1 and 2) or harmful (Scenario 3) and would not lead to dropping controls when it provides a benefit (Scenario 4).
We use an example of employee tardiness, conscientiousness, and distance to work (Becker et al., 2016, p. 160), to show that omitting an impotent control variable can bias regression estimates. Consider the following setup where the units are standard deviations:
One unit increase in home's distance from work increases tardiness by one unit. More conscientious workers tend to live further from work so that conscientiousness and distance from work correlate at 0.5. A one-unit increase in conscientiousness decreases tardiness by two units.
Suppose that we are interested in whether employee conscientiousness affects tardiness and use distance to work as a control. In this scenario, distance from work is an impotent control because the effect of distance on tardiness (+1) is completely canceled out by the effect of more conscientious workers living further from work (−2 × 0.5 = −1). However, because the distance to work has an effect, omitting it from the analysis would lead us to incorrectly conclude that the effect of one additional unit of consciousness decreases tardiness by one and a half units instead of two units. As this example shows, the relevant criterion is not whether a control correlates with the dependent variable but whether it has a causal effect.
The second specific recommendation is that proxies should be avoided (Becker et al., 2016; Spector & Brannick, 2011). A proxy variable approximates a variable that researchers would like to control for but cannot observe directly (Greene, 2012, sec. 8.5.3). For example, patent data, product launches, and surveys among managers have all been used as proxies for innovativeness (Jensen & Webster, 2009), or sales, assets, or market value as proxies for firm size (Al-Khazali & Zoubi, 2005). Some examples from textbooks include years of schooling as a proxy for education or IQ as a proxy for ability or intelligence (Greene, 2012, pp. 221, 242; Wooldridge, 2010, p. 68).
The idea that proxies can be problematic was introduced to the control variable literature by Breaugh (2008), who explained that “The problem with controlling for proxy variables is that a researcher almost never knows the strength of the relationship between a proxy variable and the underlying causal variable. Thus, the researcher cannot determine to what extent he or she has controlled for the nuisance variable of interest.” (p. 291). Becker et al. (2016) further point out that using proxies can lead to problems also “because the proxy might relate to other variables in a way that the CV of interest does not” and thus “controlling for the proxy may control for a host of unintended variables that have substantive effects that the researcher does not wish to remove” (p. 161).
We use an example from Greene (2012, p. 243) to discuss proxies. Consider estimating the effects of education on earnings, but instead of education, we measure years of schooling:
The third recommendation is that regressions should be reported with and without control variables to assess the robustness of results and the impact of control variables on the results (e.g., Becker et al., 2016; Bernerth et al., 2018; Carlson & Wu, 2012), and if results are the same, report the results without control variables (Becker, 2005). While this practice might be helpful in some cases, there are many other cases where the causal effect of variables is not estimated correctly if control variables are not included (Sturman et al., 2022). If a researcher trusts a control variable should be in the model, it does not make sense to report results without it because this increases the risk of omitted variable bias.
In short, the frugal perspective claims that control variables partial out variance, potentially change the interpretation of the variables, reduce available degrees of freedom, and there is a risk of including endogenous or bad controls leading to spurious associations. Because researchers can rarely be sure that a control would not cause any problems, they should follow the guideline “When in doubt, leave them out!” (Becker et al., 2016, p. 158). This is complemented by the specific recommendations for not using control variables that are either “impotent” or proxies and reporting results with and without control variables.
The Impact of the Frugal and Prolific Perspectives on Empirical Literature
To understand the impact that the two perspectives have had on the management literature, we did two systematic reviews. The first review is a citation analysis investigating the frugal perspective's popularity over time. Doing the same for the prolific perspective was not possible because this perspective has no central source(s). 6 Instead, we use a second systematic review to compare the relative impact of both perspectives in management research.
Literature Analysis 1: The Frugal Perspective Over Time
The origin of the frugal perspective is Becker's (2005) work, and we therefore started by reviewing all articles that cite this article or any of the other guidelines extending this work (Aguinis & Vandenberg, 2014; Becker, 2005; Becker et al., 2016; Bernerth et al., 2018; Carlson & Wu, 2012; O’Neill et al., 2014; Schjoedt & Bird, 2014). Using ISI Web of Science, we found 1,589 articles between 2006 and 2021, where at least one of these seven sources was cited. Figure 2 presents these articles over time, showing that the frugal perspective has gained significant traction.
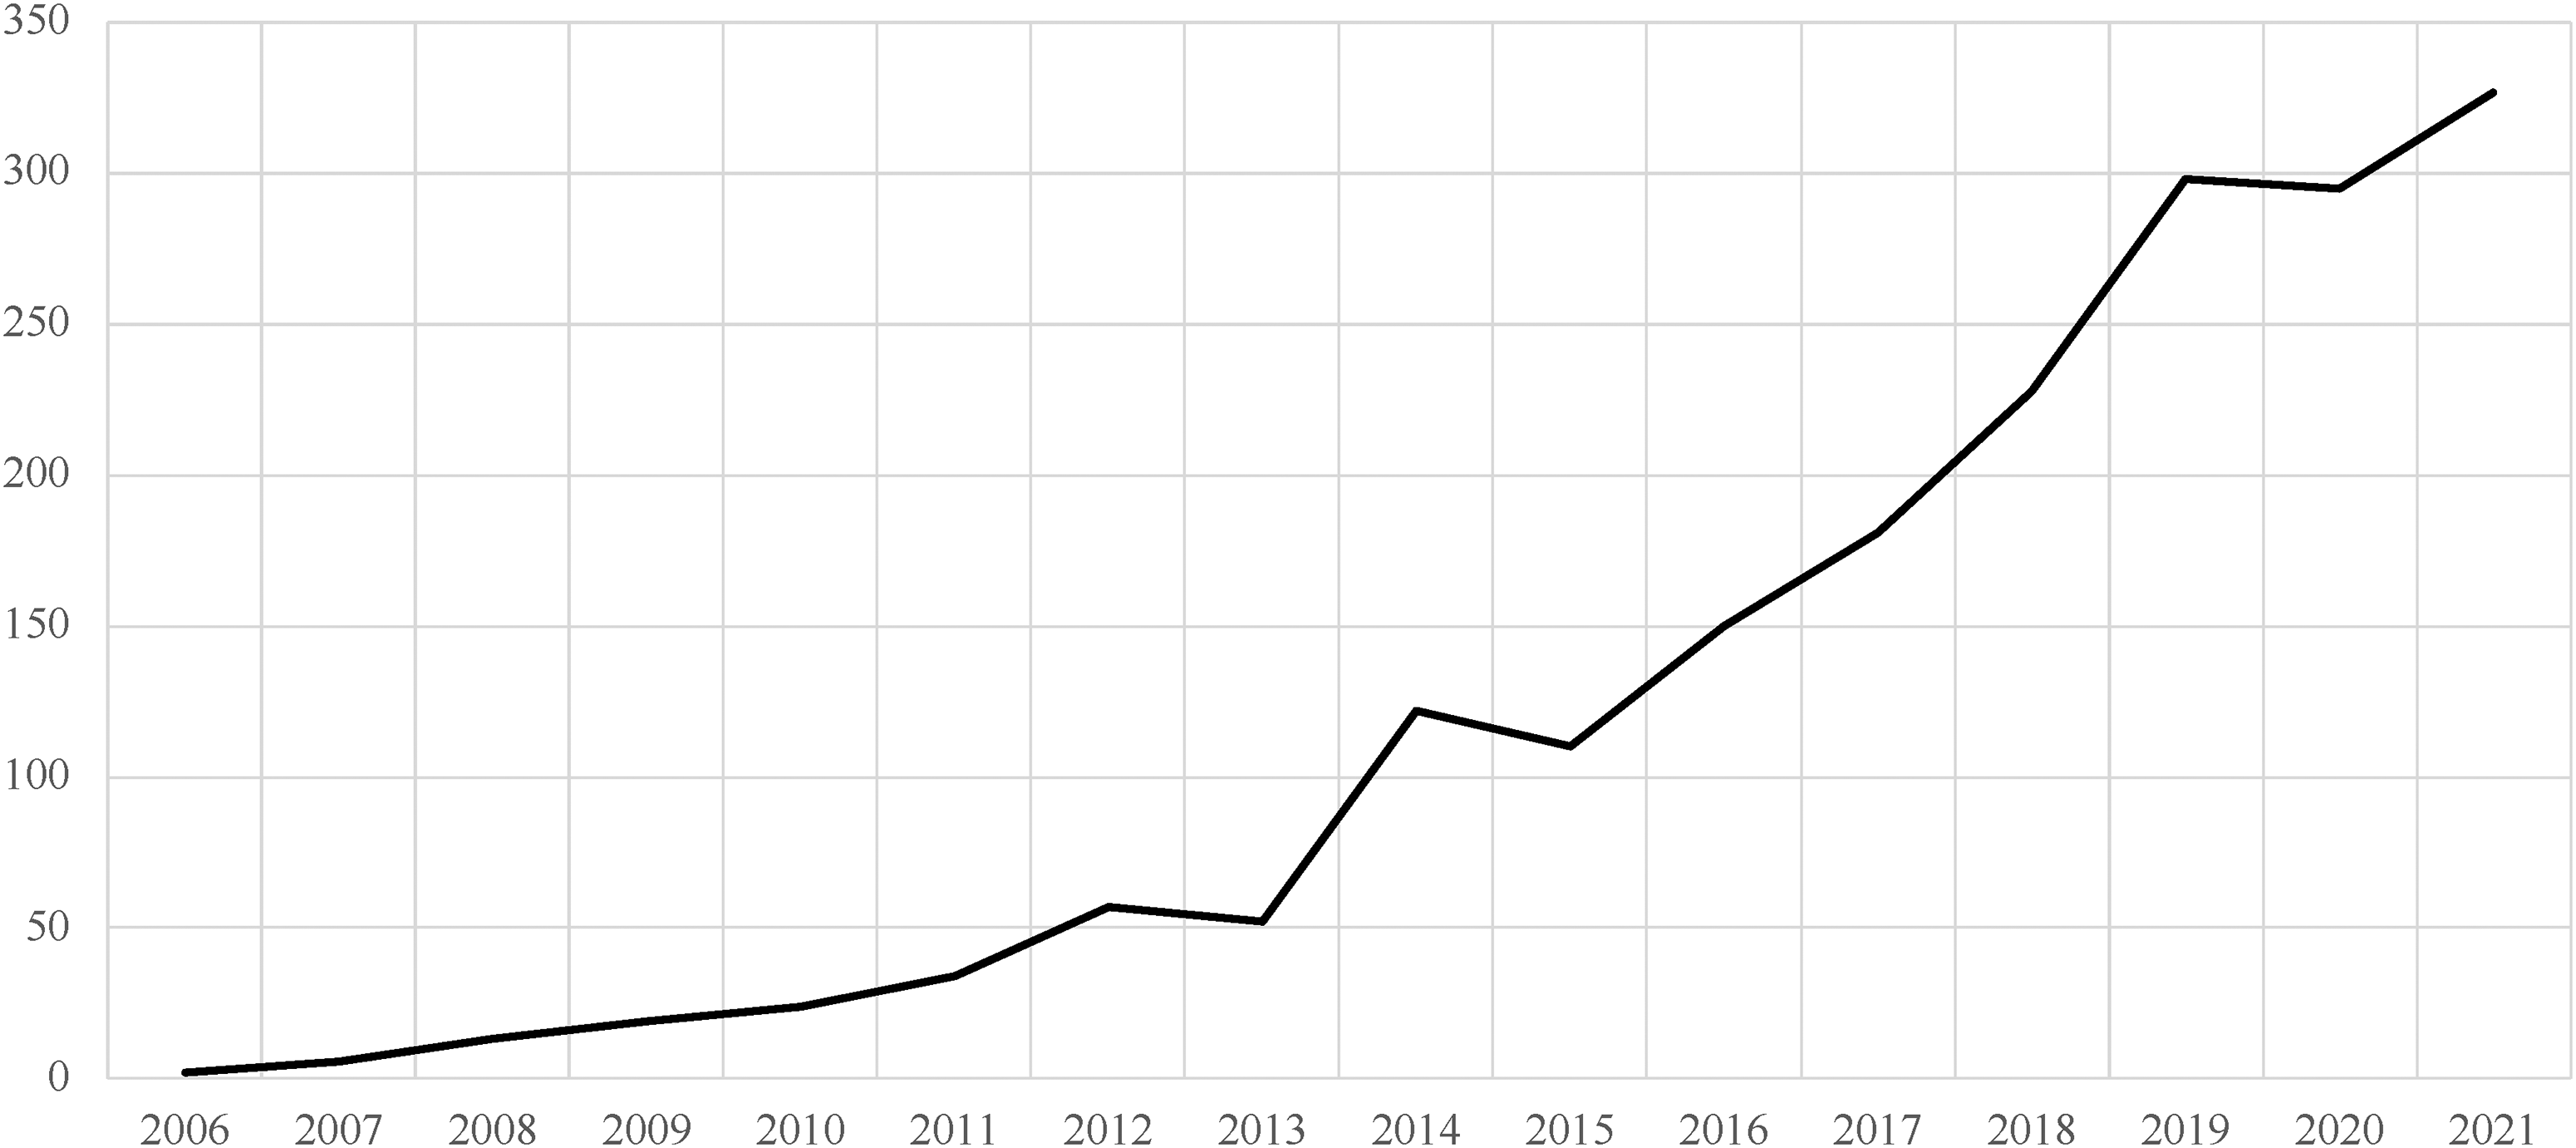
Annual number of citations to frugal perspective articles. Data from ISI Web of Science, 2006–2021.
To better understand how the frugal perspective affects research, the first author coded the articles in more detail. The second author coded a random sample of 30 articles (Krippendorff's
Table 2 presents an overview of this analysis. 64.1% (898) of these articles were either applying the frugal perspective's recommendations or supporting their use, while 35.9% (503) were not applying the frugal perspective but cited the guideline articles for their recommendations on control variable selection and reporting practices. Merely one applied paper (Sudzina, 2018, p. 68) was critical of the recommendations and did not follow them. To conclude, the impact of the frugal perspective and its associated recommendations is substantial.
Number of Papers Citing Methodological Papers of the Frugal Perspective.
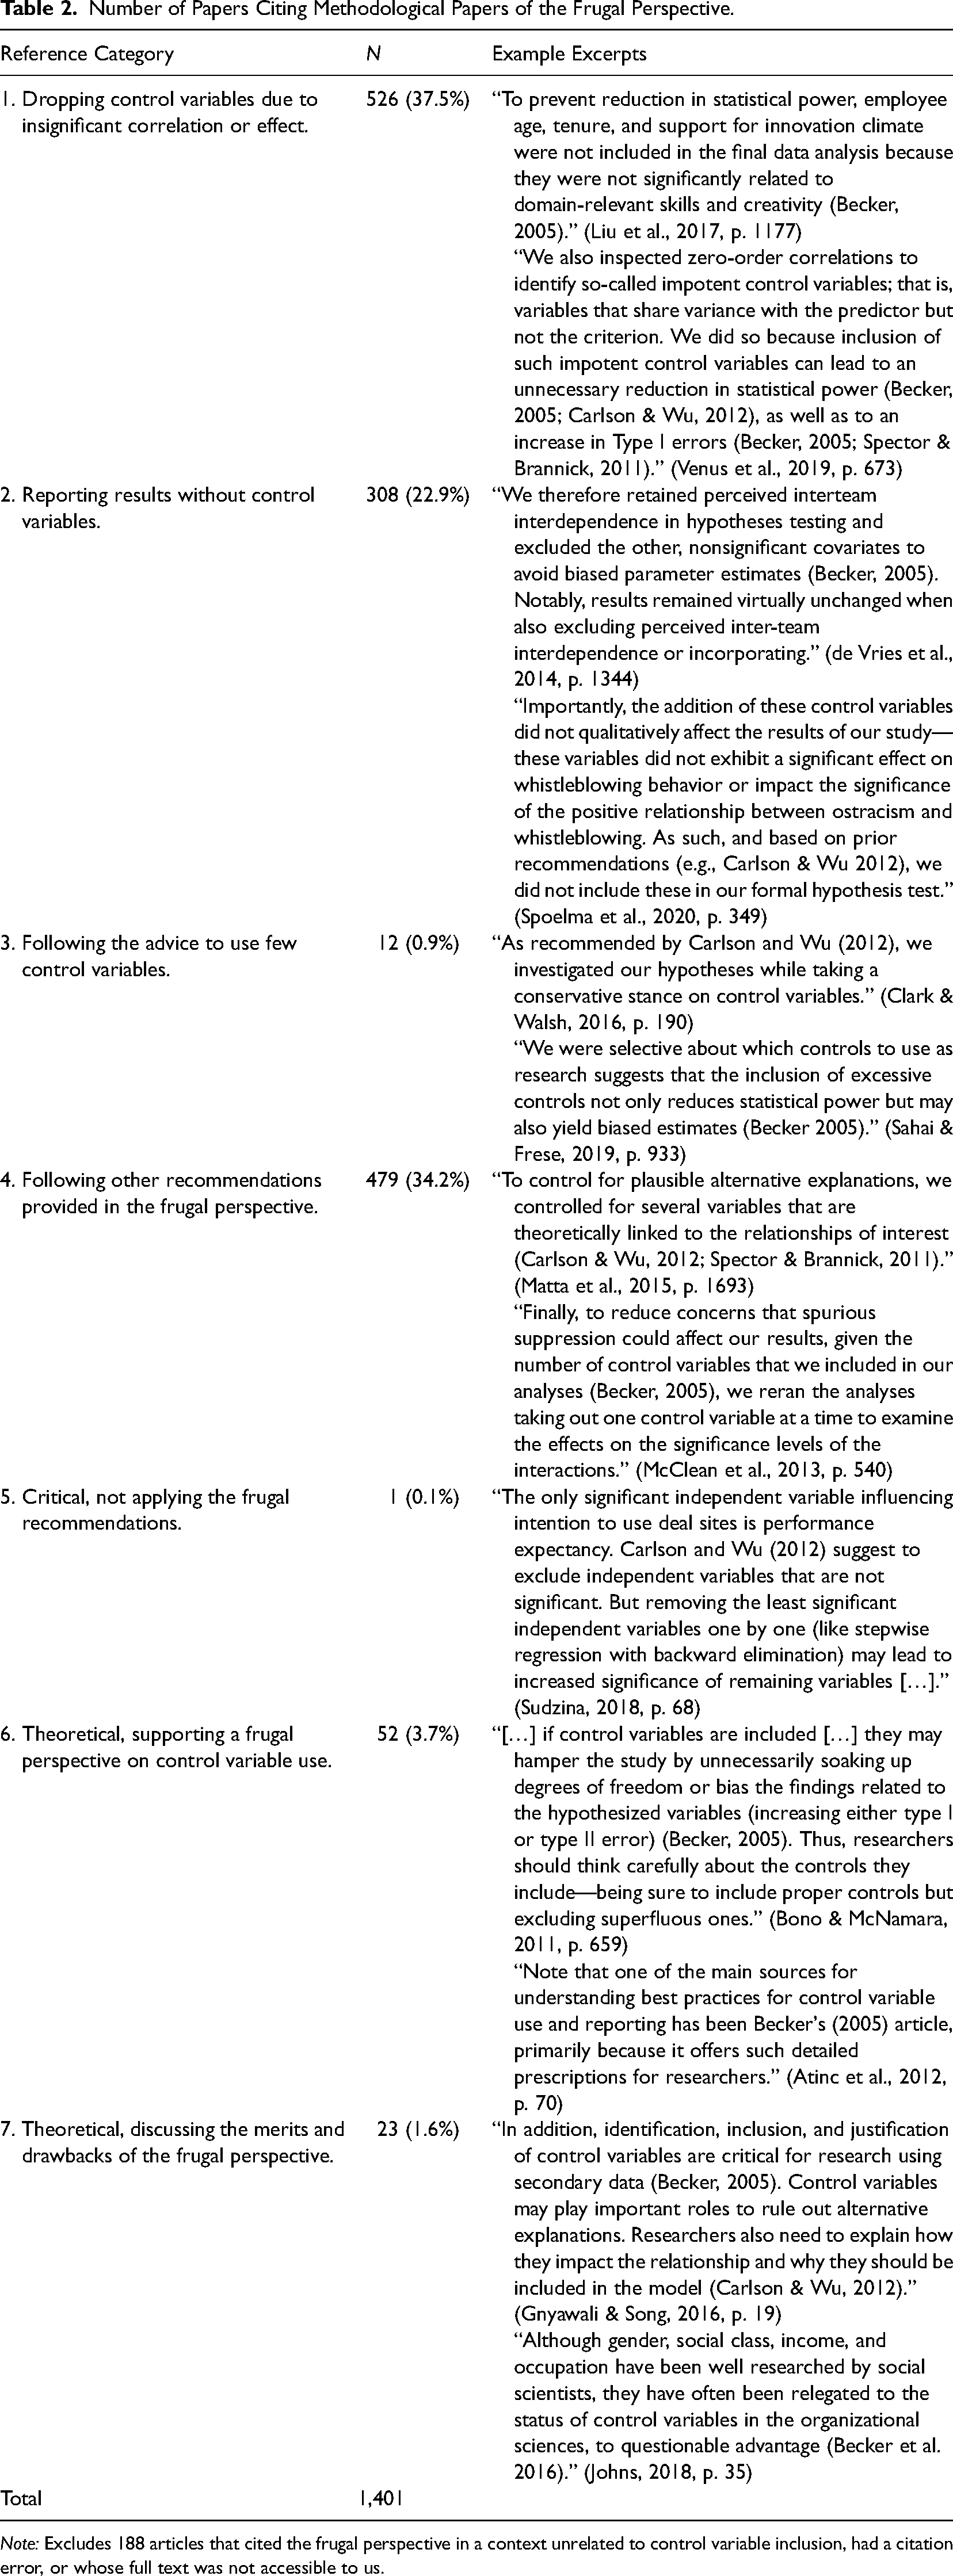
Note: Excludes 188 articles that cited the frugal perspective in a context unrelated to control variable inclusion, had a citation error, or whose full text was not accessible to us.
Literature Analysis 2: Impact of Both Perspectives on Management Research
To compare the impact of both perspectives, we selected the seven journals with the most applications of the frugal perspective in the previous analysis: Academy of Management Journal, Frontiers in Psychology, Journal of Applied Psychology, Journal of Management, Journal of Organizational Behavior, Leadership Quarterly, and Personnel Psychology. We further included the Strategic Management Journal to get a better balance of micro- and macro-perspectives. We searched for the term “control variable” within the 2019–2021 period in these eight journals, producing a list of 1,157 articles. The first author read and coded the articles according to which perspective they applied. For example, an article was coded as applying the frugal perspective if it (a) employed control variables, (b) applied at least one of the recommendations the frugal perspective makes, and (c) cited at least one of the methods papers we identified as belonging to the frugal perspective. The second author coded a subset of 30 articles (Krippendorff's
The coding results in Table 3 clearly show that if researchers justify their inclusion or exclusion of control variables using either perspective, the frugal perspective is more common by a wide margin. There is also a clear tendency that the frugal perspective is more common in micro-oriented journals (e.g., Journal of Applied Psychology) than in more macro-oriented journals (e.g., Strategic Management Journal). On the other hand, the few papers using the prolific perspective are exclusive to two journals that publish both micro and macro research (Journal of Management and Leadership Quarterly).
The Number of Articles Employing the Frugal or Prolific Perspective in Control Variables Use.
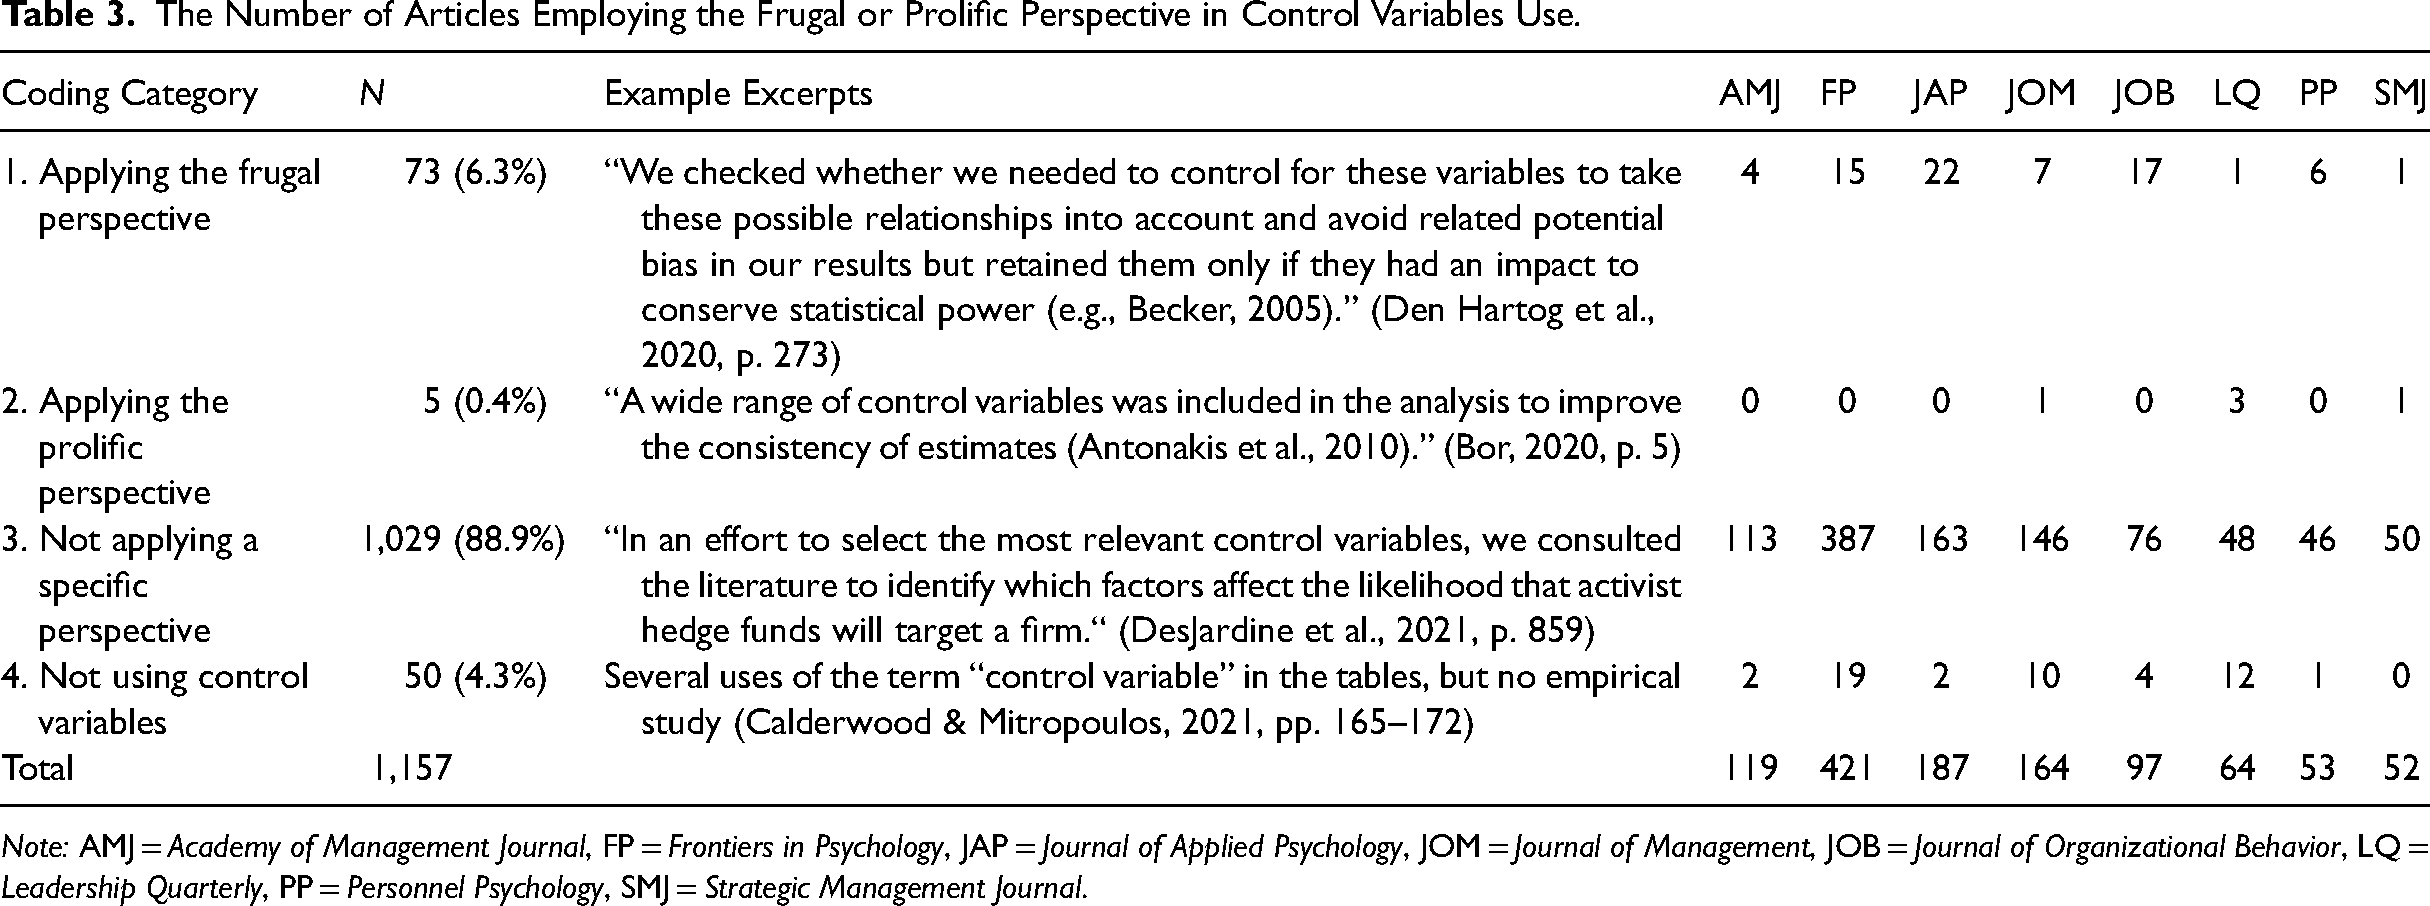
Note: AMJ = Academy of Management Journal, FP = Frontiers in Psychology, JAP = Journal of Applied Psychology, JOM = Journal of Management, JOB = Journal of Organizational Behavior, LQ = Leadership Quarterly, PP = Personnel Psychology, SMJ = Strategic Management Journal.
The frugal perspective has become the norm in methodological guidelines in management and particularly in organizational behavior (Aguinis & Vandenberg, 2014; Becker et al., 2016; Carlson & Wu, 2012; O’Neill et al., 2014; Schjoedt & Bird, 2014) and the review results show it is increasingly followed in research practice. However, as explained earlier, in contrast to the prolific perspective that builds on mathematical proofs presented in econometrics textbooks, the methodological justification of the frugal perspective largely relies on intuitive arguments rather than proofs.
Monte Carlo Simulations
We present three Monte Carlo simulations. The first two test recommendations from the frugal perspective and contrast them with the prolific perspective on control variable inclusion: dropping control variables that are not correlated with the dependent variable (“impotent control,” Simulation 1) and using proxied control variables in regressions (“proxy variable,” Simulation 2). The third simulation shows the effects of including an endogenous control variable (“bad controls,” Simulation 3). The simulations are designed to illustrate points made in the literature and the R and Stata code that we have uploaded to OSF (https://osf.io/wd3x7/) can be used for teaching and replication. The population models for each of the three simulations are shown in Figure 3. 7
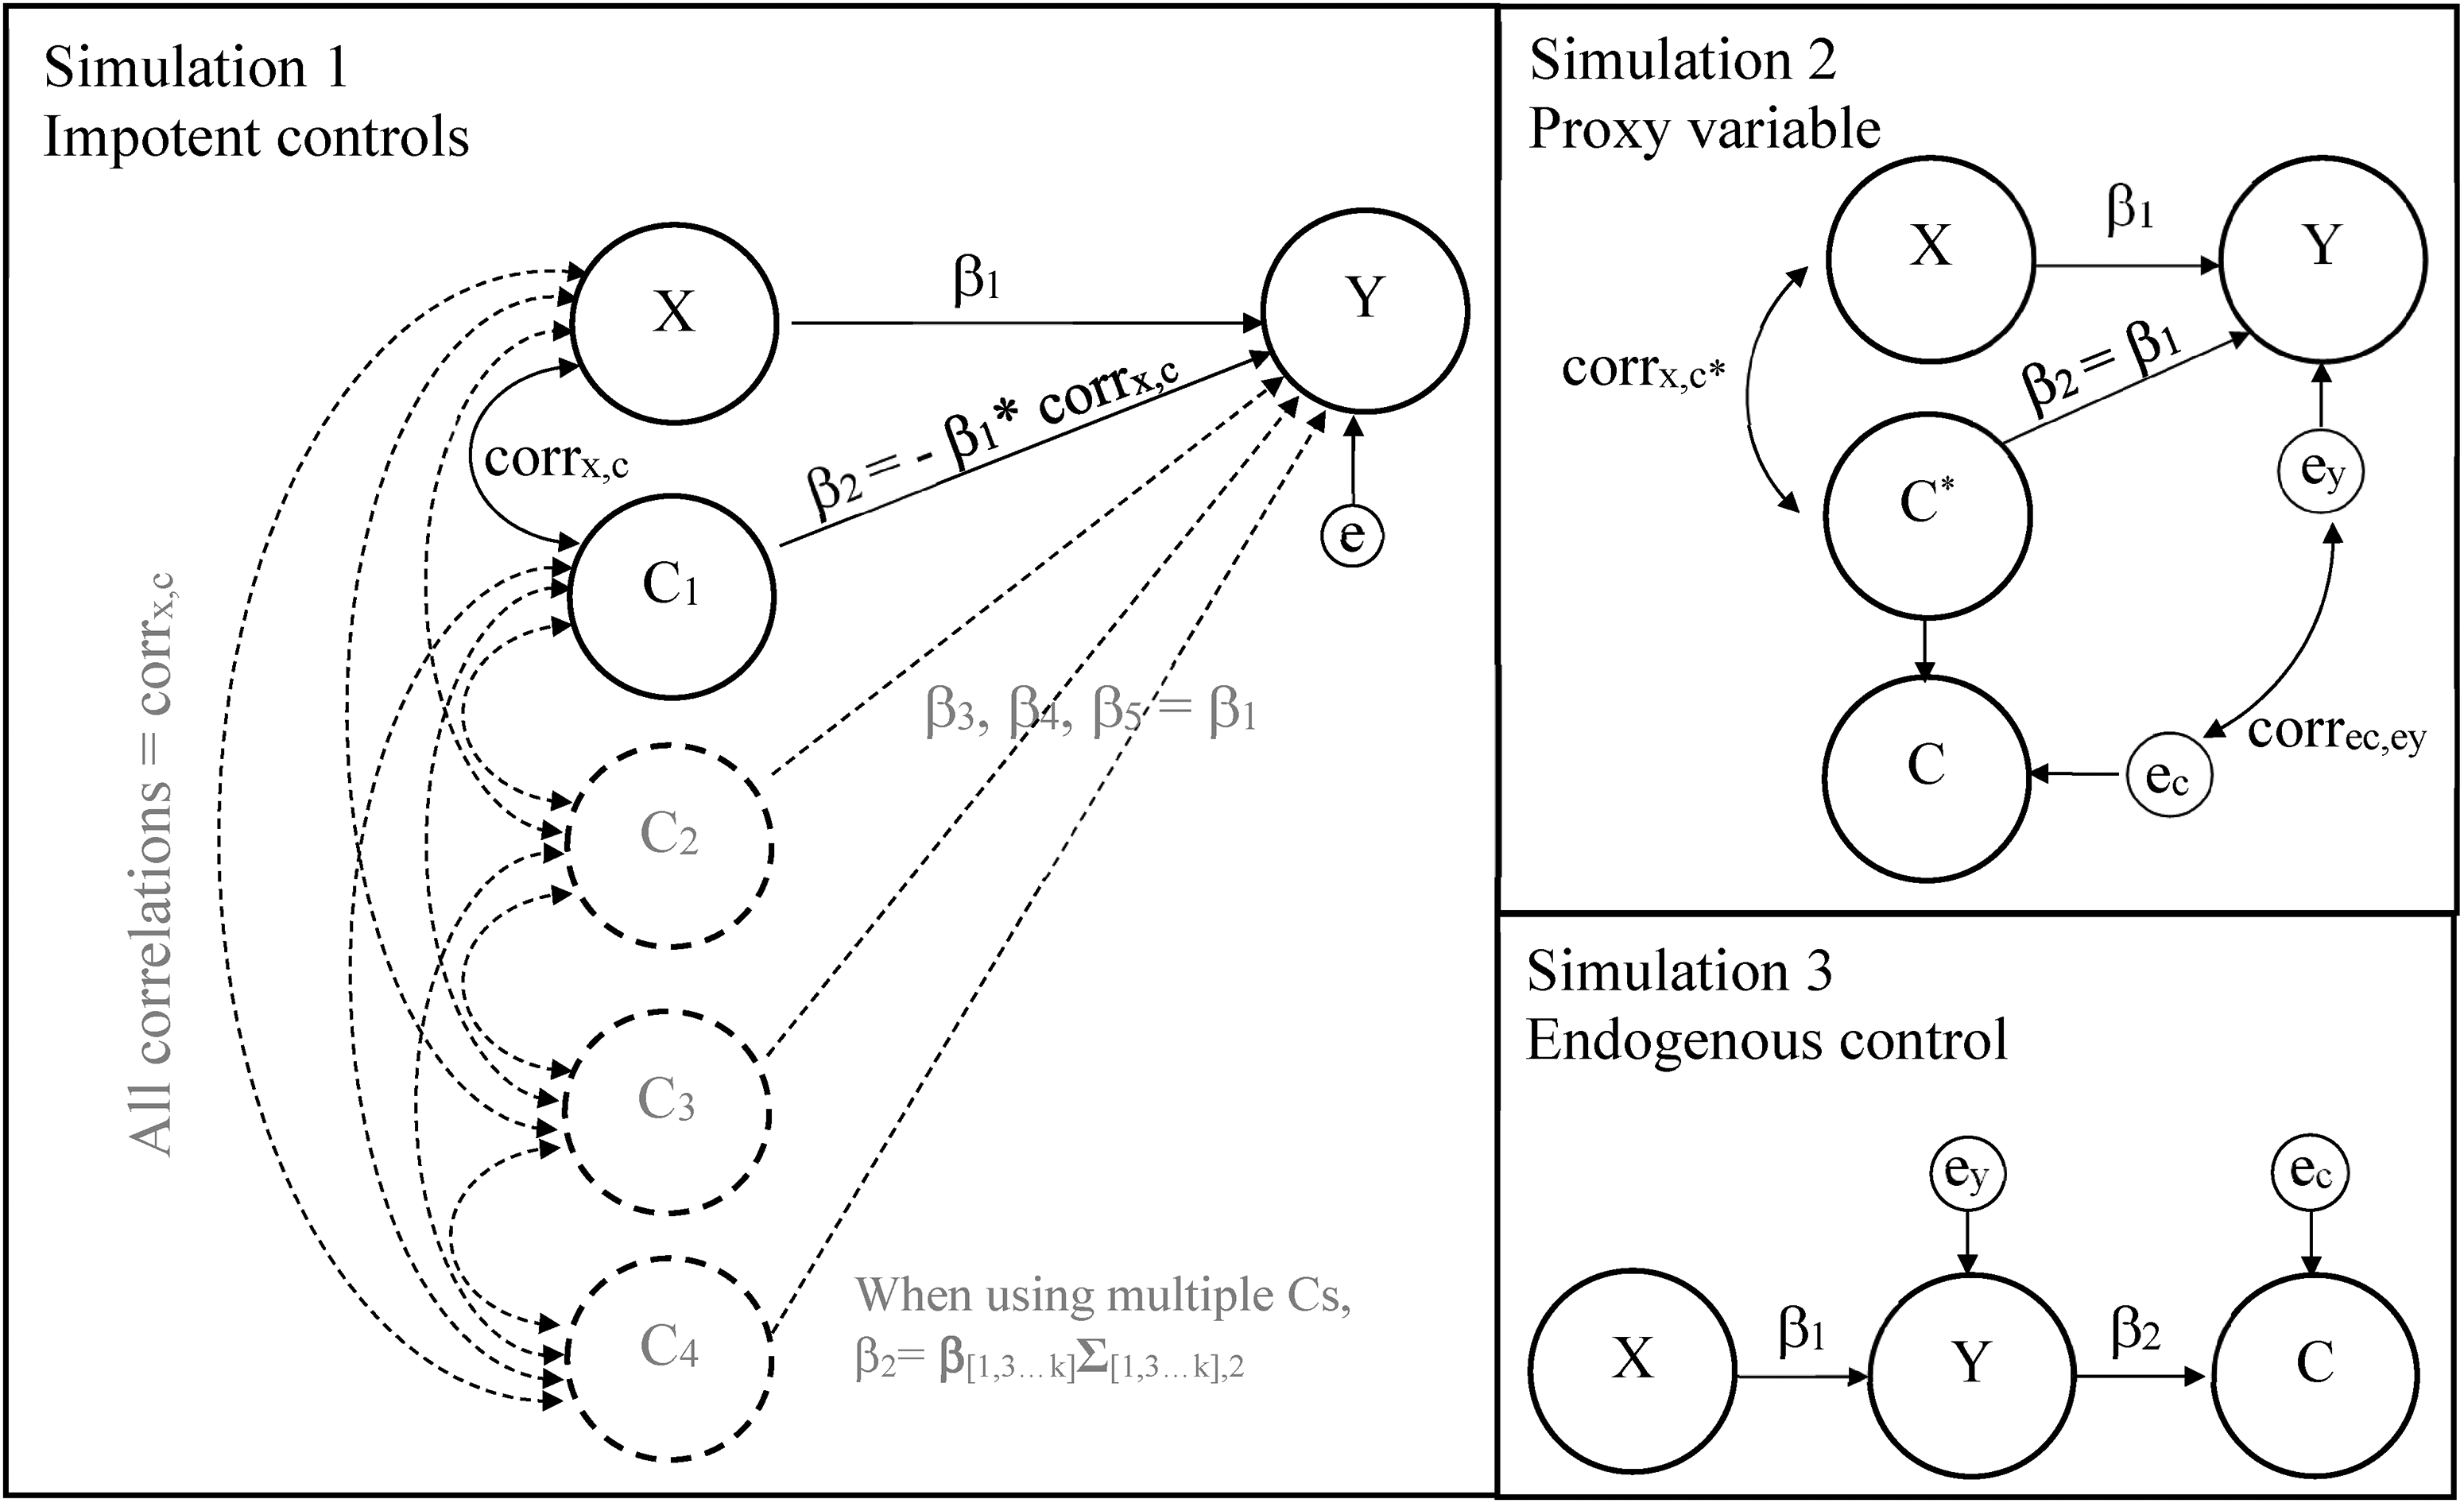
Depiction of the population models and coefficients of the Monte Carlo simulations. All models are linear, and the exogenous variables are standardized in the population. X = independent variable, Y = dependent variable, Ci = control variable(s) used in regressions, C* = control of interest that is not measured directly but proxied, ei = error term, corrk,j = bivariate correlation, βi = causal effect.
We implemented the prolific strategy by always including the control variable(s) in all three simulations. In Simulations 1 and 3, we implemented the frugal perspective by including the control variable(s) only if it is (they are) significantly correlated with the dependent variable in a replication. In Simulation 2, we never included the proxied control variable in a frugal perspective regression. For simplicity, the coefficient β1 (the effect of the focal variable X on Y) was set equal to 1, and all explanatory variables had variances of 1. The sample size was set to 250 in all three simulations, as we found that results were virtually identical across different sample sizes in a separate analysis. 8 Other simulation-specific design factors are reported below. We conducted 10,000 replications for each combination of factors.
Simulation 1 tested the impotent control rule. The experimental conditions were the number of controls (1, 2, 3, 5, 10, 20, 30) and the correlation between explanatory variables (corrX,C) that varied from 0 to 0.8 in increments of 0.1. The first control C1 was uncorrelated with the dependent variable Y to produce an impotent control. When there was only one control variable, we did this by setting the effect (β2) of the control variable Ci on the dependent variable Y to be the negative of the product of its correlation with X (corrX,C) and β1. In the other cases, we used the corresponding matrix equation that also took the other controls into account. The error variance was scaled to produce an R2 = 0.30, representing a substantial effect, yet one that might still be found in some organizational research. 9
Figure 4 shows that using the frugal perspective leads to bias in the estimate of β1, and this bias increases with the increasing correlation between the control variables Ci and the independent variable X, as well as the number of control variables. In contrast, when the prolific perspective is used, the estimate of β1 remains unbiased across all levels of correlation between Ci and X, independently of how many controls are simulated. The only case where dropping control variables does not produce bias is when the controls are uncorrelated with the focal predictor, which would be a case of irrelevant controls.
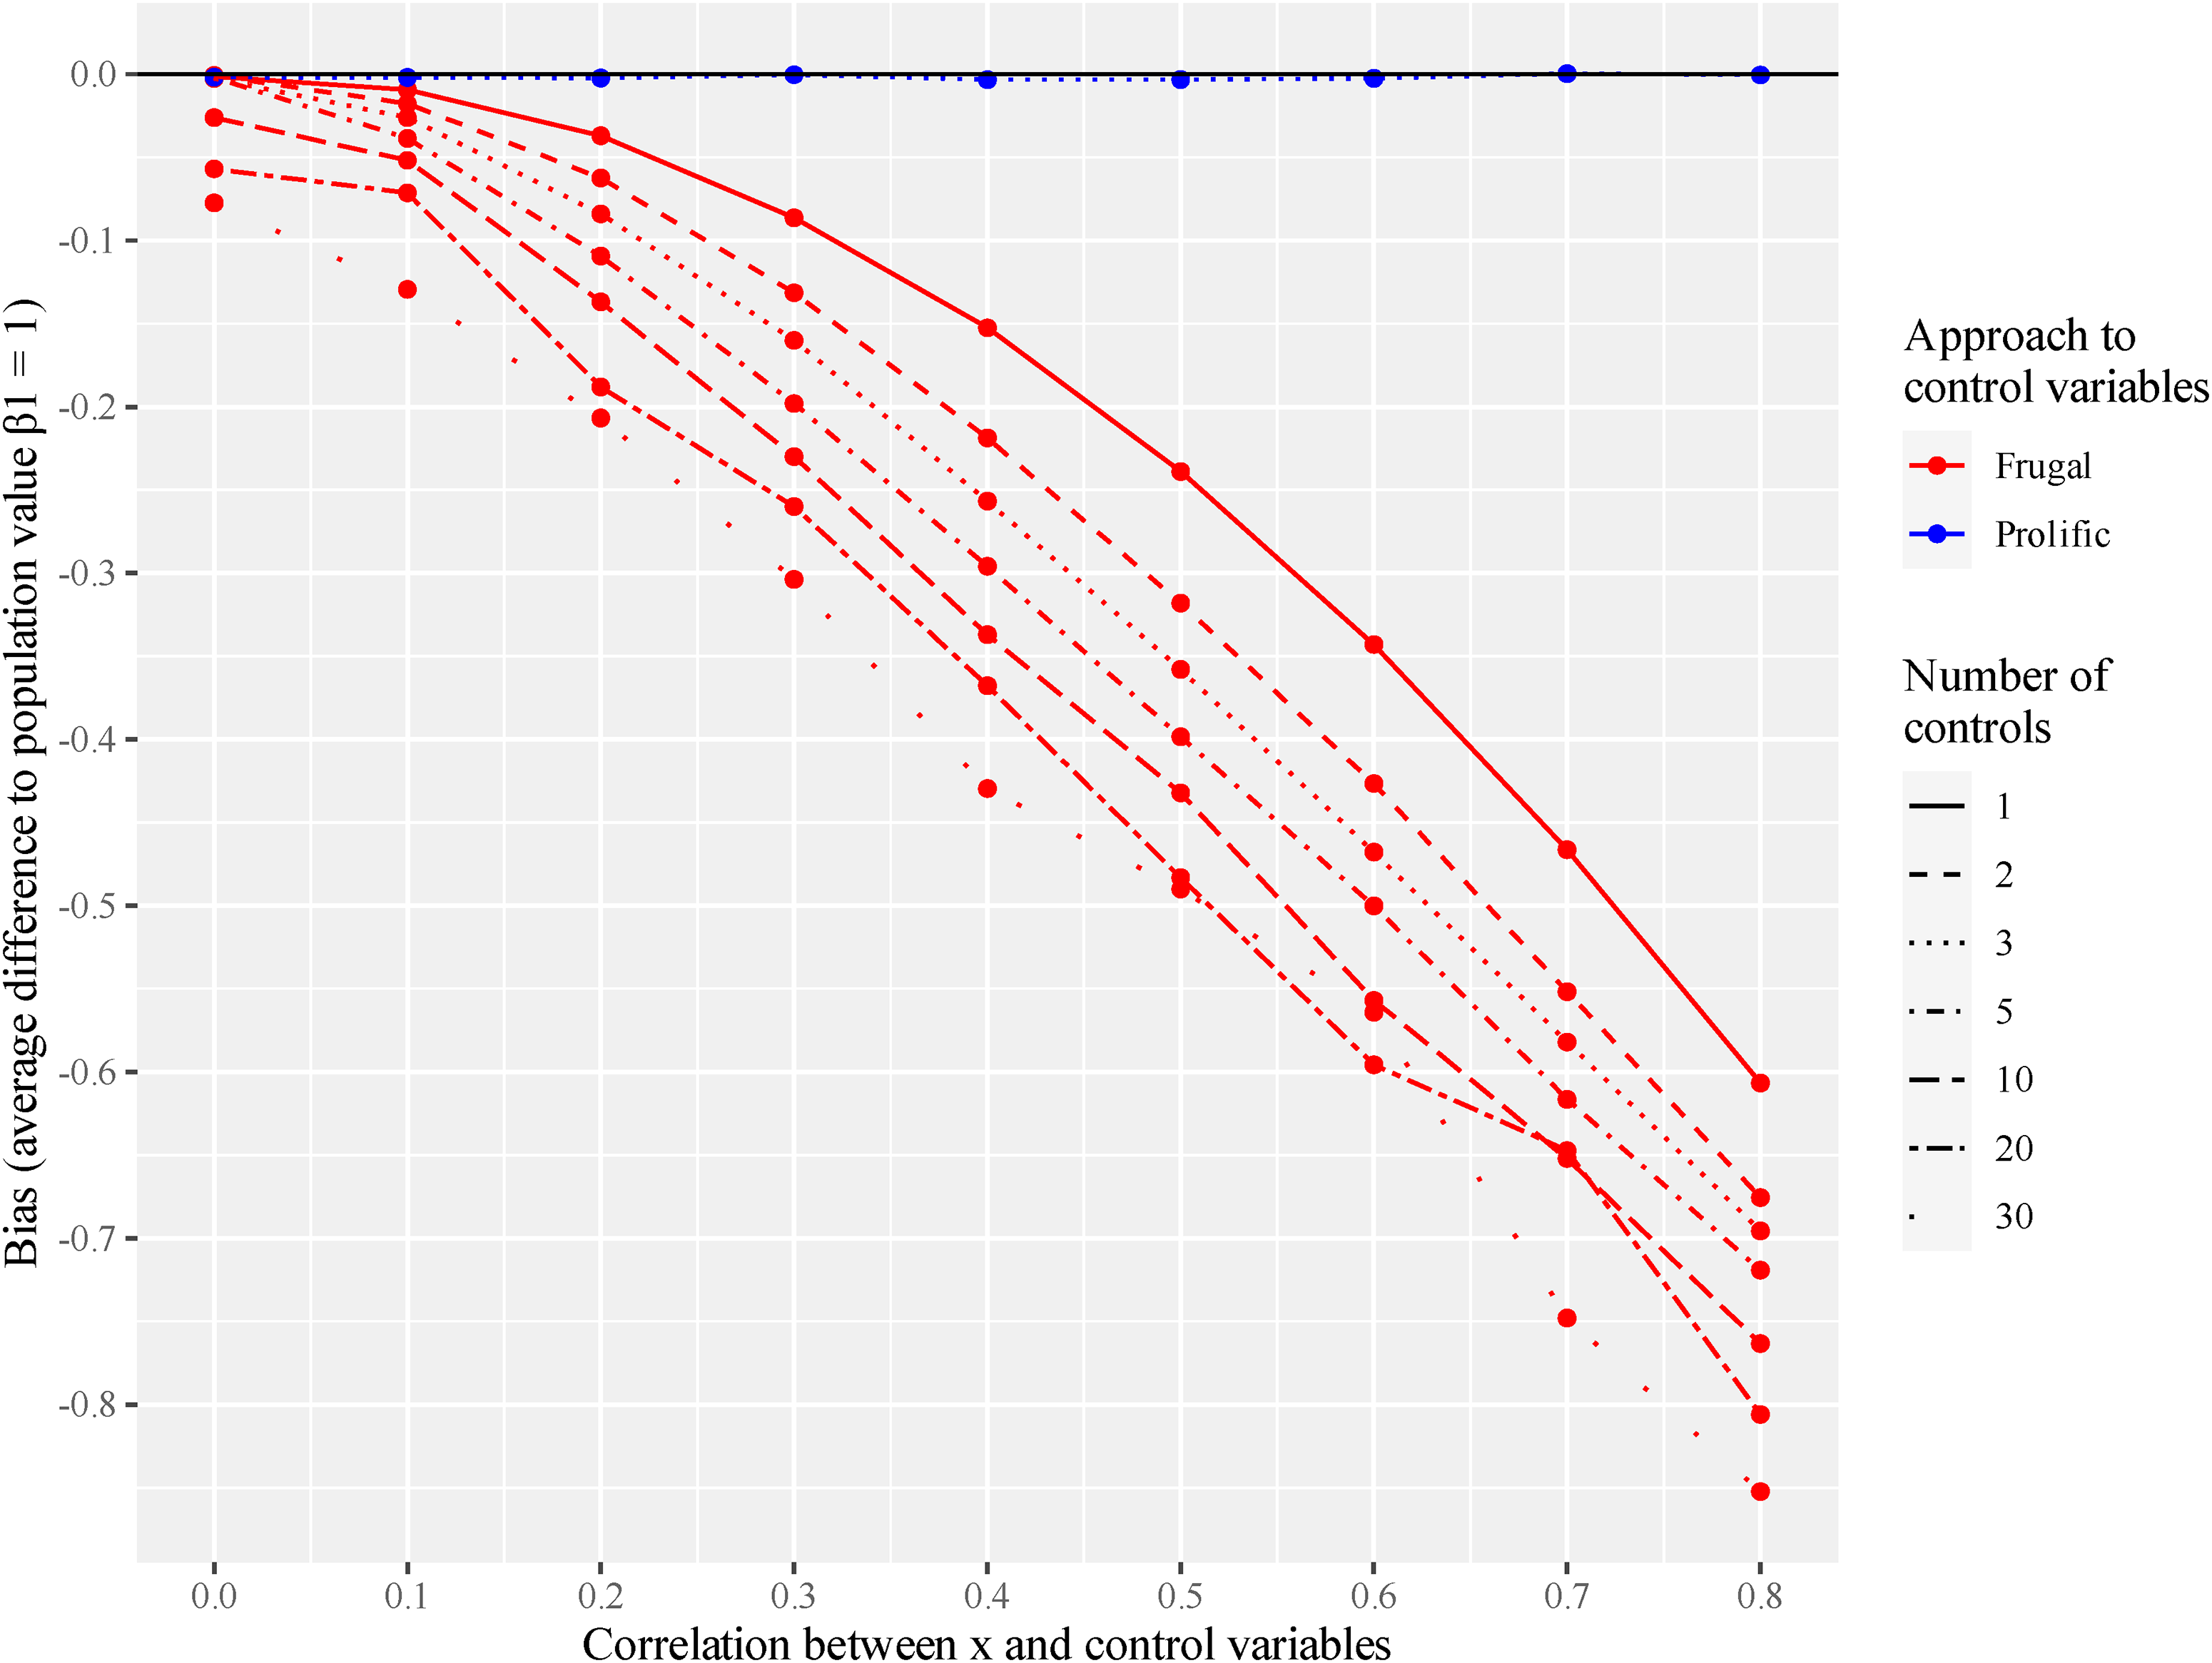
Results from Simulation 1: Amount of bias in estimates of β1 when applying the “Avoid Impotent Controls Rule,” with varying correlation between the independent variable X and a varying amount of controls C. Sample size = 250, SD of error in Y = 1.
In Simulation 2, we tested the avoid proxies rule. The design was identical to the single-control case in Simulation 1, except that the control variable C* is proxied by C, which is measured with error. We varied the error variance in the proxy variable C (ec) from 0 to 2 in increments of 0.5 and the correlation between the error terms of the proxy variable C and the dependent variable Y (correc,ey) from −.4 to .4 in increments of .2. This second experimental factor was added to model the effect of various degrees of endogeneity in the measurement error (i.e., correc,ey ≠ 0). For simplicity, the correlation of the control variable C* with the independent variable X (corrX,C*) is set to 0.5. The results from this simulation shown in Figure 5 support the statement that random measurement error (correc,ey = 0, no systematic error) in the predictor variables causes bias in regression estimates (Wooldridge, 2013, pp. 320–324), but this bias is always less than the bias from omitting the control variable. Further, in most cases of systematic error we tested, including the proxy in the model biases estimates less than dropping it.
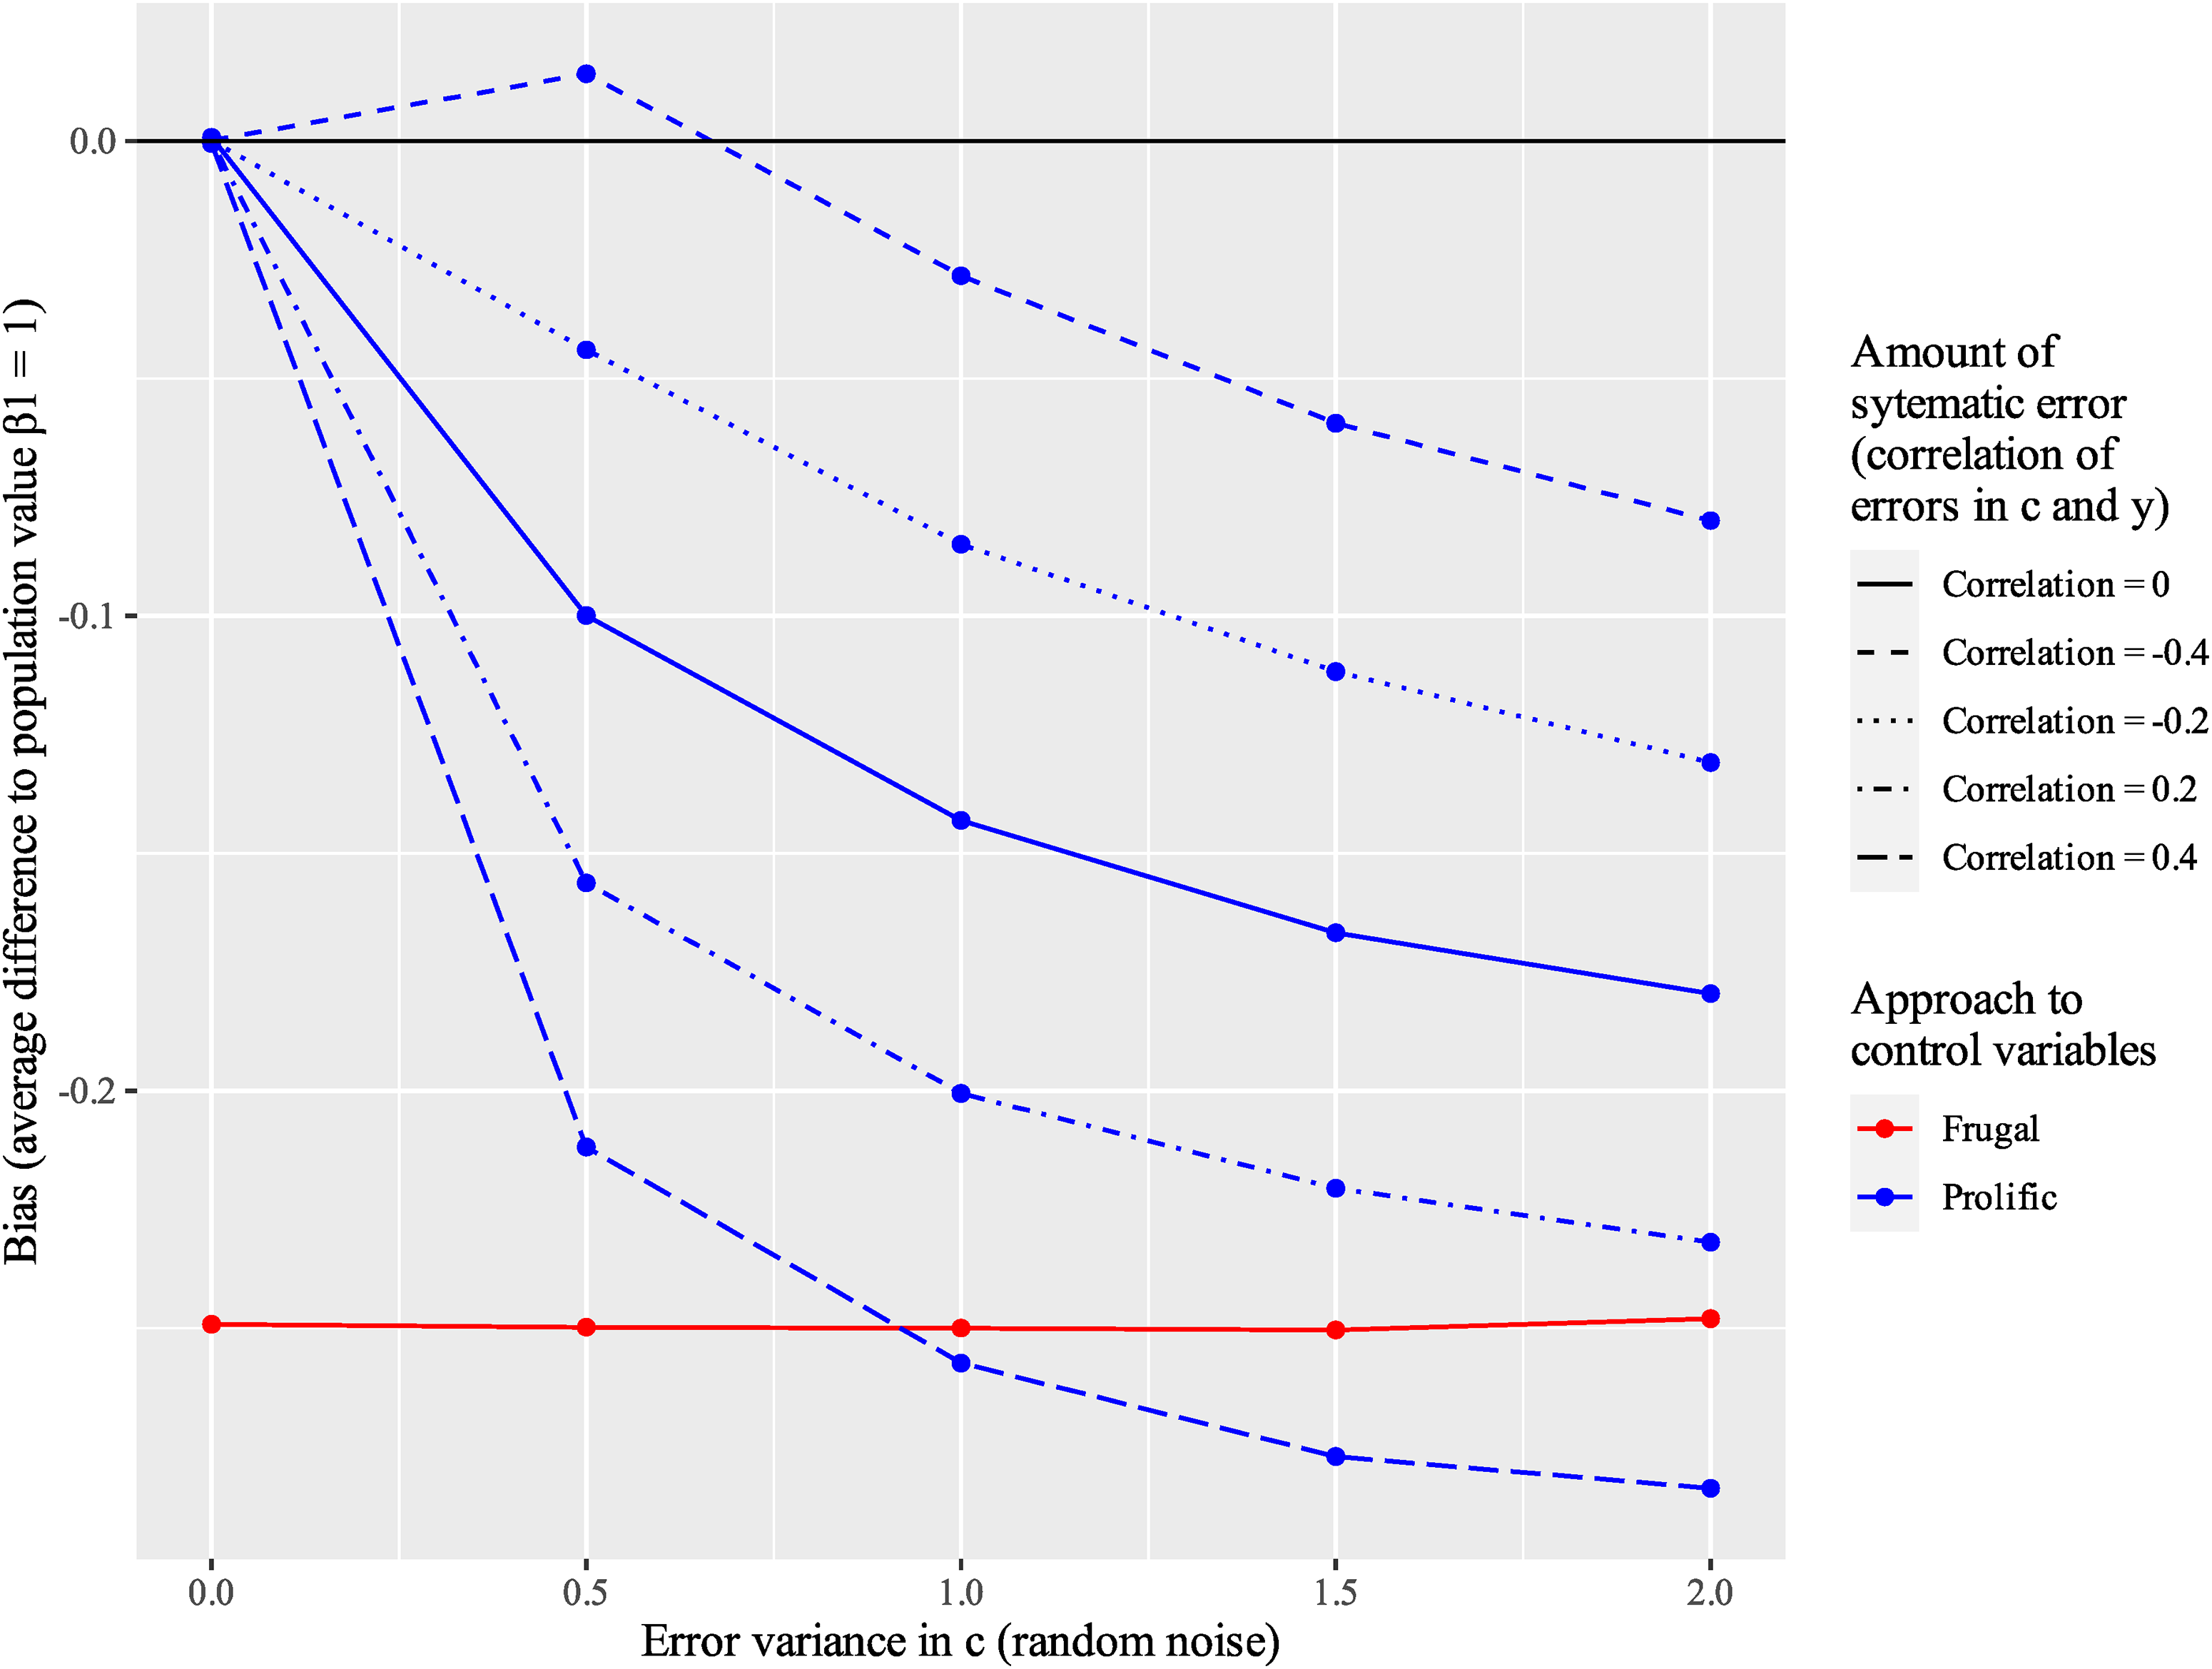
Results from Simulation 2: Amount of bias in estimates of β1 when following the “Avoid Proxies” rule, with varying error variance of the proxy and the amount of endogeneity. Sample size = 250, SD of error in Y = 1, correlation X and C* = 0.
In Simulation 3, the control variable C is not a real control but an outcome of the dependent variable Y, thus making it endogenous. We vary the degree of endogeneity by varying the effect of Y on C (β2) from 0 to 1 in increments of 0.1. Results in Figure 6 demonstrate that the estimate of β1 is biased regardless of which perspective is applied, and this bias depends on the magnitude of the causal effect of Y on C (β2). The simulations show that endogeneity (bad controls) is a serious concern, yet the specific recommendations provided by the two perspectives do not help detect endogenous controls.
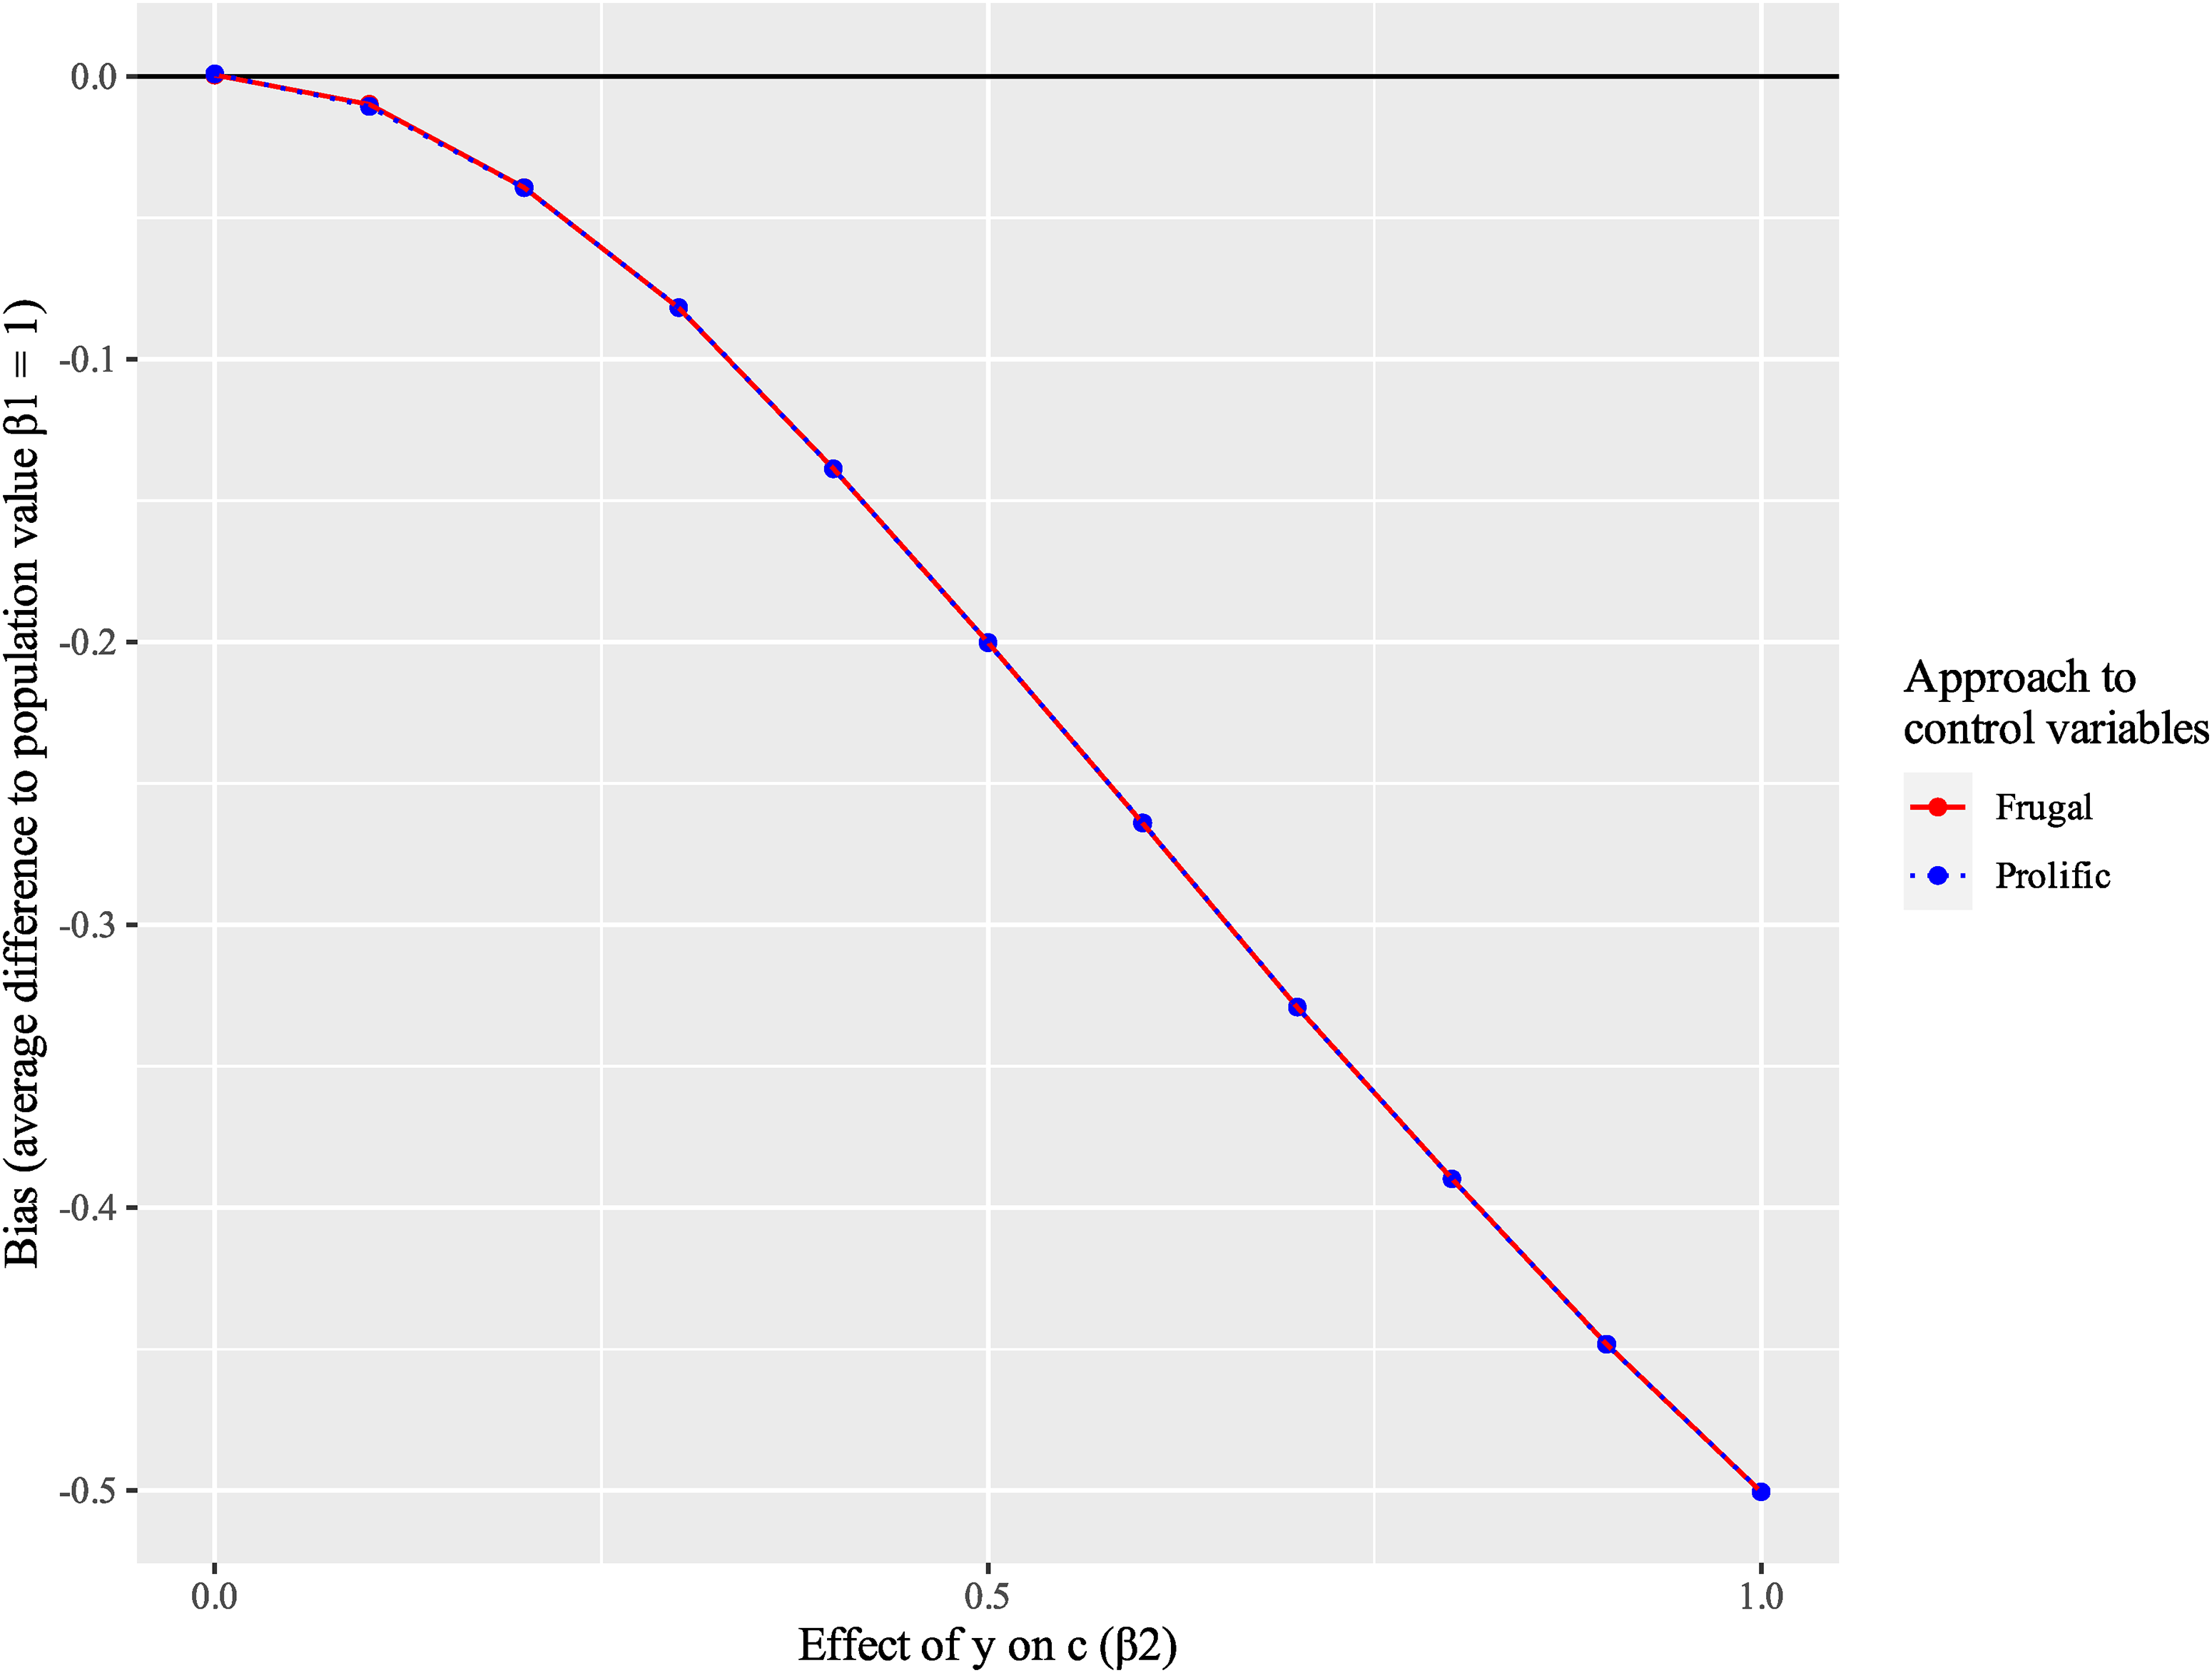
Results from Simulation 3: Amount of bias in estimates of β1 following the frugal or the prolific perspective, varying β2, the effect of Y on C, which is the amount of endogeneity in C. Results for both approaches are almost identical, which is why the lines overlap. Sample size = 250, SD of error in Y = 1.
Discussion
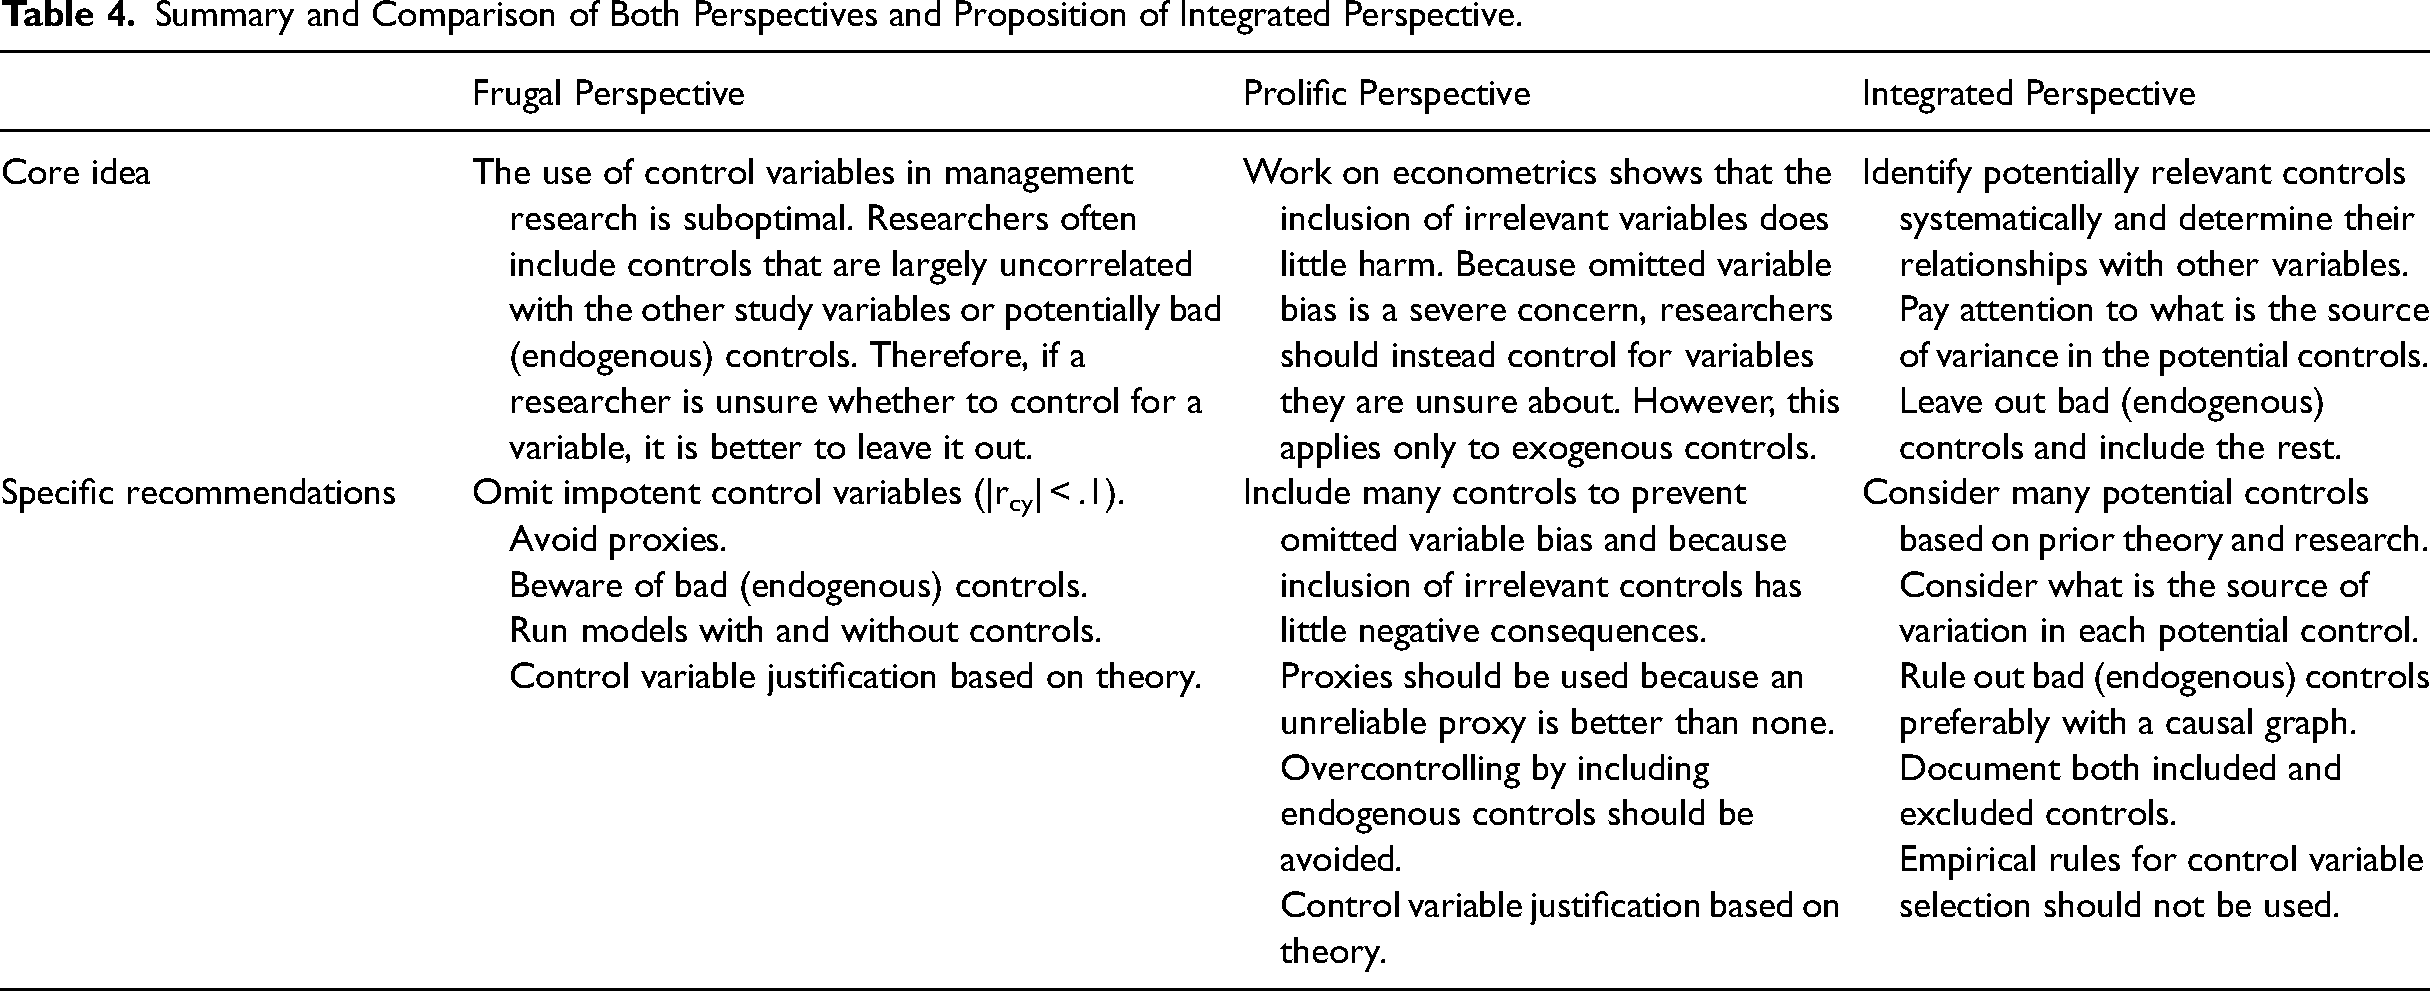
Control variables have been discussed actively within management journals in recent years. While it is largely agreed that control variable reporting could be improved and that controls should be chosen based on relevant theory, there is some disagreement on whether many or few controls should be included. Specifically, we have the frugal perspective advocating the sparse use of controls and the prolific perspective advocating a more generous use of control variables. We analyzed these two perspectives by comparing their recommendations against the more technical literature on regression analysis and econometrics, by conducting two reviews of their use in management research, and by running three simulations that demonstrate the effectiveness (or lack thereof) of specific empirical rules that have been proposed. Table 4 summarizes the central idea of both perspectives and their specific recommendations discussed in this article. The table also presents an integrated perspective that we propose in this section.
Summary and Comparison of Both Perspectives and Proposition of Integrated Perspective.
We hope our article encourages more rigorous control variable selection in three ways. First, in our review, we found that whereas the articles advocating the frugal perspective strongly argue that control variables should be chosen based on theory, it is the empirical rules from the frugal perspective that were applied in research practice. In our study, we used simulations to demonstrate that while these rules (“beware of impotent controls,” and “avoid proxies”) sound reasonable, they are at best useless and can often lead to incorrect results. While our analysis focused on regression, which is perhaps the most common analysis tool in organizational research, these same principles have also been derived in the context of structural causal models (e.g., Morgan & Winship, 2007; Pearl, 2012). For example, the result that controlling for a proxy generally reduces bias has been proven in the context of structural causal models (Ogburn & Vanderweele, 2013). Because these models make no assumptions about functional forms, these principles also apply to nonlinear models (e.g., Poisson regression). More generally, they apply to any conditioning strategy, including, for instance, various matching techniques.
On a more general level, one can wonder why the empirical rules have been introduced in the first place. Both perspectives agree that control variables should be chosen based on theory, which is perhaps best exemplified by Breaugh (2008), who states that “If theory suggests a variable should be controlled, it should be controlled” (p. 219). There is also a general agreement that the key limitation of the statistical control strategy is that it is impossible to control for every possible variable, but researchers should focus on the theoretically relevant ones (Antonakis et al., 2010, p. 1099; Cohen et al., 2003, sec. 12.1.4; Morgan & Winship, 2007, p. 5.4.2). But if controls should be determined based on theory, then empirical rules such as “avoid impotent controls” should play no role in control variable selection.
Unfortunately, while the recent literature emphasizes the role of theory, it has failed to explain how exactly researchers can use theory to guide control variable selection beyond providing general recommendations on looking at variables that are related to both the dependent variable and the independent variable(s) so that all relevant alternative explanations can be ruled out (Spector, 2019). This might be one of the reasons why many management articles contain control variables that are just weakly correlated with the focal variables, creating an “illusion of statistical control” (Carlson & Wu, 2012). Our article clearly shows that the empirical rules should be abandoned, and we hope that this would foster more thoughtful control variable selection.
Second, general recommendations such as “when in doubt, leave them out” or “err on the side of caution by including more than fewer control variables” cast the control variable decisions as a many or few choices, which is not ideal. The problem with the frugal perspective recommendation is that it might lead researchers to pick a couple of obvious controls and then declare that as sufficient instead of going through more rigorous control variable selection procedures. Similarly, following the prolific perspective, one might just conclude that “The greater the number of variables that are controlled […], the greater the likelihood that the relationship is not spurious.” (Singleton & Straits, 2018, p. 102) and mindlessly include many controls, some of which are inevitably bad, leading to severe bias, as the results from our Simulation 3 show. As Hünermund et al. (2024) put it, “the debate on whether to include fewer or more variables is not a productive one” (p. 5).
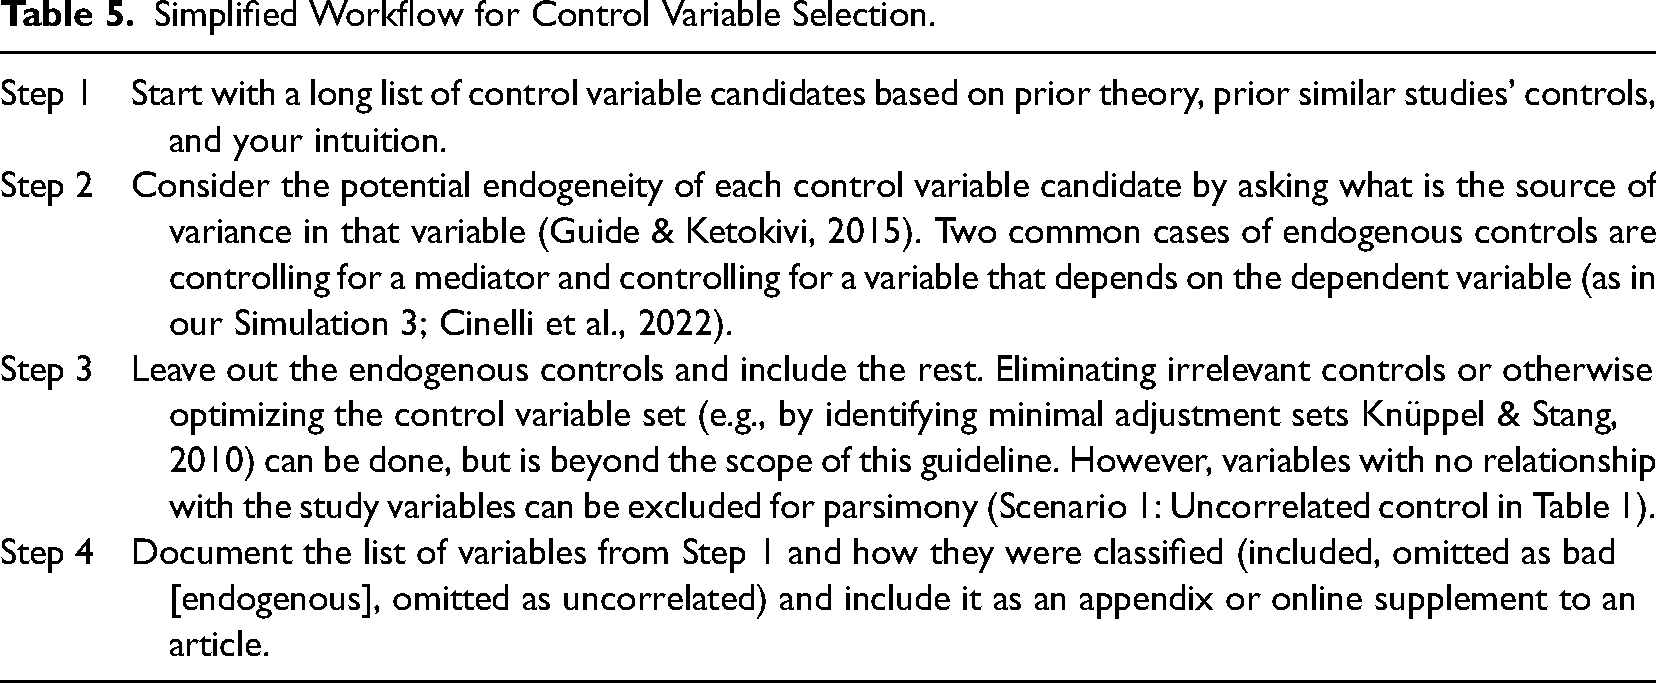
Third, there is a better way of choosing control variables. The literature on econometrics (e.g., Greene, 2012; Wooldridge, 2010, 2013) and structural causal models (e.g., Cinelli et al., 2022; Huntington-Klein, 2022) tells us (a) it is important to include all relevant controls, (b) that bad or endogenous controls should not be included, and (c) including other controls is generally safe, but can increase or decrease the precision of estimates. The key challenge is how specifically researchers can identify the relevant controls to be included and the bad controls to be excluded and do this solely based on theory. The recent literature on control variable selection using causal graphs in sociology and psychology (Cinelli et al., 2022; Wysocki et al., 2022) presents one way in which theory-based selection of controls might work. Hünermund et al. (2022) explain one possible workflow and demonstrate it in the context of leadership studies. Control variable selection should start by identifying a long list of potential controls based on prior theory, prior empirical results, and authors’ intuition. The list of controls should then be narrowed down by classifying them as relevant controls, bad controls, and unnecessary or irrelevant controls by using causal graphs (Cinelli et al., 2022; Hünermund et al., 2022; Wysocki et al., 2022). It is also recommended that the control selection process should be documented (Hünermund et al., 2024). This is consistent with the frugal perspective's call for more transparency on how and why control variables were selected (e.g., Becker et al., 2016; Bernerth et al., 2018). While the full explanation of the causal graph is technical and beyond the scope of this work, we offer a simplified workflow that should be considered in Table 5.
Simplified Workflow for Control Variable Selection.
The number of controls that comes out of this kind of rigorous process is the correct number for a study—regardless of whether many or few. If a researcher is still unsure about which controls should be included, the extensive literature on model uncertainty can be consulted (Huntington-Klein, 2022, sec. 22.2).
Footnotes
Declaration of Conflicting Interests
The authors declared no potential conflicts of interest with respect to the research, authorship, and/or publication of this article.
Funding
The authors disclosed receipt of the following financial support for the research, authorship, and/or publication of this article. This work was supported by the Academy of Finland (Grant no 311309).
Notes
Author Biographies
![]() . Mikko has also been an entrepreneur.
. Mikko has also been an entrepreneur.