
Abstract
For stochastic effects such as cancer, linear-quadratic models of dose are often used to extrapolate from the experience of the Japanese atomic bomb survivors to estimate risks from low doses and low dose rates. The low dose extrapolation factor (LDEF), which consists of the ratio of the low dose slope (as derived via fitting a linear-quadratic model) to the slope of the straight line fitted to a specific dose range, is used to derive the degree of overestimation (if LDEF > 1) or underestimation (if LDEF < 1) of low dose risk by linear extrapolation from effects at higher doses. Likewise, a dose rate extrapolation factor (DREF) can be defined, consisting of the ratio of the low dose slopes at high and low dose rates. This paper reviews a variety of human and animal data for cancer and non-cancer endpoints to assess evidence for curvature in the dose response (i.e. LDEF) and modifications of the dose response by dose rate (i.e. DREF). The JANUS mouse data imply that LDEF is approximately 0.2–0.8 and DREF is approximately 1.2–2.3 for many tumours following gamma exposure, with corresponding figures of approximately 0.1–0.9 and 0.0–0.2 following neutron exposure. This paper also cursorily reviews human data which allow direct estimates of low dose and low dose rate risk.
Keywords
1. INTRODUCTION
At low and moderate doses, radiation risks are primarily stochastic effects, in particular somatic effects (cancer), rather than tissue reaction (formerly deterministic) effects which are characteristic of higher dose exposure (Committee to Assess Health Risks from Exposure to Low Levels of Ionizing Radiation, 2006; ICRP, 2007; UNSCEAR, 2008). In contrast to tissue reaction (formerly deterministic) effects, for stochastic effects, scientific committees generally assume that at sufficiently low doses, there is a positive linear component to the dose response, i.e. that there is no threshold (Committee to Assess Health Risks from Exposure to Low Levels of Ionizing Radiation, 2006; ICRP, 2007; UNSCEAR, 2008); this does not preclude there being higher order (e.g. quadratic) powers of dose in the dose response that may be of importance at higher doses. It is on this basis that linear-quadratic models of dose are often used to extrapolate from the experience of the Japanese atomic bomb survivors [typically exposed at a high dose rate to moderate doses (average of approximately 0.1 Gy)] to estimate risks from low doses and low dose rates (Committee to Assess Health Risks from Exposure to Low Levels of Ionizing Radiation, 2006; ICRP, 2007; UNSCEAR, 2008). The so-called ‘low dose extrapolation factor’ (LDEF) consists of the ratio of the low dose slope (as derived via fitting a linear-quadratic model) to the slope of the straight line fitted to a specific dose range. Estimates of LDEF have been made for cancer in the atomic bomb survivors Life Span Study (LSS) cohort data (Pierce and Vaeth, 1991; Little and Muirhead, 2000).
Determining the effect of curvature in the dose response and its impact on low dose effects is separate from the effect that may be produced by amelioration of dose rate. This has led to the concept of a dose rate extrapolation factor (DREF), consisting of the ratio of the low dose slopes at high and low dose rates, and dose and dose rate reduction factor (DDREF), which measures the ratio of effect per unit dose at high dose and high dose rate to the effect per unit dose at low dose and low dose rate. As such, DDREF incorporates both the effect of dose–response curvature (e.g. via LDEF) and the effect of reduction in dose rate (e.g. via DREF). Recommended values of DDREF vary among scientific groups and have changed over time. Based on a combination of data from animal studies, evidence for curvilinearity in the data from the Japanese atomic bomb survivors LSS cohort, and other epidemiological studies, the International Commission on Radiological Protection (ICRP) recommended a value of DDREF of 2 for doses <200 mGy and dose rates <6 mGy h–1 (ICRP, 2007). For high-linear energy transfer (LET) radiations, such as neutrons and alpha particles, no such reduction factor is indicated because the dose response for tumour induction and hereditary effects following exposure to these sorts of radiation is generally linear, with no variation in effect with dose fractionation (ICRP, 1991; UNSCEAR, 1993).
There are no single epidemiological studies that permit a direct internal comparison – to facilitate calculation of DDREF – between: (1) exposures that are high dose and high dose rate; and (2) exposures that are highly fractionated or protracted. A second-best alternative is to compare risk estimates from the available high dose and high dose rate studies with those from fractionated or protracted dose studies. This approach has been used in some recent meta-analyses of cancer risks in various groups of nuclear workers for comparison with the LSS data, and suggested that DDREF could be <1 (Jacob et al., 2009; Shore et al., 2017). However, such comparisons are fraught with difficulties as they are based on comparison of risks in different exposed populations (e.g. nuclear workers from generally western European and North American countries compared with the Japanese atomic bomb survivors).
The difficulty of using human data is such that reliance will continue to be placed on experimental animal data, where both dose and dose rate can be varied independently in a controlled way. Among the largest sets of animal data are the set of mice irradiated in the JANUS reactor at Argonne National Laboratory (Grahn et al., 1995; Northwestern University, 2016), and the various mouse datasets that comprise the European Radiobiological Archive (ERA) (Bundesamt für Strahlenschutz, 2016). Many studies have analysed the JANUS data, with earlier publications focusing on estimating relative biological effectiveness of various radiation qualities in relation to life shortening (Thomson et al., 1981a,b, 1983, 1985a,b; Thomson and Grahn, 1988; Carnes and Grahn, 1991), and the effects of mouse strain differences (Thomson et al., 1986). Some of these papers also examined the gamma and neutron dose response for various specific causes of death, mainly in relation to tumour or all-cause mortality (Thomson et al., 1985a,b, 1986; Thomson and Grahn, 1988; Carnes and Grahn, 1991; Grahn et al., 1992), and more recently in relation in cardiovascular disease mortality (Hoel and Carnes, 2017). Combining the JANUS and ERA data archives, Haley et al. (2015) recently estimated what they termed ‘DDREFLSS’ (so-called because of its derivation from the Japanese atomic bomb survivor LSS data) modelling inverse mean lifespan, mostly using linear regression with a simple linear-quadratic model of dose recommended by the BEIR VII committee (Committee to Assess Health Risks from Exposure to Low Levels of Ionizing Radiation, 2006). Haley et al. (2015), in fitting to the JANUS and ERA data, found that this linear model did not fit the mouse lifespan data well. However, there are statistical problems with the linear model fitted by Haley et al. (2015), which does not have the correct (normal) error structure.
In the present paper, a somewhat more general model than the simple linear-quadratic model fitted by Haley et al. (2015) was applied to the JANUS mouse data. The model incorporates adjustment for the effects of dose and dose rate (in contrast to Haley et al. who adjusted simply for dose) for specific cancer and non-malignant endpoints, assessing these effects separately following both low-LET gamma radiation and high-LET neutron radiation. This work provides updated insight into the ongoing debate about DDREF. Full analysis of the JANUS mouse data has been published previously (Tran and Little, 2017). The aim of the present study is to add to the body of knowledge on the effects at low dose and dose protraction to inform estimates of LDEF and DREF, and, to some extent, DDREF needed for radiological protection. This paper also cursorily reviews human data that allow direct estimates of low dose and low dose rate risk.
2. METHODS
2.1. Mouse data
Murine experiments were conducted at the JANUS reactor in Argonne National Laboratory from 1970 to 1992 to study the effect of acute and protracted radiation dose from gamma rays and fission neutron whole-body exposure (Grahn et al., 1995; Northwestern University, 2016). Survival time and gross pathology were recorded at death. The JANUS data archive (Northwestern University, 2016) contains 50,110 mice from 13 experiments. For each experiment, mice were allocated to a control group and a radiation group. With the exception of one experiment performed on male Peromyscus leucopus (white-footed deer mouse), all experiments were performed on Mus musculus (a laboratory strain derived from the house mouse). After exclusion of mice that were not autopsied, discarded, improperly irradiated, removed to another experiment, or died before or during the first irradiation (n = 9011), and mice from a radioprotection experiment (n = 3685), mice from a controls-only experiment (n = 660) (which would yield no information on radiation effect), mice that had sex-specific tumours that were discrepant with the sex of the mouse (n = 17), and mice that had only non-lethal pathologies or non-identifiable pathologies (n = 19), 36,718 mice remained. Of these, 16,973 mice were irradiated with neutrons, 13,638 mice were irradiated with gamma rays, and 6107 mice were controls. Of the control mice, 5080 were common to both radiation types, 671 were controls in neutron experiments alone, and 356 were controls in gamma experiments alone.
Number of pathologies by radiation type, dose range, and lag period applied.
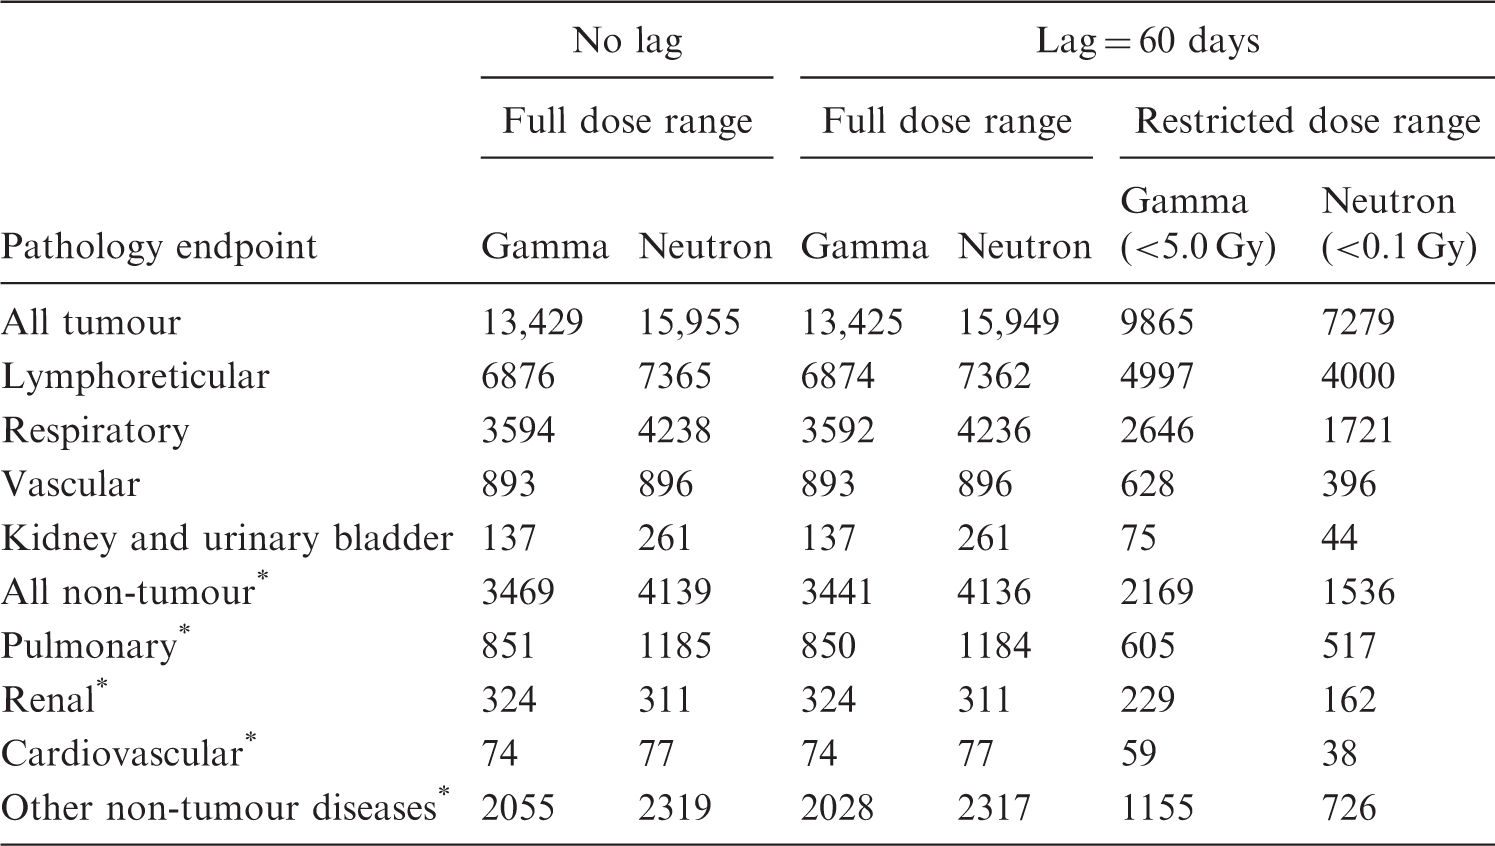
Non-tumour outcomes.
A period of 60 days was used to lag doses and entry dates for irradiated mice.
2.2. Statistics
If the expected number of excess cancers that results from a single acutely delivered dose D is 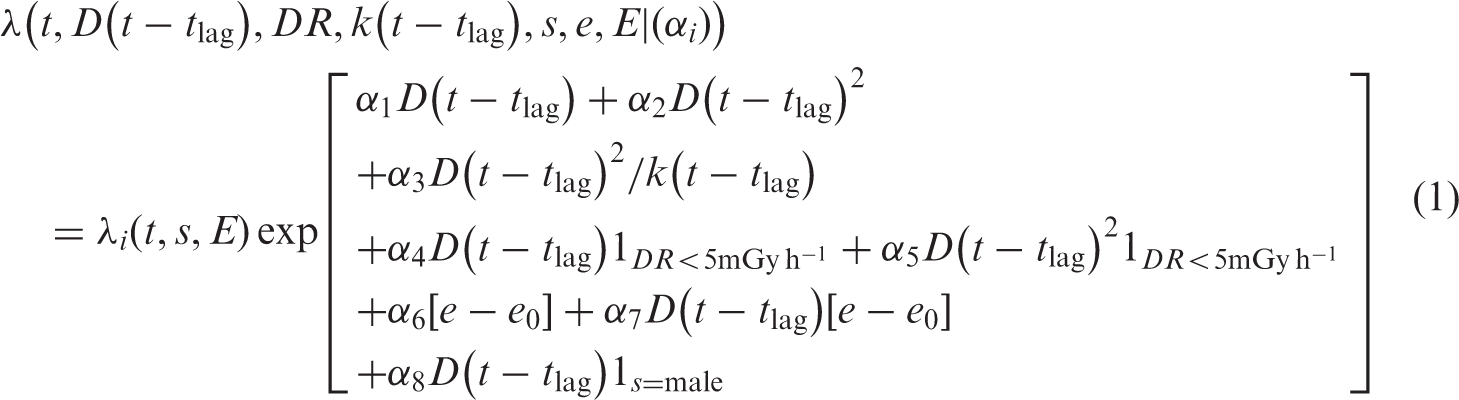
From Eq. (1), DREF, the ratio of acute to chronic low dose rate slopes, is:

For females exposed at mean age at exposure e0, this reduces to:

It should be noted that, occasionally, DREF < 0. In these cases, it is generally because 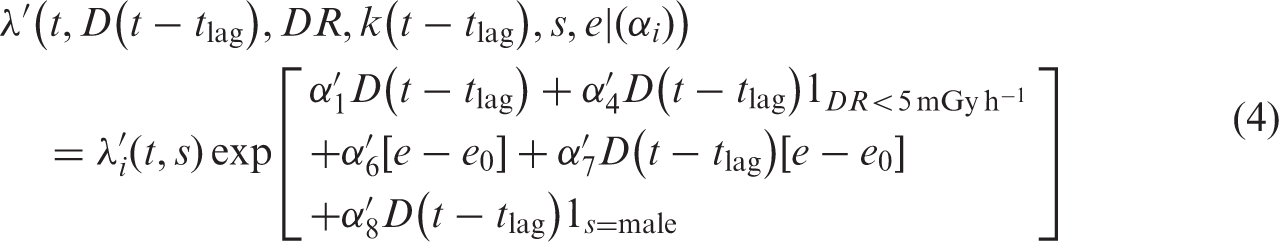
LDEF is then given by the ratio of the limiting slope of Eq. (4) to the limiting slope of Eq. (1), namely:

Therefore, LDEF at high dose rate for females at the mean age at study entry e0 is given by:
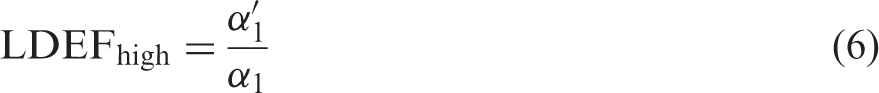
An LDEF (DREF) of 1 implies that there is no reduction in risk at low dose (low dose rate) compared with high dose (high dose rate). Values less than 1 imply greater risk at low dose (low dose rate), and values greater than 1 imply a risk reduction from high dose (high dose rate) to low dose (low dose rate). To arrive at confidence intervals for LDEF and DREF, non-parametric bootstrap techniques (Efron, 1981), sampling from the dataset with replacement, were used to generate at least 200 samples of the same size as the original data set, and 95% confidence intervals (CI) were calculated from the 2.5% and 97.5% percentiles. Parameter estimation was performed in the R packages ‘survival’ (Therneau, 2016) and ‘boot’ (Ripley, 2016). All R code used is contained in the electronic supplementary material of the companion paper (Tran and Little, 2017).
A latent period of
The linear-quadratic or linear models that underlie LDEF and DREF implicitly assume that the dose–response curve is approximately linear at sufficiently low doses (Pierce and Vaeth, 1991; Little and Muirhead, 2000). To assess the sensitivity of model fits to this assumption, a restricted dose range <5.0 Gy for gamma radiation and <0.1 Gy for neutron radiation was considered. The higher limit for gamma radiation was chosen to yield sufficient data for analysis. Survival models, LDEF, and DREF were estimated to test the assumption of linearity and dose rate effect in these lower dose ranges.
3. RESULTS
3.1. Gamma
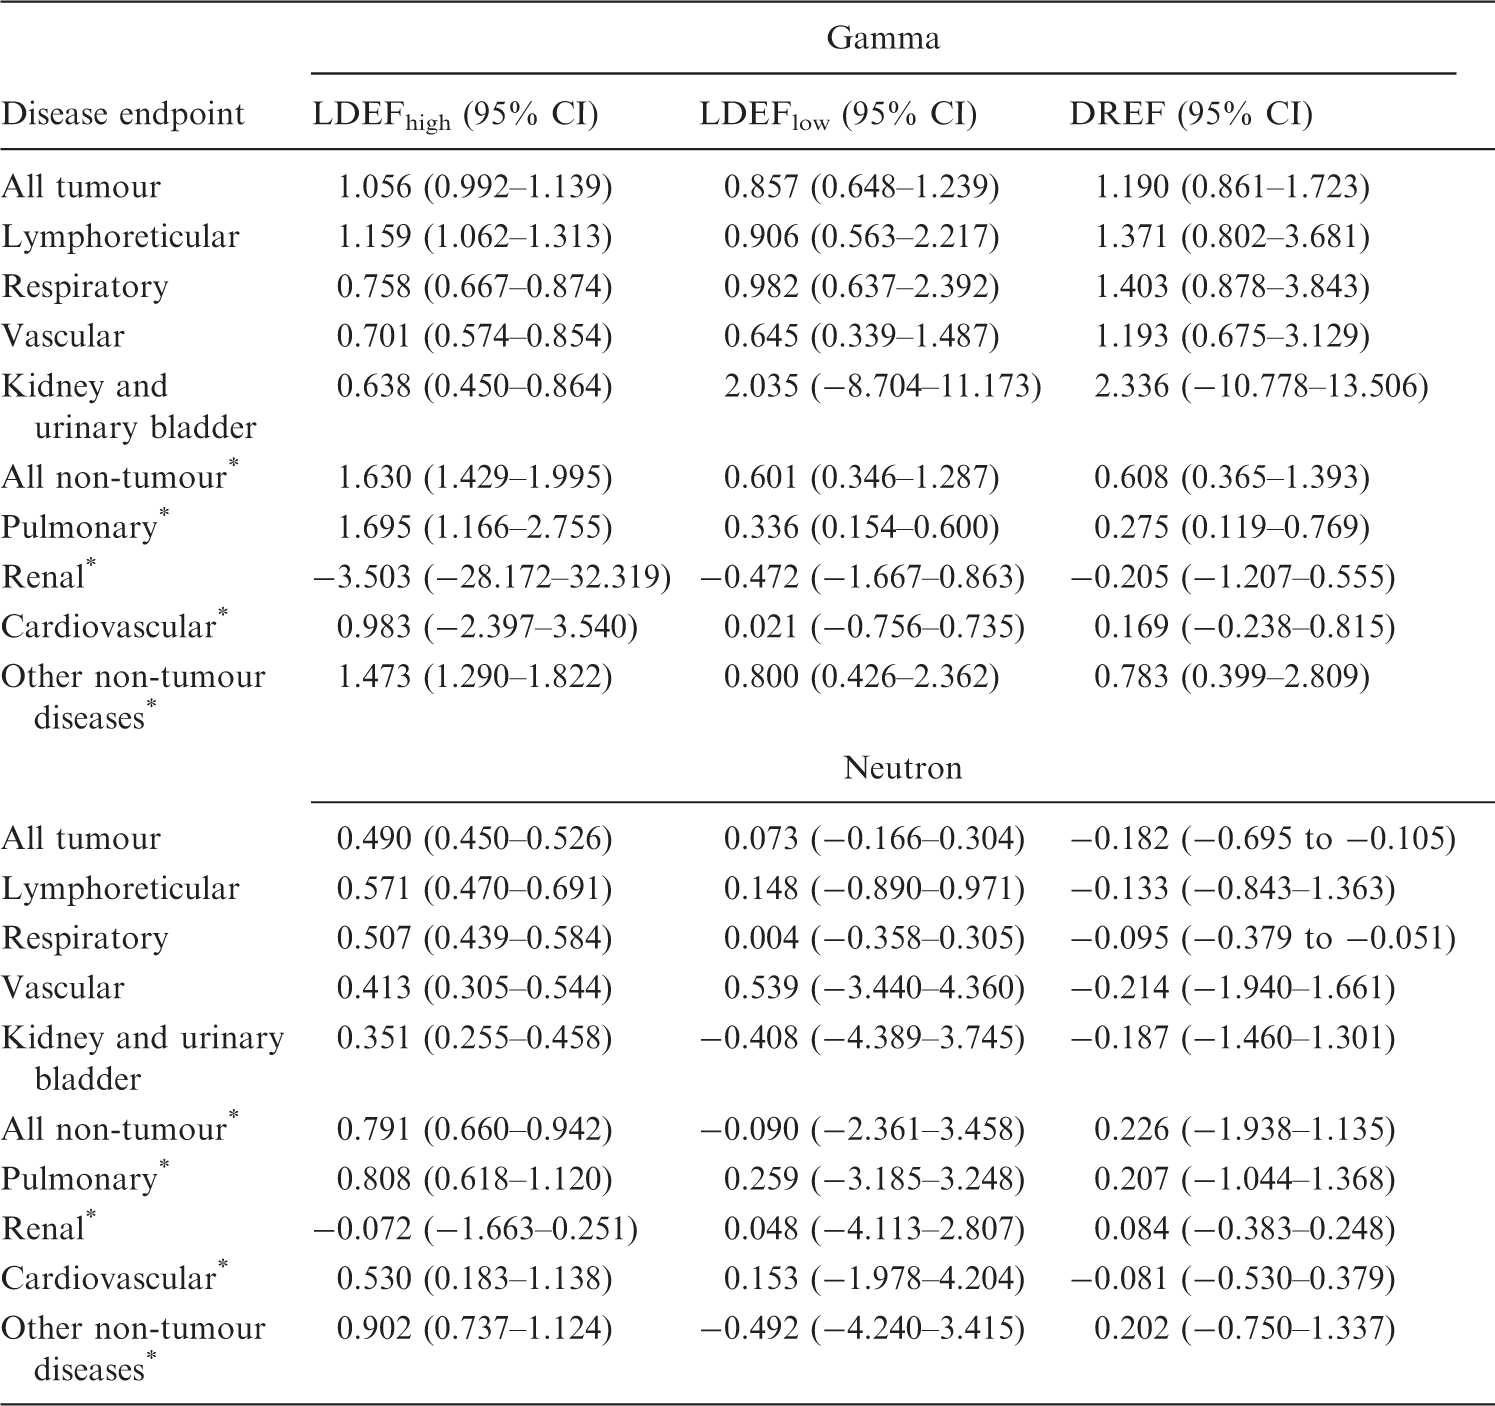
Low dose extrapolation factor (LDEF) and dose rate extrapolation factor (DREF) estimates and 95% confidence intervals (CI) calculated from at least 200 bootstrap samples by pathology and radiation type resulting from fitting Eq. (1).
Non-tumour outcomes.
In contrast, Table 2 shows that DREF > 1 for many tumour sites, with most central estimates in the range 1.2–2.3, although this was not conventionally statistically significant. For most non-malignant endpoints, DREF < 1, and for some sites, this departure from 1 was statistically significant, particularly pulmonary disease (DREF = 0.275, 95% CI 0.119–0.769), renal disease (DREF = −0.205, 95% CI −1.207–0.555), and cardiovascular disease (DREF = 0.169, 95% CI −0.238–0.815) (Table 2). These results are generally similar in unlagged analyses (results not shown).
Low dose extrapolation factor (LDEF) and dose rate extrapolation factor (DREF) estimates and 95% confidence intervals (CI) calculated from at least 200 bootstrap samples by pathology and radiation type resulting from fitting Eq. (1).
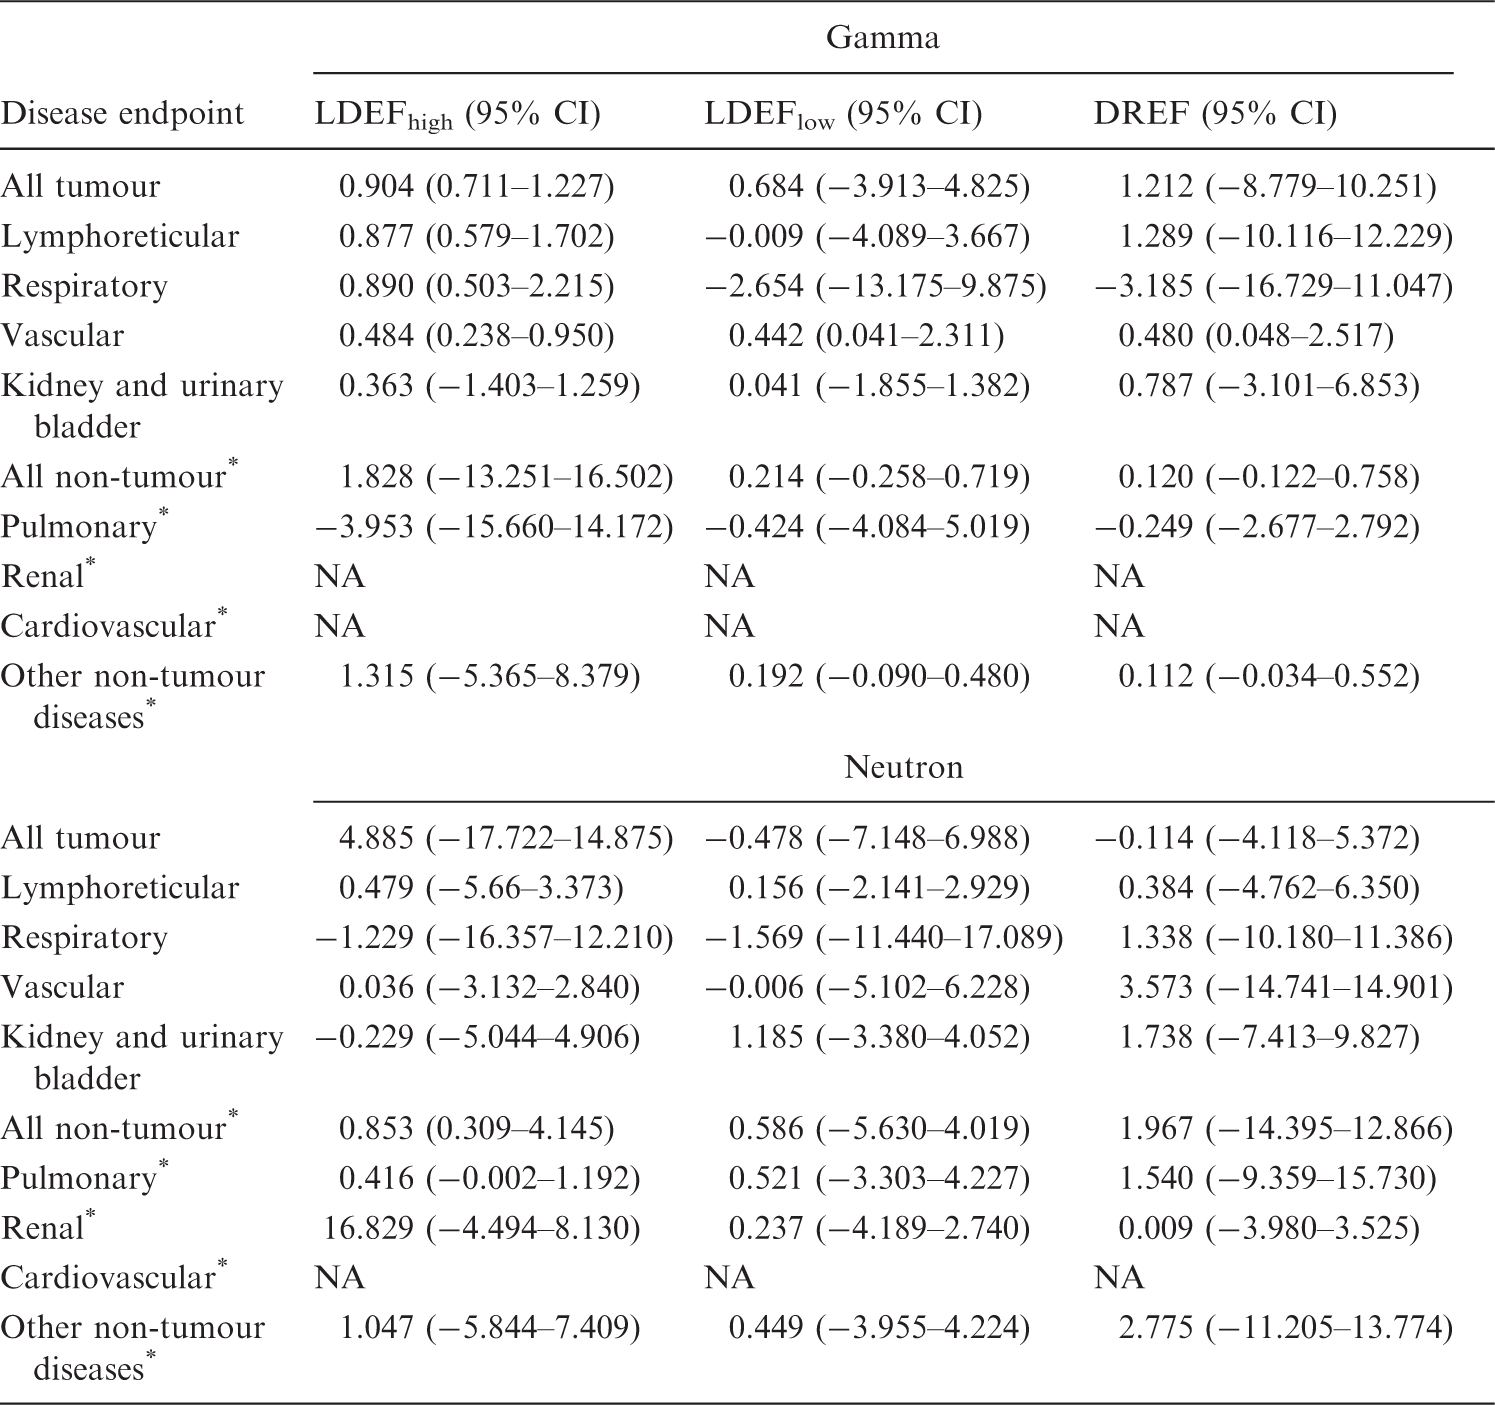
NA, not available.
Non-tumour outcomes.
3.2. Neutron
In contrast to gamma, Table 2 shows that LDEFhigh is generally significantly <1 for most malignant endpoints, with central estimates of LDEFhigh mostly in the range 0.1–0.5. For non-malignant endpoints, the central estimates of LDEFhigh are also <1, although not always significantly, but the reduction below 1 is significant for all non-tumour disease (LDEFhigh = 0.791, 95% CI 0.660–0.942) and renal disease (LDEFhigh = −0.072, 95% CI −1.663–0.251). Table 2 shows that LDEFlow is generally <1 for all endpoints, even if this was not conventionally statistically significant; the reduction below 1 was significant for all tumours (LDEFlow = 0.073, 95% CI −0.166–0.304), lymphoreticular tumours (LDEFlow = 0.148, 95% CI −0.890–0.971), and respiratory tumours (LDEFlow = 0.004, 95% CI −0.358–0.305). These results are generally similar in unlagged analyses (results not shown).
Again in contrast to gamma, Table 2 demonstrates that DREF was generally in the range 0.0–0.2 for most malignant and non-malignant endpoints, and in many cases (all tumours, respiratory tumours, non-malignant renal disease, and cardiovascular disease), DREF was significantly <1. These results are generally similar in unlagged analyses (results not shown).
Applying the dose restriction ≤0.1 Gy results in many endpoints having LDEFhigh and LDEFlow <1, although not significantly (Table 3). DREF varies across endpoints, with none achieving significant departure from 1.
4. DISCUSSION
This paper reports the re-analysis of a large series of gamma- and neutron-irradiated mice. The optimal model used a relative risk formulation with linear and quadratic terms in cumulative lagged dose, with adjustments to both linear and quadratic dose terms for low dose rate irradiation (<5 mGy h–1) and with adjustments to the dose for age at exposure and sex. In general, after gamma radiation, the dose response for both malignant and non-malignant disease is mostly upward curving, with reduced risk per unit dose at low doses; there is reduced risk per unit dose at low dose rates (<5 mGy h–1) for most malignant endpoints, and increased risk per unit dose at low dose rates for all non-malignant endpoints. After neutron exposure, the dose response is generally downward curving, with increased risk per unit dose at low doses for most malignant and non-malignant endpoints; for most malignant endpoints, there are non-significant indications of reduced risk per unit dose at low dose rate (<5 mGy h–1), but for most non-malignant endpoints, there are non-significant indications of increased risk per unit dose at low dose rate. For some tumour sites, after gamma radiation, LDEF is slightly >1, but for most, LDEF was either indistinguishable from 1 or significantly <1. For example, for all tumours, LDEFhigh is 1.056 (95% CI 0.992–1.039) and LDEFlow is 0.857 (95% CI 0.648–1.239) (Table 2); however, there is considerable spread about this (what might be considered central) estimate. For many tumour sites after gamma radiation, DREF > 1, with most central estimates in the range 1.2–2.3, but generally not significantly different from 1. So, for example, the all tumour DREF is 1.190 (95% CI 0.861–1.723) (Table 2); again, however, there is considerable spread about this (what might be considered central) estimate, and the upper 95% CI in particular for certain sites attain or exceed 10. For many non-tumour sites after gamma radiation, DREF < 1, with most central estimates in the range 0.2–0.8. For all tumour and non-tumour sites after neutron radiation, LDEF generally lies in the range 0.1–0.9, and is mostly significantly <1. After neutron exposure, DREF was quite often near 0 or negative for most malignant and non-malignant endpoints, and in many cases was significantly <1. A limitation of the data for the purposes of inference on DREF is the limited numbers of mice exposed at low dose rates; only 5% of the gamma-irradiated animals and only 9% of the neutron-irradiated mice were exposed at <5 mGy h–1 (Tran and Little, 2017). This limits power to infer DREF, but should not bias inference on this measure. The limits of the low dose groups used (5 Gy for gamma rays and 0.1 Gy for neutrons) are arguably not very low, but as the companion paper makes clear, there is little information at lower doses (Tran and Little, 2017). As with the analysis of Haley et al. (2015) of this data, it is reasonably clear that the simple linear-quadratic model proposed by the BEIR VII committee (Committee to Assess Health Risks from Exposure to Low Levels of Ionizing Radiation, 2006) does not fit the JANUS gamma or neutron data at all well (Tran and Little, 2017).
Perhaps the most remarkable aspects of the present findings relate to the dose and dose rate effects of neutrons. It is generally thought that LDEF = DREF = 1 for neutrons and other high-LET radiation (e.g. alpha particles) because, in general, the dose response for tumour induction following exposure to these types of radiation is linear, with no variation in effect with dose rate (ICRP, 1991; UNSCEAR, 1993). The reason for this may be connected to the fact that, at the level of the cell nucleus, there is no such thing as a low dose rate; although only approximately 1.5% of cells have a neutron traversal of the cell nucleus following a tissue dose of 3 mGy (30 mSv), every cell nucleus that is traversed by a neutron receives a large dose of approximately 0.2 Gy (2 Sv) (Brackenbush and Braby, 1988). Therefore, the instantaneous dose rate at the level of the cell nucleus is unavoidably high (>5 mGy h–1 (Wakeford and Tawn, 2010).
Excess relative risk (ERR) coefficients for childhood cancer following radiation exposure in utero (Wakeford and Little, 2003).
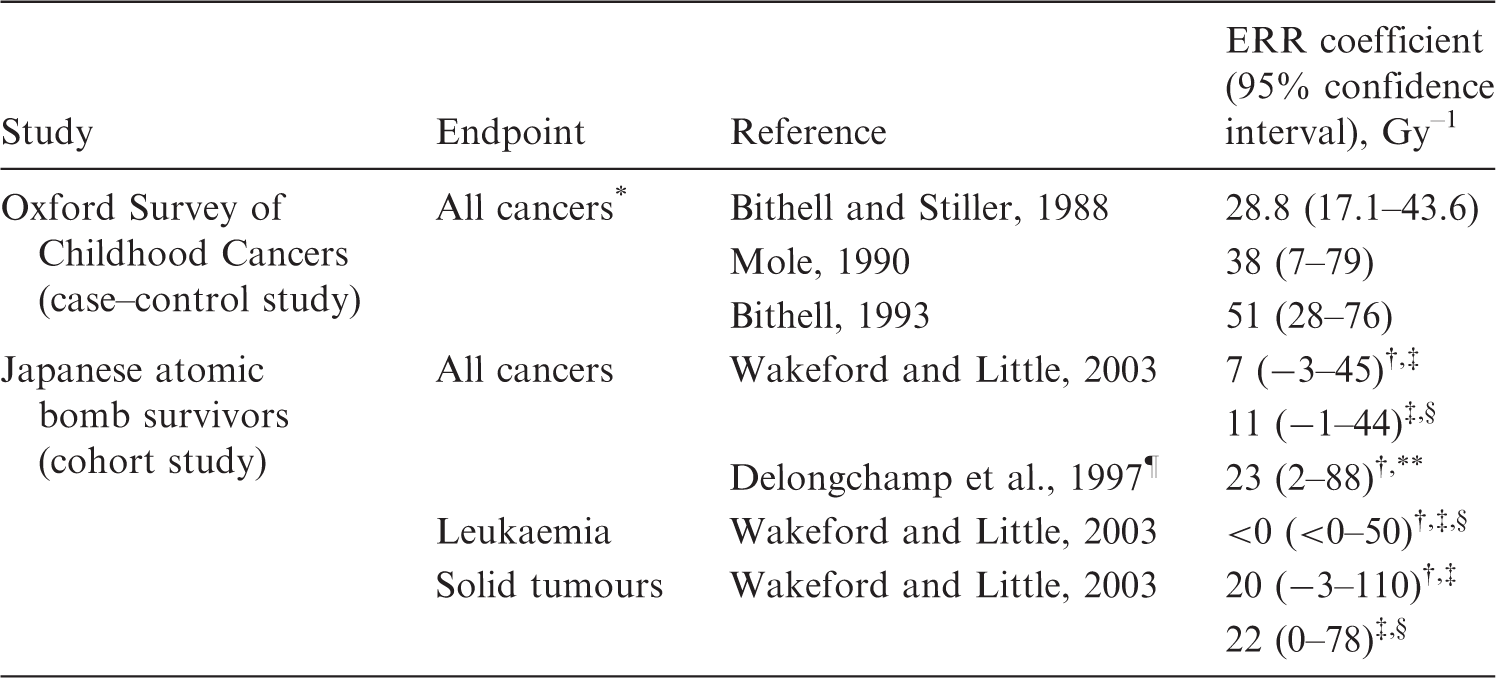
ERR coefficients for leukaemia and solid tumours are taken to be the same as that for all cancers (see Wakeford and Little, 2003).
Mortality data.
‡Based on extended birth cohort.
Incidence data.
Obtained from follow-up commencing 1 October 1950.
90% confidence interval.
Excess relative risks (ERR) in the UK-NCI computed tomography study (Pearce et al., 2012), Japanese atomic bomb survivor Life Span Study (LSS) (Preston et al., 2007; Hsu et al., 2013), and various background radiation studies (Kendall et al., 2013; Spycher et al., 2015; Nikkila et al., 2016; Demoury et al., 2017).
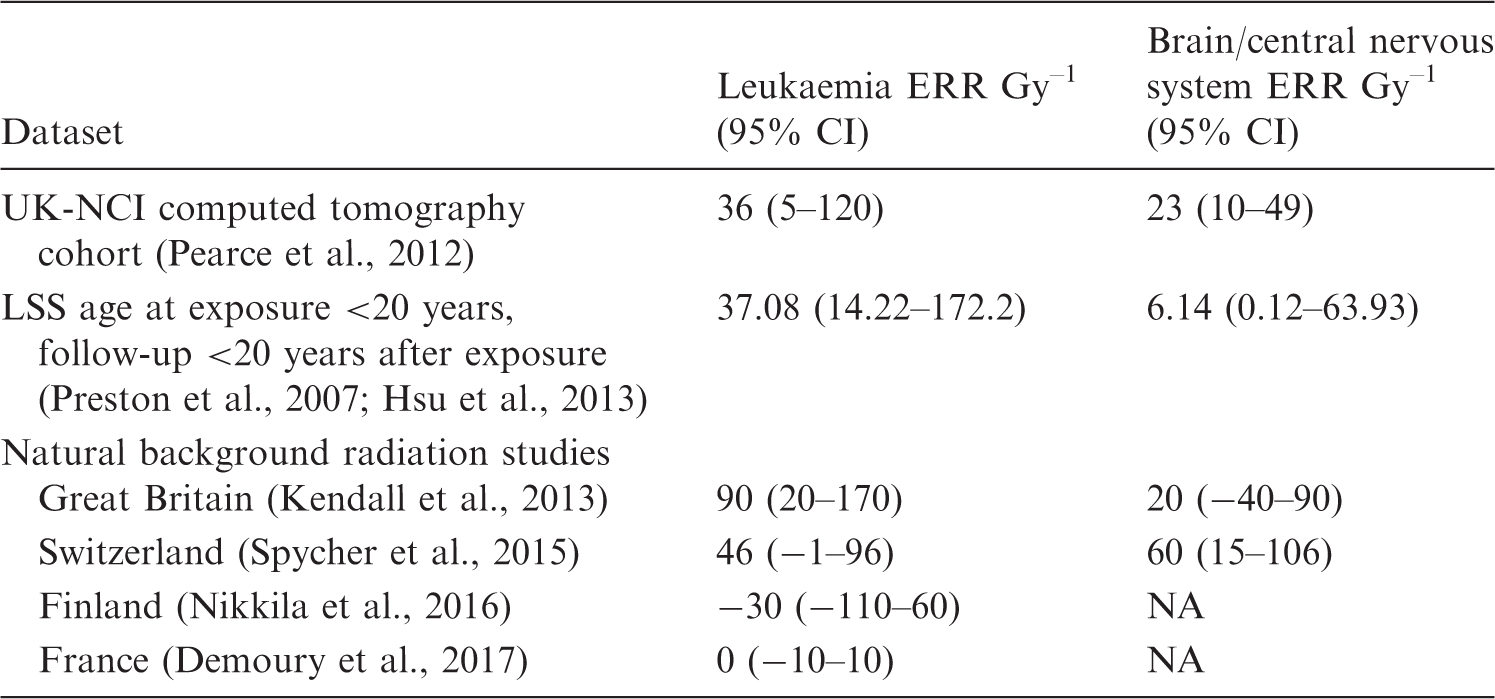
CI, confidence interval; NA, not available.
Nevertheless, the human data are uninformative regarding the effects of dose rate (i.e. DREF), as there is no single population exposed to the effects of both high and low dose rate radiation. As such, animal data, such as the data used here, represent the best source of information available at present on dose rate effects. However, there is human information on the effects of extrapolation of dose (i.e. LDEF). In the LSS, there is emerging mortality and incidence data suggesting that there is modest upward curvature in the solid cancer dose response (Ozasa et al., 2012; Grant et al., 2017); as such, the ratio of quadratic/linear coefficients
Footnotes
5. Acknowledgements
The author is grateful for the detailed and helpful comments of the two referees. This work was supported by the Intramural Research Program of the National Institutes of Health, National Cancer Institute, Division of Cancer Epidemiology and Genetics, and by ICRP Committee 1 Task Group 91.