
Abstract
In 2014, a team of high school students and teachers measured individual exposure doses using D-Shuttle dosimeters. In total, 216 students and teachers participated in the project, with the cooperation of 12 high schools in Japan (six from Fukushima Prefecture), four from France, eight from Poland, and two from Belarus. The participants wore the dosimeters for 2 weeks and recorded their locations in diary charts. The distribution of annual exposure doses for each school and region, estimated from the measured results, overlapped. It was concluded that the external exposure of high school students in Fukushima Prefecture was not markedly higher compared with that of students from other regions.
Keywords
1. INTRODUCTION
The accident at Fukushima Daiichi nuclear power plant, triggered by the Great East Japan Earthquake, has given rise to concerns of contamination caused by radioactive material fallout. In Fukushima City, glass badges were rented to all school children and pregnant women from Autumn 2011 to measure individual exposure doses. However, this survey only provided data on cumulative doses over a certain period of time (3 months), and the sources of the cumulative doses were unknown.
The D-Shuttle dosimeter (Fig. 1) is able to record integrated exposure doses from natural background radiation and additional doses on an hourly basis. Its efficacy has been confirmed previously in other studies, and Professor Hayano of the University of Tokyo has highlighted the effectiveness of using D-Shuttle dosimeters to communicate the state of exposure to residents. Coop Fukushima has undertaken a comparison of individual doses inside and outside Fukushima Prefecture with the cooperation of its members, but to date, no surveys of individual exposure doses for high school students have been reported. As such, this article reports an individual dose study undertaken by members of the Super Science Club of Fukushima High School, with the cooperation of high schools in Fukushima Prefecture and elsewhere, using D-Shuttle dosimeters to record individual dose among high school students and teachers.
D-Shuttle dosimeter.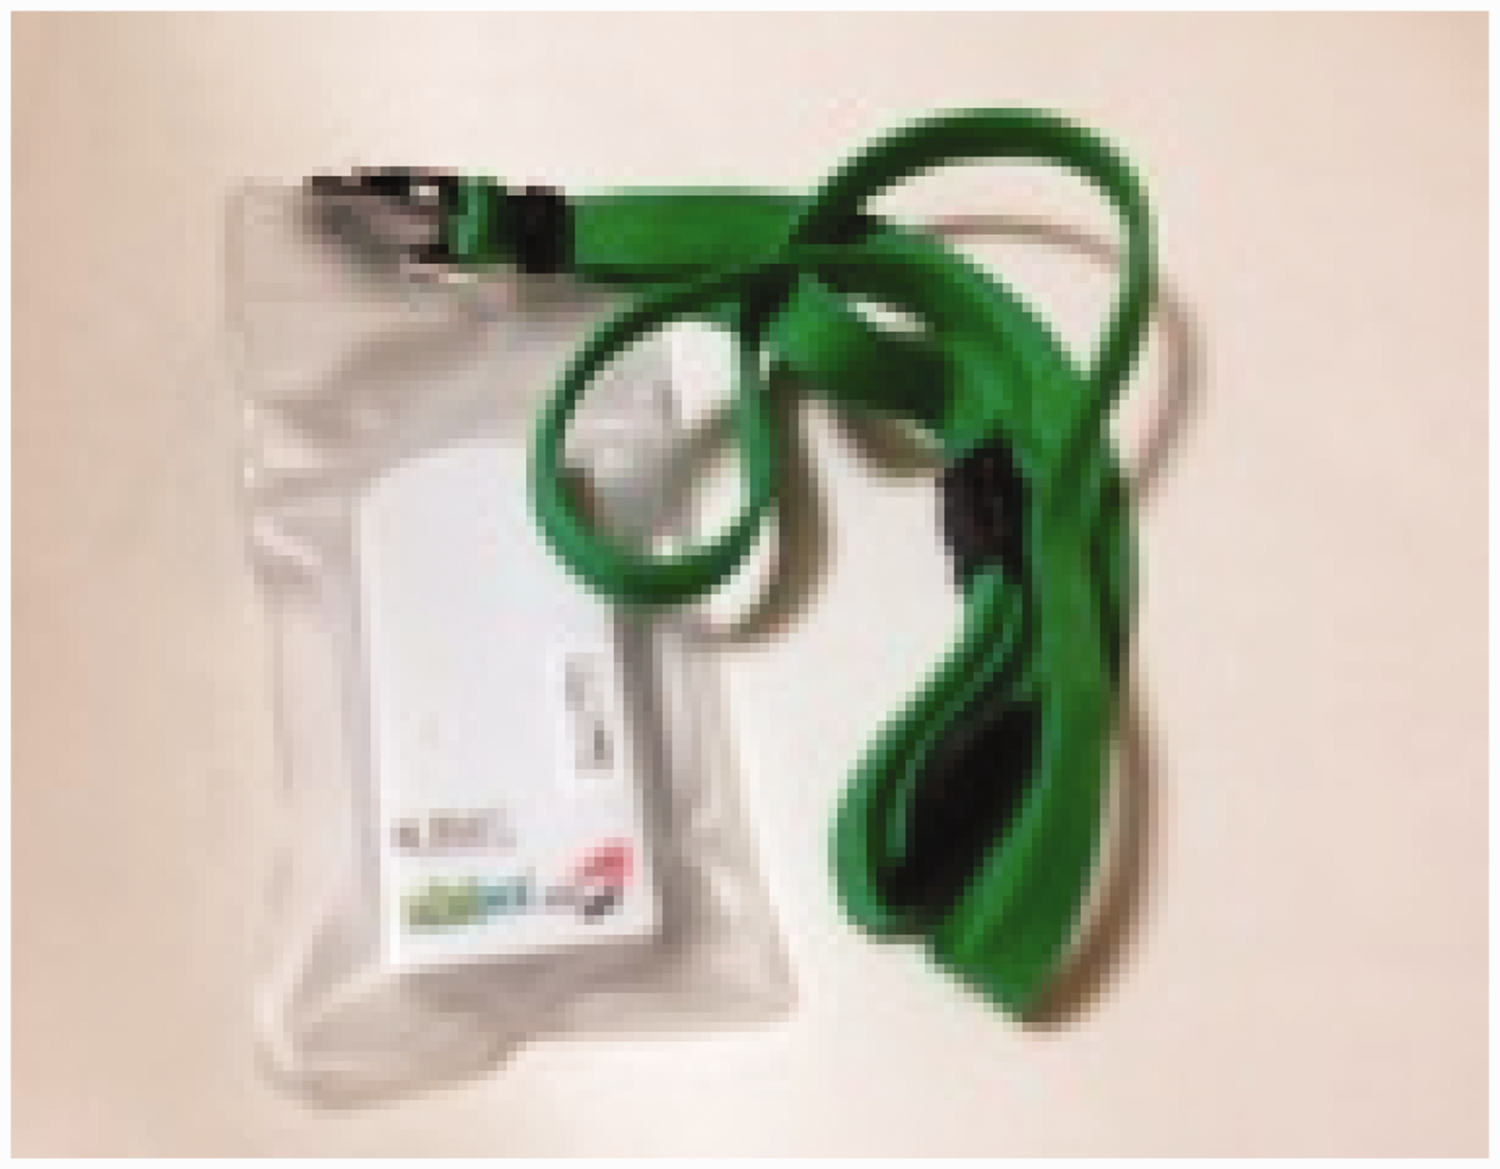
2. METHODOLOGY
Schools participating in the individual dose study.
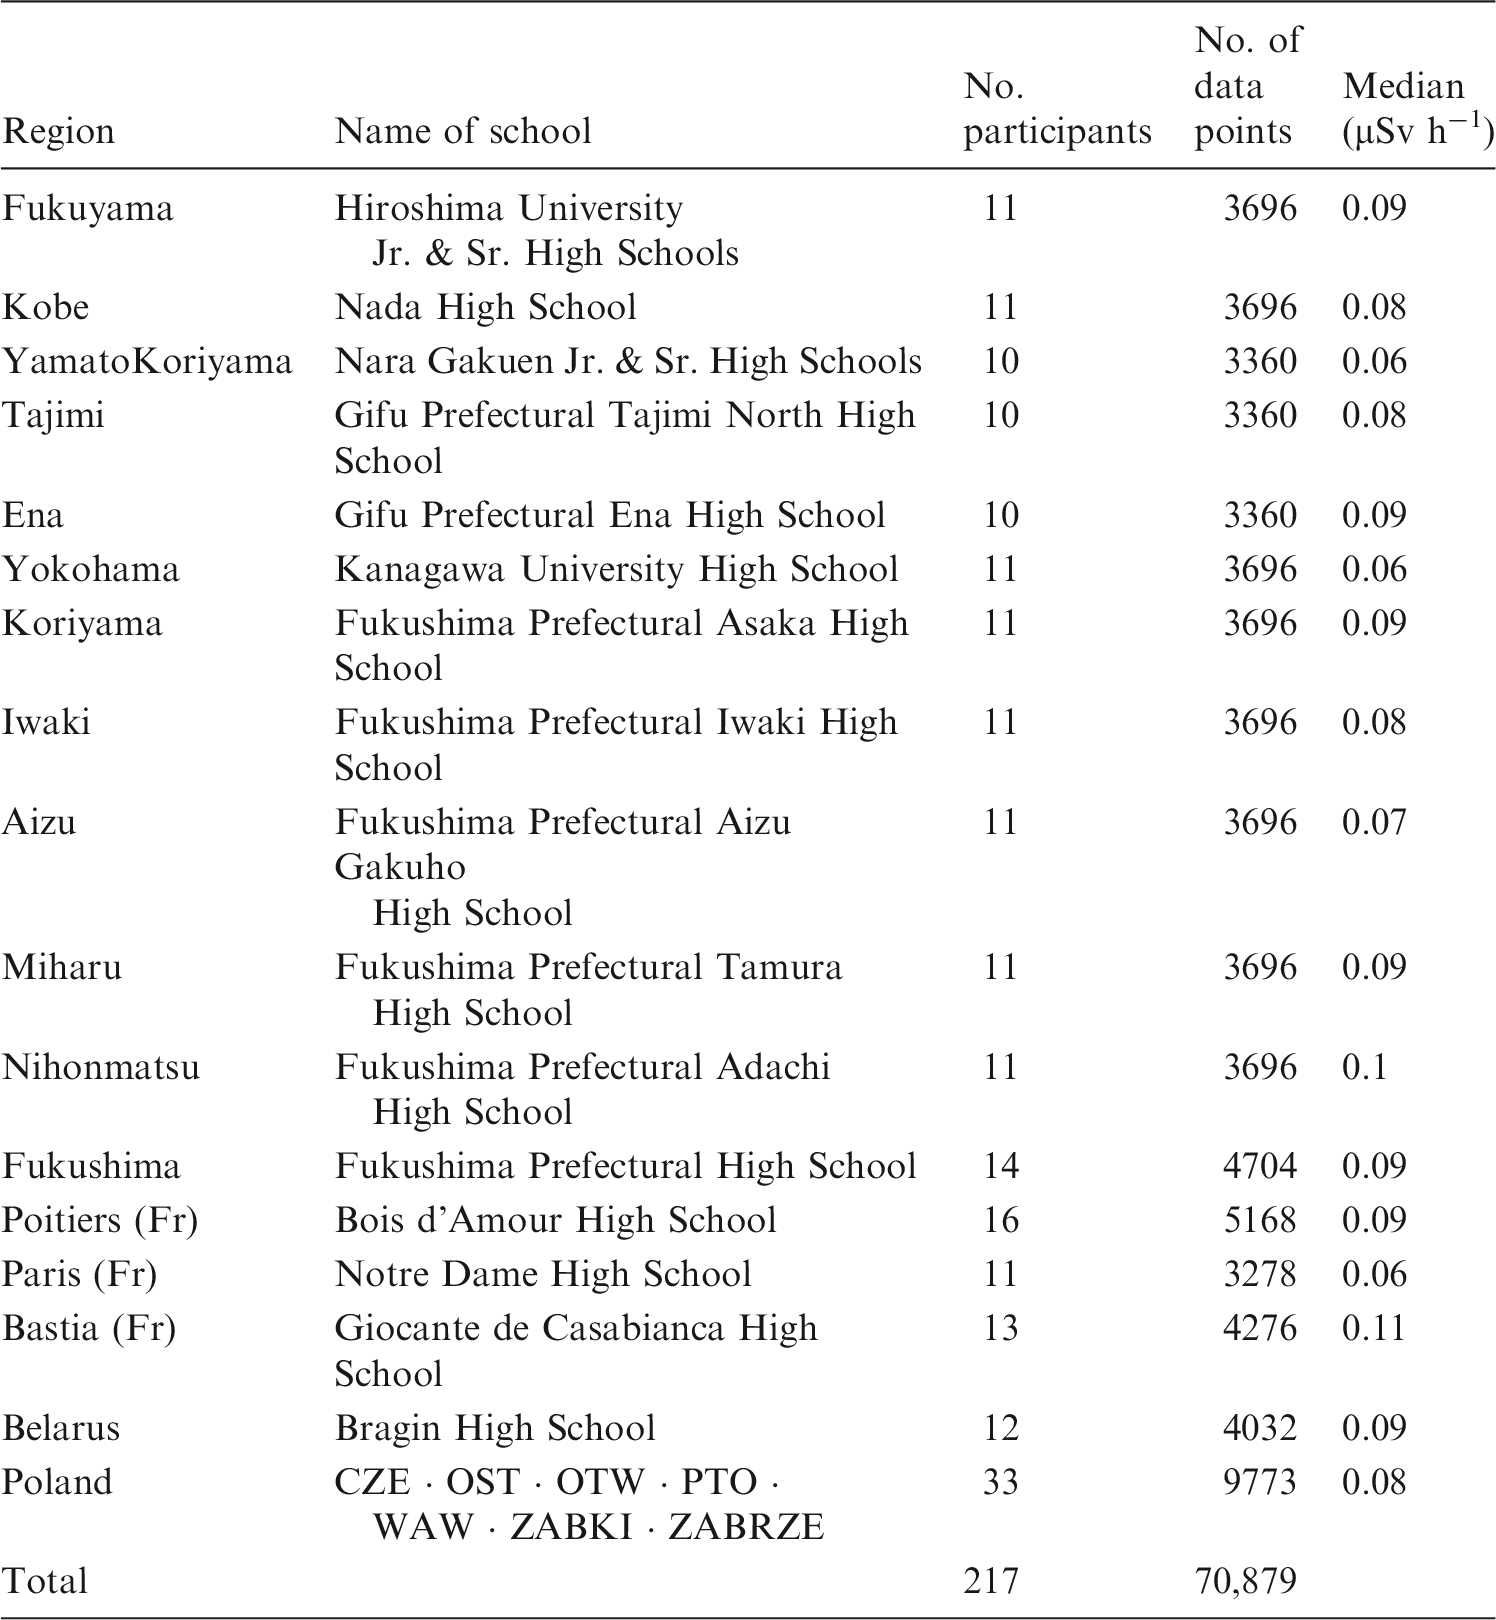
Fr, France.
The high schools were asked to select students from diverse environments. Diversity of lifestyle was considered to be important so that, for example, the students would not all live in apartment complexes or in the same neighbourhood, and the students would not all be members of field sports clubs. The study was conducted from 18 June to 1 July 2014 for the 12 high schools in Japan; the specific study periods differed for overseas countries but were implemented for a 2-week period between October and December 2014.
This study used D-Shuttle dosimeters. These semi-conductor-type individual dosimeters were jointly developed by the National Institute of Advanced Industrial and Science and Technology and Chiyoda Technol Corporation. D-Shuttle dosimeters can lodge hourly cumulative dose (dose rate) with the date and time, so the data can be viewed against the record of daily life and thereby show when and where a person was exposed to radiation. Each participant was asked to wear a D-Shuttle dosimeter around their neck during the day, and to leave it next to their pillow while sleeping.
For each participant, there were 24 data points/day × 14 days = 336 data points. This equated to approximately 3600 data points per school, and totalled 70,879 data points for the 216 participants.
3. RESULTS
3.1 Comparison of dose rates for each school
Fig. 2 compares the average dose rates measured over the 2-week period for each school in Japan. Individual doses were higher in Fukushima, Nihonmatsu (Adachi High School), and Koriyama (Asaka High School) compared with Aizu Wakamatsu and Iwaki. It should be noted that these values include the natural background radiation dose counts. However, when comparing the individual doses of students from Fukushima, Nihonmatsu (Adachi High School), and Koriyama (Asaka High School) with those of students from schools outside Fukushima Prefecture, they were equal to the values found at high schools in Ena (Gifu Ena High Schoo), Fukuyama (Fukuyama Univ. Jr. & Sr. High School), and Kobe (Nada High School). The dose counts from outside Fukushima Prefecture represent those of natural background radiation dose alone. These comparisons show that although the impact of the accident at Fukushima Daiichi nuclear power plant can be seen on the individual doses of the students in Fukushima Prefecture, the gap is not huge compared with individual doses received from natural background radiation.
Comparison of average dose rates in Japan.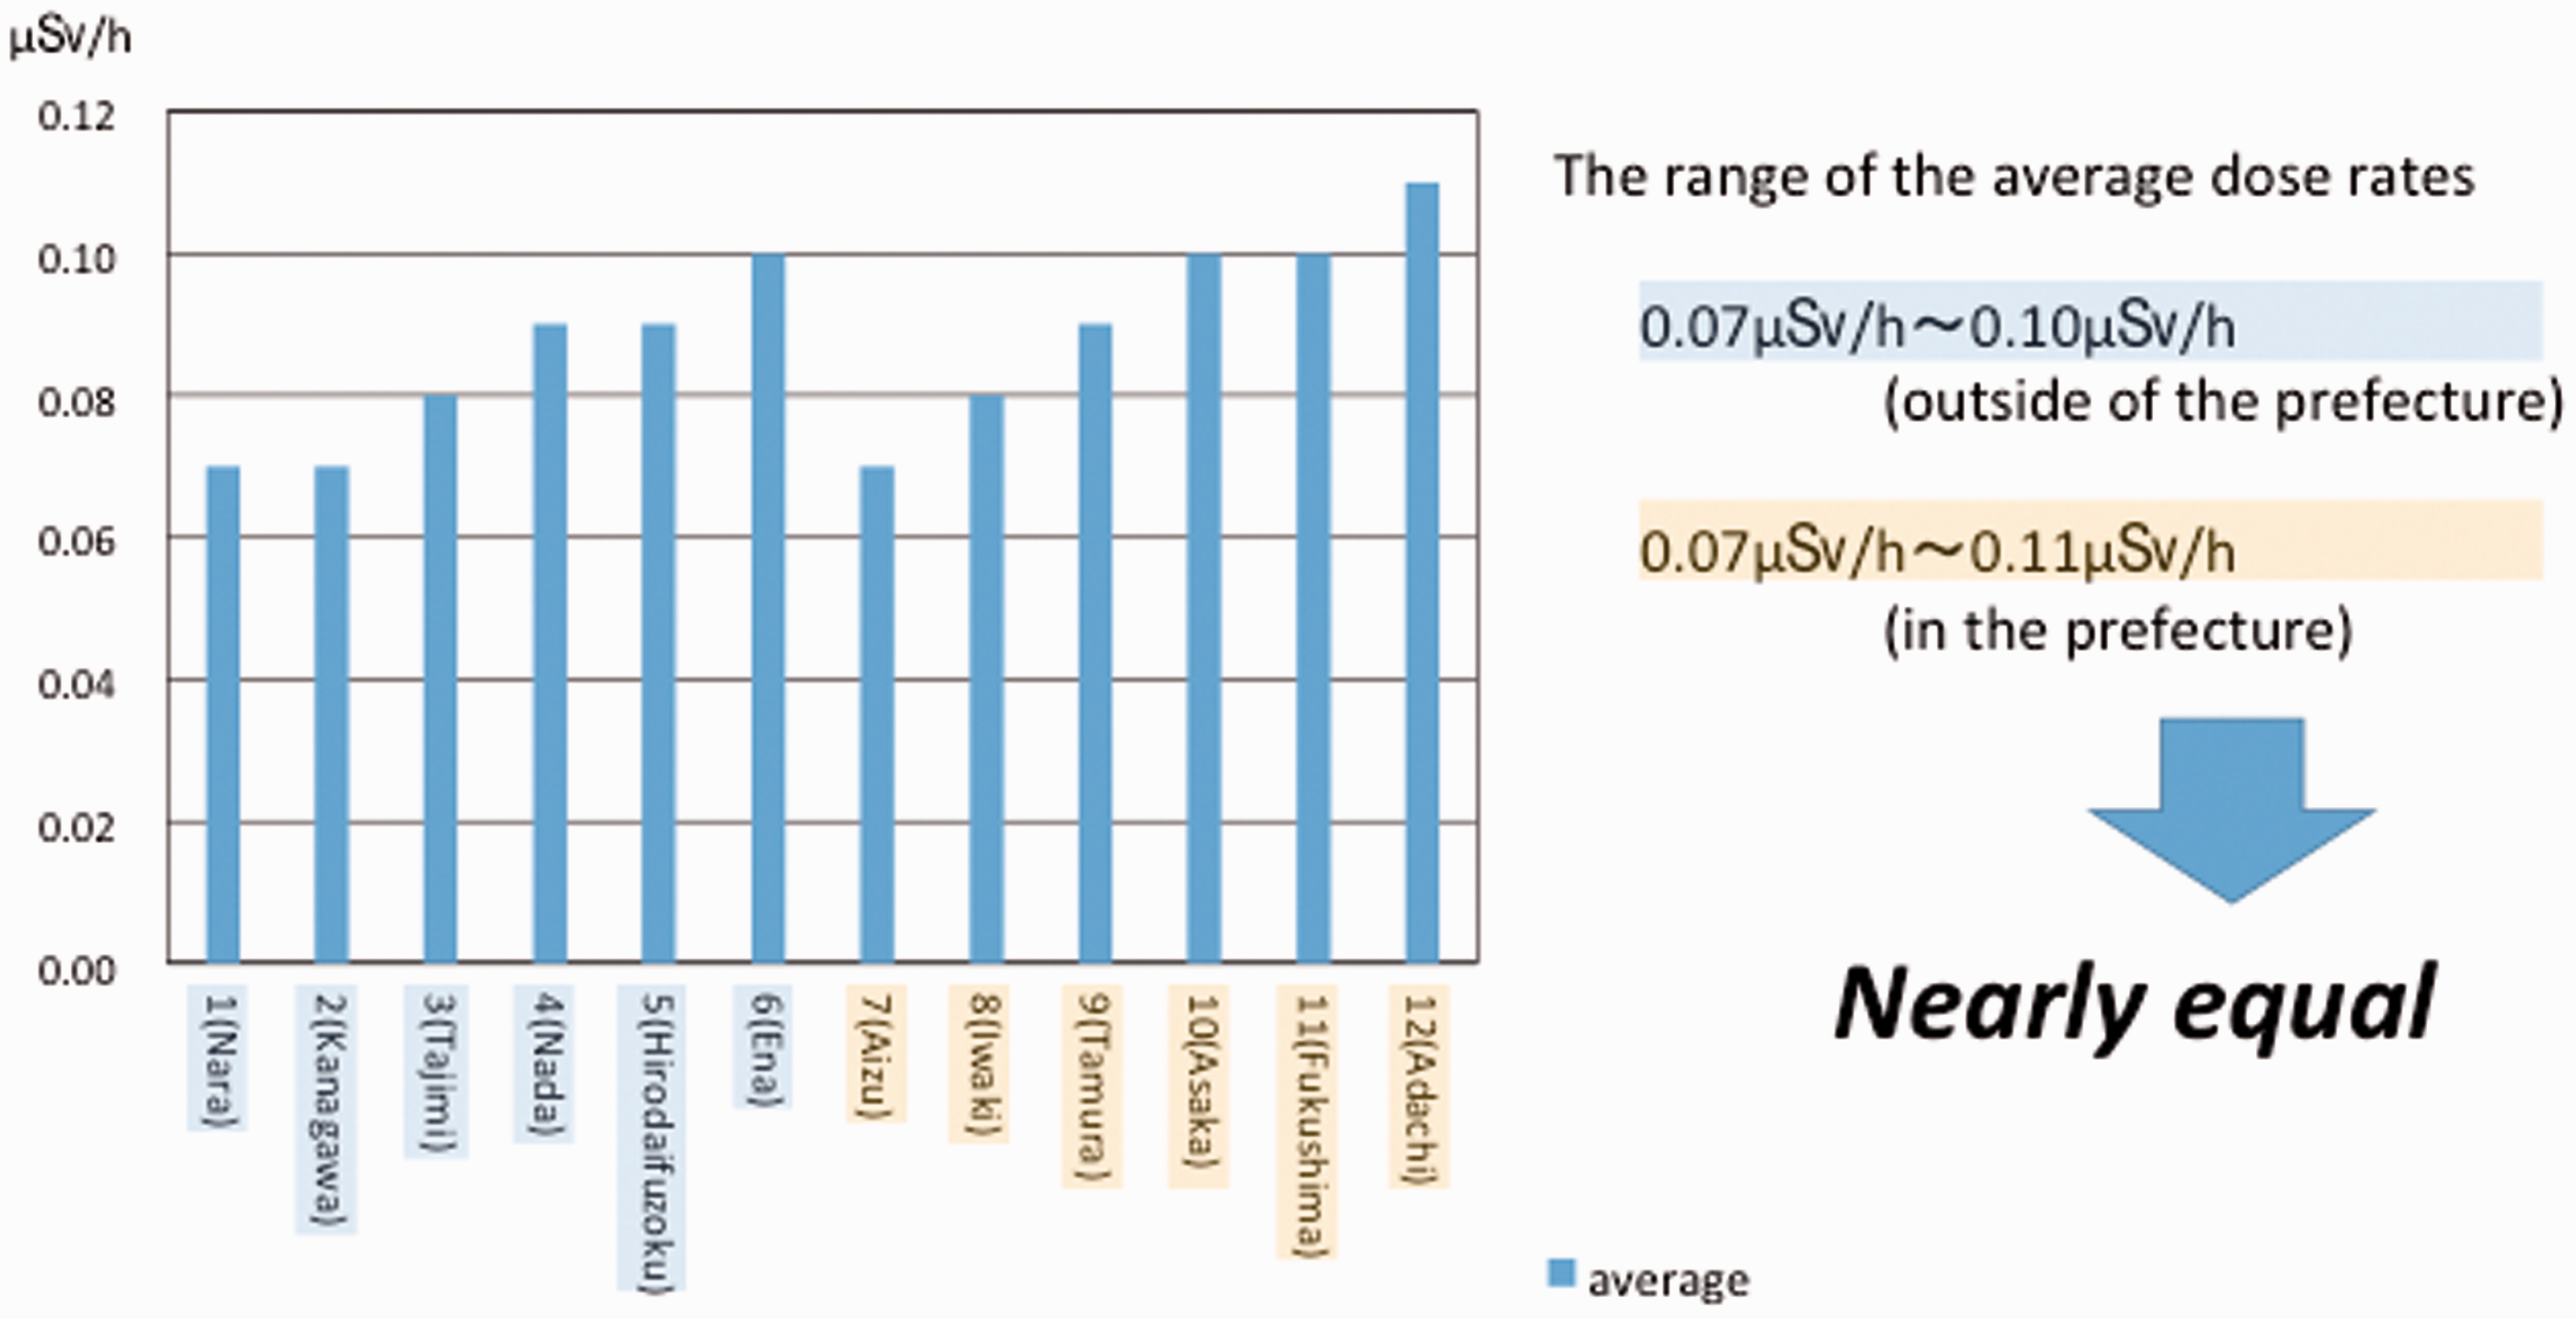
Fig. 3 shows a box-and-whisker graph of data from each school. The x axis indicates the names and regions of the schools, and the y axis indicates the dose rates (unit: µSv h-1) with a logarithmic scale. The bottom line of the box for each school represents the first quartile value (25th percentile), the vertical line represents the median, and the top line represents the third quartile value (75th percentile). The lengths of the whiskers are 1.5 times the lengths of the boxes, and X indicates outliers. The total value of the outliers is 1059, or 1.5% of the data.
Comparison of dose distribution by school.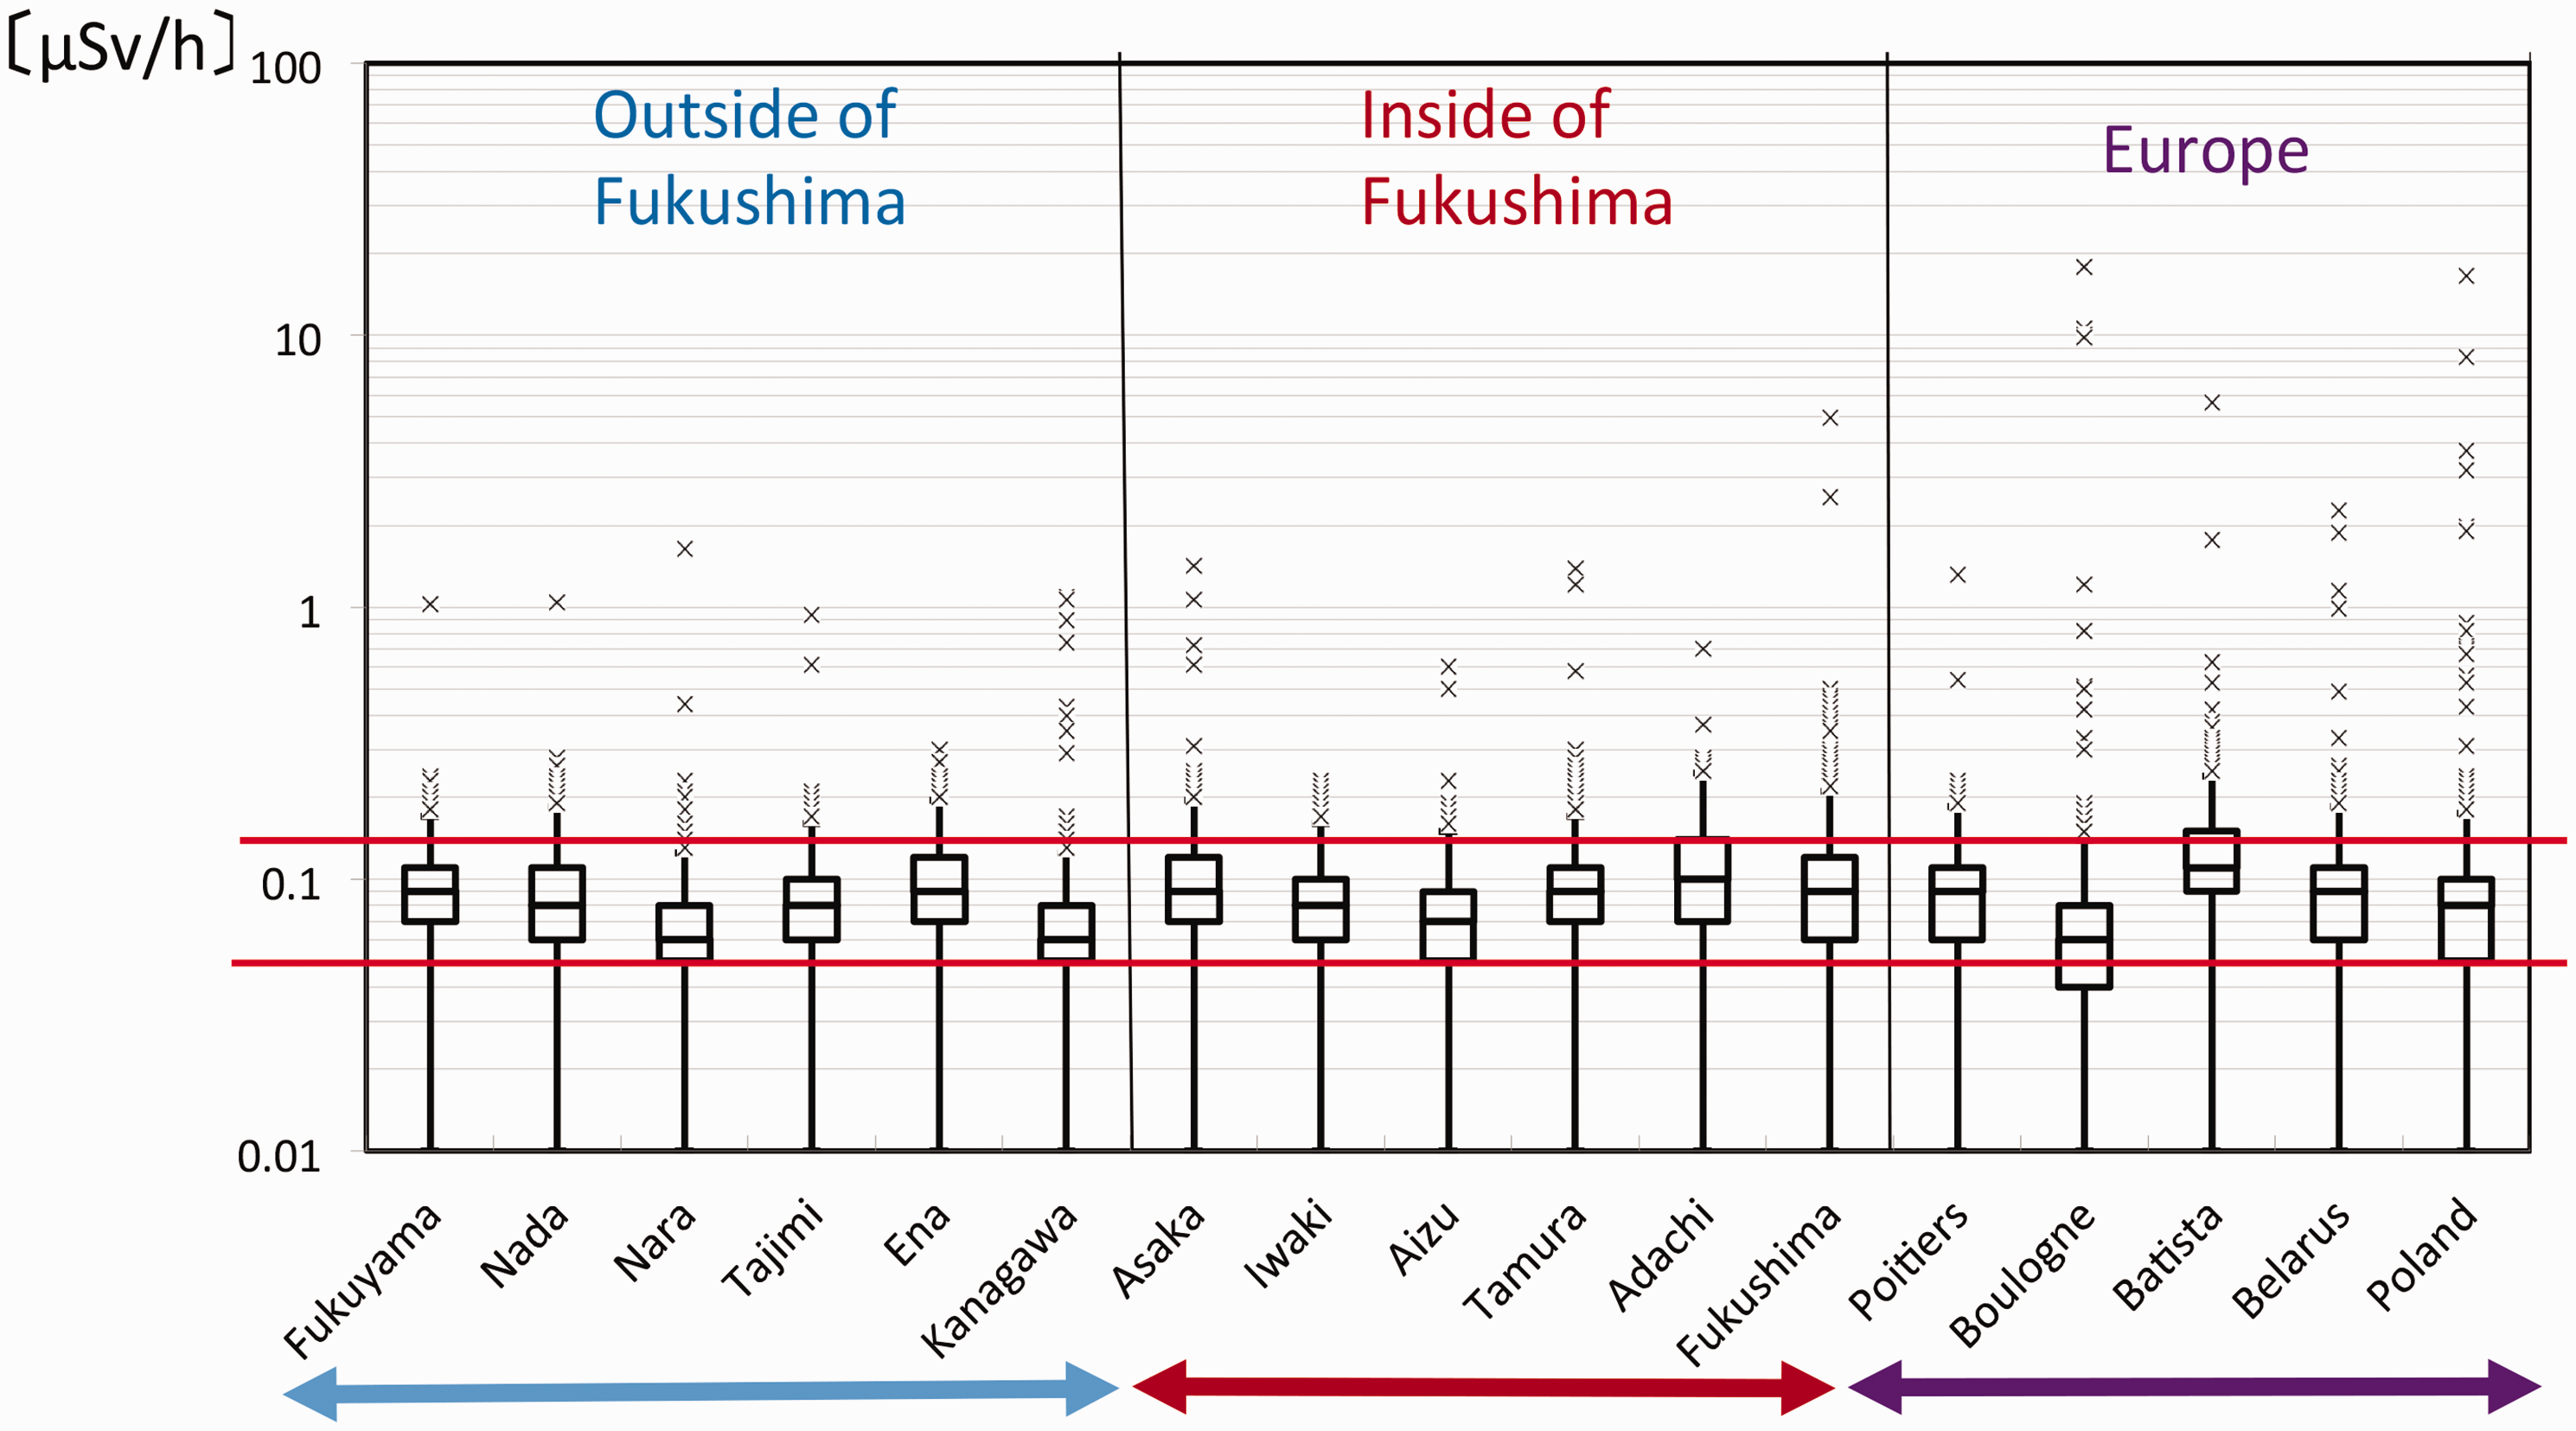
The red lines indicate the minimum value of the first quartile and the maximum value of the third quartile. The positions of these red lines and the boxes for each school show that the ranges of boxes with 50% of school dose rates are almost equal; as such, it can be concluded that exposure of high school students in Fukushima Prefecture is not much higher compared with that of high school students in other regions.
The outliers need to be examined separately. However, it should be noted that outliers are not only seen in Fukushima Prefecture, but also in regions outside Fukushima Prefecture and in France, where radiocaesium contamination seems unthinkable.
The records of everyday life were used for the analysis of outliers. For example, there is an outlier for Fukushima High School which is very high at 5 µSv h−1. The reason for this high value is due to one of the participants undertaking a survey in a high-dose area, Okuma in Fukushima Prefecture, during the study. In addition, there are three outliers in Boulogne that are higher than 10 µSv h−1. They were detected when the participant was in a library, so it is difficult to imagine that the individual was actually exposed to such a high dose. Considering that there are places outside Fukushima Prefecture with outliers >1 µSv h−1, it can be concluded that not all outliers are due to high dose, but may be due to the influence of communication devices such as mobile phones, or from noise transmitted if a dosimeter hits something. As stated above, the ratio of outliers in the total data was approximately 1.5%. The impact of these outliers on individual participants’ total exposure dose will be covered in the following section.
3.2 Comparison of annual individual doses
Fig. 3 is a box-and-whisker graph that depicts the total measured values of the participants over the study period, converted into annual individual doses. The y axis indicates the annual individual doses in mSv years−1. The bottom of the box, the horizontal line in the box, and the top of the box indicate, as in Fig. 2, the first quartile, the median value, and the third quartile for each school and region, respectively. The tip of the whiskers indicates the maximum and minimum values for each school and region.
It should be noted that the outliers plotted in Fig. 2 were not excluded from the calculations of annual individual dose. Therefore, a participant in Boulogne shows a value as high as 1.8 mSv year−1. If the three outliers mentioned above for this participant were excluded, the annual value would be 0.04 mSv year−1, equivalent to the minimum value for Boulogne.
Furthermore, the measured values include natural background radiation dose. The additional exposure dose of the general public is expressed by the International Commission for Radiological Protection as <1 mSv year−1. However, the values measured for most of the participants, as shown in Fig. 4, are inclusive of a natural background radiation dose of approximately 1 mSv year−1. In other words, although there are slight differences in the distribution, even when the outliers in Fig. 3 are taken into consideration, it can be concluded that the high school students in Fukushima Prefecture are not exposed to much higher levels of radiation compared with students at high schools in other regions.
Distribution of annual individual dose by school.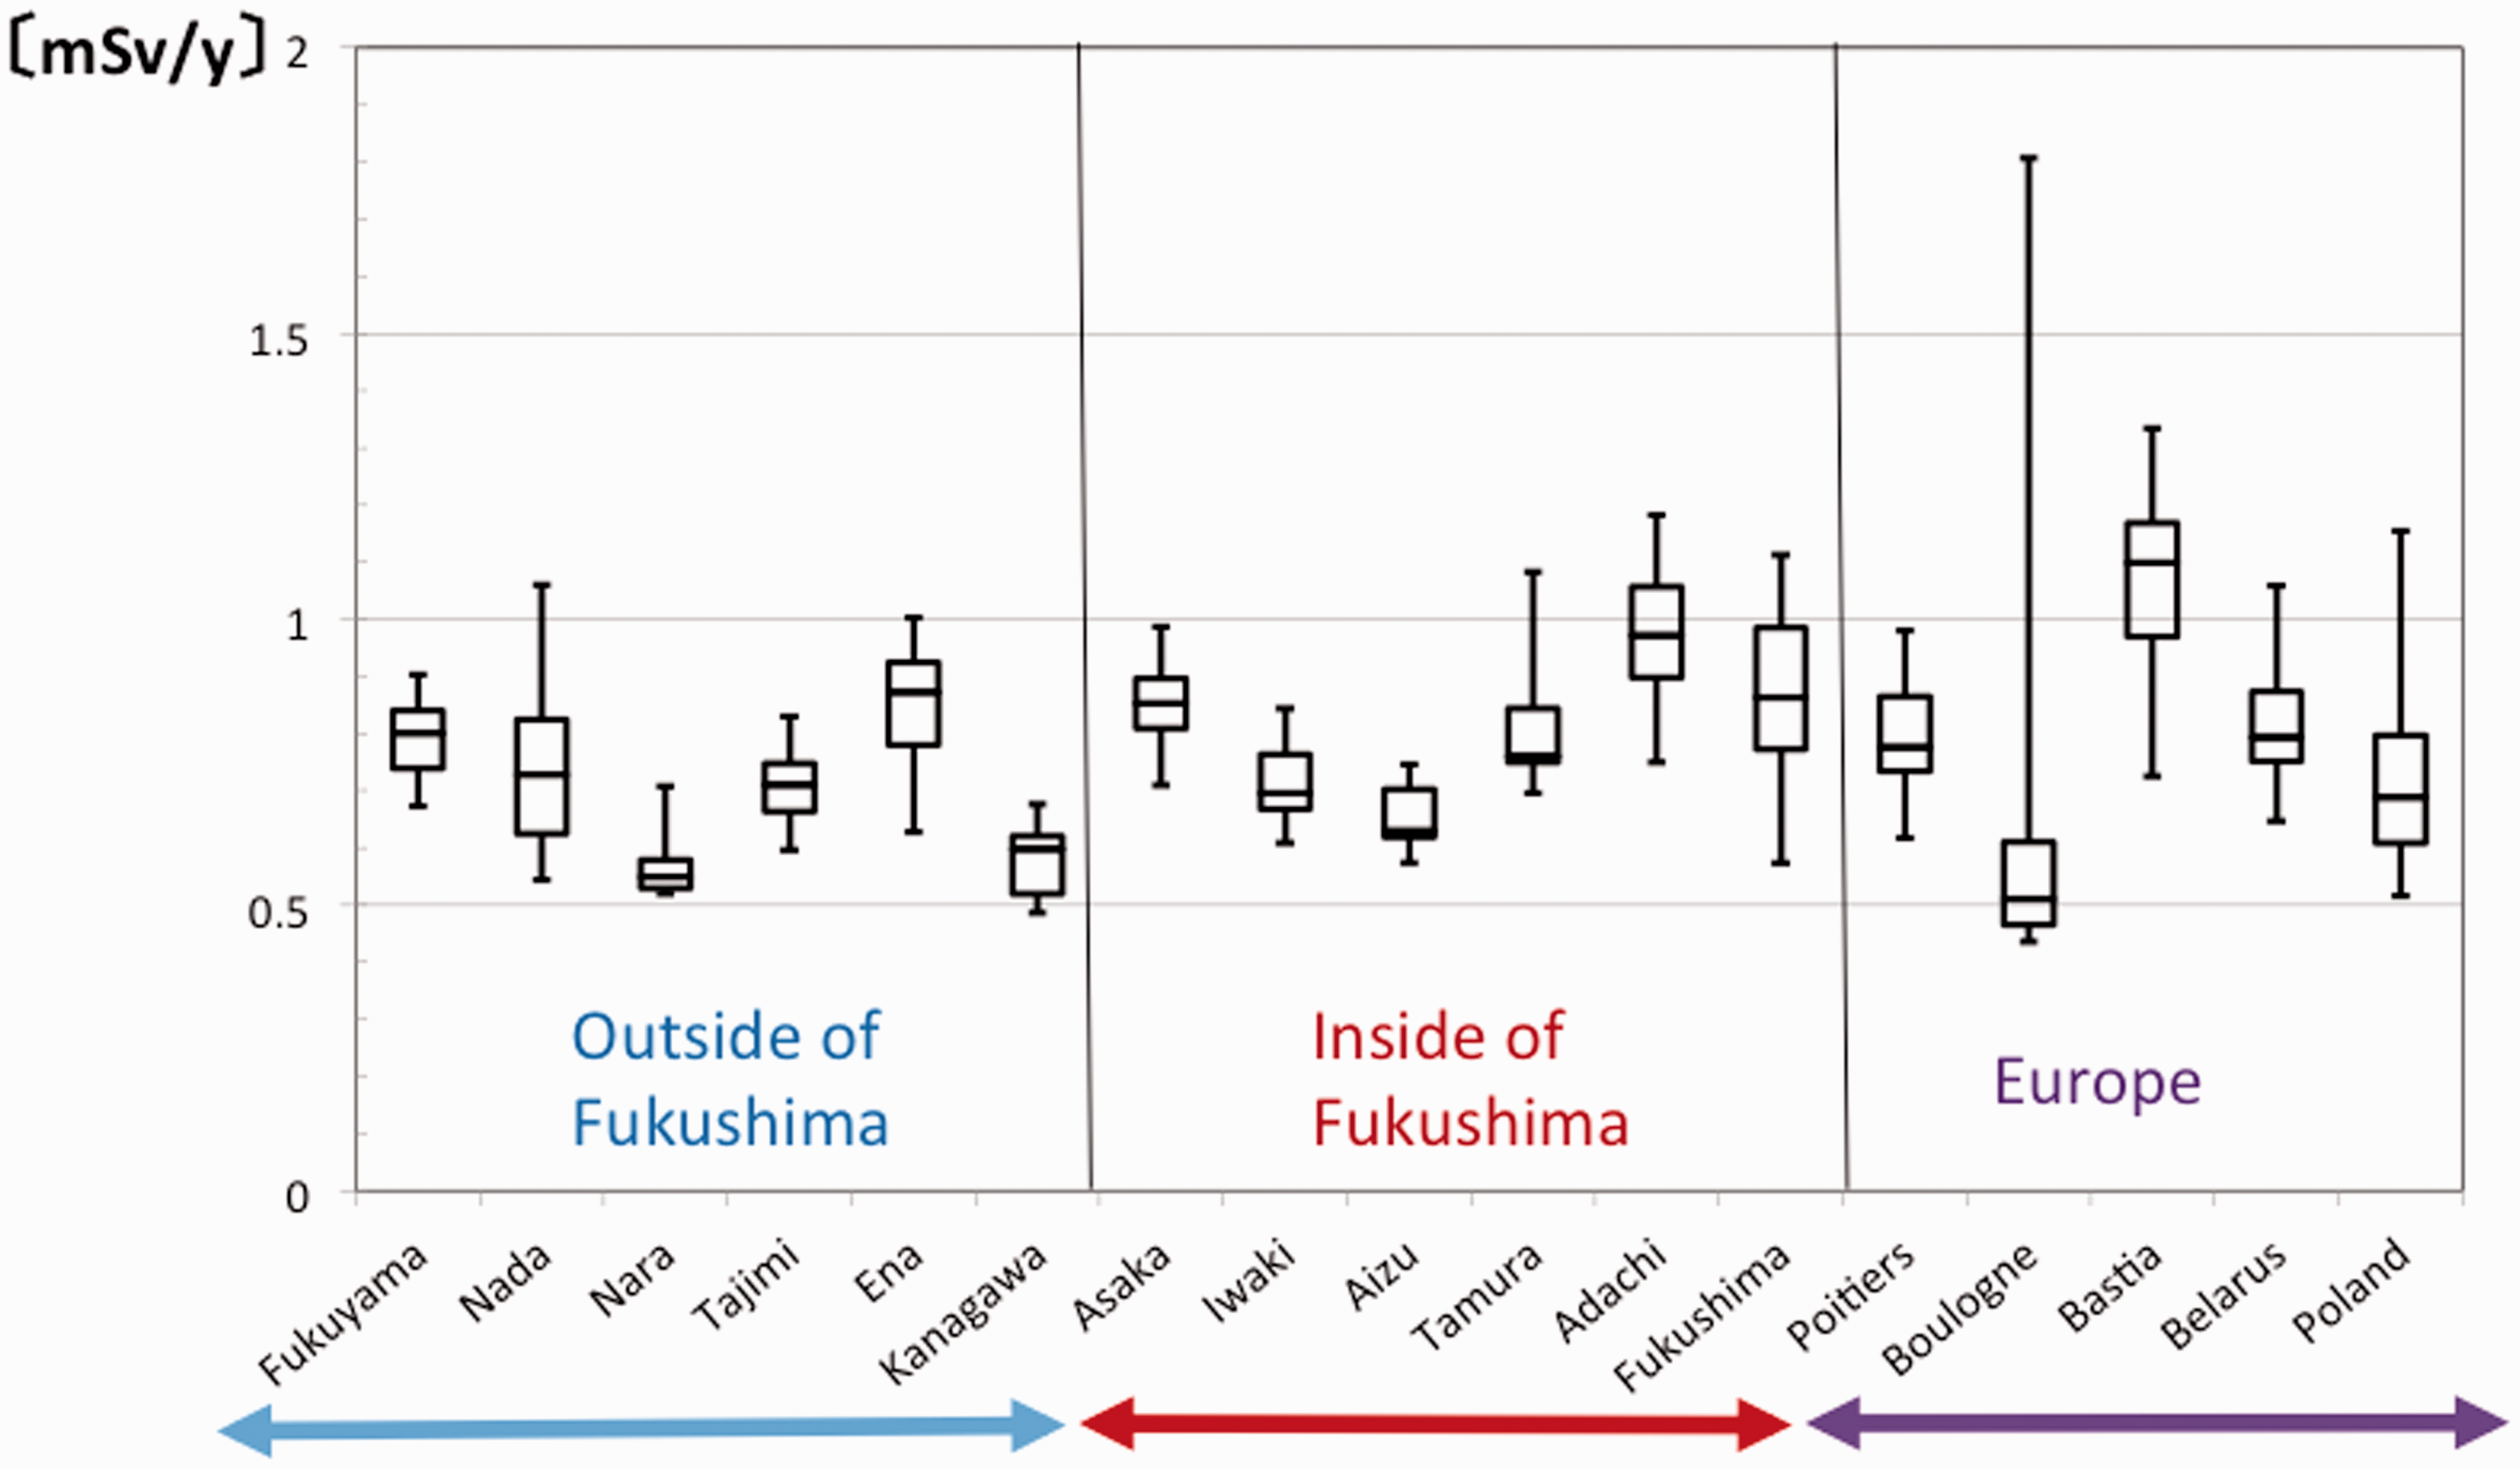
4. NATURAL BACKGROUND RADIATION DOSE AND INDIVIDUAL EXPOSURE DOSE
Fig. 5 shows that the individual doses received by high school students in radiocaesium-contaminated Fukushima were not particularly different from those received by students in other regions. The bar graph in Fig. 5 was taken from data released by the Japan Geology Association to plot natural background radiation dose in the neighbourhoods of participating schools in Japan. The unit for the y axis is µGy h−1. The boxes at the top of the graph indicate the values with whiskers and outliers excluded from the box-and-whisker graph (Fig. 2), and the horizontal lines in the boxes represent the median for each school (µSv h−1).
Comparison of natural background radiation and individual exposure dose.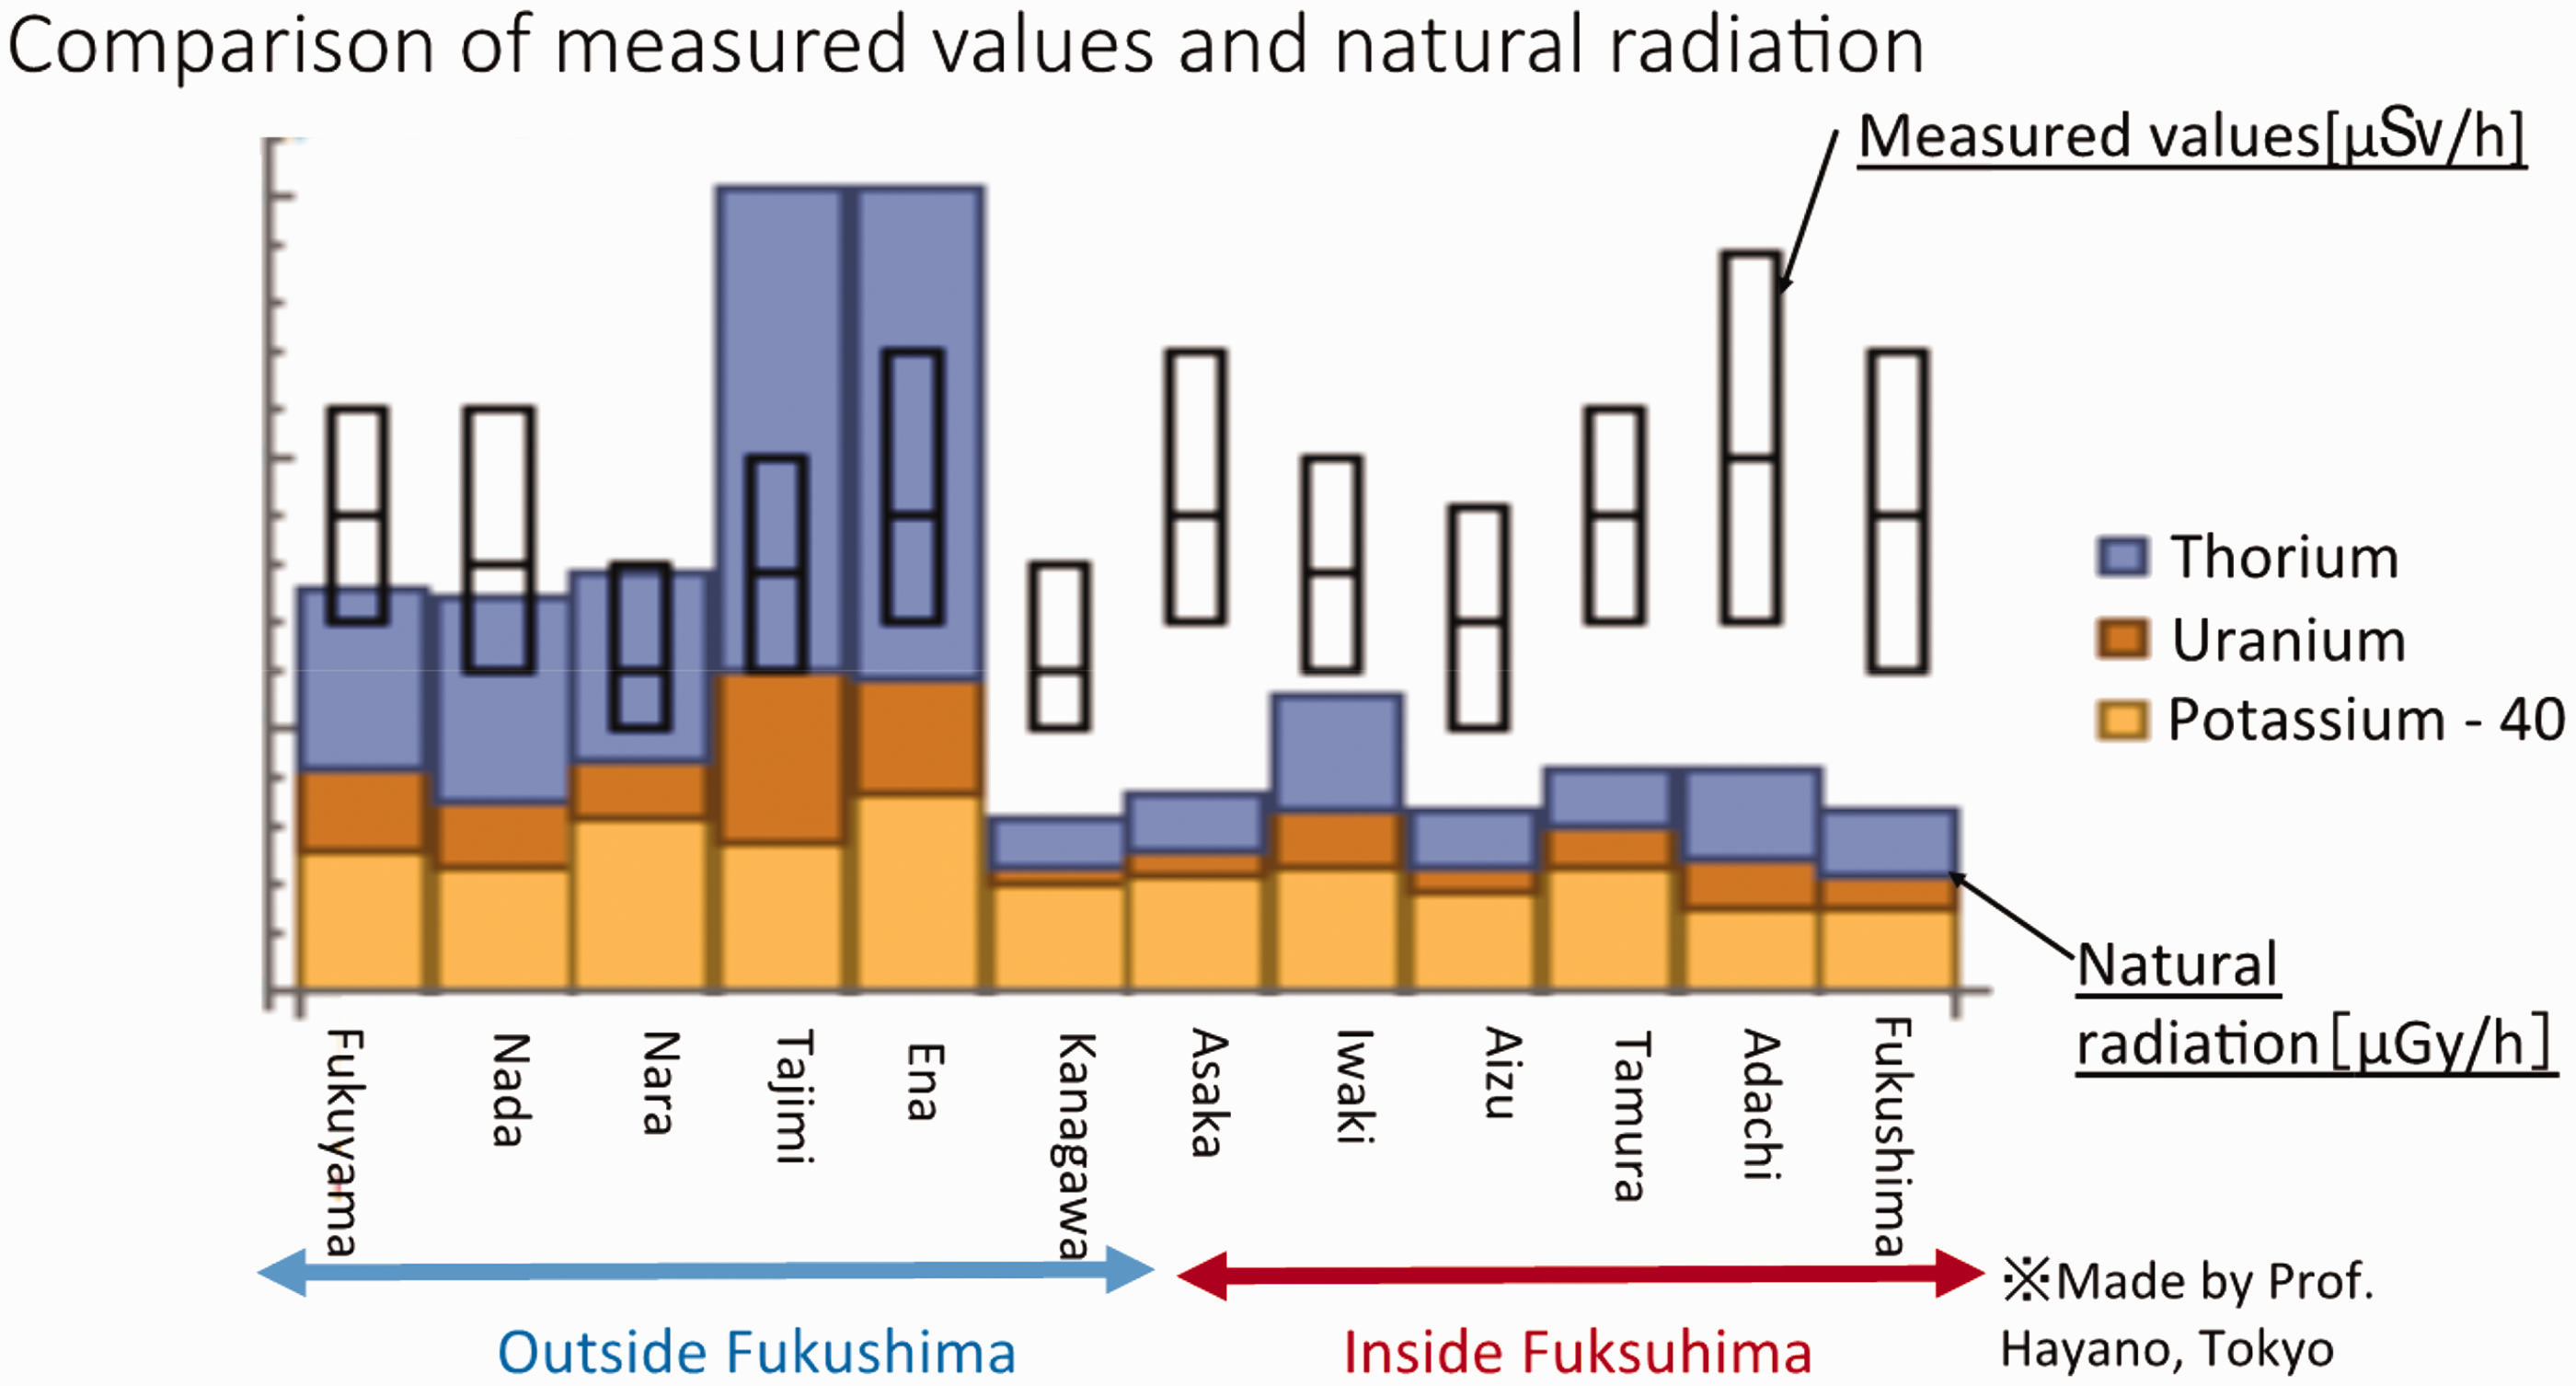
Fig. 5 shows that natural background radiation dose in Fukushima Prefecture is lower compared with other regions. Again, the positions of the boxes and bars tend to overlap in regions outside Fukushima Prefecture, while the bars are higher than the boxes for Fukushima Prefecture. From these results, it can be concluded that if there was no contamination due to radioactive substances, the positions of the boxes and bars would have overlapped. However, due to contamination, individual exposure doses are slightly higher than those from natural background radiation, placing the boxes higher than the bars. However, natural background radiation in Fukushima Prefecture has always been low; therefore, even if exposure doses due to contamination were added, it is considered that the results would be of the same level as those for other regions.
5. CONCLUSION
Individual external exposure doses were measured using D-Shuttle dosimeters by students and teachers from 12 high schools in Japan (six from Fukushima Prefecture), four from France, eight from Poland, and two from Belarus. Median dose rates were 0.06–0.09 µSv h−1 outside Fukushima Prefecture, 0.07–0.10 µSv h−1 inside Fukushima Prefecture, and 0.06–0.11 µSv h−1 in Europe. The annual median individual doses calculated from the total exposure doses measured over the study period were 0.55–0.87 mSv year−1, 0.63–0.97 mSv year−1, and 0.51–1.0 mSv year−1, respectively. It can be concluded that students in Fukushima Prefecture are not exposed to much higher doses of radiation compared with students in other regions.