
Abstract
Cooperating with radiological protection experts and taking radiation measurements, the residents of Suetsugi, Iwaki City, Fukushima have been striving to reshape their lives since the accident at Fukushima Daiichi nuclear power plant. Suetsugi lies within 30 km of the power plant, so the residents have had serious reservations about continuing their lives there since the accident. Today, radiation remains a ‘line’ dividing their lives, with any dose measurements directly affecting their daily decision making. Assisted by medical and scientific specialists, the residents faced this challenging situation by measuring exposures individually and then discussing the results among themselves. Since 2012, the residents of Suetsugi have been using personal dosimeters, made village-wide trips for whole-body counter tests, and measured food contamination throughout the village. The results have been shared openly between the residents. Obtaining and discussing their own data were crucial to gain understanding of various results and to practice radiological protection in their daily routine. These 4 y of experience in Suetsugi demonstrate cooperation between various stakeholders, which should be a lesson for the future.
1. Introduction
As a resident of Iwaki, a seaside city in Fukushima, Japan, for 13 y, I will discuss how the ‘lines’ set by the Japanese Government or by scientific measurements have affected our lives since the accident at Fukushima Daiichi nuclear power plant. Since the Great East Japan Earthquake, tsunami, and nuclear plant accident in 2011, three ‘lines’ have emerged that have affected our lives and caused serious disruption. The first is the geographical ‘line’. The Japanese Government used the radius from the plant to designate evacuation zones. A 30-km radius ‘line’ became a border for local residents. The second is the ‘line’ used for decontamination requirement (ambient dose rate target of 0.23 μSv h−1). The Japanese Government explained that this ambient dose rate corresponded to an effective dose of 1 mSv y−1. Thus, people believe that staying in an area with 0.23 μSv h−1 would result in an additional annual dose of 1 mSv. The third ‘line’ is related to food contamination, ‘not detected’, or ‘ND.’ Unlike the first two ‘lines’, it was not set by any authority, but it has been added to the list as people perceive ‘ND’ to be a de-facto ‘standard’.
2. Enforced Radius Zone
In reality, numerous ‘lines’ are set by central and local government standards for no-fly zones, water, school lunches, etc. The three ‘lines’ chosen in this article were selected as they are believed to have had the most significant impact on the lives of the local residents.
The first ‘line’ is the 30-km radius from the Fukushima Daiichi nuclear power plant. At 14:46 on 11 March 2011, a huge earthquake and consequent tsunami devastated the east coast of Japan. The 15-m-high tsunami disabled the power supply and cooling of three reactors at Fukushima Daiichi, causing a nuclear accident. As the situation deteriorated, the Japanese Government ordered nearby residents to evacuate, and the evacuation zones were expanded with the progress of the accident. Suetsugi, a district at the northern end of Iwaki City, lies within the 20–30-km radius zone. On the morning of 13 March 2011, the Mayor of Iwaki City requested that residents within the 30-km radius zone evacuate voluntarily, prior to the request from the Government. Two days later, the Government requested all residents within the 20–30-km radius zone to stay indoors.
The evacuation zones were rearranged by the Government on 22 April 2011. The areas within the 20-km radius zone were designated as ‘restricted areas’. Although the 20–30-km radius zone was considered as an ‘evacuation prepared area in case of emergency’, the northern tip of Iwaki City was not included. However, people had doubts about the safety of this area. There were many unanswered questions, such as ‘Is it safe to return?’ or ‘Why is this area different?’ My impression is that as the Japanese Government did not provide information to reassure the residents, the enforced radius ‘line’ remained in the residents’ minds and became a psychological barrier.
3. Ambient Dose Rate
The second ‘line’ is the ambient dose rate of 0.23 μSv h−1 and the annual radiation dose of 1 mSv. In August 2012, the Ministry of Environment introduced these values in the so-called ‘Act on Special Measures’. This aims to reduce the additional exposure dose of 1 mSv y−1 as the ‘long-term goal’ of decontamination for intensive contamination survey areas. Below, I will explain how the Ministry of Environment determined 0.23 μSv h−1, using information from their website.
Of the natural radiation dose that existed prior to the accident, annual terrestrial dose from the ground was 0.37 mSv y−1. This terrestrial dose, when divided by 24 h × 365 days, yields 0.04 μSv h−1.
The Ministry assumed the hourly additional exposure dose to be 0.19 μSv h−1. This dose corresponds to the annual target additional exposure dose of 1 mSv. To come up with this figure, the Ministry assumed that an average person spent 8 h outdoors and 16 h indoors in a wooden house with a shielding effect of 0.4. It would take 0.19 μSv h−1 of additional dose for the person to reach the exposure level of 1 mSv y−1. The natural radiation dose of 0.04 μSv h−1 and target dose of 0.19 μSv h−1 are added to obtain 0.23 μSv h−1. This is the ambient dose that is supposed to correspond to additional exposure to 1 mSv, and hence the target for decontamination.
I believe that the decontamination standard sounds rather weak, based on arbitrary assumptions. However, the Ministry of Environment uses the value as the standard for decontamination to this day. Initially, the purpose of 0.23 μSv h−1 was to set a standard for decontamination. In other words, the figure was not intended to signify health risk (i.e. whether it was safe or dangerous to one’s health). However, the residents took a different view.
Many people believed that any place with an ambient dose higher than 0.23 μSv h−1 that required decontamination must be ‘dangerous’. For example, some decided not to return until the ambient dose rate around their homes was less than 0.23 μSv h−1 due to health concerns. Others decided not to go near any forests or hills where the ambient dose rate was higher. Many people started restricting their lives based on this figure. The 1 mSv of additional exposure became a signifier of risk for many people. Any exposure greater than 1 mSv was viewed as ‘dangerous to health’. I lost count of how many times people told me, ‘If you have been exposed to more than 1 mSv, you will develop cancer in the future, although the Government says that there is no immediate effect’.
The decontamination standard formed a ‘line’ that had severe impacts on the living space of the residents. The ‘line’ marked off a zone to be avoided. Without any orders from the Government, people started limiting their actions and lifestyle choices. Many people started avoiding places they used to visit daily, such as their fields. At the same time, huge mistrust and complaints grew against the Government, which had forced this inconvenience and seemed to be doing nothing to remedy the situation. I believe that such mistrust and complaints still have a strong hold on the residents.
4. ‘Line’ of ‘Not Detected’
The third ‘line’ that affected the lives of residents of Suetsugi is ‘ND’ or ‘not detected’. Initially, ‘not detected’ simply meant the minimum threshold specification in a measurement. However, it started to carry a different meaning. People started to view ‘ND’ as ‘safe’. In my view, the root cause of this confusion is in the change made to the standards of radionuclides in food after the accident. Immediately after the accident, on 17 March 2011, the Ministry of Health, Labour and Welfare (MHLW) issued a notice specifying provisional standard values for radiation levels in food. In essence, it was designed to limit the annual maximum permissible dose from radioactive caesium in foods at 5 mSv. It set the ‘provisional regulation value’ of 200 Bq kg−1 for water and 500 Bq kg−1 for most other food products. There was strong opposition to this standard, claiming that it allowed too much contamination. The MHLW consequently issued ‘New Standard Limits for Radionuclides in Foods’ on 1 April 2012, 1 y after the accident.
The new standard lowered the annual maximum permissible dose from radioactive caesium in foods to 1 mSv, with a ‘standard limit’ for most food of 100 Bq kg−1. On the surface, the new standard lowered the limit, so it should have satisfied people. However, many people became more confused and doubtful. The opinion I have heard most often is, ‘The limit has become more strict in such a short time. The first standard must have been wrong; they were labelling something dangerous as safe’. Although there is less vocal discontent about the standards, the change actually reinforced mistrust against the standards set by the Government. As a result, the number of people who do not believe such standards seems to have increased. Lowering the limit did not remove people’s concerns. Thus, people who did not trust the standard limits set by the Government sought safety in ‘ND’, whatever that meant.
5. Effect of the ‘Lines’ on the Lives of residents of Suetsugi
In addition to the three ‘lines’ discussed above, many ‘lines’ drawn after the accident, including those enforced by government authorities, made our lives uncomfortable. These ‘lines’ were engraved in our minds and became internal norms. Thus, we voluntarily restricted our activities, and became increasingly bound by these ‘lines’. We reached a point where we could not trust the standards for radiation set by the Government. As a result, we started seeking the minimum, believing that ‘the lower, the safer’. At the same time, in various situations in our daily lives, we had to decide whether our choice was ‘safe or dangerous’. Before the Fukushima Daiichi accident, we never had to think about whether a certain place was safe, or if a particular herb was contaminated. Now, we had to pause, think, and make a decision.
Below, I will explain the activities in Suetsugi district to resolve such situations. Suetsugi is a small community of 118 households and 386 residents, as of April 2014. It is approximately 27 km from the Fukushima Daiichi nuclear power plant. Residents of Suetsugi were requested to evacuate on 12 March 2011, and the district was subject to an evacuation order until 22 April 2011. Most residents experienced evacuation at least once; some families moved multiple times to find a place to stay, while other families had to split apart. As described above, little explanation was given to the residents when the evacuation order was lifted. This is an important point. Suetsugi lay within the 30-km radius, in an area that was deemed to be ‘high risk’. However, the residents did not receive any information to prove that it was safe to return and continue living in their homes.
Given this situation, some residents of Suetsugi started to act for themselves. They measured the ambient dose rate and took soil samples in various places in Suetsugi to measure the level of radiation and create a contamination status map. Between Autumn 2011 and Spring 2012, they measured the entire district, gathering more than 1000 soil samples. Suetsugi is the only district, I believe, that took measurements to such an extent without any external organisational support. This effort built a base among the residents of Suetsugi to remind them that the ‘line’ drawn using the distance from Fukushima Daiichi did not matter. It was important to measure the actual condition and make a judgement based on the measurement, rather than some value given by the Government.
5.1. Measuring external exposure in Suetsugi
The next step was measuring external exposure. Fig. 1 shows the readings of individual dosimeters of residents of Suetsugi. The red horizontal line represents the daily dose rate corresponding to an additional exposure of 1 mSv y−1, and the green horizontal line represents estimated background radiation prior to the accident.
Number of days vs accumulated dose per person in Suetsugi. Data measured with D-shuttle dosimeters for 14 individuals.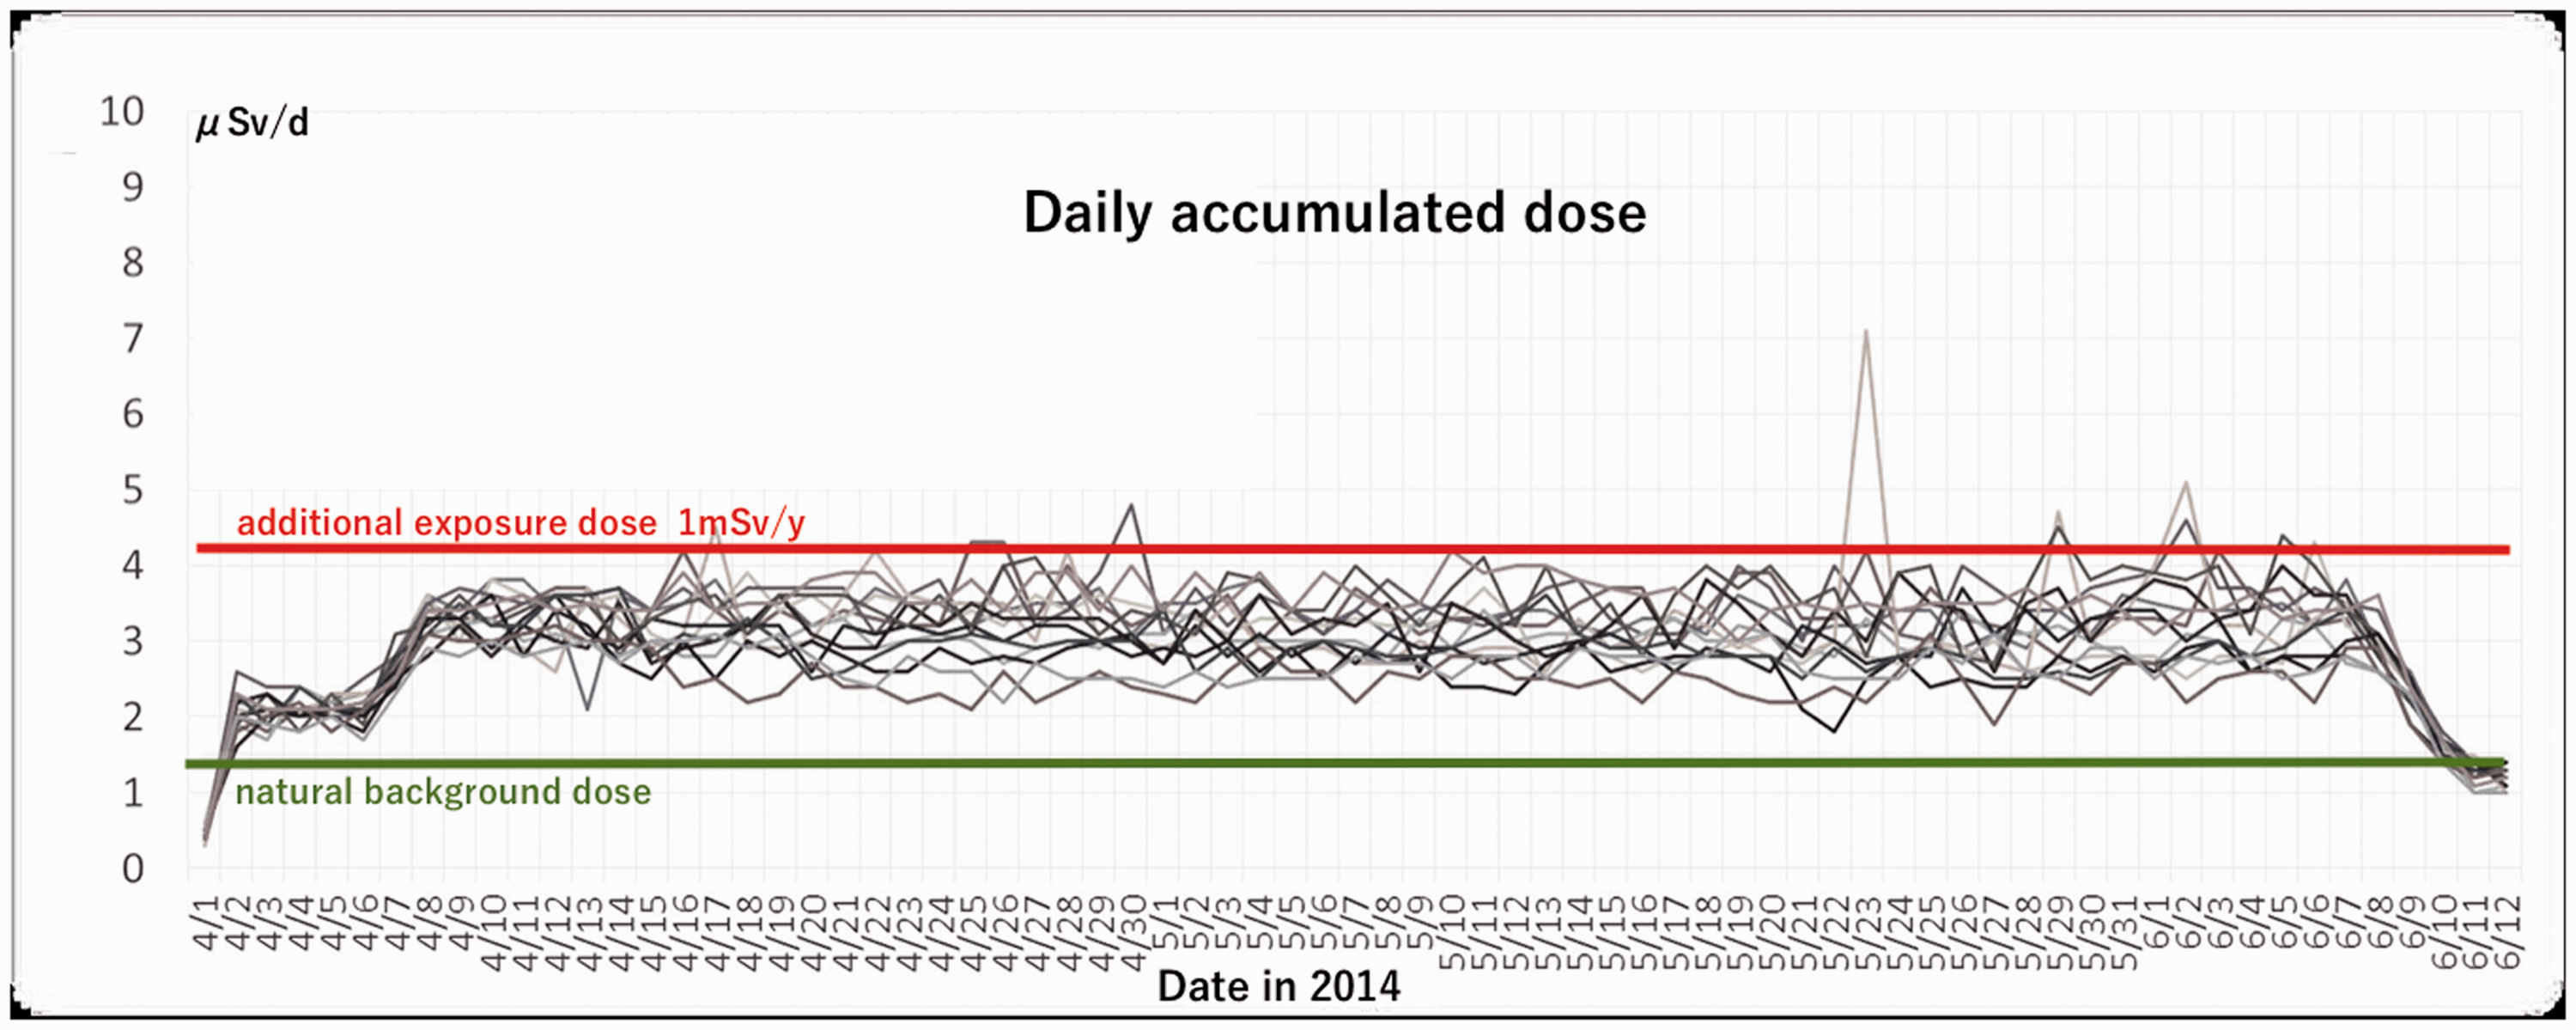
Some residents started taking measurements on their own in July 2012, and this has since become a community-wide initiative. Upon request, the district distributes ‘D-shuttle’ dosimeters (Chiyoda Technology Corp., Tokyo, Japan) to the residents. Thirty dosimeters were available in April 2014, increasing to 100 dosimeters in February 2015. Fig. 1 gives an overall picture of the external exposure of all residents, as well as an individual’s level in comparison with others in the group. Also, one can pinpoint where and how the exceptional readings came from.
Fig. 2 shows the distribution of estimated annual exposure of the residents of Suetsugi. Dr Makoto Miyazaki of Fukushima Medical University, who has supported our efforts since the beginning, prepared both Figs. 1 and 2. The dotted line in Fig. 2 shows the additional annual exposure to 1 mSv. Clearly, the exposure of most residents falls below this line, with the highest number of residents receiving exposure of 0.4–0.6 mSv y−1. This assured the residents of the exposure level as a community.
Distribution of annual external exposure in local residents.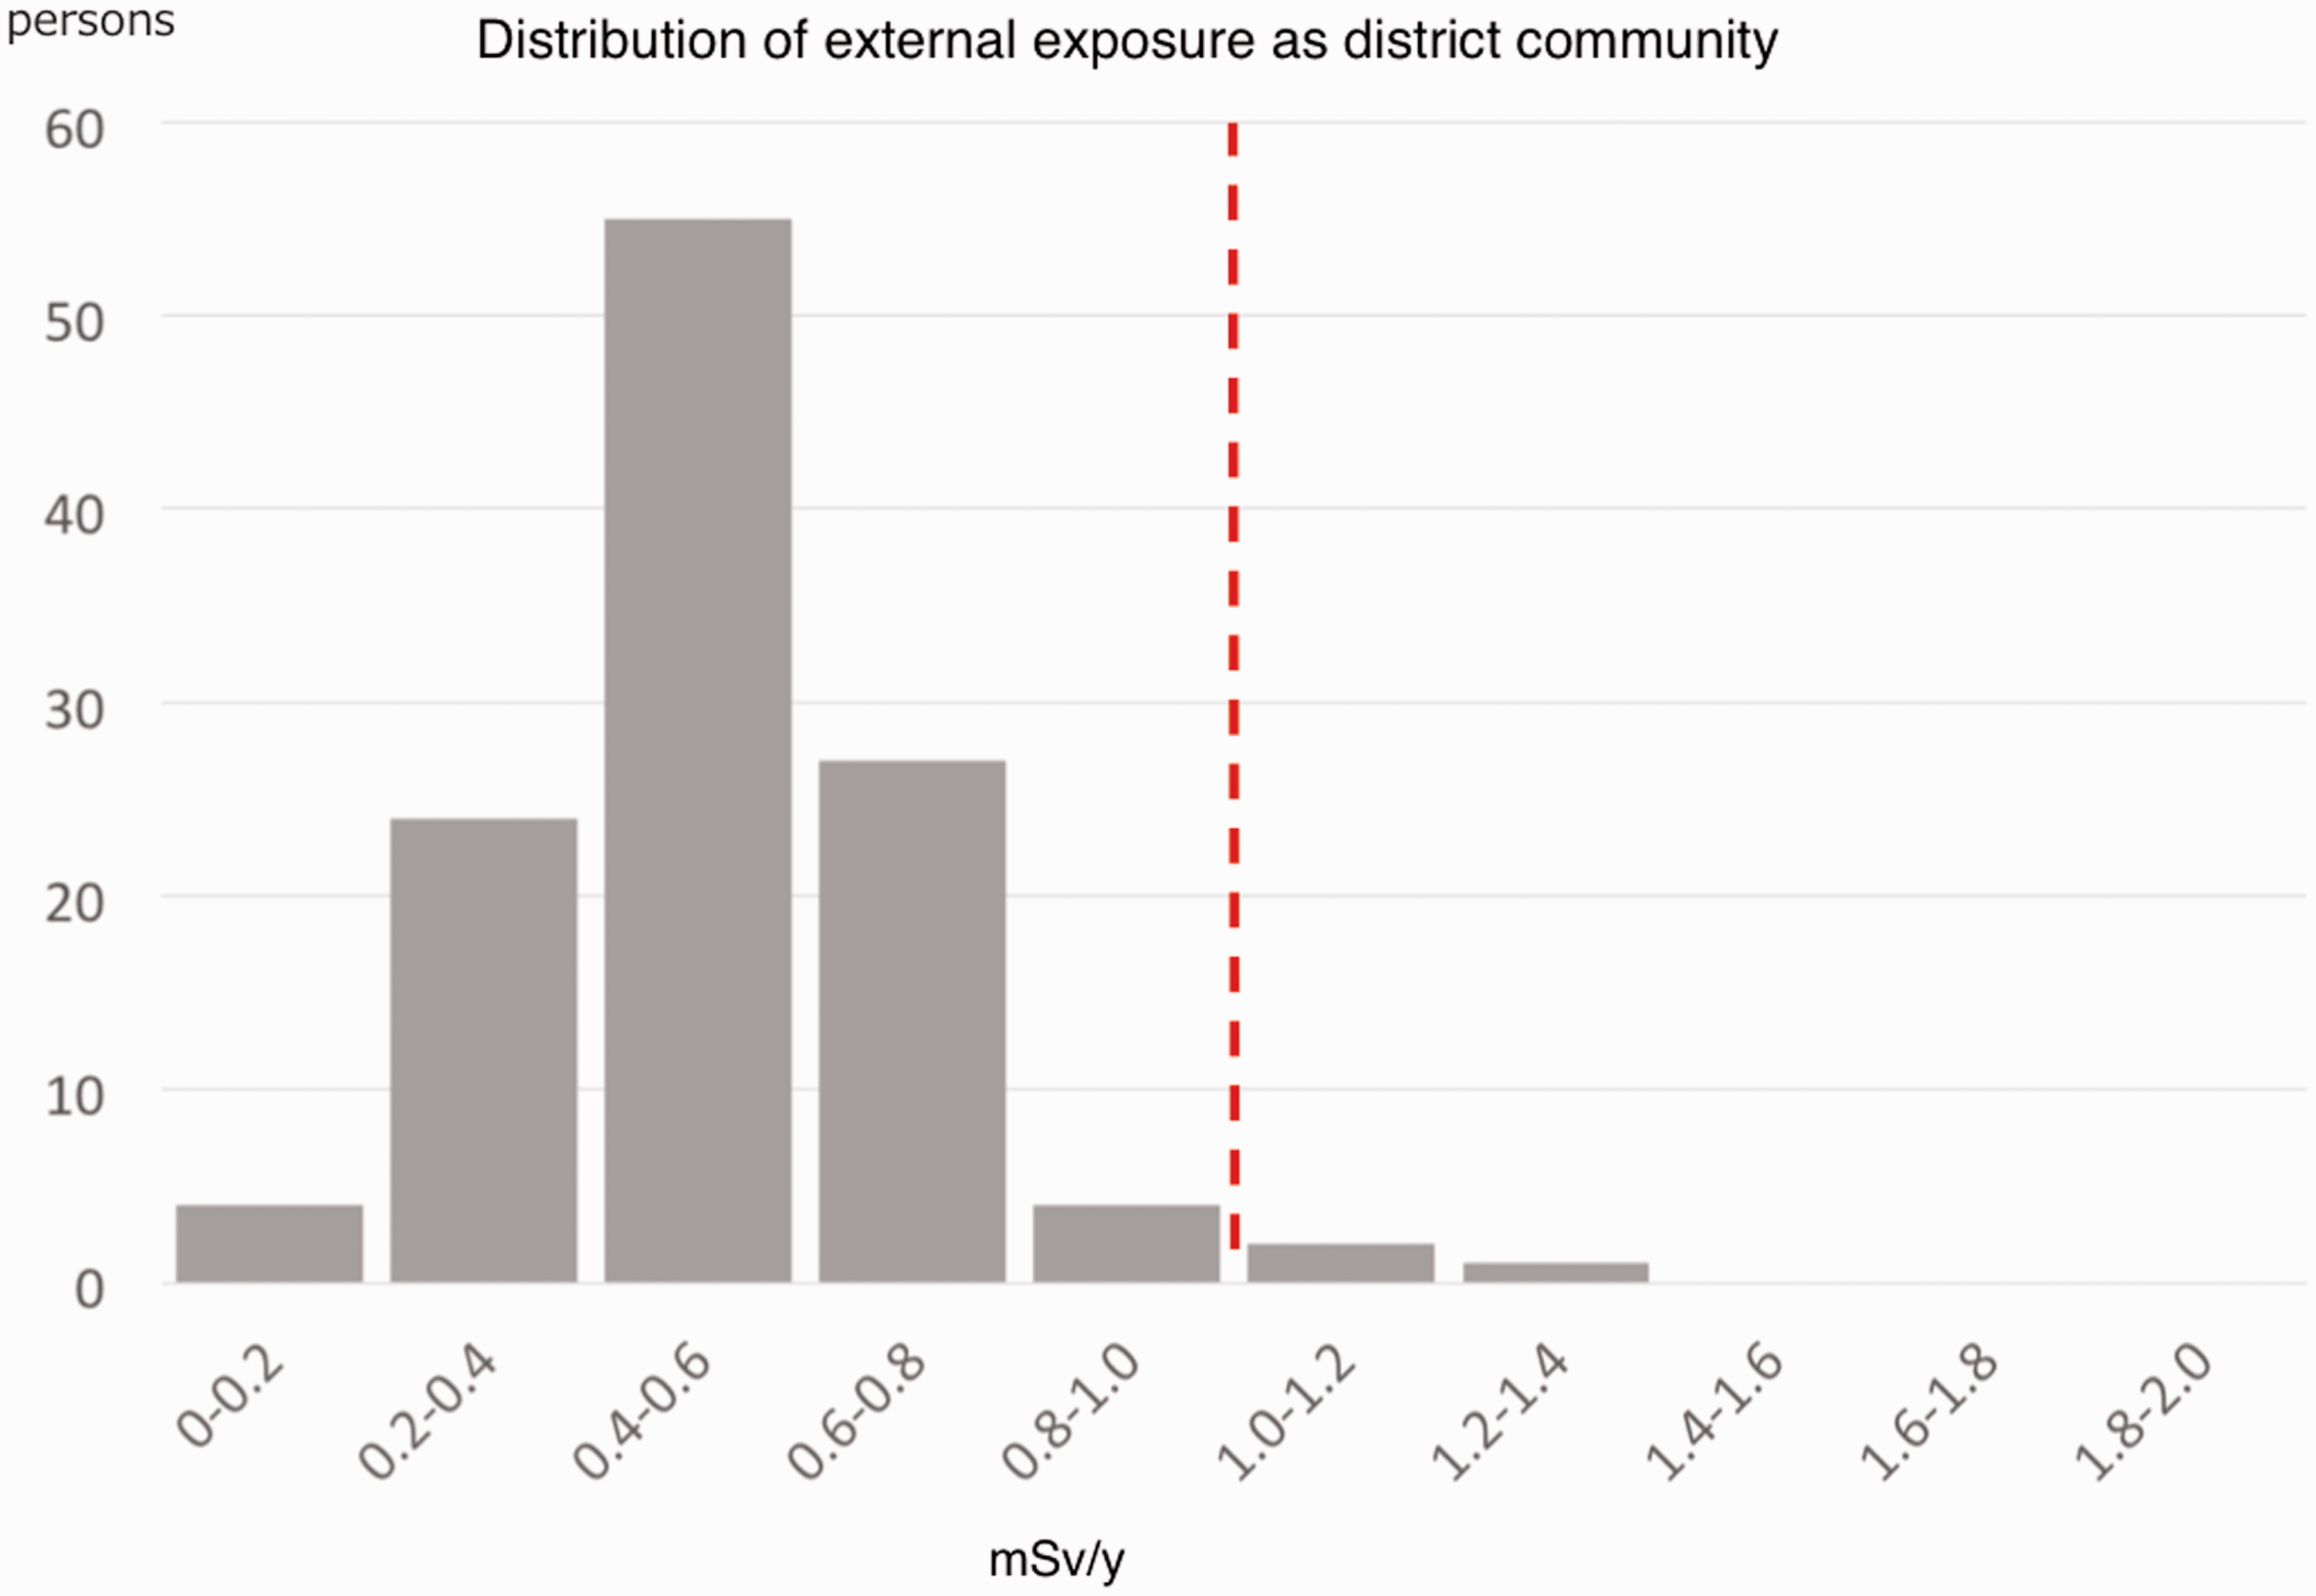
5.2. Measuring food contamination
Since March 2015, the residents of Suetsugi have been able to measure food contamination at their community centre. Each Tuesday, any resident can walk in and have their sample measured.
Fig. 3 is based on findings from 3 March 2015. In cities, people buy food in supermarkets, but in Suetsugi, people grow rice and vegetables. Home-grown vegetables and home-prepared pickles are their pride and joy. Before the accident, mushrooms and mountain herbs were delicacies to be cherished and shared. Thus, measuring food to be sure of its safety has been essential for the residents to regain their lifestyle. The opportunity for people to gather and talk freely has also played a key role for exchanging and sharing information.
Distribution of residents consuming local food since the accident at Fukushima Daiichi nuclear power plant.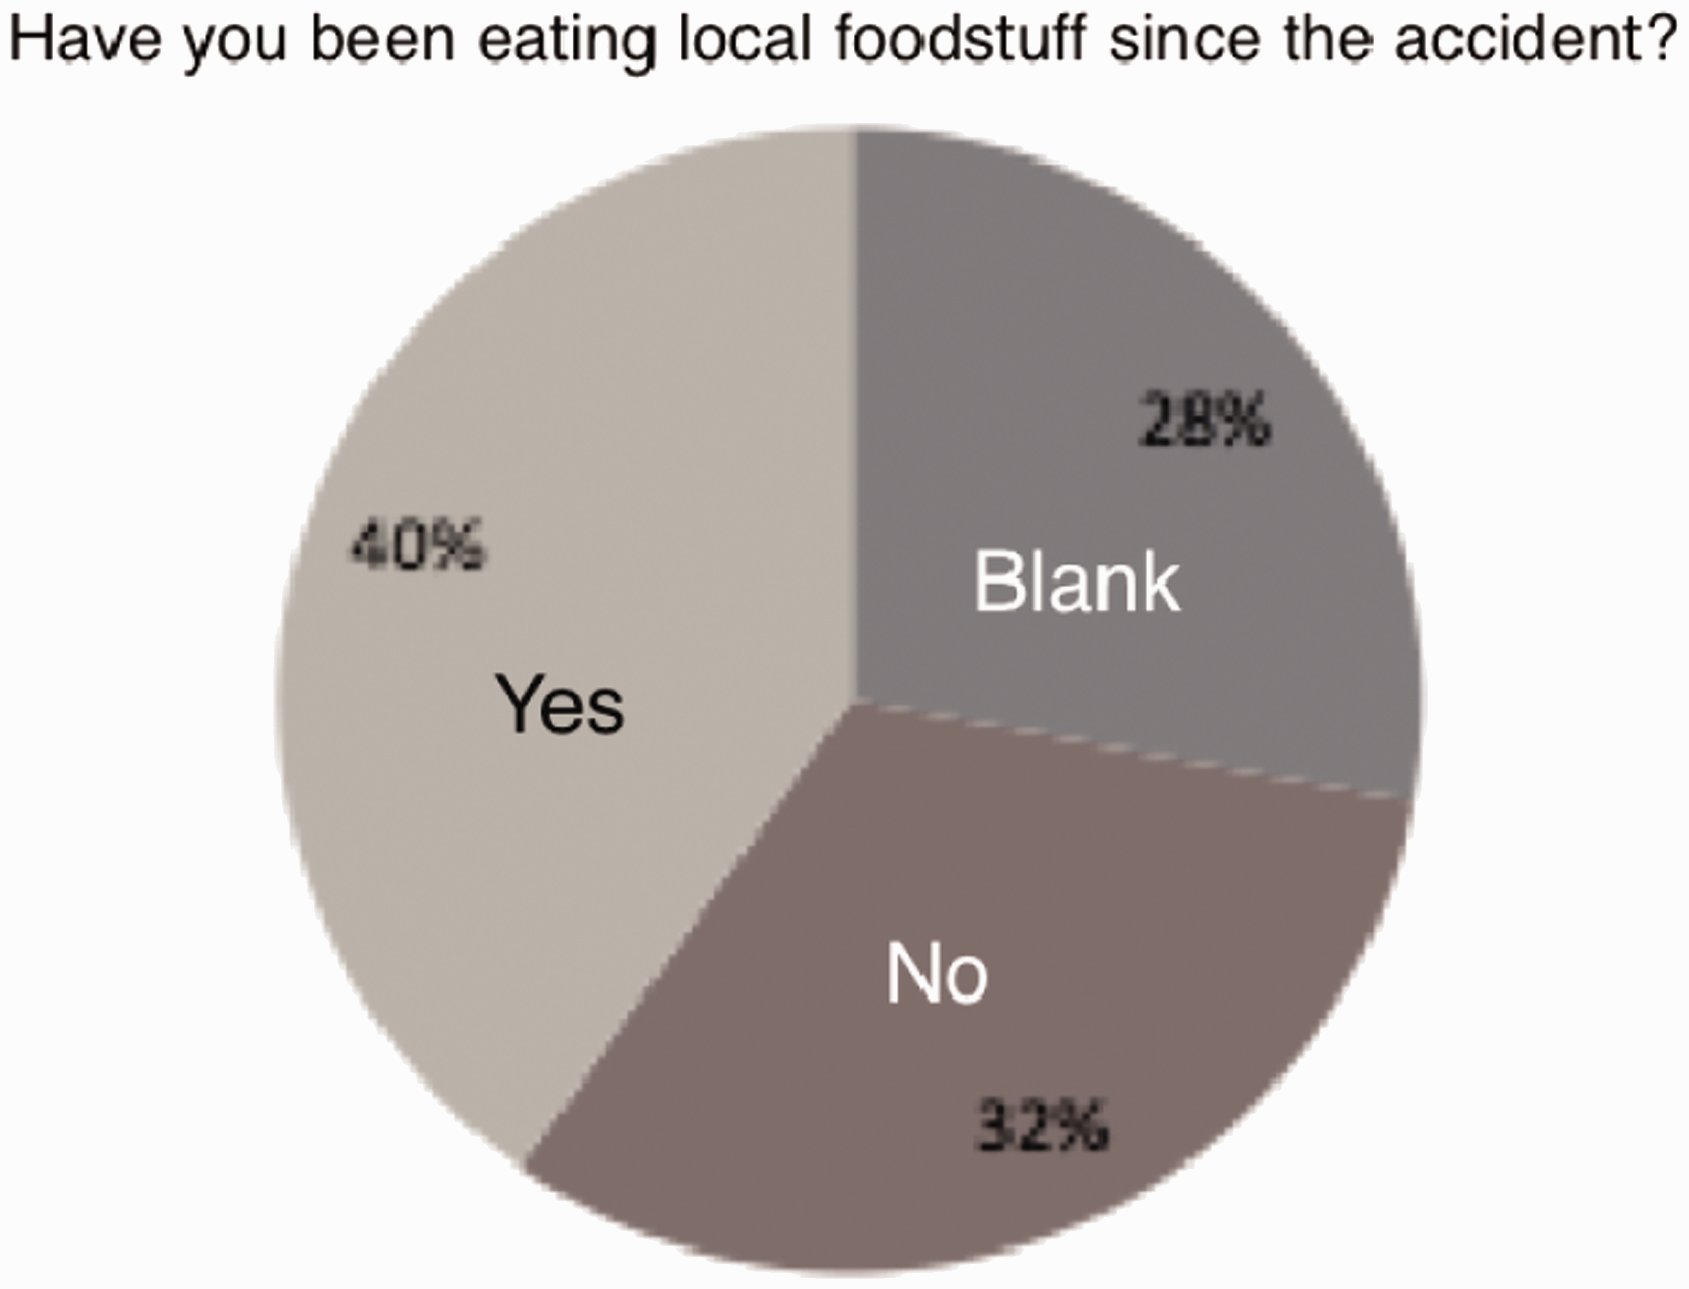
6. Measuring Radiation Levels in Communities
The Polimaster PM1406 (Polimaster Pacific, Tokyo, Japan) is used by the residents to measure food contamination. The focus of the PM1406 is to determine whether the contamination of a sample is higher than 100 Bq kg−1. This level is currently used as the standard limit for most food products in Japan. Thus, the PM1406 is not convenient for measuring the exact Bq kg−1 value below 100. When we measure food contamination in Suetsugi, the results are given as either ‘over standard’ or ‘below standard’. Before starting out, the relevant information for measuring foodstuff was discussed. In my view, the ‘standard’ is the value that has meaning in our society. In addition, we need to be realistic. This is food to be eaten at home. Staple food such as rice is consumed in kilogrammes, but this is not true for foods such as pickled plums. The residents are mainly interested in whether something is really ‘out of norm’ and should be given up. In any case, residents are advised to visit the food measurement centre run by Iwaki City, which is approximately a 10-min drive away, to obtain more detailed results.
Ultimately, we cannot measure everything that comes into our bodies. Therefore, in addition to measuring food contamination, it is important to confirm the total amount of radioactive substance in our bodies from ingestion using the whole-body counter (WBC) test. WBC tests have been conducted in Suetsugi since June 2013, when 124 residents took the first test. After taking a WBC test, Dr Miyazaki explained the results to the residents at the community centre. The results were the same as those for other districts in Fukushima Prefecture. Most residents were ‘ND’ (i.e. below 300 Bq body−1, the detection limit for the WBC test). The residents completed a survey before the test. Fig. 3 shows the results from the survey, with the question, ‘Have you been eating local foodstuff since the accident?’ Forty percent of residents answered ‘Yes, I have eaten local food’, 32% answered ‘No, I have not eaten local food’, and the rest (shown as ‘Blank’) did not give an answer.
When Dr Miyazaki explained Fig. 3 to the residents, this had a powerful impact. As most residents had the same results for the WBC test, they could see that the results were not affected by their response to the question. In other words, avoiding local food did not affect the level of internal exposure. A resident told me that, before the test results came back, she could not be confident about whether her eating habits were safe. After the WBC test, she was able to start regaining confidence about her cooking and eating style. Knowing the results for the entire Suetsugi community, rather than just knowing your own result, was significant in rethinking one’s eating habits and WBC results.
7. Continued Efforts after Fukushima
To summarise, by creating the contamination map, the residents started thinking about risk based on actual data, rather than the 30-km radius ‘line’ that was drawn automatically. Also, by measuring external exposure and getting a real estimate of their actual exposure, they learned to be free of the spell of ‘0.23 μSv h−1’. What mattered for the health of the community was the exposure level of people, not the ambient dose rate of a certain place. Finally, by taking WBC tests and measuring actual foodstuffs used for cooking, they began to rethink the meaning of ‘ND’. Instead of having the mentality that ‘anything that is not “ND” is dangerous’, people were able to use actual values to make a judgement.
With relation to the ‘lines’, our efforts can be described this way. First, the local residents measure radiation in their living space as well as in their bodies, and discuss their results and views. Measuring and discussing is the starting point to find a grip on the ‘lines’ that have been imprinted on to our lives since the accident. In turn, the people start to relativise these ‘lines’. In other words, the ‘lines’ are no longer invisible, untouchable chains binding their lives. They become one of the many conventions and rules in everyday life. Finally, by measuring and discussing, the residents start to question the meaning of the ‘lines’; ‘Why they are necessary?', ‘What benefit do they bring to one‘s life?', etc. Through this step, they restore confidence in standards as well as in the society in general that created these standards.
However, the situation has been simplified for the purpose of explanation. In reality, the progress is not one way, and things are often murky. In essence, we have been asking the meaning of the ‘lines’ that divided our lives through measuring and discussing. ‘What is the meaning of this line to the way I live?’ is the question. Sharing data within the community allowed us to ask the question not just for ourselves, but for all of us together, and for our society.
Finally, I would like to highlight a problem. Some ‘lines’ cannot be resolved by the ‘measure and discuss’ approach. These are related to the Government’s actions. Specifically, the ‘lines’ related to evacuation and compensation cannot be resolved by independent measurement by the residents, because the measured results are not used as the basis for administrative actions. Another problem is that the ‘measure and discuss’ approach has been effective for the members of the community in Suetsugi, but has limits in affecting the thinking of people outside the community. For example, even if we explain the results of our measurements to someone in Tokyo, Japan who believes that ‘Suetsugi is not safe to live because it is in the 30-km zone’, we may not be able to change their mind. Our efforts to change ‘lines’ by measuring and discussing do not necessarily work outside the community.
8. Conclusions: Lessons Learned
What are the lessons learned from these ‘lines’? Each time when a ‘line’ is drawn, it has huge impacts on people’s lives. A ‘line’ has the power to tear apart someone's life or the fabric of a community. However, the Japanese Government believes that it is its mission to draw ‘lines’ by its orders and standards. Often, the Government does not consider the full extent of the social impact and the effect on individual lives. I have worked with the people of Suetsugi for 4 y since the accident at Fukushima Daiichi nuclear power plant, and I feel that I have been cleaning up the problems created by the ‘lines’ that were drawn, without much thought, by the Government, rather than the direct effects of the accident.
I hope that no one feels this way in the future. To that end, I urge people in responsible positions to think about the ‘lines’ before any similar accident happens again. I would like them to think about the necessary and appropriate ‘lines’ drawn in society, and how to draw a ‘line’ that will minimise the negative impact on people's lives.
Once there is an accident, governments have to draw ‘lines' based on ‘standards' for radiological protection. However, these ‘lines' directly affect people s lives. ‘Lines' are no longer just science, and they are social; ‘lines' affect people's livelihood and dignity. Stakeholders have the final word of whether or not a line is appropriate. Thus, stakeholder involvement is essential to draw ‘appropriate lines'.