
Abstract
Since the onset of COVID-19, a rise in loneliness has raised concerns about the social impact of lockdowns and distancing mandates. Yet, to date, the effects of the pandemic on social networks have been studied only indirectly. To evaluate how the pandemic affected social networks, the current analyses analyzed five waves of detailed social network interviews conducted before and during the first 18 months of the pandemic in a sample especially vulnerable to contracting the virus: mostly non-White couples (243 husbands and 250 wives) recruited from lower income neighborhoods. Pre-COVID interviews asked spouses to name 24 individuals with whom they interact regularly. Post-COVID interviews indicated a nearly 50% decline in face-to-face interactions and a nearly 40% decline in virtual interactions, with little recovery over the first 18 months of the pandemic. Compared with less affluent couples, those with higher incomes maintained more of their network relationships, especially when virtual interactions were taken into account.
After COVID-19 prompted lockdowns around the world, health officials expressed concerns about a “parallel pandemic” of social isolation (Mucci et al., 2020). Many worried that efforts to contain the virus (e.g., through social distancing and avoiding public gatherings) were separating people from their support networks at the very time when those networks were most needed (e.g., Donnelly et al., 2020). Meta-analytic findings now confirm that feelings of isolation and loneliness have indeed increased since the onset of the pandemic (Ernst et al., 2022), with mothers of young children among the populations especially affected (Weissbourd et al., 2021). By themselves, these feelings warrant concern, as the adverse health implications of loneliness are well-established (Holt-Lunstad et al., 2015). The fact that mental health suffered more in areas that imposed stricter lockdowns and distancing guidelines (Knox et al., 2022) is consistent with the idea that rises in loneliness and emotional distress are due at least in part to COVID mitigation efforts.
Why might people feel lonely and isolated as a result of COVID-19? One possibility is that distancing guidelines and restrictions on social gatherings inflicted lasting damage on people’s social networks (Goolsbee et al., 2020). Early in the pandemic, strict injunctions to avoid social gatherings interrupted routines that would otherwise bring people into regular contact with close friends and family (Philpot et al., 2021; Usher et al., 2020). The transition to remote work further limited opportunities for social interaction, with remote workers reporting more loneliness than those continuing to work in person (Borgatti et al., 2022). With more than 1,000,000 deaths from the virus recorded to date (Centers for Disease Control and Prevention, 2022), many people also lost network members to the virus—losses disproportionately experienced in lower income communities and by people of color (Alcendor, 2020; Khanijahani et al., 2021). Together these trends suggest that the onset of the pandemic may be associated with lasting reductions in the size of people’s social networks (Bierman et al., 2021).
It remains possible, however, that COVID-19 increased feelings of isolation and loneliness without affecting social interactions. For example, even if distancing guidelines restricted face-to-face interactions, people may have compensated by increasing the frequency of their virtual interactions (e.g., through text, Facetime, and Zoom), thus maintaining or even expanding the size of their social networks. Indeed, government entities and public health organizations made virtual connection a centerpiece of their COVID-19 guidance, recommending that people take advantage of burgeoning video-call technology to schedule virtual gatherings with friends and family (Almeda et al., 2021). Unfortunately, people do not receive the same support from virtual connections that they receive from in-person interactions, leaving them feeling lonely even after communicating virtually (Geirdal et al., 2021; van der Velden et al., 2021). Thus, paradoxically, an increase in virtual interactions could account for the rise in loneliness even if overall interactions within one’s social network remained constant.
A third possibility is that social networks shrank during the initial stages of the pandemic but then recovered once vaccines became available and the most stringent restrictions were lifted. As some scholars have noted, lasting damage to people’s social networks is “not inevitable nor necessarily enduring, since social networks are also adaptive and responsive to change” (Long et al., 2022, p. 129). Some research on loneliness is consistent with this possibility, finding that, after its initial rise in the first year of the pandemic (Ernst et al., 2022), feelings of loneliness may have begun to subside (Ray & Shebib, 2022).
The primary aim of this study is to determine whether efforts to contain COVID-19 affected people’s interactions with their social network members, thereby testing competing explanations for documented increases in subjective experiences of isolation and loneliness. To date, researchers have not had access to the data necessary to address this issue, that is, multiwave assessments of social networks collected before and after the onset of the pandemic. The current study fills this gap by drawing upon five waves of social network interviews (two prior and three during the pandemic) collected from a diverse sample of mostly non-White couples (250 wives and 243 husbands) living in lower income neighborhoods. Situating our study here allows us to focus directly and explicitly on the communities (Truong & Asare, 2021) and racial/ethnic groups (Khanijahani et al., 2021) suffering disproportionately from COVID-19. At each of these five assessments, we calculated measures of individuals’ face-to-face network size (i.e., how many people, out of 24 total network members named, participants saw face-to-face in about the last 9 months), virtual network size (i.e., how many of the 24 they interacted with virtually in the last 9 months), and face-to-face or virtual network size (i.e., how many of the 24 they interacted with face-to-face or virtually in the last 9 months). Using participants’ most recent of the two interviews prior to COVID-19 as an indicator of their “pre-COVID” network, in addition to the three assessments during COVID, we assessed how these three network types changed from pre-COVID across the three COVID intervals (i.e., COVID 1–3). Participants were asked about the same 24 network members at each of the four intervals. In addition, we calculated these network sizes for each of three subgroups: family, friends, and coworkers, to assess whether individuals maintained some relationship types more than others.
A second aim of this study is to look beyond average changes in social networks in an effort to identify segments of the population that are particularly hard-hit by the pandemic. We do this in two ways. First, we test the prediction that constriction in social networks will be especially acute among those with lower incomes and fewer resources. Toward this aim, we tested three individual difference moderators of network change: in-person worker status (i.e., in-person worker vs. non-in-person worker), racial/ethnic identification (i.e., Latinx, Black, or White), and income. Given that lower income and minoritized individuals have limited access to the high-speed internet and virtual communications needed to compensate for a lack of in-person contact (Millett et al., 2020; Yearby & Mohapatra, 2020), we expect a greater reduction in their social networks compared with those of relatively affluent individuals sampled within these same communities. Second, because the qualities of individuals’ entire networks may shape how those networks respond to the pandemic-related restrictions, we test the prediction that networks in which fewer members know each other (i.e., less-dense networks) will experience more instability because less-dense networks have more weak ties that can be easily shed (Zhou et al., 2009).
Method
Sampling
The original sampling procedure of this longitudinal study, dating back to 2009, was designed to yield first-married newlywed couples in which both partners were of the same race/ethnicity (i.e., Latinx, Black, or White), living in neighborhoods with a high proportion of low-income residents in Los Angeles County. Recently married couples were identified through names and addresses on marriage license applications filed in 2009, obtained from the Los Angeles County Recorder’s Office. Because sample recruitment occurred when same-sex marriage was illegal in the state, all couples were mixed gender. Addresses were matched with census data to identify applicants living in census block groups wherein the median household income was no more than 160% of the 1999 federal poverty level for a four-person family. Names on the licenses were then weighted using data from a Bayesian Census Surname Combination, which integrates census and surname information to produce a multinomial probability of membership in each of four racial/ethnic categories. Couples were chosen using probabilities proportionate to the ratio of target prevalences to the population prevalences, weighted by the couple’s average estimated probability of being Latinx, Black, or White. Couples were screened to ensure that they were married, that neither partner had been previously married, and that both spouses identified as Latinx, Black, or White. A total of 3,793 couples were identified through addresses listed on their marriage licenses. Of those, 2,049 could not be reached and 1,522 (40%) responded to a mailing and agreed to be screened for eligibility. Of those, 824 couples were screened as eligible, and 658 (80%) of those couples agreed to participate in the study. A final baseline sample of 431 couples completed the initial assessment of this longitudinal study within the data collection window.
Procedure
Between 2009 and 2014, couples were interviewed five times at approximately 9-month intervals. Couples were then recontacted for a sixth interview in 2018–2019, which began a series of five more interviews between 2018 and 2022. The data examined here were obtained during these latter five interviews, aside from some demographic information gathered at the beginning of the longitudinal study (e.g., racial/ethnic identification). Because the first two of these interviews were conducted mostly prior to the COVID-19 pandemic in the United States, we refer to these as “pre-COVID 1” and “pre-COVID 2” while the latter three interviews are “COVID 1,” “COVID 2,” and “COVID 3.”
At the pre-COVID 1 assessment, which took place between June 2018 and April 2019, two trained interviewers visited couples in their homes. The interviewers took spouses to separate areas to obtain informed consent and verbally administer the individual interviews, which were divided into two parts. The first was a standard interview from which we derive all demographic information. The second part was a detailed social network interview. Participants were asked to name 25 network members (starting with their spouse) with whom they had any form of contact during the past year. Although social networks are larger when considering the number of weak ties and acquaintances that people maintain, 25 network members sufficiently capture individuals’ most meaningful relationships (Hill & Dunbar, 2003; Kennedy et al., 2015). Spouses answered several questions about each individual they named. At the pre-COVID 2 wave, which occurred between July 2019 and May 2020, interviews were again conducted in person until March 14, 2020, after which interviews were conducted over the phone. During this wave, spouses were asked again to name 25 network members with whom they had any form of contact during the past year. This list could include or exclude network members listed at pre-COVID 1. On March 19, 2020, California (where most couples in the study lived) declared a mandatory stay-at-home order. Forty husbands and 41 wives were interviewed after March 19, 2020 during the pre-COVID 2 wave. Our analyses asked spouses to recall their interactions with others over the past year, so most of that time was prior to March 19th. Thus, we included spouses who were interviewed after March 19th during the pre-COVID 2 assessment. For the purpose of the present analyses, we used social network data from a spouse’s most recent of the pre-COVID 1 and pre-COVID 2 interviews, that is, pre-COVID 2 if available or pre-COVID 1 if pre-COVID 2 was not available. We refer to these data as coming from the spouse’s “pre-COVID interview.” The pre-COVID 2 assessment was the most recent pre-COVID assessment for 92% of husbands and 91% of wives. The pre-COVID interview sample size was 243 husbands and 250 wives.
A timeline of important events during the COVID-19 pandemic in conjunction with dates of the COVID assessments is provided in the Online Supplemental Materials (Haggerty, 2023): https://osf.io/vef8t/. At the COVID 1 interview, conducted entirely via telephone from July 2020 to January 2021, spouses were not asked to name a new list of 25 network members. Instead, they were asked a series of questions about the people they listed during their most recent pre-COVID assessment, items that were relevant to understanding how these relationships changed across the transition into the COVID-19 pandemic. Despite the uncertainty and turmoil of the pandemic, retention was high. The COVID 1 sample size was 200 husbands and 210 wives (82% and 84% of the pre-COVID sample size, respectively). At the COVID 2 (March–September 2021) and COVID 3 (November 2021–March 2022) assessments, spouses were provided with the same 25 names they had provided prior to the pandemic and asked the same questions about each name on that list. The COVID 2 sample size was 204 husbands and 212 wives (84% and 85% of the pre-COVID sample size, respectively). The COVID 3 sample size was 201 husbands and 199 wives (83% and 80% of the pre-COVID sample size, respectively). We assessed whether those who dropped out after their pre-COVID assessment (N = 42 husbands, N = 51 wives) differed from those who completed their COVID 3 assessment (N = 201 husbands, N = 199 wives) on 12 measures of network size as well as income and network density. Of these 28 tests across the two spouses, we found only one significant difference: Wives who completed the study saw more of their friends in-person pre-COVID compared with those who dropped out, t(248) = 2.2, p = .03.
At the first COVID interview, 80% of participating couples were living in Los Angeles County and therefore subject to the same mandates and guidelines. Of the remaining households, all but one resided within the United States. Our sample size did not allow for direct comparisons between couples living in different regions. All procedures were approved by the RAND Corporation institutional review board.
Participants
The final sample consisted of 243 husbands and 250 wives from 251 households who provided data for at least one time point. At the pre-COVID assessment, wives ranged in age from 28 to 49 years old (M = 37.0, SD = 4.9), and husbands ranged in age from 28 to 61 years old (M = 38.7, SD = 5.6). The majority of wives (91%) and husbands (85%) reported receiving a high school diploma or greater. Approximately 41% of wives and 34% of husbands reported a college degree or higher education. The median household income at the pre-COVID assessment was $96,000 (SD = $101,175). As part of the study inclusion criteria, spouses were required to identify as Latinx, Black, or White, and both spouses in a couple had to identify as the same race/ethnicity. Of the 243 husbands, 80% identified as Latinx, 12% identified as White, and 8% as Black. These proportions were identical for the 250 wives. At the pre-COVID interview, 91% of husbands and wives had children.
Measures
Pre-COVID Network Sizes
At pre-COVID 1 and 2, spouses were asked the following question about each network member they named: “In the past year, how often have you had face-to-face contact with [NAME]?” If the spouse answered “A few times a year” or a more frequent response, that network member was coded as “1.” If the participant did not see the network member at least a few times a year, that network member was coded “0.” We selected this threshold of “a few times a year” because interviews were generally about 9 months apart. Thus, if a spouse saw a network member at least a few times a year, it is highly likely they had seen that network member since the last interview. We then added the number of network members coded “1” to create a measure of face-to-face network size for each participant prior to the pandemic.
A second question asked: “In the past year, how often have you had contact with [NAME] over the phone, via emails, text messages, video chat, social media, etc.?” The response options were the same as for the face-to-face question. The same procedure was used to derive a measure of virtual network size before the pandemic.
To create a measure of the size of the total interactive network (i.e., the people with whom respondents had face-to-face or virtual interactions), a network member was coded “1” if they were contacted either in-person or virtually at least “a few times a year.” Adding the number of network members contacted virtually or in-person for each spouse gives a measure of the total interactive network size.
Respondents categorized each network member into one of four types of relationships: family, friend, coworker, or other. Categories were not mutually exclusive; however, participants gave more than 97% of network members only one categorization. When two or more relationships were listed, we reclassified the network member as family if one of the categories was family, friend if one of the categories was friend but not family, followed by coworker and, finally, other. For each of the three networks (i.e., face-to-face, virtual, and total), we estimated the size of three subnetworks: one for family, one for friends, and one for coworkers. A further 8% of husbands’ and 10% of wives’ network members were “other” relationships. These data were not analyzed due to the relatively small number of people who fit that categorization and because the disparate relationships within that category (e.g., neighbors, service providers, unspecified other types) make it difficult to draw conclusions about how and why this category might have changed over time.
COVID Assessments Network Size
At COVID 1, spouses were asked the following question about each network member: “What kind of contact have you had with this person since March 19th?” At COVID 2 and 3, spouses were asked: “What kind of contact have you had with this person since the last time we spoke with you in [fill month and year from prior assessment]?” The response options at COVID 1–3 were: “No contact at all,” “In-person, less than 6 feet away,” “In-person, 6 feet away or more,” “Virtual, with video,” and “Virtual, without video (phone, email, text, social media).” For face-to-face networks, a network member was coded “1” if they were seen in-person, regardless of whether it was 6 feet away or not. For virtual networks, a network member was coded “1” if they were contacted virtually, either with or without video. By adding the number of network members coded “1,” we derived separate estimates of face-to-face network size and virtual network size. The response options were not mutually exclusive, meaning the same individual could be a part of the face-to-face and virtual network. Like the pre-COVID assessments, we derived a measure of the total interactive network size by coding a network member “1” if they were contacted either in-person or virtually for each spouse. In addition, we calculated family, friend, and coworker subnetwork sizes for the face-to-face, virtual, and total networks, as was done for the pre-COVID assessments.
In-Person Worker Status
At their pre-COVID interview, 94% of husbands and 73% of wives indicated that they were employed outside their homes. In the first COVID interview, participants were asked: “Since the stay-at-home order began on March 19th, how many hours a week have you worked outside your home on average?” If the respondent worked outside the home for at least 1 hour per week, they were classified as an in-person worker. At the COVID 1 assessment, 145 (73%) husbands and 101 (48%) wives were classified as in-person workers. The COVID 1 in-person worker status was used as a moderator in our analyses.
Social Network Density
During the pre-COVID social network interview, but not during the COVID interviews, participants were asked the following question for each pair of network members on their list: “Have [NAME] and [NAME] had contact in the past year or so?” To calculate network density, we divided the number of pairwise connections among network members by the total possible number of pairwise connections. A network density value of 1 would indicate that every person that the spouse listed had been in contact with every other person on their list in the past year or so, whereas a value of 0 indicates a sparse network in which network members were not in contact with each other. The mean network density was .38 (SD = .19) for husbands and .46 (SD = .24) for wives.
Income
Spouses reported their average monthly income. The values for husbands and wives were added and multiplied by 12 to compute a yearly household income measure. Household income at COVID 1 was used as a moderator in our analyses. The median income was $90,000 (SD = $75,875) at COVID 1.
Analytic Plan
To account for the interdependence between husbands’ and wives’ responses, we conducted multilevel modeling using Restricted Estimation Maximum Likelihood to estimate random effects in SPSS Version 27 using the MIXED procedure (Corbeil & Searle, 1976). We generated graphs from R Version 3.6.2. The two-intercept approach models data from both spouses, providing separate husband and wife intercepts and slopes and accounts for the covariance between husbands’ and wives’ responses (Planalp et al., 2017; Raudenbush et al., 1995). Although we did not have any a priori predictions regarding gender differences, whenever the pattern of significant results was different for husbands and wives, we used an interaction approach (see Planalp et al., 2017) to test whether husbands’ and wives’ parameters were significantly different from one another. For both approaches, time (i.e., pre-COVID, COVID 1, COVID 2, COVID 3) is nested within spouse within couple, but this is equivalent to a two-level model with time and individual nested within couple (Raudenbush et al., 1995). The two-intercept approach, within-couple equation is as follows:
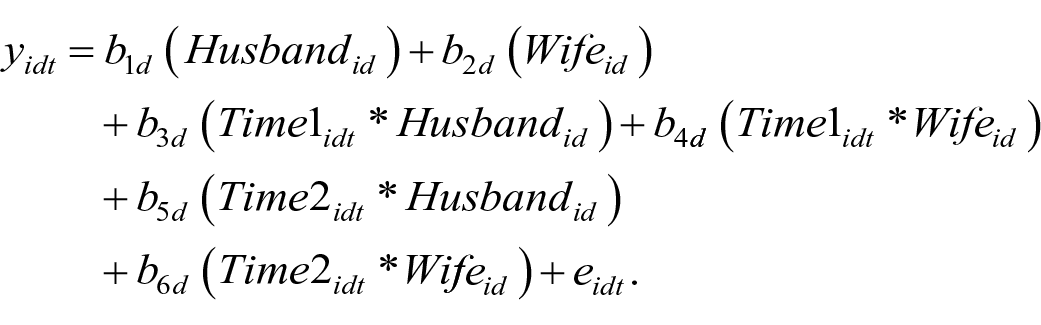
We estimated a piecewise growth model (see Shadish et al., 2002; Zvoch, 2016) across the four timepoints with a knot placed at COVID 1 by coding Time1 (−1 0 0 0) and Time2 (0 0 1 2). Thus, the
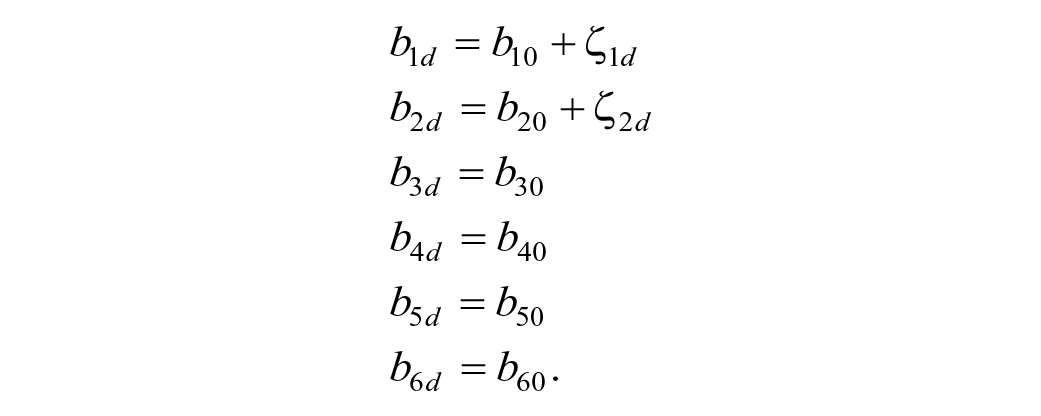
Here, we see that the Level 1 coefficients are not further explained by covariates, but the between-couple residual terms,
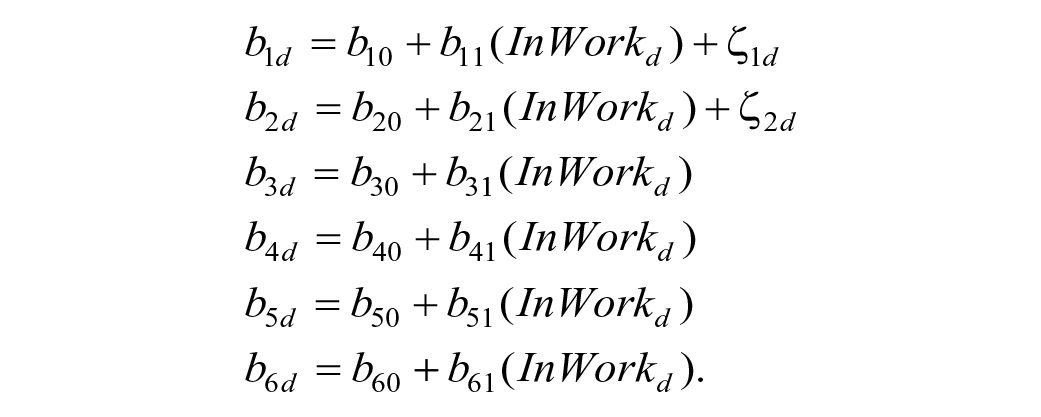
The six coefficients are each further explained by in-person worker status. The
There were 12 dependent variables in this study: For each of the total, family, friend, and coworker networks, we calculated a face-to-face, virtual, and face-to-face or virtual network size. Supplemental Materials (Haggerty, 2023), including question text, syntax, data file, tables, and codebook are available online: https://osf.io/vef8t/. These analyses were not preregistered.
Results
Did Social Networks Shrink After the Onset of the Pandemic?
Compared with before the pandemic, husbands reported seeing 11.3 fewer people face-to-face on average at the first COVID assessment (b = −11.3, t = −32.7, p < .01), while wives reported seeing 10.9 fewer people on average (b = −10.9, t = −33.9, p < .01), a decline of 47% and 46%, respectively (see Figure 1 and Table 1). The change for husbands was not significantly different from the change for wives (b = 0.4, t = 1.0, p = .34). From COVID 1–3, husbands’ face-to-face interactive network size increased by 0.9 people (b = 0.9, t = 4.8, p < .01) and wives’ network size increased by 1.2 people (b = 1.2, t = 6.7, p < .01). These increases were also not significantly different from one another (b = 0.3, t = 1.2, p = .22). Although this was a statistically significant recovery for both spouses, 18 months after the onset of the pandemic, the average face-to-face interactive network size remained down by 40% for husbands and 36% for wives compared with pre-pandemic levels.
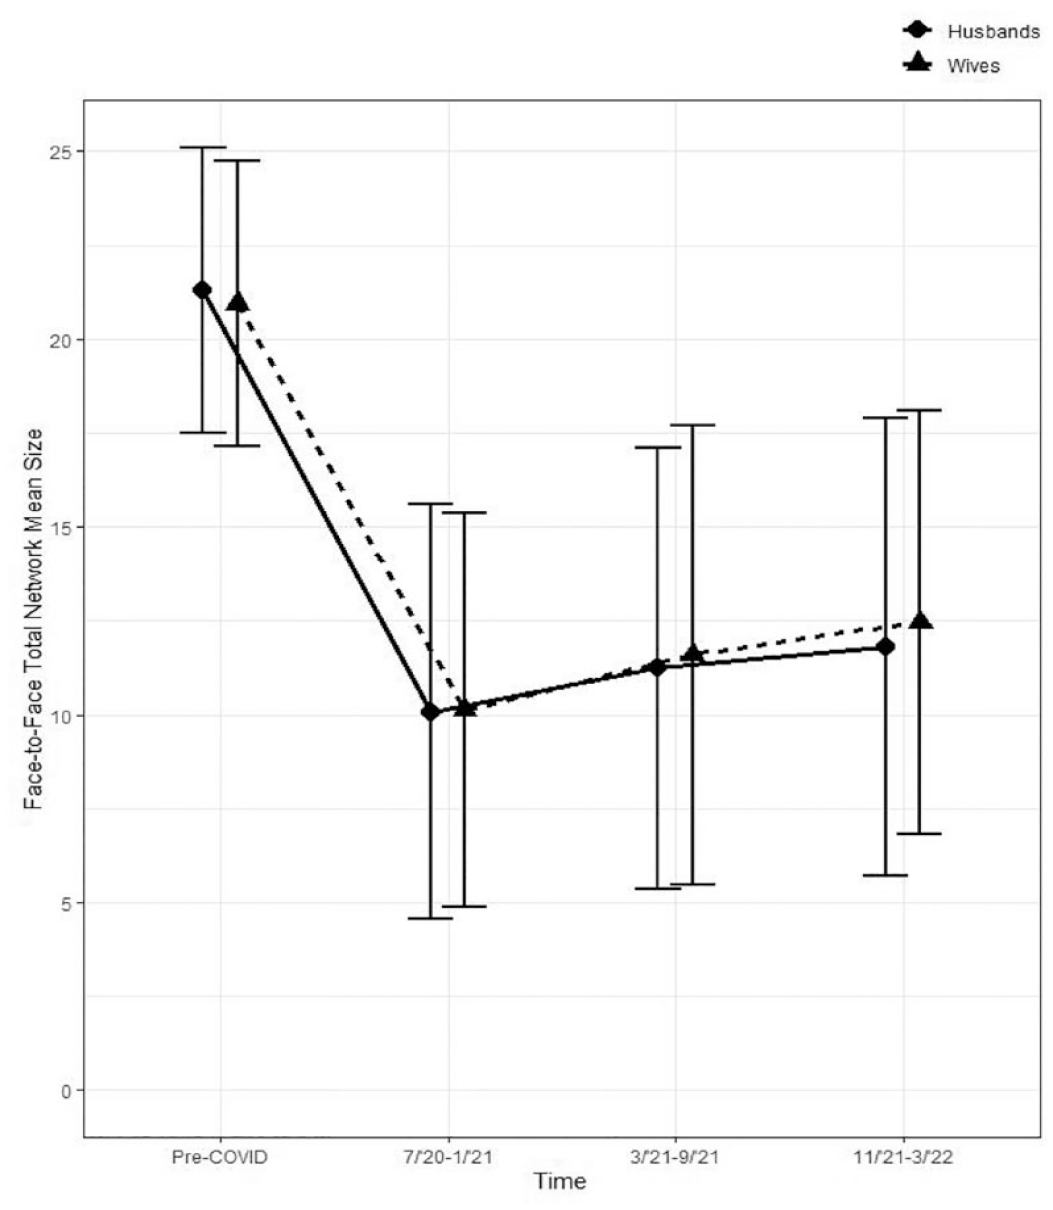
Change in Face-to-Face Network Size of Total Network. Mean face-to-face total network size decreased from pre-COVID to COVID 1 for husbands and wives and recovered only slightly over the next 1.5 years. Bars represent ±1 standard deviation from the mean.
Average Interactive Network Size Change Across Subnetworks and Network Types.
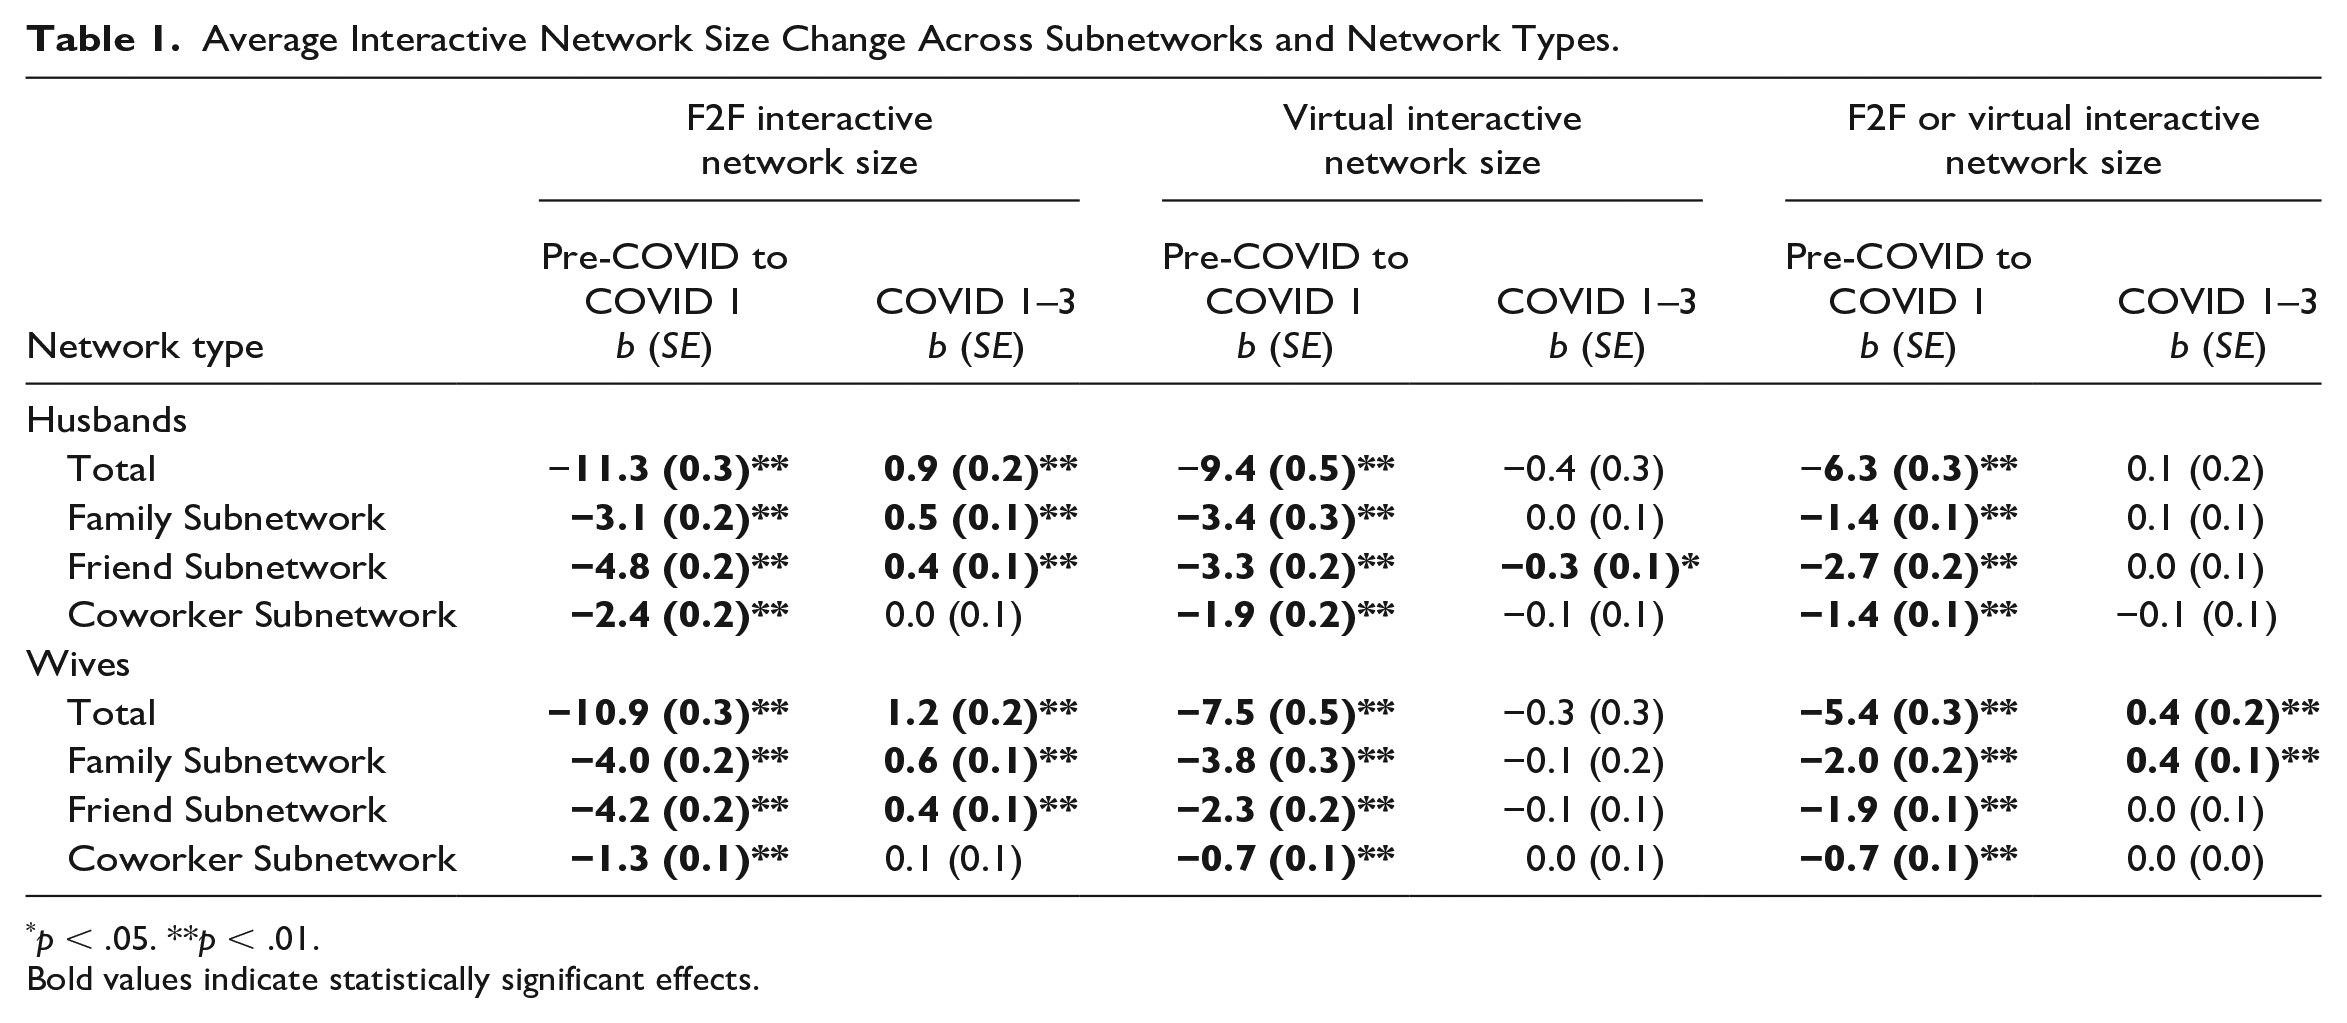
p < .05. **p < .01.
Bold values indicate statistically significant effects.
Although government agencies encouraged people with internet access to compensate for the mandated constraints on face-to-face interactions by increasing virtual interactions, virtual social networks also experienced lasting declines during the first year of the pandemic (see Figure 2). From pre-COVID to COVID 1, husbands’ average virtual network size decreased by 9.4 people (b = −9.4, t = −19.9, p < .01), and wives’ average virtual network size decreased by 7.5 people (b = −7.5, t = −16.4, p < .01), declines of 39% and 32%, respectively. Husbands’ declines in virtual network size were significantly greater than that of wives (b = 1.9, t = 3.5, p < .01). Neither husbands’ nor wives’ virtual networks recovered significantly between COVID 1 and COVID 3 (husbands: b = −0.4, t = −1.4, p = .17; wives: b = −0.3, t = −1.1, p = .27). By 18 months after the beginning of the pandemic, average virtual network size was down 42% for husbands and 34% for wives.
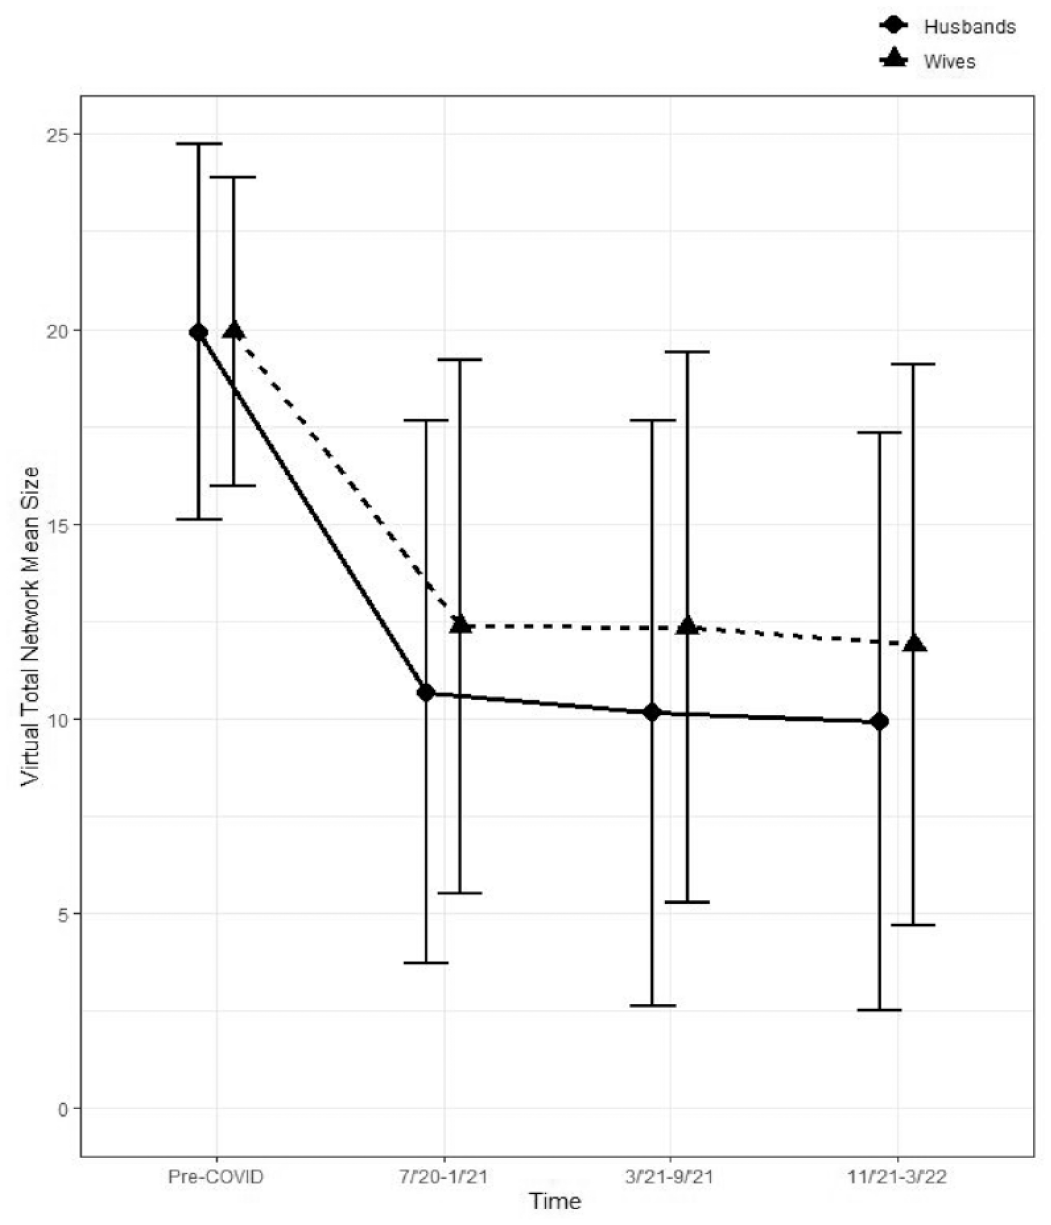
Change in Virtual Network Size of Total Network. Mean virtual total network size decreased from pre-COVID to COVID 1 for husbands and wives and did not recover over the next 1.5 years. Bars represent ±1 standard deviation from the mean.
If spouses were primarily interacting with network members through both face-to-face and virtual contact prior to the pandemic, but only one modality after the pandemic began, then their total (i.e., face-to-face or virtual) interactive networks might have remained stable even though face-to-face and virtual interactive networks both shrank. However, even when we allowed for such shifts by considering network members with whom spouses had face-to-face or virtual contact, we continued to observe substantial and lasting declines in the total interactive network after the onset of the pandemic. These declines were not as drastic as they were in the separate face-to-face or virtual networks: From pre-COVID to COVID 1, husbands had virtual or face-to-face interactions with 6.3 fewer people (b = −6.3, t = −19.2, p < .01) and wives with 5.4 fewer people on average (b = −5.4, t = −19.7, p < .01), a decline of 27% and 23%, respectively (see Figure 3). Again, the decrease for husbands was significantly greater than the decrease for wives (b = 0.9, t = 2.4, p = .02). After these initial losses, husbands’ total interactive networks experienced no significant recovery between COVID 1 and COVID 3 (b = 0.1, t = 0.4, p = .72). Wives’ total networks recovered only slightly from COVID 1 to COVID 3 (b = 0.4, t = 2.6, p < .01), but this change was not significantly different than the change that husbands experienced (b = 0.3, t = 1.6, p = .12). Thus, 18 months into the pandemic, husbands’ average total interactive network size was still 26% lower and wives’ average total interactive network size was 20% lower than pre-pandemic levels.
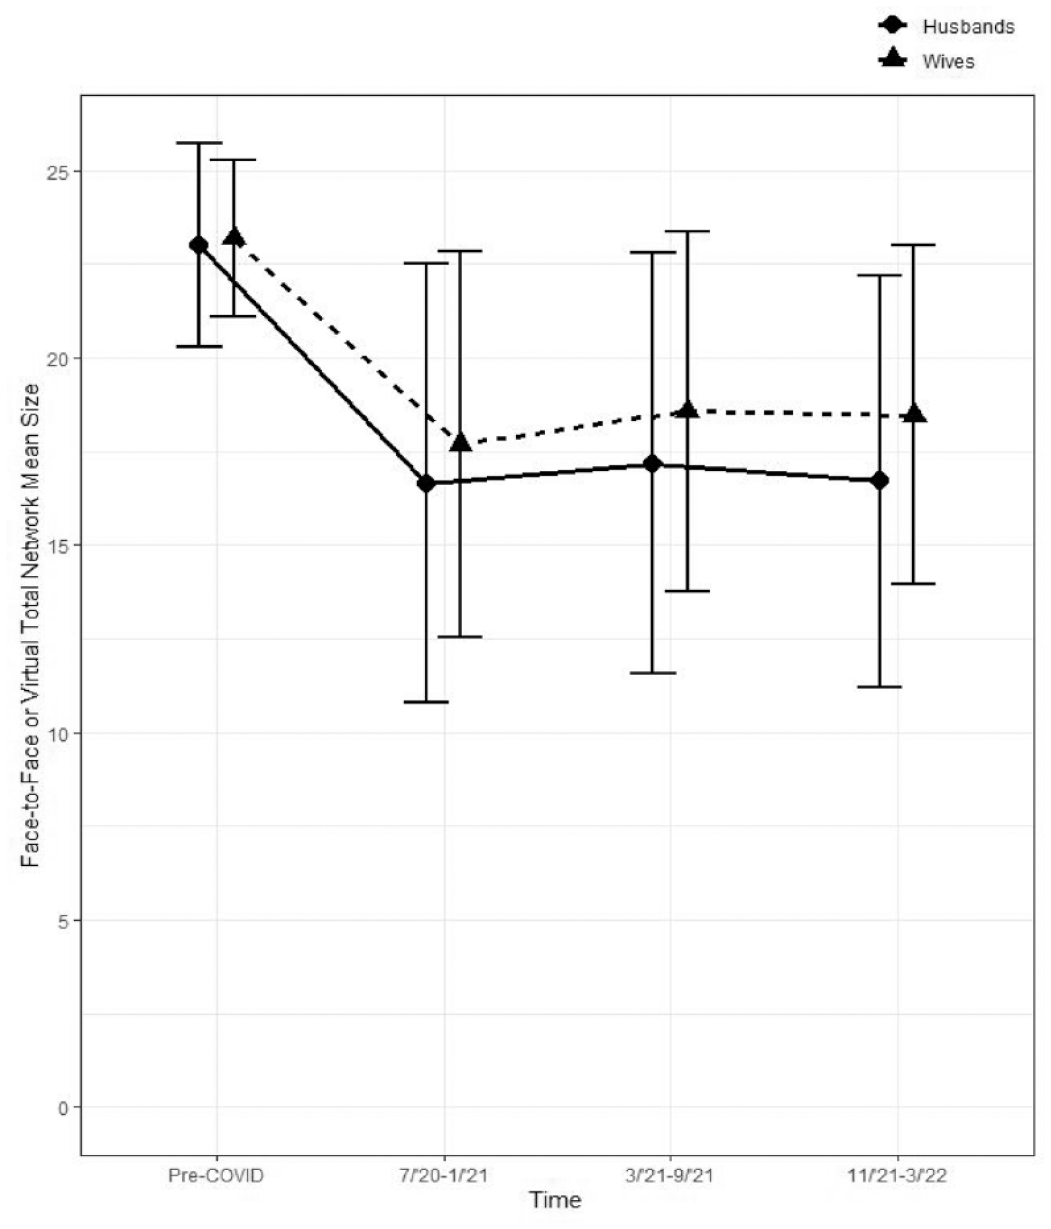
Change in Face-to-Face or Virtual Network Size of Total Network. Mean face-to-face or virtual total network size decreased from pre-COVID to COVID 1 for husbands and wives and did not recover to pre-pandemic levels. Bars represent ±1 standard deviation from the mean.
A possible reason for these declines is that deaths due to COVID-19 removed people from the network. At COVID 1, spouses indicated that only 3.2% of all network members had contracted the virus, and over the following two data collection periods spouses spontaneously reported 0.6% of their network members had died from COVID-19. Thus, deaths from COVID were not nearly frequent enough within this sample to account for the declines in network relationships observed here.
Which Relationships Were Most Affected by Shrinking Social Networks?
When lockdowns and social distancing measures were imposed, we might have expected that more distal relationships (e.g., coworkers) would shrink more than closer relationships (e.g., friends and family). In fact, Table 1 reveals significant and lasting declines for husbands and wives within all subnetworks.
As the table reveals, face-to-face interactions with spouses’ family, friend, and coworker subnetworks each shrank significantly from pre-COVID to COVID 1. In terms of gender differences, wives experienced larger decreases in their family subnetwork size (b = −1.0, t = −3.9, p < .01), but husbands experienced larger decreases in both the friend (b = 0.6, t = 2.1, p = .04) and coworker (b = 1.1, t = 5.5, p < .01) subnetworks. For husbands and wives, the family subnetwork recovered slightly from COVID 1 to COVID 3 (husbands: b = 0.5, t = 4.9, p < .01; wives: b = 0.6, t = 4.6, p < .01), but even with those recoveries, husbands and wives, who on average saw 89% and 86% of their families face-to-face pre-COVID, saw only 64% and 63% of their families face-to-face by COVID 3. Face-to-face interactions with the friend subnetwork followed a similar pattern, recovering significantly from COVID 1 to COVID 3 for husbands and wives (husbands: b = 0.4, t = 2.7, p < .01; wives: b = 0.4, t = 3.5, p < .01), but not reaching pre-COVID levels. Wives on average saw 85% of their friends face-to-face before COVID, but only 41% in-person by COVID 3, while husbands on average saw 87% of their friends face-to-face before COVID but only 41% in-person by COVID 3. Face-to-face interactions with the coworker subnetwork did not recover from COVID 1 to COVID 3 for either husbands (b = 0.0, t = 0.4, p = .69) or wives (b = 0.1, t = 1.7, p = .09). By 18 months into the pandemic, husbands and wives were both interacting with about 50% fewer coworkers on average compared with pre-COVID.
For husbands and wives, virtual interactions also declined on average for all three subnetworks from pre-COVID to COVID 1 and did not rebound significantly over the subsequent assessments. Husbands experienced greater declines than wives from pre-COVID to COVID 1 in both the friend (b = 1.0, t = 3.6, p < .01) and coworker (b = 1.2, t = 6.2, p < .01) subnetworks. Both spouses had pre-COVID virtual interactions with 83% to 88% of each of their three subnetworks, but this had declined to 36% to 55% by 18 months into the pandemic. In other words, consistent with the findings for the overall network, spouses were not increasing their virtual contact with family, friends, or coworkers to compensate for the decline in face-to-face contact in each of these subnetworks.
Considering network members contacted through face-to-face or virtual interactions, Table 1 shows that all three subnetworks declined significantly from pre-COVID to COVID 1 for husbands and wives, with the only indication of recovery coming from wives’ family interactions between COVID 1 and COVID 3 (b = 0.4, t = 4.3, p < .01). Wives experienced steeper declines than husbands in face-to-face or virtual interactions with family from pre-COVID to COVID 1 (b = −0.6, t = −3.2, p < .01) but recovered more quickly during COVID (b = 0.2, t = 2.2, p = .03). Husbands, however, experienced larger declines from pre-COVID to COVID 1 for both the friend (b = 0.8, t = 3.4, p < .01) and coworker (b = 0.8, t = 4.8, p < .01) subnetworks. Prior to COVID, husbands and wives interacted with 97% of their family in-person or virtually; by COVID 3, this average had declined to 85% for husbands and 87% for wives. Prior to COVID, husbands and wives interacted with friend and coworker subnetworks at similarly high rates (97–98%), but the average declines in these subnetworks were much larger. By 18 months into the pandemic, husbands were interacting face-to-face or virtually with only 65% of their friends and 63% of their coworkers on average, and wives were interacting with 73% of their friends and 63% of their coworkers on average.
Whose Social Networks Shrank the Most?
In-Person Workers versus Non-in-Person Workers
Table 2 displays how in-person workers and non-in-person workers differed in total network size change. Unsurprisingly, compared with non-in-person workers, in-person workers experienced less drastic decreases in face-to-face network size compared with non-in-person workers (husbands: b = 2.3, t = 3.0, p < .01; wives: b = 1.7, t = 2.6, p = .01), although there were no differences in recovery between COVID 1 and COVID 3. Perhaps because they had maintained more of their face-to-face interactions, husbands who worked in-person experienced larger decreases in their virtual network size from pre-COVID to COVID 1 (b = −2.4, t = −2.3, p = .02). Wives who worked in-person experienced a larger decrease in virtual network size across COVID 1 to COVID 3 than those who did not work in-person (b = −1.4, t = −2.8, p < .01). With respect to the total interactive network (face-to-face or virtual interactions), wives who worked in-person had smaller decreases from pre-COVID to COVID 1 (b = 2.2, t = 3.9, p < .01) but larger decreases from COVID 1 to COVID 3 (b = −1.0, t = −3.4, p < .01). There were no significant group differences in the total interactive network for husbands.
Effects of Individual Differences on Total Interactive Network Sizes.
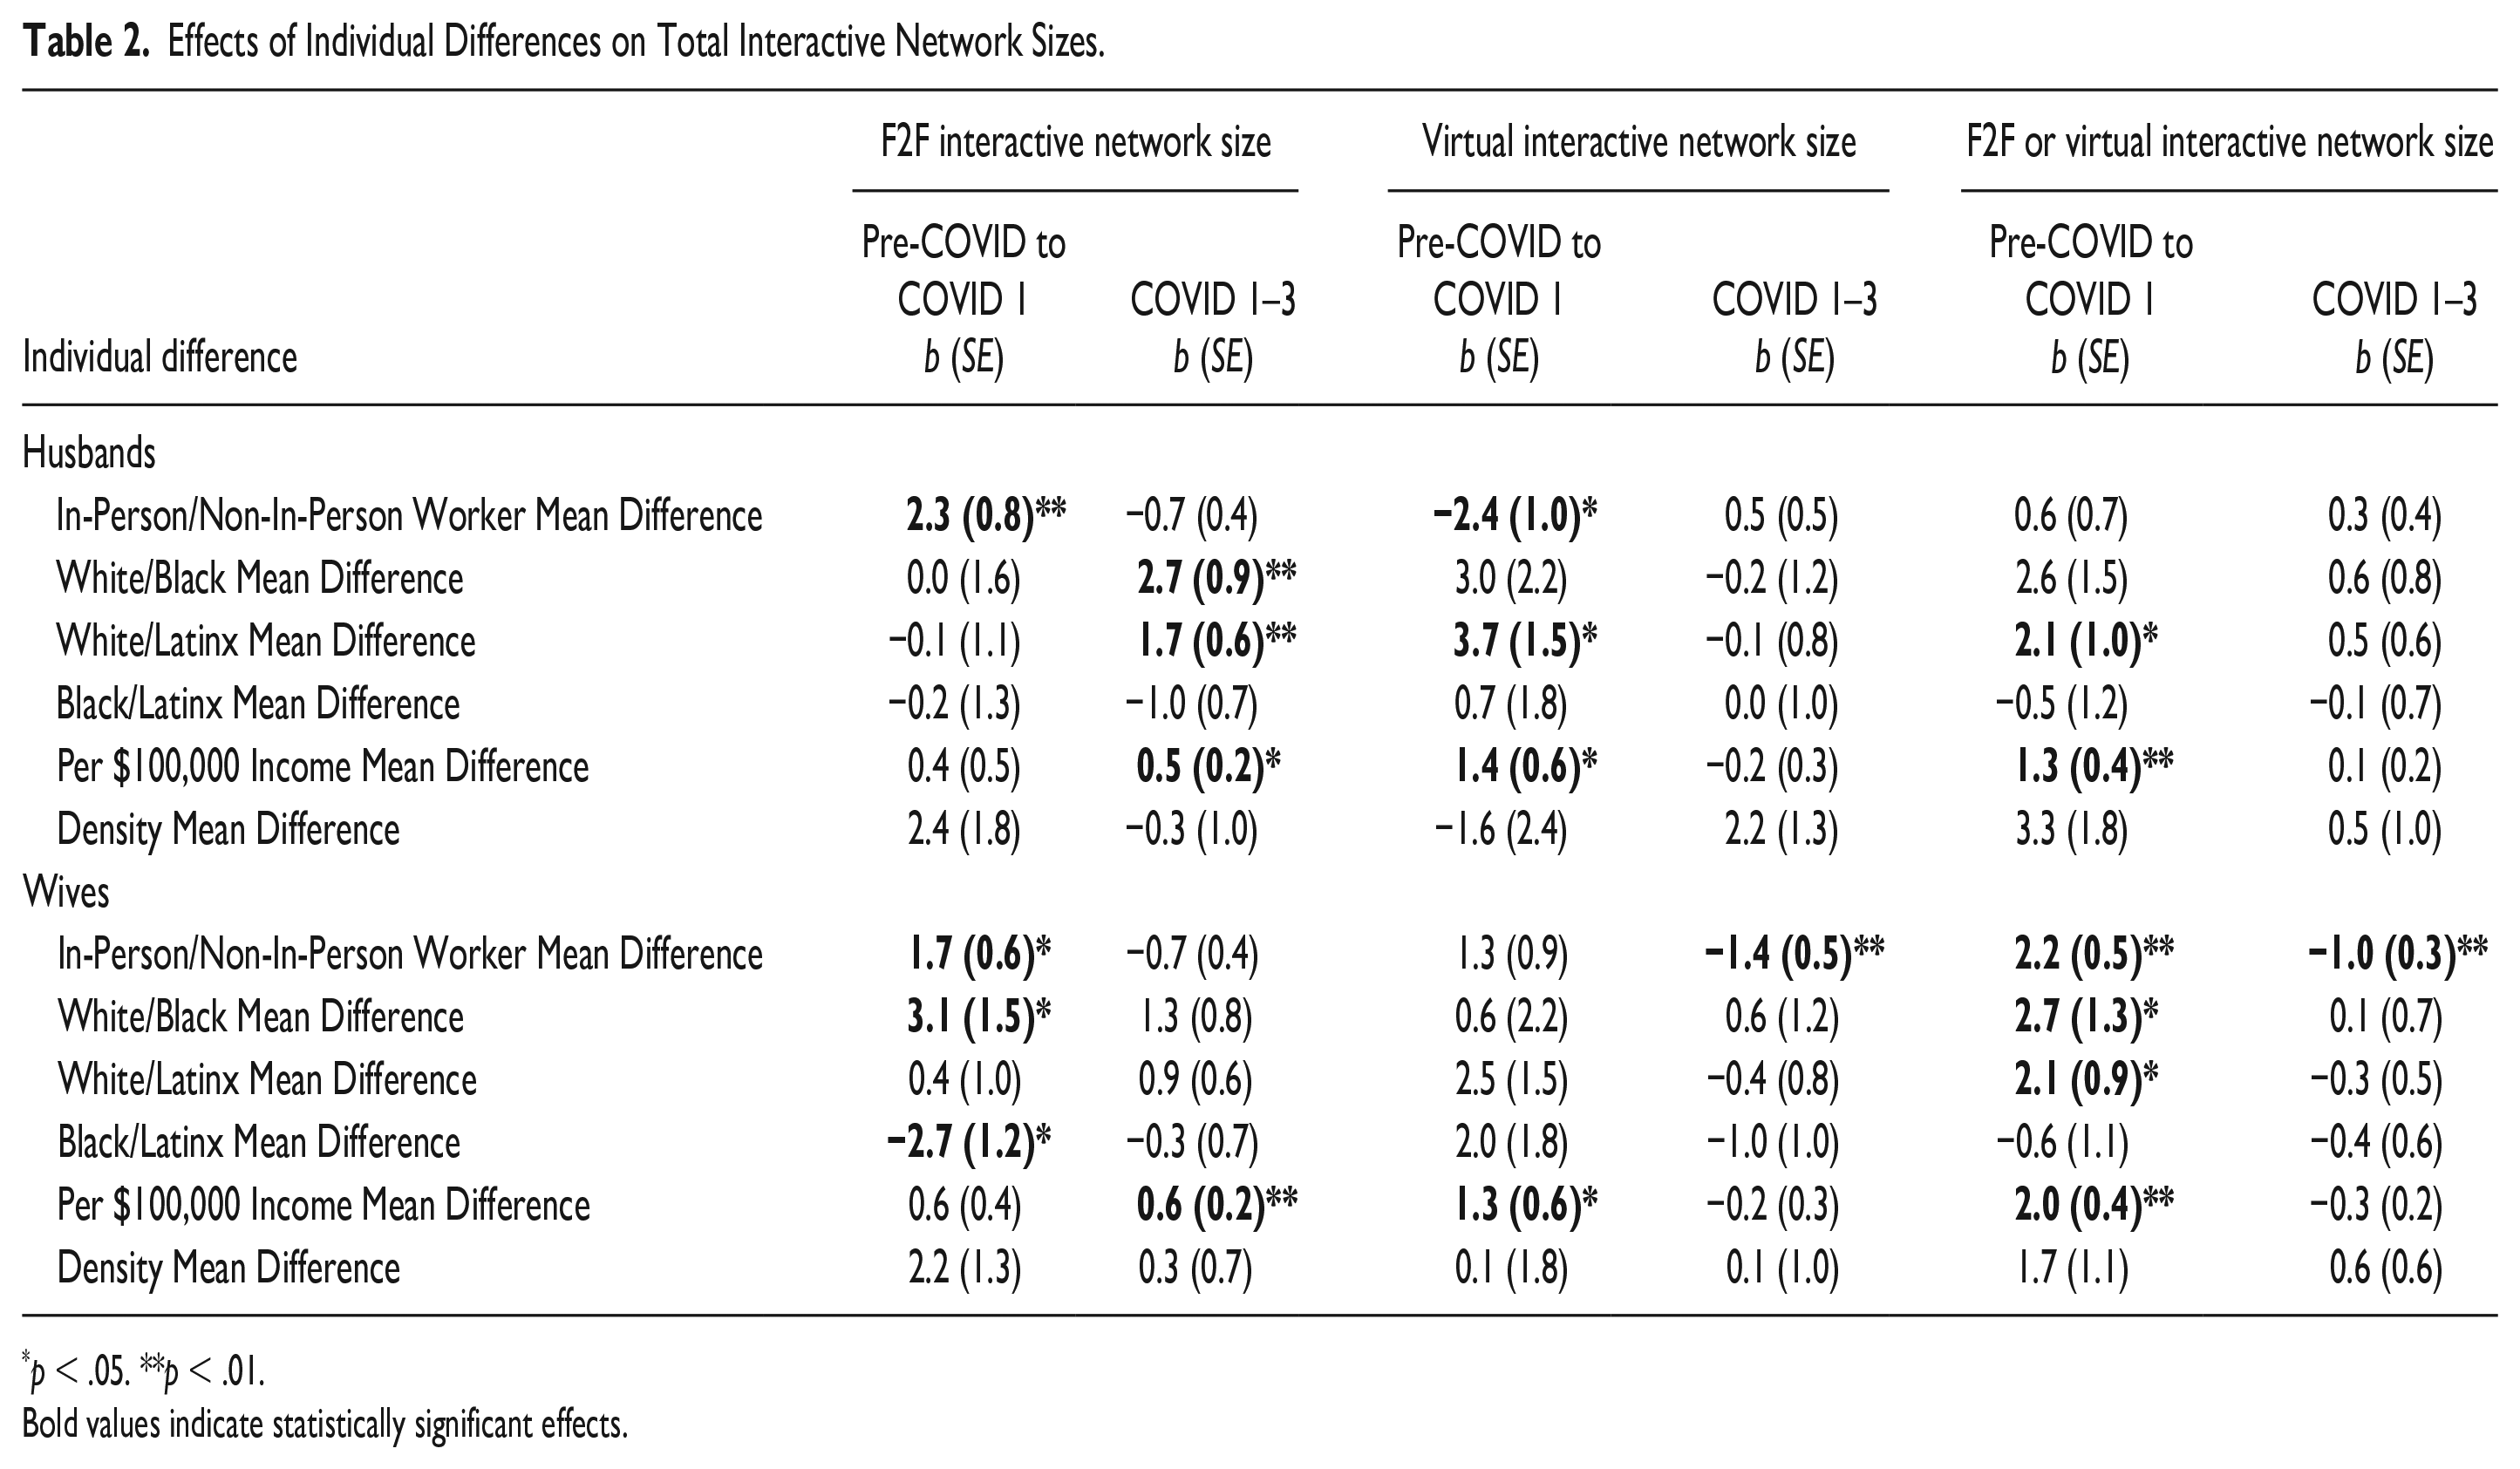
p < .05. **p < .01.
Bold values indicate statistically significant effects.
Racial/Ethnic Differences
As Table 2 reveals, the pandemic had significantly different effects on the social networks of Latinx, Black, and White spouses. With respect to face-to-face interactions for husbands, there were no significant differences among racial/ethnic groups in the immediate effects of the pandemic on social networks, but there were significant differences in recovery. Over the 18 months of the pandemic that we studied, White husbands’ face-to-face networks had recovered significantly more than those of Black husbands (b = 2.7, t = 3.1, p < .01) and Latinx husbands (b = 1.7, t = 2.9, p < .01). For wives, racial/ethnic differences were evident at the outset of the pandemic. White wives had significantly less drastic declines in their face-to-face network size than Black wives (b = 3.1, t = 2.0, p = .04), and Latinx wives similarly experienced less drastic declines in face-to-face network size than Black wives (b = −2.7, t = −2.2, p = .03).
With respect to virtual interactions, Table 2 reveals only that White husbands experienced smaller decreases in virtual network size from pre-COVID to COVID 1 compared with Latinx husbands (b = 3.7, t = 2.5, p = .01). There were no differences in virtual network size recovery from COVID 1 to COVID 3 for either husbands or wives.
With respect to the total interactive network (face-to-face or virtual), there were no differences in network size change between Black and Latinx husbands or wives, but the total networks of White husbands did not decrease as drastically as those of Latinx husbands from pre-COVID to COVID 1 (b = 2.1, t = 2.0, p = .04), and the same was true for White wives (b = 2.1, t = 2.3, p = .02). In addition, White wives experienced significantly smaller decreases in total network size from pre-COVID to COVID 1 compared with Black wives (b = 2.7, t = 2.0, p = .04). There were no differences in face-to-face or virtual network size recovery from COVID 1 to COVID 3 for husbands or wives. Consistent across these findings in all three network types is that White spouses experienced significantly smaller declines and greater recovery in network size than Latinx and Black spouses.
Income
As Table 2 reveals, income was a robust predictor of the recovery of the face-to-face network. Husbands and wives with greater income had significantly larger increases in face-to-face network size from COVID 1 to COVID 3 (husbands: b = 0.5, t = 2.2, p = .03; wives: b = 0.6, t = 2.6, p < .01). Consistent with the idea that individuals with higher incomes have greater access to technologies facilitating virtual interactions, higher income spouses had smaller decreases in their virtual network size from pre-COVID to COVID 1 (husbands: b = 1.4, t = 2.3, p = .02; wives: b = 1.3, t = 2.0, p = .04). With respect to the total interactive network (face-to-face or virtual), higher income generally predicted smaller declines in network size from pre-COVID to COVID 1 for both husbands and wives (husbands: b = 1.3, t = 2.9, p < .01; wives: b = 2.0, t = 5.5, p < .01).
Density
Table 2 reveals that there were no significant effects of density on total network size. Additional tables provided in the online supplement, however, show that density was a strong predictor within subnetworks. Generally, higher density networks were associated with larger decreases in family interactions and smaller decreases in friend interactions. For example, wives with 10% denser pre-COVID networks experienced larger declines in family network size from pre-COVID to COVID 1 by approximately 0.4 family members face-to-face (b = −3.6, t = −4.0, p < .01) and 0.3 family members virtually (b = −2.8, t = −2.5, p = .01), but smaller declines in friend network size from pre-COVID to COVID 1 by approximately 0.5 friends face-to-face (b = 4.7, t = 5.7, p < .01) and 0.2 friends virtually (b = 2.2, t = 2.7, p < .01). Husbands with denser networks, like wives, also had steeper decreases in family virtual network size from pre-COVID to COVID 1 (b = −5.2, t = −3.7, p < .01), but greater recovery from COVID 1 to COVID 3 (b = 1.7, t = 2.3, p = .02).
Discussion
During the initial spread of COVID-19, social distancing mandates and lockdowns aimed to limit face-to-face interactions within social networks. To evaluate the effects of these policies, the current analyses drew upon multiple waves of social network interviews conducted before and throughout the first 18 months of the pandemic within a population at disproportionate risk of suffering the effects of the virus—primarily non-White couples with school-age children recruited from lower-income communities (Khanijahani et al., 2021; Truong & Asare, 2021). Whereas spouses regularly interacted with almost all of their network members in-person prior to the pandemic, during the first months of the pandemic, when restrictions on socializing were at their peak, they interacted with less than 50% of those individuals.
Further analyses refined this picture in several ways. First, networks did not recover fully, even 18 months later when the most severe restrictions were lifted and the first vaccines had become available. Second, technology compensated for the loss of in-person interactions only partially: Virtual interactions also declined overall, and total interactive networks defined by face-to-face or virtual interactions still experienced lasting (if smaller) declines. Third, these declines were not confined to distal relationships: Coworkers, friends, and family subnetworks all contracted significantly. Thus, relationships that were regular parts of couples’ interactive social networks were put on hold at the immediate onset of the pandemic, and most of those relationships remained on hold 18 months later. The well-documented rise in loneliness therefore cannot be understood as a response to stress or anxiety (e.g., Werner et al., 2021) but rather corresponds with an actual decline in social network relationships during the pandemic (Knox et al., 2022).
What happened to those lost relationships? One explanation for shrinking social networks in the first years of the pandemic is that efforts to avoid spreading or contracting the virus inhibited the central behaviors through which relationships are sustained. Interdependence theory has long proposed that maintaining relationships, particularly close relationships, requires regular interactions over sustained periods of time (Kelley et al., 1983). When circumstances (e.g., long distance) inhibit or prevent those interactions, partners report expending greater effort (Belus et al., 2019), and experiencing more stress (Du Bois et al., 2016) and greater uncertainty (Sahlstein, 2006). It is not hard to imagine that some relationships, forced by lockdowns and social distancing guidelines to confront these same challenges during the pandemic, did not survive. In this way, the COVID-19 pandemic may have accelerated trends toward less and less social interaction that began years prior to the pandemic. Compared with the 20th century, people in the first decades of the 21st century were already maintaining smaller networks of close relationships than they once did (McPherson et al., 2006; Putnam, 2000), despite the boom in virtual technologies in part designed to replace or supplement in-person interactions. Our results suggest that when partners are only able to communicate virtually because of a restriction in face-to-face interactions, relationships may wither or cease, likely in part because people do not experience the same support via virtual interactions that they experience during in-person interactions (Geirdal et al., 2021; Holtzman et al., 2017; van der Velden et al., 2021).
A second possible source of disruption is the growing political divide in the United States (Abramowitz & McCoy, 2019). During this pandemic, attitudes toward vaccinations, masking, and social distancing have become topics of emotional disagreement in many areas (Bruine de Bruin et al., 2020; Gollust et al., 2020). Given limited opportunities to maintain any relationships during this time, people may have invested in network members with more similar beliefs (McPherson et al., 2001), and let network members who expressed disagreement fall away. Given that conservative-leaning areas in the United States were significantly less likely to practice social distancing than liberal-leaning areas (Gollwitzer et al., 2020), future work could address how the network change processes documented here vary by political orientation.
The social costs of COVID did not fall equally on everyone. Couples who worked outside the home experienced smaller initial declines in their face-to-face networks, presumably because the demands of work and social obligation left them less able to avoid social interactions than couples who worked remotely. Those with denser (i.e., more interconnected) prepandemic networks had a more difficult time maintaining a connection with family but wives with denser networks lost fewer friends. People have reported being particularly fearful of infecting family members with COVID-19 (Luttik et al., 2020; Sloan et al., 2021), so those with tight-knit networks in which the virus could easily spread may have been even more likely to stay away from family. Demographic variables also made a difference. Even within a sample exclusively recruited from lower-income communities, couples with higher incomes maintained more of their relationships throughout the pandemic than less affluent couples, especially when virtual interactions were taken into account. This suggests that sustaining relationships may have been supported by access to technologies facilitating virtual contact (e.g., high-speed wireless internet), which are less available to less affluent families (Catalano et al., 2021). Finally, racial/ethnic identification accounted partly for differences in the initial effects of the pandemic on network size and in rates of recovery, such that the networks of White spouses decreased less drastically and recovered more than networks of Black or Latinx spouses. The fact that less affluent and non-White groups, who were at greatest risk of contracting COVID in the early years of this pandemic (Khanijahani et al., 2021), also experienced the most sustained contraction of their social networks in this sample suggests that social distancing might have been an insufficient strategy for preventing the virus in these groups and highlights the need to examine unique mechanisms of transmission in different populations (Wong & Li, 2020). One possible explanation is that less affluent and non-White groups are also those most likely to experience overcrowded housing conditions, which may facilitate the spread of COVID even when interactions outside the home are constrained (Ghosh et al., 2021; Mejia et al., 2022).
Despite widespread interest in the social costs of COVID (Ernst et al., 2022), this is the first study to describe changes in social interactions using detailed interviews collected before and during the early years of the pandemic. Although longitudinal data lend confidence that the patterns reported here are free from retrospective biases, it should be noted that all interviews were collected from mixed-gender married couples recruited from lower-income neighborhoods in Los Angeles County. By virtue of their age and marital status, these couples were likely to have had stronger social networks at the outset of the pandemic than unmarried couples, individuals without partners, or older adults (Acock & Hurlbert, 1993; Wrzus et al., 2013). Were this research to be replicated in these other groups, observed declines in social network interactions may be even steeper. In addition, despite the advantages of more than 18 months of COVID-19 data, the pandemic continues. Thus, we cannot rule out the possibility that social network size has recovered or may still recover to its pre-pandemic levels over time.
As the COVID pandemic continues, and as health officials plan for future pandemics, these findings highlight a tension between the goal of preventing virus transmission and the need to preserve social relationships, especially in vulnerable or underserved populations under stress. One suggestion for managing this tension has been to impose even more severe restrictions on social life, in hopes that the faster a virus is contained, the sooner normal interactions can resume (Coccia, 2021). Yet our findings suggest that the costs of these restrictions manifest quickly, and then persist even after the most severe restrictions are lifted. Thus, these results support public health strategies that balance the requirements of preventing transmission with the requirements of maintaining connection, for example, facilitating access to virtual technologies for vulnerable populations, creating safer public transport systems, public spaces, and working conditions, and promoting the use of masking (Michie & West, 2021). Ultimately, recovery from this pandemic and prevention of the next one may require social solutions as much as medical ones.
Footnotes
Data Availability Statement
The data used in this study come from a broader longitudinal study that has generated previous published work, but this is the first time that any of the data collected during the COVID-19 pandemic have been analyzed. These analyses were not preregistered. Supplemental Materials, including data, codebook, syntax, tables, and question text can be found here: ![]()
Declaration of Conflicting Interests
The author(s) declared no potential conflicts of interest with respect to the research, authorship, and/or publication of this article.
Funding
The author(s) disclosed receipt of the following financial support for the research, authorship, and/or publication of this article: Preparation of this report was supported by Research Grant R01HD091832 from the National Institute of Child Health and Human Development awarded to Benjamin R. Karney.
Supplemental Material
Supplemental material is available online with this article.