
Abstract
Objectives
Chronic otitis media is a long-term infection of the middle ear. It is characterized by persistent discharge from the middle ear through a perforated tympanic membrane. It is one of the most common causes of preventable hearing loss, especially in developing countries. Precise estimation of the size of tympanic membrane perforation is essential for successful clinical management. In this study, we developed a smartphone-based application to calculate the ratio of the area of tympanic membrane perforation to the area of the tympanic membrane. Twelve standardized patients and 60 medical students were involved to assess the area of tympanic membrane perforation, in particular, the percentage of perforation size.
Methods
In total, 60 student doctors (including year 5 and year 6 medical students, intern and post-graduate year training of doctors) were recruited during their rotation at the Otolaryngology department of Taipei Medical University Shuang-Ho Hospital. Twelve standardized patients with chronic otitis media were recruited through a single otology practice. Oto-endoscopic examination was performed for all patients by using a commercially-available digital oto-endoscope, and clinical images of the tympanic membrane perforation were obtained. To demonstrate the variability of perforation size estimation by different student doctors, we calculated the percentage of perforation using the smartphone-based application for 12 tympanic membranes objectively and compared the results with those visually estimated by the 60 student doctors subjectively.
Results
The variance in the visual estimation by the 60 student doctors was large. By contrast, variances in smartphone-based application calculations were smaller, indicating consistency in the results obtained from different users. The smartphone-based application accurately estimated the presence of perforation for tympanic membranes with high consistency. The differences in visual estimations can be considerably great and the variances can be large among different individuals.
Conclusions
The smartphone-based application is a dependable tool for precisely evaluating the size of tympanic membrane perforation.
Keywords
Introduction
Chronic otitis media is a long-term infection of the middle ear. It is characterized by incessant discharge from the middle ear through a perforated tympanic membrane (TM). It is a frequent cause of preventable hearing loss, especially in developing countries. 1 The perforation size may vary widely, from a pinhole to a large defect. Clinically, the perforation size is an important prognostic factor in tympanoplasty.2,3 The success rate of tympanoplasty for small perforations is higher than that for large perforations. 4 Emir et al. 5 reported that tympanoplasty for a perforation at 50% or more of the entire TM is associated with poorer hearing results and reduced success rate. Therefore, the precise estimation of the tympanic membrane perforation size is crucial for further clinical management.
Preoperative tympanic membrane perforation size is a predictive factor for the success rate of tympanoplasty. In clinical practice, otolaryngologists assess the TM using an otoscope and determine the size of the tympanic membrane perforation through visual inspection. Typically, the TMF size is categorized as small (<25% of the total TM), medium (25%-50%), large (50%-75%), or total (>75%).6,7 However, visual inspection is greatly dependent on physicians’ experience, leading to considerable inter-individual variations. Some physicians estimate the perforation size by measuring its diameter. 2 However, this may not be an accurate method because not all tympanic membrane perforation are circular in shape.
In this study, we developed a smartphone-aided diagnosis application, flipMed, to calculate the ratio of the perforation area to the entire TM area. After constructing the application, our team accessed the applicability of the application by involving 12 standardized patients and 60 medical students to it. The participants were asked to assess the area of tympanic membrane perforation, in particular, the percentage of perforation size. To demonstrate the inter-individual variability of estimations, the percentage of perforation size in 12 tympanic membranes calculated using flipMed was compared with those estimated through visual inspection.
Methods
The Development of Personalized Smartphone-Aided Diagnosis Application
flipMed is a personalized smartphone-aided diagnosis application developed by National Yang Ming Chiao Tung University and Taipei Medical University-Shuang Ho Hospital, Ministry of Health and Welfare. Our team members designed this application named “flipMed” using Android App Inventor2. Android App Inventor2 assists application development based on JAVA visual programming language. Area ratio calculation formulas were applied in this app. Our study based on the Android system and its associated mobile device applications. It is designed to determine the ratio between the areas of 2 selected regions. Images with different dimensions are adjusted proportionally to fit in the device’s screen for assessment. In this study, images of the TM were uploaded to flipMed. The boundary of the entire TM was outlined by the student doctors (Figure 1A). The margin of tympanic membrane perforation was then identified and marked in a similar fashion (Figure 1B). The areas of these 2 designated regions were automatically calculated and presented on the screen. The ratio of these 2 areas was displayed on the lower-left corner of the main screen (Figure 1C). Images of tympanic membranes on the main screen of the personalized smartphone-aided diagnosis application flipMed (A). Boundary of the tympanic membrane and perforation margin outlined by student doctors, the area of tympanic membrane was outlined in yellow; while the area of perforation was outlined in green. (B and C). The ratio of these 2 areas is shown in the lower-left corner (2C).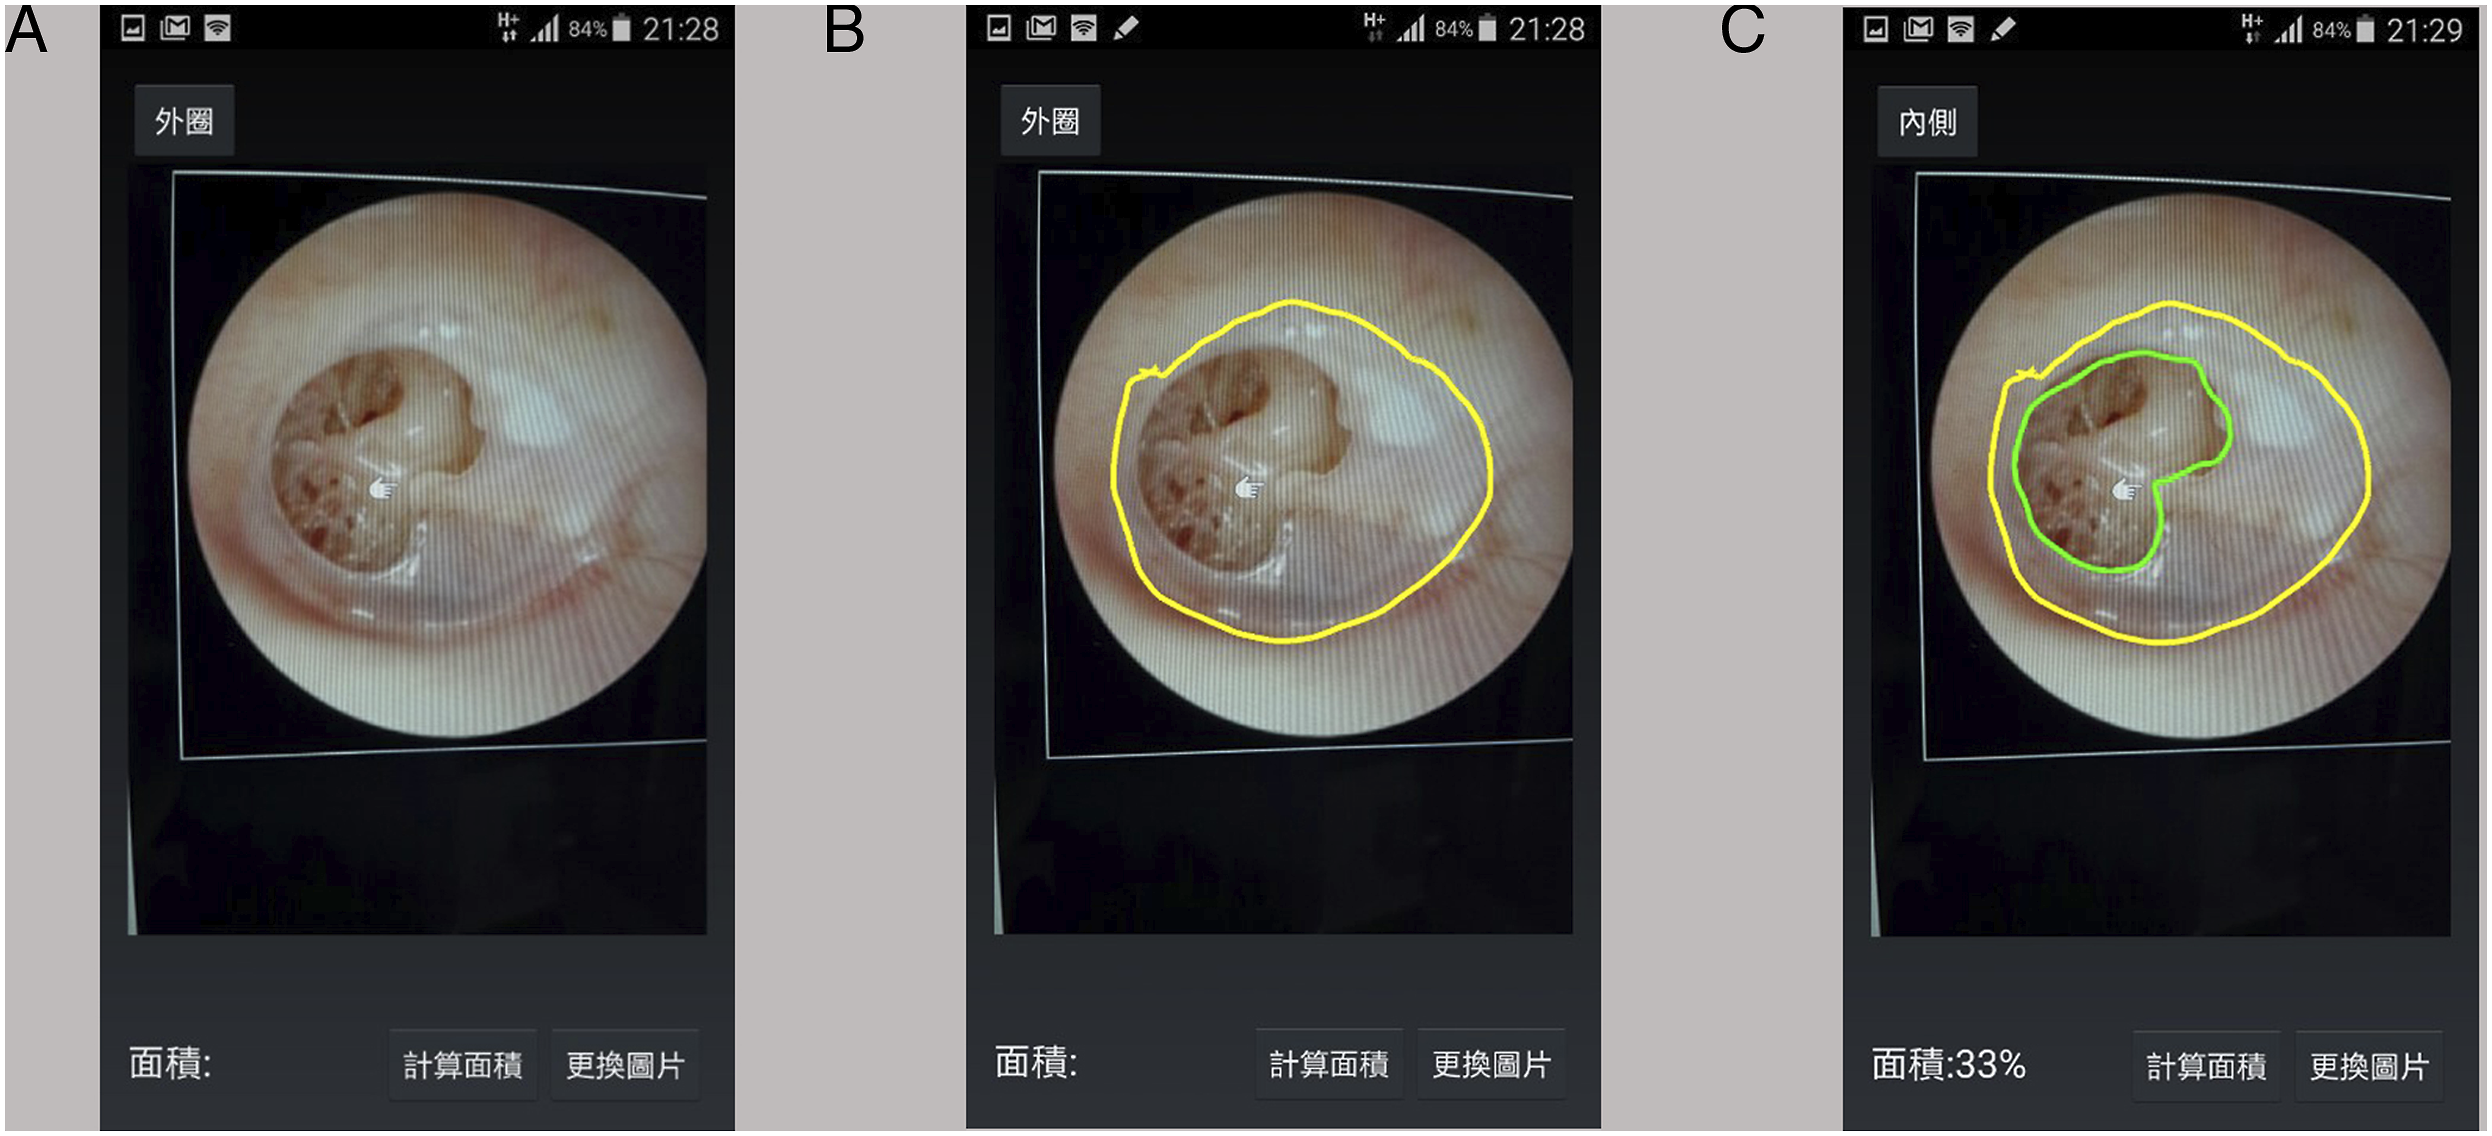
The Image of Tympanic Membrane Perforation
Oto-endoscopic examination was performed for all patients by using a commercially-available digital oto-endoscope, and clinical images of the tympanic membrane perforation were obtained. The commercially available digital oto-endoscope generates images with good dynamic color image resolution (4032 × 3024 megapixels). We applied mobile devices using the Android system. The size of the mobile devices screen is measuring 6.1 inches. The boundary was marked with Stylus. It was easy to determine the edges of the tympanic membrane perforation and of the entire tympanic membrane, and thus to obtain an automatic calculation of the area of the perforation and of the entire tympanic membrane, irrespective of the perforation’s size and shape.
Otoendoscopic examinations were performed for all patients and clinical images of the tympanic membranes were obtained (Figures 2A-D). Patient 1–3 had small-sized tympanic membrane perforation (Figure 2B). Patient 4–6 showed medium-sized tympanic membrane perforations (Figure 2B). Patient 7–9 had large-sized tympanic membrane perforation (Figure 2C). Patient 10–12 showed total tympanic membrane perforations (Figure 2D). Clinical images of tympanic membrane perforations obtained from 8 patients with chronic otitis media. Panel A represented small-sized tympanic membrane perforation. Panel B represented medium-sized tympanic membrane perforation. Panel C represented large-sized tympanic membrane perforation. Panel d represented small-sized tympanic membrane perforation.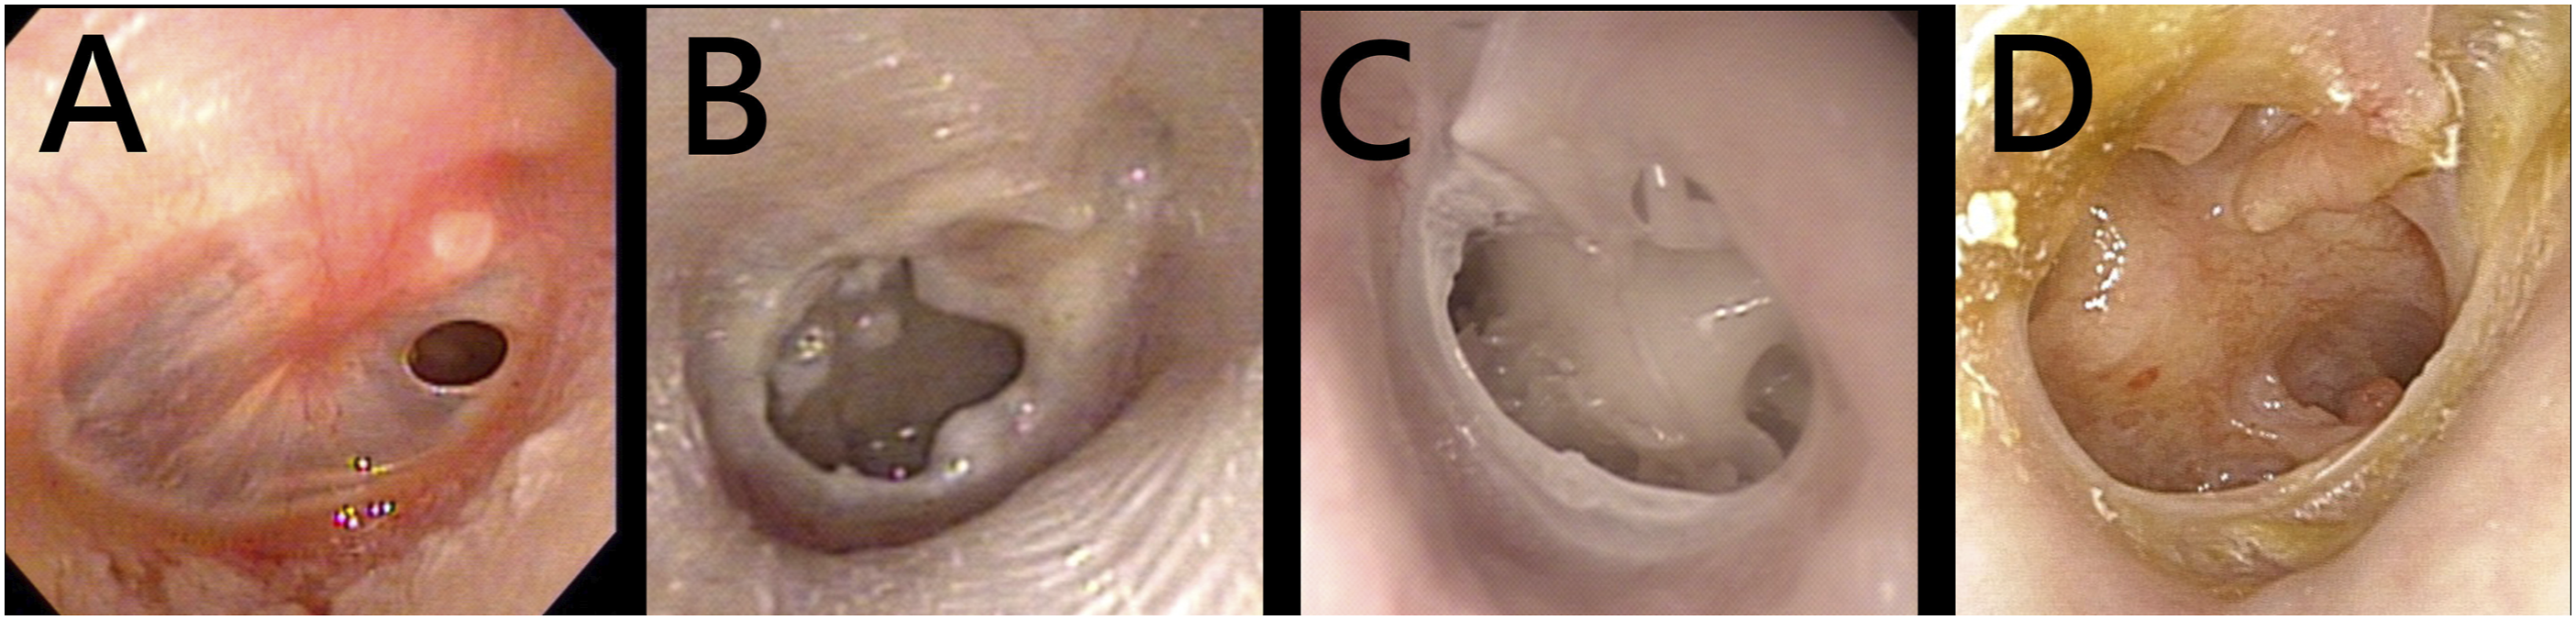
Participant Selection
In total, 60 student doctors were recruited during their rotation at the Department of Otolaryngology at Taipei Medical University-Shuang Ho Hospital and Kaohsiung Veterans General Hospital. Twelve patients with identified hearing loss and tympanic membrane perforation were enrolled from a single otology practice. Ethical approval was obtained from the Institutional Review Board of Kaohsiung Veterans General Hospital and Taipei Medical University prior to the commencement of the study. Informed consent was obtained from all students. All methods were conducted in accordance with relevant guidelines and regulations.
Task and Statistical Analysis
The clinical images were presented to the student doctors for visual assessment. They were asked to estimate the percentage of the perforation relative to the tympanic membrane through direct visual inspection. The images were then uploaded to the smartphone-based application, which showed the area of tympanic membrane perforation. Next, the student doctors were asked to calculate the percentage of tympanic membrane perforation as shown in each clinical picture. Specifically, the student doctors first subjectively appraised the percentage of tympanic perforation by visual examination. They then objectively calculated the percentage of tympanic perforation with data generated by the smartphone-based application.
Descriptive statistics were applied to determine tympanic membrane perforation of different sizes using SPSS version 21 for Windows (SPSS, Chicago, IL, USA). The mean and standard deviations were calculated.
Results
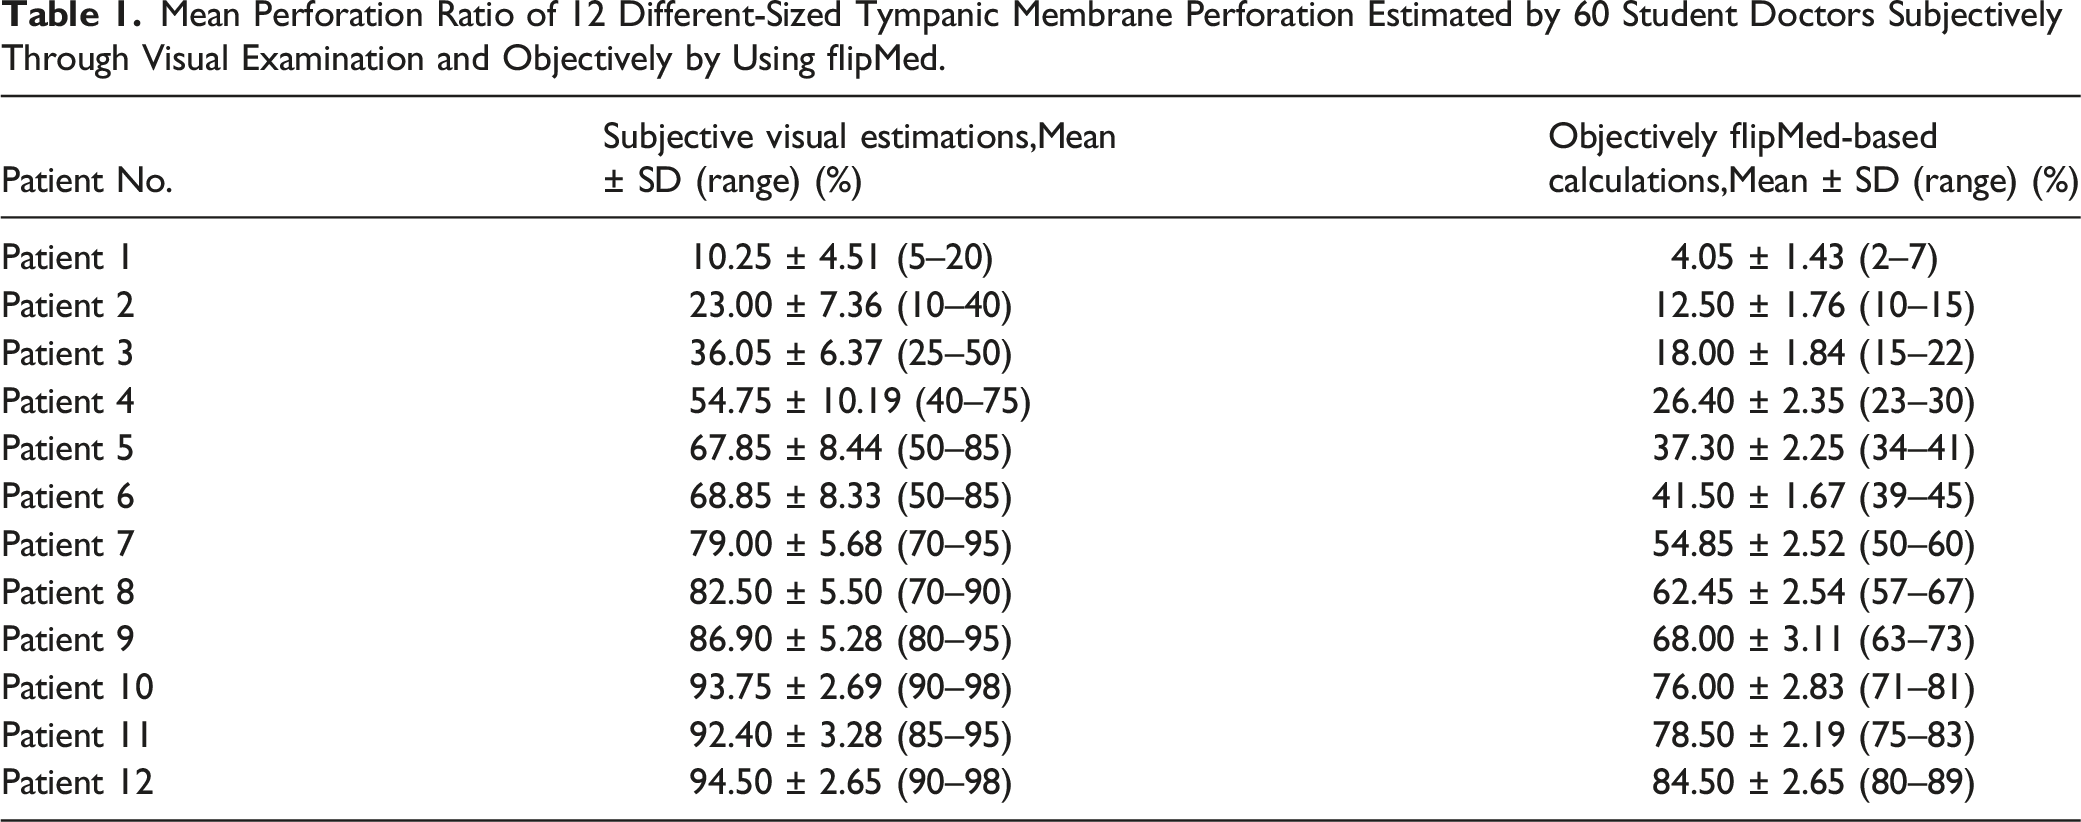
Mean Perforation Ratio of 12 Different-Sized Tympanic Membrane Perforation Estimated by 60 Student Doctors Subjectively Through Visual Examination and Objectively by Using flipMed.
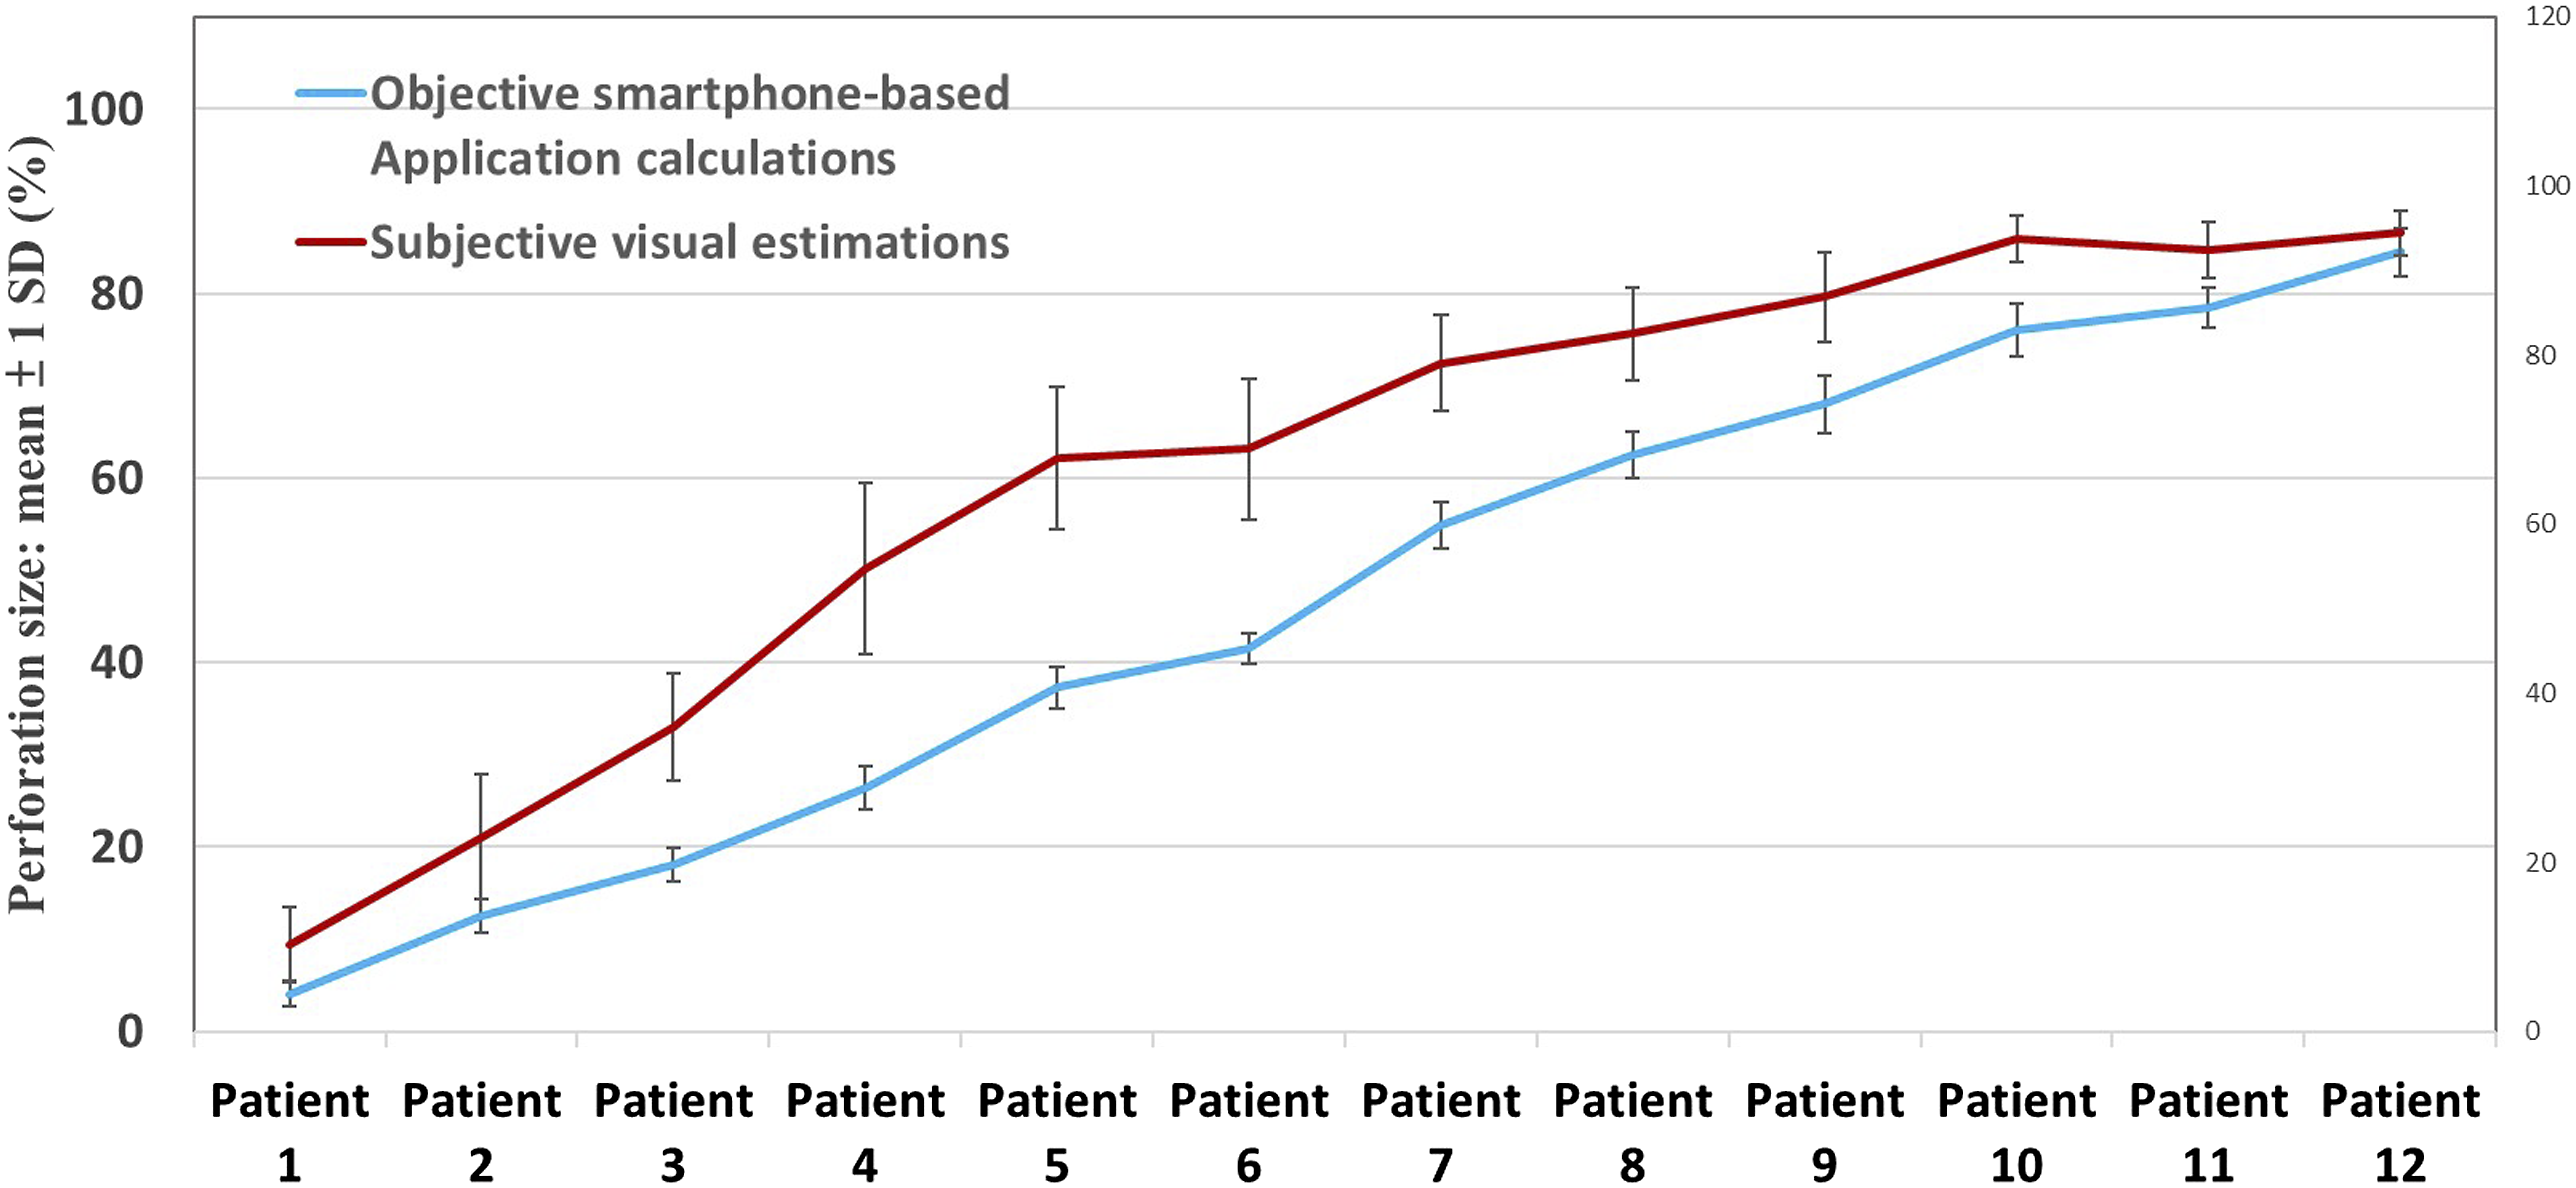
Estimated percentages of 12 perforations by 60 student doctors in 2 groups.
The variances of visual estimations were considerably high. This finding suggests inconsistency in the results obtained through visual examination. The variances in personalized smartphone-aided diagnosis application calculations were relatively small. This finding indicates that the results calculated using the smartphone application were consistent.
For the 12 clinical images, the mean percentage of tympanic membrane perforation estimated subjectively (visually) was significantly different from that calculated objectively using the smartphone-based application. Surprisingly, the doctors tended to overestimate the size of medium and large perforations. The estimations were more inaccurate for medium and large perforations. By contrast, the estimations were more accurate, with very little variance, for small and total perforations.
Discussion
Chronic otitis media is one of the most common causes of preventable hearing loss. The size of a tympanic membrane perforation may vary from a pinhole to a large defect. Larger perforations tend to cause more severe hearing impairment because the TM has a decreased physiologically vibrating area and decreased proportional difference between the TM and the base of the malleus.2,3 The perforation size is also an essential prognostic factor for the success of tympanoplasty.2,3 Several studies have suggested that the perforation size influences the success rate of tympanoplasty. The success rate for small perforations is higher than that for large perforations. 4 Tan et al. 7 also found that patients who had perforation with a size less than 50% of total area have better closure results. In conclusion, hearing loss due to tympanic membrane perforation was associated with the perforation size and tympanoplasty success rate. These data imply the importance of determining the size of tympanic membrane perforation.
Our study has disclosed several main findings. Tympanic membrane perforations are categorized into 4 groups based on size: small, medium, large, and total perforations. All these sizes were noted in our patients. The percentage of tympanic membrane perforation estimated through visual inspection was inconsistent, as indicated by the considerably large variances recorded by the student doctors. The student doctors tended to overestimate the sizes of medium and large perforations, and their estimations were more inaccurate for these perforations. By contrast, the estimations were more accurate, with considerably smaller variances, for small and total perforations. The percentages of tympanic membrane perforations calculated using flipMed were consistent. Results obtained from the student doctors using flipMed were consistent, with very small variances. The accuracy of calculating the percentage of the tympanic membrane perforation was better with flipMed than with visual inspection.
The innovative design and development of the application is unique to this study. Size estimation of tympanic membrane perforation, albeit its classification by size, with data generated by this personalized smartphone-aided diagnosis application showed high consistency among different users. In contrast, visual assessment of size of tympanic membrane perforation is more likely to give diverse results, especially for moderate and large tympanic membrane perforation. Advances in mobile health technology have enabled the application of smartphones in clinical practice and mobile health support.8-15 The ratio of the size of the perforation to the entire TM area in the images was calculated using flipMed. We used the percentile ratio value as applied by Park et al. 16 because it is a semiquantitative and straightforward method. 17 We measured the percentile ratio of the area of the tympanic membrane perforation obtained from otoendoscopy records to the total area of the membrane by using flipMed.
Literature reviews disclose certain associations between our strengths and weaknesses in relation to other studies. Hsu et al. 18 revealed interesting findings related to tympanic membrane perforation size evaluation between experienced otologists and residents. To many’s surprise, the experienced otologists tended to overestimate the perforation size. Their estimations are more inaccurate than residents’ estimations. Hsu et al. 18 analyzed their results with the means of a computer program and the variances were quite small, indicating that the results obtained from different users are quite consistent. Such results were similar to our findings, proving that doctors tended to overestimate the sizes of medium and large perforations, and their estimations were more inaccurate for these perforations. Subjective estimations are known to be larger than objective estimation, also in the ophthalmic literature for estimations of optic disk cup size. 19
The Image J geometrical analysis software package was applied in the literature to calculate the true tympanic membrane perforation area ratio. 20 ANOVA test was used to compare Subjective Visual Estimations, Objectively flipMed-Based Calculations and true tympanic membrane perforation area ratio. There is no statistical significance in these groups. On the other hand, the size estimations were more accurate, with considerably smaller variances, for small perforations. Given that mobile health is an uprising new trend nowadays, our study which applied an innovative application developed by our team is superior to other previous studies which relied on computer programming.
There are limitations of the current study. The student doctors recruited in the study consisted of year 5 and year 6 medical students, interns and post-graduate year training of doctors. In particular, 34 of them were year 5 medical students, 18 of them were year 6 medical students, 2 of them were intern doctors, 4 of them were postgraduate year 1 doctors, and 2 of them were postgraduate year 2 doctors. Their clinical experience can hardly be standardized, and this may affect their visual assessment of tympanic membrane perforation. Also, as the sample size of different grade of doctors was not evenly distributed, it is hard to analyze statistically.
There are unanswered questions in our study. For example, the involvement of doctors-in-training and the uneven distribution of seniority of medical practitioners may affect the accuracy of visual estimation of tympanic membrane perforation. This indicates the direction of further investigations. Future studies are needed to further test the mHealth application’s usability for symptom management among people with moderate hearing impairment.
Conclusion
Perforations in the TM can be precisely estimated as the ratio of the size of a perforation to the entire TM area. flipMed is a reliable tool for evaluating this ratio because visual estimations can result in larger interindividual variances in measurements. The personalized smartphone-aided diagnosis application was a user-friendly personalized mHealth application which aids precise evaluation. We will refine the mobile health application based on users’ experience and the collected data.
Footnotes
Acknowledgments
We thank all the doctors and patients for participating in the study.
Author Contributions
Conceptualization, L.-Y.L., S.-Y.W., T.-F.W. and C.-J.W.; methodology, L.-Y.L.; validation, L.-Y.L., C.-J.W.; formal analysis, L.-Y.L., J.-M.Y., C.-J.C.; investigation, C.-Y.T.; resources, L.-Y.L.; data curation, L.-Y.L.; writing—original draft preparation, L.Y.-Y.W.; writing—review and editing, L.-Y.L., J.-M.Y., C.-J.C.; visualization, L.-Y.L.; supervision, C.-J.W.; project administration, L.-Y.L. All authors have read and agreed to the published version of the manuscript.
Declaration of Conflicting Interests
The author(s) declared no potential conflicts of interest with respect to the research, authorship, and/or publication of this article.
Funding
The author(s) received no financial support for the research, authorship, and/or publication of this article.
Ethical Approval
The study was conducted according to the guidelines of the Declaration of Helsinki, and approved by the Institutional Review Board of Kaohsiung Veterans General Hospital and Taipei Medical University.
Informed Consent
Written informed consent was obtained from the subjects for their anonymized information to be published in this article.
Statement of Human and Animal Rights
All procedures in this study were conducted in accordance with the Institutional Review Board of Kaohsiung Veterans General Hospital and Taipei Medical University approved protocols.
Patent
This application is an open-source, which is currently available to ENT doctors in Taiwan. We have spared no effort in modifying this application and we look forward to having users from all around the world.