
Abstract
Introduction:
Previous studies have reported a diverse range of threshold values for blood eosinophilia. In addition, a single predictive biomarker for eosinophilic chronic rhinosinusitis (CRS) with nasal polyps (ECRSwNP) has not yet been identified.
Objectives:
The aim of this study is to compare the clinical characteristics of ECRSwNP and non-ECRSwNP to evaluate the preoperative risk of tissue eosinophilia of chronic rhinosinusitis with nasal polyps (CRSwNP) through a multiparametric statistical analysis.
Methods:
One hundred ten patients with evidence of chronic polypoid rhinosinusitis were included in this study and clinical records were retrospectively reviewed. Eosinophilic CRSwNP was diagnosed based on the presence of at least 10 eosinophils per high-power field. The demographic and clinical features of ECRSwNP and non-ECRSwNP are described. The values of blood eosinophilia as predictors of tissue eosinophilia have been identified using receiver operating characteristic curves. As the predictive value of the identified cutoff through regression analysis was low, we evaluated whether other risk factors could be statistically associated with ECRSwNP, and from this, a new predictive model was proposed for the identification of eosinophilic nasal polyps before surgery.
Results:
We found that the best method for predicting ECRSwNP is based on a model having asthma, blood eosinophil percentage, posterior ethmoid value in Lund-Mackay score, and modified Lund-Kennedy score as explanatory variables.
Conclusions:
This study provides new data for a better understanding of the polypoid CRS endotypes, and the proposed model allows the endotype to be identified preoperatively.
Introduction
Chronic rhinosinusitis (CRS) is a heterogeneous disease with a multifactorial pathogenesis, in which anatomy, microbiome, and the immune system are all considered to play a major role.1-4 Based on clinical features, CRS can be subdivided into 2 phenotypes: CRS with nasal polyps (CRSwNP) and CRS without nasal polyps.5-7 Furthermore, comorbidities of asthma and aspirin sensitivity tend to make the patient’s condition more severe and difficult to treat, compared to CRSwNP alone.8,9
A classification into endotypes was necessary in the light of the pathophysiological mechanisms that determine and influence the clinical manifestations of the disease.10,11 Chronic rhinosinusitis with nasal polyps with predominant eosinophil infiltration within the sinus tissue (ECRSwNP) versus non-ECRSwNP endotype is generally associated with asthma 12 and poorer overall prognosis13,14 and is clinically characterized by high serum eosinophilia and total immunoglobulin E, atopy, 15 greater extent of the disease, more severe endoscopic 16 and computed tomography (CT) scores, 17 greater symptom severity,18,19 and greater olfactory dysfunction.20,21 This is useful for both therapeutic management and preoperative briefing about the likelihood of recurrence to help patients make informed, preference-based decisions.22,23
A surrogate biomarker of tissue eosinophilia is blood eosinophilia. Because previous studies have reported a diverse range of threshold values for blood eosinophilia (Table 1)13,15,24-27 and a single predictive biomarker for ECRSwNP has not yet been identified, in this study, we propose a new predictive model based on the association between biomarkers and clinical features to enhance the reliability of prediction.
Summary of the Studies That Evaluated the Relationship Between Eosinophilia and Nasal Polyposis.a
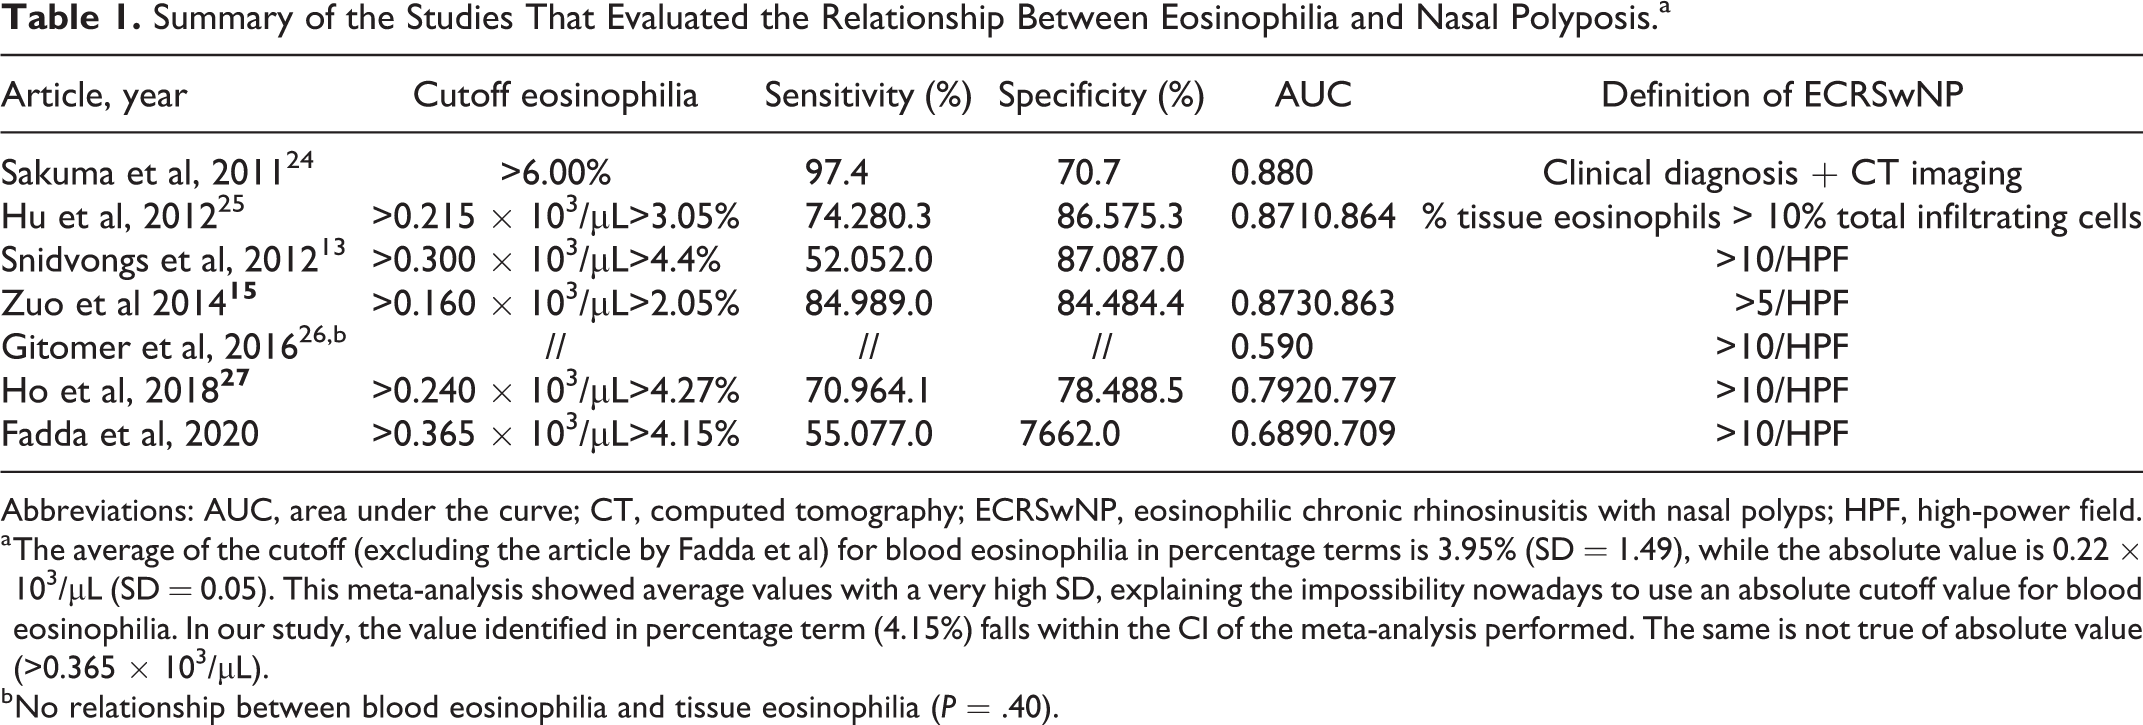
Abbreviations: AUC, area under the curve; CT, computed tomography; ECRSwNP, eosinophilic chronic rhinosinusitis with nasal polyps; HPF, high-power field.
a The average of the cutoff (excluding the article by Fadda et al) for blood eosinophilia in percentage terms is 3.95% (SD = 1.49), while the absolute value is 0.22 × 10³/µL (SD = 0.05). This meta-analysis showed average values with a very high SD, explaining the impossibility nowadays to use an absolute cutoff value for blood eosinophilia. In our study, the value identified in percentage term (4.15%) falls within the CI of the meta-analysis performed. The same is not true of absolute value (>0.365 × 10³/µL).
b No relationship between blood eosinophilia and tissue eosinophilia (P = .40).
Materials and Methods
Aims
The first aim of this study is to describe the clinical features and objective parameters of CRS. The second aim is to evaluate whether higher blood eosinophilia could be statistically associated with the ECRSwNP endotype.
The third aim is to evaluate whether other risk factors (such as prior sinus surgery, smoking, gastroesophageal reflux disease [GERD], blood pressure, diabetes, asthma, allergic rhinitis, Sino-Nasal Outcome Test-22 [SNOT-22], Lund-Mackay [LM] scores, and modified Lund-Kennedy [MLK] scores) were statistically associated with the ECRSwNP endotype. Furthermore, another benefit of risk factor analysis is that a new predictive model arises for the identification of eosinophilic nasal polyps before surgery.
Patient Population
The clinical records of 280 patients who underwent endoscopic sinus surgery (ESS) for chronic polypoid rhinosinusitis refractory to medical therapy were reviewed retrospectively. In these patients, ESS had been performed by the same surgeon at the ear, nose, and throat department of San Luigi Gonzaga Hospital in Turin, Italy, between March 2014 and March 2019. Exclusion criteria were as follows: patients younger than 18 years, acute infection, odontogenic CRS, antrochoanal polyps, cystic fibrosis, fungal sinusitis, systemic granulomatous disease, ciliary dyskinesia, and sinonasal tumor. As a result, 110 patients with evidence of chronic polypoid rhinosinusitis were included in this study.
Classification of CRSwNP
Patients undergoing ESS were categorized into 2 groups: ECRSwNP and non-ECRSwNP, based on histological examination. 1
Study Tools
The clinical records of 110 selected patients were carefully reviewed on the basis of demographic data, including age and sex, previous sinus surgery, smoking, GERD, allergic rhinitis, history of asthma and aspirin sensitivity, diabetes mellitus, arterial hypertension, and preoperative medical therapy; SNOT-22 questionnaire before ESS, with all questions being answered based on a 0 to 5 scale (0: lowest intensity; 5: highest intensity) 28 ; blood eosinophil percentage (EOS%) and count were measured before preoperative corticosteroid therapy, at least 3 months after withdrawing oral steroids; preoperative MLK endoscopic scoring system, based on polyp extent (0: none; 1: limited to the middle meatus; 2: beyond the middle meatus), edema (0: absent; 1: mild; 2: severe), and discharge (0: none; 1: clear; 2: thick and purulent) 29 ; and preoperative CT images of the sinuses were graded according to the LM scoring system. Each sinus was graded 0 to 2 (0: no abnormalities; 1: partial opacification; 2: total opacification). The ostiomeatal complex was also graded 0 (not obstructed) or 2 (obstructed). A total score of 0 to 24 was assigned, and each side could be considered separately (0-12) 30 ; sinus mucosal specimens were obtained intraoperatively and assessed by pathologists. Eosinophilic chronic rhinosinusitis with nasal polyps was diagnosed when histopathological assessment showed >10 eosinophils per high-power field (HPF). Histological examination is currently considered the diagnostic gold standard. 14
Statistical Analysis
Receiver operating characteristic curve
Receiver operating characteristic (ROC) curves based on the most significant clinical variables were compared with those obtained with the fitted values as output from the model.
Optimal cutoff point
The optimal cutoff points (optimal for both sensitivity and specificity) were defined as those for which the lowest values were yielded by the equation (1 − sensitivity) 2 − (1 − specificity) 2 . 31
Logistic regression
The probability of having eosinophilic nasal polyps (success) as a function of the main findings was evaluated by univariate logistic regression. Parameter estimates and 95% CI were calculated for each variable. Variables that were significantly correlated (P ≤ .05) with the logit of the probability of ECRSwNP were used in the subsequent multivariate logistic analysis.
Stepwise regression analysis
In order to select only the most significant predictive model (as the best linear combination of the significant variables), the stepwise logistic regression method was implemented. The automatic stepwise procedure was based on bidirectional elimination, according to the Akaike information criterion (AIC). The fitted values were used in subsequent analyses as possible predictors of ECRSwNP.
Statistical tool
Statistical analyses were conducted using RStudio version 1.1.456 with R engine version 3.5.1.
Results
As mentioned in the Methods section, the first aim of the study was to describe the clinical features and objective parameters of CRS. The clinical profile of the 110 patients included in this study is presented in Table 2. Based on our histological criteria, among the 110 patients with CRSwNP, 65 (60%) were classified as ECRSwNP while 45 (40%) were non-ECRSwNP.
Patient Demographics and Clinical Characteristics.
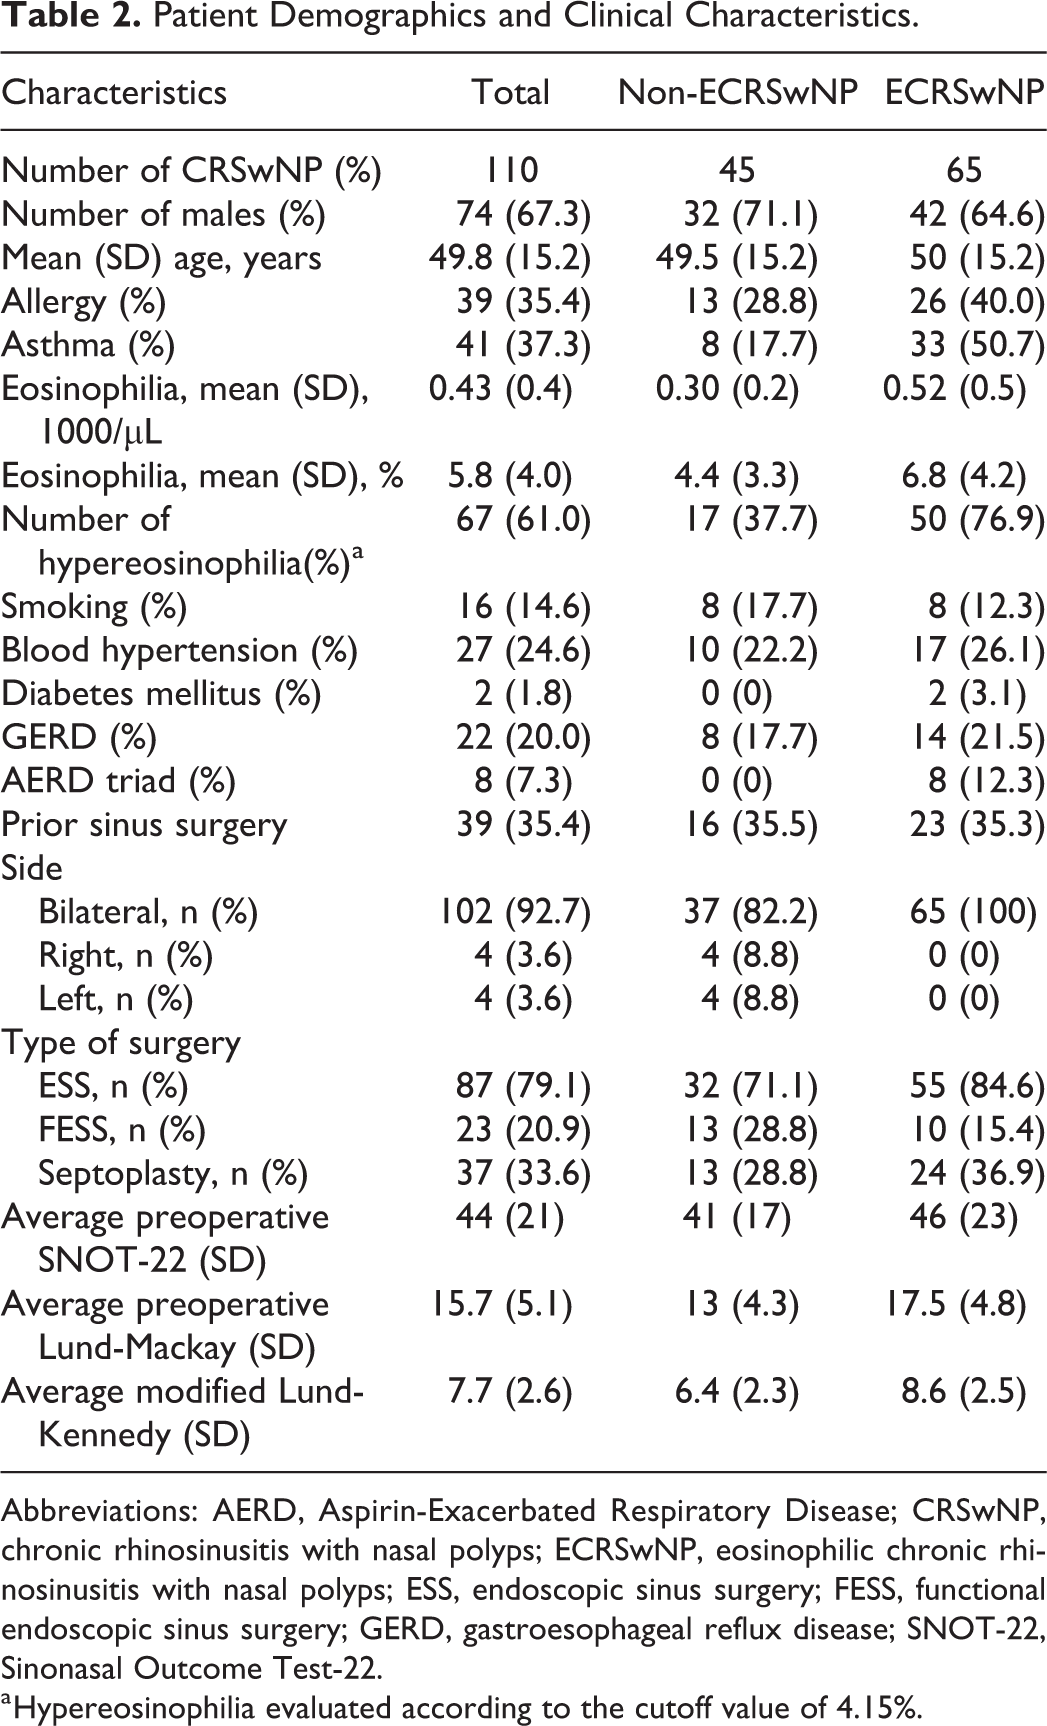
Abbreviations: AERD, Aspirin-Exacerbated Respiratory Disease; CRSwNP, chronic rhinosinusitis with nasal polyps; ECRSwNP, eosinophilic chronic rhinosinusitis with nasal polyps; ESS, endoscopic sinus surgery; FESS, functional endoscopic sinus surgery; GERD, gastroesophageal reflux disease; SNOT-22, Sinonasal Outcome Test-22.
a Hypereosinophilia evaluated according to the cutoff value of 4.15%.
The second aim was to evaluate whether higher blood eosinophilia could be statistically associated with the ECRSwNP endotype. We analyzed the predictive ability of the absolute eosinophil blood count and percentage in the diagnosis of ECRSwNP. The ROC curves for both percentage and absolute count of blood eosinophils as predictors of ECRSwNP are shown in Figure 1. Looking at the data, we preferred using the percentage value rather than the absolute blood eosinophil count because the former had an area under the curve (AUC) of 0.709, while the latter had a value of 0.689. Next, we determined the best threshold value of EOS% and absolute count, which granted optimal sensitivity and specificity to discriminate ECRSwNP and non-ECRSwNP. Several cutoff points were selected. The lower the (1 − sensitivity) 2 + (1 − specificity) 2 value, the better the accuracy of the predictor. The optimal value for EOS% was >4.15%, which presented a sensitivity of 77% and a specificity of 62%, whereas for the absolute count, it was >0.365 × 10³/µL, which presented a sensitivity of 55% and a specificity of 76% (Table 1).13,15,24-27 Both optimal values are indicated in blue in Figure 1. Since the ROC curves in our study have a lower AUC than other studies (Table 1),13,15,24-27 we wondered if it would be possible to construct a predictor model of tissue eosinophilia that takes into account the remaining risk factors.
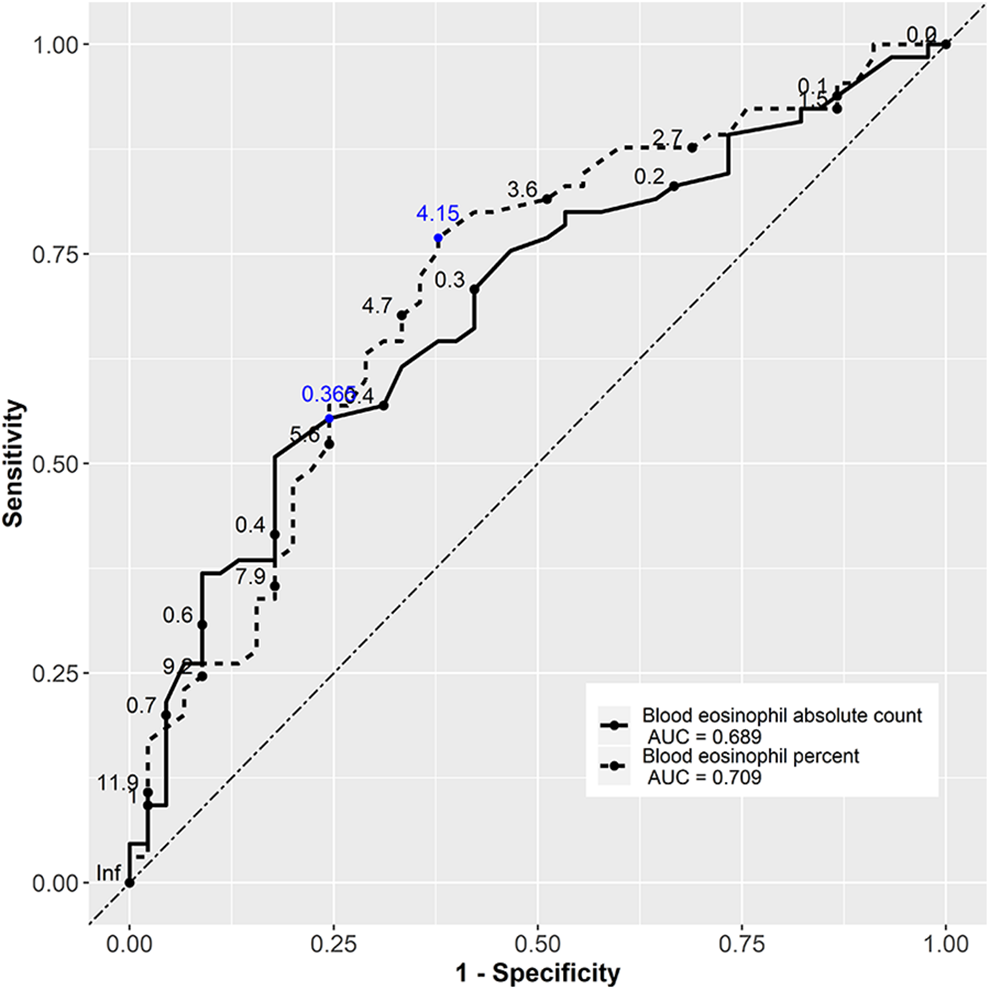
Receiver operating characteristic curves of blood eosinophilia. The predictive ability was calculated based on the area under the curve (AUC). An AUC with a value close to 1 indicates an excellent ability to discriminate. Receiver operator characteristic curves demonstrate a poor utility of blood eosinophil absolute count and percentage for predicting eosinophilic chronic rhinosinusitis with nasal polyps in the population under analysis. The blue numbers are those that minimize the equation (1 − sensitivity)2 + (1 − specificity)2.
The third aim was to evaluate whether other risk factors were statistically associated with the ECRSwNP endotype. To determine those risk factors, logistic regression analyses were conducted. First, the following variables were introduced into the univariate model: age, sex (male), prior sinus surgery, asthma, allergy rhinitis, GERD, smoking, diabetes, blood pressure, SNOT-22, blood eosinophil count (absolute number and percentage), and total and detailed LM scores, and MLK score. The factors significantly (P ≤ .05) associated with the probability of having ECRSwNP are summarized in Table 3. On the basis of the univariate analysis results, all significant factors were further introduced into a multivariate logistic model.
Logistic Regression Analysis of Findings Associated With ECRwNP.a
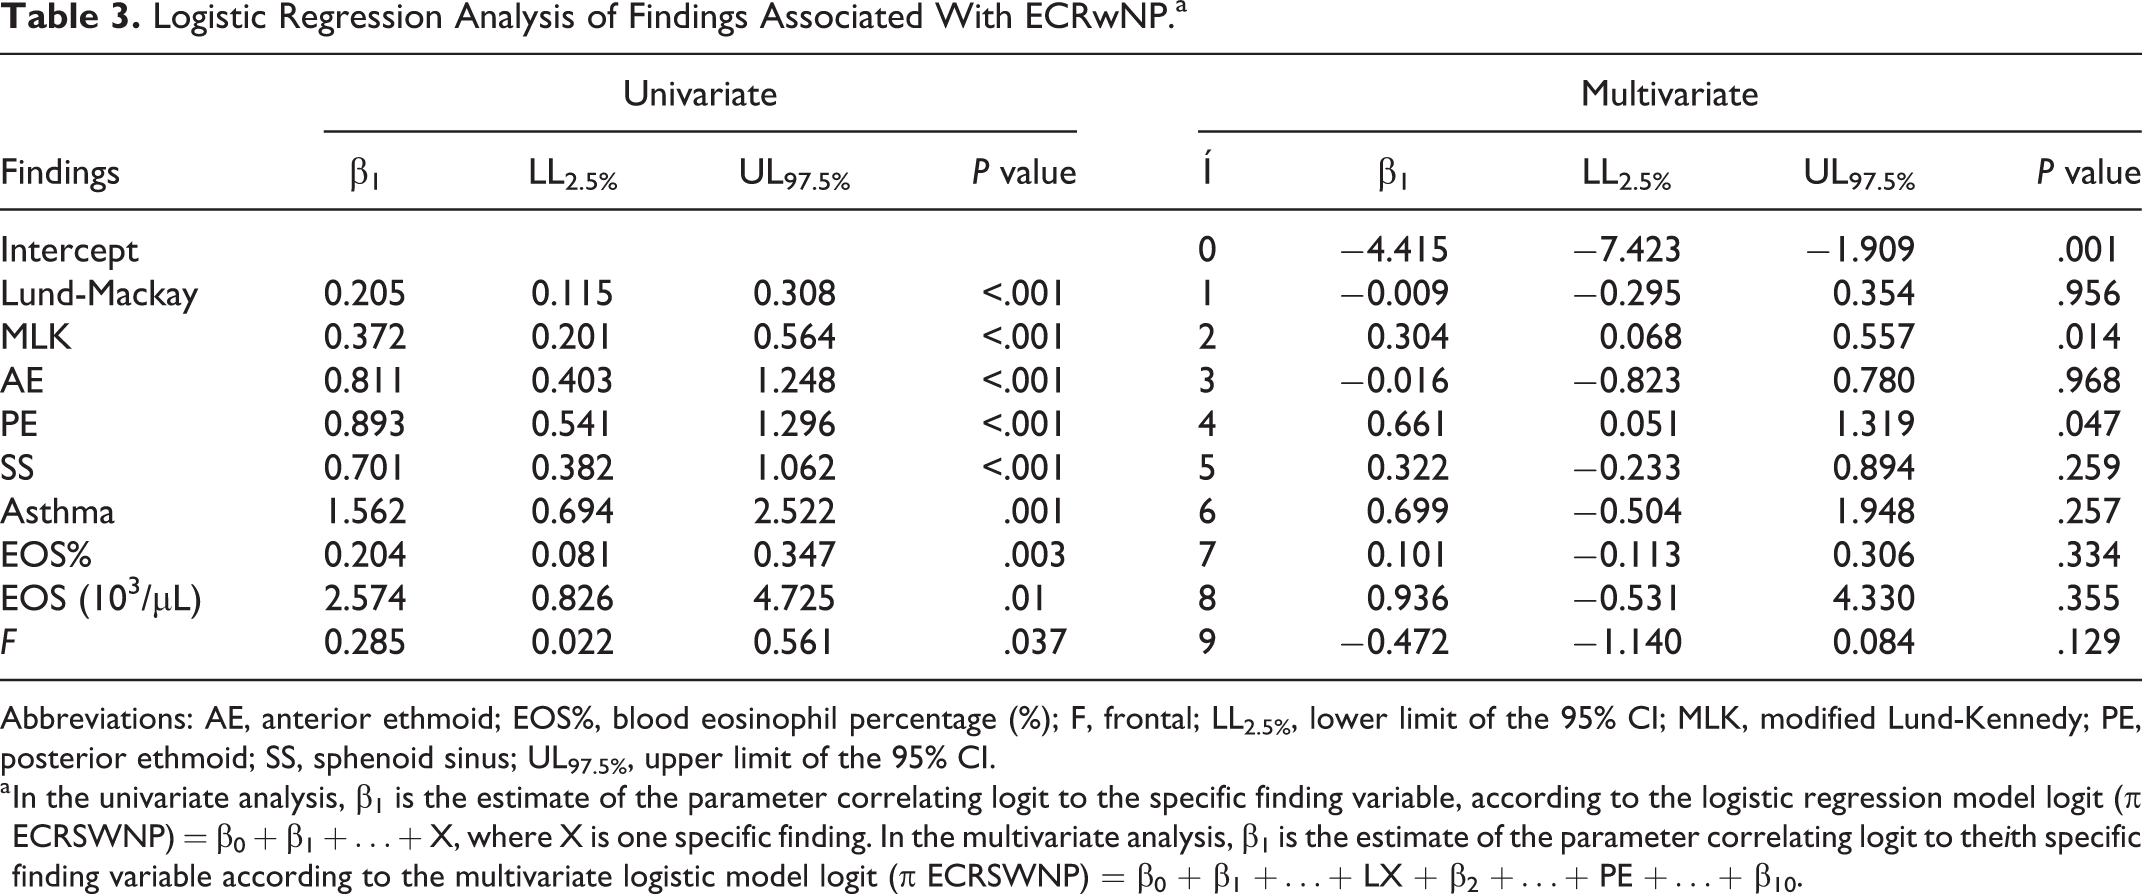
Abbreviations: AE, anterior ethmoid; EOS%, blood eosinophil percentage (%); F, frontal; LL2.5%, lower limit of the 95% CI; MLK, modified Lund-Kennedy; PE, posterior ethmoid; SS, sphenoid sinus; UL97.5%, upper limit of the 95% CI.
a In the univariate analysis, β1 is the estimate of the parameter correlating logit to the specific finding variable, according to the logistic regression model logit (π ECRSWNP) = β0 + β1 +…+ X, where X is one specific finding. In the multivariate analysis, β1 is the estimate of the parameter correlating logit to theith specific finding variable according to the multivariate logistic model logit (π ECRSWNP) = β0 + β1 +…+ LX + β2 +…+ PE +…+ β10.
From this, the only 2 factors to show a statistically significant difference between groups were the MLK score (P = .014) and posterior ethmoid (PE) sinus in the LM score (P = .047; Table 3).
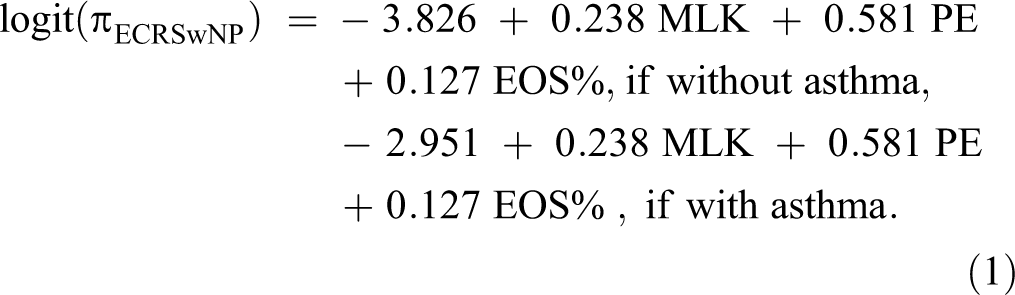
In addition, the stepwise logistic regression method was implemented to choose the multivariate model with the minimum number of the most significant predictive variables. Through this automatic procedure for statistical model selection, based on minimizing the AIC, we looked for the best predictive model for ECRSwNP. In fact, ROC curves based on the most significant variables showed the highest AUC (+17% compared with the AUC based on the single EOS%). These results are summarized in Table 4 and depicted in Figure 2. Therefore, we found that the best (for both sensitivity and specificity) method for predicting ECRSwNP is based on the model having asthma, EOS%, and PE sinus in the LM score and MLK score as explanatory variables. The preferred model is the following:
Predictive Models for ECRSwNP That Allow the Specificity and Sensitivity to be Increased Compared to the Best Case Based on a Single Predictor.
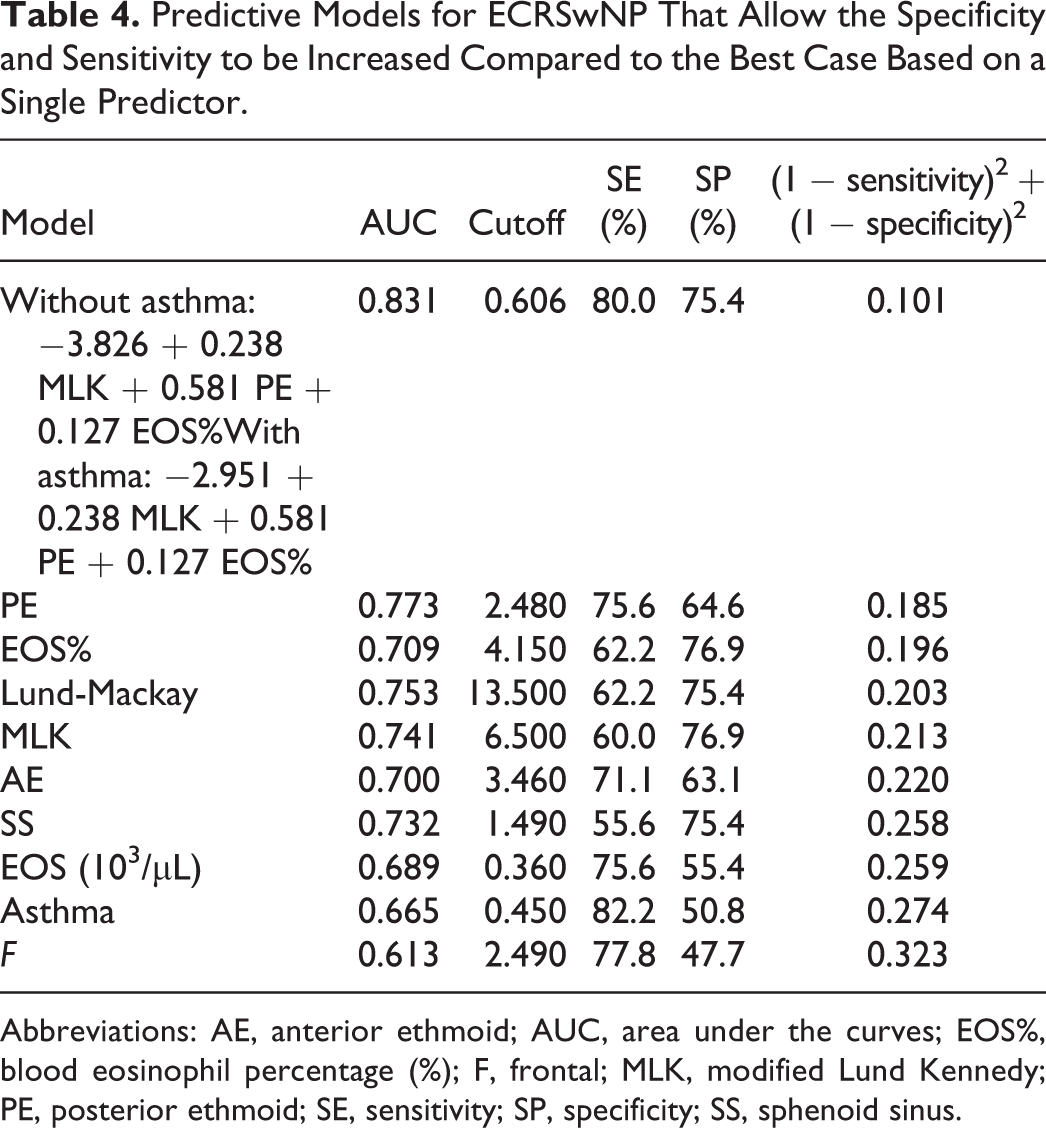
Abbreviations: AE, anterior ethmoid; AUC, area under the curves; EOS%, blood eosinophil percentage (%); F, frontal; MLK, modified Lund Kennedy; PE, posterior ethmoid; SE, sensitivity; SP, specificity; SS, sphenoid sinus.
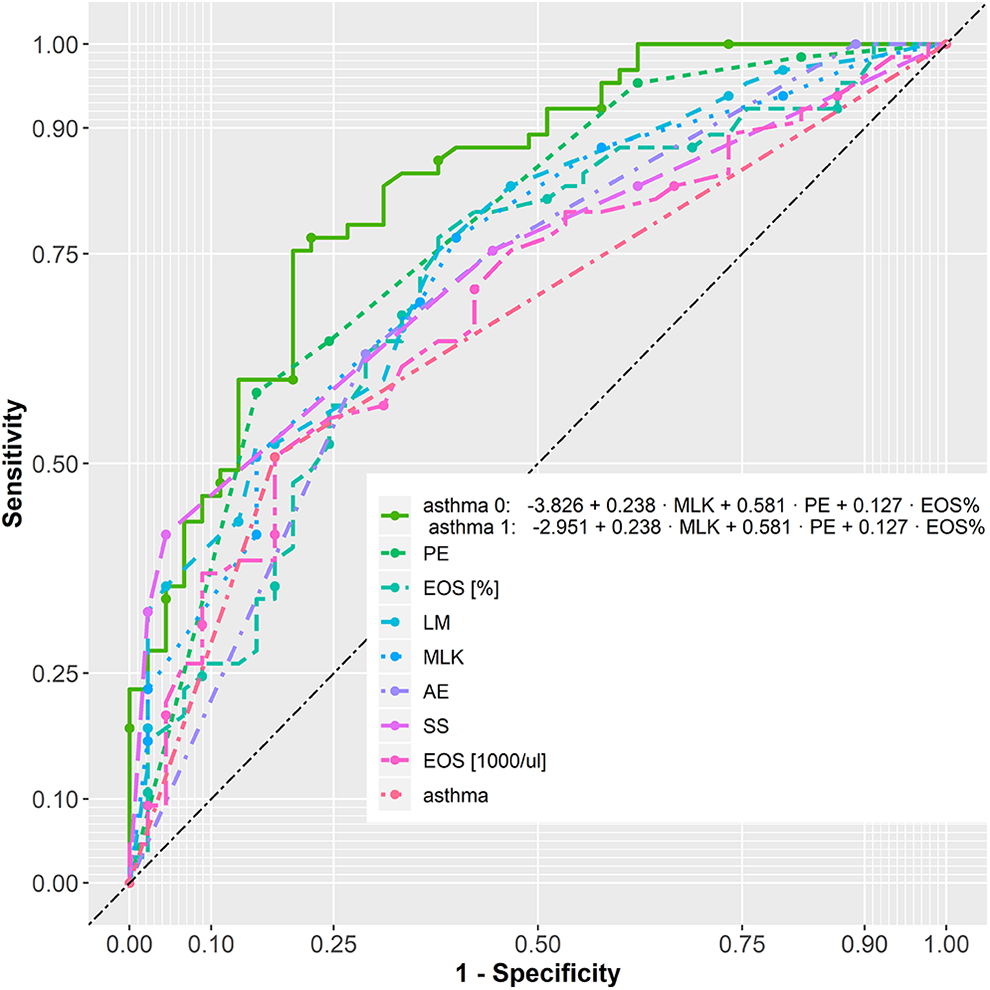
Receiver operating characteristic curves of different predictive models of ECRSwNP. The predictive ability was calculated based on the AUC. Through the new models that combine different markers of tissue eosinophilia, we obtain higher AUC values and therefore a predictive model with better sensitivity and specificity. AE indicates anterior ethmoid; AUC, area under the curve; ECRSwNP, eosinophilic chronic rhinosinusitis (CRS) with nasal polyps; EOS%, blood eosinophil percentage (%); EOS 1000/μL, absolute number (×103/μL); F, frontal; LM, Lund-Mackay; MLK, modified Lund-Kennedy; PE, posterior ethmoid; SS, sphenoid sinus.
Discussion
Unlike classifications based on CRS phenotyping, which differentiate disease variants according to observable clinical features, 7 classifications based on endotyping are based on immunohistological biomarkers involved in disease pathophysiology.32,33 Not only has the current interest in the endotypes of CRS (derived from previous research on asthma)34,35 advanced a new diagnostic scheme, but it has also demonstrated therapeutic implications.23,36 As reported in the literature, one of the most widely used biomarkers for endotyping CRSwNP is the degree of tissue eosinophilia,14,37,38 based on which good responders to a specific treatment can be selected and the risk of recurrence after sinus surgery and for comorbidities such as asthma can be predicted. 23 Such preoperative knowledge is, therefore, of considerable use, and several authors have evaluated blood eosinophilia as a submarker of tissue eosinophilia (Table 1).13,15,24-27 The meta-analysis summarized in Table 1 presents very different cutoff values of blood eosinophils as a marker of tissue eosinophilia, and this may be due to the lack of a clear and unambiguous definition of ECRSwNP. Serum eosinophil count can also be falsely elevated by comorbid parasite infection, allergy, autoimmune disorders, or adverse drug events. 39 Gitomer et al 26 did not find correlations because they were not able to eliminate either topical or systemic steroid use as a confounder of tissue eosinophilia. In keeping with Soler et al, 14 we defined ECRSwNP on the basis of the presence of an absolute count of tissue eosinophils >10/HPF, which is associated with worse general outcomes and prognosis. Our identified cutoff values (4.85% and 0.295 × 10³/µL) fall within the CI of our meta-analysis (Table 1).
Since a single parameter does not possess sufficient accuracy to be regarded as clinically relevant, we looked for a predictive model for ECRSwNP that would take into account several parameters at a time. The model proposed in this study (see Equation 1) takes into account the presence or absence of asthma, MLK, PE, and the EOS%. This allows the specificity and sensitivity to be increased compared to the best case based on a single predictor (Table 4). This information allows individualized therapeutic management taking into account the patient’s endotype.
Unlike other studies relying on the original Lund-Kennedy score, we used MLK because it is the only scoring system that shows a positive correlation with SNOT-22 in both preoperative and postoperative patients, suggesting its applicability to all patients, regardless of their surgical state. 29 In our study, in both the univariate logistic regression analyses and the multivariate logistic relationship, we found a statistically significant correlation between the MLK value and tissue eosinophilia. In addition, in the new model proposed for preoperative assessment of tissue eosinophilia, the most significant marker is MLK and not the percentage value of blood eosinophils. In conclusion, this study helps clarify which factors are most associated with ECRSwNP in order to assist in defining endotypes.
Footnotes
Authors’ Note
GianLuca Fadda made substantial contributions to the work reported in this manuscript and as a surgeon. Paolo Castelnuovo and Maurizio Bignami contributed to the conception or design of the work, revised it critically for important intellectual content, and gave final approval of the version to be published. Andrea Galizia and Giovanni Cavallo made substantial contributions to the preparation of patients undergoing surgery and gave final approval of the version to be published. Giuseppe Galizia underwent statistical analysis, interpreted data in the study, and gave final approval of the version to be published.
Declaration of Conflicting Interests
The author(s) declared no potential conflicts of interest with respect to the research, authorship, and/or publication of this article.
Funding
The author(s) received no financial support for the research, authorship, and/or publication of this article.