
Abstract
Purpose:
To evaluate stapedotomy learning curve with cumulative summation methodology using different success criteria (ie, air-bone gap [ABG] ≤10 dB, ABG ≤15 dB, restoration of interaural symmetry, or hearing threshold gain >20 dB), and to assess patient characteristics influencing or modifying the learning curve.
Methods:
Retrospective chart review of primary and revision stapedotomy cases performed by surgeon 1 (S1, n = 78) and surgeon 2 (S2, n = 85).
Results:
Using the classic criterion for a successful stapedotomy (ABG ≤10 dB), patients with preoperative ABG >34 dB were associated with unsuccessful procedures (S1 P = .02; S2 P = .07). Revision surgery was associated with unsuccessful outcomes (S1 P = .005; S2 P = .0012). Cumulative summation plots using different criteria did not show a linear trend of association between stapedotomy success and number of operations, but preoperative characteristics of the patients who underwent stapedotomy significantly influenced the plots. Cumulative summation plots showed an initial increasing tendency with improving results, but when ear surgeons got more skilled, they operated on more complex cases (ie, patients with higher preoperative ABG or revision stapedotomy) and they could not meet the success criteria.
Conclusions:
Cumulative summation plots do not seem useful to evaluate the stapedotomy learning curve, as they do not correctly deal with heterogeneous case series. The increasing complexity of the stapedotomy patients during the surgeons’ career impacts on the outcome of stapedotomy and confounds the evaluation of the growing skills of the surgeon. Stapedotomy audiological success rates are strongly influenced by the success criteria used.
Introduction
Nowadays, stapedotomy is the procedure chosen by the majority of otologists performing stapes surgery. 1 It is conceptually simple, but technically difficult. Once the technique is mastered, the results of stapes surgery are predictably good. 2 Previous investigations suggested that otologists need to go through a learning curve of 40 to 70 operations in order to achieve their full competency in stapedotomy surgery. 3 -6 Most of the reports on the stapedotomy learning curve do not evaluate whether surgeons are able to maintain their proficiency in stapes surgery. 3,5 Yung and colleagues 4 failed to find a distinct end point of the stapedotomy learning curves of 2 otologists, as their results were not sustainable. Watson et al 6 used cumulative summation (CUSUM) plots to demonstrate landmark points of competence and maintenance of proficiency in stapes surgery; this statistical analysis has already been performed to assess the success in several different surgical settings such as laparoscopic colorectal surgery, 7 transplant surgery, 8 and sentinel lymph node biopsy. 9 Watson and colleagues 6 did not find a learning curve in a retrospective case series of 204 stapedotomies by the same otologist, using the classical success criterion, that is, closure of the air-bone gap (ABG) to 10 dB or less; they found a learning curve only using closure of ABG to 15 dB as success indicator for stapedotomy.
Unfortunately, reports on stapedotomy results did not use uniform success criteria. An ABG ≤10 dB in more than 90% of the patients has long been accepted as the benchmark of good stapes surgery practice, but others have used postoperative ABG ≤15 dB 6 or ≤20 dB 10 as success criteria. Other indicators used to identify successful postoperative hearing improvement were mean air-conduction (AC) thresholds within 30 dB 11 or interaural symmetry. 12,13
The presence of a learning curve in stapedotomy surgery is a matter that should be acknowledged and discussed with patients. 4 Unfortunately, the available reports on stapedotomy learning curve are conflicting, and there is still debate about the capability of maintaining the proficiency in stapes surgery once surgeons reached the peak of the learning curve, and about how to evaluate stapedotomy success. In the present study, we retrospectively reviewed the outcomes of stapedotomy operations performed by 2 otologists from the beginning of their carrier as consultants (78 and 85 consecutive cases, respectively). We chose as success criteria postoperative ABG ≤10 dB (the most widely accepted criterion 2,3,5,10), postoperative ABG ≤15 dB (proposed by Watson et al 6 after a rational analysis of the stapedotomy learning curve using a solid statistical method, the CUSUM), and restoration of interaural symmetry (proposed by Smyth and Patterson, 12 because interaural hearing asymmetry is connected to important disabilities and handicaps. 13 In addition, we propose a new criterion, a postoperative ABG gain of 20 dB or more, as patients report an important hearing improvement. The aim was to evaluate the stapedotomy learning curve with the CUSUM methodology using different success criteria and to assess patient characteristics (as age, preoperative ABG, and revision cases) influencing or modifying the learning curve.
Materials and Methods
Patients
In the present investigation, 2 case series of consecutive primary and revision stapedotomies performed by 2 otologists at the Department of Otolaryngology and Head and Neck Surgery of the Vrije Universiteit (VU) Medical Center (Amsterdam, the Netherlands) were considered. Surgeon 1 (S1) performed 78 operations (29 left and 49 right ears; 8 [10.2%] revision stapedotomy) on 72 patients (27 male and 45 female, 6 bilateral) with a mean age of 48 years (median 48 years; standard deviation [SD] 13 years). Surgeon 2 (S2) performed 85 stapedotomy (46 left and 39 right ears; 19 (22.3%) revision stapedotomy) on 68 patients (29 male and 39 female, 11 bilateral and 6 unilateral plus revision) with a mean age of 48 years (median 48 years; SD 10 years). The observation period of the present study started from the beginning of each surgeon career as a consultant, in order to have the best data for a learning curve investigation. The inclusion criteria were as follows: (a) otosclerosis hearing loss demonstrated at the time of surgery; (b) 12-month postoperative follow-up period; (c) presence of at least 1 postoperative audiogram.
Surgery
Both ear surgeons used the same technique of small fenestra stapedotomy. Stapedotomy was performed with a Skeeter drill, and all patients received a 0.4-mm diameter titanium piston prosthesis (Kurz, Dusslingen, Germany). The operations were routinely performed under general anesthesia.
Audiological Evaluation
Audiometric evaluation included preoperative and postoperative (3 to 12 months) bone-conduction (BC) thresholds at 0.5, 1, and 2 kHz, and AC thresholds at 0.5, 1, 2, and 4 kHz, for both ears (operated and contralateral), as established by a protocol of the Audiology Department of the VU University Medical Center. Preoperative and postoperative ABG was calculated as the average difference between the AC and BC thresholds at 0.5, 1, and 2 kHz, while AC pure-tone average (PTA) was calculated as a 4 frequency average (0.5, 1, 2, and 4 kHz). Only AC and BC results that were obtained at the same time were used for calculations, according to American Academy of Otolaryngology Head and Neck Surgery guidelines. 14 Complete immittance audiometry was performed in all patients as previously reported. 15
Success Criteria
The outcomes of stapedotomy surgery were analyzed according to 3 success criteria existing in the literature and one proposed by the present authors: (1) postoperative ABG ≤10 dB 2,3,5,10 ; (2) postoperative ABG ≤15 dB6; (3) restoration of interaural symmetry (AC PTA within 15 dB of contralateral ear AC PTA) 12 ; and (4) postoperative ABG gain >20 dB (calculated as preoperative ABG minus postoperative ABG).
Statistical Analysis
In order to avoid any bias due to post hoc considerations, we preliminarily decided to dichotomize the considered variables for inferential statistics, according to median values (for age, and preoperative ABG), or as stapedotomy success (0) vs failure (1) (postoperative ABG ≤10 dB [0] vs >10 dB [1]; postoperative ABG ≤15 dB [0] vs >15 dB [1]; restoration of interaural symmetry [0] vs asymmetry [1]; postoperative ABG gain >20 dB [0] vs ≤20 dB [1]). Fisher exact test was used to compare the dichotomized variables. When a significant P value was disclosed, the odds ratio (OR) and the corresponding 95% confidence interval (CI) were calculated. A P value <.05 was considered significant.
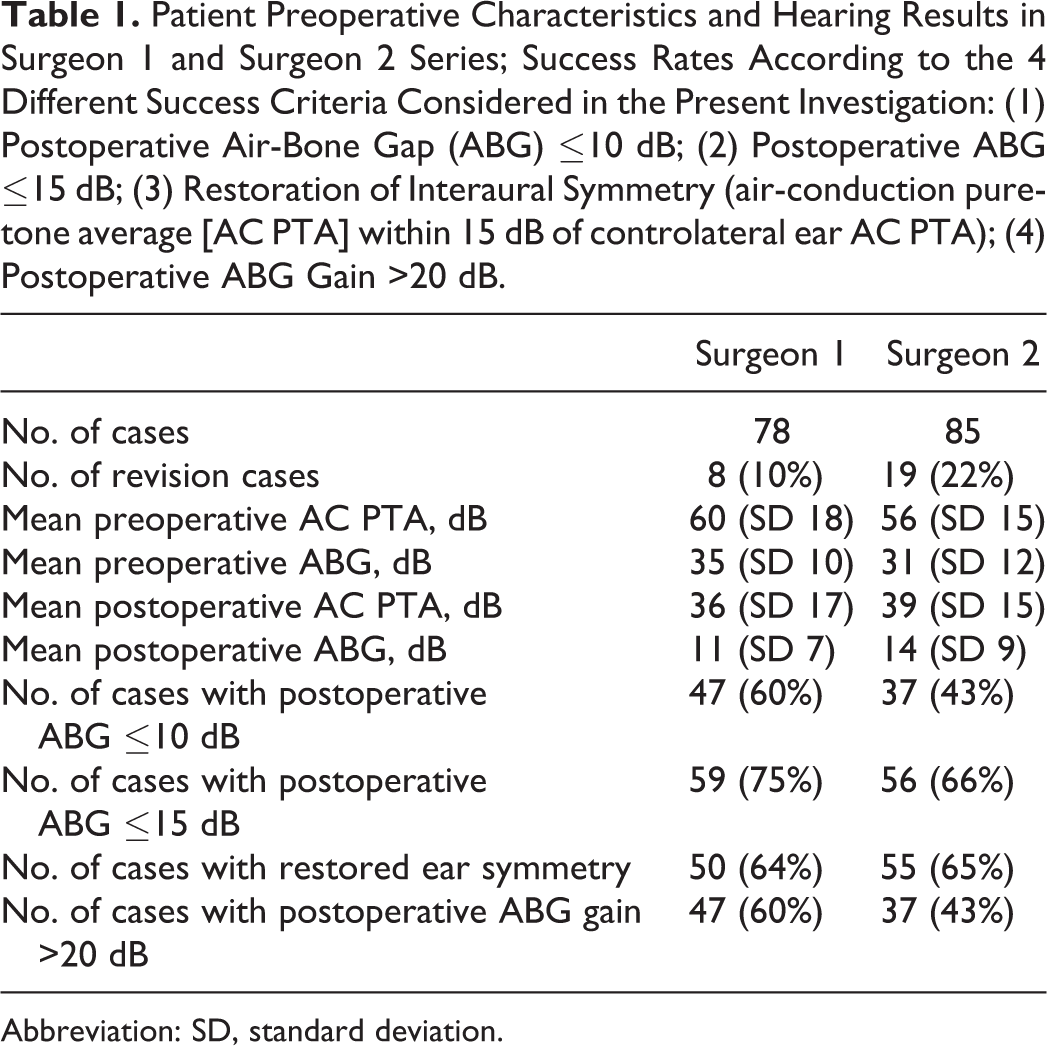
The CUSUMs were calculated according to the function proposed by Kay and Little in 1987. 16 Success (0) or failure (1) of stapedotomy was determined according to the 4 audiometric criteria listed previously, in order to create 4 CUSUM plots for S1 and S2 (Figures 1A-D and 2A-D, respectively). Every case in the 2 surgical series is plotted from left to right on the x-axis, and the graph moves in y-axis up for every positive result (0) or down for every negative result (1). The CUSUM function is influenced mainly by the number of failures (1), thus different graphs may show different excursions on the y-axis, depending on the percentage of failures included. According to the analysis of CUSUM plots made by Royston, 17 a learning curve should present as a progressively ascending graph, indicating a linear increasing trend of association between the success of stapedotomy and the increasing number of sequential operations. For instance, when after a successful series (0) of interventions, a surgeon experiences some failures (1) that influence negatively the CUSUM plot, the next series of positive results should be larger to show an increasing trend. The STATA 8.1 (Stata Corp, College Station, Texas) statistical package was used for all analyses.
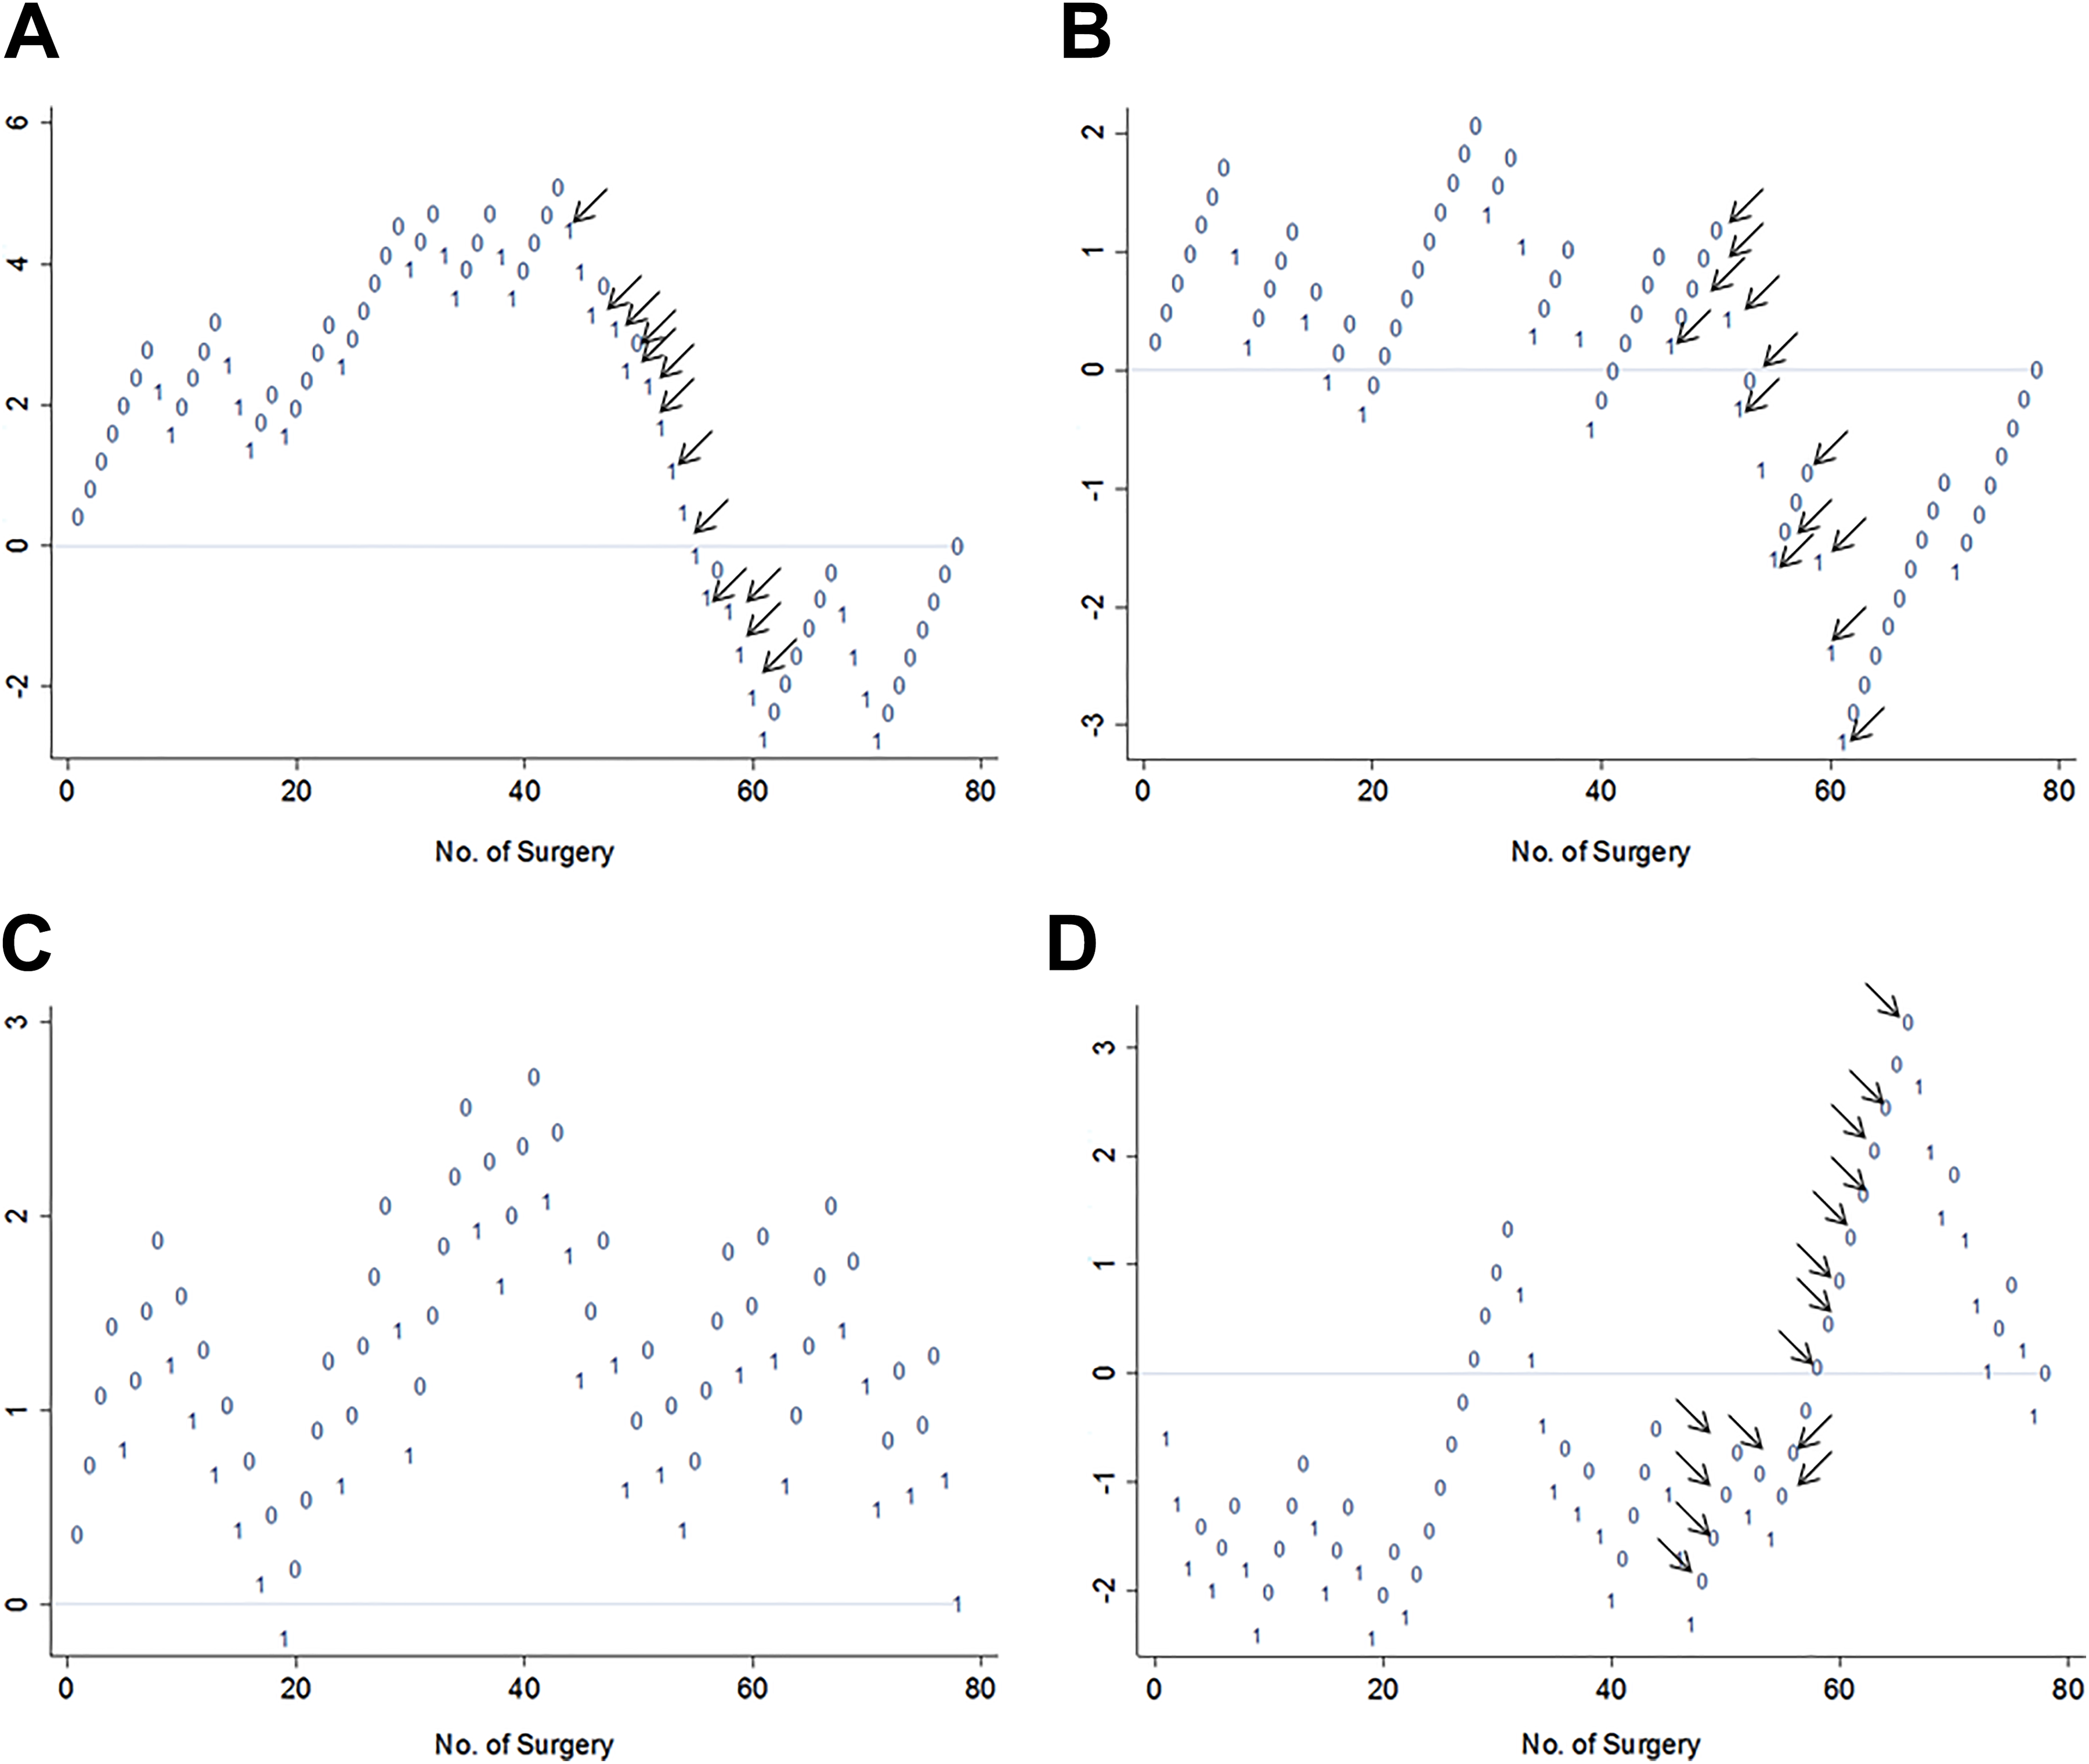
A-D, Cumulative summation plots of stapedotomy operations performed by surgeon 1 showing positive (0) and negative (1) results according to different success criteria: (A) postoperative air-bone gap (ABG) ≤10 dB; (B) postoperative ABG ≤15 dB; (C) restoration of interaural symmetry; and (D) postoperative ABG gain >20 dB. Between cases 44 and 66, 18 patients (black arrows) with preoperative ABG >34 dB were operated, which explains the descending lines (negative outcomes) in A and B, and the ascending line (positive outcomes) in D.
Results
Stapedotomy Outcomes and Patients Characteristics
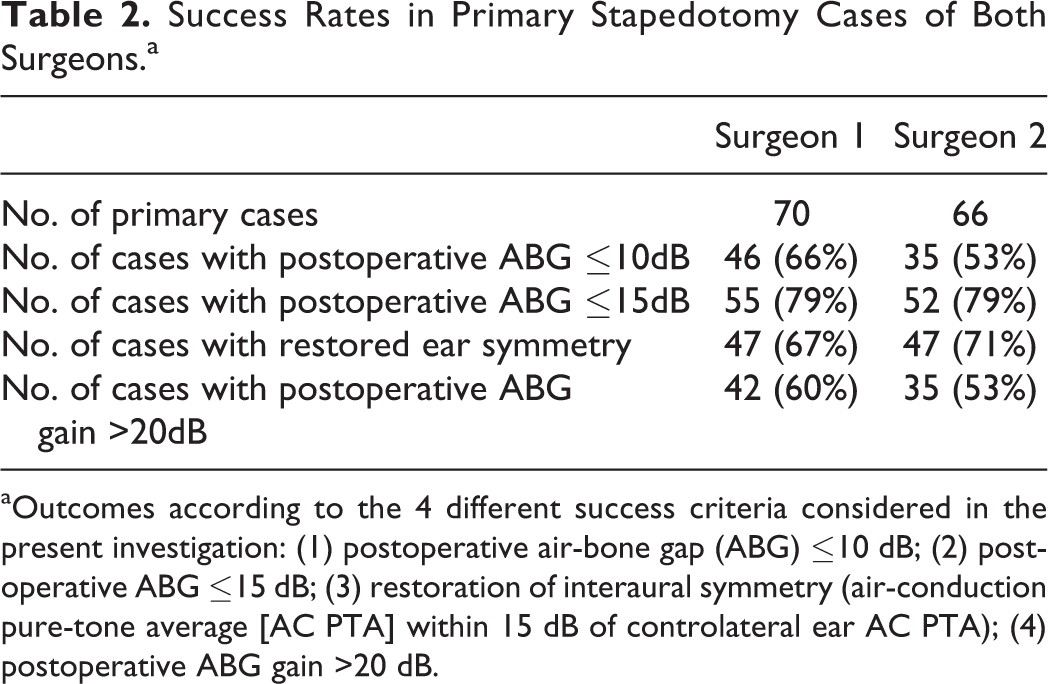
In Table 1, we reported patients’ preoperative characteristics and hearing results in S1 and S2 case series (primary and revision cases). Success rates were calculated according to the 4 different success criteria considered in the present investigation (postoperative ABG ≤10 dB, postoperative ABG ≤15 dB, restoration of interaural symmetry [AC PTA within 15 dB of contralateral ear AC PTA], or postoperative ABG gain >20 dB).
Patient Preoperative Characteristics and Hearing Results in Surgeon 1 and Surgeon 2 Series; Success Rates According to the 4 Different Success Criteria Considered in the Present Investigation: (1) Postoperative Air-Bone Gap (ABG) ≤10 dB; (2) Postoperative ABG ≤15 dB; (3) Restoration of Interaural Symmetry (air-conduction pure-tone average [AC PTA] within 15 dB of controlateral ear AC PTA); (4) Postoperative ABG Gain >20 dB.
Abbreviation: SD, standard deviation.
We used postoperative ABG ≤10 dB as stapedotomy success criterion to evaluate the association with patient characteristics. In S1 case series, patients with higher preoperative ABG (>34 dB, median value) were significantly associated with unsuccessful (ABG >10 dB) outcomes (Fisher exact test, P = .02; OR = 3.38, 95% CI = 1.18-9.9), while for S2, the analysis of such an association disclosed a trend toward significant values (Fisher exact test, P = .07; OR = 2.41, 95% CI = 0.86-7.06). It should be noted that hearing results in this group of patients improved from mean preoperative ABG of 43.2 and 43.3 dB, respectively for S1 and S2, to 13.3 and 17.2 dB of ABG postoperatively, for many patients a satisfactory result.
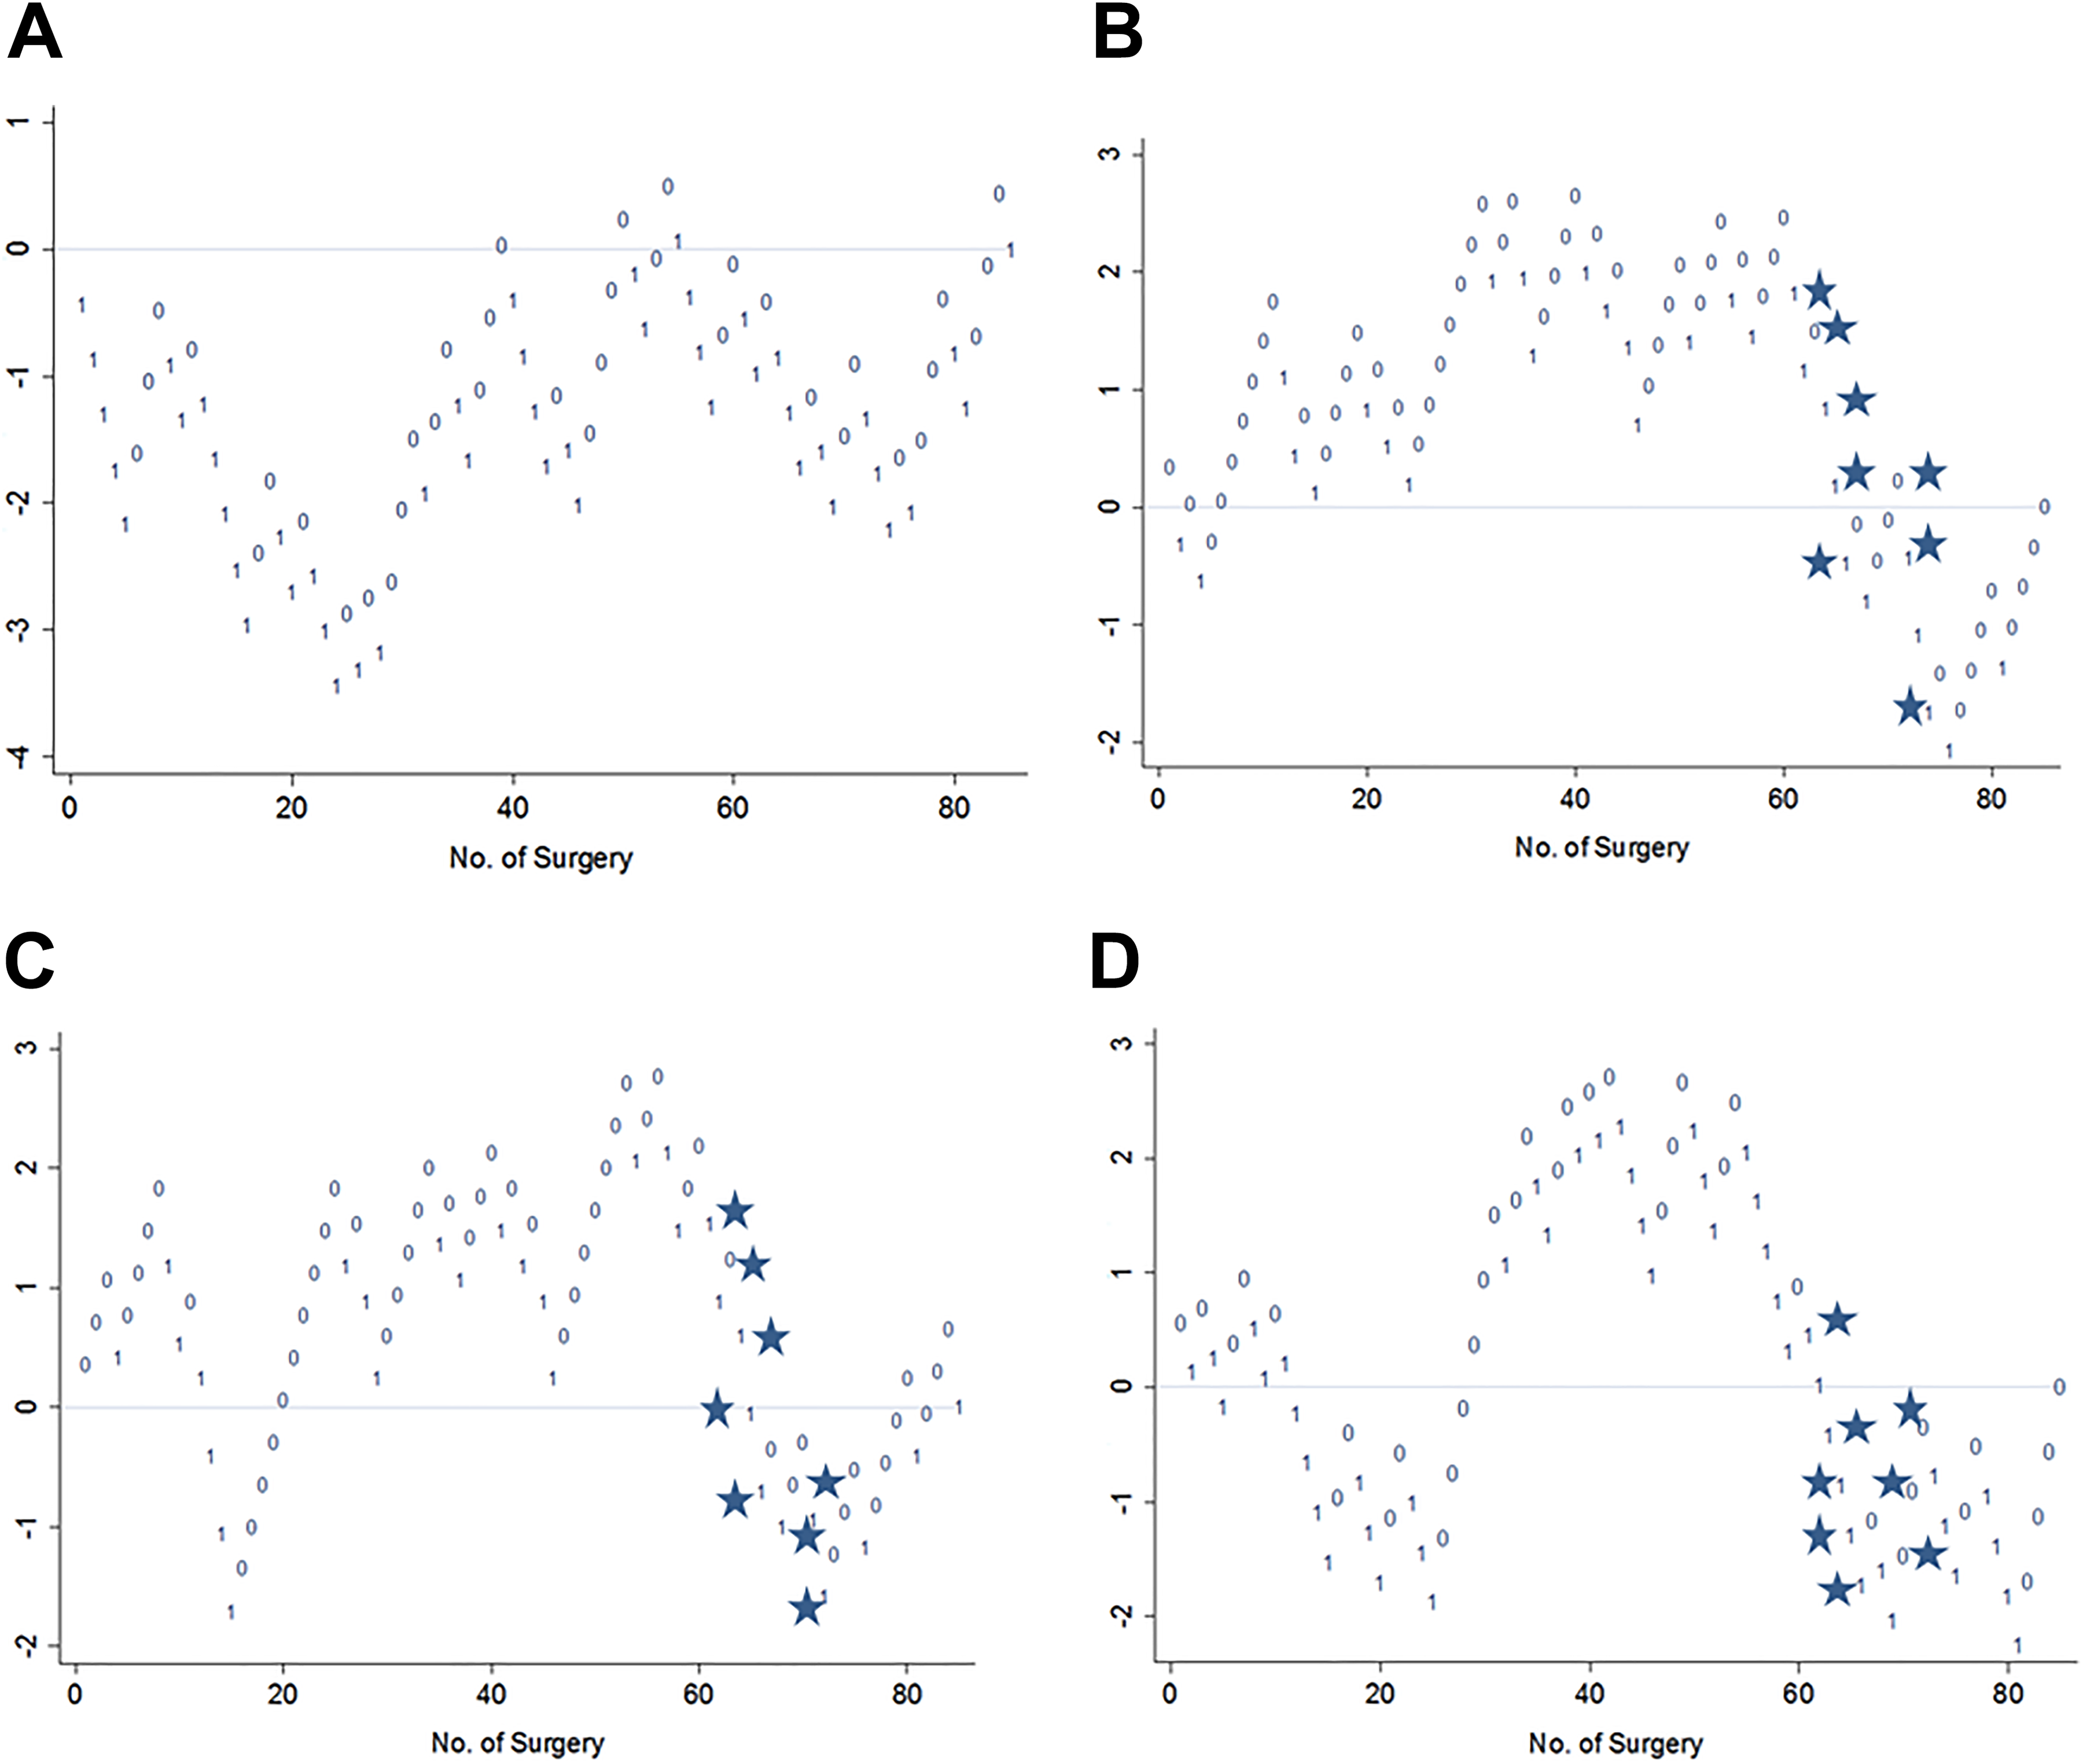
Revision surgery was strongly associated with unsuccessful outcomes, when using postoperative ABG ≤10 dB as stapedotomy success criterion, in both S1 and S2 case series (Fisher exact test, for S1 P = .005, OR = 13.4, 95% CI = 1.52-61.73; for S2 P = .0012; OR = 9.59, 95% CI = 1.97-90.14). Changing the success criterion to postoperative ABG ≤15 dB improved the success rate of revision cases from 12.5% to 50.0% for S1 and from 10.5% to 21.1% for S2. Mean hearing levels improved in revision stapedotomy cases as well: from preoperative mean ABG of 39.6 and 28.9 dB, respectively for S1 and S2, to postoperative mean ABG of 15.8 and 22.5 dB. When considering only primary stapedotomy cases (Table 2), success rates according to the different criteria were comparable between the 2 ear surgeons. Age was not associated with the stapedotomy outcomes (Fisher exact test, for S1 P = .81; for S2 P = .1).
Success Rates in Primary Stapedotomy Cases of Both Surgeons.a
aOutcomes according to the 4 different success criteria considered in the present investigation: (1) postoperative air-bone gap (ABG) ≤10 dB; (2) postoperative ABG ≤15 dB; (3) restoration of interaural symmetry (air-conduction pure-tone average [AC PTA] within 15 dB of controlateral ear AC PTA); (4) postoperative ABG gain >20 dB.
Learning Curve Analysis
Using the analysis of CUSUM plots proposed by Royston, 17 we did not find a linear trend of association between stapedotomy success and the increasing number surgical experience with any of the selected criteria, neither in S1 nor in S2 case series (Figures 1 and 2). Most of the graphs, using different success criteria, showed a similar increasing tendency in the first part (meaning improving results), while in the second part, when surgeons were more skilled, the plots descended toward negative values in the y-axis, with an increasing number of failures (Figure 1A-B, Figure 2B-D). Interestingly, for S1 using the criteria of postoperative ABG gain >20 dB, the tendency of the curve was remarkably different and the CUSUM plot ascended in the second part. In the specific S1 case series, between case 44 and 66, more patients with a preoperative ABG >34 dB were operated, and this may explain the descending part (negative outcomes) of the CUSUM plots in Figure 1A and B (ABG ≤10 dB and ≤15 dB) and the ascending part (positive outcomes) in Figure 1D (ABG gain >20 dB). Analyzing the operated cases by S2, we note that between cases 61 and 74 the number of revision case was high (8 revision stapedotomy), which may explain the descending part of the 3 curves (Figure 2B-D). Because more difficult cases (revision/ larger ABG) are included in the case series with increasing experience and professional status, the length of successful series for both ear surgeons did not increase, which led to a descending tendency using CUSUM.
A-D, Cumulative summation plots of stapedotomy operations performed by surgeon 2 showing positive (0) and negative (1) results according to different success criteria: (A) postoperative air-bone gap (ABG) ≤10 dB; (B) postoperative ABG ≤15 dB; (C) restoration of interaural symmetry; and (D) postoperative ABG gain >20 dB. Between case 61 and 74, 8 revision cases were operated (stars), which explains the descending lines (negative outcomes) in B-D.
Discussion
In the present study, we retrospectively review the outcome of stapedotomies performed by 2 otologists (S1 and S2) at the beginning of their carriers as consultants, using similar surgical techniques, in an identical setting (the same tertiary referral center), with a relative large number of patients, and evaluate the usefulness of the CUSUM methodology in the analysis of their stapedotomy learning curves. The presence of a learning curve in stapedotomy surgery is an important issue that should be acknowledged and discussed with patients. 4 Unfortunately, previous reports on stapedotomy learning curves report contradictory results, which could in part be explained by the fact that different studies use different success criteria. Generally, the postoperative ABG has been used to describe the postoperative outcome, but with varying criteria indicating success (postoperative ABG of less than 10 dB, 15 dB, or 20 dB each have all been reported). 3 -6,10 Here, we have evaluated the outcome using different success criteria: (a) a postoperative ABG ≤10 dB, the most widely accepted criterion 2,3,5,10 ; (b) a postoperative ABG ≤15 dB, proposed by Watson et al 6 ; and (c) restoration of interaural symmetry as proposed by Smyth and Patterson. 12 In addition, we propose a new criterion, a postoperative ABG gain of 20 dB or more, as patients notice an important hearing improvement. Furthermore, the influence of the patients’ audiometric characteristics on stapedotomy success rates and the CUSUM methodology was evaluated.
The 2 case series differed in terms of preoperative ABG (median 34 dB for S1 vs median 28 dB for S2), and number of revision stapedotomies (10.2% for S1 vs 22.3% for S2). In S1 case series, patients with higher preoperative ABG were associated with negative outcomes (P = .02), when using the postoperative ABG ≤10 dB criterion, while in S2 series, this association was not statistically significant (P = .07). Revision surgery was strongly associated with unsuccessful outcomes (ABG >10 dB) in both stapedotomy groups (S1 P = .005; S2 P = .0012), but when changing the success criterion to ABG ≤15 dB, the success rate of revision stapedotomy remarkably increased. A large preoperative ABG was associated with postoperative failure according to the classical success criterion (ABG ≤10 dB); however, most patients experienced a significant improvement in hearing. Both revision surgery and large preoperative ABG have been associated with negative stapedotomy outcomes in previous reports. 18 -20
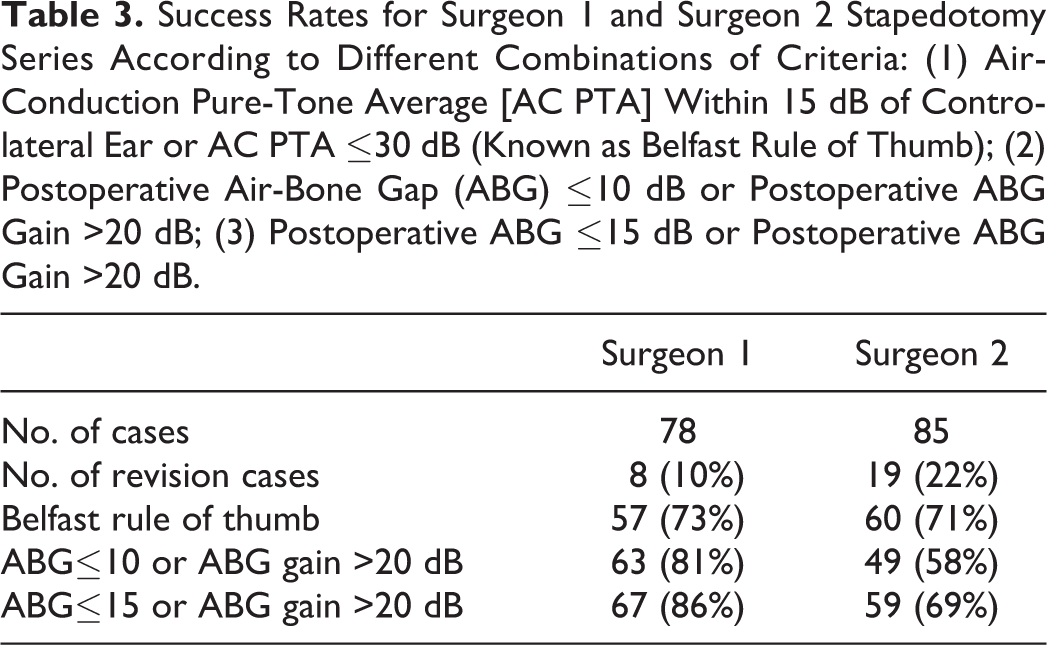
Discrepancies have frequently been reported between the success of stapes surgery as perceived by otologists and by patients. Although audiometric improvement of the operated ear is important, patients may highly value other aspects such as stereophony, listening abilities in various listening conditions, absence of sound distortion, or tinnitus. 21 In order to overcome this, the use of multiple success criteria have been proposed. 21,22 Smyth and Patterson 12 observed that patients considered the postoperative outcome as “bad” when the interaural difference was greater than 15 dB. They proposed to use the Belfast rule of thumb, a combination of 2 criteria: postoperative interaural difference within 15 dB or mean AC thresholds within 30 dB. 12 In Table 3, we compared success rates using the Belfast rule of thumb and other criteria combinations proposed according to our findings. Hazenberg and colleagues 22 used objective audiometric measures and subjective questionnaires to evaluate quality of life and listening capabilities. They found that listening capabilities, as evaluated by the Operation Benefit Profile questionnaire, did not correlate with any audiometric measures. The definition of success after stapedotomy thus remains complex and is probably not adequately represented with any single audiometric criterion but should include the patients’ perception of the hearing performance after surgery.
Success Rates for Surgeon 1 and Surgeon 2 Stapedotomy Series According to Different Combinations of Criteria: (1) Air-Conduction Pure-Tone Average [AC PTA] Within 15 dB of Controlateral Ear or AC PTA ≤30 dB (Known as Belfast Rule of Thumb); (2) Postoperative Air-Bone Gap (ABG) ≤10 dB or Postoperative ABG Gain >20 dB; (3) Postoperative ABG ≤15 dB or Postoperative ABG Gain >20 dB.
The CUSUM plots for S1 and S2 did not show a linear association between stapedotomy success and the increasing number of operations (Figures 1 and 2). Although the CUSUM plots showed increasing success rates in the first part, at the later stages, the number of failures increased, and the results were not sustainable (Figure 1A-B and Figure 2B-D). This is most probably due to the observation that the ear surgeons operated on more complex cases (ie, patients with higher preoperative ABG or revision cases) as they progressed through their learning curve. This was also suggested by Yung et al 4 in order to explain why their stapedotomy results were not sustainable. The CUSUM plots do not seem to be able to correctly deal with a heterogeneous case mix. Revision stapedotomies, for instance, will have a negative impact on the outcome of surgery (and thus on the CUSUM curve); however, the surgeon will clearly learn a great deal from doing revision cases, and they are obviously beneficial for one’s learning curve. As complex cases will generally be underrepresented in the early stages and a more frequent occurrence in the later stages of one’s learning curve, overall results may even become less favorable, even though the skills and expertise of the surgeon are growing. The CUSUM methodology is not able to adequately deal with this paradox and does therefor not seem to describe correctly the growing skills and expertise of surgeons going through their stapedotomy learning curve. In order to overcome this problem, one could opt to leave complex cases out of the analysis and perform the CUSUM analysis on, for instance, primary stapedotomies only. 3 -5 This would however also not adequately describe a real learning curve as complex cases do become part of the case mix, and a surgeon does learn from the experience.
In order to provide adequate preoperative counseling to patients, otologists should be able to present their own stapedotomy results and be aware of their own learning curve. However, different ear surgeons will go through different learning curves, due to factors such as differences in training, setting, experience with other ear procedures, and the case mix they are presented with. The current methods used to evaluate learning curves in health technologies do however not seem to be able to describe these complex processes, and further research is required to adequately describe the effects of the growing skills and expertise of the ear surgeon on the outcome of stapedotomies. 23
Footnotes
Authors’ Note
Informed consent was obtained from all individuals participating in the study. All procedures performed in the study were in accordance with the ethical standards of our institutional research committee and with the 1964 Helsinki Declaration and its later amendments.
Declaration of Conflicting Interests
The author(s) declared no potential conflicts of interest with respect to the research, authorship, and/or publication of this article.
Funding
The author(s) received no financial support for the research, authorship, and/or publication of this article.