
Abstract
To address water accumulation in old goafs of deep coal mines, which readily forms water inrush hazards and makes grout diffusion difficult to predict, we established a three-dimensional continuous spatial distribution model of porosity and permeability in the goaf based on O-ring and key stratum theories. A multiphysics-coupled numerical model combined with response surface methodology (RSM) was used to quantitatively analyze the effects of influencing factors and their interactions on grout diffusion behavior. The results show that grout diffusion within the goaf is strongly asymmetric: the horizontal diffusion distance exceeds 25 m, the upward vertical diffusion distance exceeds 5 m, and the downward vertical diffusion distance exceeds 2 m. The permeability of the porous medium and grouting pressure promote diffusion, whereas grout viscosity inhibits it. The RSM-based grout diffusion volume prediction model was applied to the design of a fly-ash grout backfilling project in a goaf of a coal mine in Shaanxi Province. Considering pressure attenuation along the flow path and the heterogeneous seepage field, a borehole spacing of 40 m was determined, providing a theoretical basis and technical support for water-hazard control and optimization of grouting parameters in similar old goafs of deep coal mines.
Keywords
As coal extraction in China extends to greater depths, the production landscape is being reshaped, and many mines have been closed or decommissioned (China National Coal Association, 2021), while many active mines remain adjacent to abandoned workings. Water accumulated in old goafs within these abandoned mines poses a latent water-inrush threat to neighboring operating mines (Dong, 2010; Xu et al., 2025; Zhang et al., 2024). Statistical data indicate that water hazards have become the second most significant disaster type in coal mines after gas accidents, and the proportion of incidents triggered by old-goaf water continues to rise, highlighting persistent weaknesses in the investigation, treatment, and monitoring of old-goaf water (Zeng et al., 2023). In engineering practice, grouting reinforcement and filling technologies are widely adopted as primary measures for the prevention and control of water hazards associated with old goafs (Dong et al., 2023; Fan et al., 2022; Zhao et al., 2016). However, under variable geological and operational conditions, the migration behavior, diffusion range, and diffusion patterns of grout injected through horizontal boreholes are difficult to generalize or predict with high accuracy. Engineering design often relies heavily on field experience, introducing a degree of uncertainty.
Researchers have carried out a large number of theoretical, modeling, and experimental studies on slurry diffusion behavior and characteristics, and have achieved abundant results. In terms of diffusion mechanisms, fractal theory was introduced to establish a mathematical model for the cylindrical diffusion of Bingham-type grout in fractal porous media, and an analytical solution of the fractal permeation-grouting diffusion equation was derived (Zhou et al., 2024); based on a Bingham-fluid constitutive model with time-dependent viscosity, a one-dimensional permeation-grouting diffusion model was developed under a constant grouting rate, in which the spatiotemporal variation of grout viscosity was taken into account (Zhang et al., 2017). In terms of numerical simulation, the discrete element method was used to investigate the fracture initiation mechanism and grout diffusion paths during horizontal borehole grouting under different grout-property conditions (Liu, 2022; Liu and Zhang, 2023); combined with tracer tests, the dominant controlling factors of grout diffusion in horizontal borehole grouting were studied, and a calculation formula for the grout diffusion range was established (Guo et al., 2023a, 2023b, 2024). In terms of physical model tests, model experiments were conducted using a fracture dynamic-water grouting device in combination with an orthogonal experimental design, and the correlations among the seepage pressure field, grouting effectiveness, and grouting process were obtained (Zhang and Liu, 2025); the diffusion patterns of chemical grout and the variation in sealing efficiency under flowing-water conditions were further revealed based on a single-fracture model and a two-dimensional fracture-network model (Sui et al., 2015; Zheng et al., 2023); through grouting tests in fragmented rock, a controlling equation for grout diffusion distance was derived that considers the particle size of fragmented rock and the grout mass fraction (Zeng et al., 2025). In terms of grouting material performance, through experimental studies on the properties of grouting slurries, the influence patterns of different types of grouting materials on grout diffusion were analyzed (Fan et al., 2025; Miao et al., 2022; Wang, 2019). In summary, existing studies have mostly taken karst-fractured aquifers such as Ordovician limestone and intact rock masses of coal seam floors as the research objects, and generally adopted simplifying assumptions such as homogeneous media and single-phase flow, making it difficult to reflect the grout diffusion patterns of directional horizontal borehole grouting dominated by preferential pathways, as well as the interactions among influencing factors, in the goaf formed by mining, which is an extremely heterogeneous, strongly anisotropic fragmented medium.
Therefore, against the background of fly-ash slurry grouting backfilling engineering in coal-mine goaf, this article investigates the spatial distribution characteristics of porosity and permeability in the goaf and the dominant controlling factors governing slurry migration during grouting. Based on the O-ring theory and key stratum theory, a three-dimensional, spatially continuous characterization method for goaf porosity and permeability is established. Using COMSOL Multiphysics, a three-dimensional numerical model of horizontal-borehole grouting in the goaf is developed with coupled free-flow and porous-media flow. In combination with a two-level fractional factorial design, steepest ascent experiments, and response surface methodology, the evolution of the slurry diffusion interface under different operating conditions is examined, and the effects of grouting pressure, slurry properties, and formation characteristics on the slurry diffusion volume are analyzed. The results are intended to provide a theoretical basis and engineering support for optimizing the goaf grouting process parameters and for proactive regional control of water hazards.
Theory of grout–water two-phase flow
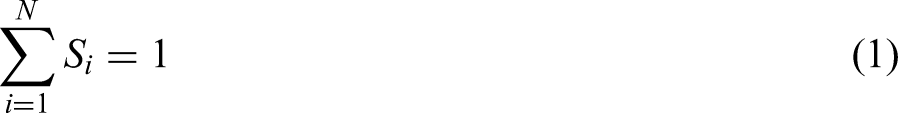
In coal mine goafs, the displacement of groundwater by grout under high injection pressure can be treated as a two-phase flow problem involving coupled free-flow and porous-media flow. The flow in the free-fluid region is governed by the Navier–Stokes equations. The flow in the porous medium is described by the Brinkman equation, which accounts for momentum transfer through macroscopic viscous effects and pressure gradients and may be viewed as an extension of Darcy's law (Le Bars and Worster, 2006; Nield and Bejan, 2017). To quantify the fraction of a local control volume occupied by each phase, the phase volume fraction Si is introduced. Si varies in space and time, but the sum of the volume fractions of all phases is always equal to unity, that is,
The flow of the free fluid within the goaf is assumed to be viscous and incompressible, and is governed by the Navier–Stokes equations:


In the porous medium, the fluid occupies only the pore space. Its motion is affected not only by body forces such as gravity but also by the drag exerted by the solid skeleton (Bear, 1972; Helmig, 1997). Therefore, the incompressible Brinkman equation is adopted to describe the flow in the porous region:


On the basis of the above governing equations, the level set method is employed to track the interface between the two phases (Chen et al., 2006). A level set function ϕ is introduced, and its evolution equation is given by the following equation:

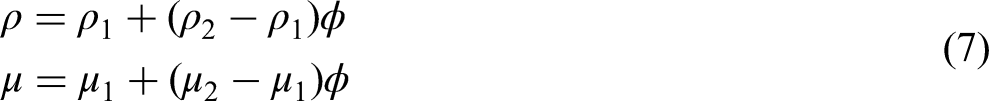
In addition to defining the interface between the two phases, the level set method also smooths the discontinuities in density and viscosity across the interface by defining them as follows:
Spatial distribution model of porosity and permeability of porous media in the goaf
Spatial distribution equation of porosity of porous media in the goaf
In the goaf, the porosity and permeability of the porous medium are not constant but vary strongly with spatial position. To investigate the spatial distributions of porosity and permeability in the goaf, the point at which the midpoint of the contact line between the goaf and the advancing working face intersects the upper surface of the floor is taken as the origin of the model coordinate system. The positive x-axis is defined along the strike direction toward the interior of the goaf, the positive y-axis along the dip direction toward the return-air roadway, and the positive z-axis perpendicular to the upper surface of the floor and directed upward, as shown in Figure 1.
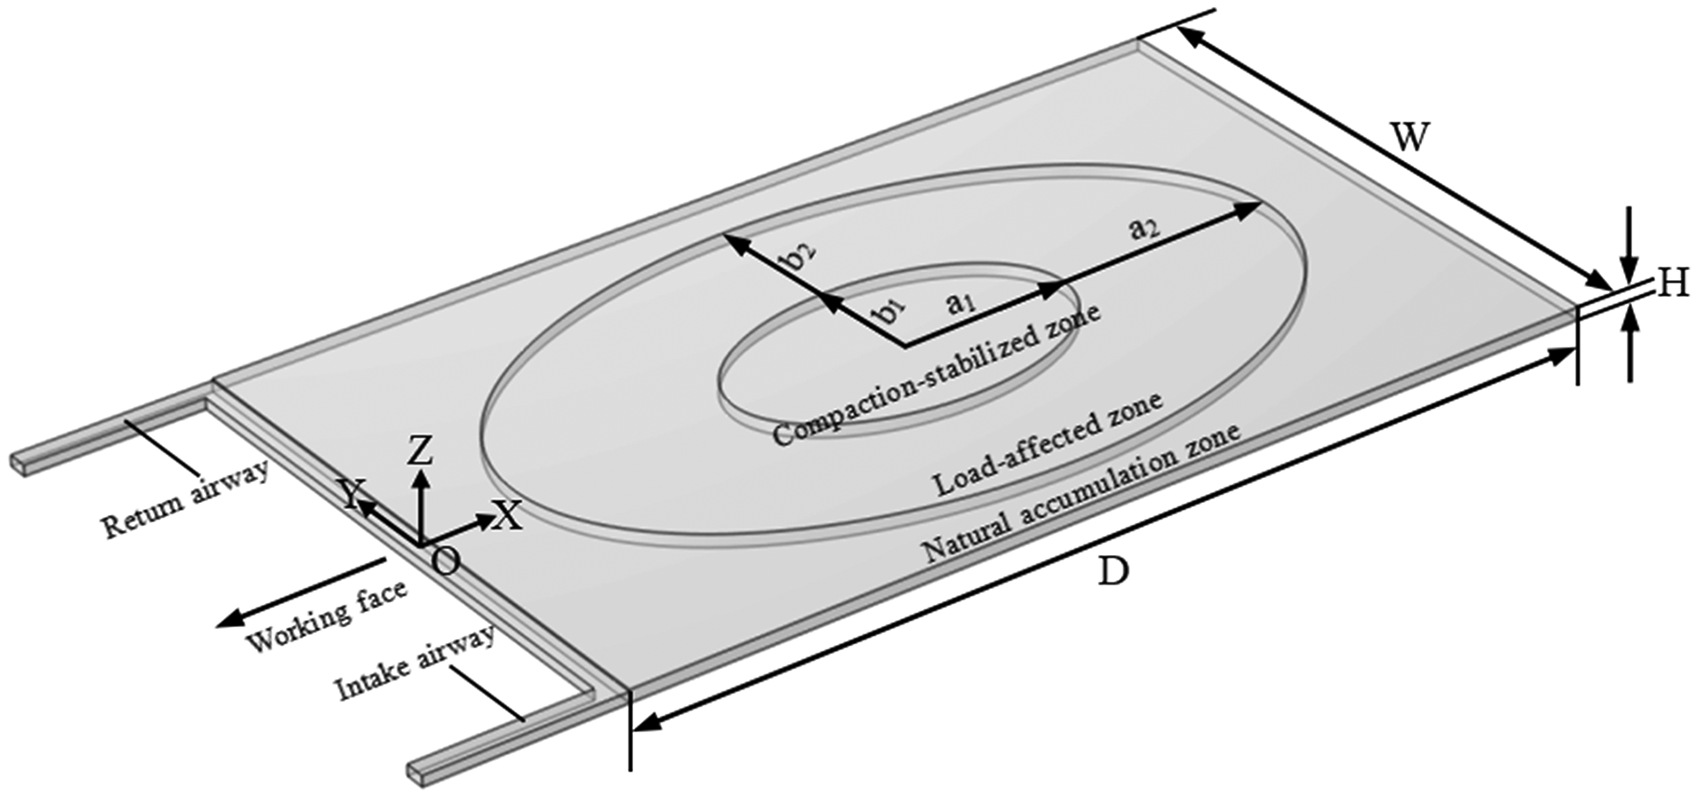
Schematic diagram of the goaf.
According to the O-ring theory proposed by Academician Minggao Qian and the key-stratum theory, failure of the key stratum causes large-scale movement of the overlying strata, thereby generating numerous mining-induced fractures. Under the combined support of the coal wall and the longwall supports, the basic roof and part of the immediate roof around the margins of the goaf remain partly suspended and form a cantilever structure. In contrast, the central part of the goaf, being far from the coal wall, is mainly controlled by the self-weight of the overlying strata, so the mining-induced fractures there tend to become compacted. Consequently, a continuous zone with well-developed, interconnected mining-induced fractures is formed around the margins of the goaf, exhibiting an O-ring distribution pattern (Qian and Xu, 1998).
Therefore, on the section y = 0 in the goaf, the porosity φx along the x-direction first decreases and then increases from the roof-cut line to the open-off cut, and its overall distribution is approximately symmetric. To quantitatively characterize the above pattern, based on field-measured data, MATLAB regression fitting was employed to establish the following expression for the spatial distribution of porosity along the x-direction in the goaf:

Similarly, on the section x = 0 in the goaf, the porosity variation coefficient

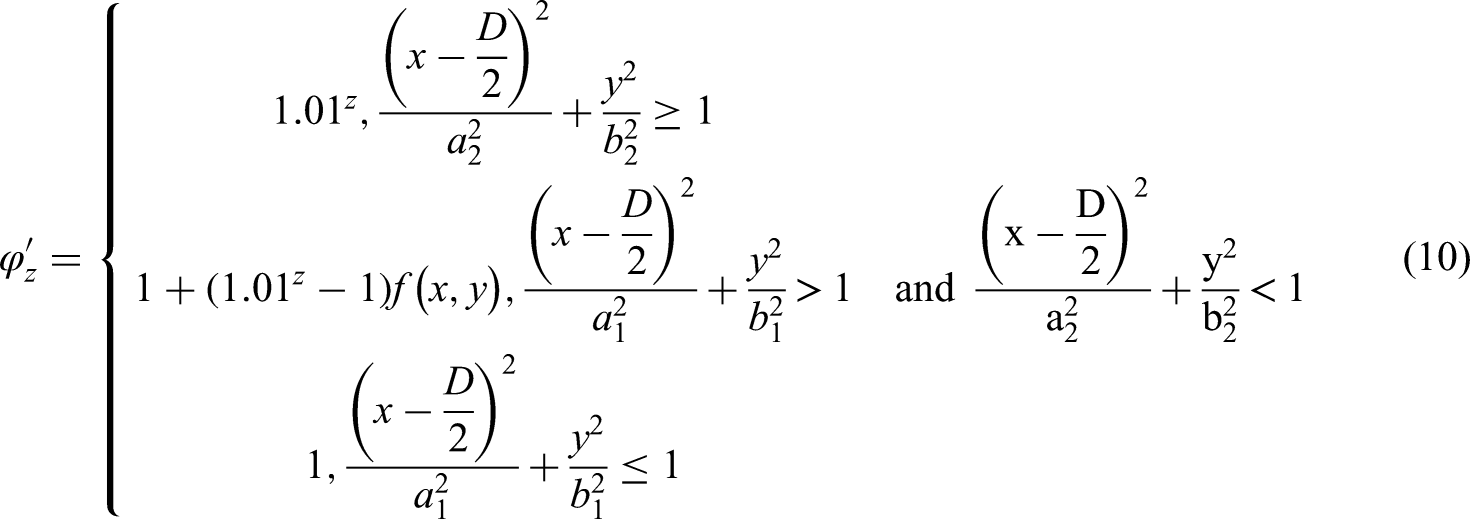
According to the lithology of the roof and the failure characteristics of the caved rocks in the goaf after the working face has been mined, the goaf can be subdivided into a natural accumulation zone, a load-affected zone, and a compaction-stabilized zone. In the natural accumulation zone, because the roof subsidence is small, the caved rocks are loosely accumulated, and the porosity is relatively high and increases exponentially in the vertical direction (positive z-direction). In the compaction-stabilized zone, the stress in the overlying strata tends to be stable, and the porosity of the caved rocks changes only slightly under long-term compaction, so it can be approximated as a constant. The load-affected zone acts as a transition zone, whose porosity lies between that of the other two zones and varies continuously. Therefore, along the z-direction in the x–y plane, the porosity variation coefficient
In the goaf, the three-dimensional spatial distribution of porosity φ can be expressed as the product of φx,
Accordingly, the porosity of the porous medium in the goaf can be regarded as a function of spatial position. Taking the 85209-1 working face of a mine in Shaanxi Province as an example, the goaf has a strike length of D = 500 m, a dip width of W = 300 m, and a vertical height of H = 5 m. Previous studies indicate that the typical distance from the outer boundary of the O-ring to the coal wall is ∼30 m, and that its extents in the strike and dip directions are consistent with the corresponding dimensions of the goaf (Li et al., 2011; Liu, 2012). Based on these parameters, together with the zonal geometric relationships shown in Figure 1, the inner and outer boundaries of the O-ring are represented by two concentric ellipses. The resulting semi-major and semi-minor axes are a1 = 87.5 m and b1 = 52.5 m for the inner ellipse, and a2 = 200 m and b2 = 120 m for the outer ellipse. The porosity spatial distribution surface is shown in Figure 2.

Spatial distribution surface of porosity of porous media in the goaf: (a) z = 0 m and (b) z = 5 m.
Spatial distribution equation of permeability of porous media in the goaf
Porosity and permeability are basic parameters used to describe the characteristics of porous media. A large number of experimental studies have shown that there is a certain correlation between them, and this relationship varies under different conditions of porous media. In general, however, porosity and permeability are positively correlated; that is, the larger the porosity, the greater the permeability. In permeability measurement experiments, by fitting the variation curves of porosity and permeability of porous media, an exponential relationship between them can be established (Che, 2011):

By substituting equation (12) into equation (13), the spatially continuous distribution equation of the permeability of the porous media in the goaf can be obtained as follows:

Spatial distribution surface of permeability of porous media in the goaf: (a) z = 0 m and (b) z = 5 m.
Numerical model and solution settings
Basic assumptions
The diffusion model for grout in the coal mine goaf is based on the following assumptions (Xu et al., 2022): (1) the grout is treated as an isotropic, incompressible continuum; (2) the dynamic viscosity of the grout varies only with time, and at a given time the dynamic viscosity is the same at different locations; (3) the grout flow is mainly laminar, and turbulence may occur only in a local region near the grouting borehole; (4) grout diffusion occurs as complete displacement, and mixing between water and grout at the grout–water interface is neglected; (5) the sidewalls satisfy a no-slip boundary condition; and (6) prior to grouting, the goaf is fully saturated with a single water phase and is in hydrostatic equilibrium, and the initial pore-water pressure is prescribed according to the hydrostatic pressure distribution.
Model construction and mesh generation
To simulate the flow and transport of two immiscible phases in coupled free and porous-media flow, and to track the two-phase interface in the porous medium, this study couples the Laminar Flow physics interface with the two-phase flow, level set, and Brinkman equations multiphysics interface in COMSOL Multiphysics. Within the global coordinate system defined in the “Spatial distribution model of porosity and permeability of porous media in the goaf” section, a three-dimensional geometric model of the goaf is established (Figure 4(a)), with a strike length of 500 m, a dip width of 300 m, and a vertical height of 6.41 m. To represent the O-ring distribution, characterized by a relatively compact central region and well-developed fractures around the margins, two coaxial, concentric elliptical boundaries are constructed in the x–y plane and extruded along the z-axis to form elliptical cylindrical surfaces. The semi-major and semi-minor axes of the inner ellipse are a1 = 87.5 m and b1 = 52.5 m, respectively, and those of the outer ellipse are a2 = 200 m and b2 = 120 m, respectively. On this basis, the goaf is subdivided into a compaction-stabilized zone, a load-affected zone, and a natural accumulation zone, which are collectively referred to as the “three transverse zones.”
Three-dimensional numerical model and mesh discretization of grouting in the goaf: (a) three-dimensional numerical model and (b) mesh discretization.
A short-distance, feather-like, branched borehole pattern is adopted for the layout of the branch boreholes. A 500 m horizontal main borehole is arranged along the strike in the central part of the goaf. Starting from its origin, branch boreholes are successively arranged along the strike at an equal spacing of 50 m, alternating between the left and right sides. Each branch borehole intersects the main borehole at a small angle and is oriented towards the roadways on both sides. In the model, both the main borehole and the branch boreholes are explicitly represented as cylindrical channels with a radius of 0.074 m.
To balance solution accuracy and computational cost, a hybrid meshing strategy is adopted (Figure 4(b)). The goaf is discretized with an unstructured tetrahedral mesh, while the grouting borehole region is meshed by mapping the inlet circular surfaces and sweeping them along the borehole axis to generate structured hexahedral elements. Local refinement is applied near the T-junctions between the main and branch boreholes and near borehole ends to better resolve seepage and pressure gradients. The final model contains 5,045,814 volume elements, 273,058 boundary elements, and 25,282 edge elements.
Initial and boundary conditions
Before grouting, the pores in the goaf are assumed to be completely filled with groundwater and to be in hydrostatic equilibrium. At the elevation Z0 that is connected to the atmosphere, the pore-water pressure is set to 0 MPa (gauge). The initial pore-water pressure then follows the hydrostatic distribution:

To simulate grout injection into the formation under pumping, which displaces groundwater and induces its migration, the opening of the horizontal main borehole along the roadway is taken as the grouting inlet in the model. A prescribed-pressure boundary condition is applied at this inlet, with the grouting pressure set to the actual field grouting pressure. The open-off cut connected to the goaf is taken as the outlet, where a prescribed-pressure boundary condition of 0 MPa (gauge) is imposed to represent free outflow to the atmosphere. All other external boundaries are treated as impermeable (no-flow) boundaries, with the normal flux set to zero. In the simulations, the effects of temporal and spatial variations in temperature and fluid properties are neglected.
In addition, the displacement process of groundwater by the grout is described using the mass fraction concentration. The concentration at the grouting inlet is set to 1 (pure grout), whereas the goaf is initially fully saturated with water, and the concentration in this region is set to 0 (pure water). As the simulation proceeds, the concentration field evolves with time.
Analysis of factors influencing grout diffusion
Response surface methodology (RSM) is an optimization approach that combines designed experiments with mathematical modeling (Jia et al., 2025). Using numerical simulation results, a second-order polynomial regression model was developed in Design-Expert to relate slurry diffusion volume to the key controlling factors. The model enables quantitative evaluation of both individual effects and interaction effects on slurry diffusion volume and provides an explicit regression equation to support the selection and optimization of on-site construction parameters.
Determination of experimental factors and levels
Screening and determination of factors based on a two-level full factorial design
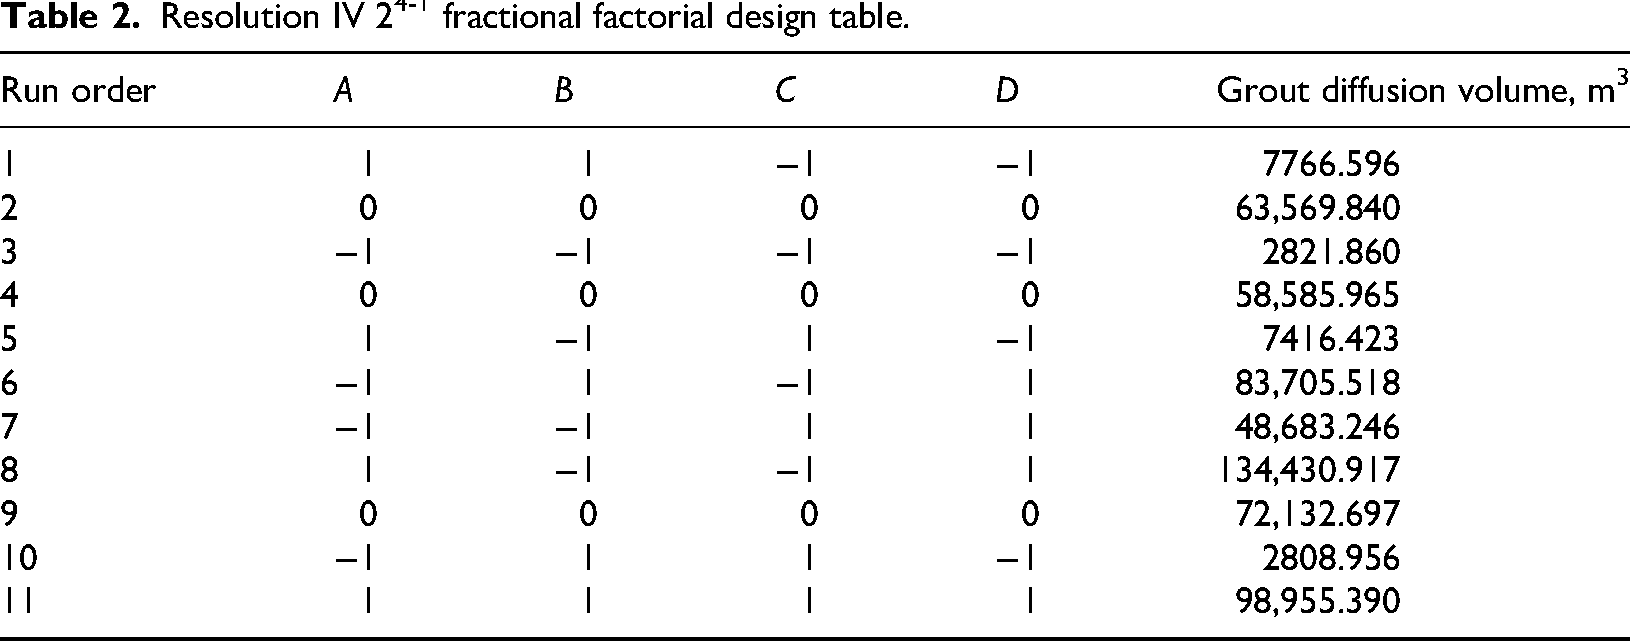
To identify the key factors controlling grout diffusion with a minimal number of experiments prior to RSM, a resolution IV 24-1 fractional factorial design is adopted (Montgomery, 2009). To avoid multicollinearity between porosity and permeability, permeability was retained to represent the porous medium. The investigated factors were grouting pressure (A), slurry density (B), slurry dynamic viscosity (C), and permeability of the porous medium (D). With reference to the actual engineering parameters of the study area, each factor was set at two levels (Table 1). Table 2 presents the resolution IV 24-1 fractional factorial design and the corresponding experimental results.
Investigated factors and their levels.
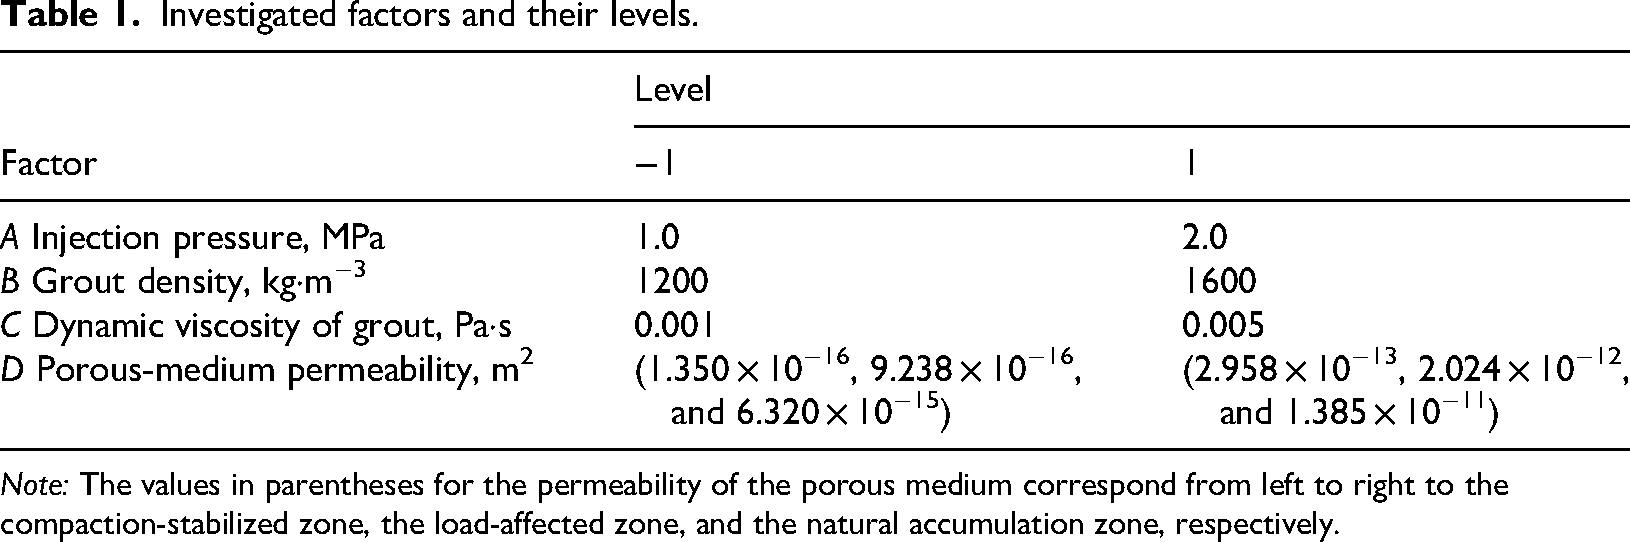
Note: The values in parentheses for the permeability of the porous medium correspond from left to right to the compaction-stabilized zone, the load-affected zone, and the natural accumulation zone, respectively.
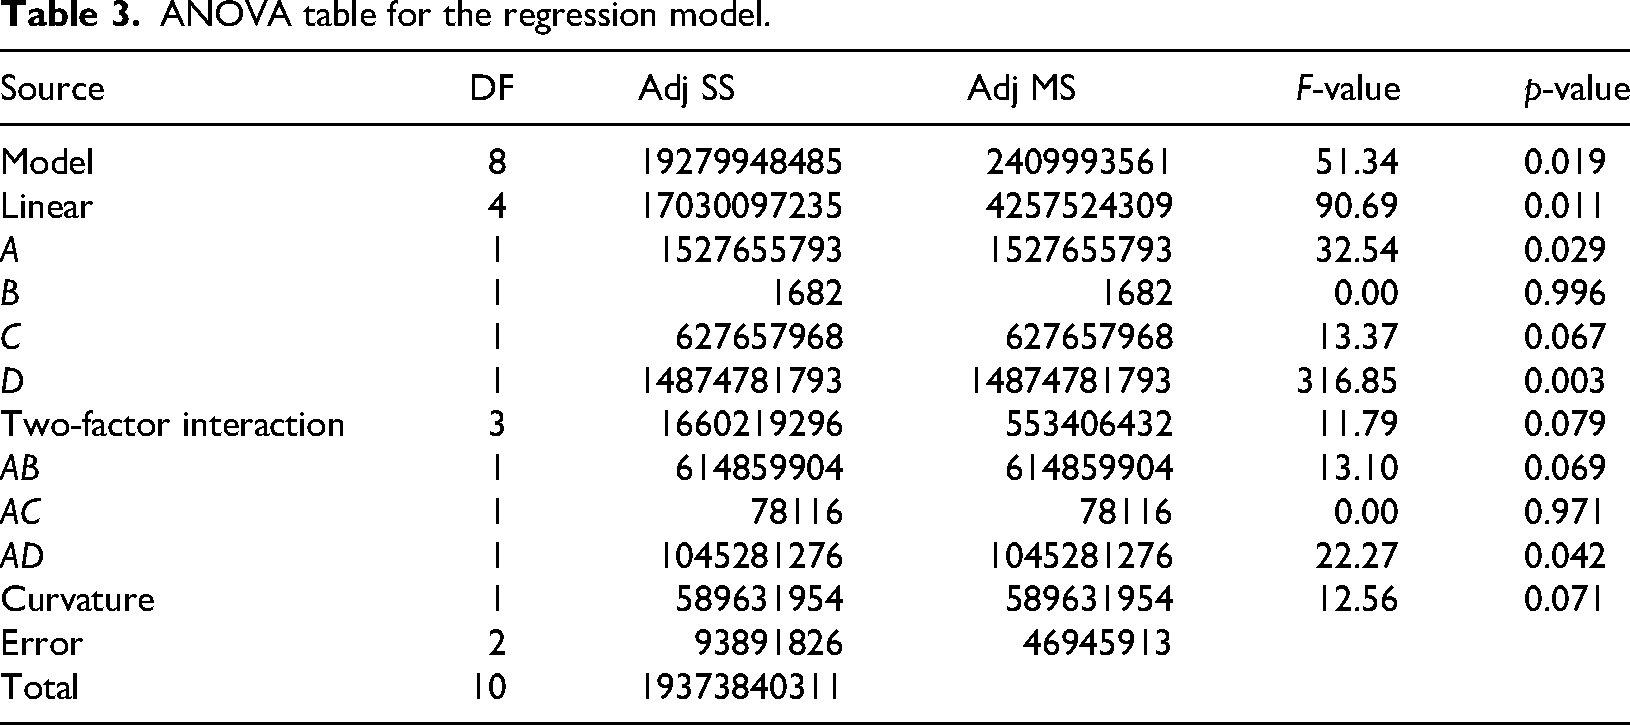
Grout diffusion volume is selected as the response variable. The ANOVA results (Table 3) indicate that the overall model is significant (p = 0.019 < 0.05). Among the main effects, porous-medium permeability (p = 0.003 < 0.05) and injection pressure (p = 0.029 < 0.05) are significant. The p-value for grout dynamic viscosity is 0.067, slightly above 0.05, but its relatively large F-value indicates a non-negligible effect on the response. In contrast, grout density is not significant (p = 0.996 > 0.05) and can be neglected. Therefore, injection pressure (X1), grout dynamic viscosity (X2), and porous-medium permeability (X3) are selected as the main controlling factors for subsequent RSM.
Resolution IV 24-1 fractional factorial design table.
ANOVA table for the regression model.
Determination of factor levels based on the steepest ascent experiment
After the main controlling factors are determined, the method of steepest ascent is employed to optimize the factor levels, so as to rapidly approach the region of maximum response and to reasonably locate the center point of the subsequent response surface design. The duration of a single simulation is set to 5 h. Based on the relative magnitudes and signs of the regression coefficients of each factor, the step sizes and directions of change are determined, thereby defining the experimental path along the direction of steepest ascent. In all steepest ascent experiments, the grout density is fixed at 1400 kg·m−3. The step size is gradually increased along this path. When the response no longer increases significantly or begins to decrease, the region of maximum response is considered to have been reached or approached. An experimental point near this region is then selected as the center point for the subsequent response surface design. The corresponding steepest ascent experimental design is shown in Table 4.
Steepest ascent experimental scheme.
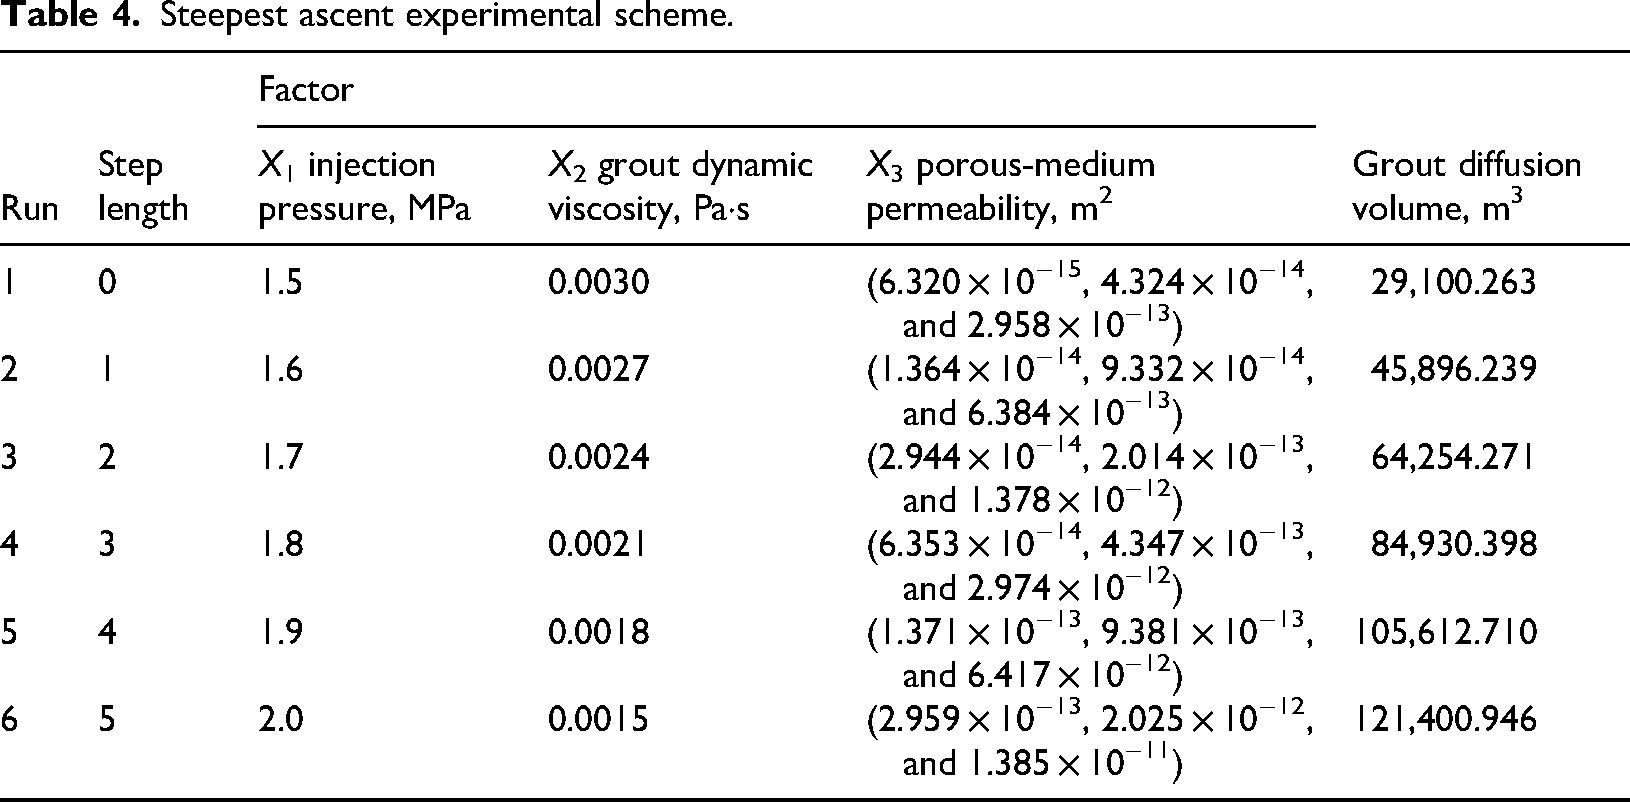
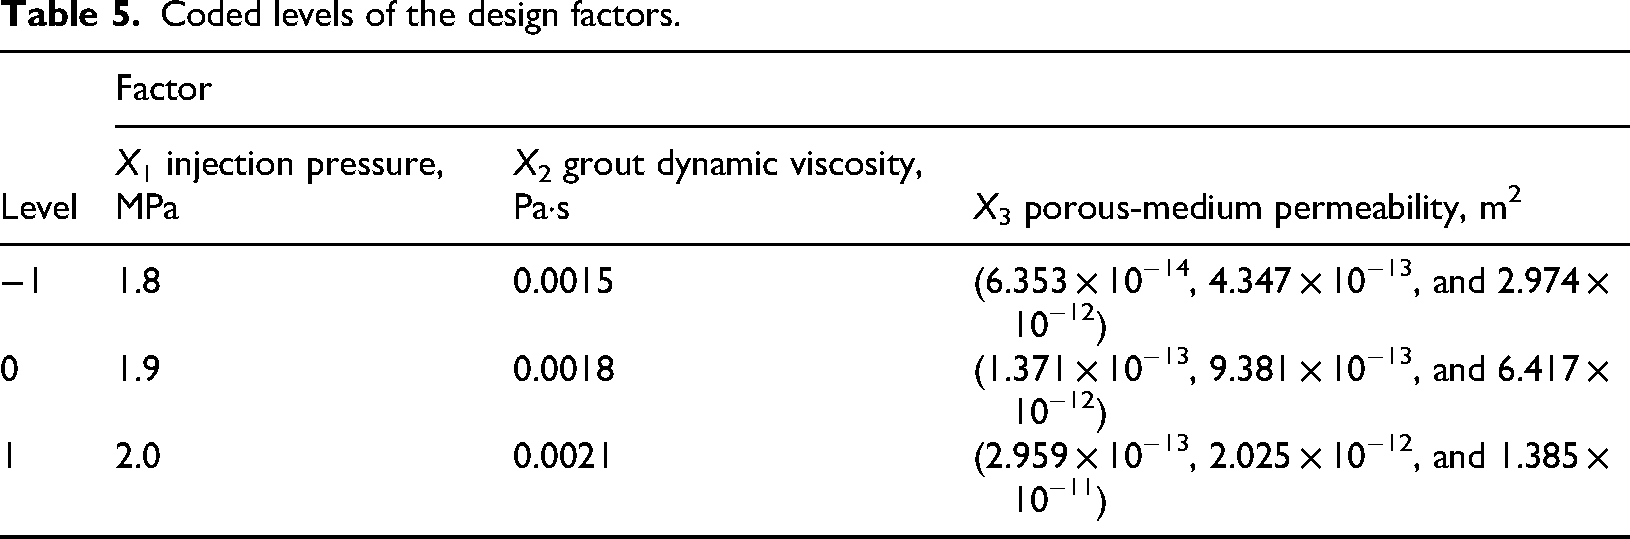
According to Table 4, along the direction of steepest ascent, the grout diffusion volume at each experimental point increases monotonically with step length, whereas the growth rate between adjacent experiments gradually decreases from 57.72% to 14.95%, exhibiting a clear downward trend. Notably, the increment in diffusion volume between the fifth and sixth runs decreases relative to the previous increment, indicating that the experiments have entered a region of diminishing returns. Considering both grout diffusion volume and its growth rate, as well as the engineering feasibility of parameters such as injection pressure and grout dynamic viscosity, this study selects the fifth run in the steepest ascent experiment (X1 = 1.9 MPa, X2 = 0.0018 Pa·s, X3 = (1.371 × 10⁻¹³, 9.381 × 10⁻¹³, 6.417 × 10⁻¹²)) as the center point of the factor levels in the response surface design. Taking this center point as a reference, one level above and one level below it is set for each factor, and these levels together define the factor settings of the response surface experiment. The correspondence between the factor levels and their coded values is given in Table 5.
Coded levels of the design factors.
Response surface experimental design
Based on the selected experimental factors and their level ranges, Design-Expert software is used in this study to design a three-factor, three-level response surface experiment according to the BBD principle, with grout diffusion volume as the response variable. The numerical simulation contour plots of grout volume fraction are shown in Figure 5, and the response surface design and the corresponding results are given in Table 6.

Contour plots of grout volume fraction.
Response surface experimental design and results.
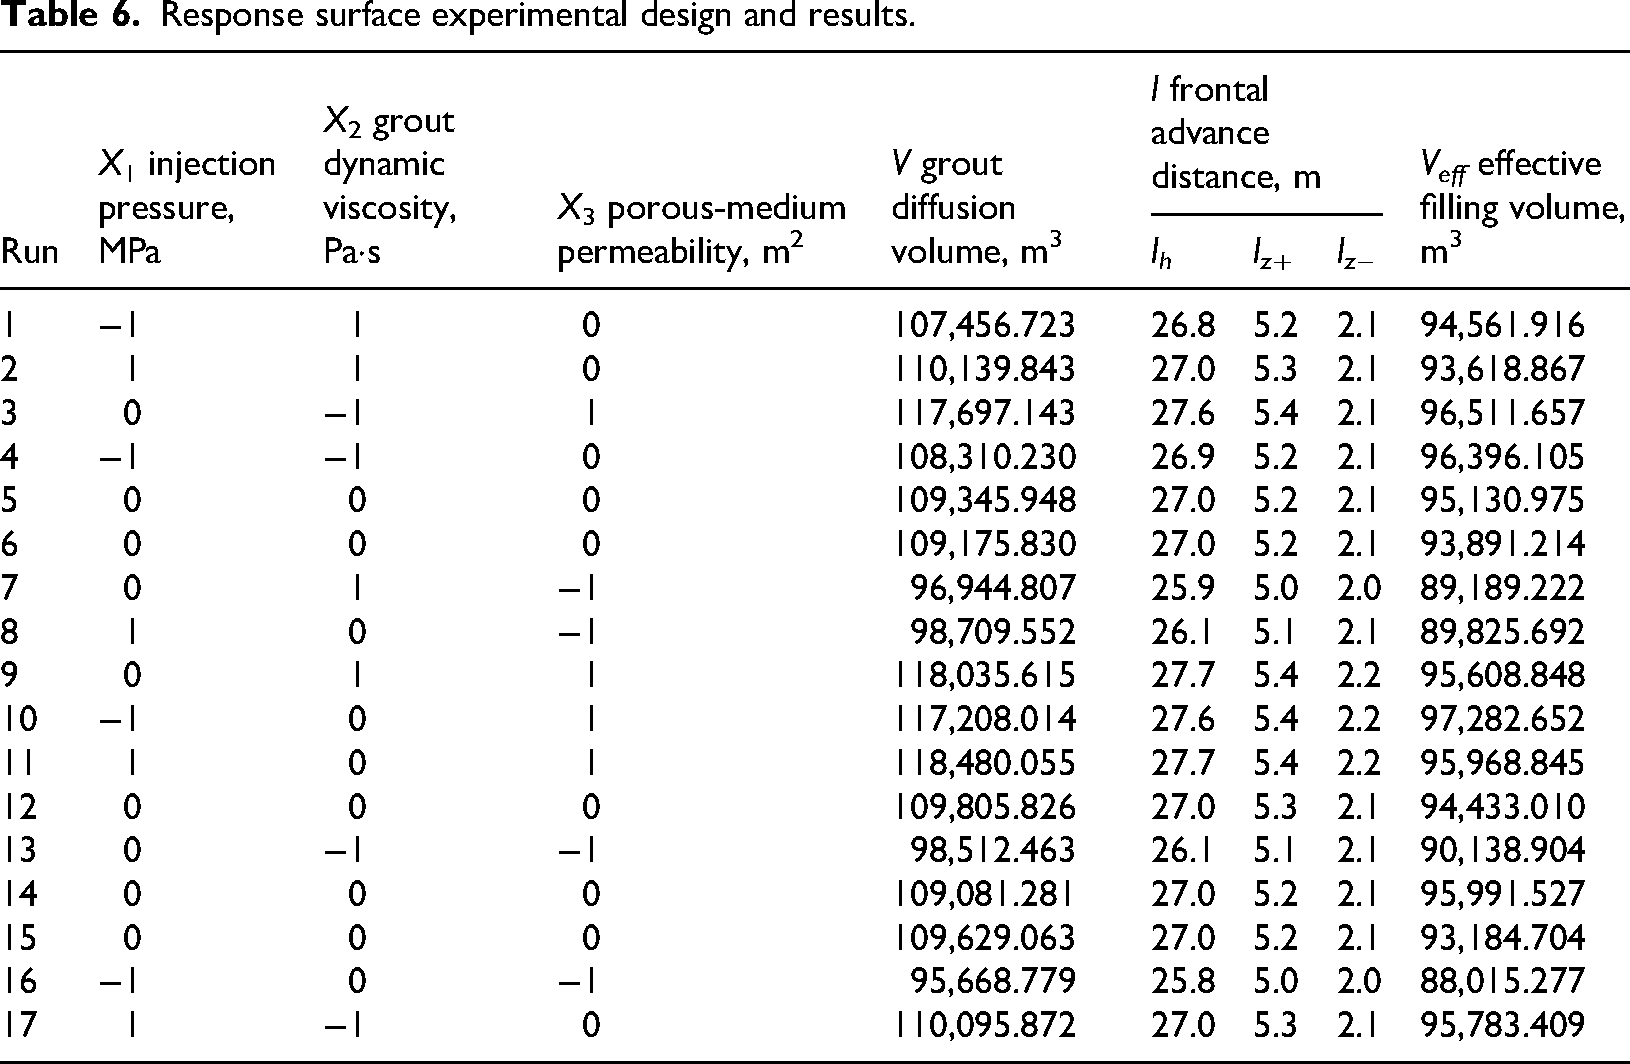
Figure 5 illustrates the stage-wise evolution of slurry diffusion in the goaf. To quantitatively characterize the diffusion process, the diffusion boundary is identified from the slurry volume-fraction field. The centroid of the outlet cross-section of the first branch borehole, r0 = (x0, y0, z0), is selected as the reference point. Taking S2 ≥ S* 2 as the criterion for effective filling, the propagation distance of the slurry front in each direction is defined as follows:
The effective filling volume can be defined as follows:
The results in Table 6 indicate that, within the parameter ranges considered in this study, the horizontal diffusion distance of grout exceeds 25 m, the vertical upward diffusion distance exceeds 5 m, and the vertical downward diffusion distance exceeds 2 m. This variation is primarily governed by the combined effects of the “three-zone” structure of the goaf and the pressure-decay pattern along the injection path. During the initial grouting phase, the pronounced pressure gradient near the main-borehole inlet causes the grout to infiltrate preferentially into the naturally accumulated zone and the load-affected zone, which exhibit higher permeability and better connectivity. In contrast, the compacted stable zone has lower permeability, which significantly impedes grout migration. As grouting continues, flow resistance along the main borehole gradually increases, leading to a decrease in grouting pressure at branch holes farther from the inlet. Consequently, the grout diffusion distance shows a characteristic stepwise reduction along the main-borehole direction (Figure 5). Furthermore, preferential pathways such as fractures enhance grout migration both horizontally and upward, resulting in asymmetric diffusion: the horizontal diffusion distance is much greater than the vertical diffusion distance, and upward diffusion is stronger than downward diffusion.
The comparison of Veff values in Table 6 indicates that an increased slurry diffusion range does not necessarily improve the effective filling rate. Taking runs 11 and 16 as examples, run 11 exhibits a larger diffusion range but a lower effective filling rate. This indicates that under heterogeneous “three-zone” structural conditions, dominant pathways may expand the slurry's reachability while potentially diminishing its substantive contribution to filling low-permeability zones, leading to a separation between “reachability” and “effectiveness.” Therefore, when maximizing slurry diffusion volume is the optimization objective, effective filling rate should be treated as a constraint condition.
Analysis of variance
Based on the response surface experimental results, a quadratic polynomial regression is performed for injection pressure (X1), grout dynamic viscosity (X2), and porous-medium permeability (X3), yielding the following quadratic polynomial regression equation for grout diffusion volume (V): V = −1.49794 × 10⁵ + 1.53280 × 105X1 − 2.15479 × 107X2 + 7.86964 × 1015X3 + 7.47898 × 106X1X2 − 1.04535 × 1015X1X3 + 3.75518 × 1017X2X3 − 34391.48
The ANOVA results (Table 7) show that the model has an F-value of 1253.71 and a p-value <0.0001, indicating that it is statistically highly significant and that the fitted quadratic regression model provides a good description of the relationship between the factors and grout diffusion volume. The lack-of-fit term is not significant (F = 0.5696, p = 0.6641 > 0.05), indicating that the residuals mainly arise from experimental pure error and that the model structure is reasonable. The model has R2 = 0.9994, adjusted R2 = 0.9986, predicted R2 = 0.9964, and an Adeq Precision of 107.01 (>4), indicating high goodness of fit, strong predictive ability, and a good signal-to-noise ratio. Therefore, the model can be used to optimize the experimental conditions.
ANOVA table for the regression model.
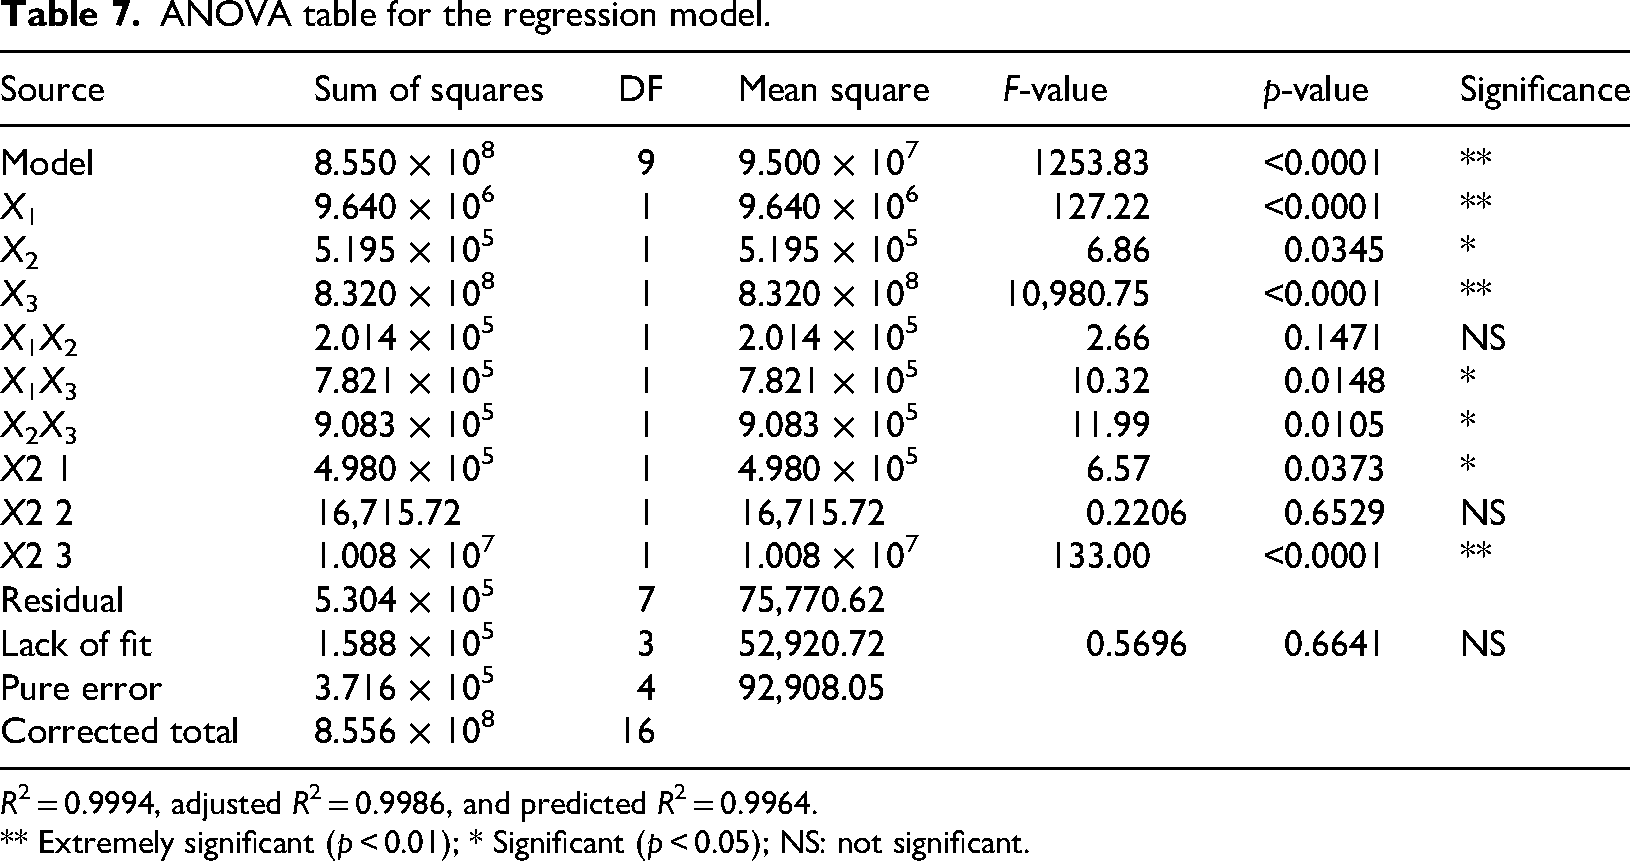
R2 = 0.9994, adjusted R2 = 0.9986, and predicted R2 = 0.9964.
** Extremely significant (p < 0.01); * Significant (p < 0.05); NS: not significant.
Among the main-effect terms, the influence of porous-medium permeability on grout diffusion volume is statistically highly significant (F = 10,980.75, p < 0.0001), and it is the dominant factor controlling grout diffusion. The influence of injection pressure is likewise statistically highly significant (F = 127.22, p < 0.0001). The effect of grout dynamic viscosity is significant (F = 5.82, p = 0.0466), but its influence is clearly weaker than that of porous-medium permeability and injection pressure and can therefore be regarded as a secondary factor. Therefore, under the experimental conditions of this study, the factors influencing grout diffusion volume can be ranked in descending order of importance as porous-medium permeability > injection pressure > grout dynamic viscosity.
Among the quadratic terms, the effects of X
In summary, the diffusion volume of grout is primarily governed by the permeability of the porous medium. This conclusion aligns with the diffusion-path selection mechanism dominated by permeability heterogeneity arising from the “three-zone” structure of the goaf. However, permeability is an intrinsic property of the porous medium and thus largely uncontrollable. Moreover, interaction analysis indicates that the effects of grouting pressure and slurry dynamic viscosity on diffusion volume are strongly permeability-dependent: at different permeability levels, the marginal effect of the same change in pressure or viscosity varies. Therefore, optimizing grouting parameters hinges on achieving synergistic matching among controllable variables under a given permeability condition. While ensuring adequate reachability, it is essential to limit excessive grout preferential flow through dominant pathways and increase penetration into low-permeability zones, thereby balancing diffusion coverage and filling efficiency.
Analysis of response surface interactions
Figure 6(a) to (c) shows that, within the range of parameters considered in this study, grout diffusion volume increases significantly with increasing injection pressure and porous-medium permeability, and decreases monotonically with increasing grout dynamic viscosity. No internal extremum is observed, indicating that the optimal parameter combination lies on the side of high injection pressure, low grout viscosity, and high porous-medium permeability. Figure 6(a) shows that injection pressure is positively correlated with grout diffusion volume, whereas an increase in grout dynamic viscosity suppresses diffusion. The contour lines are essentially parallel, indicating that the X1X2 interaction is weak. Figure 6(b) shows that both injection pressure and porous-medium permeability promote an increase in diffusion volume, but the effect of porous-medium permeability is much stronger than that of injection pressure. The contour lines are slightly curved, reflecting a noticeable X1X3 interaction. Figure 6(c) shows that an increase in porous-medium permeability markedly increases diffusion volume, whereas an increase in grout dynamic viscosity reduces it. The X2X3 interaction is mainly manifested in the fact that the influence of porous-medium permeability on grout diffusion differs under different levels of grout dynamic viscosity. In summary, porous-medium permeability is the dominant factor controlling grout diffusion, injection pressure is secondary, and grout dynamic viscosity acts as an inhibiting factor with a relatively weak influence.

Response surface and contour plots of the interaction effects of factors on grout diffusion volume: (a) injection pressure and grout dynamic viscosity, (b) injection pressure and porosity of the porous medium, and (c) grout dynamic viscosity and porosity of the porous medium.
Parameter optimization and validation
Based on optimization of the experimental data, the optimal grouting parameters for the coal mine goaf were an injection pressure of 2 MPa and a grout dynamic viscosity of 0.0015 Pa·s. The porous-medium permeabilities in the compaction-stabilized, load-affected, and natural-accumulation zones were 2.959 × 10⁻¹³, 2.025 × 10⁻¹², and 1.385 × 10⁻¹¹ m2, respectively. With this parameter set, the regression model predicted a grout diffusion volume of 118,753.272 m3.
Engineering application
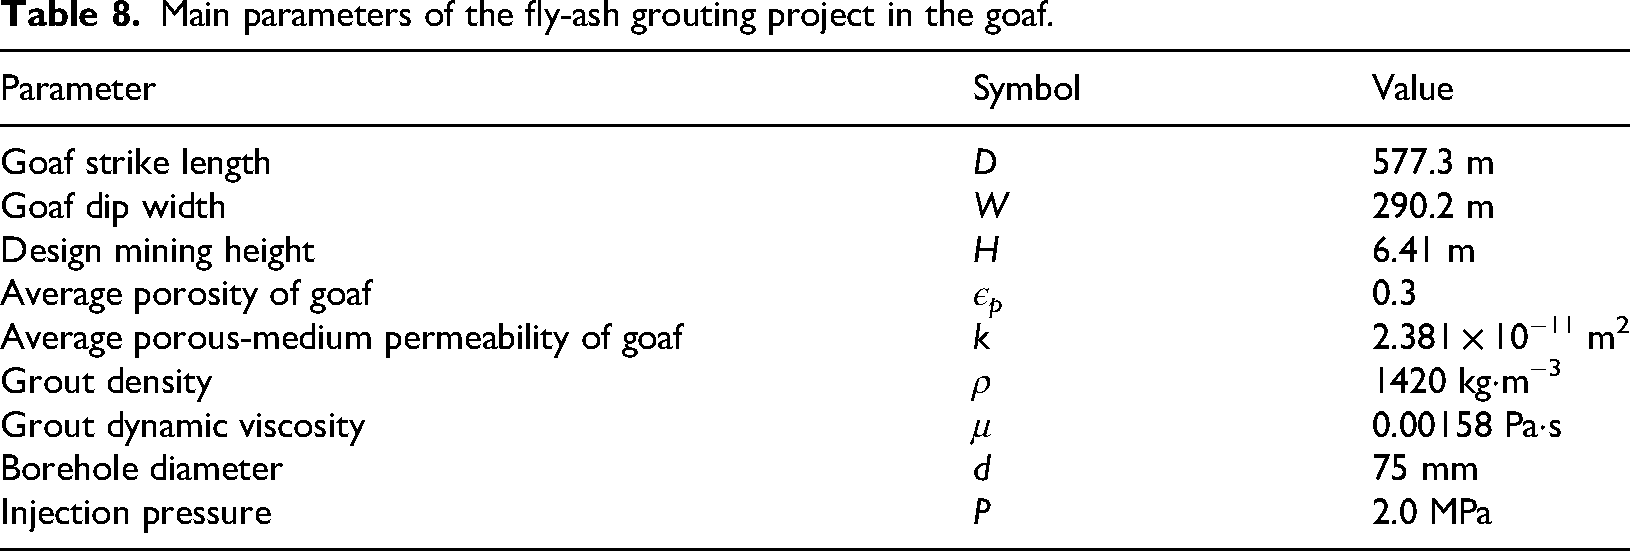
A mine in Shaanxi Province uses long-distance pipeline transport of fly-ash grout to fill the goaf of the working face. Because the conveying distance is long and the fly-ash grout has fine particles and a high water–ash ratio, stratification, segregation, and locally loose filling are likely to occur during transport, thereby impairing the filling performance. Therefore, in combination with the actual operating conditions of the fly-ash grouting and filling project in the goaf of this mine, several key engineering parameters that affect grout filling performance have been identified, as shown in Table 8.
Main parameters of the fly-ash grouting project in the goaf.
At present, no consensus has been reached on methods for predicting grout diffusion range, and the layout of grouting boreholes in engineering practice still lacks a reliable theoretical basis. Therefore, on the basis of the grout diffusion distance prediction model established in this study, the borehole layout for this project is optimized.
By substituting an injection pressure P = 2.0 MPa, grout dynamic viscosity μ = 0.00158 Pa·s, and goaf permeability k = 2.381 × 10⁻¹¹ m2 into the quadratic polynomial regression equation for grout diffusion volume, the predicted grout diffusion volume is V = 109,746.43 m3. The corresponding horizontal, upward vertical, and downward vertical diffusion distances are lh = 27.0 m, lz+ = 5.3 m, and lz− = 2.1 m, respectively. Accordingly, the theoretical limiting control radius of grout diffusion in the goaf is 27 m, implying a theoretical limiting spacing of 54 m between branch boreholes.
The flow of fly-ash grout in the grouting borehole is predominantly laminar, and the pressure drop ΔP along the borehole follows the Hagen–Poiseuille law:
According to equation (16), the pressure drop increases approximately linearly with the conveying length L. When the main borehole length is L = 550 m and the borehole diameter is d = 75 mm, maintaining the theoretical limiting spacing of the branch boreholes would lead to a substantial reduction in the pressure at the branch-borehole openings and in the effective grout diffusion radius ahead of them. Taking into account both the along-hole pressure drops in the main borehole and the spatial heterogeneity of porosity and permeability in the goaf, the theoretical limiting spacing 2h1 must therefore be reduced. To account for these uncertainties and to achieve a conservative design, a safety factor η is introduced for the borehole spacing. In this study, a conservative value of η = 0.75 is adopted, so that the reasonable spacing of branch boreholes is taken as follows:
With this reduction, the theoretical limiting spacing between boreholes is decreased by about 25% while still ensuring a moderate overlap between the seepage ranges of grout from adjacent branch boreholes. This helps to alleviate the adverse effects of along-hole attenuation of injection pressure and uncertainties in the porosity-permeability parameters. Accordingly, the borehole spacing for the fly-ash grouting and filling project in the goaf of a mine in Shaanxi is designed to be 40 m, and the borehole locations are shown in Figure 7.
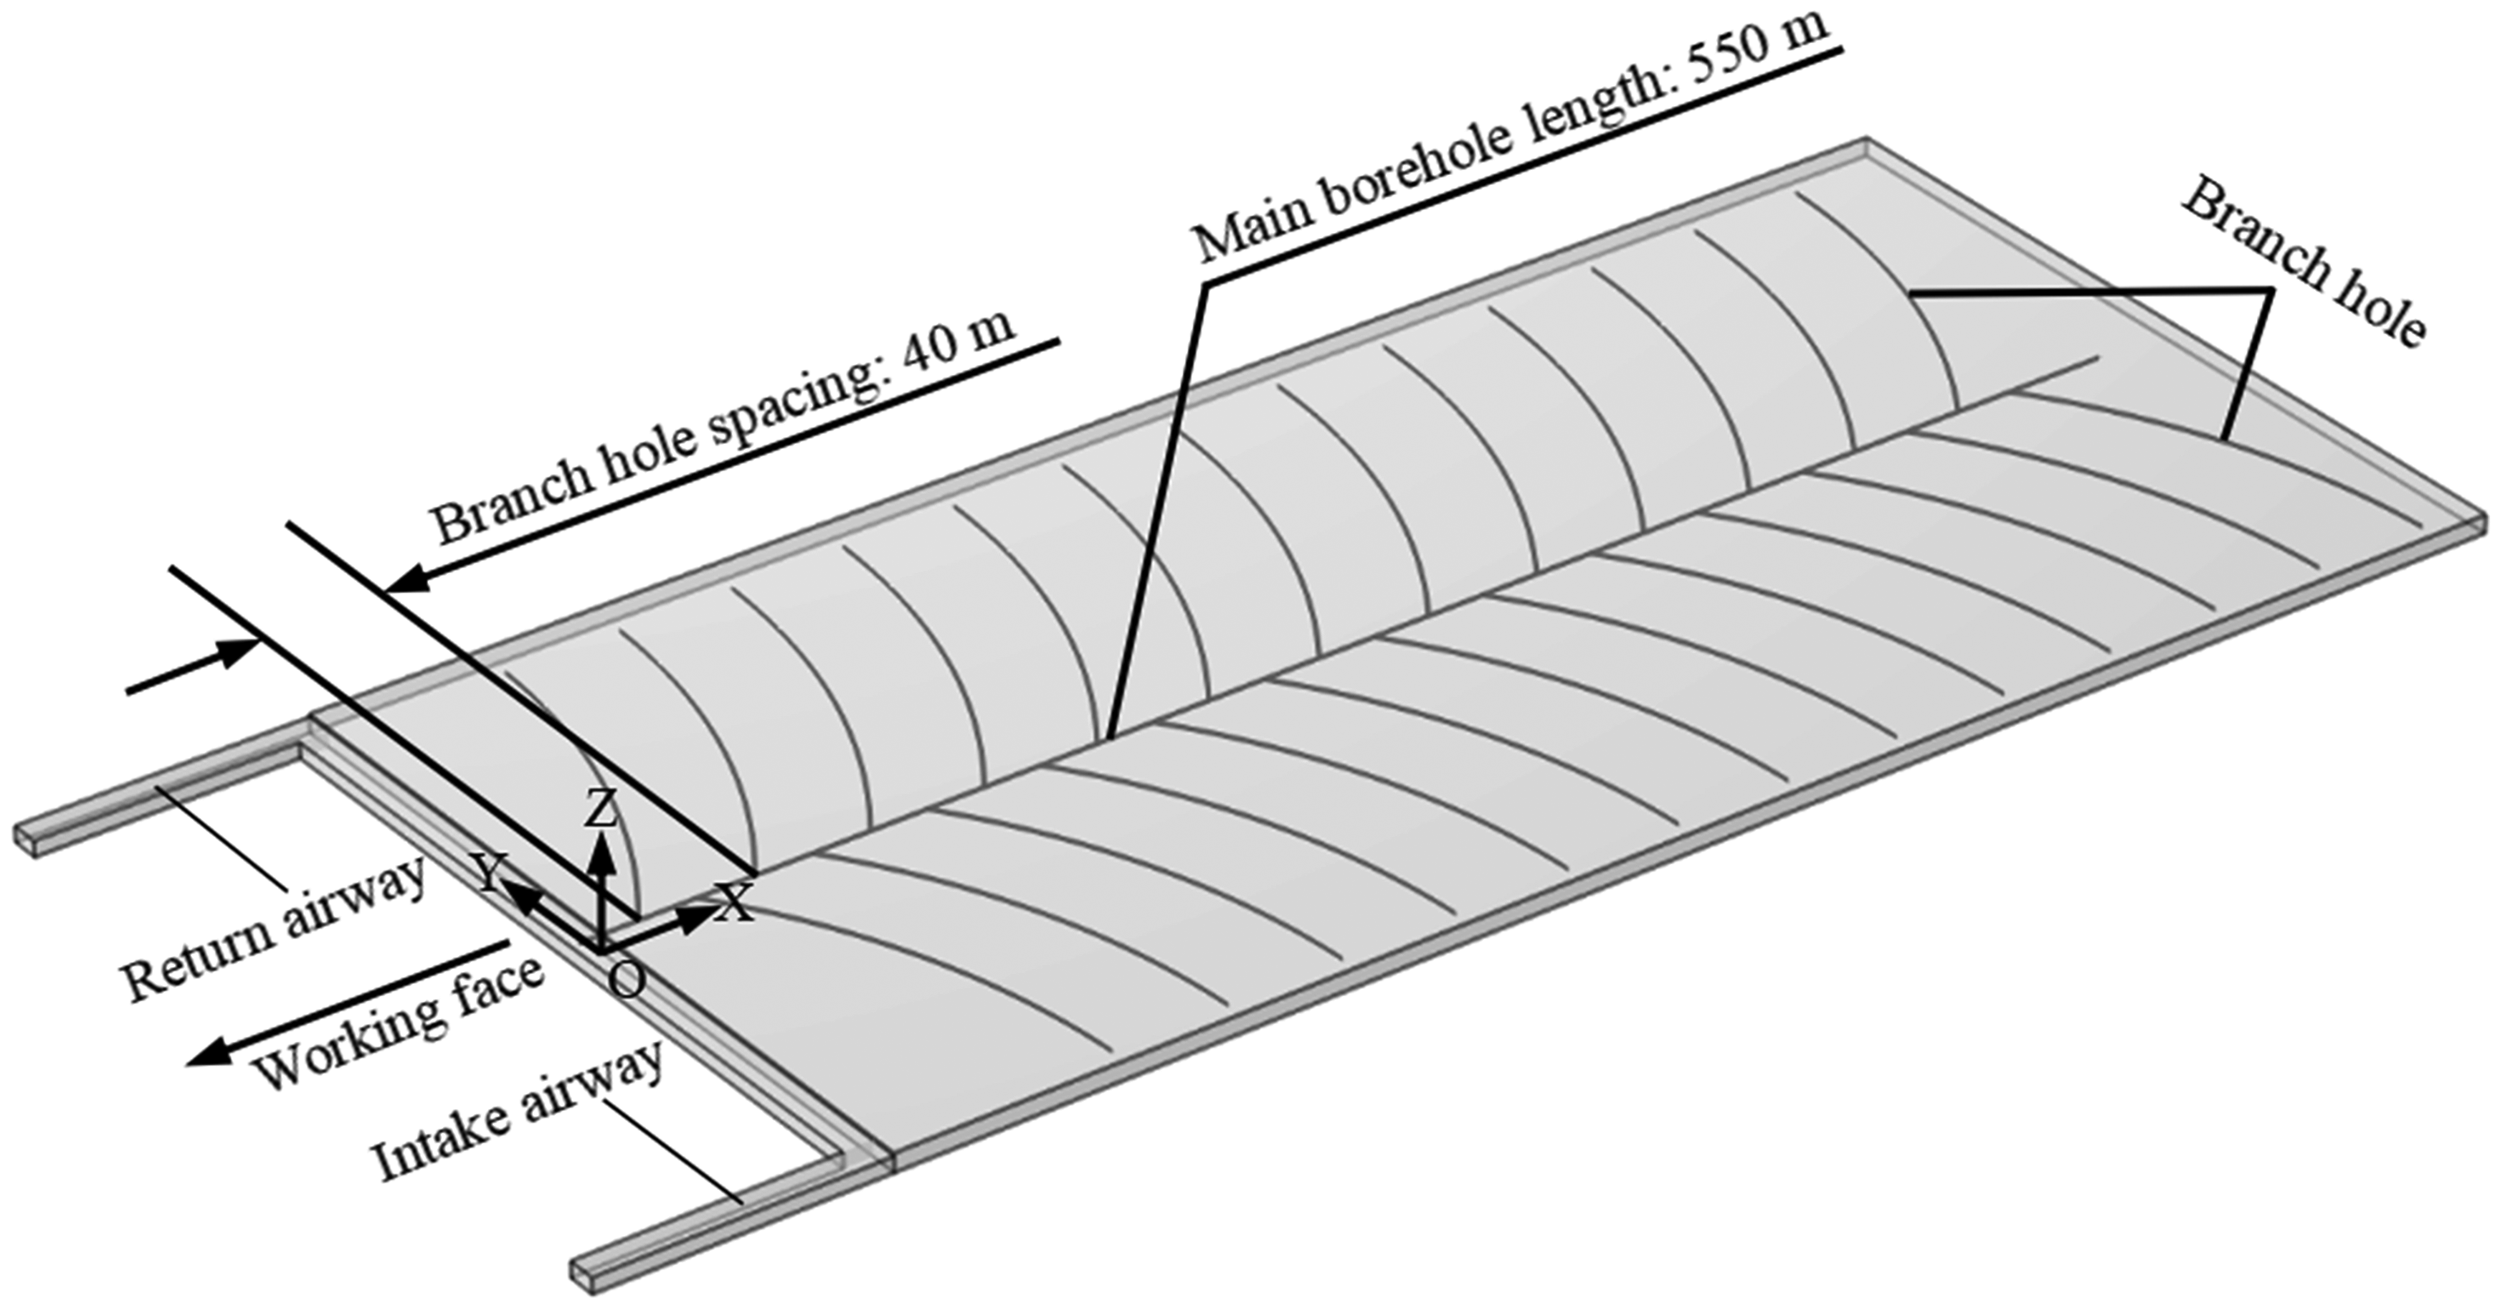
Borehole design for fly-ash grouting backfill in the goaf of a coal mine in Shaanxi Province.
In situ 3D laser scanning and borehole-camera observations in the 85209-1 goaf indicate that the solid phase of the fly-ash slurry accumulated predominantly between 100 and 130 m along the goaf. Using the measured goaf geometry, the numerically predicted diffusion volume yields a characteristic diffusion length of 102 m. Taking the onset of continuous solid-phase accumulation (∼100 m) as the field-effective diffusion length, the relative deviation is about 2%, indicating quantitative agreement at the field scale. This agreement supports the reasonableness of the model-based borehole-spacing design (40 m, including a conservative safety factor) for achieving the target coverage in the studied goaf.
Conclusions
The 3D spatial distribution of porosity and permeability in deep coal-mine goafs exhibits an O-ring pattern, with lower values in the central zone and higher values near the margins, suggesting that grout preferentially forms dominant seepage channels along the goaf perimeter.
Numerical simulation indicates that grout diffusion in deep goaf exhibits significant asymmetry, with diffusion distances exceeding 25 m horizontally, 5 m upward, and 2 m downward. Branch hole spacing should be less than twice the numerically validated effective horizontal diffusion radius, with ∼25%–50% overlap reserved during planar hole layout to ensure closure of adjacent branch hole coverage zones.
RSM indicates that slurry diffusion volume increases with injection pressure and porous-medium permeability, but decreases with slurry dynamic viscosity. Porous-medium permeability plays a dominant role in determining slurry diffusion volume, directly influencing diffusion characteristics and effectiveness. Based on this, a quadratic polynomial regression model was developed for rapid prediction and parameter optimization, validated in the fly ash grouting backfill project design for a goaf in a Shaanxi coal mine.
Footnotes
Acknowledgements
The authors thank the engineering team of the 85209 working face for their assistance with field measurements and grouting tests. The authors also appreciate the constructive discussions and support provided by colleagues involved in this research.
Ethical considerations
Not applicable. This study did not involve human participants, human data, or human tissue.
Consent to participate
Not applicable.
Consent to publication
Not applicable.
Funding
The authors disclosed receipt of the following financial support for the research, authorship, and/or publication of this article: This research was supported by the National Key Research and Development Program of China (No. 2022YFB4102105), the National Natural Science Foundation of China (No. 51704158), and the Natural Science Foundation of Hebei Province (No. D202540205).
Declaration of conflicting interests
The authors declared no potential conflicts of interest with respect to the research, authorship, and/or publication of this article.
Data availability statement
The datasets generated and/or analyzed during the present study are not publicly available due to confidentiality agreements with the mine operator, but are available from the corresponding author on reasonable request.