
Abstract
Failure and instability of inclined rock–coal–rock composite structures (IRCRS) are critical contributing factors to impact-induced mining disasters, particularly in scoured coal seams. This study utilizes the UDEC numerical modeling approach to investigate the failure mechanisms of IRCRS. Systematically analyzing the failure and instability modes, associated characteristics, and the influence of various parameters. The primary findings are as follows: (1) The failure and instability modes of IRCRS can be classified into three distinct types: Fragmentation instability (FI), single contact surface slip and fragmentation instability (SSI), and double contact surface slip and fragmentation instability (DSI). (2) Although the peak strength of FI exceeds that of slip-induced instability, the extent of fracture damage is more severe during slip instability. In such cases, the composite structures exhibit a characteristic “low stress and high energy release” behavior. (3) As the inclination angle of the contact surfaces, surface roughness, and the mechanical strength of the coal and rock increase, the propensity for slip instability rises, the degree of fracturing diminishes, and the peak stress required to trigger structural failure decreases. These findings contribute to a deeper understanding of failure processes in scoured coal seam mining environments and provide a theoretical foundation for preventing rockburst disasters caused by structural instability.
Keywords
Introduction
During the formation of coal seams, rivers may erode and remove coal material, resulting in localized thinning of the seam and the development of scoured zones characterized by anomalous variations in coal seam thickness and dip angle (Sun et al., 2021; Liu et al., 2018). Notably, the scoured zones are typically featured with a tripartite “roof–coal–floor” structure, where both the roof–coal and coal–floor interfaces tend to form inclined contact surfaces due to uneven erosion (Rong et al., 2022; Zhang et al., 2025). This unique dual inclined contact surface configuration induces significant asymmetry in the coal–rock composite structure, which fundamentally alters its mechanical response and instability behaviors compared to stable coal seams with horizontal or single inclined interfaces (Yin et al., 2024). Given that such asymmetric instability is a major trigger for impact-induced mining disasters in scoured zones, investigating the failure mechanisms, instability characteristics, and key influencing parameters of inclined rock–coal–rock composite structures (IRCRS) is therefore critical for ensuring mining safety in these geologically complex areas.
To address the challenges associated with coal–rock composite structures, scholars worldwide have conducted extensive laboratory investigations focusing on their mechanical properties, contact surface characteristics, and acoustic emission behaviors (Wang et al., 2023; Gao et al., 2025; Liu et al., 2018). Early foundational research by Petukhov and Linkov (1979) proposed a composite structural system consisting of roof and coal, laying a theoretical basis for stability analysis of such structures. Subsequent laboratory studies have explored the effects of various single factors on composite structures. Chen et al. (2017) examined the influence of rock–coal height ratio on mechanical properties and failure mechanisms via uniaxial compression tests. Bai et al. (2019) investigated failure characteristics of different coal–rock composite samples through laboratory simulations of uniaxial compression. Ma et al. (2020) analyzed energy evolution by varying coal seam thickness in uniaxial compression tests. Huang and Liu (2013) explored the effect of loading rate on the mechanical behaviors of single rock, single coal, and composite samples. Other studies have focused on contact surface and rock strength effects. Liu et al. (2015) revealed how rock strength variations affect failure modes through controlled indoor experiments. Wu et al. (2020) conducted physical tests and theoretical derivations on rock–coal–anchor composites with different contact surface angles, finding that larger angles enhance cracking tendency (driven by tensile and shear failures) and that anchors effectively constrain crack propagation. Xue et al. (2022) further demonstrated that a higher roof–coal height ratio amplifies acoustic emission signals and increases rock burst risk using high-precision testing devices and acoustic emission systems.
Despite the insights gained from laboratory studies, the inherent heterogeneity of coal–rock materials makes it difficult to prepare composite samples with consistent strength and contact surface properties, limiting the generalizability of experimental results (Tian et al., 2025; Duan et al., 2022; Liu et al., 2021). As a complement, numerical analysis methods have been widely adopted in rock mechanics research with the advancement of computer technology (Gao et al., 2022; Zhang et al., 2024; Xiao et al., 2024). Zhao et al. (2013) employed FLAC3D to simulate roof–coal–floor composites with varying coal thicknesses. Guo et al. (2018) utilized PFC2D to analyze failure characteristics and damage evolution of rock–coal–rock composites under different coal thicknesses and contact angles. Zhao et al. (2019) used RFPA to investigate the effects of coal–rock height, roof strength, and contact angles on impact tendency. Several scholars have utilized the UDEC numerical analysis method to investigate the failure mechanisms of coal and rock masses. Gao et al. (2014) developed an innovative UDEC Trigon approach to simulate the shear failure process of coal mine tunnel roofs. Zhong et al. (2025) conducted a comprehensive study using UDEC numerical simulations to analyze the deformation and failure characteristics of layered rocks, crack evolution processes, and stress transfer mechanisms. Compared with other numerical methods such as PFC2D, FLAC3D, and RFPA, the UDEC technique offers the distinct advantage of explicitly modeling the opening, sliding, and closing behaviors of discontinuities (including joints, bedding planes, and contact surfaces) within rock masses, thereby yielding more direct and accurate research outcomes.
In conclusion, although previous studies have achieved notable progress in understanding the mechanical properties of coal–rock composites, the majority of current research remains focused on simplified models featuring either a single or horizontally oriented contact surface. However, in coal seams influenced by ancient river erosion, a more prevalent configuration is a three-component composite structure (IRCRS) characterized by the roof, coal seam, and floor strata. This distinctive geometric arrangement may significantly alter stress transmission pathways and give rise to a coupled instability mechanism, wherein interfacial slip and coal mass crushing interact competitively. The mechanical behavior of such a structure fundamentally diverges from that of structures with a single or horizontal interface. To date, there remains insufficient systematic insight into how dual-inclined contact surfaces influence the classification of instability modes, strength characteristics, and energy release patterns within the composite system. This knowledge gap hinders a comprehensive understanding of the mechanisms underlying impact-induced ground pressure disasters in scoured zones. Therefore, this study aims to address this gap by investigating the instability characteristics of IRCRS through UDEC numerical analysis, thereby providing theoretical support for impact disaster prevention in scoured coal seam mining.
Model construction
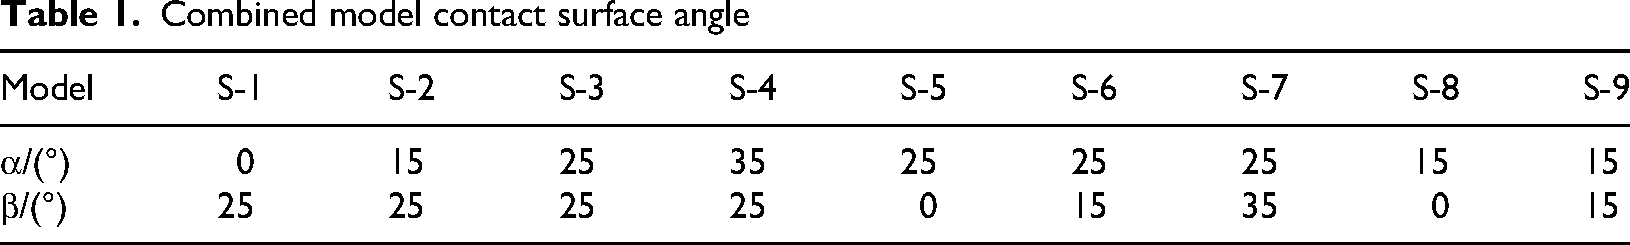
The erosion caused by ancient river systems may undermine the initial structural stability of coal seams, leading to variations in thickness, dip angle, and lateral continuity. These changes present significant challenges to the safe and efficient extraction of coal resources. Based on the geological structural characteristics of eroded coal seams, a three-component composite model comprising the roof, inclined coal seam, and floor was developed using the block discrete element software UDEC, as shown in Figure 1. In accordance with the testing standards of the International Society for Rock Mechanics (ISRM), the dimensions of the composite model are set to a height of 100 mm and a width of 50 mm. The dip angles of the upper and lower contact surfaces of the coal–rock are defined as α and β, respectively, with specific values detailed in Table 1. The specimen was discretized into multiple triangular blocks. The blocks were assigned an isotropic elastic constitutive model, while the joint were simulated using a Coulomb slip model. Rigid loading plates are implemented at both the top and bottom boundaries, with the bottom boundary fixed and horizontal displacement constrained along the top boundary. A constant vertical loading velocity of 0.05 m/s was applied to the top plate (Zhang et al., 2024).

Numerical model of compound sample.
Combined model contact surface angle
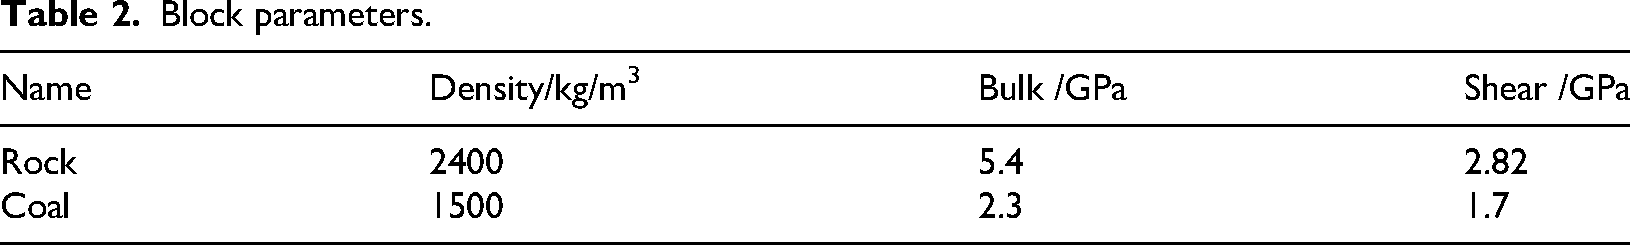
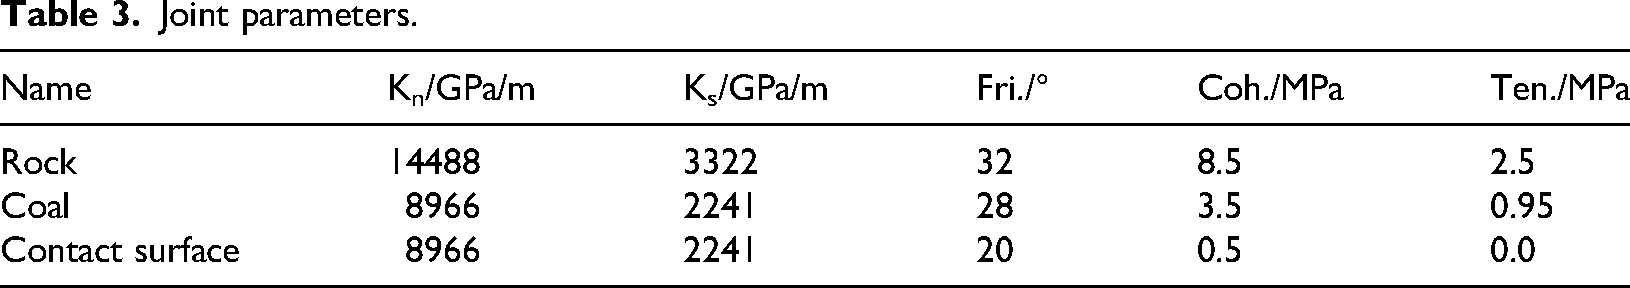
The micro-mechanical parameters required for the UDEC are categorized into two components: those representing the block and those characterizing the joints. These parameter sets cannot be directly determined from laboratory mechanical tests and must therefore be calibrated through an iterative process involving numerical simulations and experimental results. Calibration is primarily based on uniaxial compression and Brazilian splitting tests. The overall calibration procedure is illustrated in Figure 2, and the resulting calibrated micro-mechanical parameters are summarized in Tables 2 and 3 (Zhang et al., 2020).
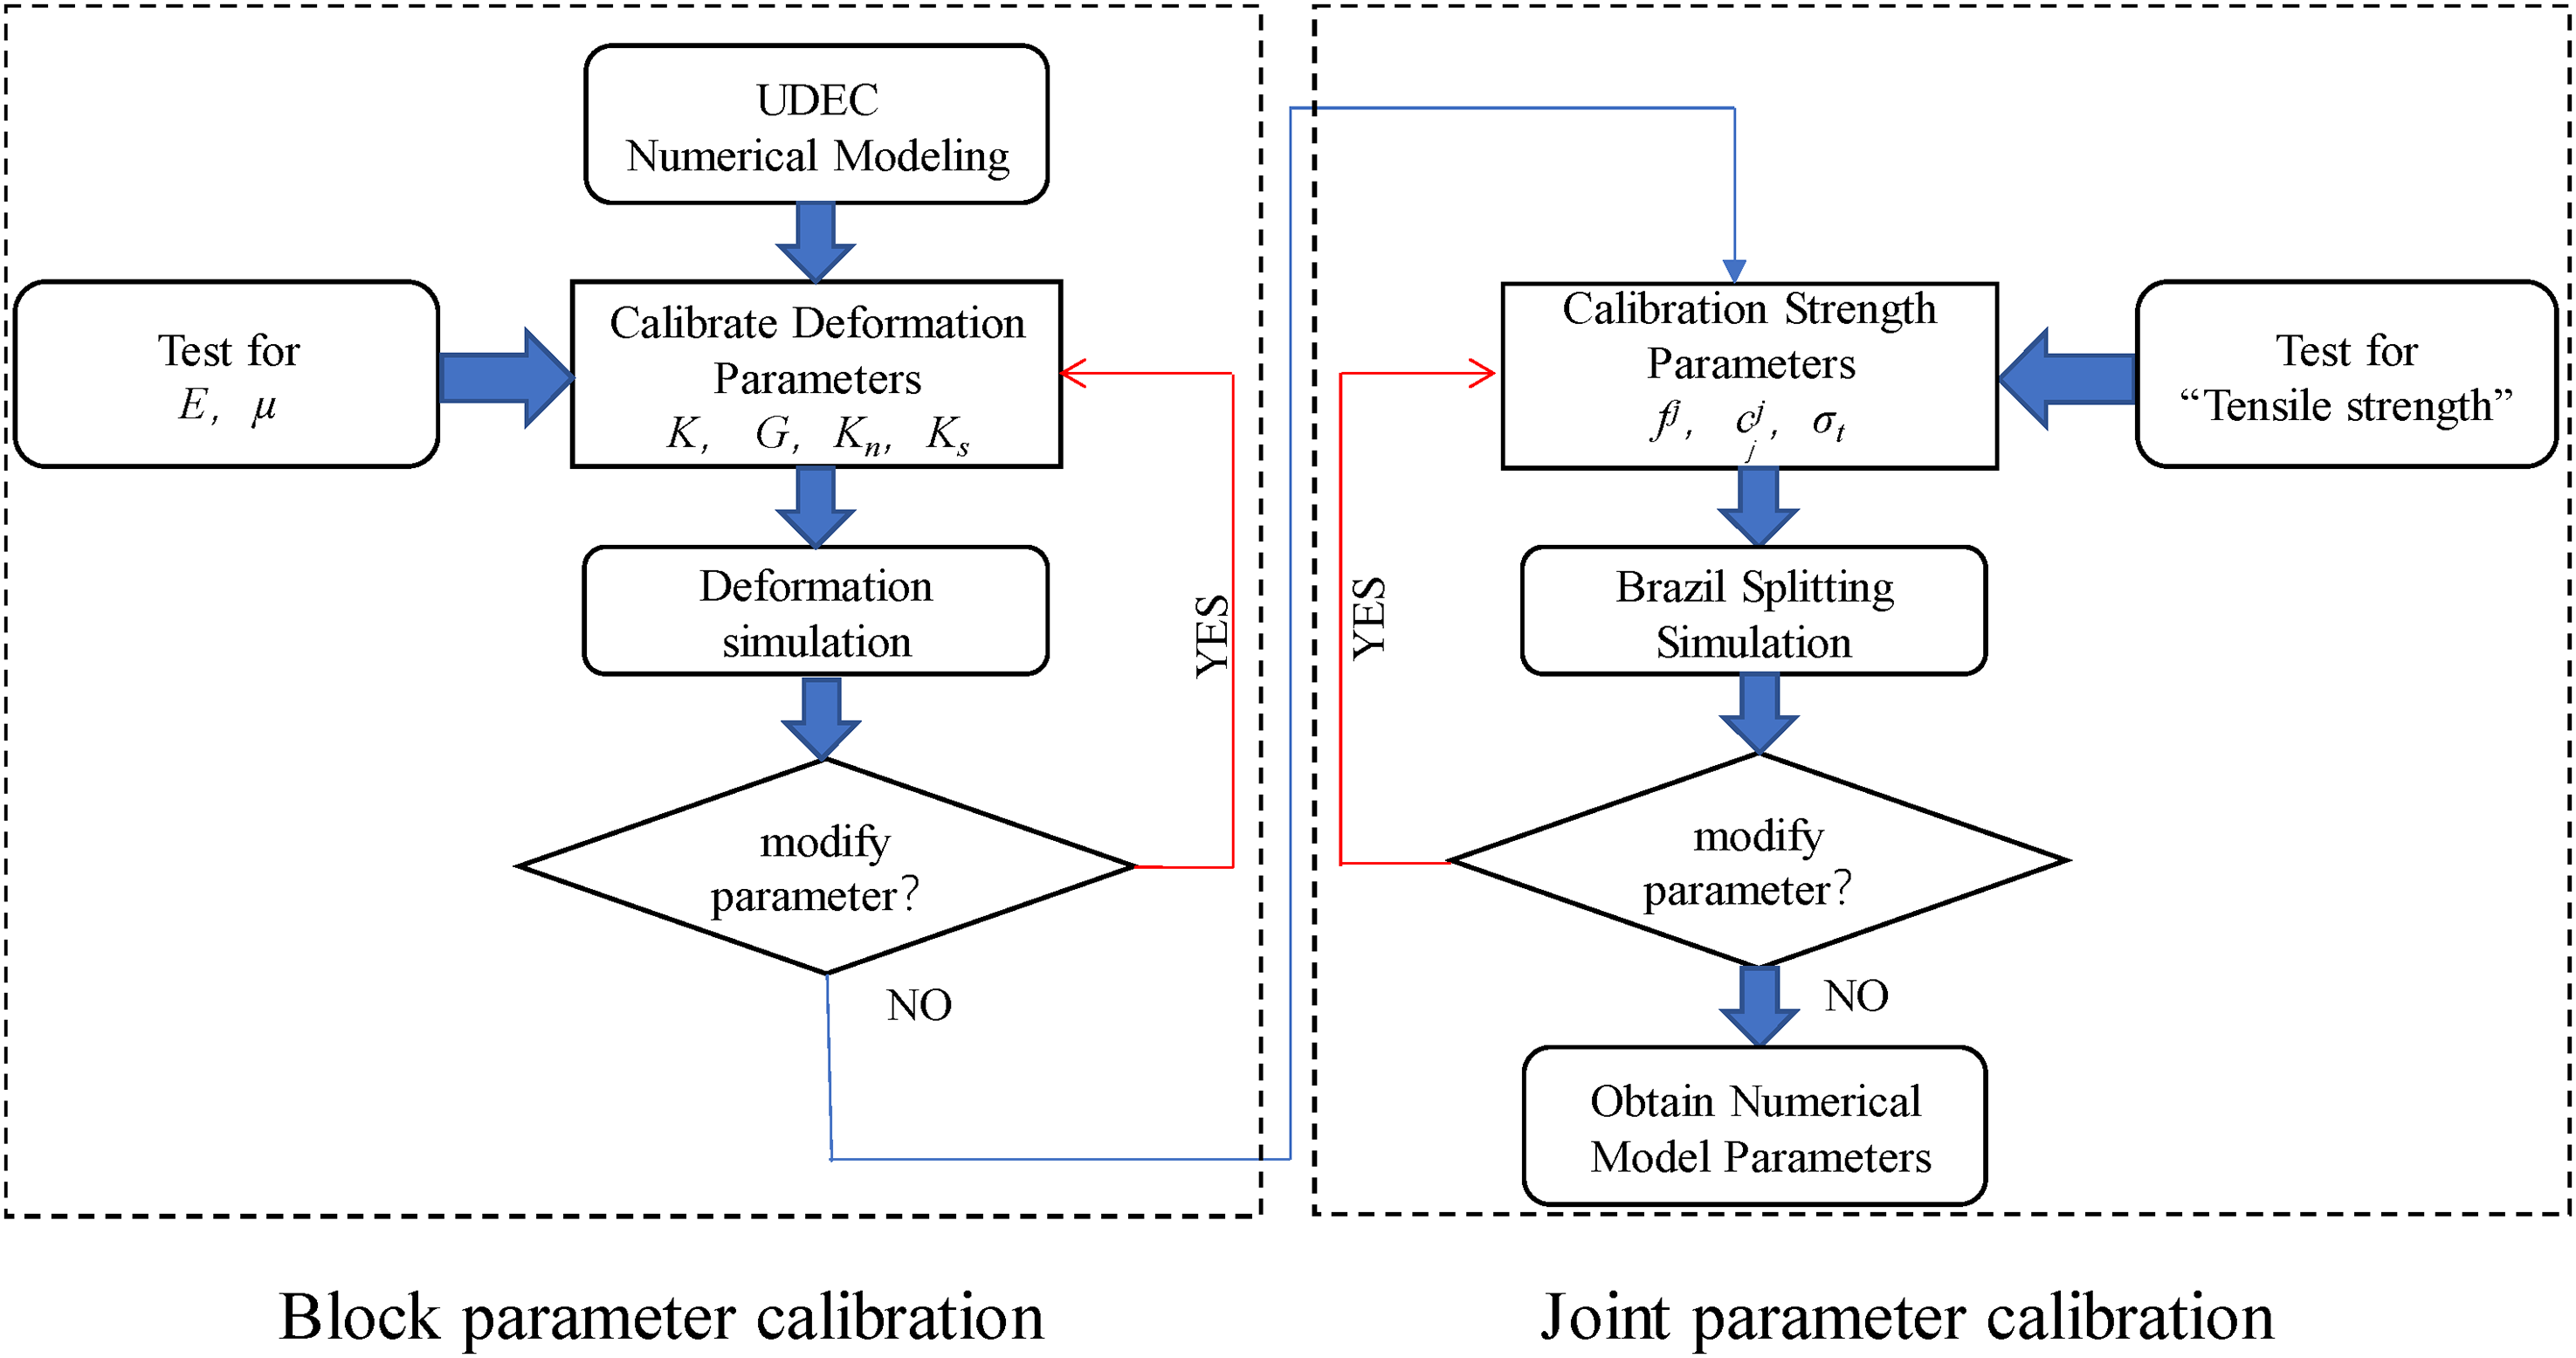
Flow chart of the micromechanical parameter calibration (Zhang et al., 2020, 2024).
Block parameters.
Joint parameters.
Analysis of experimental results
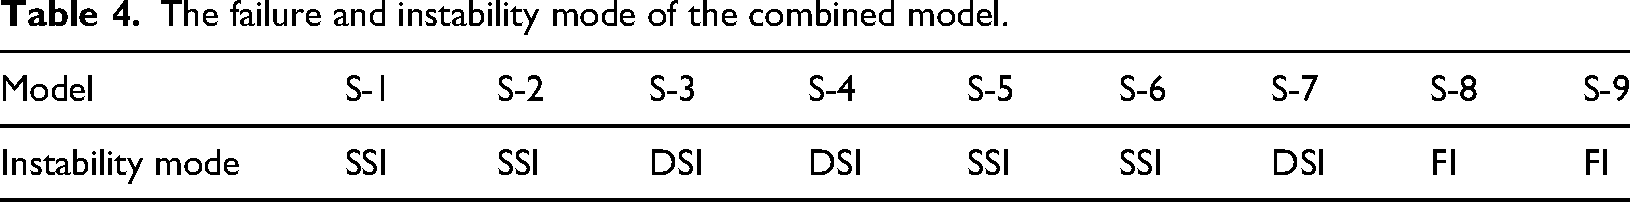
The development, propagation, and penetration of internal fractures within the composite model serve as indicators of its progressive instability (Zhang et al., 2023; Fan et al., 2023). Mesoscopic failure and instability mechanisms are examined through an analysis of fracture evolution characteristics in the IRCRS, along with the associated fracture damage evolution curves. Based on numerical simulation results, under constant contact surface roughness of the composite model, the failure and instability modes can be classified into three types: Fragmentation instability (FI), single contact surface slip and fragmentation instability (SSI), and double contact surface slip and fragmentation instability (DSI). The classification of these failure and instability modes is summarized in Table 4.
The failure and instability mode of the combined model.
Characteristics of FI
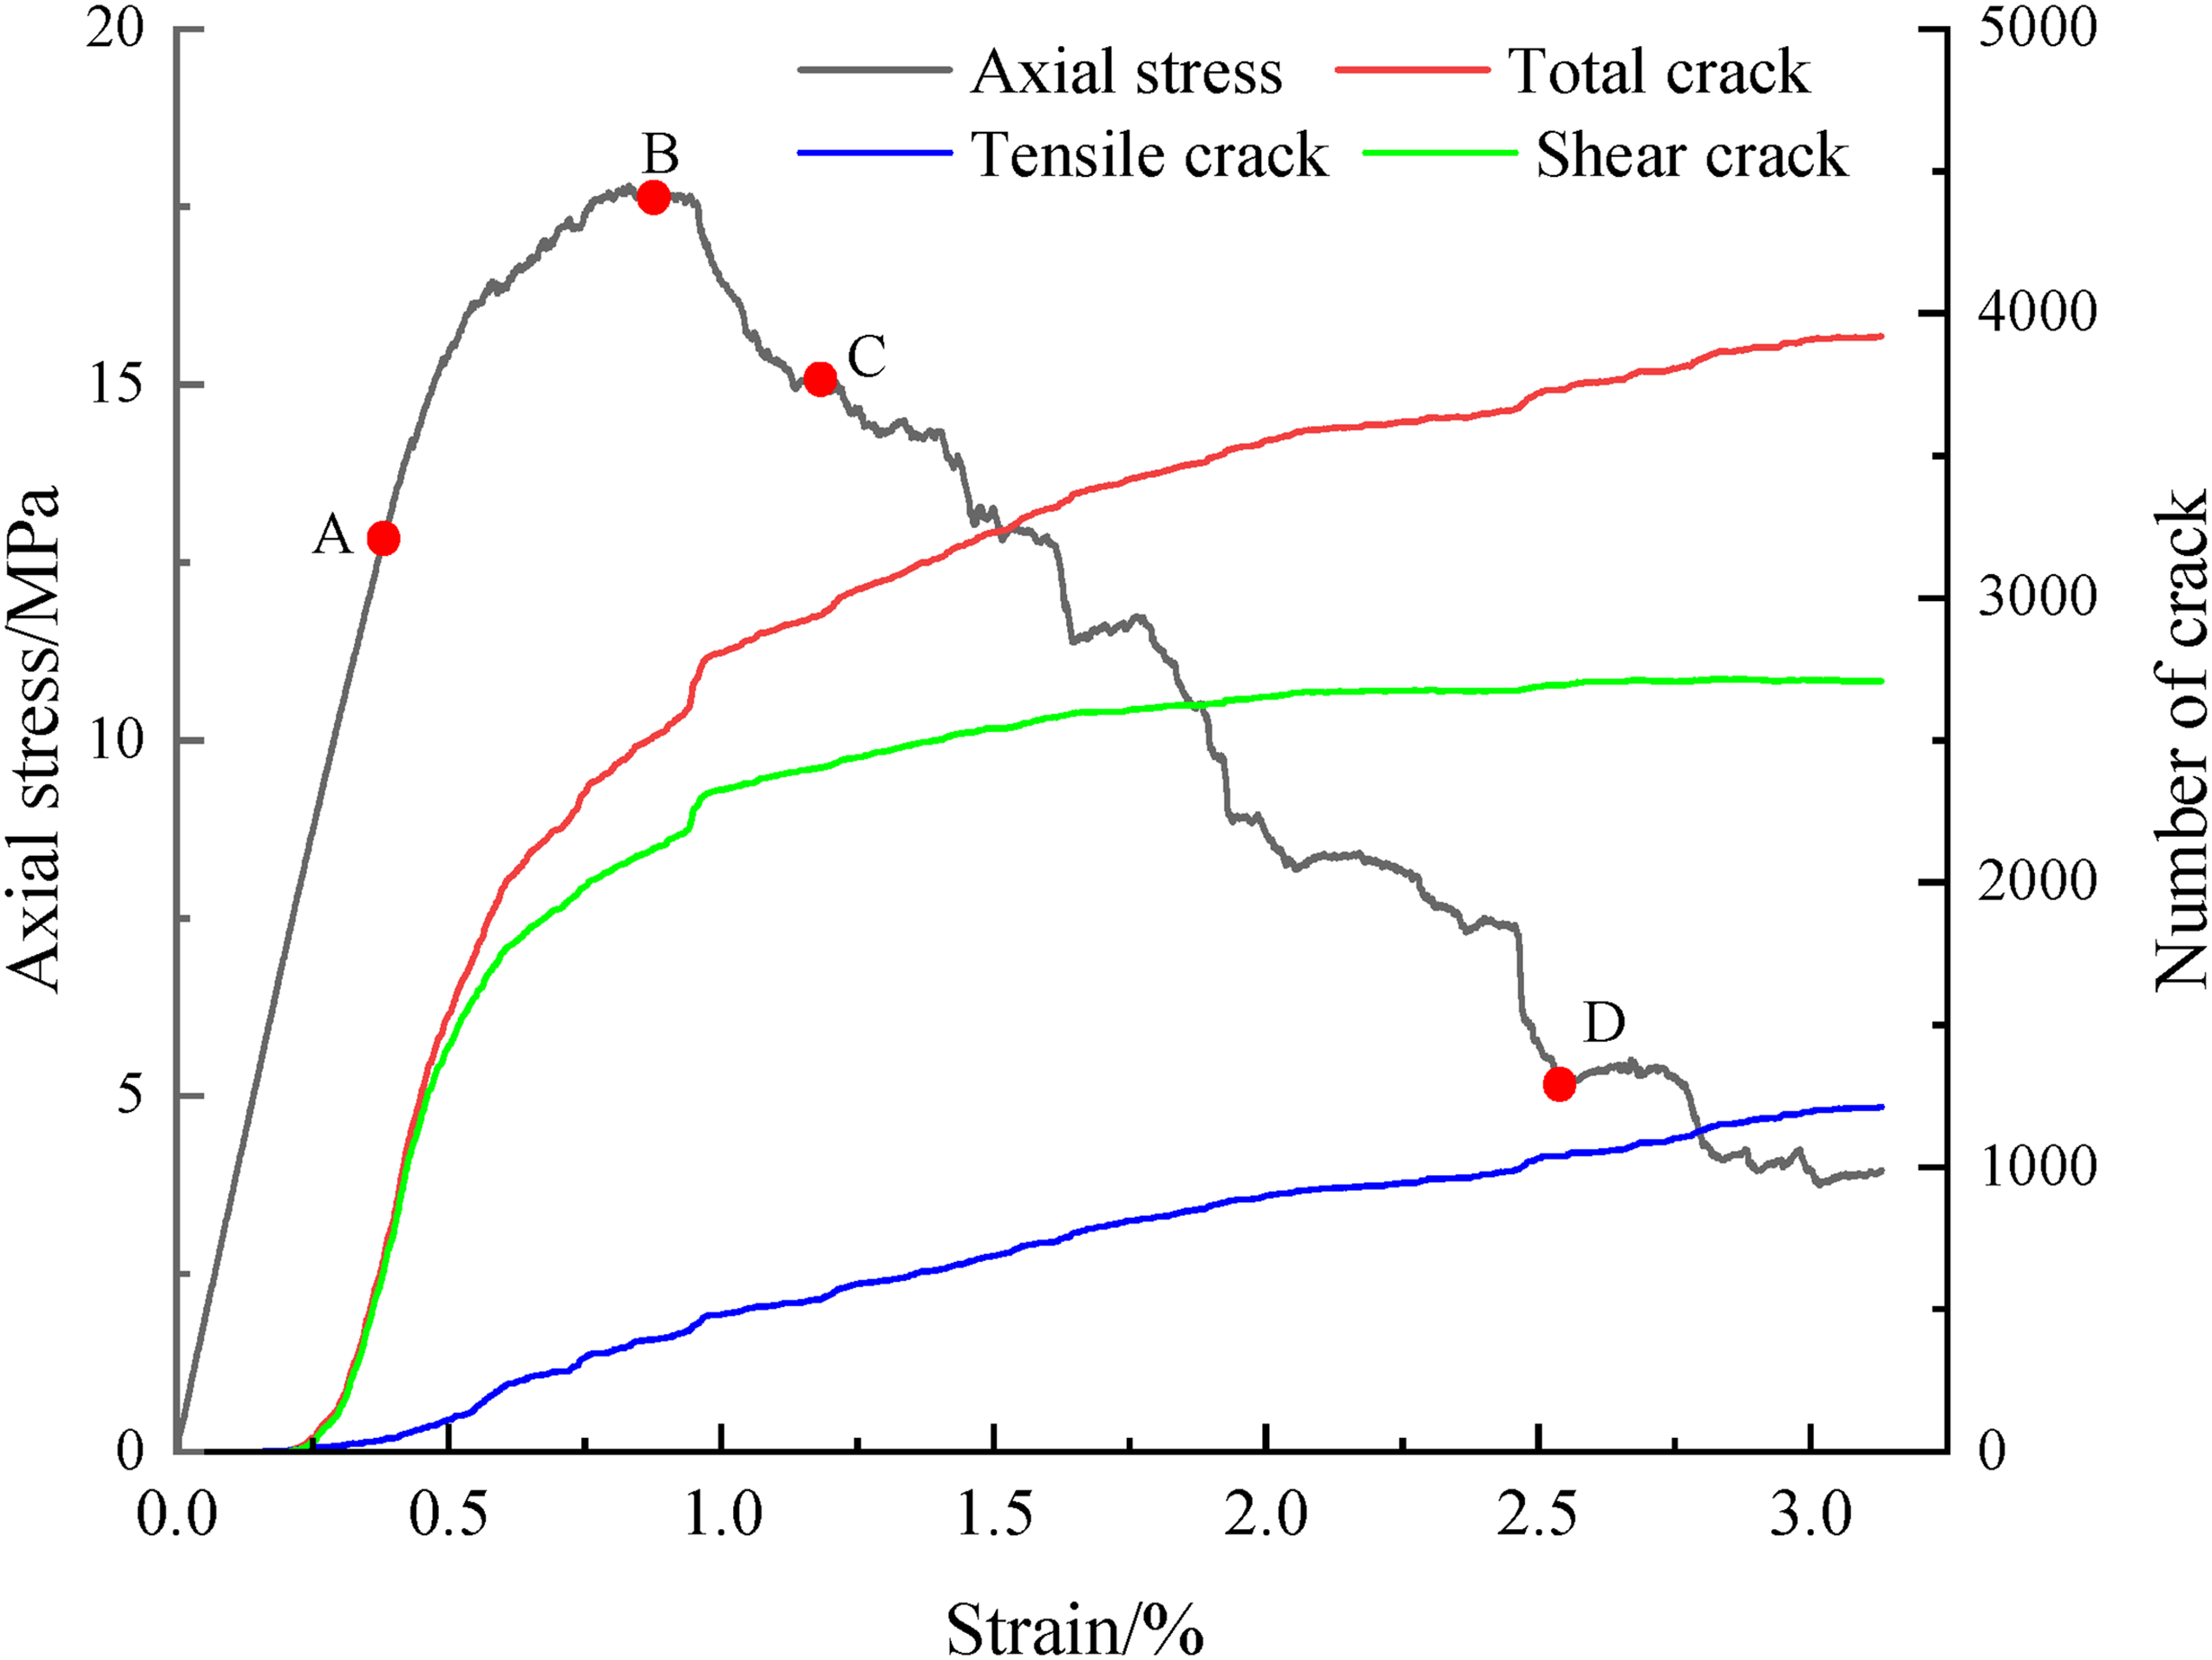
As shown in Table 4, the final instability observed in Models S-8 and S-9 can be attributed to the fragmentation of coal and rock, with no significant relative slip detected along the contact surface. Model S-8 was selected as the primary focus for further analysis of the mesoscopic fracture-induced instability characteristics of the composite model. During the loading process, key parameters such as axial stress, axial strain, and number of cracks were continuously monitored to characterize the evolution pattern of fracturing, as shown in Figure 3.
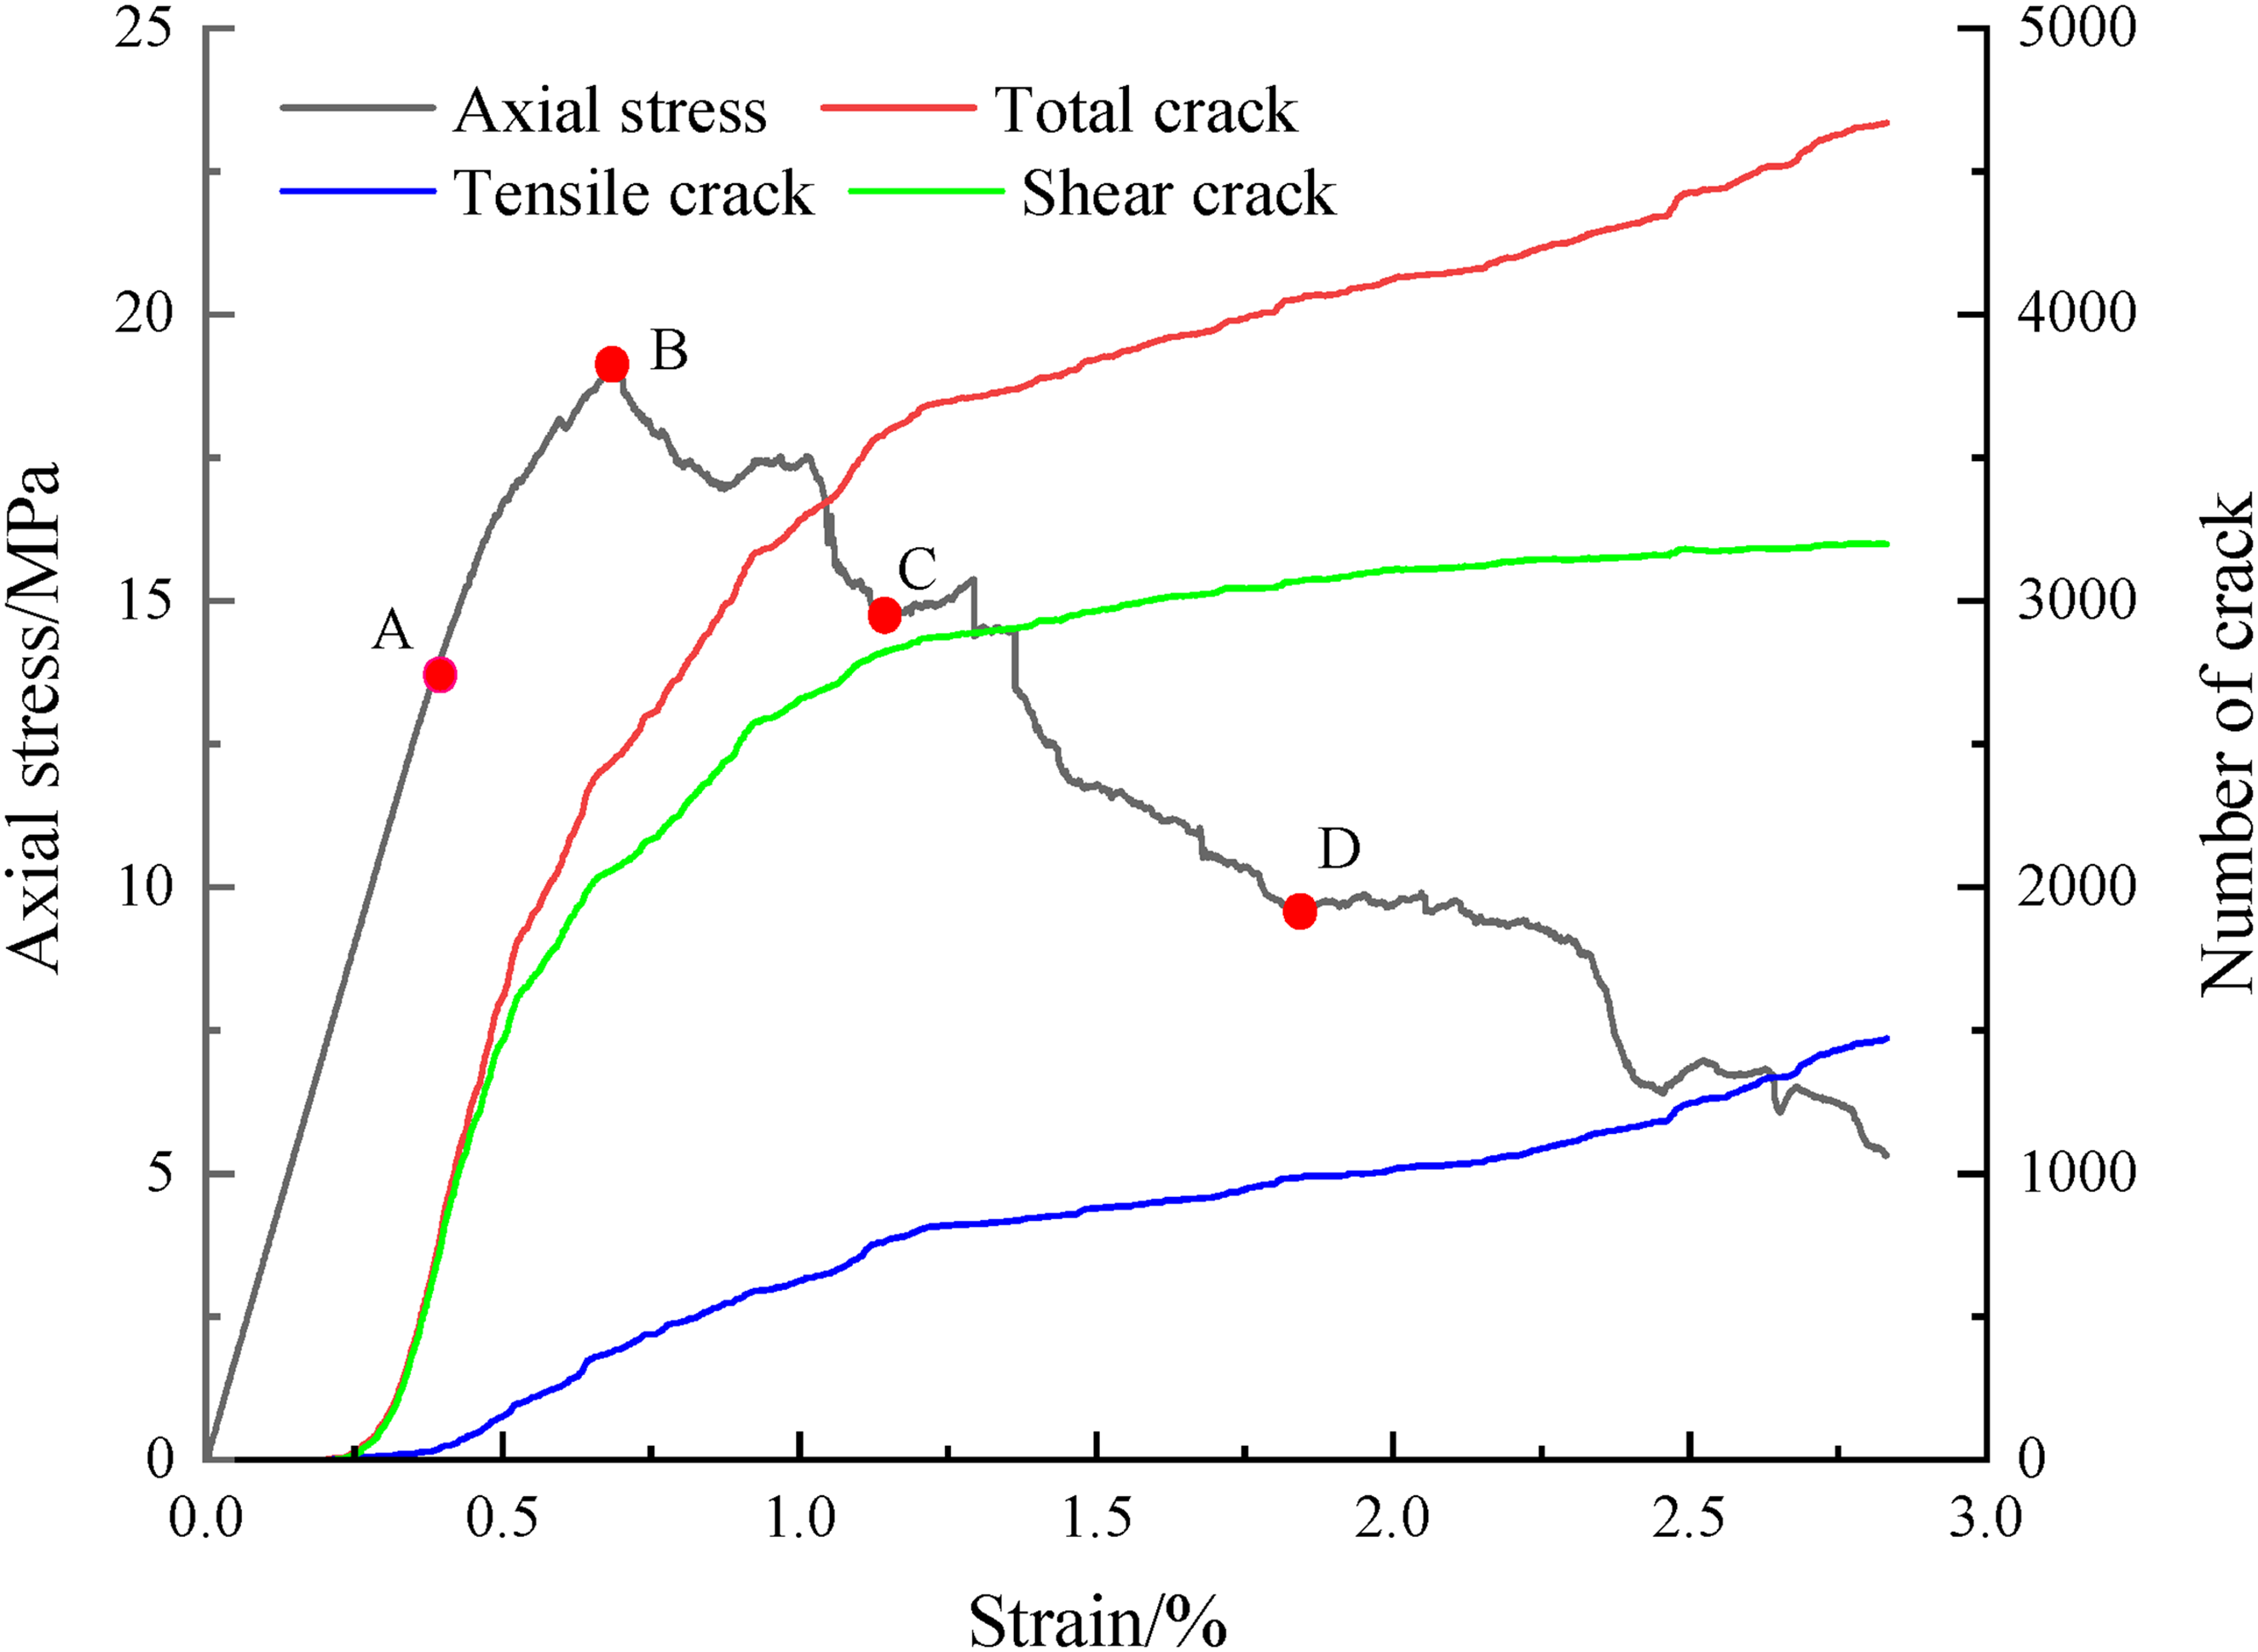
Stress–strain curve of the model S-8.
The OA stage represents the compaction phase, during which stress increases predominantly in a linear fashion. At this stage, internal fracturing within the model remains relatively limited and is primarily characterized by shear fractures. The AB stage corresponds to the fracture initiation and propagation phase, in which the stress continues to rise until reaching the peak failure strength of the composite model (19.1 MPa). During this stage, the number of cracks within the model progressively increases. Compared to the OA stage, the rate of shear crack development decreases, whereas tensile cracks continue to propagate steadily.
The BC stage represents the model fragmentation phase. Following the peak strength, the stress–strain curve exhibits relatively moderate fluctuations. This behavior can be attributed to the comparatively lower mechanical strength of coal relative to rock, which leads to the gradual accumulation and subsequent release of elastic energy, thereby inducing coal fragmentation. In the IRCRS, the rock exhibits significantly higher strength than coal, rendering the coal more prone to deformation under compressive loading. Upon reaching the failure strength of the composite model, the stress experiences an initial post-peak reduction. As loading progresses, the coal seam undergoes progressive compaction, resulting in a subsequent rise in stress after an initial decline, ultimately reaching a second peak stress value. Throughout this process, the total number of cracks within the composite model continues to increase. While shear crack develops at a relatively slower rate, tensile crack shows a progressively increasing trend.
The CD stage represents the model's instability phase, during which the stress gradually decreases to 9.54 MPa at point D. Compared with the BC stage, there is a significant reduction in the total number of cracks within the composite model. The growth trend of shear cracks remains nearly constant, while tensile cracks exhibit a slow yet steady increase. At point D, the cumulative number of cracks reaches 4,048, consisting of 3065 shear cracks and 983 tensile cracks. These results indicate that Model S-8 has reached a state of complete instability.
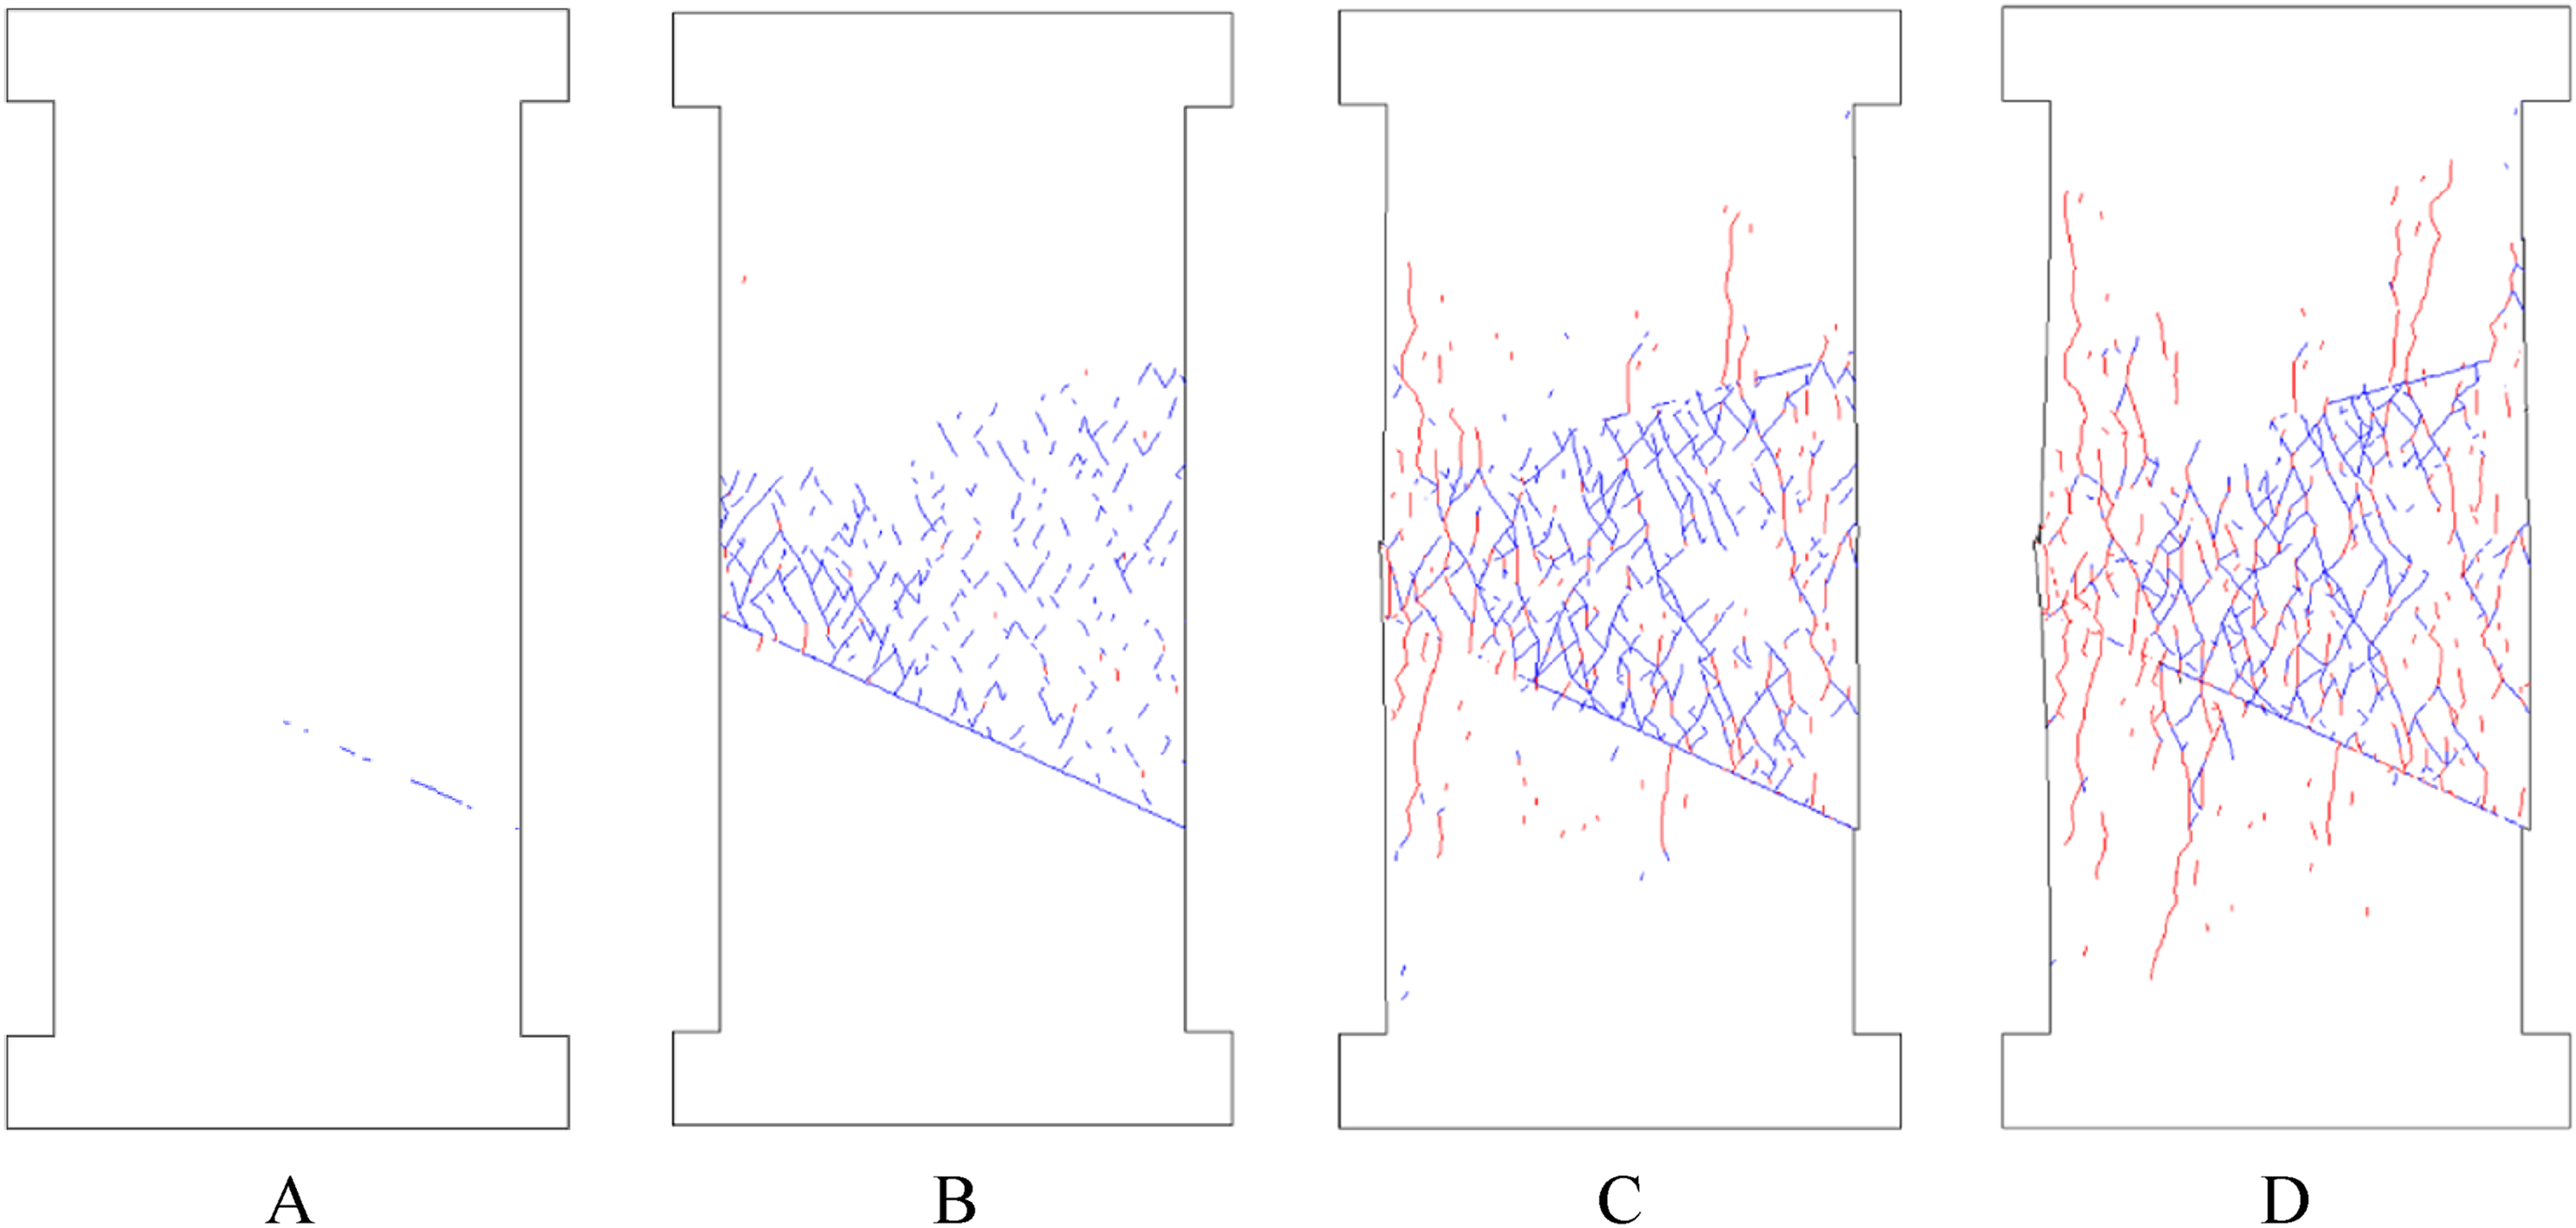
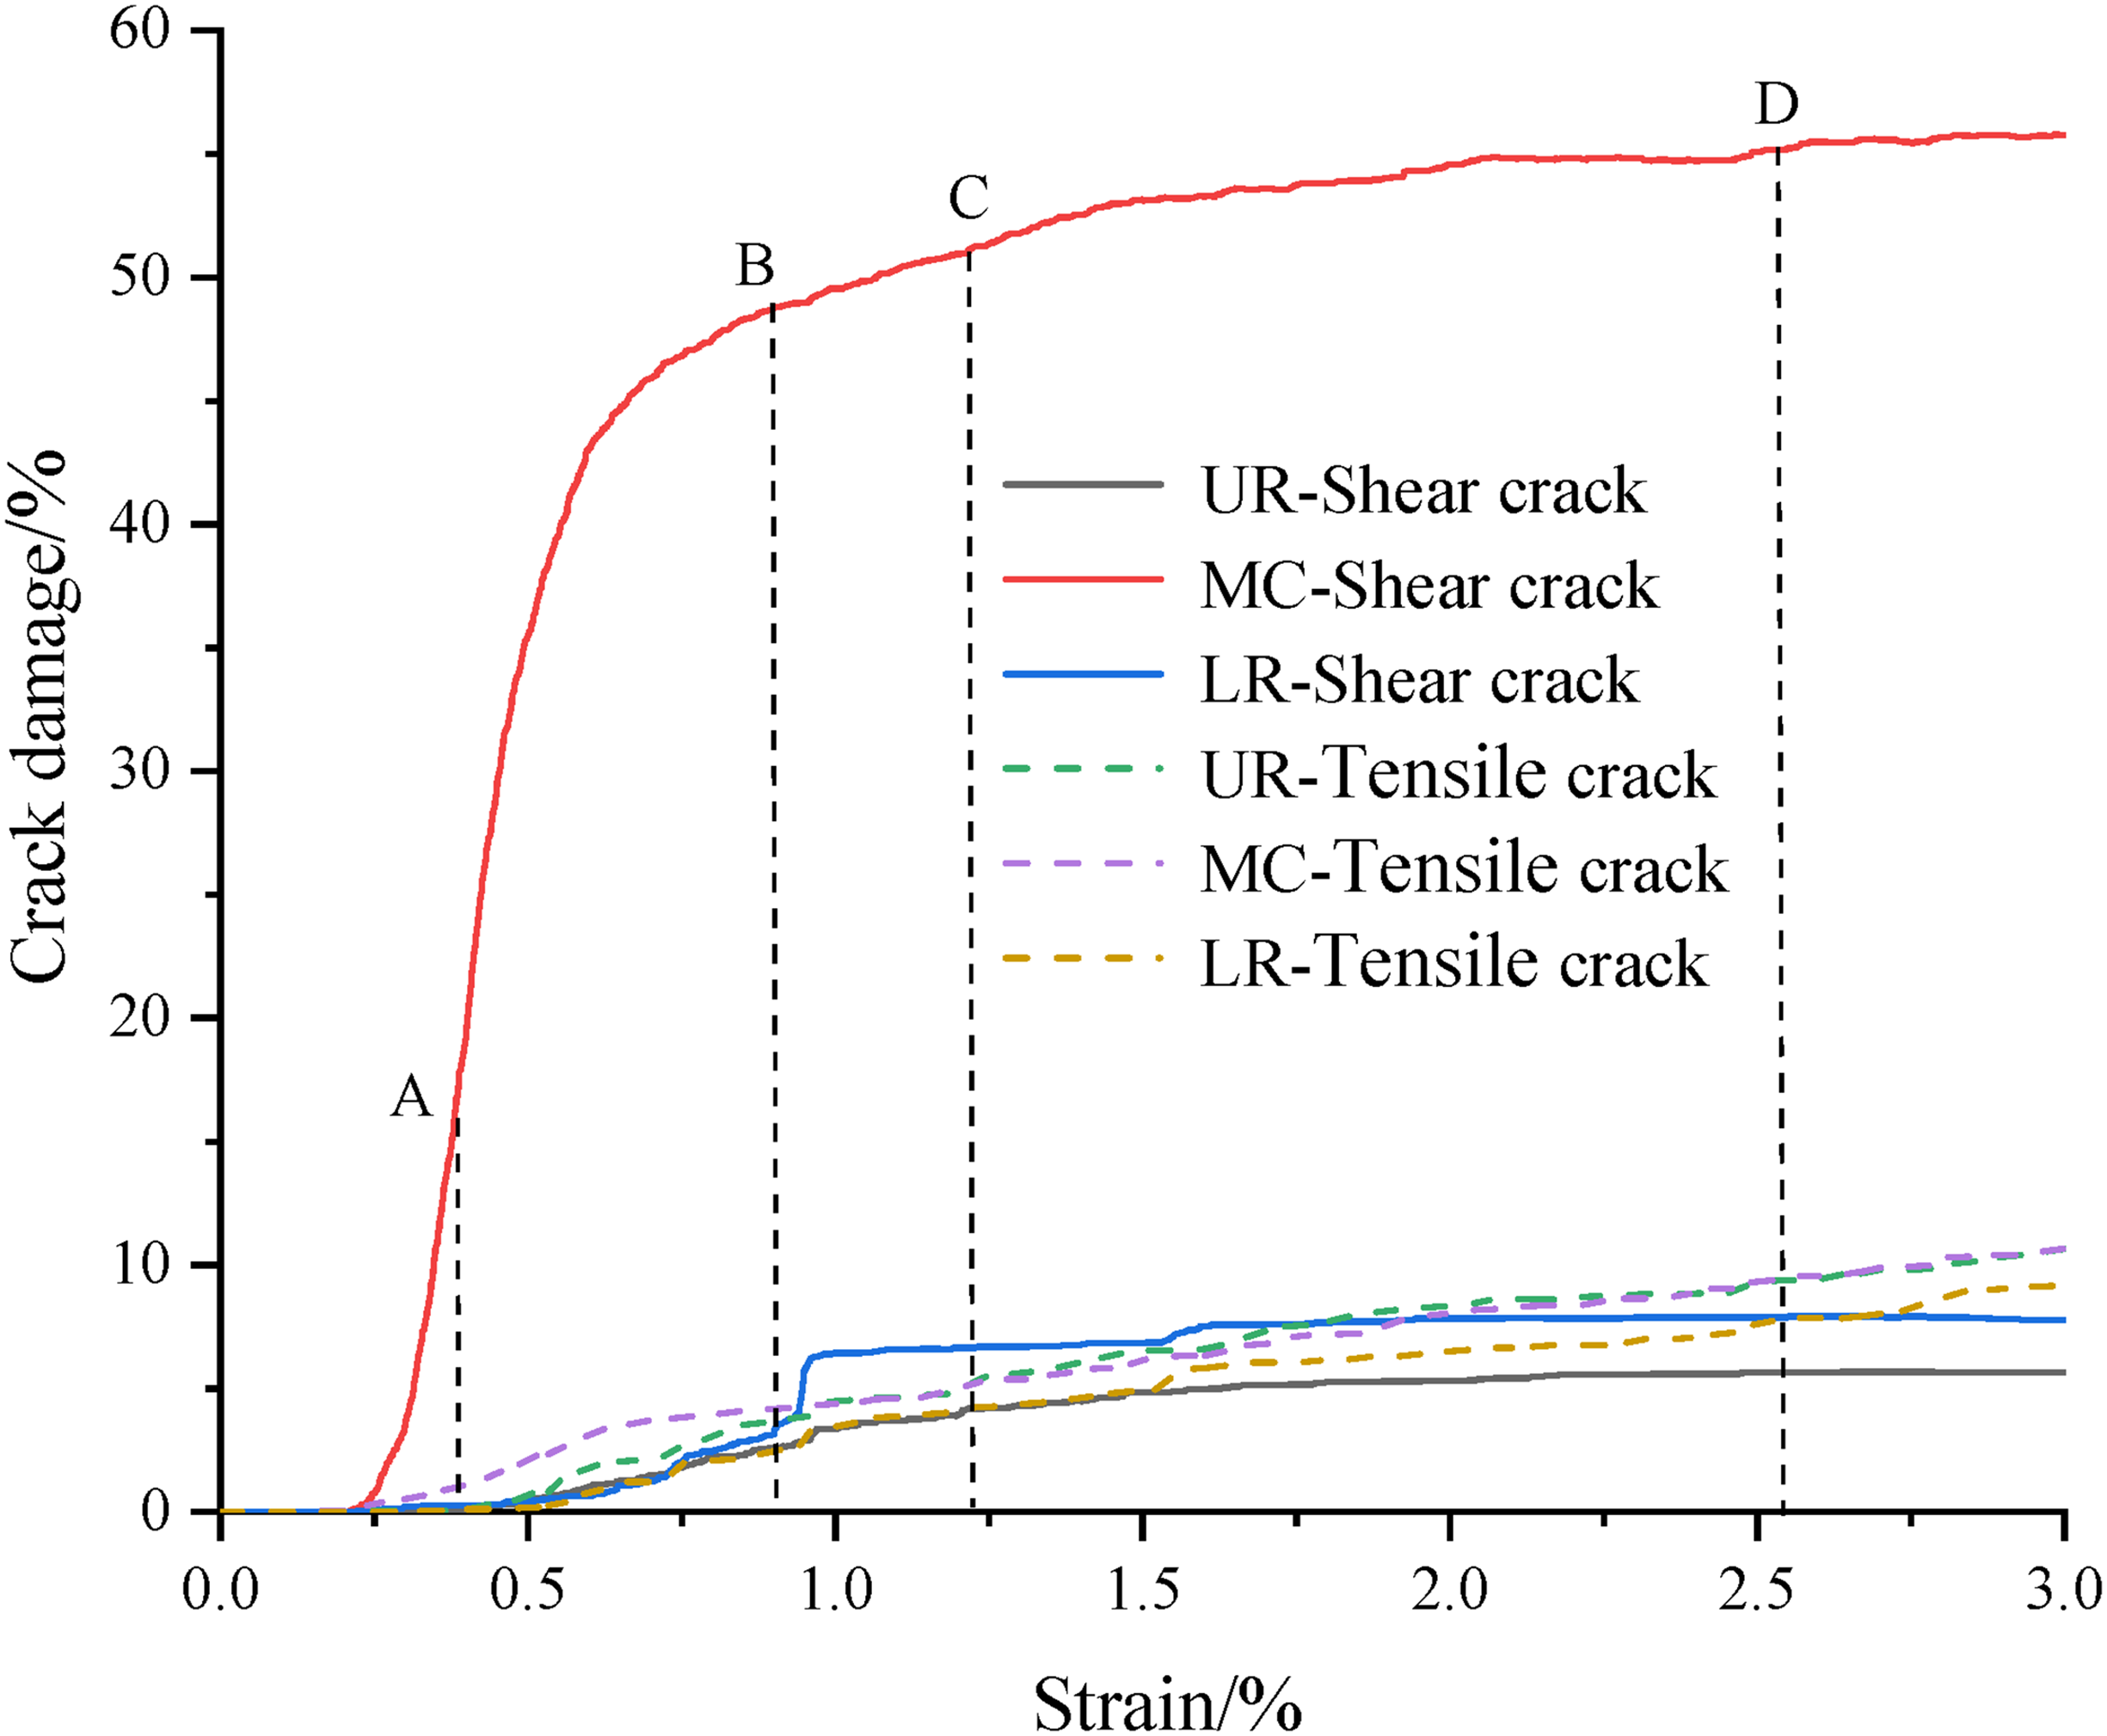
Figure 4 shows the fracture evolution diagram of the model S-8. Figure 5 shows the crack damage evolution curve of the model S-8. At point A, the number and total length of cracks within the model are minimal, with shear cracks predominantly developing in the central coal. The coal exhibits a crack damage rate of 21.49%, whereas the damage rates in the upper and lower rock are nearly negligible. Due to its relatively soft mechanical properties, coal is more prone to fracturing compared to surrounding rock, resulting in more extensive crack development within the coal. At point B, a significant increase in crack length and density is observed relative to point A. Shear cracks within in the central coal extend further and begin to coalesce. The coal damage rate rises to 42.89%, representing an increase of 21.4 percentage points from point A, while the upper and lower rock reach damage rates of 3.61% and 5.33%, respectively. Fractures remain primarily shear-dominated within the coal, with propagation extending into the adjacent rock. In contrast, tensile cracks are longer in the rock formations but remain relatively short within the central coal seam. Prior to reaching peak stress, a rapid increase in tensile fracture development is observed, suggesting that this behavior may serve as a precursor to structural instability in composite models. At point C, shear cracks within the coal begin to coalesce and trigger the formation of tensile cracks, which are primarily distributed along the lateral boundaries of the coal and extend into the surrounding coal–rock interface. Although tensile cracks remain less prevalent than shear cracks in the overall model, most originate from the linkage and penetration of pre-existing shear cracks. The coal damage rate reaches 50.43%, while the upper and lower rock exhibit damage rates of 12% and 15.18%, respectively. At point D, crack connectivity intensifies significantly, leading to overall model instability. The coal damage rate increases to 53.85%. Given the inherent mechanical weakness of the coal structure in this composite model, this degree of fracture damage (53%) observed at instability can be considered as representing the fracture damage limit of the model. Notably, macro-failure becomes evident on the left side of the central coal, where the coal seam is thinner compared to the right side, and this region also exhibits a higher concentration of tensile cracks, confirming their critical role in driving instability. These observations indicate that micro-damage is primarily driven by shear fracturing, whereas macro-failure results from tensile cracks formed through the coalescence and extension of shear cracks.
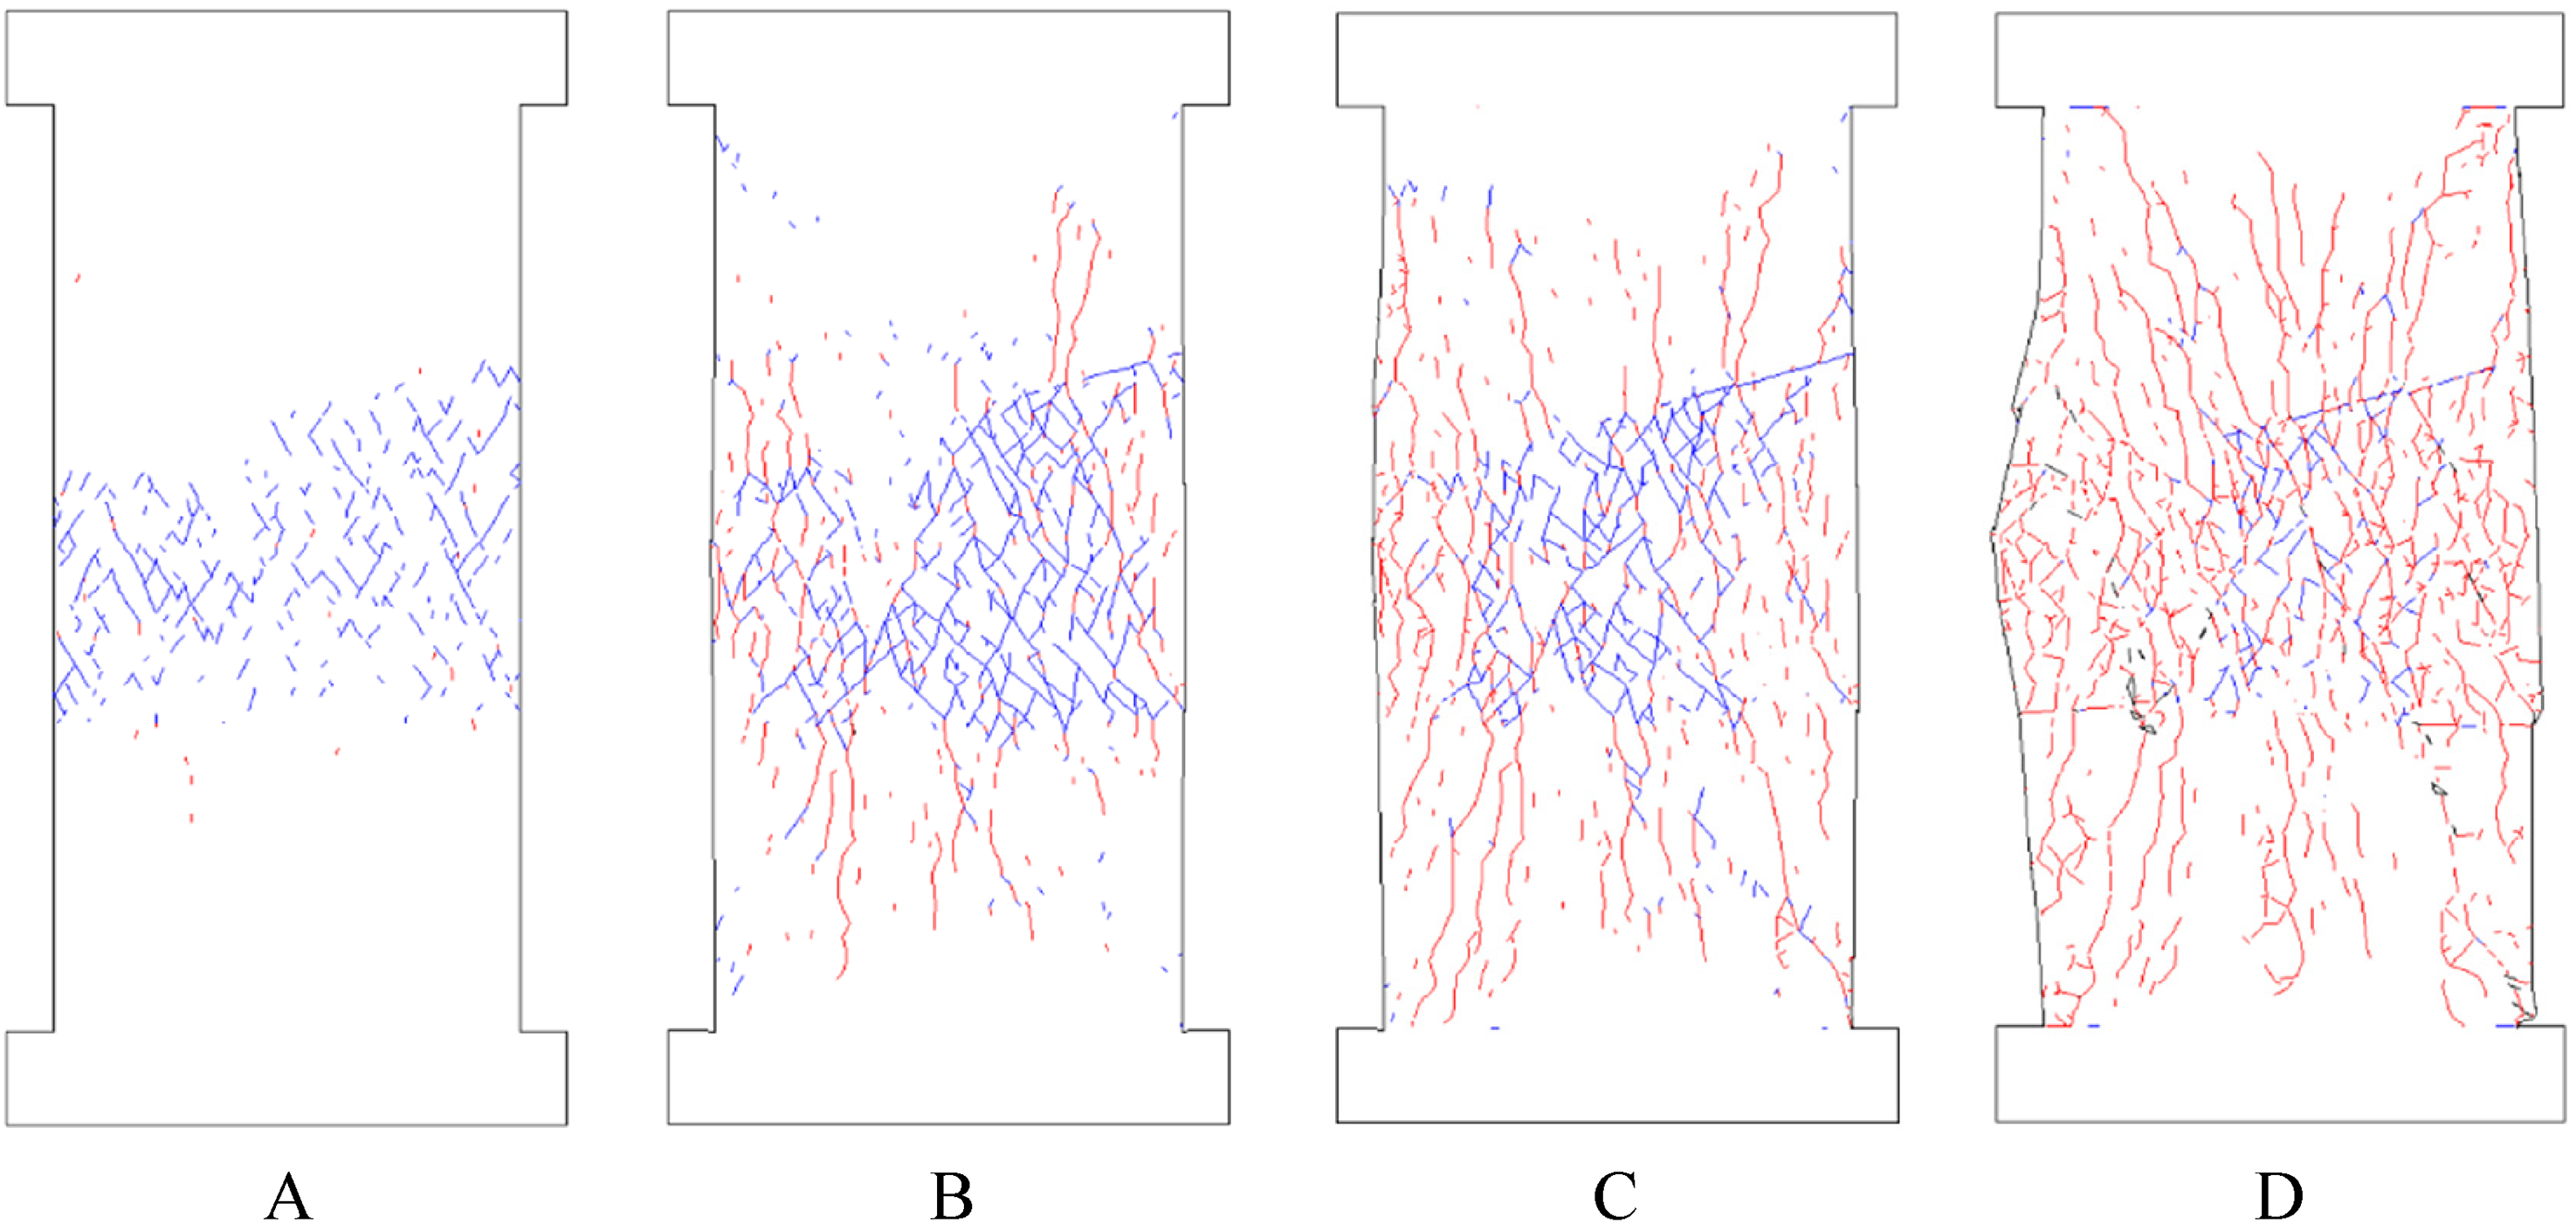
Fracture evolution diagram of the model S-8 (Note: blue represents shear crack, and red represents tensile crack).
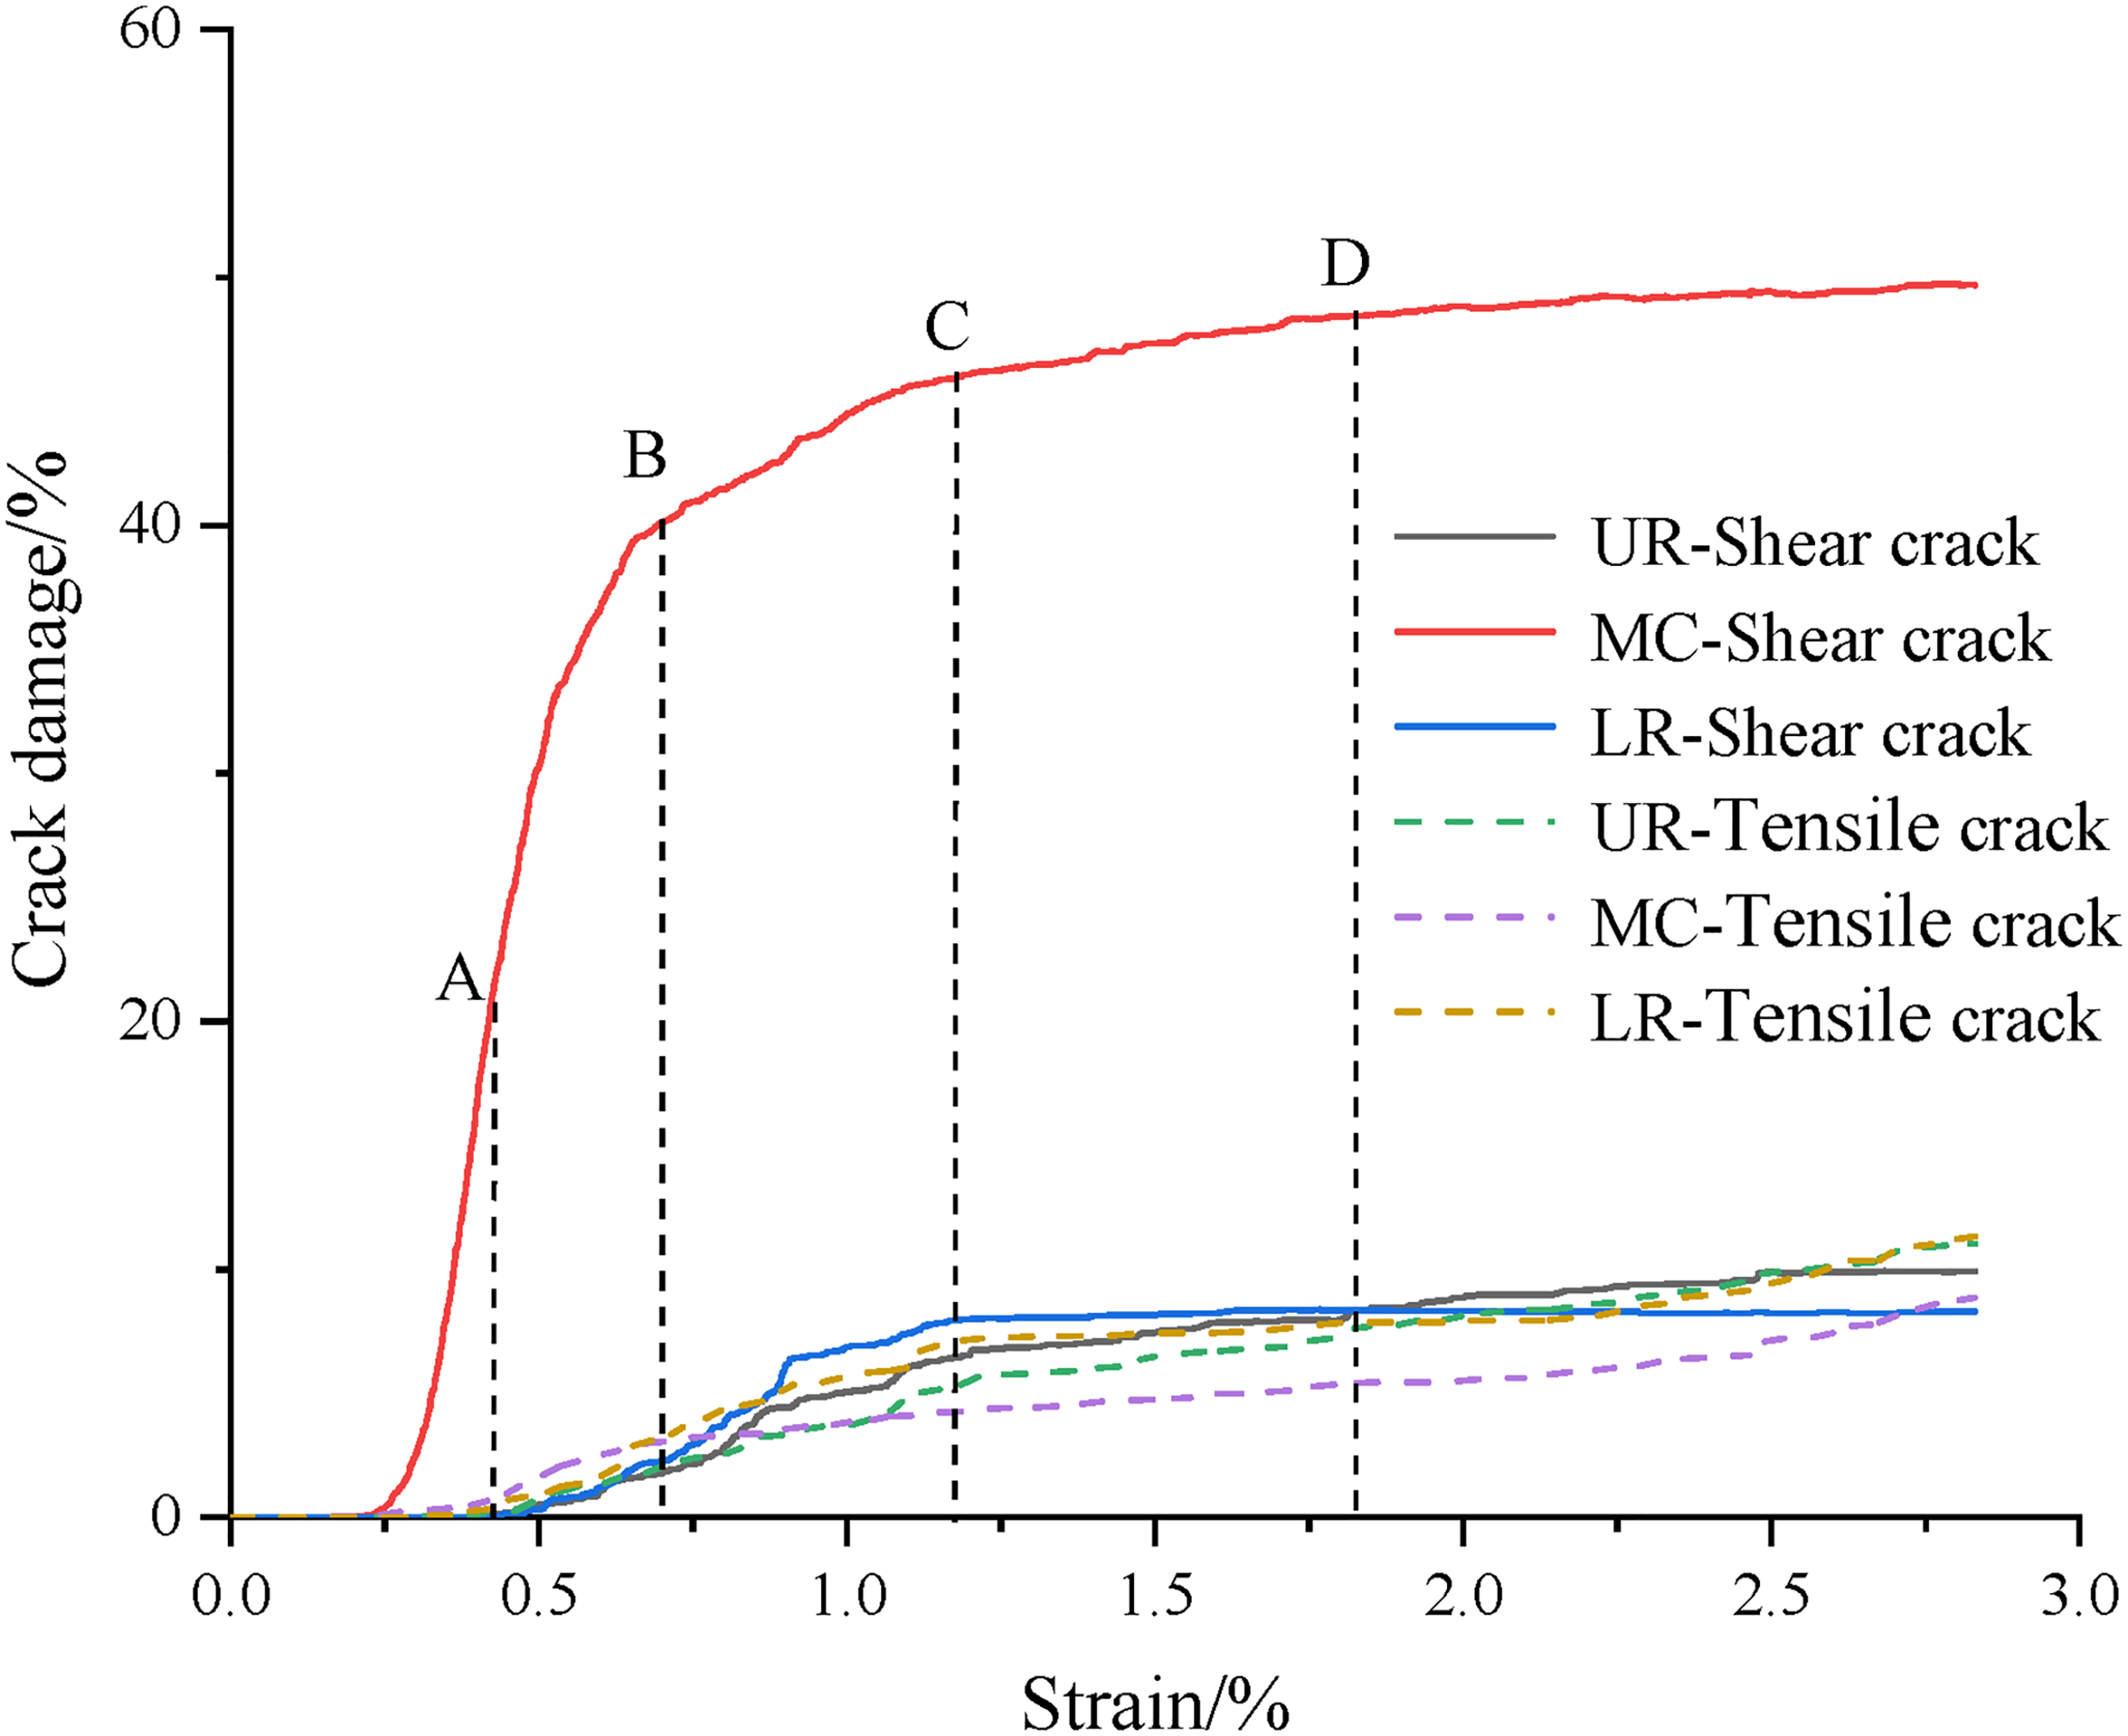
Crack damage evolution curve of the model S-8. (Note: UR represents the upper rock, MC represents the central coal, and LR represents the lower rock).
In summary, the rapid proliferation of tensile fractures within the composite model prior to attaining its peak instability strength may serve as a precursor indicator of impending structural failure.
Characteristics of SSI
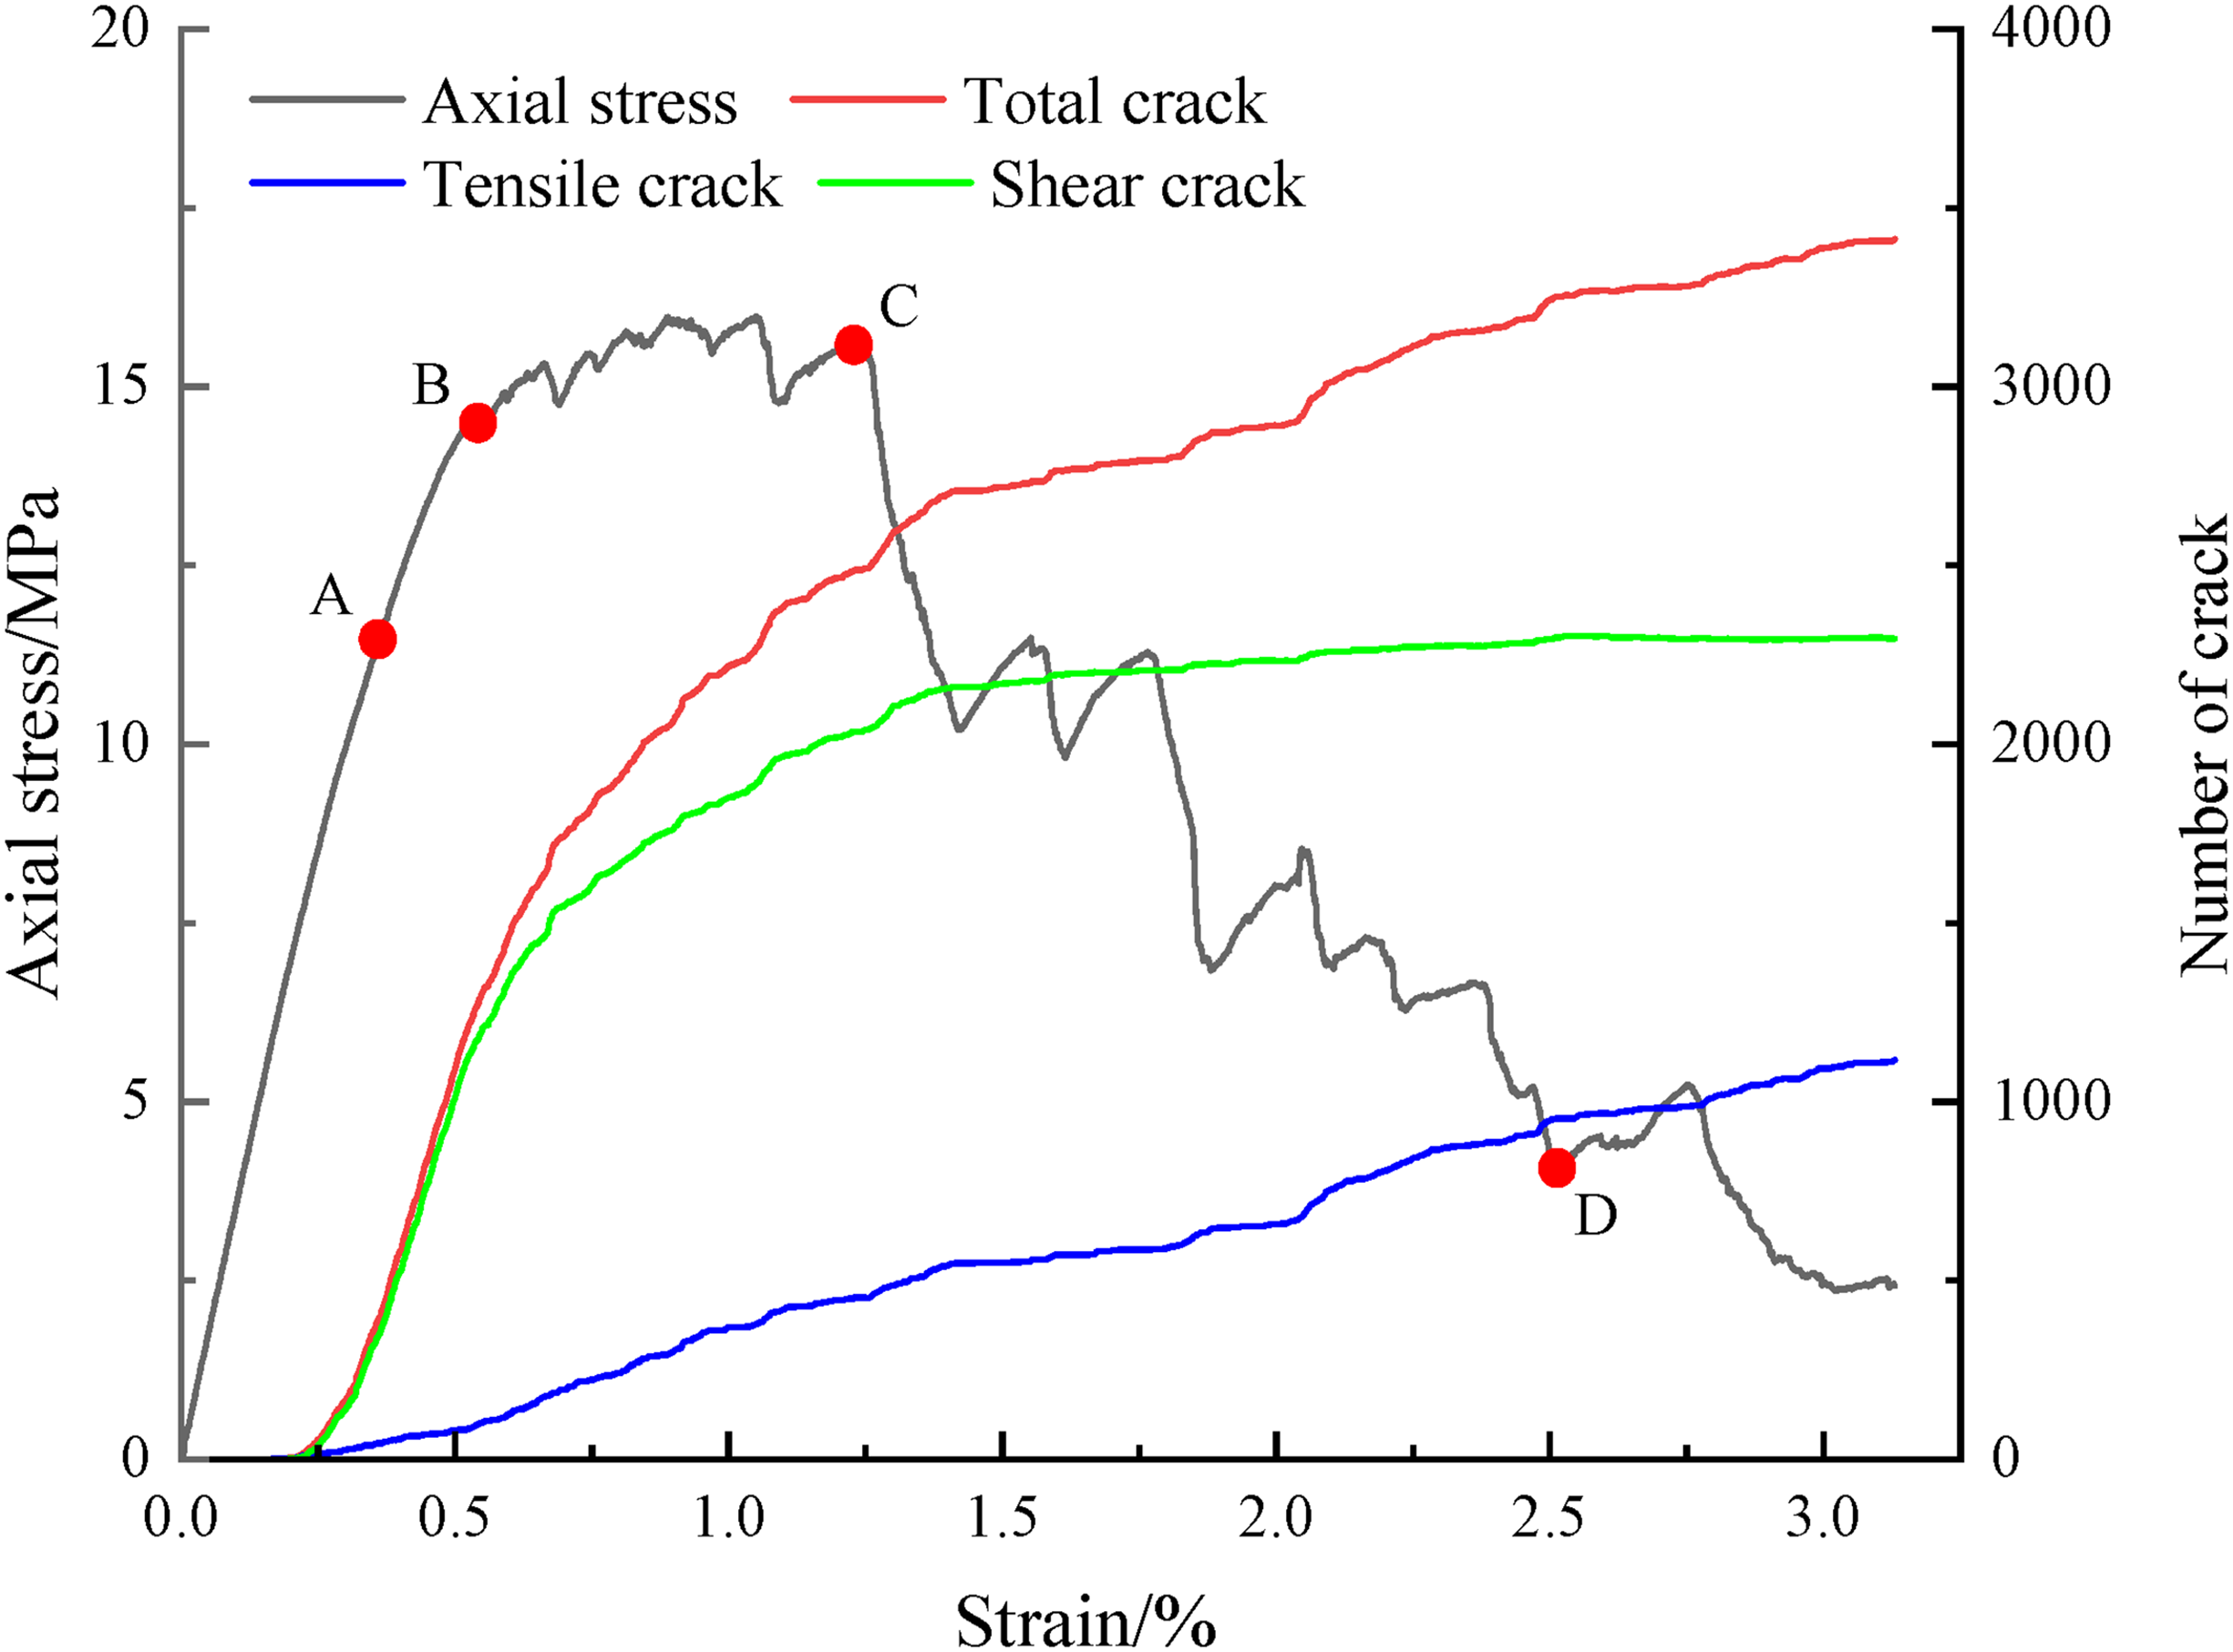
As shown in Table 4, the SSI phenomenon was observed in Models S-1, S-2, S-5, and S-6. Model S-2 was selected as the primary subject for investigating the characteristics of SSI in coal and rock. During the entire loading process, key parameters such as axial stress, axial strain, and the number of cracks were continuously monitored to establish the fracture evolution pattern, as shown in Figure 6.
Stress–strain curve of the model S-2.
The OA stage represents the compaction phase, during which stress increases linearly. At this stage, internal fracturing within the model is minimal, with shear fractures being the predominant type. The AB stage corresponds to the initiation and propagation of cracks. During this stage, stress rises to reach the peak strength of 17.5 MPa. Prior to attaining the peak strength, fluctuations are observed in the stress–strain curve, primarily attributed to the progressive compaction of an increasing number of cracks—mainly concentrated in the central coal. The total number of cracks continues to increase; however, the rate of shear crack development decreases compared to the OA stage, while tensile cracks gradually increase. The BC stage marks the onset of slip-induced fragmentation within the model, during which stress decreases to 14.9 MPa. After point B, a sharp increase in the number of shear cracks is observed, followed by stabilization, whereas tensile cracks continue to accumulate. Enhanced slip occurs along the lower contact surface, and greater displacement is evident on the left side of the central coal, indicating incipient spalling—likely due to the thinner coal on the left being more prone to crushing. The CD stage represents the instability phase of the model, during which stress declines further declines to 5.2 MPa. Throughout this stage, the total number of cracks increases significantly, driven primarily by the continued propagation of tensile cracks, while the development of shear cracks remains negligible. At point D, the model contains a total of 3731 cracks (2693 shear cracks and 1038 tensile cracks), indicating that Model S-2 has reached a state of complete structural instability.
Fracture evolution characteristics and fracture damage evolution curve of Model S-2 (Figures 7 and 8) are systematically analyzed as follows. At point A: In contrast to other slip and fragmentation instabilities, shear cracks initially appear on the lower contact surface during the SSI process in the composite model. At point B: The number of cracks increases substantially compared to point A. Shear cracks in the central coal propagate across the entire coal, with longer shear cracks observed on the left side than on the right, fully penetrating the lower contact surface. The coal damage rises to 55%, representing an approximate 40% increase from point A. Meanwhile, the damage ratios for the upper and lower rock are recorded at 3.61% and 5.33%, respectively. At point C: Shear sliding occurs along the lower contact surface, leading to penetration by shear cracks into the coal, which subsequently induce tensile cracks (primarily on the left side, ultimately resulting in macroscopic failure). At point D: Cracks in the lower rock extend further and propagate perpendicularly to the contact surface, indicating that slip along this interface influences the orientation of fracture development in the lower rock. By this stage, the rate of crack damage progression has slowed significantly; the model ultimately loses structural stability, with the coal damage degree reaching 65%.
Fracture evolution diagram of the model S-2.
Crack damage evolution curve of the model S-2.
In summary, during the SSI of the composite model, Crack penetration is observed exclusively at a single contact interface. The model undergoes slip along this interface, accompanied by fragmentation. Therefore, it can be concluded that the SSI results from the combined effects of slip and fragmentation.
Characteristics of DSI
As shown in Table 4, Models S-3, S-4, and S-7 all demonstrate DSI. Among these, Model S-3 is selected as the primary subject of investigation to systematically characterize the DSI behavior within the coal–rock composite. During the loading process, key parameters such as axial stress, axial strain, and the number of cracks were continuously monitored to establish the fracture evolution pattern, as shown in Figure 9.
Stress–strain curve of the model S-3.
The OA stage corresponds to the compaction phase, during which stress increases nearly linearly and internal fracturing within the model remains relatively limited, primarily consisting of shear cracks. During the AB stage, stress continues to rise, accompanied by a steady increase in the total number of cracks in the composite model. Although the growth rate of shear cracks slows compared to the OA stage, tensile cracks continue to develop actively. In the BC stage, the stress–strain curve fluctuates around the peak value. This behavior is attributed to the relatively lower mechanical strength of coal compared to rock, leading to cyclic energy accumulation and release under uniaxial compression, ultimately resulting in coal fragmentation. Furthermore, due to the inherently lower strength of coal within the IRCRS, significant compression occurs under uniaxial loading. After reaching the failure strength of the composite model, the stress initially decreases post-peak. However, with continued loading, progressive compression of the coal seam occurs, followed by a subsequent decrease and then an increase in stress, eventually attaining a second peak. Throughout this stage, the total number of cracks continues to increase, with shear cracks developing at a reduced rate while tensile cracks exhibit a progressively increasing trend. The CD stage signifies the onset of model instability, during which stress gradually decreases to 9.54 MPa at point D. Compared with the BC stage, the rate of crack development in the composite model significantly decreases: shear cracks exhibit minimal growth, while tensile cracks increase at a reduced pace. By point D, the total number of cracks reaches 3251 (comprising 2299 shear cracks and 952 tensile cracks). The total number and growth rate of shear cracks are substantially lower than those observed in the FI and SSI scenarios. This trend indicates that fracture-induced damage within the model diminishes as contact-surface slip intensifies.
Fracture evolution characteristics and fracture damage evolution curve of Model S-3 (Figures 10 and 11). The degree of fracture damage in Model S-3 is markedly greater than that observed in other instability models. At point A, shear cracks initiate simultaneously along both contact surfaces of the model. By point B, these shear cracks have fully penetrated both the upper and lower contact surfaces. At this stage, the shear damage ratio within the central coal reaches approximately 38%, whereas no discernible fractures are observed in either the upper or lower rock. At point C, the shear damage ratio in the central coal increases from 38% to 56%. Meanwhile, shear damage in the upper and lower rock also rise, albeit to a comparatively modest degree. Lateral sliding of the central coal along the contact surfaces commences, promoting the expansion and through-penetration of shear fractures, which are predominantly concentrated in the left portion of the composite model—this is attributed to the thinner coal layer on the left, which exhibits heightened susceptibility to crushing. At point D, the shear damage ratio in the central coal stabilizes at approximately 60%, while tensile damage begins to accumulate as propagating shear cracks nucleate secondary tensile cracks. During the DSI of the composite model, the overall crack damage intensity in the rock remains lower than that recorded during FI and SSI, indicating reduced rock fragmentation due to energy dissipation via interfacial slip. Consequently, the overall mechanical strength of the composite model is predominantly governed by the residual strength of the central coal.
Fracture evolution diagram of the model S-8.

Crack damage evolution curve of the model S-3.
In summary, when the instability mode of the composite model is characterized by DSI, fracture development on both contact surfaces becomes more pronounced. Under the shear effects at the interfaces, cracks initiate from these surfaces and predominantly concentrated within the central coal, ultimately resulting in fragmentation of coal and rock in the boundary.
Comparison analysis of different instability characteristics
Figure 12 shows a comparison analysis of the instability parameters of the composite model across three modes of instability. As illustrated, the peak instability strength exhibits a progressive decline across the sequence FI → SSI → DSI, while the fracture damage rate concurrently increases. These trends indicate that interfacial shear stress, activated upon slip initiation, promotes the progressive evolution of internal fractures within the composite model.

Comparative analysis of different forms of instability:
Overall, FI is mainly controlled by the compressive strength of the coal. Before the failure, the contact surface remains basically stable, and the accumulated elastic strain energy in the system is mainly used to drive the initiation and expansion of fractures within the coal, ultimately leading to overall crushing. While SSI and DSI start to be controlled by the shear strength of the coal–rock contact surface. When the interface shear stress reaches its limit, a sudden sliding occurs. This sliding is an unstable dynamic process that instantly changes the stress state of the structure and releases a large amount of energy. Therefore, the slip instability of the contact surface exhibits the characteristics of “low stress” (occurring earlier than the coal being fully compressed) and “high energy release” (due to the sudden conversion of elastic strain energy into kinetic energy and fracture energy).
The influence of coal and rock parameters
Inclination angle
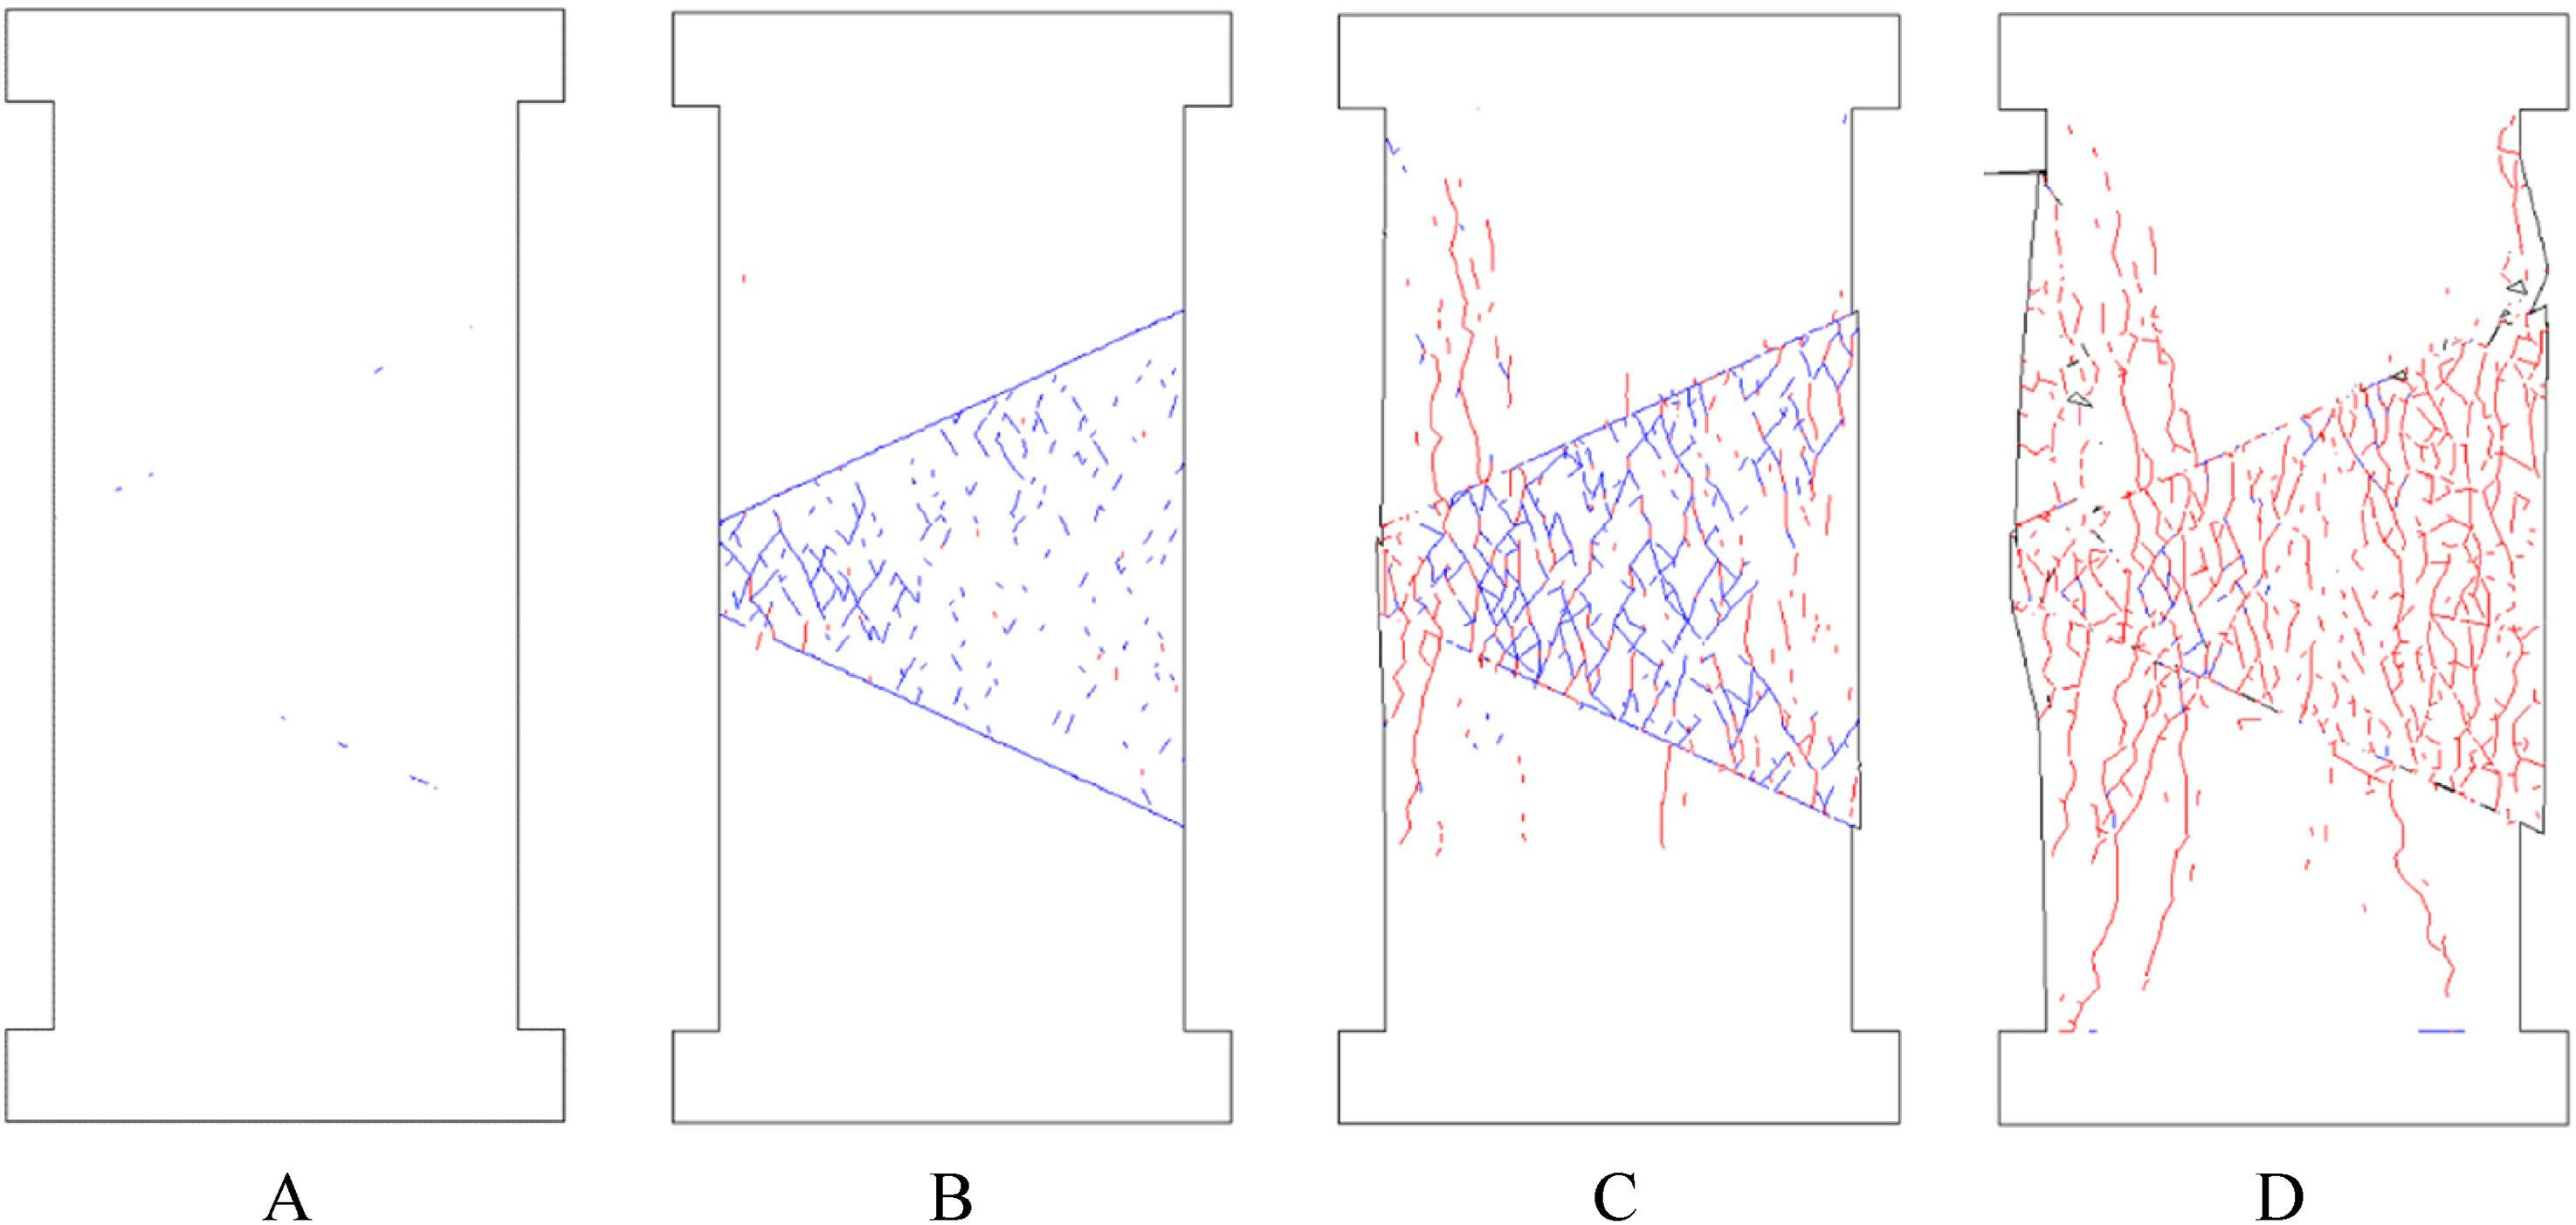
Models S-1, S-2, S-3, and S-4 were selected to systematically investigate how variations in the inclination angle of the upper contact surface influence the structural instability of the composite model, while the lower contact surface was held constant at a fixed inclination angle. Figure 13 shows the instability characteristics under varying inclination angles.

Instability characteristics under varying inclination angles.
The lower contact surfaces of Models S-1 and S-2 exhibited significantly greater slip relative to their upper contact surfaces, resulting in fragmentation of the coal–rock mass—both features characteristic of SSI. Overall, both models sustained substantial damage, with particularly severe fracturing observed in the upper rock and central coal. Model S-1 displayed more extensive fracture development in the upper coal compared to Model S-2, whereas fracture propagation in the lower coal was less pronounced. Additionally, Model S-2 exhibited a localized bulging deformation on the left side of its midsection. Models S-3 and S-4 also experienced slip along both upper and lower contact surfaces, resulting in further fragmentation of coal and rock. However, in contrast to Models S-1 and S-2, the extent of fracture development in Models S-3 and S-4 was comparatively limited. Notably, in Model S-4, fractures within upper rock propagated vertically upward from the contact surface—a pattern likely attributed to shear stresses induced by slippage at the upper interface. Meanwhile, Model S-3 exhibited a distinct bulge in the left middle coal, accompanied by spalling in the right upper rock. In summary, when failure in the composite model occurred through SSI, increasing inclination angles at the upper contact surface were associated with enhanced fracture development in the lower rock. Conversely, fracture development in the upper rock diminished—a trend potentially influenced by the relative orientations of the two contact surfaces. Under conditions characterized by DSI, an increase in the inclination angle of the upper contact surface corresponded to a reduction in overall fracture development throughout the model.
Figure 14 shows the stress–strain curve and peak stress under varying inclination angles. As the inclination angle increases, the peak instability stress of the composite model exhibits a consistent decreasing trend. During the initial loading stage, the stress–strain curves of all composite models remain highly similar. This phenomenon can be attributed to the fact that the uniaxial compressive strength of coal is considerably lower than that of rock. Deformation primarily occurs in the weaker coal. Furthermore, the simulation parameters and experimental conditions are set under idealized numerical conditions, which contribute to the observed consistency in early stress–strain behavior across models. Additionally, the rate of stress accumulation in the composite model also declines progressively with increasing upper contact surface inclination angle. When the dominant failure mode of the model is characterized by SSI, the rate of stress accumulation diminishes markedly. Specifically, the stress growth rate associated with slip-type instability declines substantially, reflecting an enhanced susceptibility to deformation and macroscopic instability under intensified interfacial shear effects. For example, progressive fracture propagation or relative interfacial slip can trigger localized strain energy release, thereby reducing the rate of stress increase. Among these factors, the influence of contact surface slip on the stress growth rate is particularly pronounced. In the IRCRS, coal exhibits lower strength compared to rock and thus undergoes uniaxial compression. Once the composite model reaches its failure strength, the stress declines after peaking. As loading continues, the coal seam is progressively compressed, leading to internal damage within the coal body, which results in an initial decrease followed by an increase in stress. With further loading, the IRCRS experiences overall instability, and relative slip occurs between the coal and rock along the upper contact surface, causing stress to decrease again. As the angle of the lower contact surface increases, stress fluctuations become more pronounced. Compared to fragmentation-induced instability, slip-induced instability results in more significant stress fluctuations.
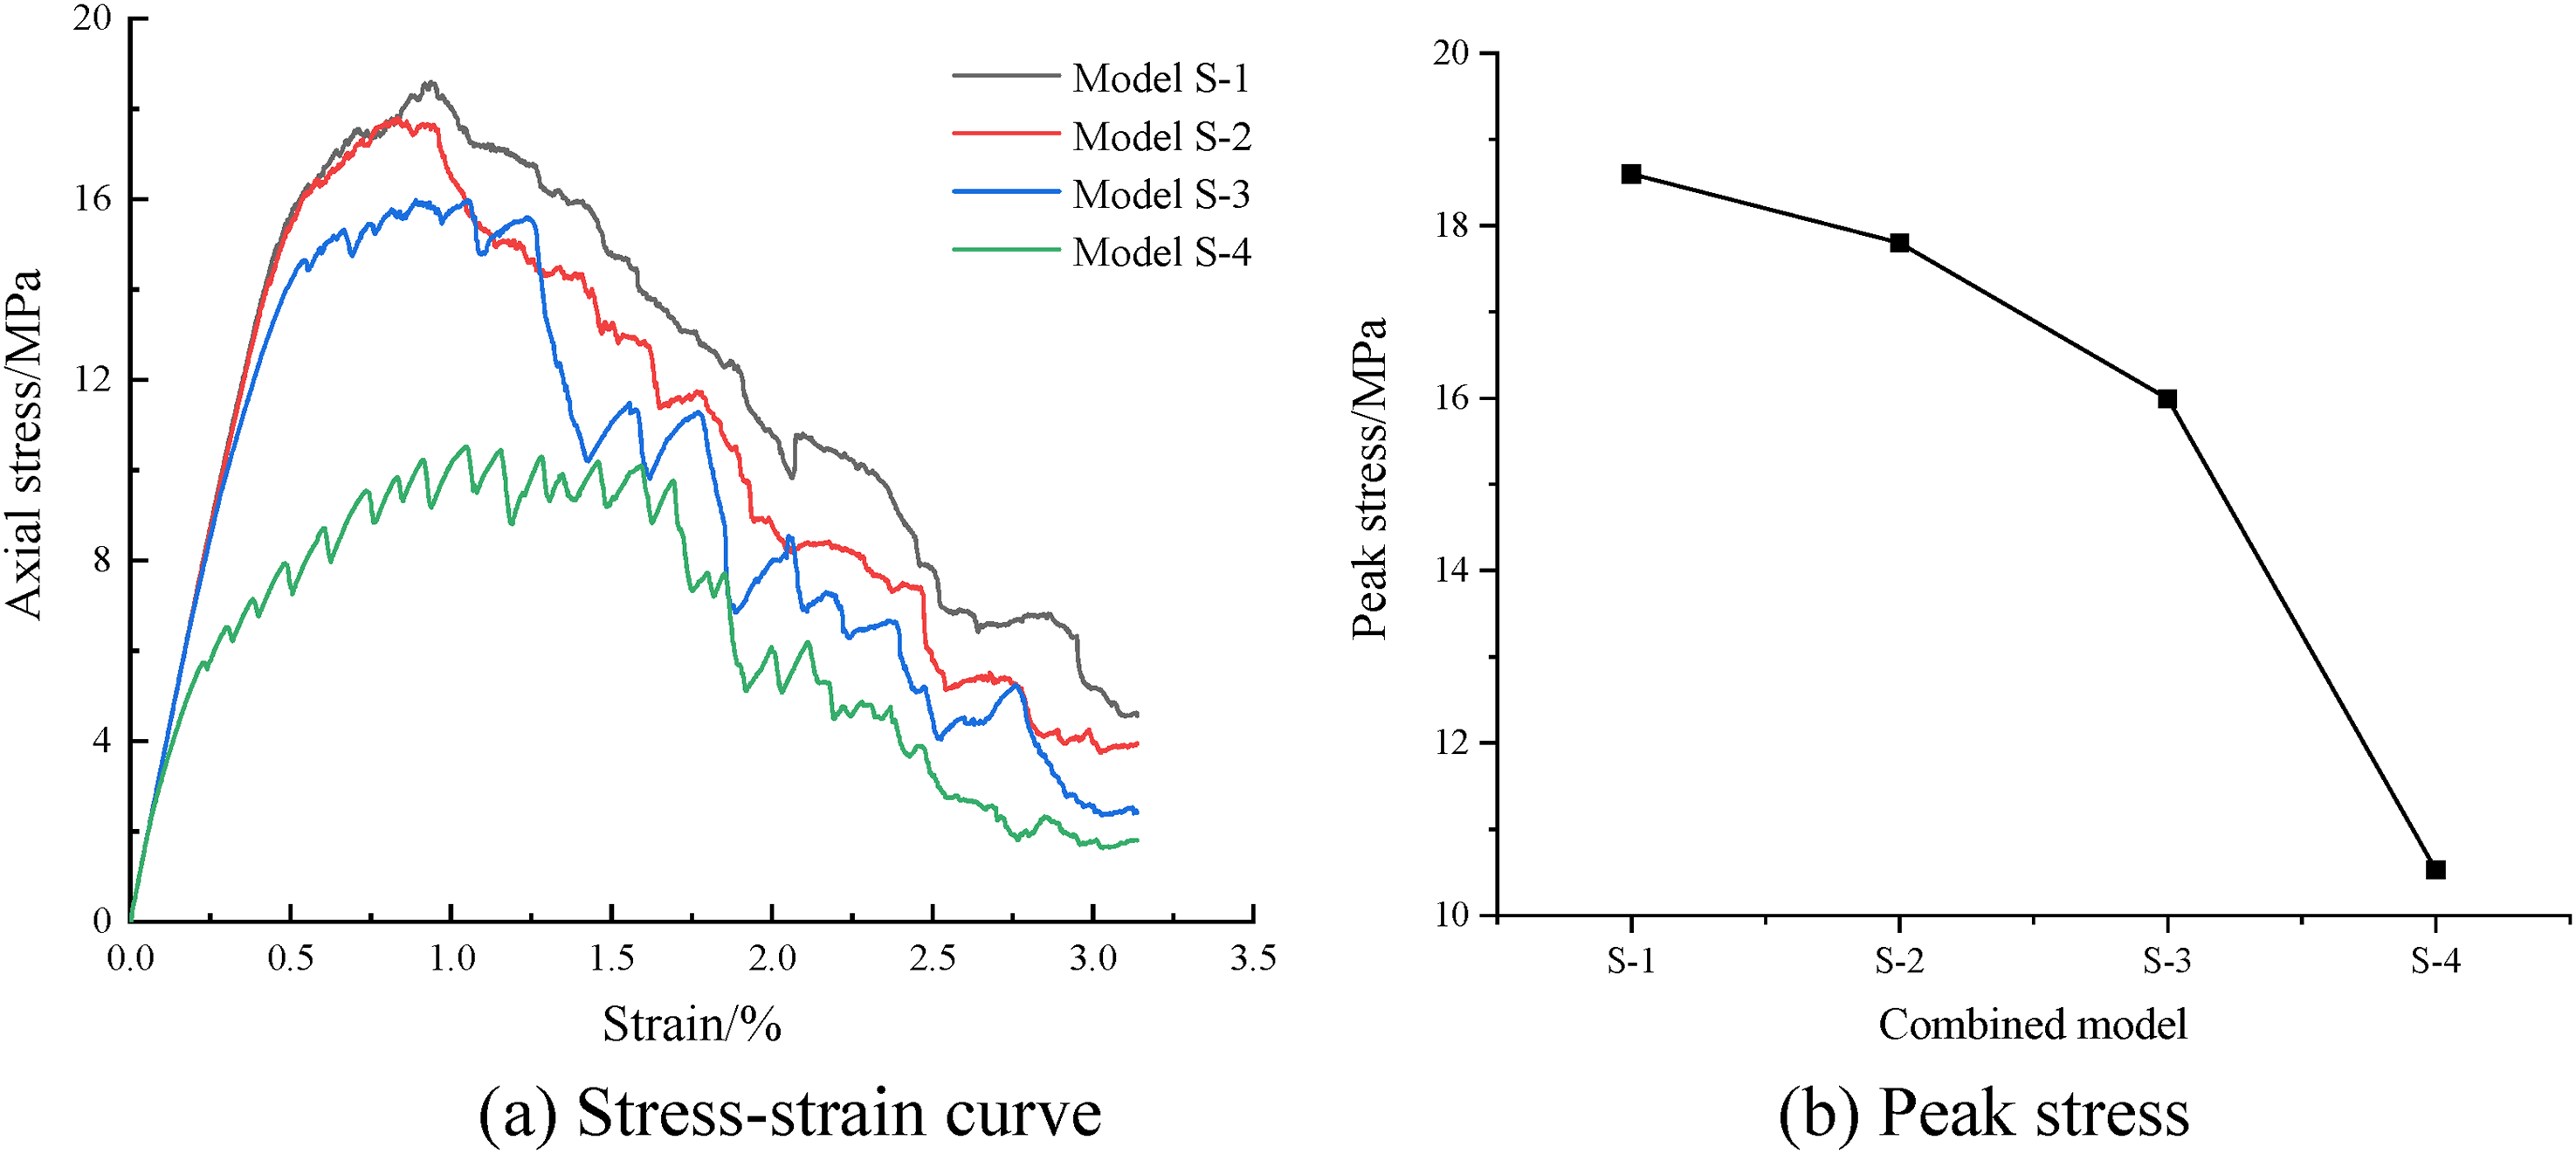
The stress–strain curve and peak stress under varying inclination angles:
During the failure process of the IRCRS, internally stored elastic energy is progressively dissipated. Energy evolution is quantitatively monitored via numerical simulation, and the resulting energy increment curve captures the spatiotemporal development of internal fracturing. Figure 15 shows the energy increment under varying inclination angles. In the initial loading stage, minimal energy release occurs, primarily attributable to compaction of pre-existing microfractures. As axial stress approaches its peak value, cumulative energy remains comparatively low overall, punctuated by intermittent high-magnitude energy bursts—indicative of nucleation and propagation of new cracks. Following the peak stress, each abrupt stress drop corresponds to a distinct high-energy event, strongly correlated with macroscopic slip along localized shear surfaces. As the stress increases again, low-energy releases predominate, indicating sustained internal fracture development. When the inclination angle of the upper contact surface is smaller, the model exhibits a greater number of fractures but experiences relatively minor energy fluctuations. As the inclination angle increases, the stress curves display more pronounced fluctuations, high-energy spikes occur more frequently, and the extent of slip intensifies.

Energy increment under varying inclination angles:
In summary, the susceptibility to slip instability in the composite model increases monotonically with the inclination angle of the upper contact surface. Concurrently, fracture development is progressively suppressed as the inclination angle increases. Moreover, the peak stress required to induce instability decreases with increasing inclination angles. Notably, the instability strength associated with FI is greater than that of SSI, which in turn surpasses that of DSI.
Contact surface roughness
Based on Model S-3, variations in contact surface roughness are quantified through adjustments to the friction angle of the contact surface. A higher friction angle corresponds to greater roughness, while maintaining identical friction angles for both the upper and lower contact surfaces. Please refer to Table 5 for further details.
Friction angle setting of different contact surfaces.
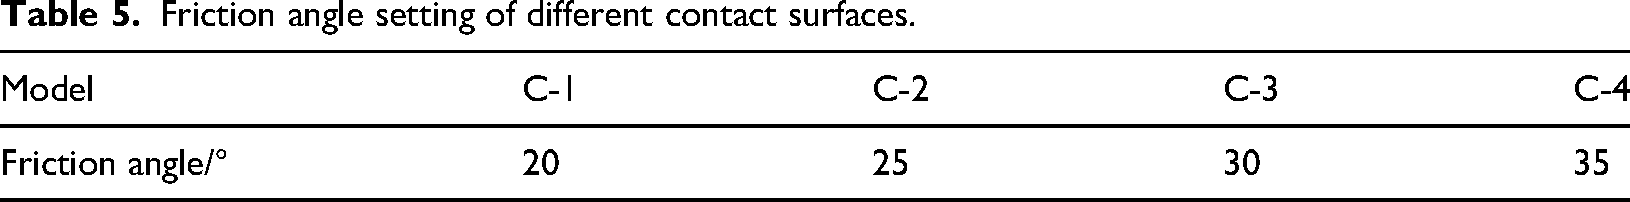
Figure 16 shows the instability characteristic under varying contact surface roughness. An increase in the contact surface roughness of the composite model leads to a sequential change in instability modes, transitioning from DSI to SSI, and ultimately to FI. Consequently, both the extent of fracture propagation and the overall damage level within the model progressively intensify. A review of relevant literature indicates that variations in the coal-to-rock height ratio within the model result in an asymmetric stress distribution, with the left side experiencing a higher stress magnitude than the right. This asymmetry exacerbates stress concentration on the left side, thereby promoting localized deformation in that region. Furthermore, shear slip at the contact surface contributes to localized deformation, as contact surface roughness increases, the resistance to shear slip also rises. Accordingly, when the contact surface roughness reaches a sufficiently high level, both stress concentration and associated deformation become markedly pronounced on the left side of the model.
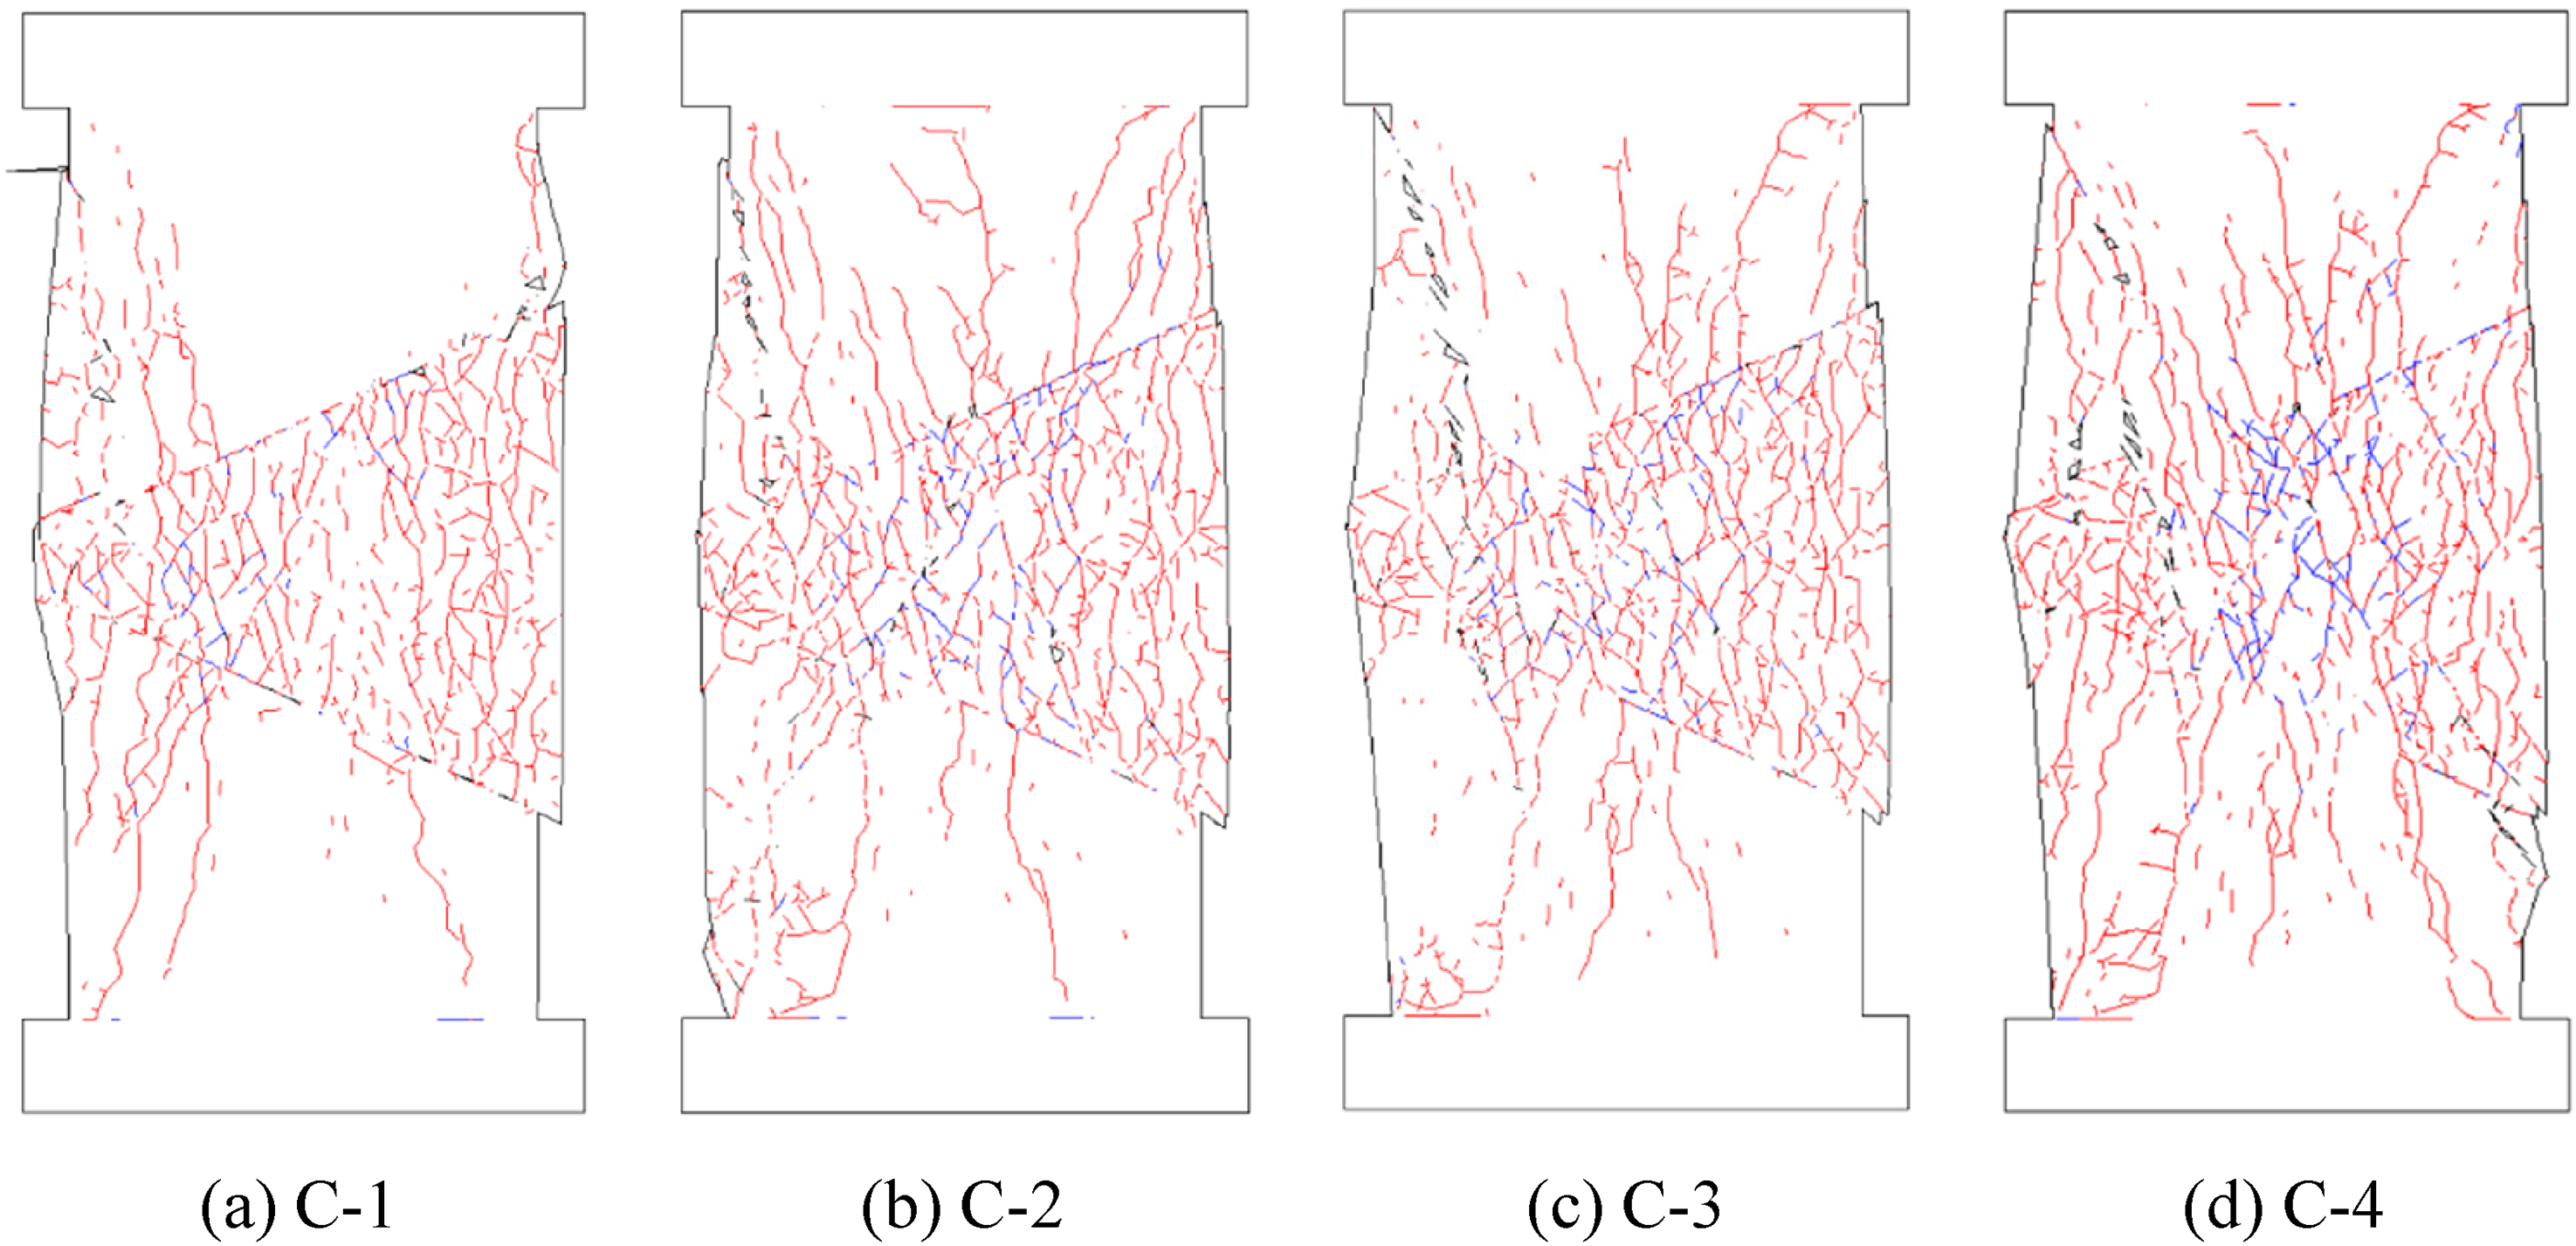
Instability characteristic under varying contact surface roughness.
Figure 17 shows the stress–strain curve and peak stress under varying contact surface roughness. The peak instability stress of the model gradually increases with increasing roughness. Compared with Models C-1 and C-2, Models C-3 and C-4 exhibit a reduced degree of shear slip at the contact surfaces as roughness increases. Prior to instability, fractures initiate and propagate more readily, leading to a relatively gradual increase in peak stress and a higher degree of overall fragmentation within the composite model. The extent of overall fragmentation increases with roughness, which corresponds to a progressive rise in peak instability stress.

The stress–strain curve and peak stress under varying contact surface roughness: (a) stress–strain curve and (b) peak stresses.
Figure 18 shows the energy increment under varying contact surface roughness. When the contact surface roughness is low, energy release predominantly occurs post-peak, accompanied by significant post-peak energy fluctuations. In contrast, as contact surface roughness increases, the magnitude of energy released remains relatively low throughout loading. The composite model exhibits more extensive crack development, reduced stress curve fluctuations, and frequent low-energy events—suggesting a greater degree of FI.

Energy increment under varying contact surface roughness:
In summary, the propensity for slip instability in the composite model diminishes with increasing contact surface roughness. Both the peak stress required to induce instability and the extent of crack development increase as surface roughness increases.
Coal strength
The influence of varying coal strengths on the instability characteristics of composite models is investigated based on Model S-3 by systematically adjusting the coal strength. Four distinct coal strength levels are established to form four corresponding IRCRS, as summarized in Table 6.
Coal strengths setting of different composite model.
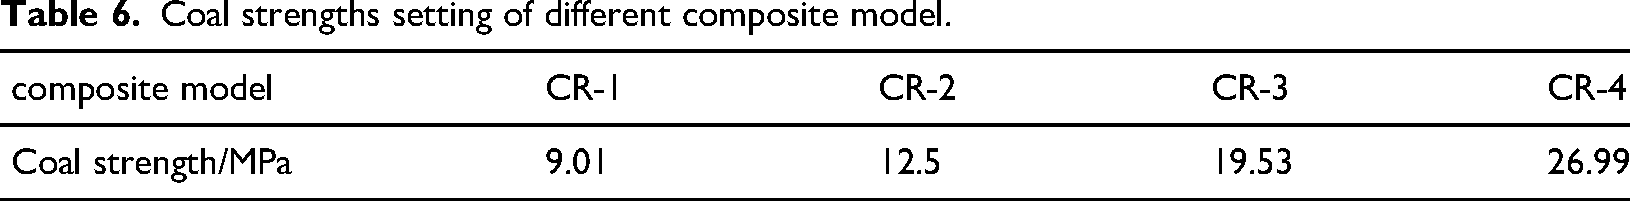
Figure 19 shows the instability characteristics under varying coal strengths. While the upper and lower rock retain consistent strength, the coal strength increases gradually. All four models exhibit slip and fragmentation at both contact surfaces. As the coal strength increases, the fracture density within the upper and lower rock initially rises before subsequently diminishing, accompanied by a progressive reduction in fragmentation within the model's left region. When the coal strength is relatively low, the upper rock experiences rapid crack propagation on its left side, primarily driven by slip at the contact surface, resulting in pronounced torsional fragmentation. In Model CR-5, the stark disparity between coal and rock strength constrains crack development in the upper rock, leading to a gradual release of strain energy. Consequently, slip at the contact surface amplifies torsional deformation, intensifies stress concentration in the lower rock, and exacerbates its fragmentation. With further increases in the coal strength, rock fractures become more pronounced under shear forces at the contact surfaces. At elevated coal strengths, both sides of the upper rock undergo fragmentation due to torsional effects induced by slip at the lower contact surface.

Instability characteristic under varying coal strengths.
Figure 20 shows the stress–strain curve and peak stress under varying coal strengths. It is evident that the peak stress of the composite model increases progressively with increasing coal strength. Specifically, as coal strength rises from 9.01 MPa to 26.99 MPa, the peak stress of the composite model increases from 11.06 MPa to 25.32 MPa, approaching the magnitude of the coal strength itself. This observation indicates that the strength of the composite model is fundamentally governed by the strength of the coal.
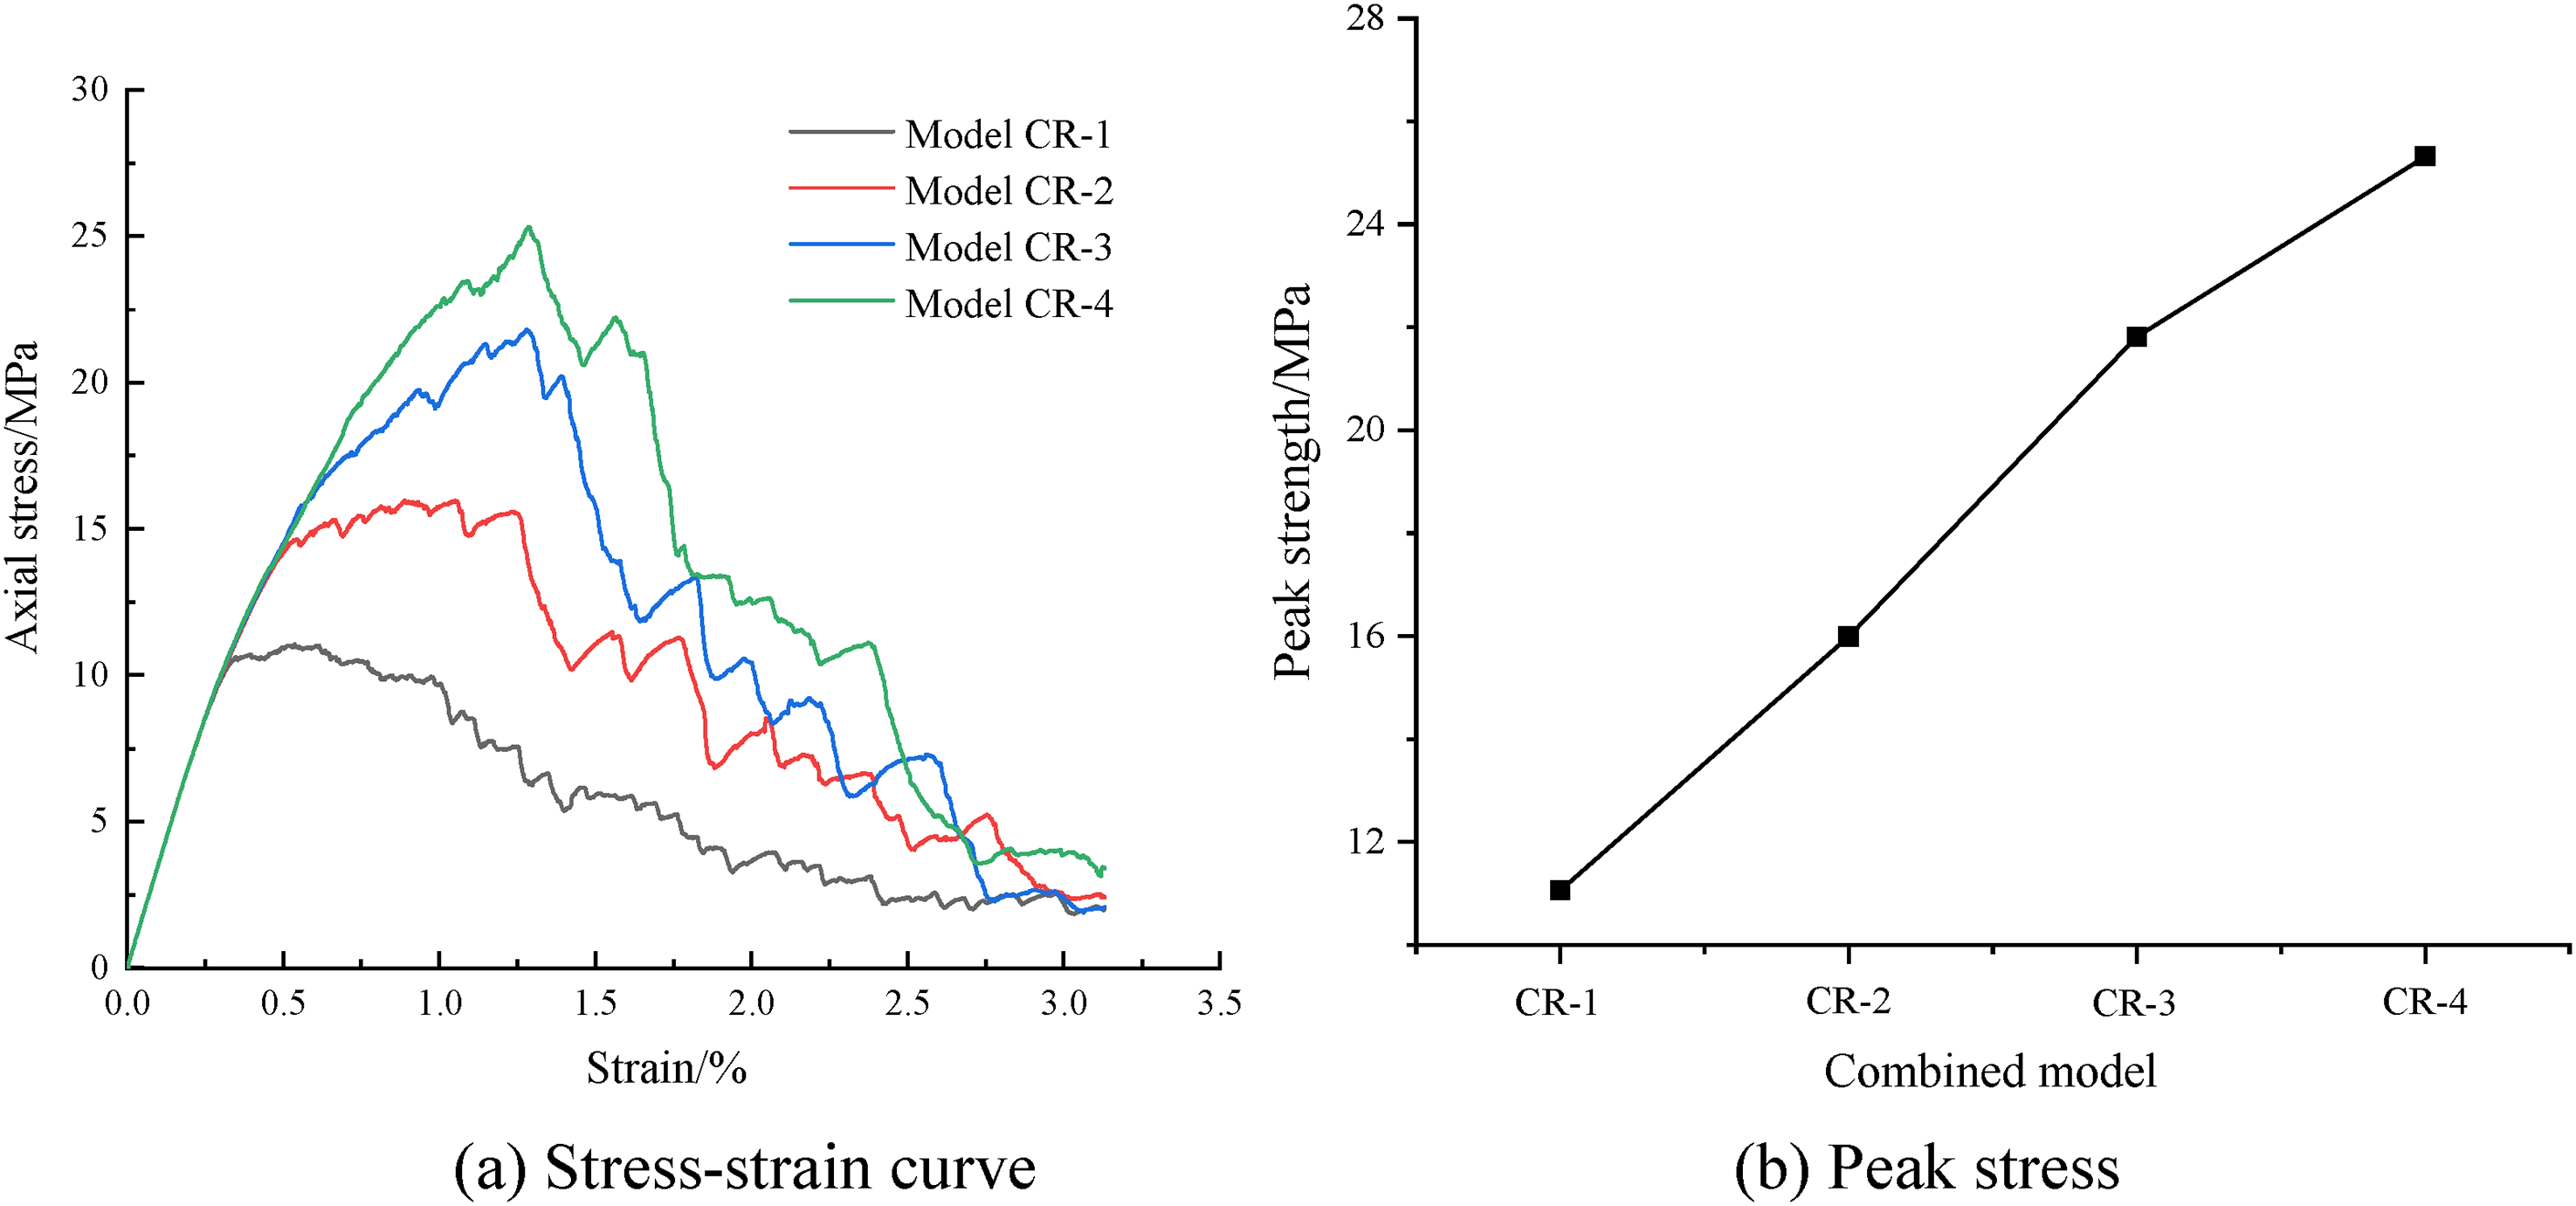
The stress–strain curve and peak stress under varying coal strengths:
The stress–strain curves for Models CR-5 and CR-2 exhibit no distinct peak, instead showing continuous fluctuations. This behavior can be attributed to their more fragmented nature relative to Models CR-6 and CR-7. With increasing coal strength, fragmentation-induced instability becomes progressively less likely to occur during slip events.
Figure 21 shows the energy increment under varying coal strengths. Similar to composite models with varying rock strengths, each stress drop following the peak is accompanied by significant energy releases. This phenomenon indicates that the propagation and coalescence of internal fractures lead to instability within the composite model, resulting in substantial energy release.
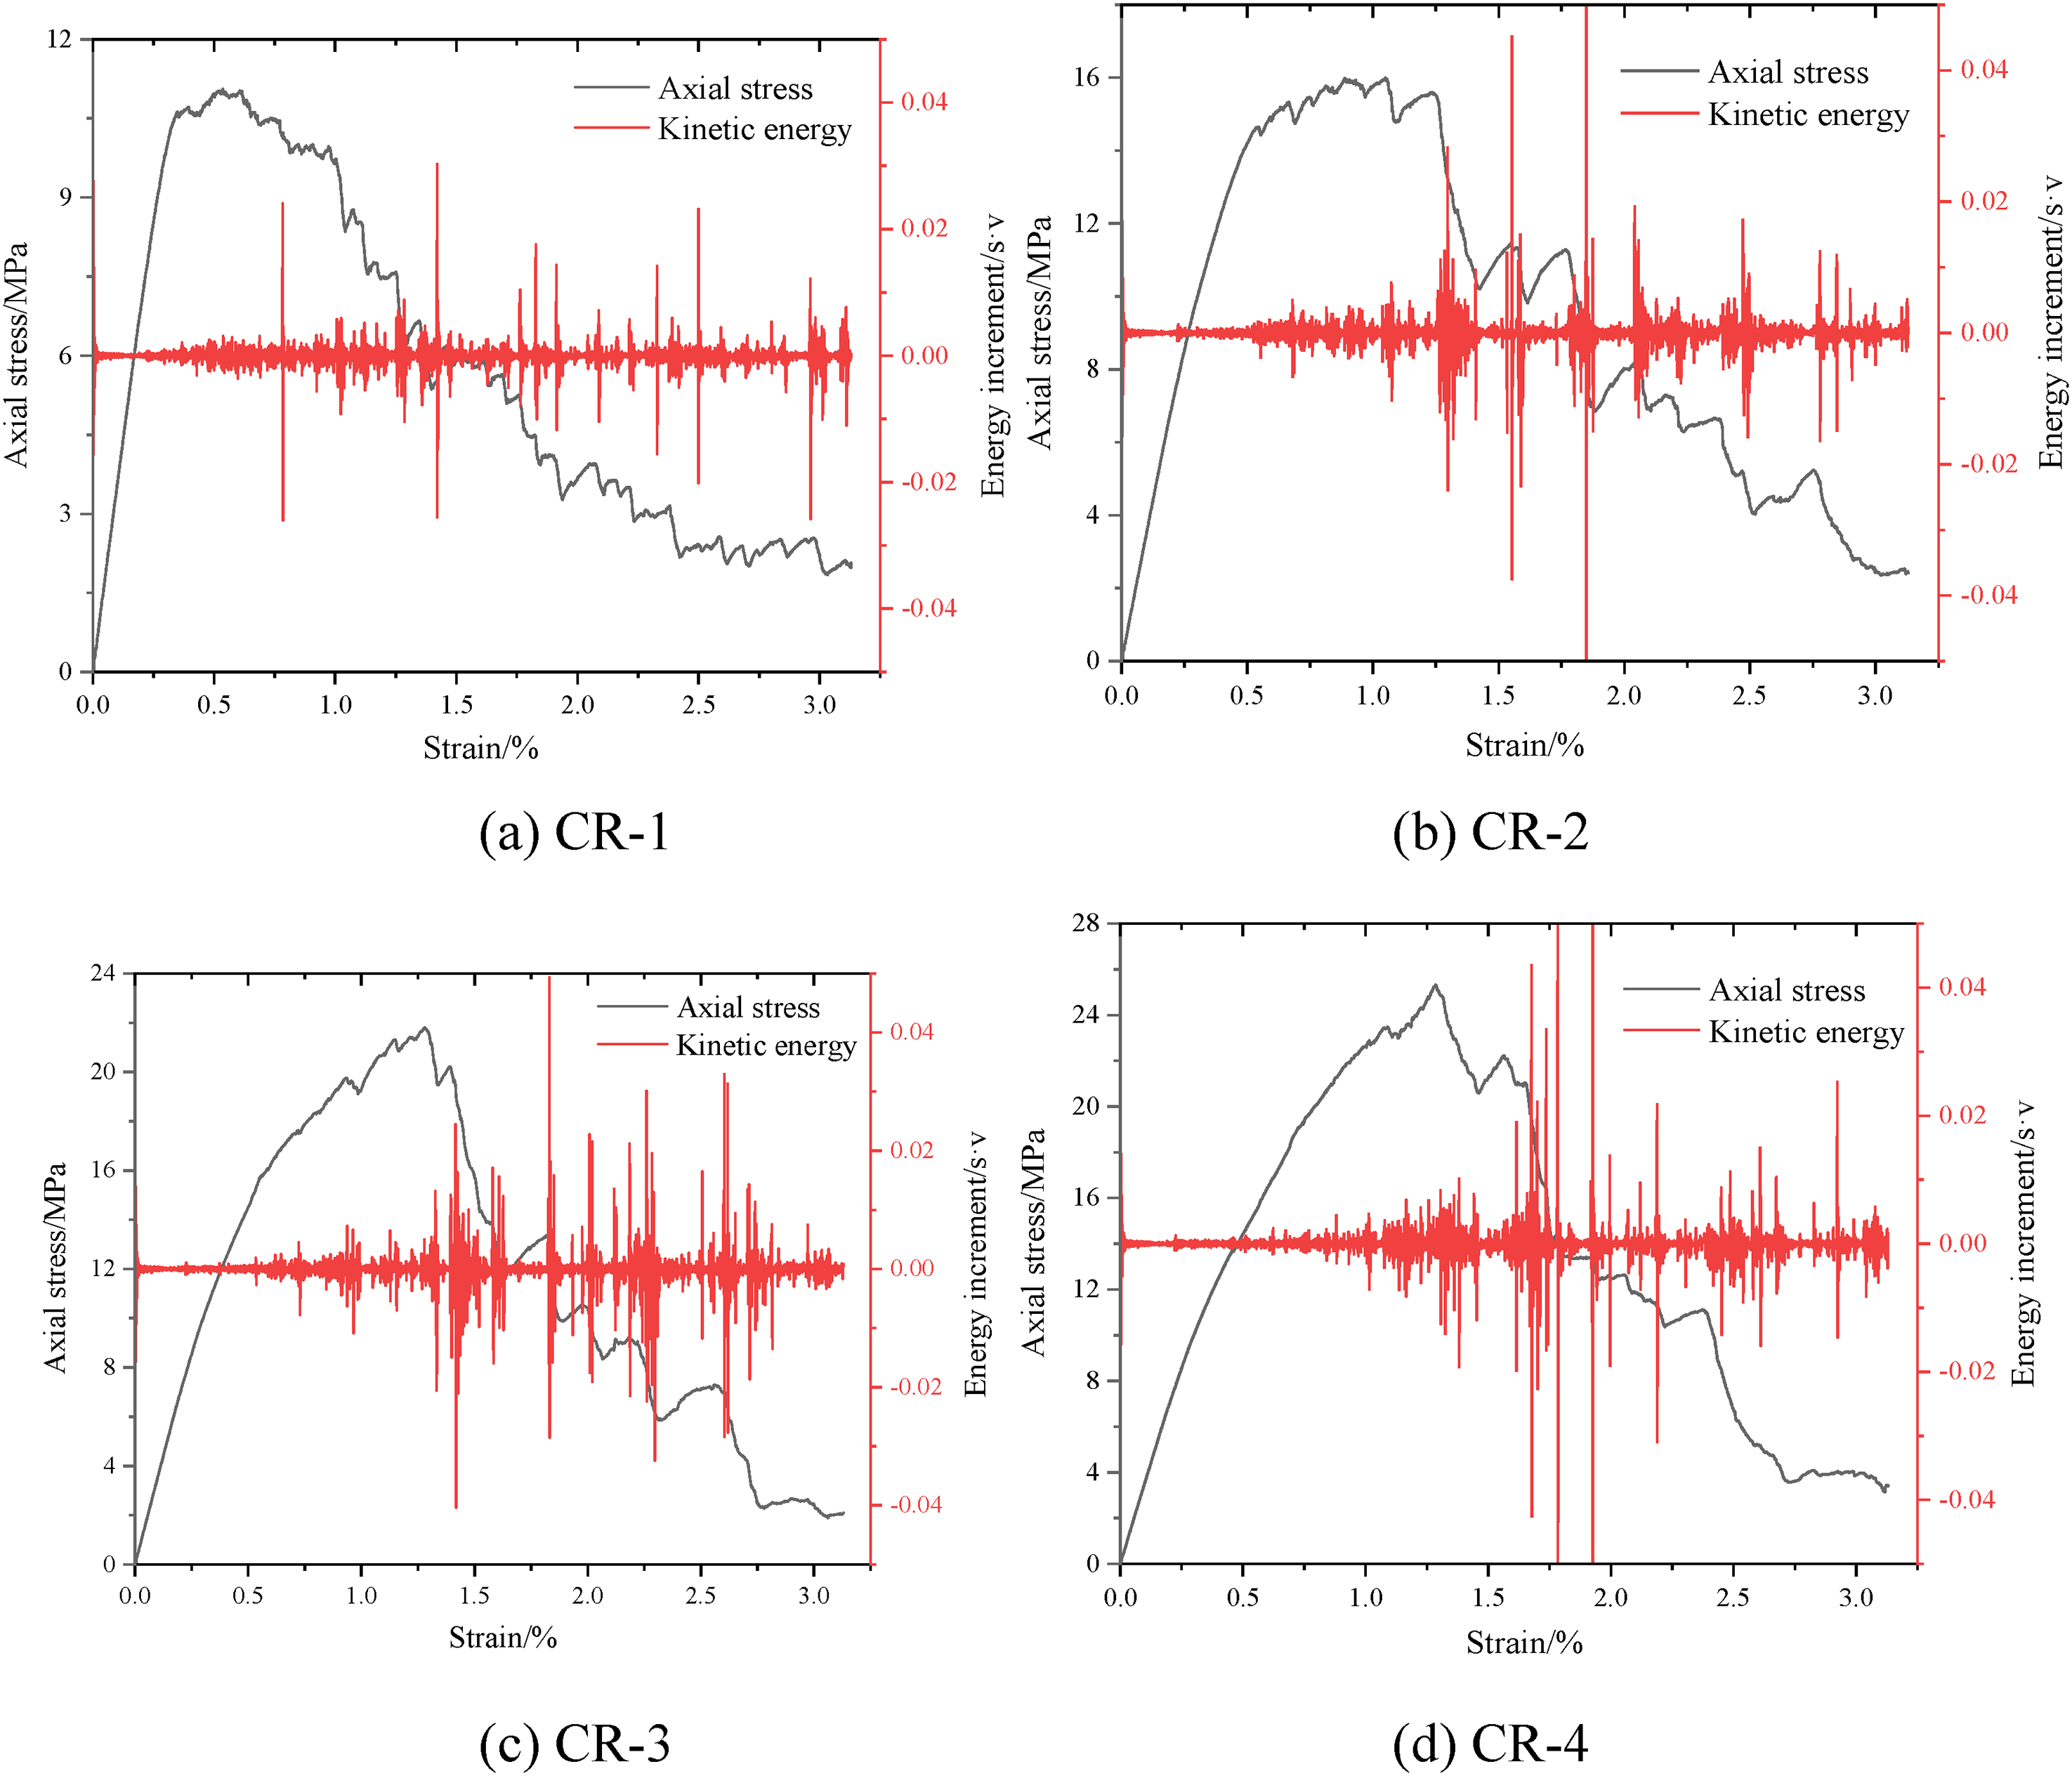
Energy increment under varying coal strengths:
In summary, the peak stress required to induce instability in the composite model increases markedly with increasing coal strength. Coal strength exerts a considerable influence on the overall instability threshold of the composite model.
Discussion
This study systematically investigated the three failure modes and their evolution characteristics of the IRCRS using UDEC numerical simulations. In contrast to previous studies, which primarily focused on horizontal or single-contact surface composite structures, this work is the first to specifically examine double-contact surface structures, which more accurately represent the geological conditions of coal seams in scoured zones. As a result, a more complex failure competition mechanism has been revealed.
The mechanical mechanism and energy transformation of the unstable mode
As demonstrated in Section 3, the fundamental distinction among the FI, SSI, and DSI modes lies in their dominant failure criteria. The FI mode is primarily governed by the compressive strength of the coal, with the coal–rock interface remaining stable prior to failure. In contrast, the initiation of the SSI and DSI modes occurs when the shear stress at the coal–rock interface reaches the Coulomb shear strength limit, thereby inducing interfacial slip. This slip constitutes an unstable dynamic process that instantaneously alters the load transfer path within the structure, resulting in the peak bearing capacity being attained at a relatively lower stress level—referred to as “low stress.” More significantly, the slip event triggers the sudden release of a substantial amount of elastic strain energy stored in the system. This released energy not only contributes to the formation of new fracture surfaces but also converts a considerable portion into kinetic energy of the system, which is observed as a sharp pulse in kinetic energy on the energy monitoring curve—referred to as “high energy release.” In comparison, the energy release process in the FI mode is more gradual. These findings enhance the understanding of the dynamic instability mechanisms in composite structures, indicating that interfacial slip plays a critical role in initiating high-impact geomechanical failures.
The competitive mechanism influenced by parameters
The parameter analysis presented in Section 4 demonstrates that variations in the inclination, roughness, and coal–rock strength of the contact surface fundamentally influence the competitive relationship between the contact surface slip criterion and the internal fracture criterion of the coal–rock mass. For example, an increase in the inclination angle (α) of the upper contact surface reduces interfacial normal stress while increasing shear stress, thereby facilitating the fulfillment of the Coulomb slip criterion. This enhances the propensity for SSI/DSI and suppresses the development of the FI, which is primarily governed by internal crushing. These findings align with previous studies (Wang et al., 2023; Chen et al., 2017; Huang and Liu, 2013; Xue et al., 2022) on single inclined contact surfaces; however, the presence of a double inclined contact surface may induce more complex stress redistribution and torsional effects. Likewise, an increase in contact surface roughness—reflected by a higher friction angle—directly improves the interfacial shear resistance, making slip less likely and promoting failure transition into the internal crushing of the coal–rock mass, consequently leading to a higher peak strength in the FI. Furthermore, an increase in coal strength enhances the overall load-bearing capacity of the composite structure, bringing its mechanical behavior closer to the intrinsic strength limit of the coal itself.
Practical significance and uncertainty
The findings of this study have direct implications for the prevention of rockburst in scoured zones. First, the three identified instability modes (FI, SSI, DSI) provide a more refined classification framework for assessing coal–rock structural stability in field applications. Second, the rapid propagation of tensile fractures may serve as a precursor to macroscopic failure, offering potential theoretical indicators for early warning systems based on microseismic or acoustic emission monitoring. Third, the study demonstrates that slip-type instabilities (particularly DSI) are characterized by “low stress and high energy release” which presents the most significant hazard potential. Consequently, engineering practices should prioritize avoiding geological configurations conducive to double-interface slip (e.g., large-angle structural combinations) or implement reinforcement measures to enhance interfacial shear resistance.
However, as a numerical investigation, this study is subject to certain limitations. The model is based on simplified ideal elastic and Coulomb slip constitutive laws, and does not account for time-dependent stress effects such as rheological behavior and damage-induced softening in coal–rock materials. Furthermore, all conclusions are derived from two-dimensional simulations with specific geometric dimensions, which may not fully capture the spatial characteristics of actual three-dimensional geological formations. With respect to the quantitative threshold of tensile fractures as precursory indicators and the precise criterion for slip displacement, further calibration through integrated physical experiments and field observational data remains necessary. Future studies can build upon the current framework by incorporating more sophisticated constitutive models and conducting three-dimensional numerical simulations to achieve a more comprehensive understanding of the instability mechanisms underlying IRCRS.
Conclusions
A systematic investigation into the instability characteristics of the rock–coal–rock composite structure (IRCRS), tailored to the geological features of the scoured zone, was conducted. Three distinct instability modes (FI, SSI, DSI) were identified. The analysis revealed that shear fractures predominantly govern fracture propagation, whereas tensile fracture penetration is responsible for ultimate structural failure.
The UDEC numerical simulations have demonstrated distinct differences in the intensity sequences (FI > SSI > DSI) and energy release behaviors among the three models. Notably, the analyses have elucidated the catastrophic nature of slip instability (SSI and DSI), characterized by “low stress concentration coupled with high energy release.” These results enhance the understanding of failure mechanisms in coal–rock composite structures under complex geological conditions.
With the increase of contact surface inclination, roughness, and coal–rock strength, the propensity for slip instability in IRCRS increases accordingly, while fracture development is suppressed and the peak stress required for trigger instability decreases. Among these factors, coal strength has a significant influence on the overall instability strength of the composite model. Therefore, during mining operations in scoured zones, the coupled mechanisms of slip and fracture instability become more challenging to predict and control from an engineering perspective, thereby posing the most severe geotechnical hazard.
Footnotes
Funding
We gratefully wish to acknowledge Sponsored by the National Natural Science Foundation of China (52504133) and Natural Science Foundation of Henan (252300421472, 252300423439) and Key R&D and promotion projects in Henan Province (24102320209) and Key Scientific Research Projects for Higher Education of Henan Province (26A440011) and Research Project on Science and Technology of Nanyang City (24KJGG018, 24KJGG066) and Innovative Technology Team for Water Pollution Control and Solid Waste Resource Utilization of Nanyang Institute of Technology.
Declaration of conflicting interests
The authors declared no potential conflicts of interest with respect to the research, authorship, and/or publication of this article.
Data availability
The datasets used and analyzed during the current study are available from the corresponding author on reasonable request.