
Abstract
Even the European Union is the international leader regarding the energy transition, the consumers are increasingly affected by overlapping crises affecting income levels and energy prices, as the geopolitical context has become more volatile. The energy poverty is a complex problem that is intricately linked to social, political, and economic elements like low income, skyrocketing energy prices, and inefficient housing. In addition to restricting comfort and well-being, energy poverty exacerbates social inequality, has serious health effects, and impedes the development of a fair and sustainable energy transition. The European Union and its Member States have taken strong action to reduce energy poverty through focused policies and initiatives in recognition of the seriousness of this issue and to assure the access to energy and to improve the energy resilience . Significant challenges still exist, though, necessitating a comprehensive and progressive strategy to guarantee that everyone has access to sustainable, inexpensive, and clean energy. In this study, the authors considered the evolution of some factorial variables that have an influence on the phenomenon of energy poverty at the level of the European Union, using in this sense statistical data taken from official sources, such as Eurostat, from the last 21 years (2004–2024). This analysis is useful to understand the trends and factors that influence energy consumption, energy prices, as well as the population's ability to maintain adequate thermal comfort in homes. This study adds to the expanding conversation on sustainable energy access by revealing the patterns and factors influencing energy consumption, cost, and affordability. It reaffirms the pressing need for an energy system that is resilient, inclusive, and geared to the future—one that enables every home to prosper in a world that is cleaner, fairer, and more sustainable.
Introduction
The energy is topic of major interested from different perspectives—economic, social, technical, geopolitical and researchers focused on specific issues taking in account the complexity of transition to low carbon economy (Bâra and Oprea, 2024; Dumitrescu et al., 2023; Fernández-González et al., 2022; Gabriela and Catalin, 2015; Hysa et al., 2023; Munteanu et al., 2020; Panait et al., 2019; Petrescu et al., 2023; Popescu et al., 2022; Tudorică et al., 2024; Vasile and Grigorescu, 2024).
The energy transition and overlapping crises have generated an amplification of social challenges, with consumers increasingly affected by rising energy prices, volatility and falling incomes. The result of the interaction of these factors is the deepening of the energy poverty phenomenon that affects, with varying intensities, all countries in the European Union, despite the efforts of public authorities to mitigate the vulnerability of cities to the challenges caused by the change in the energy mix. The promotion of sustainable development has put the need for access to energy at the center of attention. SDG 7—Affordable and clean energy correlated with other sustainable development objectives—Industry, innovation and infrastructure (SDG 9), Reduced inequalities (SDG 10), Sustainable cities and communities (SDG 11), Responsible consumption and production (SDG 12), Climate action (SDG 13) and Partnerships for the goals (SDG 17) put energy at the forefront of the concerns of public authorities who have understood the need to focus on citizens in order to ensure a decent standard of living (Asif, 2022; Kajoskoski et al., 2025; Popescu et al., 2024a, Shortall and Mengolini, 2025).
The phenomenon of energy poverty has become a central concern at international level and especially within the European Union (EU), highlighting the socio-economic inequalities and sustainability challenges faced by various communities. Defined as the inability to access essential energy services at a reasonable price, energy poverty impacts not only on the daily comfort of households, but also on health, education and, in general, affecting the quality of life. This problem (Figure 1) is amplified by rising energy costs, climate change and the transition to renewable energy sources, generating a crisis among the most vulnerable segments of the population (Bîrsănuc, 2022; Eparu et al., 2024; Morina et al., 2021; Neacsa et al., 2020; Panait et al., 2024; Shahzad et al., 2022; Simionescu et al., 2023; Sinha et al., 2022; Zaharia et al., 2017c; Zhao et al., 2022).
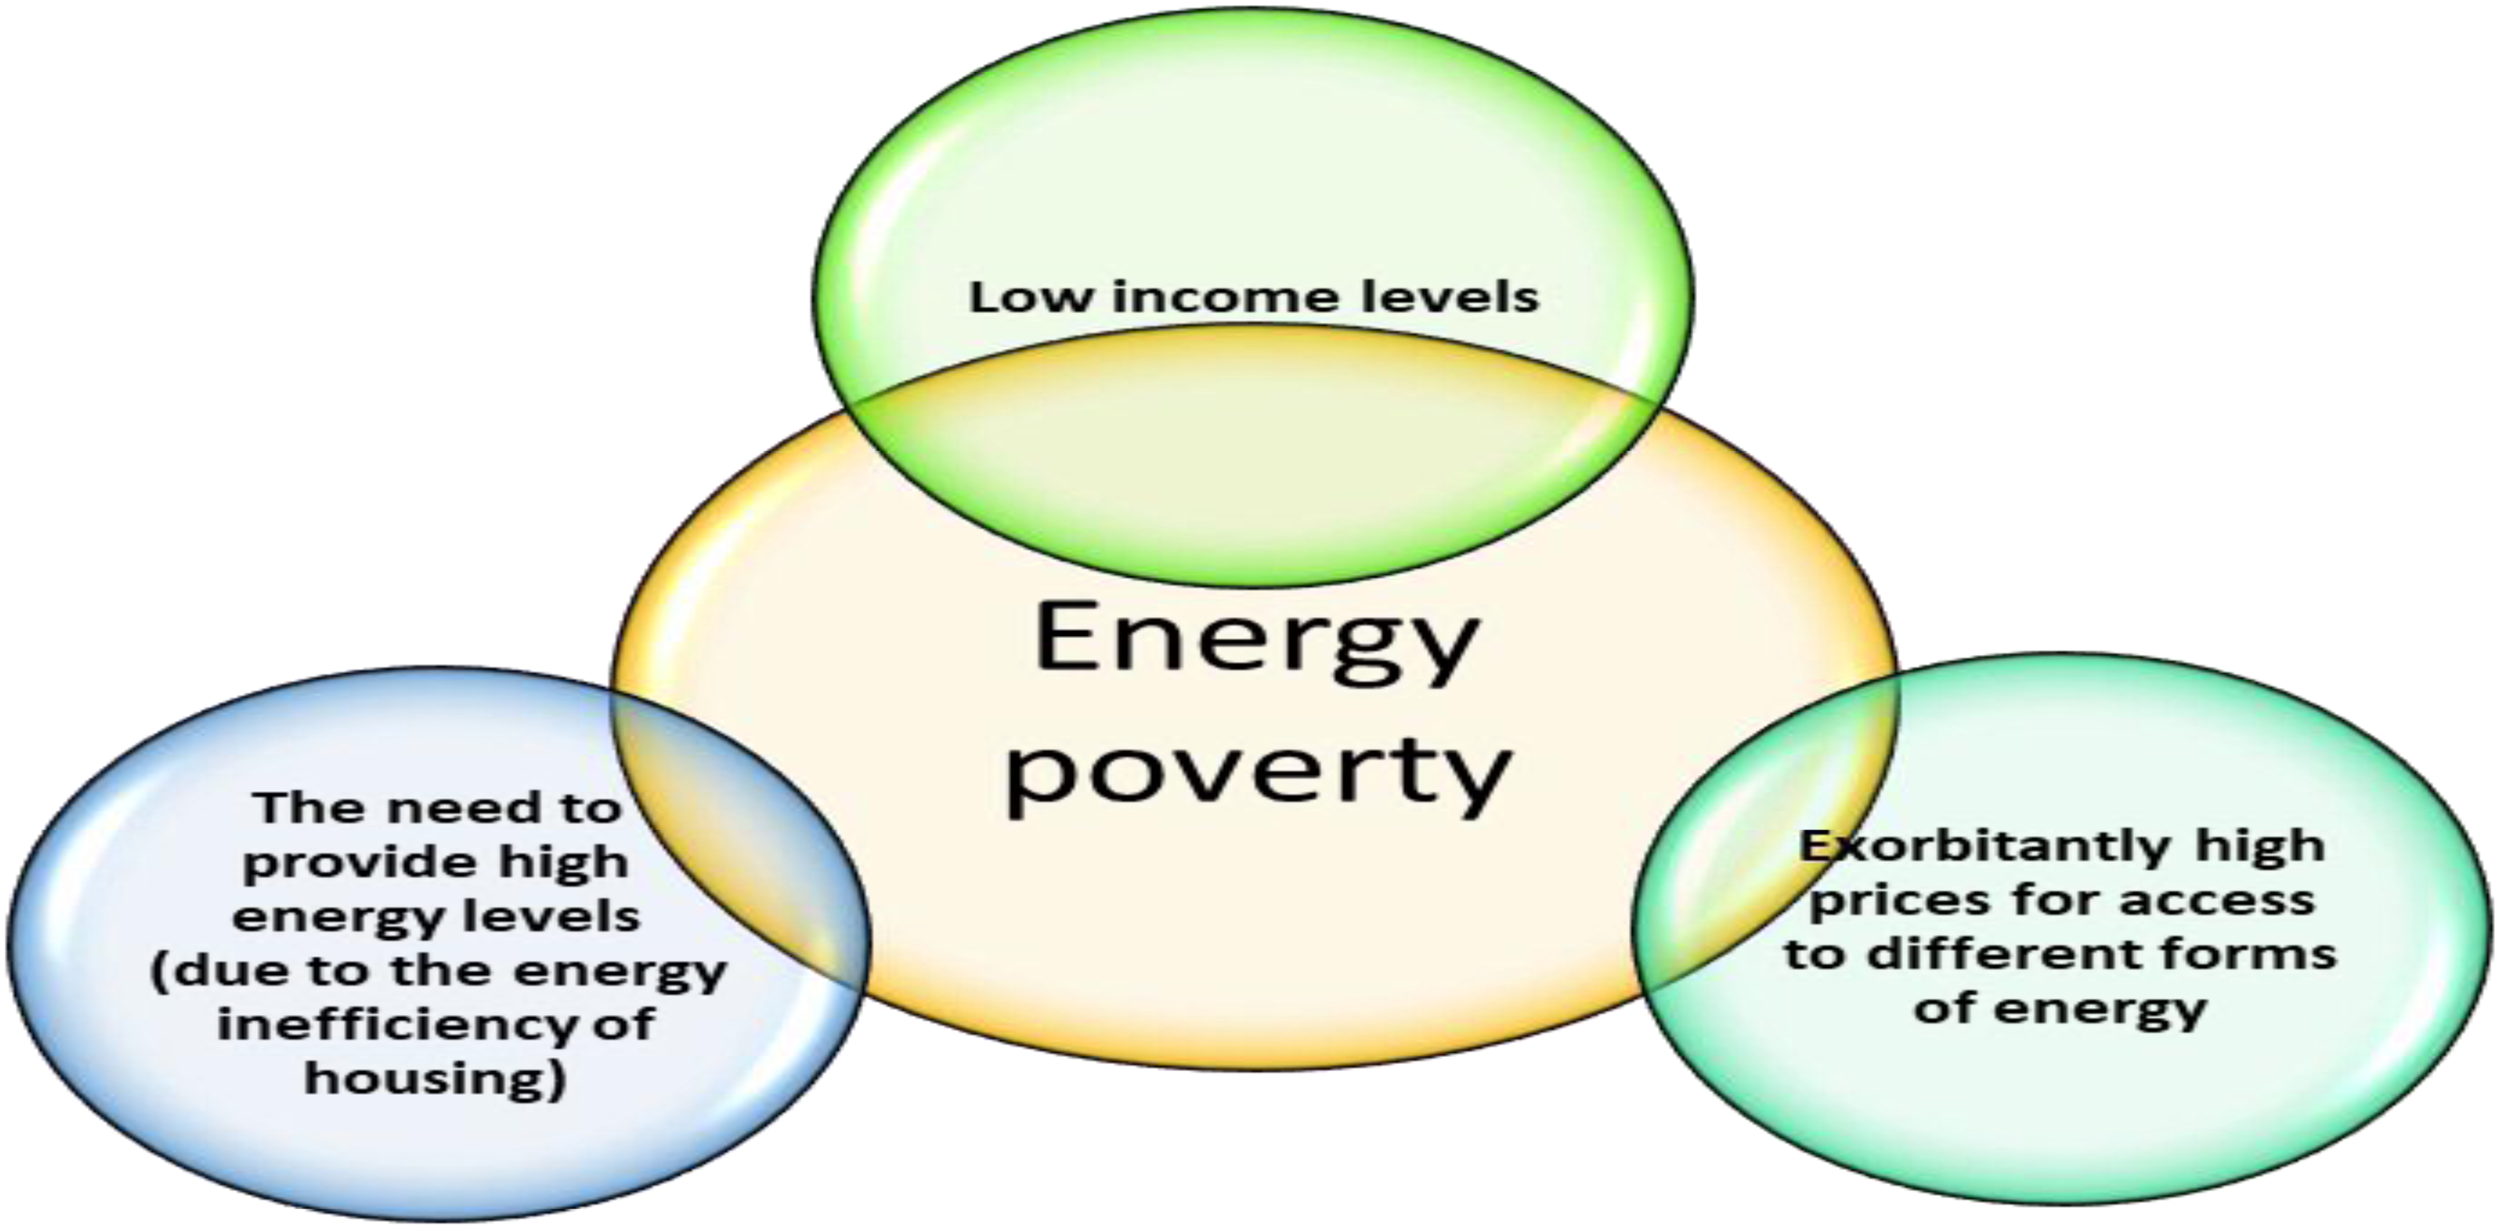
Factors of energy poverty. Source Authors based on Neacsa et al. (2020).
At EU level, it is estimated that around 34 million people face forms of energy poverty. This is an alarming statistic that underlines the need to tackle this problem as effectively as possible. In many Member States, especially in Eastern Europe, low-income households often must choose between paying their energy bills and covering other basic needs such as food and health. This difficult choice not only affects individual well-being but also that of entire communities, generating a vicious circle of poverty and exclusion (Bouzarovski et al., 2021; Delcea et al., 2024; Grigorescu et al., 2024; Maltby and Mišík, 2024;; Mišík and Figulová, 2024; Oravcová et al., 2022; Sağlam and Erdem, 2024; Thomson and Bouzarovski, 2018 Zaharia et al., 2017b; Ștefan et al., 2024).
Another important aspect of energy poverty is its close connection with the energy efficiency of housing. Very many buildings in the EU are energy inefficient, and the high costs of renovating and upgrading them represent a significant barrier to energy savings. Renovation policies and investments in energy efficiency are intended as the basis for reducing energy poverty but are often insufficiently supported by legislative and financial measures (Abbas et al., 2021; Damean and Joita, 2023; Dong et al., 2022; Janjua et al., 2023; Panait et al., 2022). In addition to economic and infrastructure challenges, energy poverty is also influenced by demographic and social factors. Elderly people, families with children and people with disabilities are vulnerable groups that face higher risks of energy poverty. Also, population migration and mobility can further complicate the situation, as recently arrived people may find themselves in precarious economic positions and therefore exposed to difficulties in accessing energy (Abbas et al., 2020; Dogan et al., 2022; Murăraşu and Bujor, 2022; Polimeni et al., 2022).
The EU has recognized the importance of addressing energy poverty and has implemented a series of initiatives to support member states in combating this phenomenon. The EU Clean Energy Strategy proposes measures to promote energy efficiency and renewable energy, while encouraging solidarity between member states (Popescu et al., 2024b; Zaharia et al., 2017a). However, to have a real impact, better coordination between energy, social protection and urban development policies is needed. The European Energy Poverty Observatory (EPOV) was established to support public policies and local initiatives aimed at reducing energy poverty. It offers tools such as dashboards with indicators, practical guides and a platform for collaboration between stakeholders. The observatory also facilitates the analysis of the impact of energy efficiency measures at national and European level and provides an atlas with successful local initiatives in various regions of Europe. The EPAH platform (Energy Poverty Advisory Hub) aims to support local authorities in diagnosing and combating energy poverty. EPAH offers resources, including online courses and manuals for the development of effective strategies at the local level, being an important center of expertise in this field (Neacsa et al., 2022b).
European instruments (Figure 2) offer important opportunities for improving energy infrastructure and reducing vulnerabilities. An example is the use of wood and coal for heating, a practice still widespread, which can be changed by expanding natural gas networks, thermal rehabilitation of homes and modernization of heating systems. These efforts underline the need for collaborations between local authorities, governments and European bodies to ensure a fair energy transition and improve access for all citizens to quality and affordable energy services (Dincă et al., 2023; Joița and Dobrotă, 2022; Neacsa et al., 2022c).
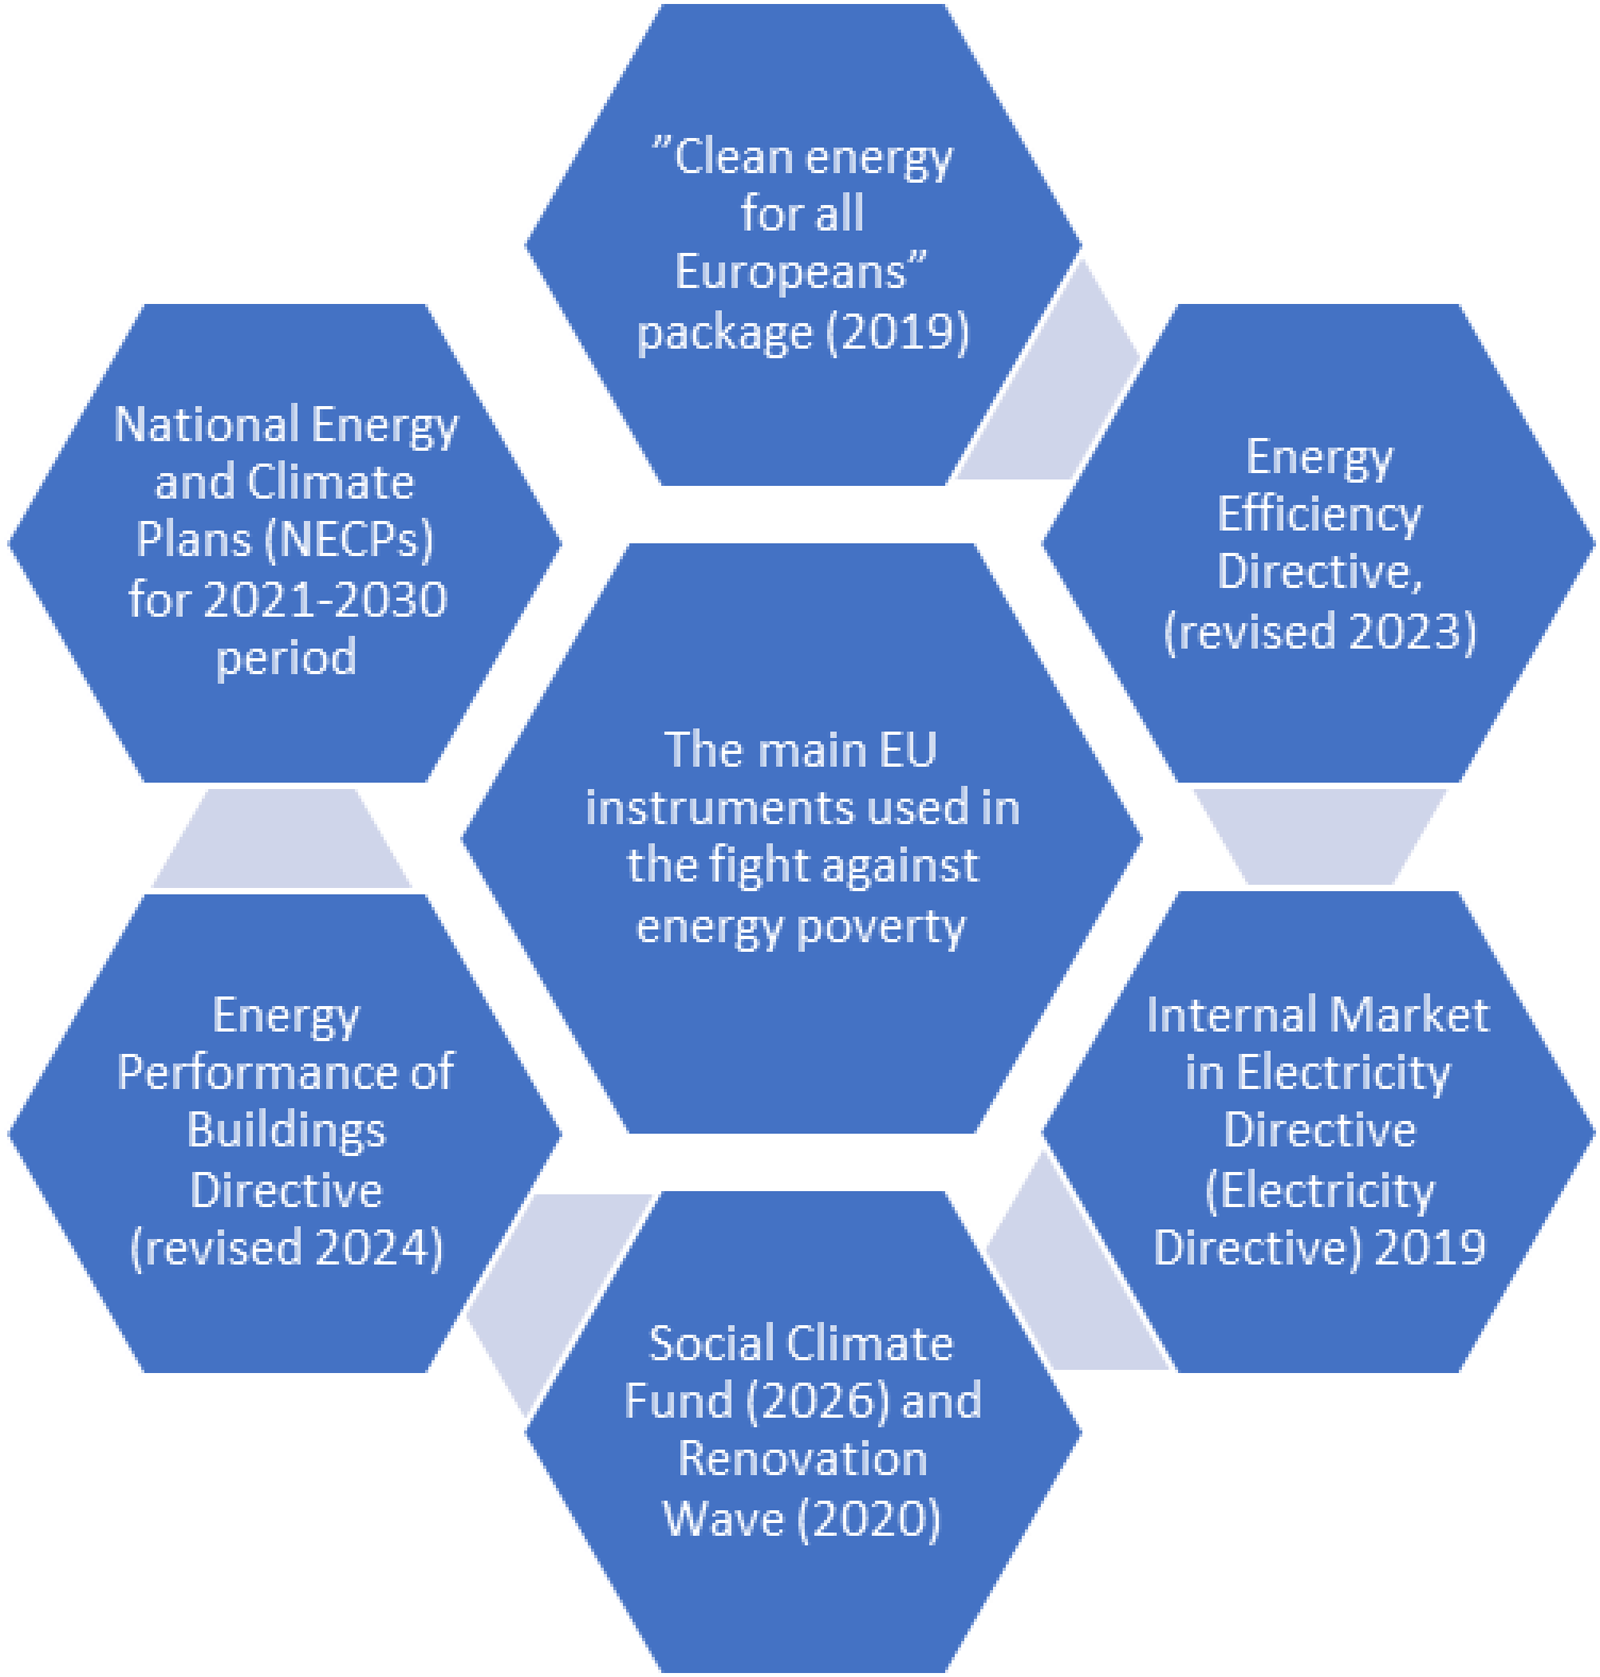
The main EU instruments used in the fight against energy poverty.
Energy poverty is a complex problem that requires an integrated and collaborative approach between all stakeholders at the level of the European Union. It is very important that all these stakeholders, including governments, non-governmental organizations and the private sector, work together to develop sustainable solutions that ensure equitable access to energy for all citizens. Only through concerted actions can significantly reduce energy poverty and create more resilient and prosperous communities in Europe (Fariña et al., 2024; Janjua et al., 2023; Khan et al., 2022; Kicsi et al., 2023; Oprea et al., 2019; Popescu et al., 2024a; Xu et al., 2019).
Taking in account these considerations, the paper aims to examine how socio-economic inequalities and energy poverty interact with the EU's green transition, and how these divides can be reduced while decarbonizing. It typically focuses on identifying factors of the energy poverty, the evolution of phenomenon in EU, and which policy mix could simultaneously alleviate poverty and support a fair, sustainable energy transformation.
Literature review
Energy poverty is defined as the inability of the population to maintain their households/dwellings at a level of adequate thermal comfort due to low incomes and high energy costs, and is a major problem at the level of the European Union. The phenomenon has multiple causes and consequences, from economic inequalities to the deterioration of the physical and mental health of the vulnerable population. Although energy poverty is more acute in Eastern European regions, it affects all European countries, including those with strong economies, especially in the context of recent crises (pandemics, armed conflicts and energy instability). This review explores the fundamental concepts, recent trends, existing policies and proposed solutions to combat this phenomenon. The main articles and studies on energy poverty in the European Union highlight the challenges related to access to affordable and efficient energy, as well as the proposed solutions to combat this phenomenon (Simionescu, 2025; Śmiech et al., 2025). Energy poverty affects approximately 50 million households in the EU and is a complex phenomenon that overlaps with other social problems, such as low incomes and inadequate housing conditions (Grigorescu et al., 2024; Neacsa et al., 2022b; Vlahinic Lenz, 2017). Energy transition programs such as REPowerEU aim to accelerate the green transition and support vulnerable groups through concrete financing and energy renovation measures, with the aim of reducing dependence on fossil fuels and increasing the energy efficiency of buildings (Fariña et al., 2024; Neacsa et al., 2022a; Neacsa et al., 2023).
Energy poverty does not have a unitary definition at European level. (Boardman, 1991) was among the first to define energy poverty, indicating that it occurs when a household spends more than 10% of its income on energy. Later, Eurostat and other organizations added new dimensions, including inadequate thermal comfort and inability to pay their bills. Definitions vary depending on the country, which complicates the measurement of the phenomenon at the EU level (Neacsa et al., 2020). According to data from Eurostat, between 2014 and 2023, the proportion of European citizens who reported difficulty heating their homes increased from 10.4% to 10.6%. The phenomenon is more serious in the countries of southern and eastern Europe (Bulgaria, Greece, Romania), where energy poverty rates exceed 20%. In developed economies such as Germany, although the rate is lower, it has increased from 4.9% in 2014 to 8.2% in 2023, signaling that global crises are also affecting prosperous countries. Studies show that the phenomenon is influenced by four main factors: (1) Low income. The vulnerable population, including pensioners and the unemployed, are most at risk of energy poverty, (2) High energy prices. The liberalization of the energy market and external events such as the conflict in Ukraine have significantly increased costs, (3) Energy inefficiency of homes. Housing built before 1990 is poorly insulated, leading to high energy losses (CEE Bankwatch, 2022). (4) Insufficient energy policies. Although there are support measures in several states, they are temporary and do not address the fundamental causes of the phenomenon (Chisăliță and Albu, 2021).
Energy poverty has multiple consequences for health and social well-being. The phenomenon directly and indirectly influences physical and mental health because people exposed to poor living conditions suffer more often from respiratory diseases and de-pression. There is also a clear link between inadequate housing conditions and mortality in the cold season. From the point of view of social isolation, the population affected by energy poverty avoids social visits because of the shame of the living conditions, accentuating the isolation (Churchill and Smyth, 2021; Neacsa et al., 2022a; Shahzad et al., 2022; Thomson et al., 2017). Also, due to the phenomenon of energy poverty, economic inequalities are registered because households with low incomes spend a higher percentage of their budget on energy, which perpetuates poverty (Eurostat, 2023). At EU level, support policies are varied and include different European directives, regulations and instruments like national energy efficiency programs: In countries such as Germany and Sweden, housing rehabilitation measures have been implemented, but the impact is still limited in Eastern Europe (Bouzarovski and Tirado Herrero, 2017; Halkos and Gkampoura, 2021; Zhou et al., 2020).
Many studies emphasize the need to invest in energy efficiency of homes and renewable sources. According to the report (CEE Bankwatch, 2022), installing photovoltaic panels and heat pumps for vulnerable households would significantly reduce bill costs and improve living conditions. However, implementation of these programs is limited in many Eastern European countries due to lack of funding and bureaucracy. The COVID-19 pandemic and the war in Ukraine have accentuated the phenomenon of energy poverty Rising energy prices, inflation and falling household incomes have exposed millions of European citizens to this risk. In Romania, for example, the energy poverty rate increased to 12.5% in 2023, from 9.3% in 2019, despite government support measures (Eurostat).
In the article “The justice and equity implications of the clean energy transition,” in Nature Energy, Carley and Konisky, 2020 considered that the transition to low-carbon energy sources will generate winners and losers, favoring those with access to clean energy opportunities, while vulnerable communities will bear the costs, which highlights the need for future research for more equitable policies. On the same topic, the article “Energy justice in the transition to low carbon energy systems: Exploring key themes in interdisciplinary research,” published in January 2019 in Applied Energy by D. McCauley, V. Ramasar, R.J. Heffron, B.K. Sovacool, D. Mebratu and L. Mundaca (McCauley et al., 2019), brings to the fore the importance of transitioning to low-carbon energy systems. This involves reducing emissions from burning fossil fuels and ensuring access to clean energy at fair prices. It is also essential that energy legislation supports policies and programs that guarantee fair access to alternative resources and innovative technologies. In the article “Decent Living Standards: Material Prerequisites for Human Wellbeing,” published by N.D. Rao and M. Jihoon in Social Indicators Research in July 2018 (Rao and Min, 2018), the essential material conditions for decent living, adaptable to different communities according to local customs, are defined. At the same time, the need for a legislative framework that supports a decent standard of living, covering basic needs and overcoming the current indicators of multidimensional poverty is emphasized. This standard target both the establishment of the minimum wage and reference budgets, as well as the fight against energy poverty and the impact of climate change.
The article “Electricity consumption and human development level: A comparative analysis based on panel data for 50 countries,” published in the International Journal of Electrical Power & Energy Systems in 2013 (Niu et al., 2013), makes the connection between electricity consumption and a country's level of development. The study, based on data from 50 countries (1990–2009), shows a long-term bidirectional causality between energy consumption and indicators such as gross domestic product (GDP) per capita, consumer spending, urbanization rate, life expectancy and literacy adults. The findings show that in higher-income countries, both energy consumption and its contribution to GDP and expenditure are increasing, while urbanization, life expectancy and literacy tend to stagnate. To support development, access to energy should be an essential component in ensuring a decent living, especially for vulnerable consumers affected by energy poverty. Article “Energy, Poverty, and Health in Climate Change: A Comprehensive Review of an Emerging Literature,” published by S. Jessel, S. Sawyer, and D. Hernandez in Frontiers in Public Health (December 2019) (Jessel et al., 2019), analyzes the link between energy, health and energy poverty. The study highlights that an adequate housing environment is essential for the health of the population, and the lack of access to energy for heating has negative effects amplified by climate change. Also, the link between home heating and socio-economic inequalities remains under-researched. The literature review (1990–2019) proposes a model that explains the dependence of health on energy insecurity, emphasizing that vulnerable populations are simultaneously exposed to other aggravating factors. The study recommends policies to ensure affordable access to energy, focusing on consumer health and combating inequalities and the effects of climate change.
In the article “Energy poverty in Romania—drivers, effects and possible measures to reduce its effects and number of people affected,” published by Clodnitchi and Busu, 2017, in the Proceedings of the International Conference on Business Excellence (July 2017) (Roxana and Cristian, 2017), the concept of energy poverty is analyzed in the context of national and European policies. The authors show that, although in 2014 Romania had a high risk of poverty and social exclusion (40.3% compared to the EU27 average of 24.4%), only 12.3% of Romanians were affected by energy poverty, according to the European Commission. However, the issue is considered critical, like other new EU member states. The study examines the evolution of policies and regulations in Romania and the EU and proposes specific measures to reduce energy poverty, adapted to the energy sector and the national economy, formulating recommendations based on available data and specialized literature.
The article “Extreme energy poverty in the urban peripheries of Romania and Israel: Policy, planning and infrastructure,” published in Energy Research & Social Science (2020) (Teschner et al., 2020), explores poverty extreme energy in marginalized communities such as Roma neighborhoods in Romania and Bedouin villages in Israel. The authors identify the lack of access to reliable energy sources and adequate infrastructure as the main causes. The study maps policies and regulations in the two countries and highlights the link between planning, infrastructure and social inequality. The research shows that national policies avoid a clear definition of energy poverty and do not provide long-term solutions. Also, extreme energy vulnerability is treated as a secondary problem, and mistrust of authorities amplifies the energy difficulties of these communities.
The article “Mapping gendered vulnerability to energy poverty in Romania,” published by Bîrsănuc, 2022 in Applied Spatial Analysis analyzed the impact of gender inequalities on energy poverty in Romania. The study examines 3,181 territorial units, using gender-sensitive indicators such as age (children under 4, people over 75), economic dependency, health status (disabled), employment (unemployed, pensioners) and living conditions (lack of electricity or heating). The analysis highlights that women in rural areas are more vulnerable due to the high number of disadvantageous factors. The results are represented spatially, providing predictive maps of vulnerability, suggesting that local and national authorities need to intervene to reduce these disparities and support affected communities.
The article “Energy Poverty: Macroeconomic Insight on Romania, Bulgaria and the Visegrad Group within the European Context,” published in Amfiteatru Economic by Kicsi et al., 2023, discusses the energy vulnerability of Romania, Bulgaria and the countries of the Visegrad Group, considered “peripheral” in the EU. The study attributes this vulnerability to the legacy of the planned economy and the post-communist transition to a market economy. Using a core-periphery model and three thresholds of energy poverty (physical, technological, economic), the research identifies differences between these countries and suggests the formation of two distinct groups. The paper emphasizes the importance of macroeconomic intervention, especially in the context of the pandemic.
The countries in the European Union most affected by energy poverty tend to be those with lower average incomes, higher energy costs relative to income, and less energy-efficient housing. Countries like Bulgaria, Hungary, Lithuania, Portugal, Cyprus, Greece, Romania, Slovakia, and Croatia face high level of energy poverty due to specific factors like relatively low wages, significant energy-inefficient housing, high reliance on imported energy, impacting affordability or higher energy price volatil
The problem of energy poverty has become more acute lately given the black swan events (Covid crisis, the war in Ukraine) that have strongly affected both the energy market and the economic situation in EU countries. These events have led to the re-configuration of the energy transition process. The public authorities understand that the main element around which the energy transition must be built around the social nucleus—the population, the consumer, the local communities—which must be as little affected as possible by the change in the energy mix. For this reason, the European authorities have launched the concept of just transition and specific mechanisms to support the stakeholders in the transition to low carbon economy. Because the energy transition involves infrastructure upgrades, technology investments, and policy changes, all the costs generate higher energy bills, disproportionately affecting low-income households and exacerbating energy poverty. Through just transition, access to clean and affordable energy sources is ensured and, in this way, no one is left behind in the energy transition. In addition, renewable energy investments are directed toward areas suffering from energy poverty. So, by just transition, energy poverty as moral and practical imperative for achieving a sustainable and equitable energy future can be addressed properly (Bâra et al., 2023; Ene and Stancu, 2022; Mihai et al., 2021; Popescu et al., 2024a; Voicu-Dorobanțu et al., 2021).
The screening of specialized literature revealed the existence of similar terms such as fuel poverty or energy vulnerability (Bouzarovski et al., 2025; Hearn et al., 2022). The terms are related, but their conceptual and temporal nuances are different and deserve to be explained more clearly. Although often used together, “energy poverty” and “energy vulnerability” describe two distinct dimensions. Energy poverty refers to a present state in which a household cannot effectively afford the energy services necessary for a decent life (heating, cooling, lighting, use of appliances). By contrast, energy vulnerability refers to the risk and trajectories over time that can push a household toward, into, or back into energy poverty—that is, the combination of structural factors (low income, inefficient housing, geographical isolation, poor health, dependence on volatile fuels, etc.) that increase exposure to shocks. In the policy vocabulary, the terms also have different operational roles. The concept of energy poverty is mainly used for immediate response measures: support for bill payments (income supplements, vouchers), social tariffs, price caps or disconnection bans for consumers already in difficulty. The notion of energy vulnerability is more appropriate when designing preventive and structural policies: renovation and energy efficiency programs targeting risk groups, employment and social protection policies that reduce income precariousness, protection schemes against price shocks and mechanisms to increase resilience to the green transition. Thus, energy poverty captures the present “snapshot” of deprivation, while energy vulnerability describes the in-depth “film” of the causes and risks in the medium and long term.So, the literature review on energy poverty can group recent work into four main strands: conceptual and indicator debates, spatial and socio-economic disparities, policy and governance responses (especially in the EU), and broader socio-economic consequences of energy deprivation (Barreiro-Pereira and Abdelkader-Benmesaud-Conde, 2025; Morina et al., 2022; Śmiech and Karpińska, 2025).
Data and method
In this study, the authors considered the evolution of some factorial variables that have an influence on the phenomenon of energy poverty at the level of the European Union, using in this sense statistical data taken from official sources, such as Eurostat, from the last 21 years. This analysis in the context of the phenomenon of energy poverty is useful to understand the trends and factors that influence energy consumption, energy prices, as well as the population's ability to maintain adequate thermal comfort in homes.
Figure 3 shows the evolution of final energy consumption in households per capita at the European Union level based on data from Table 1.
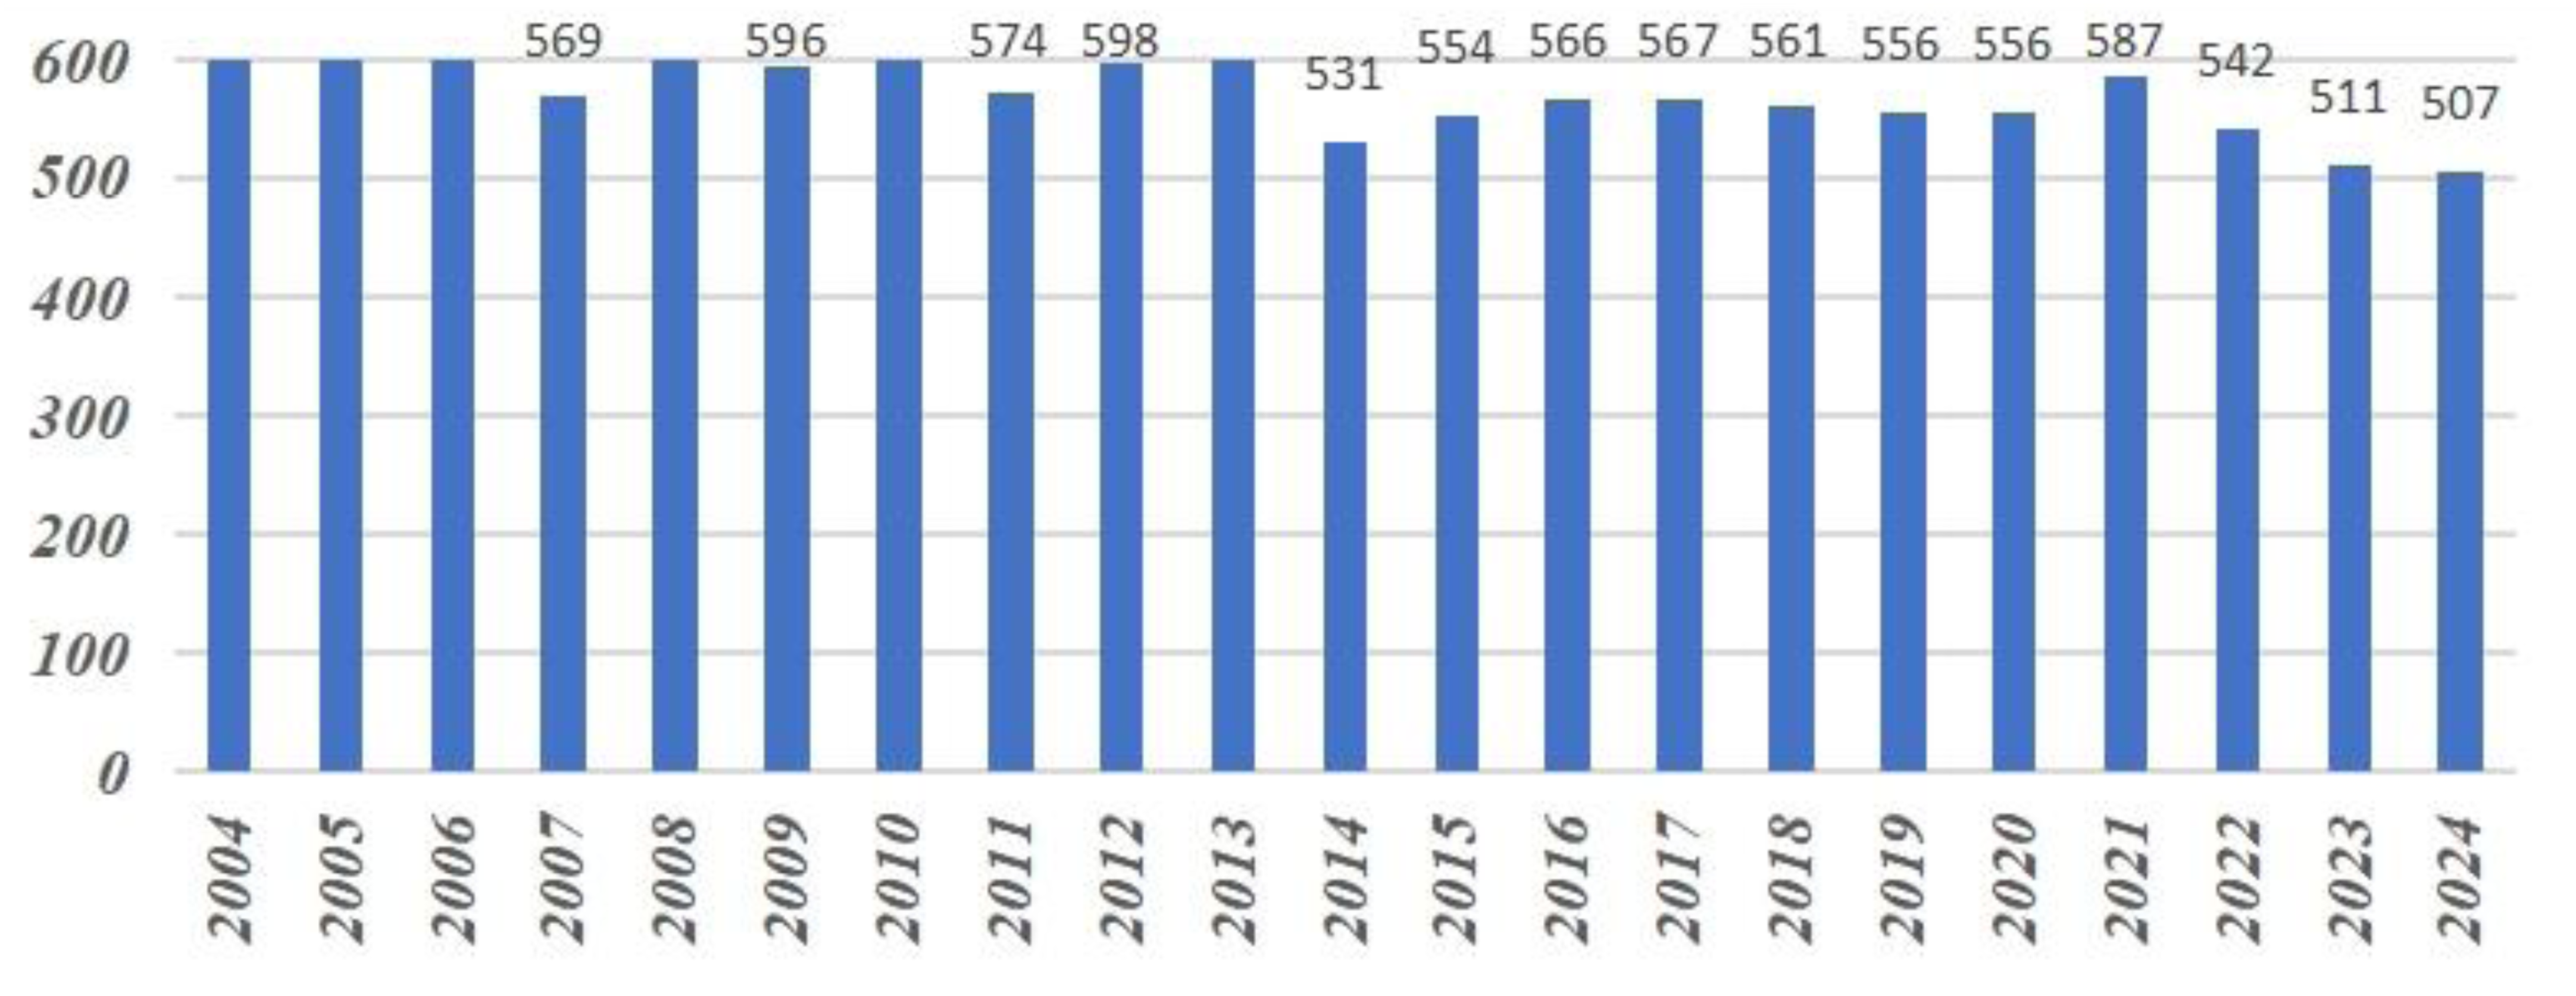
The evolution of the final energy consumption in households per capita at the level of the European Union. Source: Authors based on Eurostat data, Database: Eurostat.
Evolution of the variables considered in the period 2004–2024.
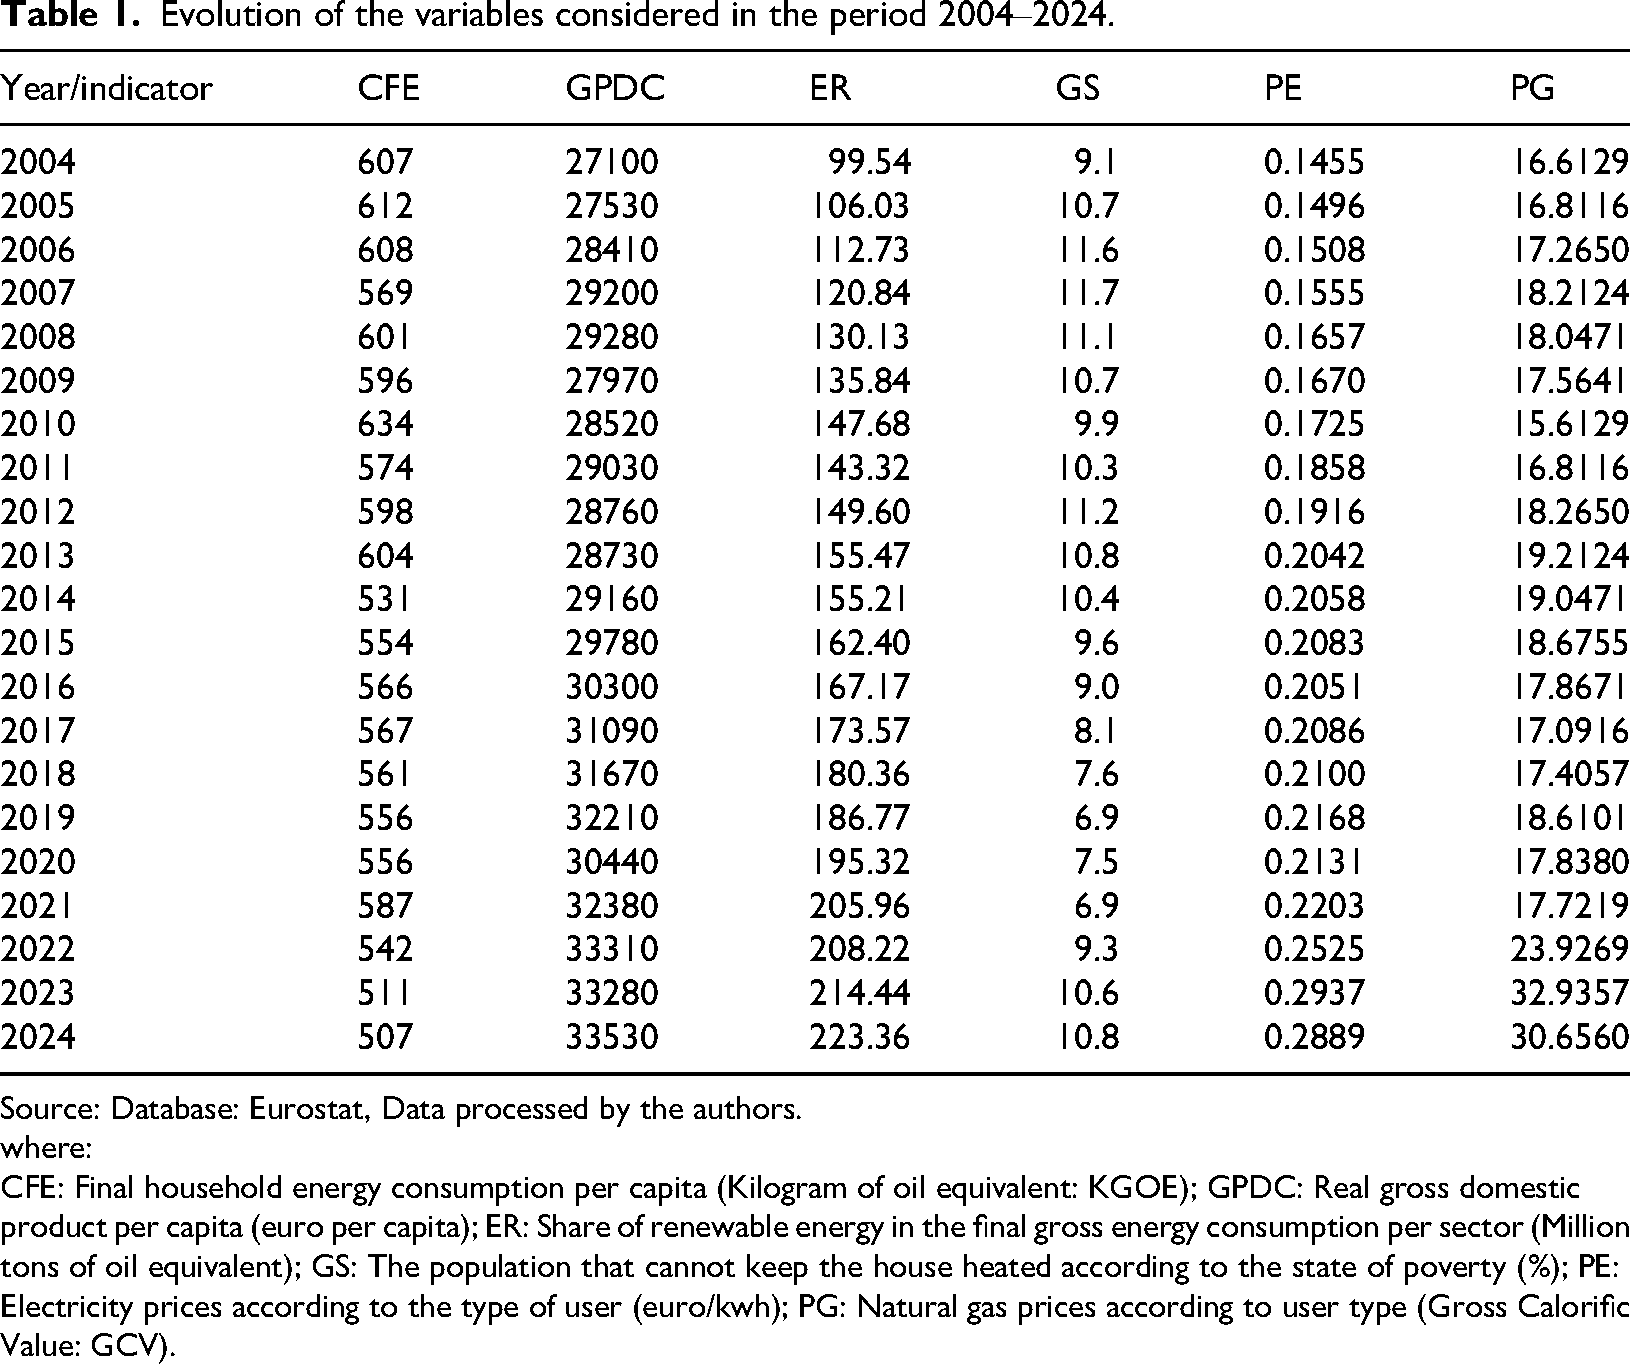
Source: Database: Eurostat, Data processed by the authors.
where:
CFE: Final household energy consumption per capita (Kilogram of oil equivalent: KGOE); GPDC: Real gross domestic product per capita (euro per capita); ER: Share of renewable energy in the final gross energy consumption per sector (Million tons of oil equivalent); GS: The population that cannot keep the house heated according to the state of poverty (%); PE: Electricity prices according to the type of user (euro/kwh); PG: Natural gas prices according to user type (Gross Calorific Value: GCV).
From the graphic representation it can be seen that for the Final energy consumption in households per capita (expressed Kilogram of oil equivalent—KGOE) every year there was a very small variation in the range between the limit values of 507 and 634 KGOE, which can be explained, from the point of view of dynamics, only by the annual temperature variations in the European Union.
Energy poverty remains a significant problem, being closely linked to variations in GDP per capita. Economic fluctuations influence the ability of households to maintain adequate energy consumption, highlighting the vulnerability of certain segments of the population to economic changes (Figure 4).
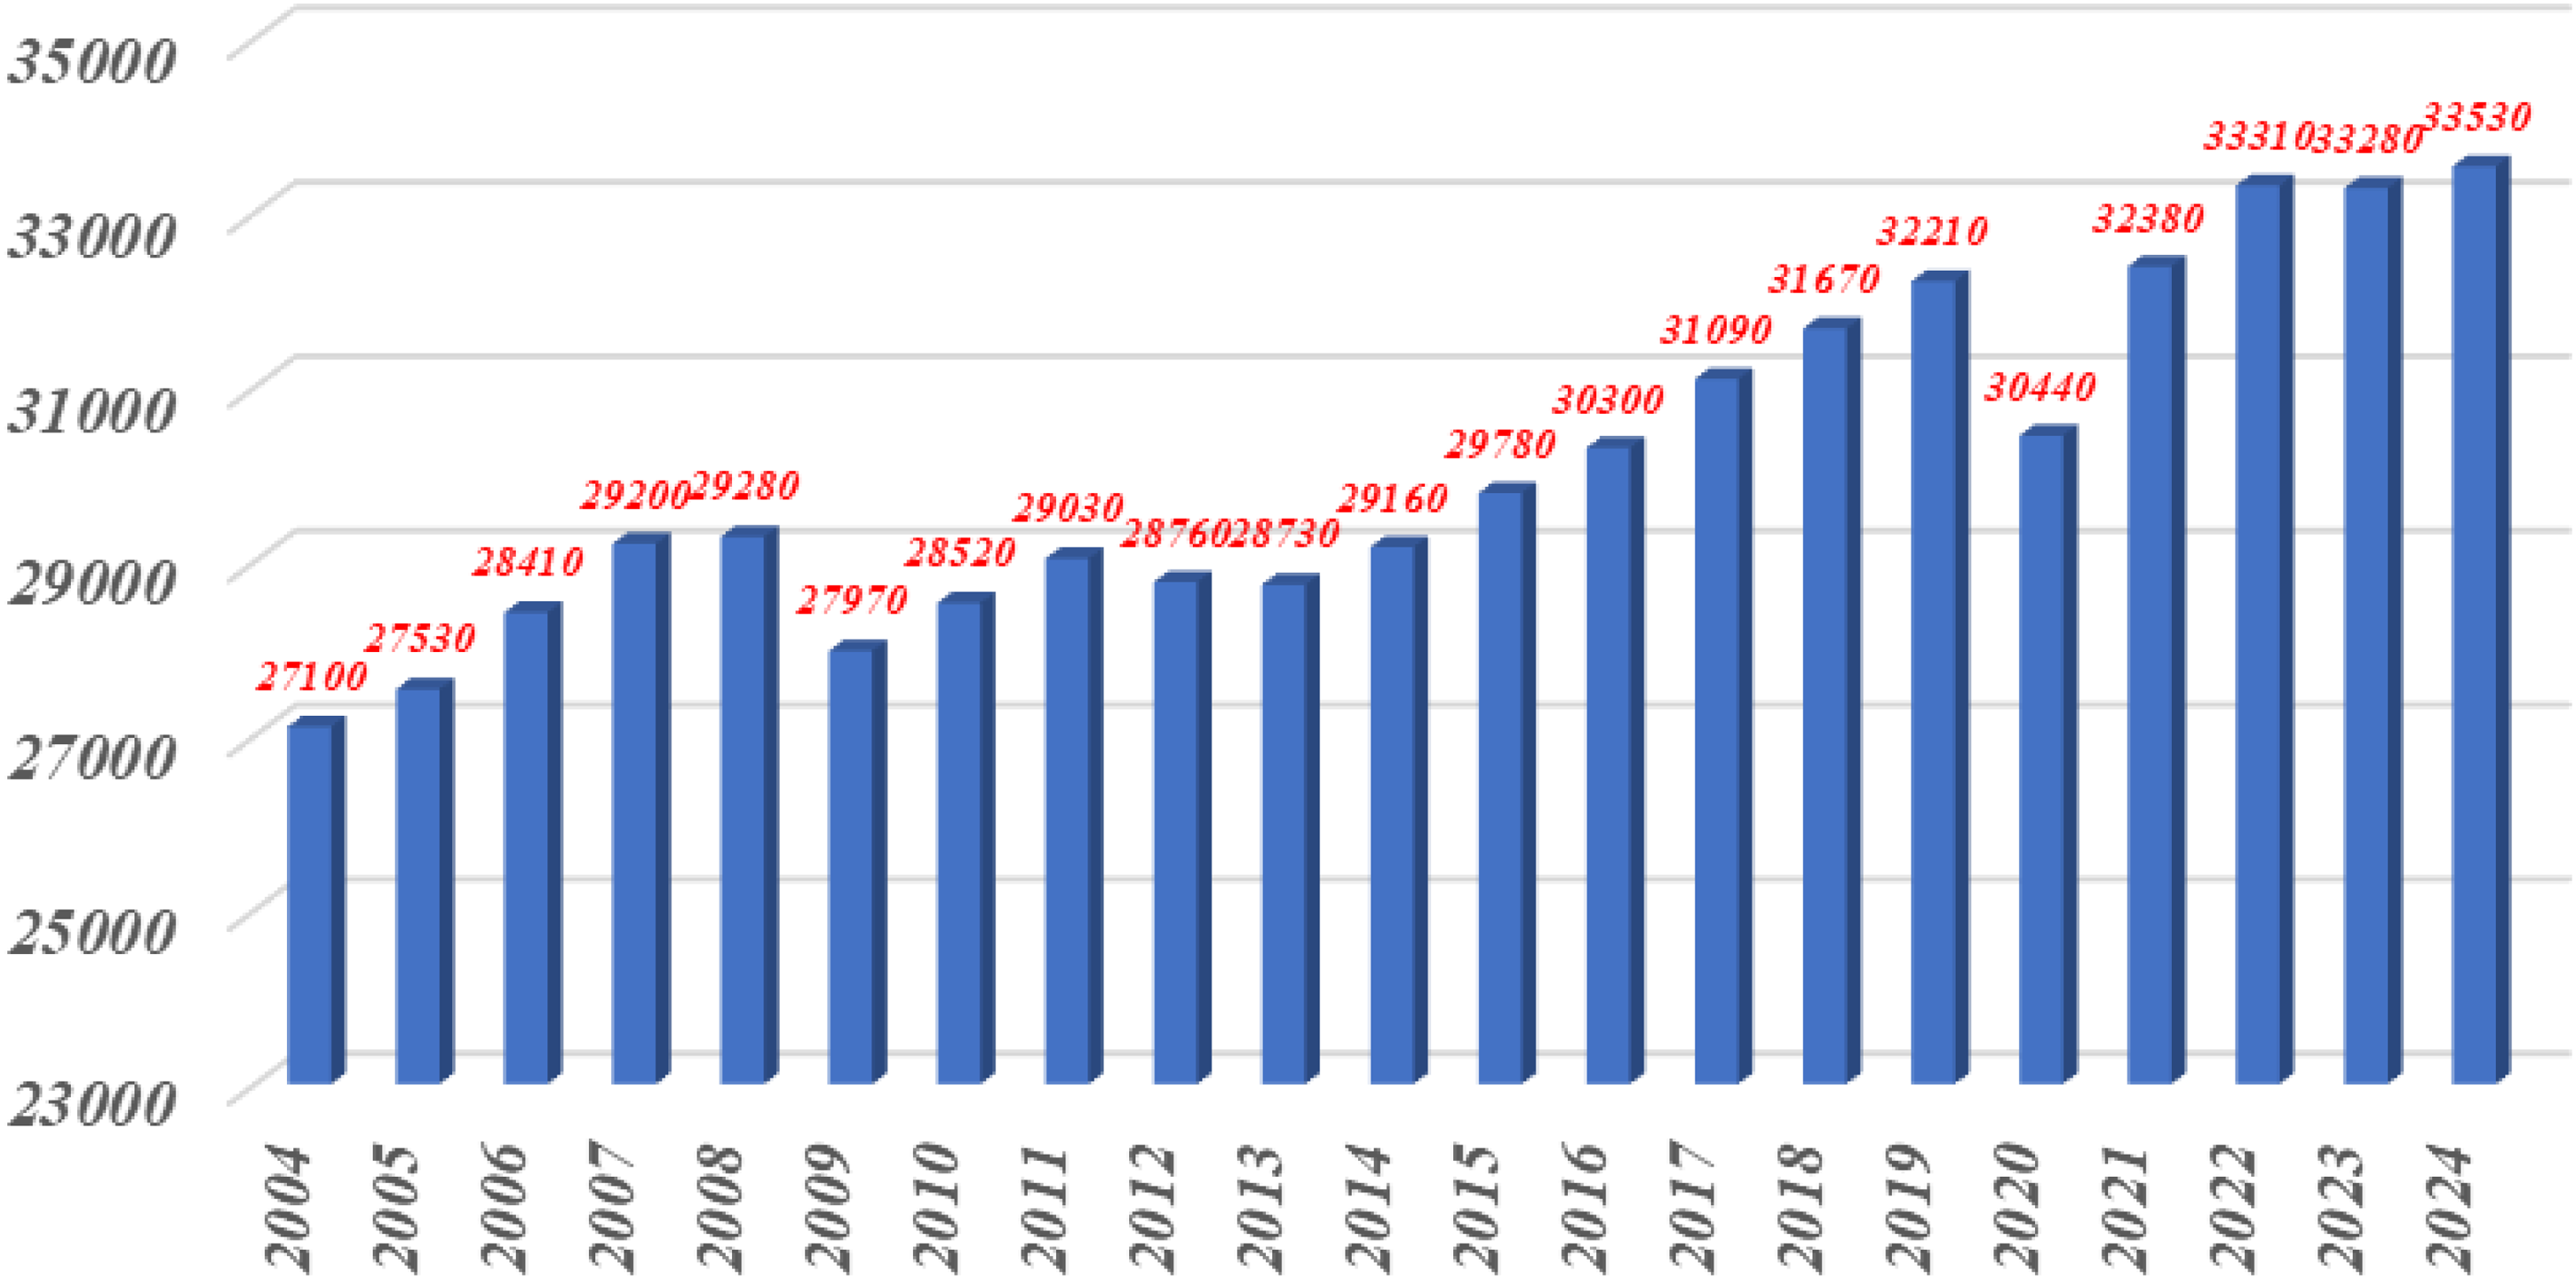
Evolution of the real gross domestic product per capita at the level of the European Union. Source: Authors based on Eurostat data, Database: Eurostat.
The dynamics of the real GDP per capita (expressed in euros per capita) can be explained very simply from an economic point of view because it shows increasing trends negatively influenced only by events that affected all economies globally and implicitly those of the European Union. The two events that influenced the variation are represented by the economic crisis of 2008 and the CORONAVIRUS pandemic of 2020. Figure 5 shows the evolution of the share of renewable energy in the final gross energy consumption per sector at the level of the European Union.
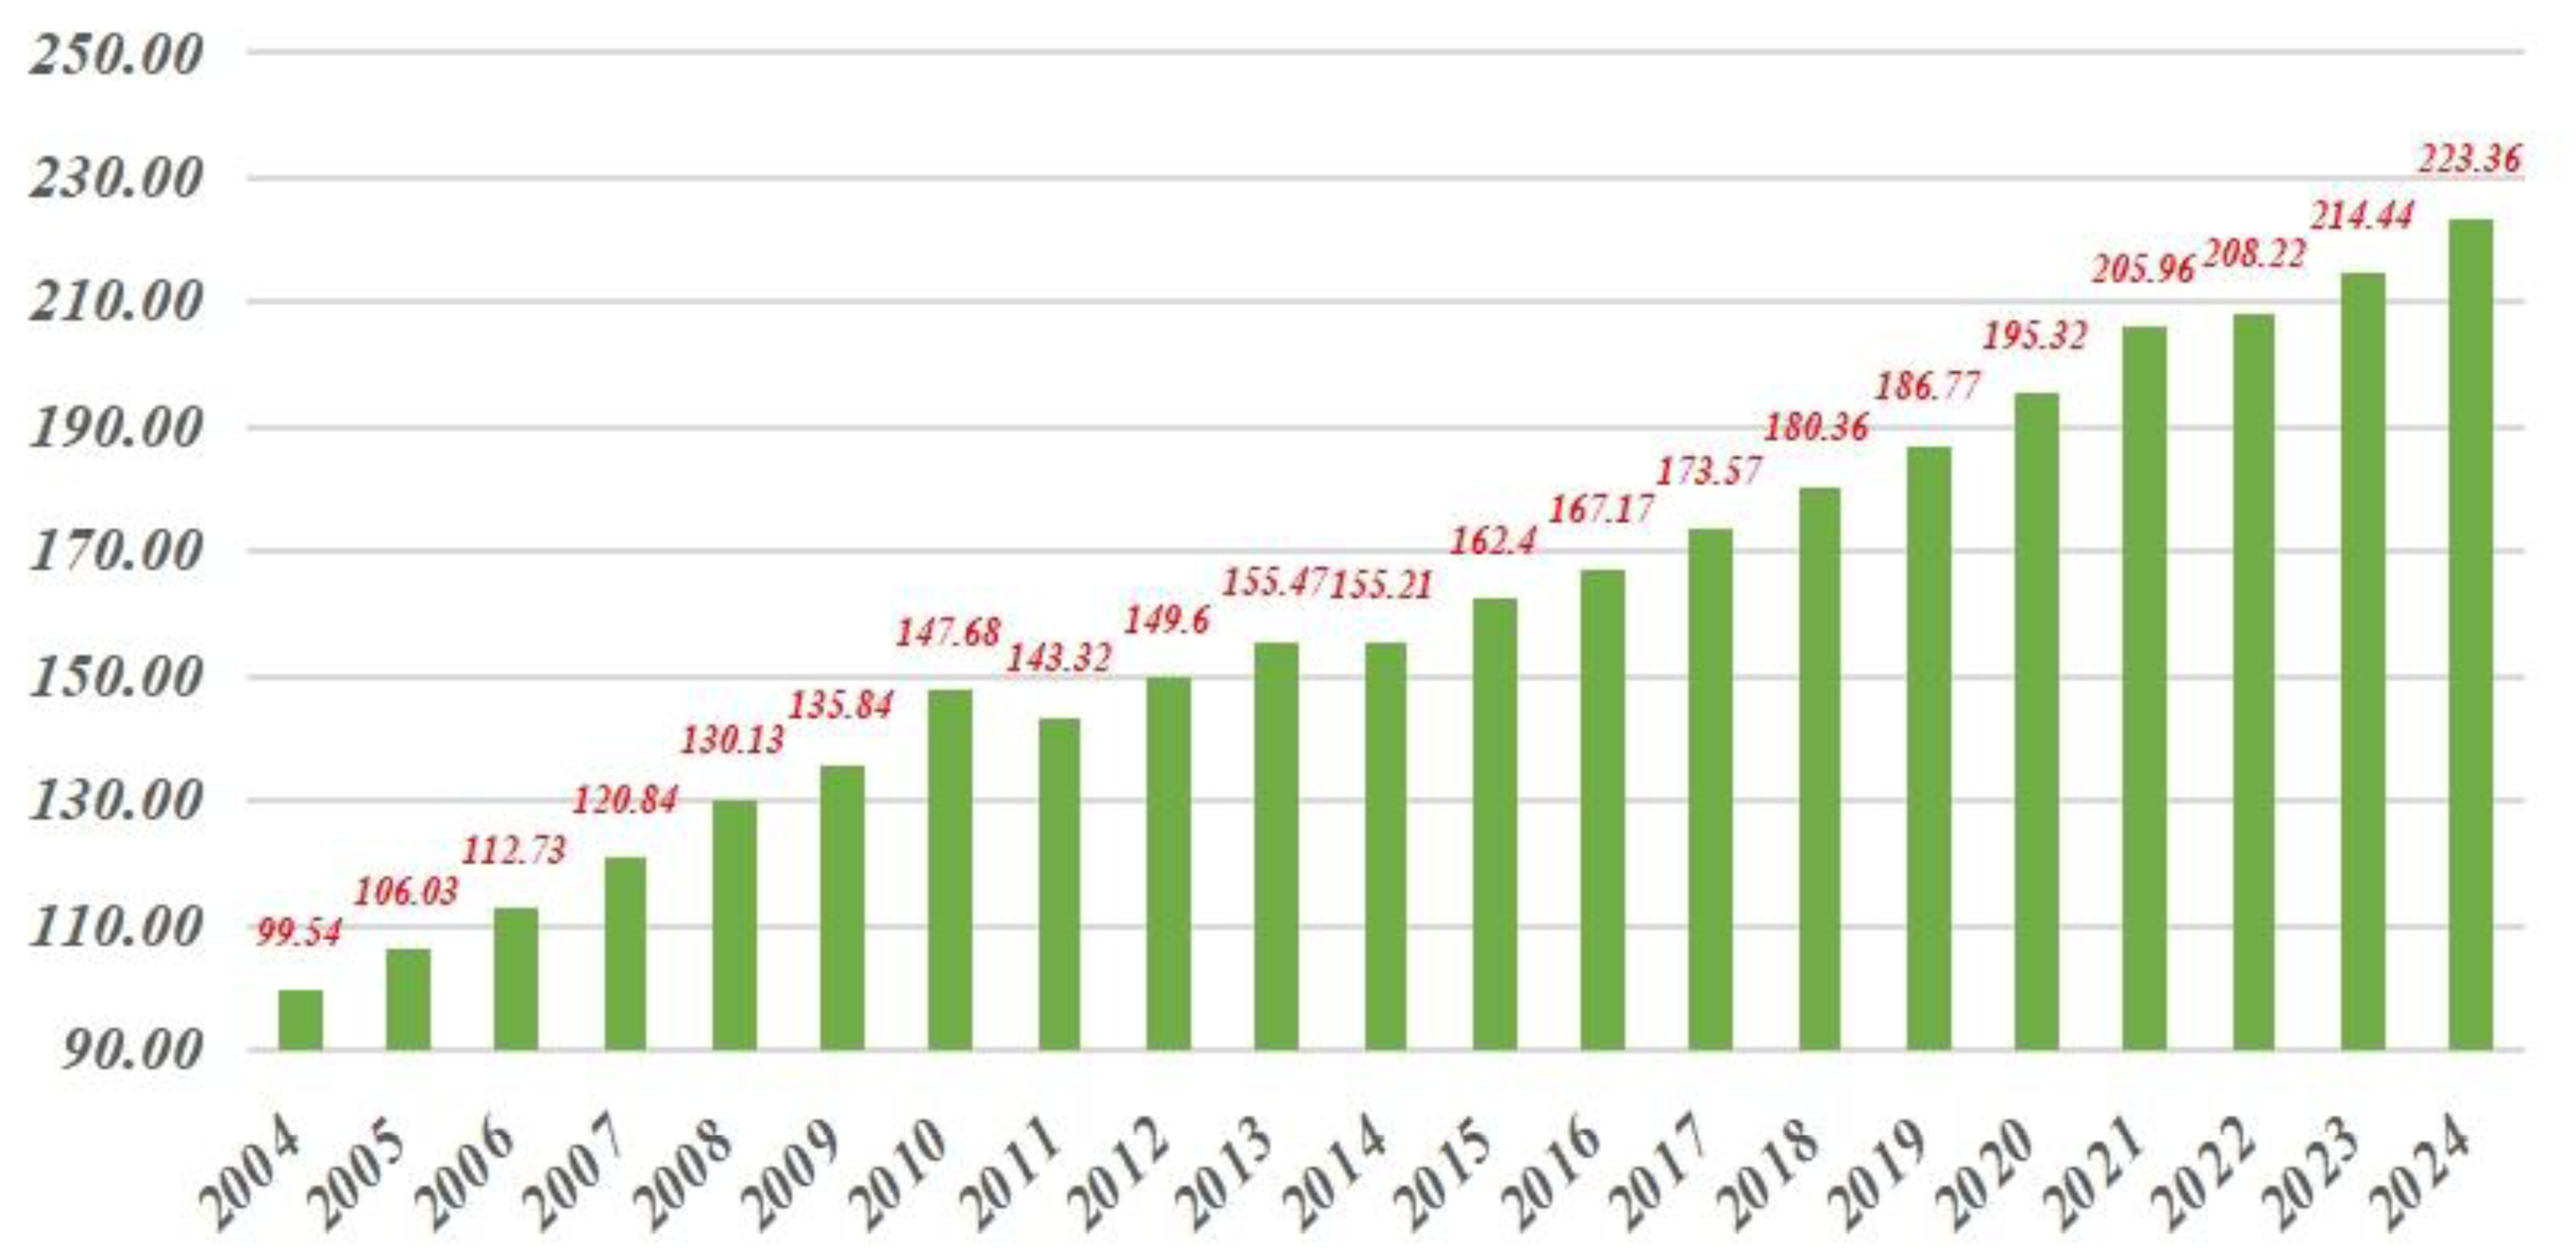
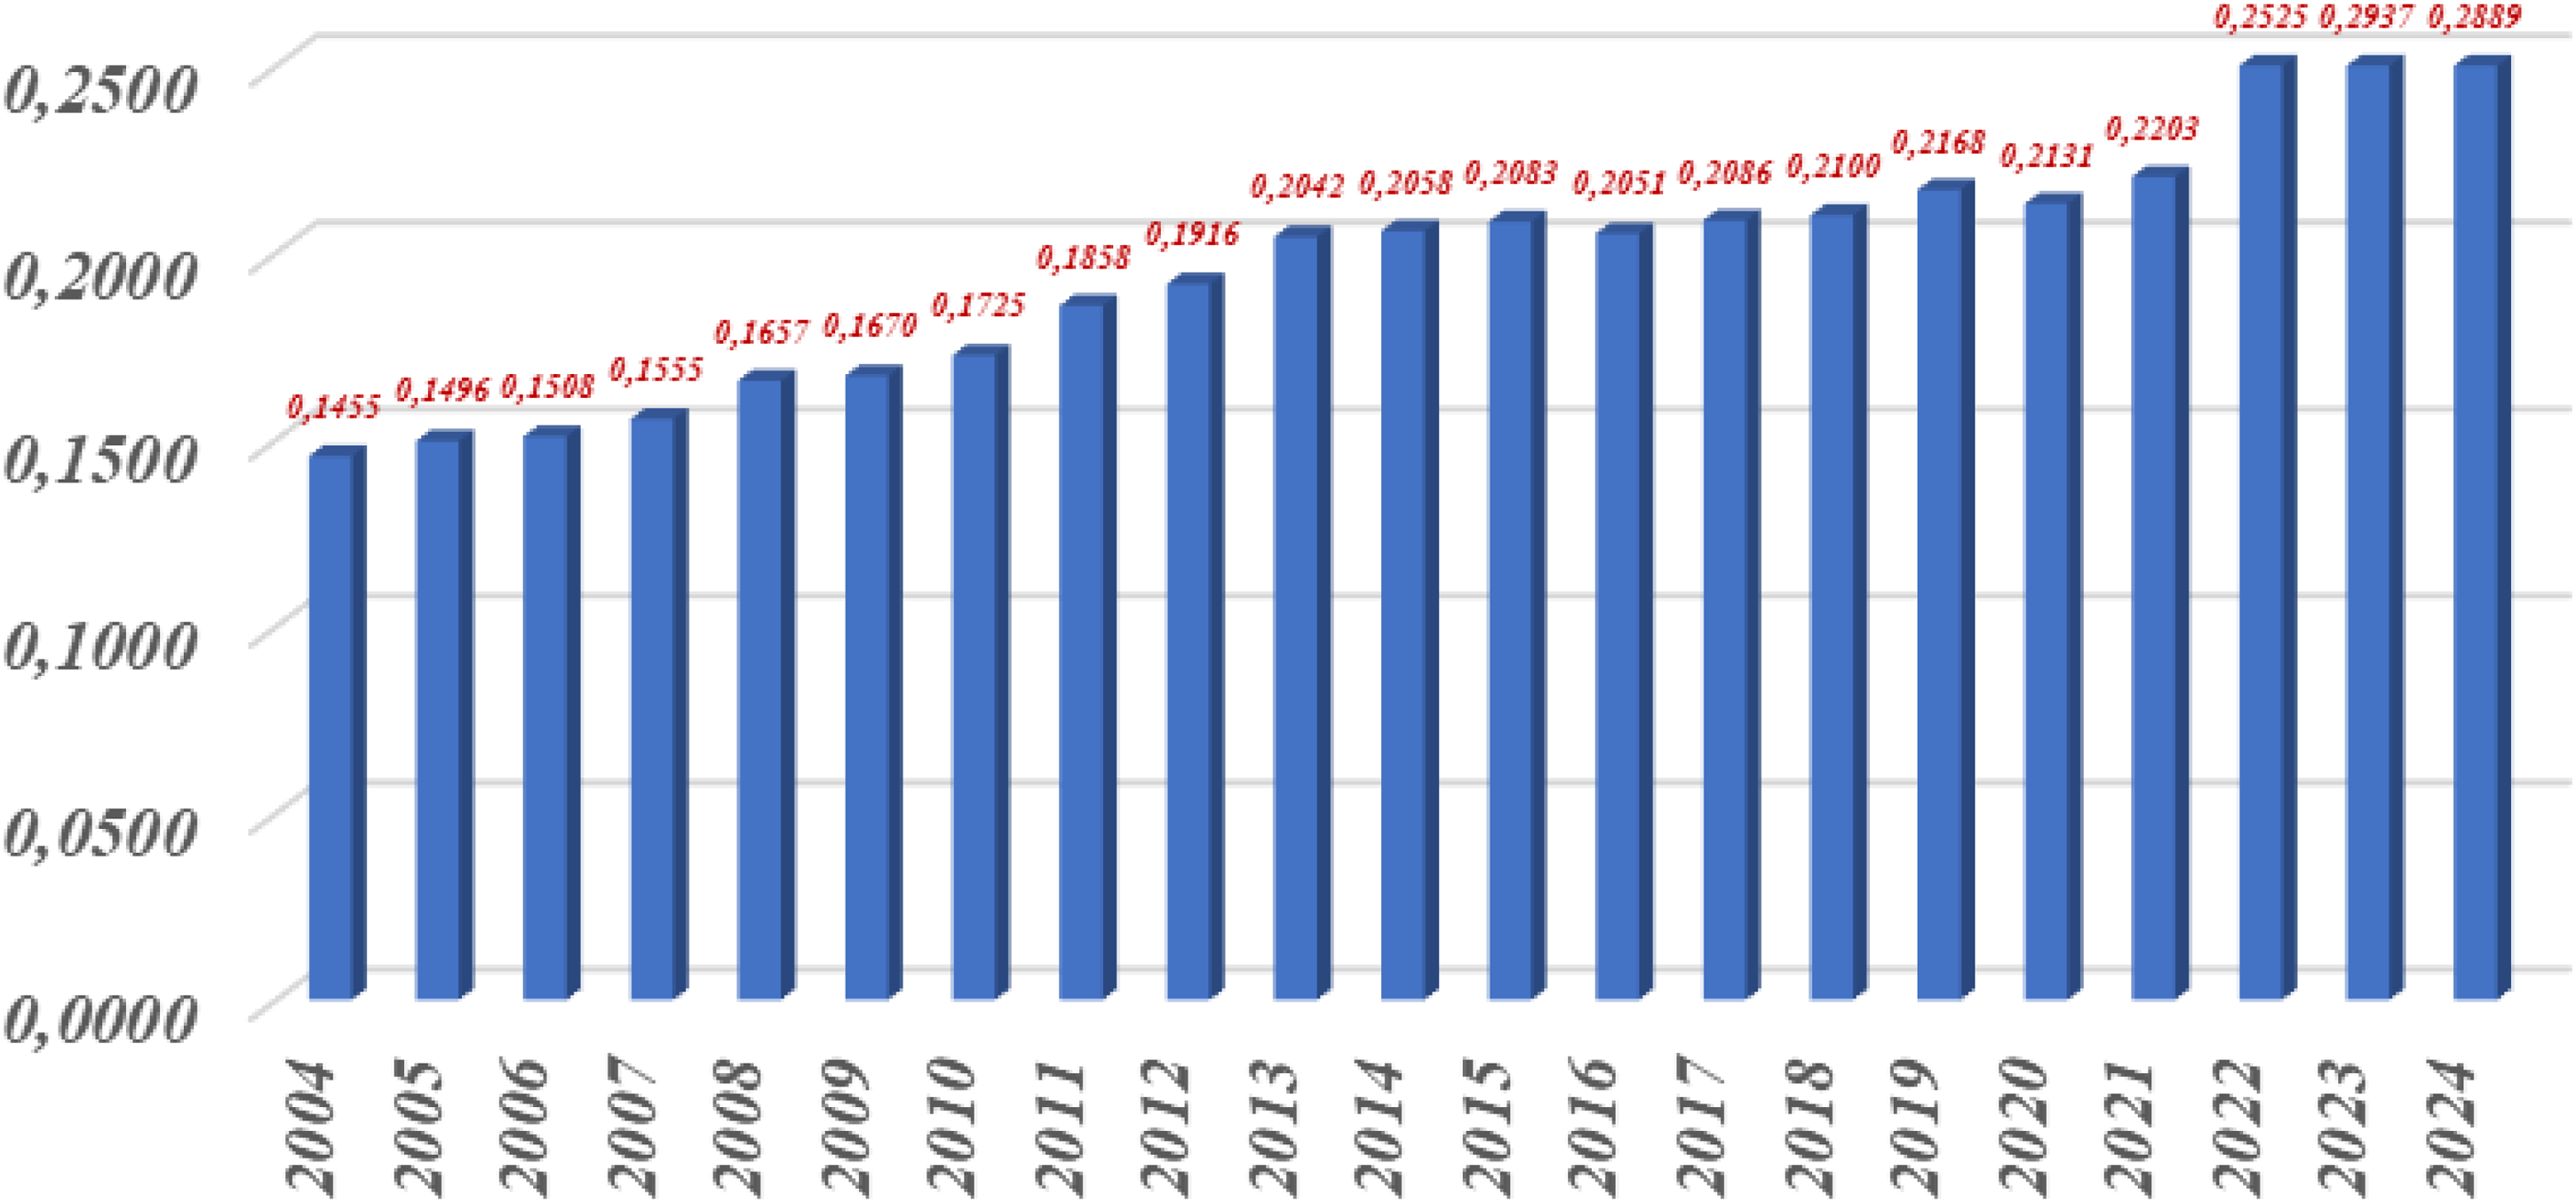
Share of renewable energy in gross final energy consumption per sector at the level of the European Union. Source: Authors based on Eurostat data, Database: Eurostat.
As can be seen in Figure 5 for the variable Share of renewable energy in the gross final consumption of energy by sector (expressed as a percentage and statistically transformed into Millions of tons of crude oil equivalent), with the exception of 2011 which can be considered as one out of the trend of values, the trend is strongly upward and can be explained by the creation of a legislative framework favorable to the just transition, the emergence of innovative technological solutions for the production of energy from sustainable sources and the involvement of all decision-makers for the implementation of these solutions.
At the level of the European Union, the variable Population that cannot keep the house heated depending on the state of poverty, registers oscillations influenced by the variation of the real GDP per capita (Figure 6), when it is low the population suffers and reduces energy consumption, and when it is high the population can afford to use more energy.
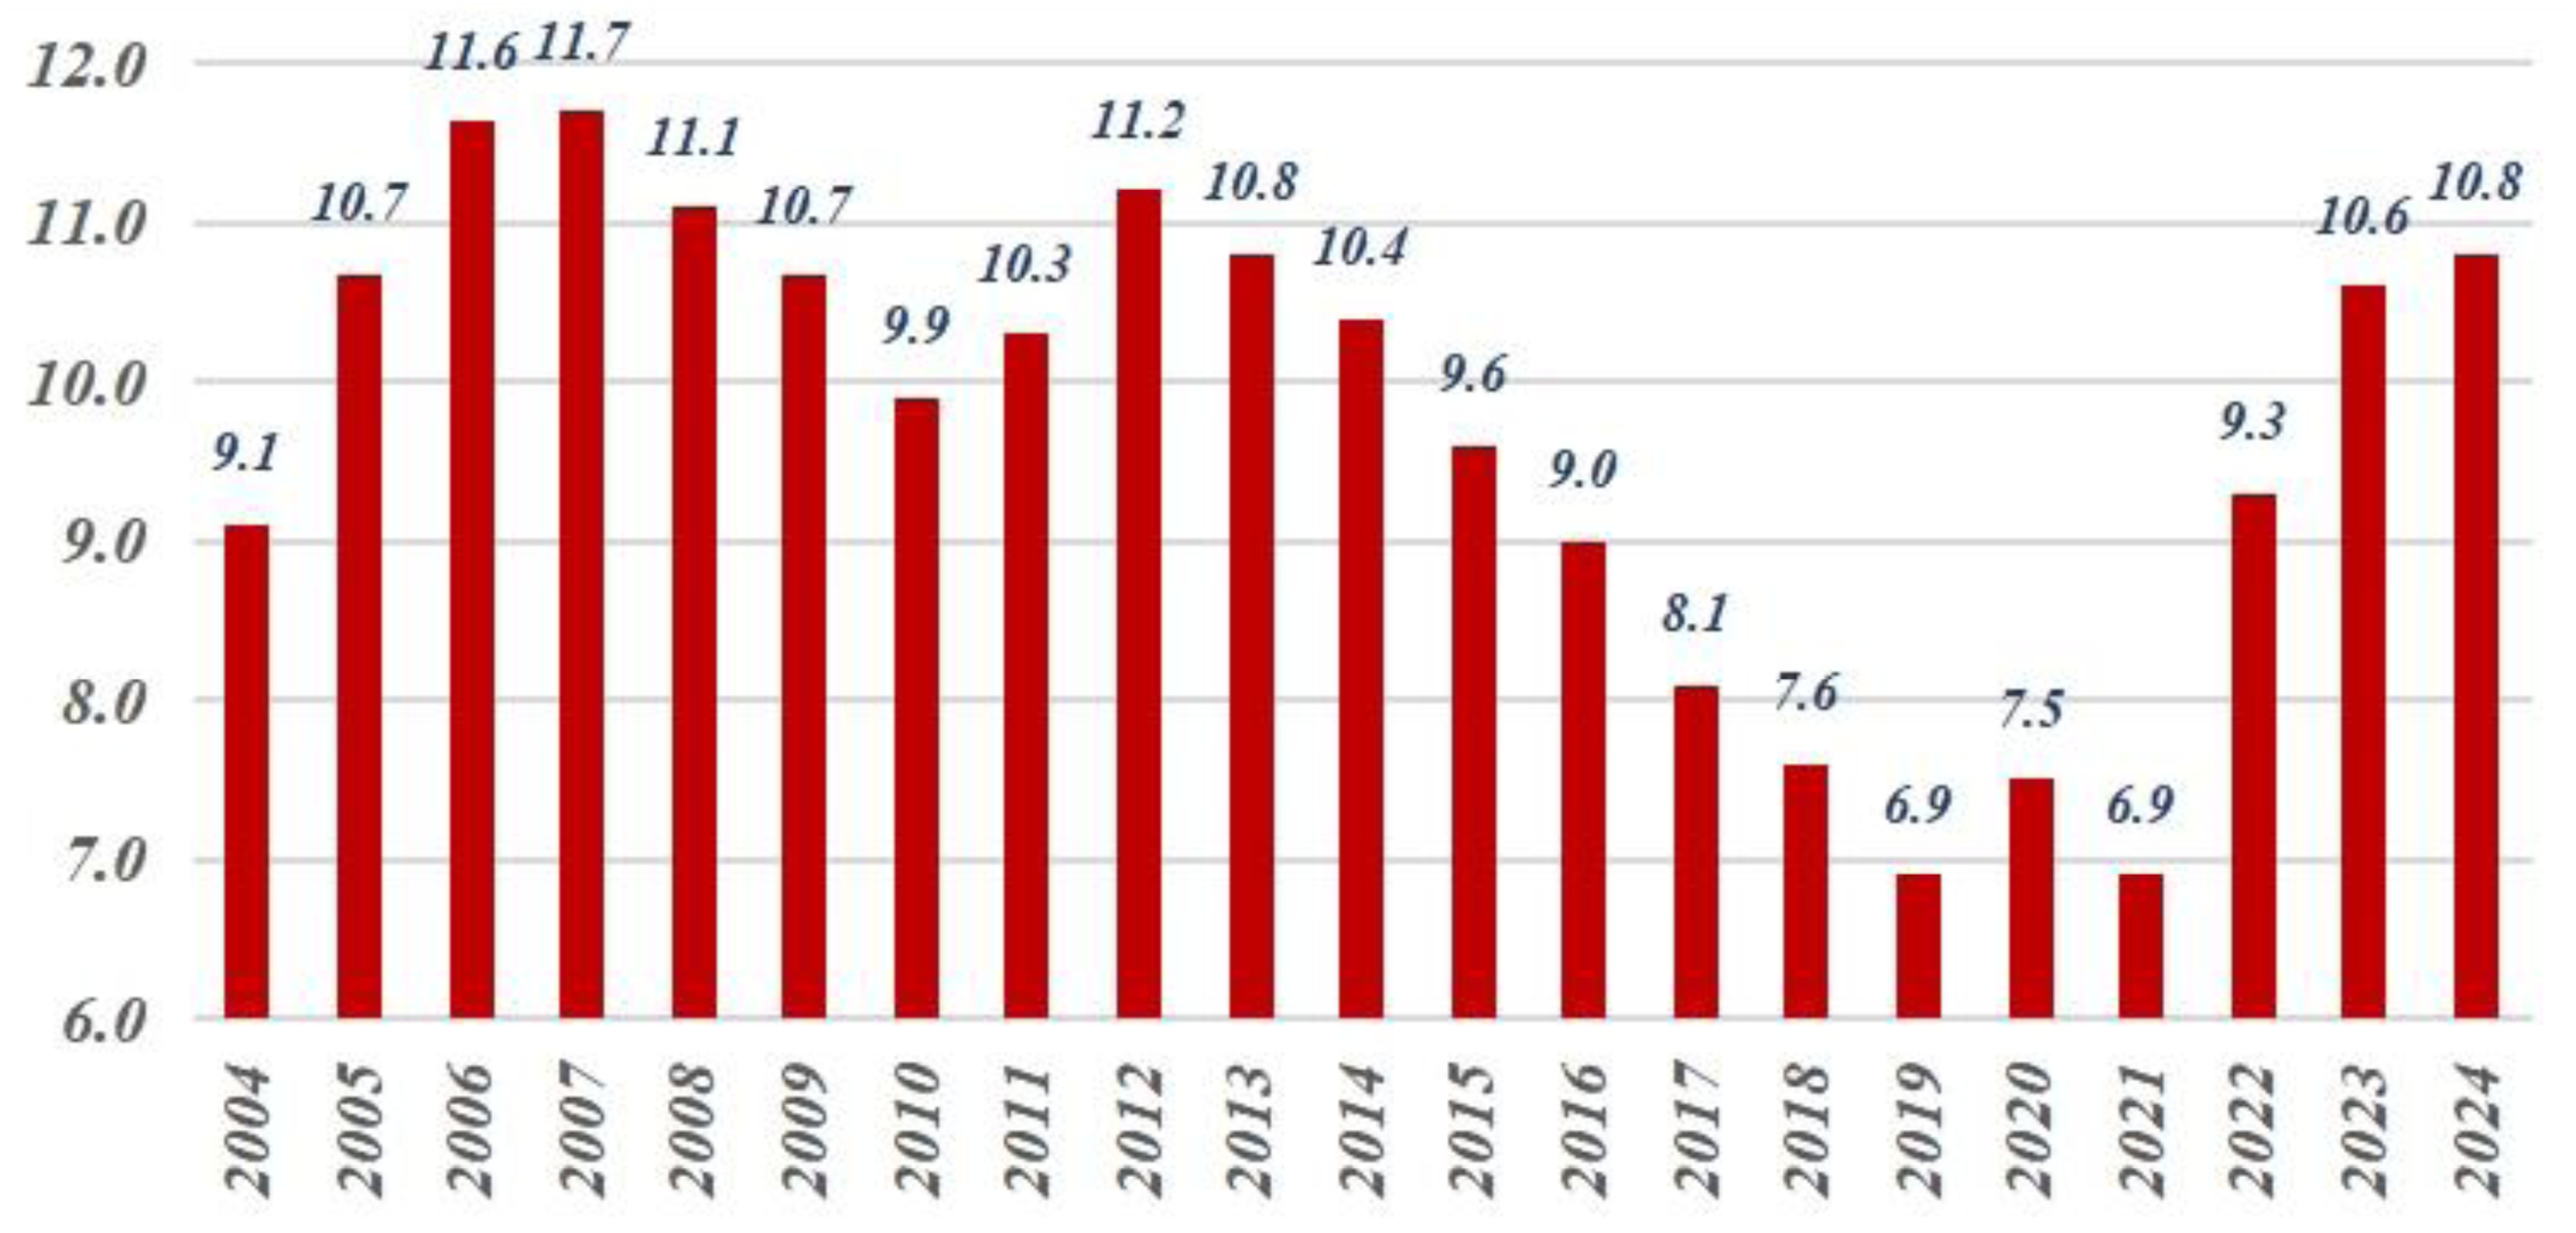
The population that cannot keep the house heated according to the state of poverty at the level of the European Union. Source: Authors based on Eurostat data, Database: Eurostat.
The indicator of the population unable to keep the house heated has shown a long-term decline, followed by a significant increase in recent years. The decrease by 2019 indicates an improvement in general economic conditions and implicitly in access to energy resources. Recent variations, including the 2022 increase, suggest increased sensitivity to factors such as disposable income, energy prices, and economic and political events. Electricity and natural gas prices have fluctuated significantly in recent years, directly affecting end consumers, and recent geopolitical events, such as the conflict in Ukraine and sanctions against Russia, have led to historic increases in energy prices, exacerbating energy poverty in certain regions.
Figure 7 shows the evolution of average electricity prices according to the type of user at the level of the European Union.
Average electricity prices by user type across the European Union. Source: Authors based on Eurostat data, Database: Eurostat.
For electricity depending on the type of user, prices had an upward trend until 2019, then during the pandemic period they decreased when consumption for domestic and industrial activities decreased, resuming their upward trend when these activities returned to a normal level.
Figure 8 shows the evolution of average natural gas prices according to the type of user at the level of the European Union.
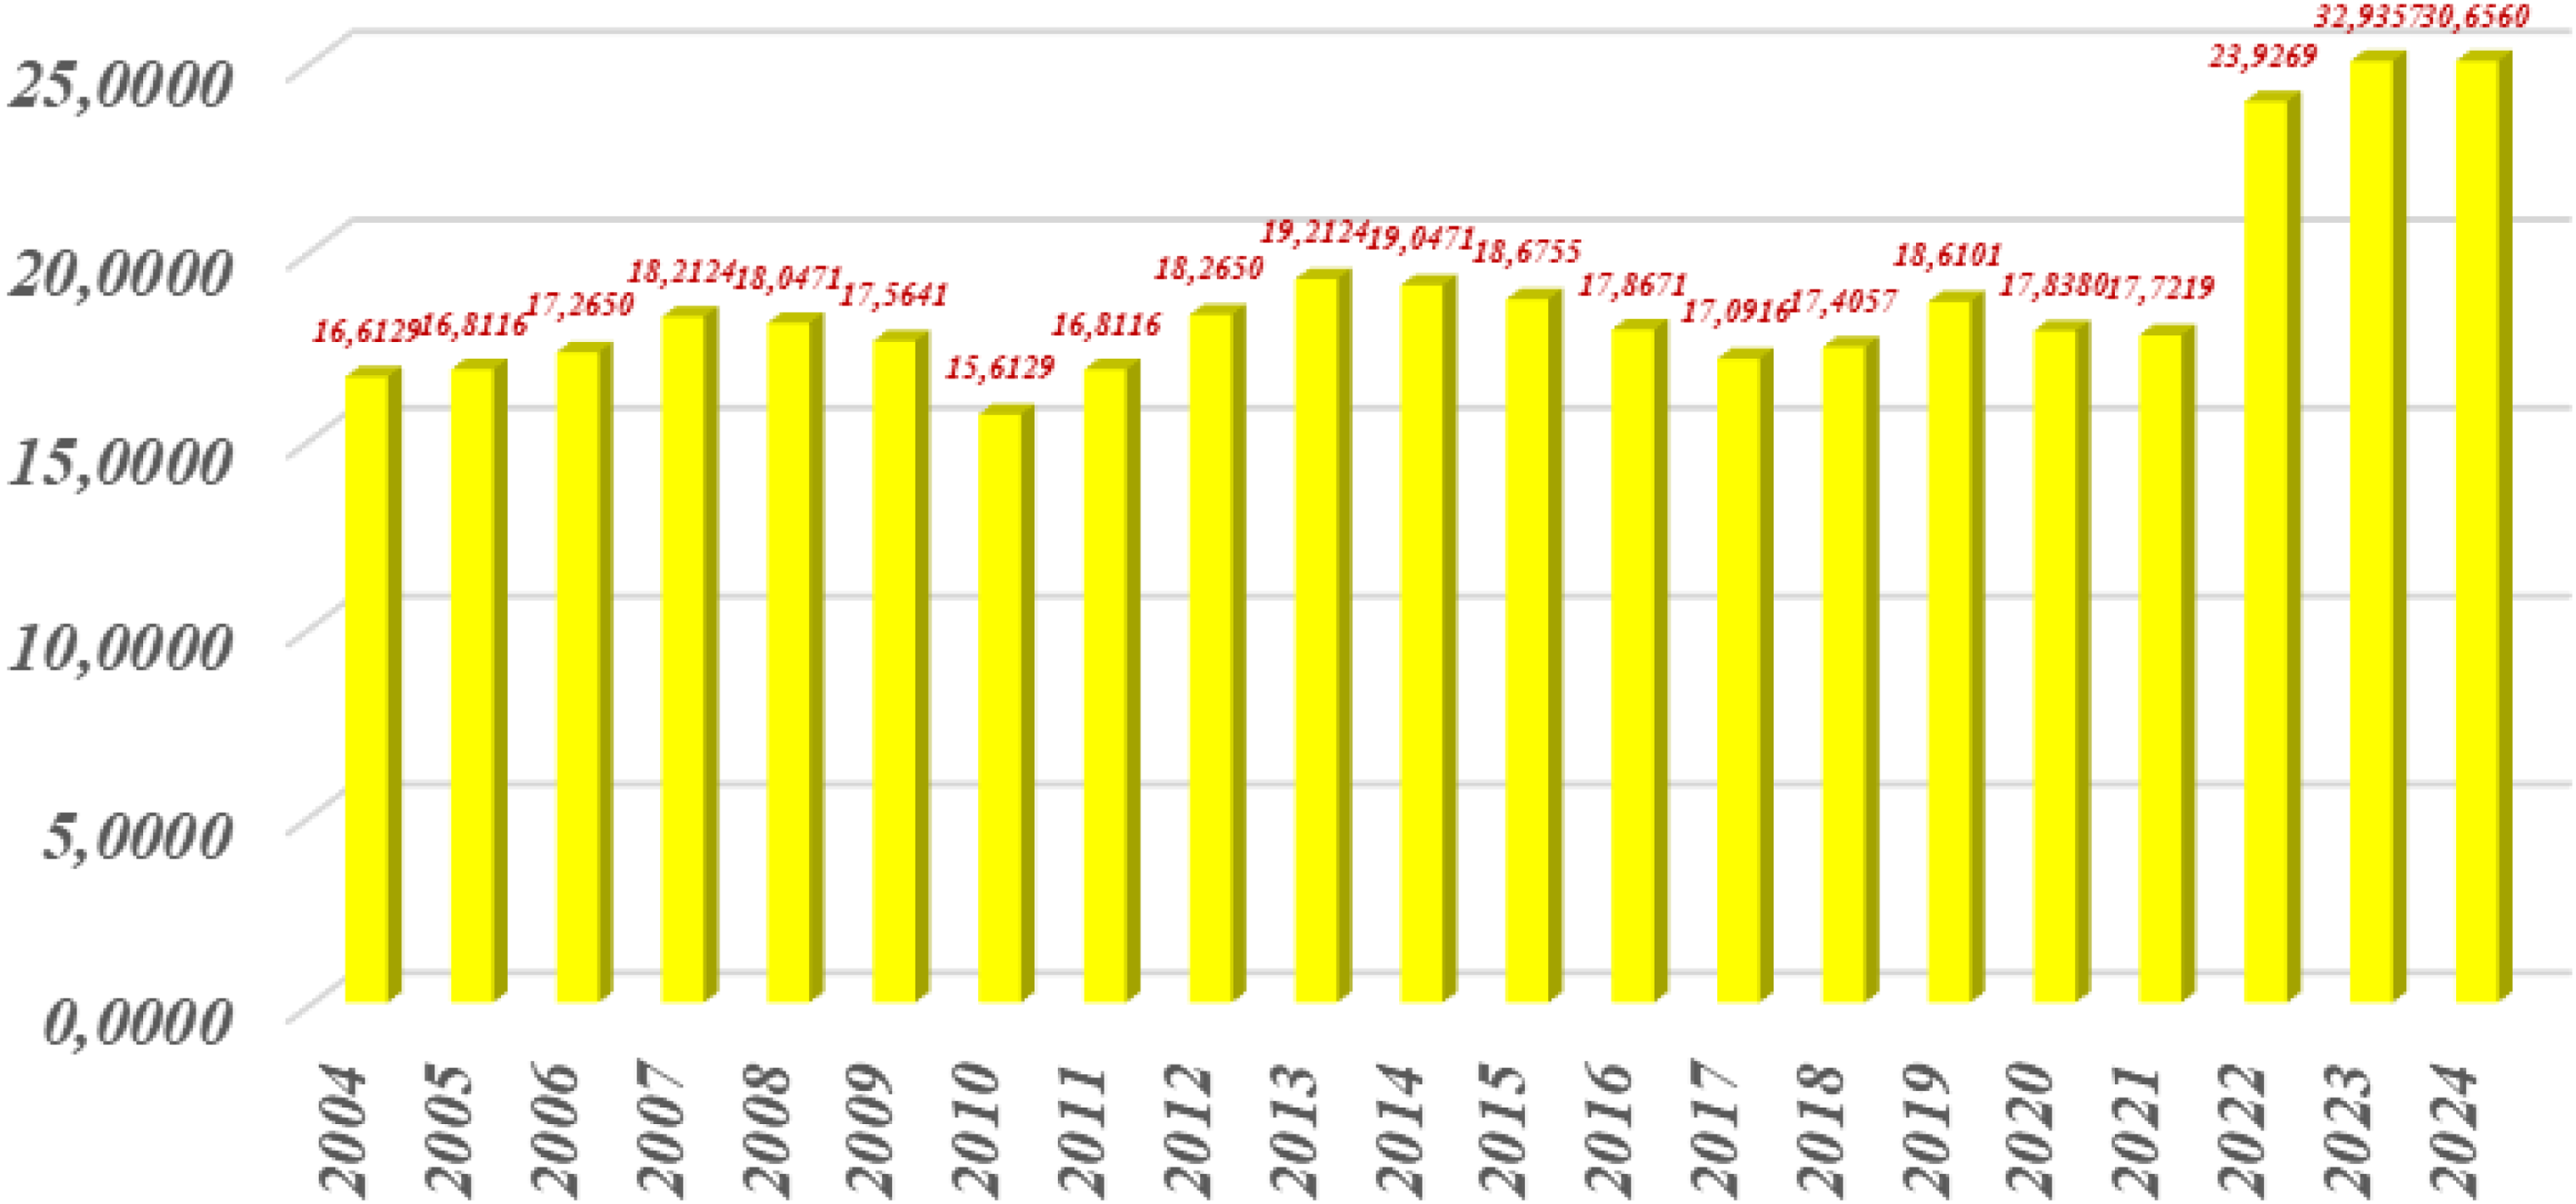
Average natural gas prices by type of user at European Union level. Source: Authors based on Eurostat data, Database: Eurostat.
Average natural gas prices, depending on the type of user (Figure 8), fluctuated a lot, the value of the variable starting from 16.6129 in 2004, on an upward trend with a maximum in 2007, then decreasing until 2010 to a minimum of 15.6129. Since 2010, there has been a new increase that reaches the maximum level in 2013 at the value of 19.2124, then a decrease that reaches a minimum in 2017 of 17.0916. From this year the value increases until 2019 to a level of 18.6101. As in the case of electricity, during the pandemic, domestic and industrial activities were reduced, implicitly reducing natural gas consumption, which also led to a decrease in prices to 17.8380 in 2020 and 17.7219 in 2021. After the pandemic the special operation in Ukraine began, a belligerent situation that led to economic sanctions imposed on Russia by the European Union, including the creation of independence of the countries of the union from Russian gas, by reducing imports from this country. The situation has led to a significant increase in natural gas prices on the international market and implicitly in Europe, to a historical level of 32.9357 in 2023. By identifying other suppliers of natural gas and liquefied natural gas, as well as the discovery of some deposits of natural gas, the trend started to become a downward one.
The prices of electricity and natural gas have registered major increases, strongly influencing the phenomenon of energy poverty. The liberalization of the market in 2022 led to sudden price increases, with traders taking advantage of the lack of clear regulations, and the price increases particularly affected low-income households, amplifying the difficulties in maintaining thermal comfort. In general, the evolution of the analyzed indicators indicates that at the level of the European Union there have been uncertain developments regarding the energy and economic situation in recent years, due to the volatility of the economic, social, cultural environment and geopolitical positioning, with significant increases in the domestic product real gross per capita and implicitly the standard of living of the population, but with a significant increase in prices for electricity and heat. Also, the increasing trends in the share of renewable energy in the final gross energy consumption per sector, complemented by price developments for accessing different forms of energy from conventional sources, indicate a change in the vision on the forms of obtaining energy in the European Union area and implicitly, on the final energy consumption in households per capita. Next, we will adapt some statistical-econometric models to the specifics of the studied phenomenon.
In order to enhance the precision of the analysis, the issue of disparate measurement units across different variables will be addressed by converting the data series into relative figures. The annual change index will be calculated for each variable. The processed data are presented in Table 2. rx/y = Pearson linear correlation coefficient
Annual change indices for the variables considered.
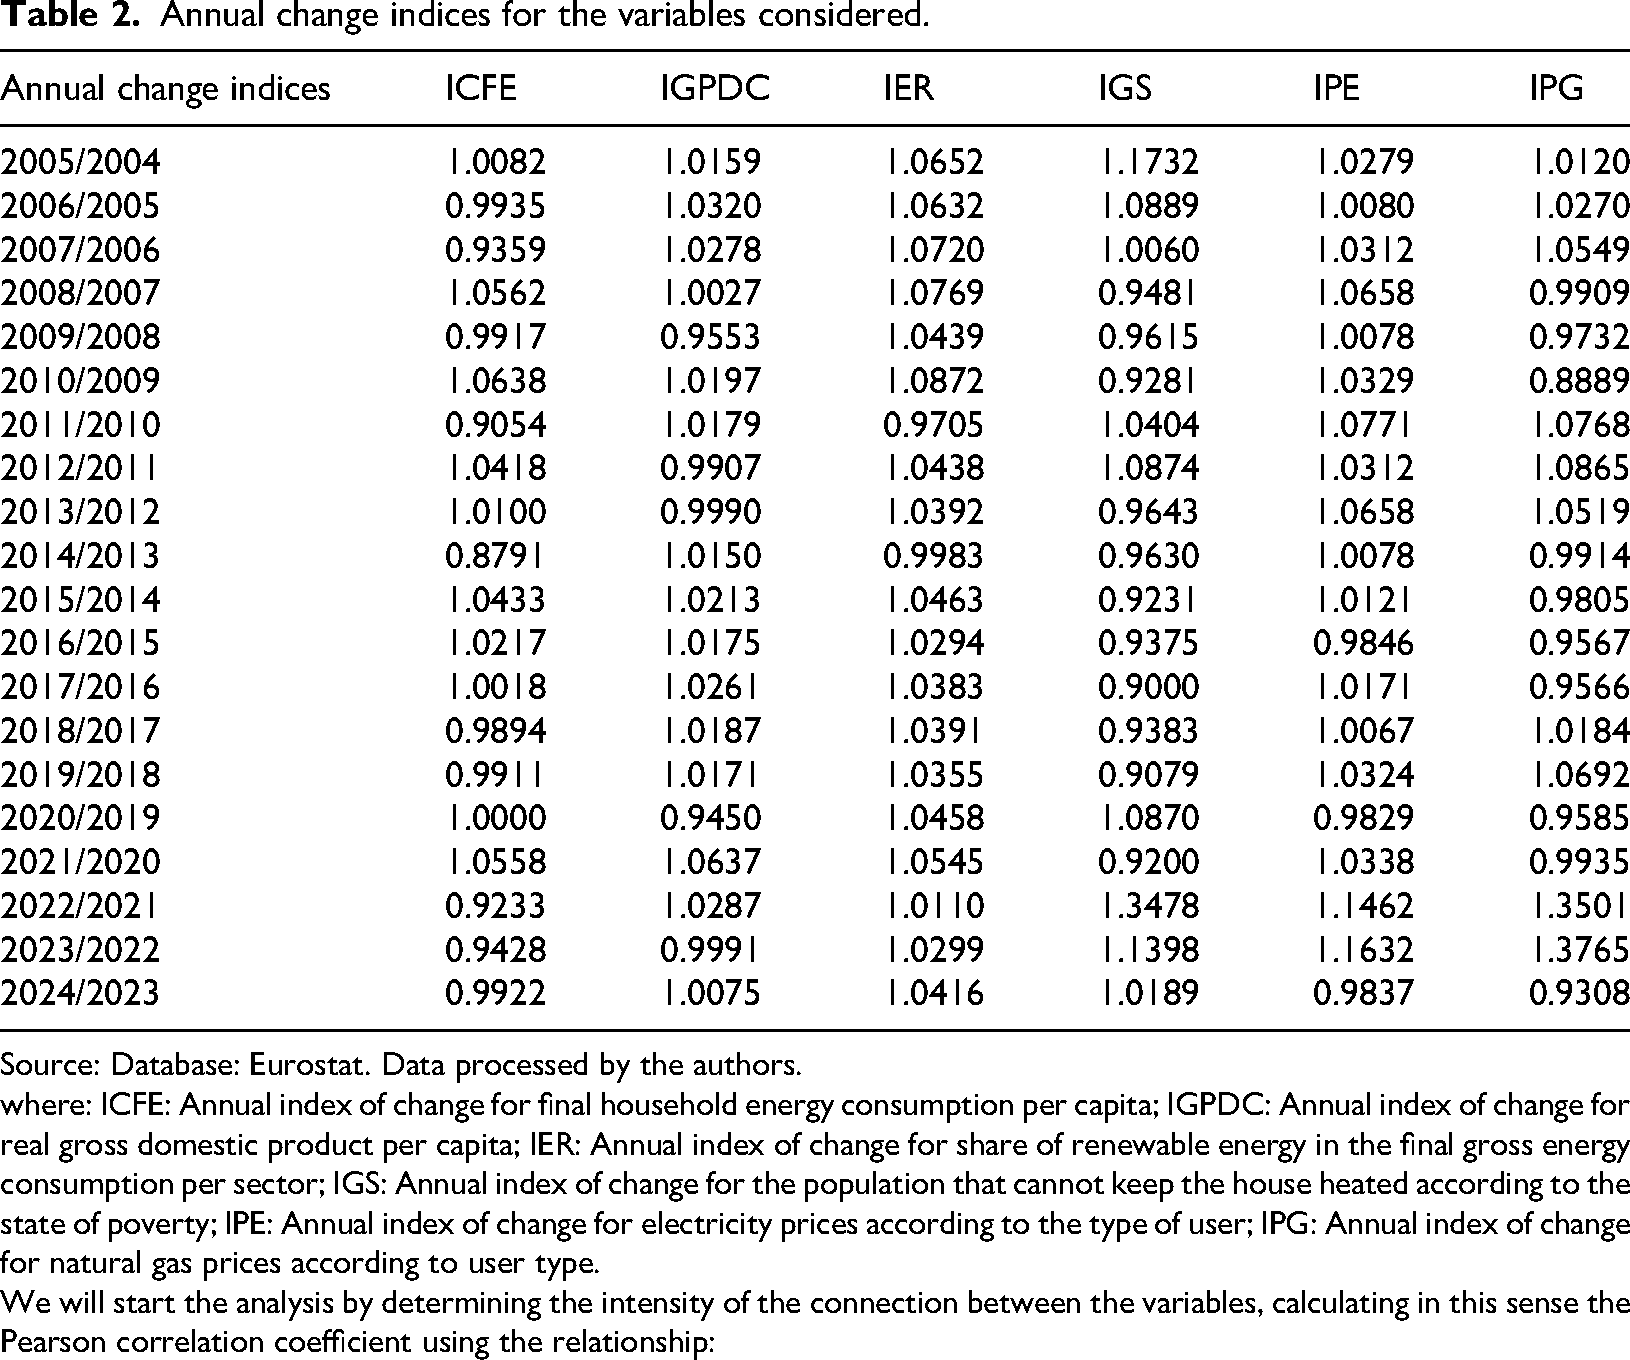
Source: Database: Eurostat. Data processed by the authors.
where: ICFE: Annual index of change for final household energy consumption per capita; IGPDC: Annual index of change for real gross domestic product per capita; IER: Annual index of change for share of renewable energy in the final gross energy consumption per sector; IGS: Annual index of change for the population that cannot keep the house heated according to the state of poverty; IPE: Annual index of change for electricity prices according to the type of user; IPG: Annual index of change for natural gas prices according to user type.
We will start the analysis by determining the intensity of the connection between the variables, calculating in this sense the Pearson correlation coefficient using the relationship:
Table 3 shows the results of the analysis.
Matrix of correlation coefficients.
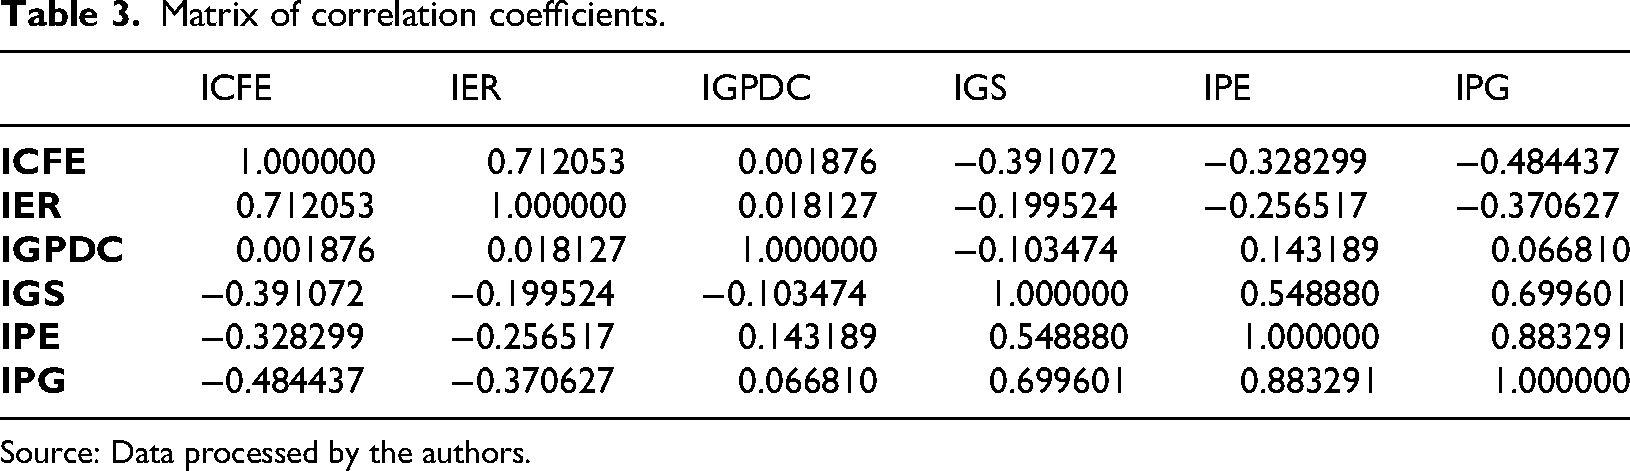
Source: Data processed by the authors.
A thorough examination and interpretation of the findings reveals the presence of robust and significant interconnections among the variables. For instance, a high correlation is observed between ICFE and IER (rICFE IER = 0.71), as well as between IPG and IPE (rIPG IER = 0.88). Conversely, the poverty level measured by the IGS indicator exhibits a weaker correlation with IER and IGPDC. The relationship between IGS and ICFE approaches an average level of correlation and is inverse (rIGS ICFE = −0.39), which is consistent with the expected outcome of an increase in poverty level leading to a decrease in the population's capacity to maintain current consumption levels. Conversely, the links between IPE/IPG and IGS are direct and above average, suggesting that an increase in gas and energy prices leads to a proportional increase in the poverty level. Consequently, the variables IGS, ICFE, IPE, and IPG will be considered, and a VAR (vector autoregression) analysis will be performed, given that the results of such analysis offer the possibility of drawing up a forecast for the following period.
To strengthen the causal claims, we considered sample expansion, stationarity testing, and the use of vector error correction model (VECM) and structural equation modeling (SEM) models based on an explicit theoretical framework. Based on this analysis, the previous study was completed by verifying the stationarity of the series, estimating a VECM, and outlining a SEM framework to strengthen the causal claims.
For each series, the augmented Dickey–Fuller (ADF) stationarity test was applied, both on the initial series and on the first-order differenced series. The null hypothesis takes into account the presence of a unit root (the series is non-stationary), and a p-value below 0.05 indicates the rejection of the unit root hypothesis and, therefore, stationarity.
The results (Table 4) show that ICFE is level stationary (very small p-value), while IGS and IPG have p-values well above 0.05, being compatible with I(1) processes. IPE has a p-value around 0.06, close to the 10% threshold, but above the 5% threshold; in practice it can be treated as approximately I(1).
ADF results for level series.
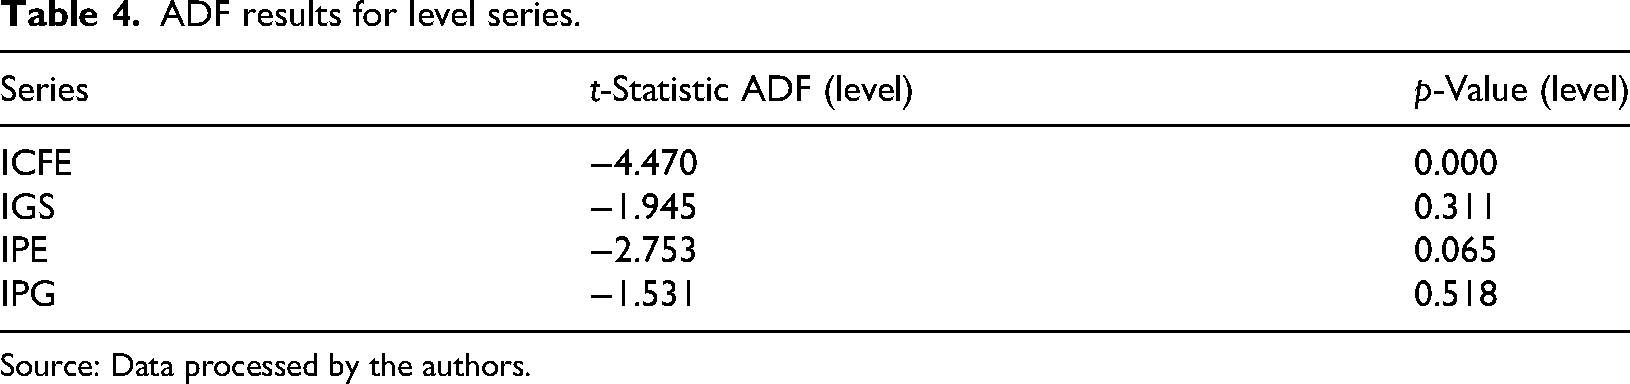
Source: Data processed by the authors.
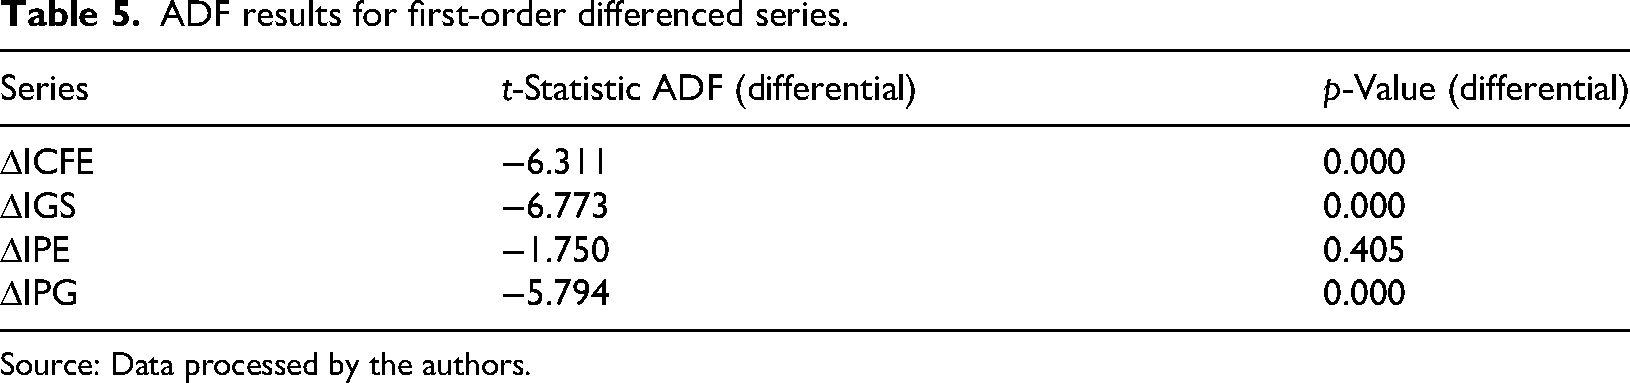
The differentiation of the series leads, especially for IGS and IPG, to a significant decrease in the p-value below 0.05, which confirms the stationarity of the differentiated series and justifies the use of a VECM model to simultaneously describe long-term relationships and short-term dynamics (Table 5).
ADF results for first-order differenced series.
Source: Data processed by the authors.
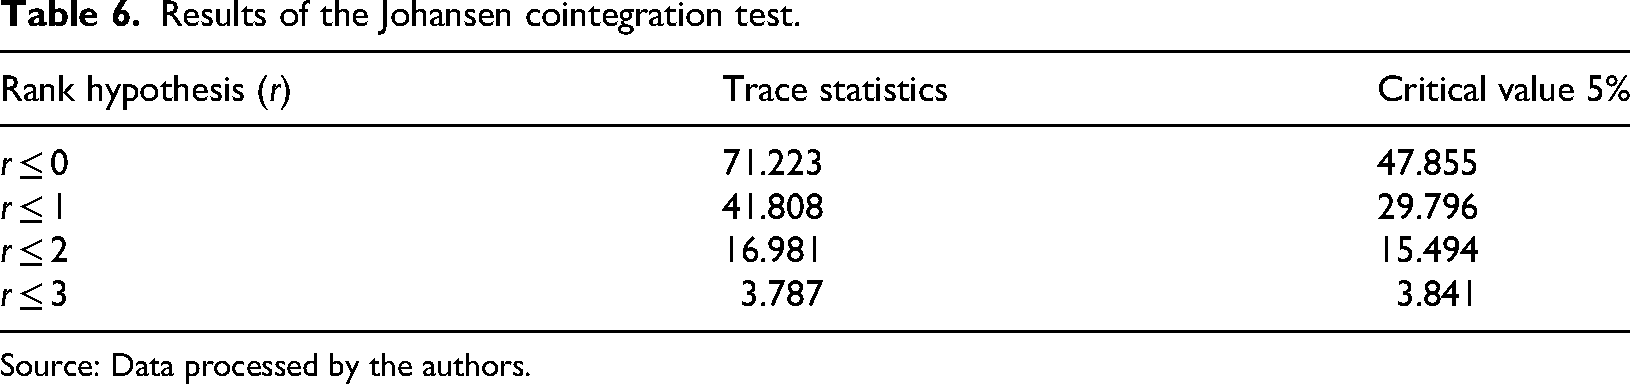
To examine the existence of long-term equilibrium relationships between the four series, the Johansen cointegration test was applied, without a deterministic trend and with a lag in the differences (k_ar_diff = 1).
For the hypothesis r = 0 (no cointegration), the trace statistic clearly exceeds the critical value of 5%, suggesting the rejection of the hypothesis of the absence of cointegration relationships. The results for r ≤ 1 and r ≤ 2 are also above the threshold, but the small sample size requires caution. For illustration, we continue with a VECM model with a cointegration rank r = 1, assuming the existence of a main equilibrium relationship between the series (Table 6).
Results of the Johansen cointegration test.
Source: Data processed by the authors.
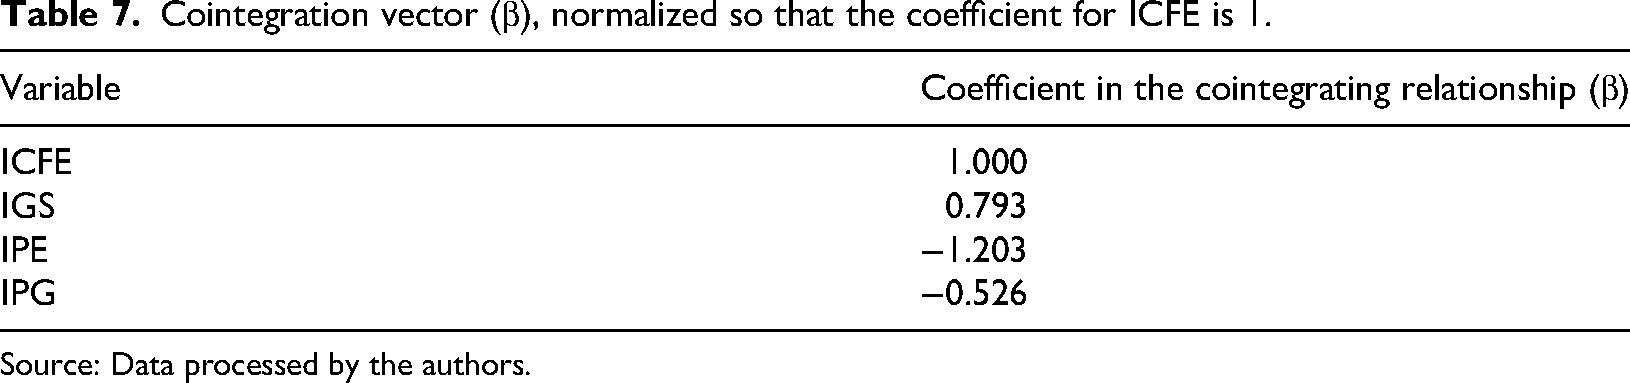
The VECM model with rank 1 can be viewed as a difference-in-differences VAR, to which is added an error correction term (EC t −1) that captures the deviation from the long-run equilibrium relationship. The VECM estimate provides a cointegration vector (β) and an adjustment vector (α) presented in the Table 7.
Cointegration vector (β), normalized so that the coefficient for ICFE is 1.
Source: Data processed by the authors.
This defines a linear combination of type:
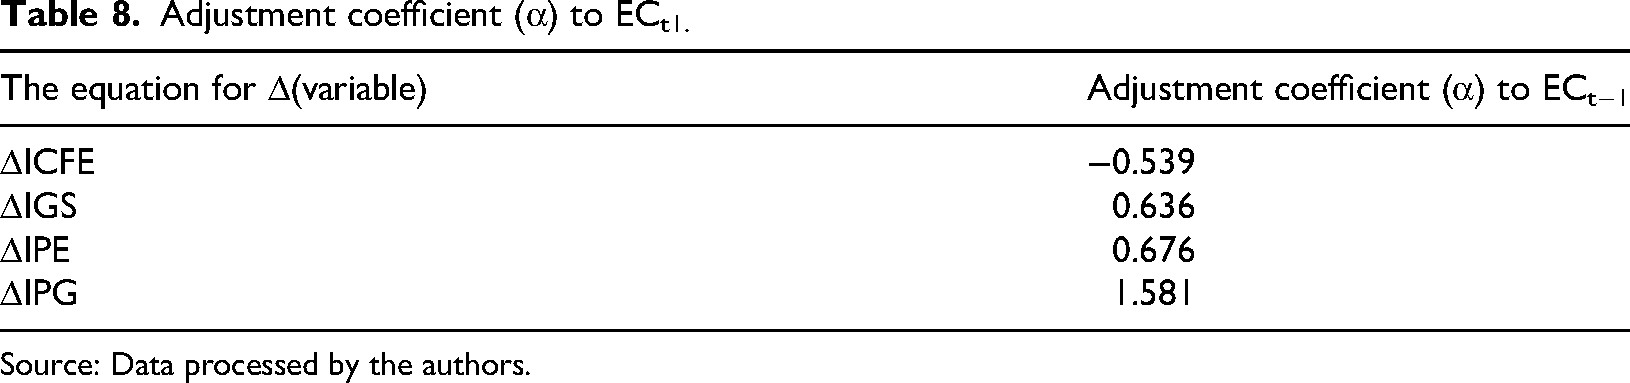
This represents the long-term equilibrium relationship. Significant deviations of EC t from a constant value are subsequently corrected by short-term dynamics. The adjustment vector (α) indicates how each variable reacts to the deviation of EC t −1, and the results are presented in Table 8.
Adjustment coefficient (α) to ECt1.
Source: Data processed by the authors.
A negative α coefficient for ΔICFE shows that when EC t −1 is positive (the linear combination is too large relative to equilibrium), ΔICFE t tends to be negative, contributing to the correction of the deviation. The positive coefficients for the other series suggest that they also react to the deviation from equilibrium, with different roles in the adjustment.
SEM allows the explicit integration of theoretical hypotheses about the direction and nature of the causal relationships between variables. In this context, the cointegration vector estimated by VECM can be interpreted as a long-run equilibrium structural equation, of the type:
The combination of this equilibrium equation with the dynamic VECM equations for each ΔYt (Y ∈ {ICFE, IGS, IPE, IPG}) leads to a dynamic SEM framework, in which: the error correction term EC t −1 captures long-run relationships, the difference coefficients describe short-run adjustments, and the restrictions imposed on the coefficients reflect theoretical assumptions about the direction of causality.
The ADF and Johansen results show that the IGS, IPE, and IPG series can be treated as first-order integrated variables, linked by a common equilibrium relationship with ICFE. The cointegration vector and adjustment coefficients in the VECM indicate that the dynamics of ICFE and the other variables are influenced by deviations from this long-run relationship, which supports stronger causal interpretations than those based on contemporaneous correlations alone. Incorporating these results into an SEM based on an explicit theoretical framework provides a robust tool for formulating and testing causal claims about the interdependencies between the analyzed series.
A VAR model with one lag (VAR(1)) was used for modeling. The choice of a single lag is justified both by the small sample size (20 observations) and by the information criteria that penalize models with more parameters. The model allows capturing the dynamic interdependencies between the four series.
As can be seen from Table 9, standard tests were applied to evaluate the basic assumptions regarding the model residuals (lack of autocorrelation, homoscedasticity).
Ljung–Box test for autocorrelation of residuals (lag 1).
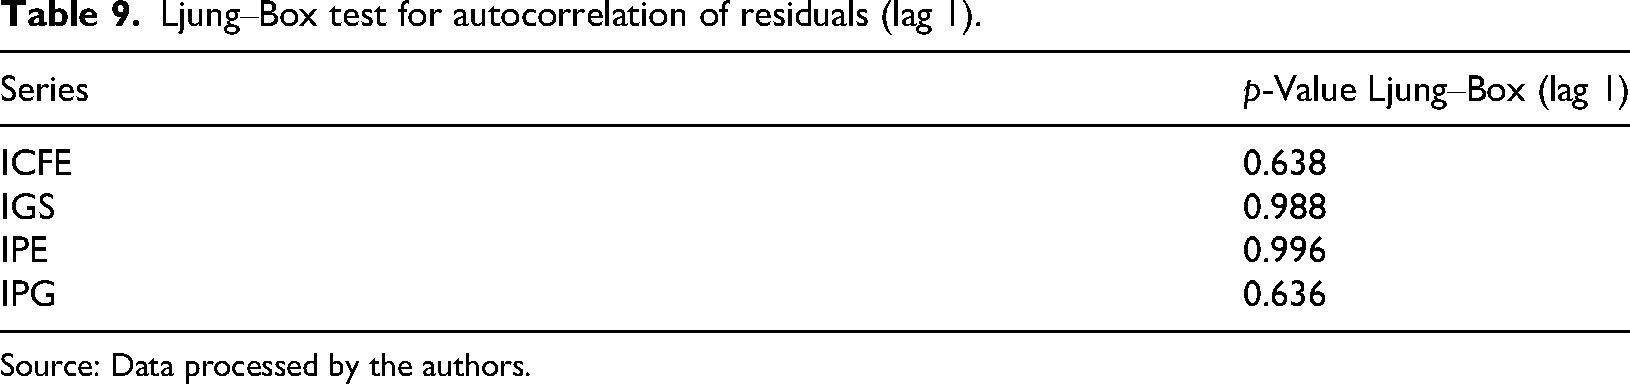
Source: Data processed by the authors.
For all series, the p-value is significantly higher than 0.05, which indicates that we cannot reject the null hypothesis of no autocorrelation in the residuals at lag 1 and the VAR(1) model is adequate from the perspective of residual autocorrelation.
For the heteroskedasticity analysis, the LM statistical test of the Breusch–Pagan test was used, resulting in a value of 0.050, with a p-value of 0.997. The high value of the p-value (>0.05) indicates that there is no significant evidence of heteroskedasticity in the equation for ICFE and the variance of the residuals can be considered approximately constant.
To assess the predictive capacity of the model, an out-of-sample validation was performed, the last 5 observations were reserved as a test set, and the VAR(1) model was estimated on the first 15 observations, generating forecasts for the next 5 steps based on this model.
The root mean square error (RMSE), aggregated over all four series, is approximately 0.179. Given the relatively low variability of the series around 1, this RMSE value indicates a reasonable predictive performance of the model over the short horizon considered.
To analyze and assess the sensitivity and robustness of the results, the last two observations, which contain relatively extreme values for some series, were eliminated, and the average for ICFE was recalculated. The average ICFE over the entire sample is approximately 0.992, and after eliminating the last two observations it becomes 0.995. The difference is 0.0028, which represents a very small change relative to the average level. This suggests that the descriptive results are robust to the exclusion of these extreme observations.
To investigate the dynamic relationships between the series, Granger causality tests with one lag were run, with ICFE as the dependent variable and the other series as potential causes (Table 10).
Granger test results (lag 1).
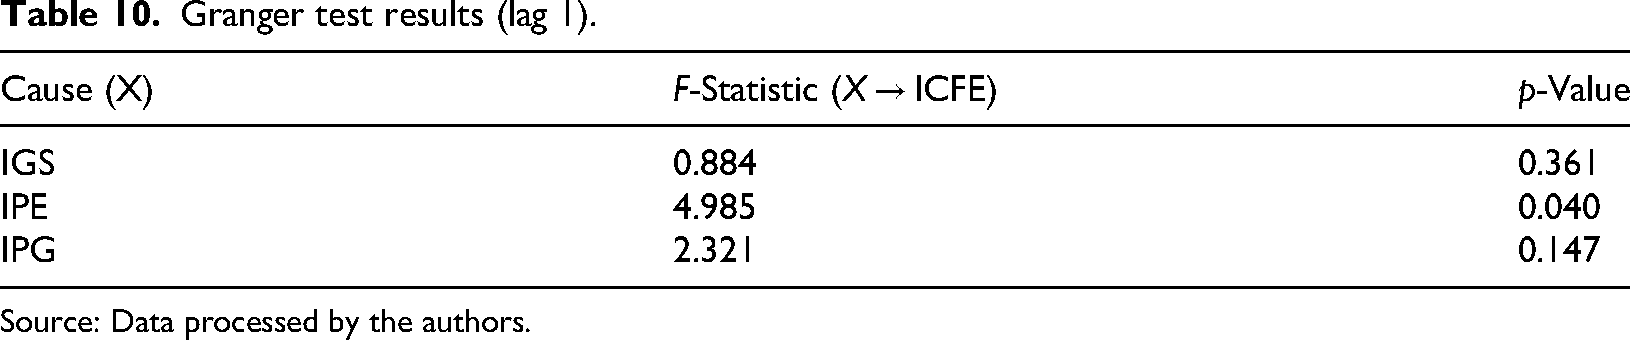
Source: Data processed by the authors.
It is observed that only the IPE series presents a p-value less than 0.05, which indicates a statistically significant Granger causality relationship IPE → ICFE at lag 1. For IGS and IPG the p-value is greater than 0.05, so there is insufficient evidence to state that these series anticipate ICFE within the specification used.
The graph in Figure 9 presents the autocorrelation functions (ACF) and partial autocorrelation functions (PACF) for the residuals of the four series in the VAR(1) model. The lack of significant spikes outside the confidence intervals confirms the conclusions of the Ljung–Box tests regarding the absence of systematic residual autocorrelation.
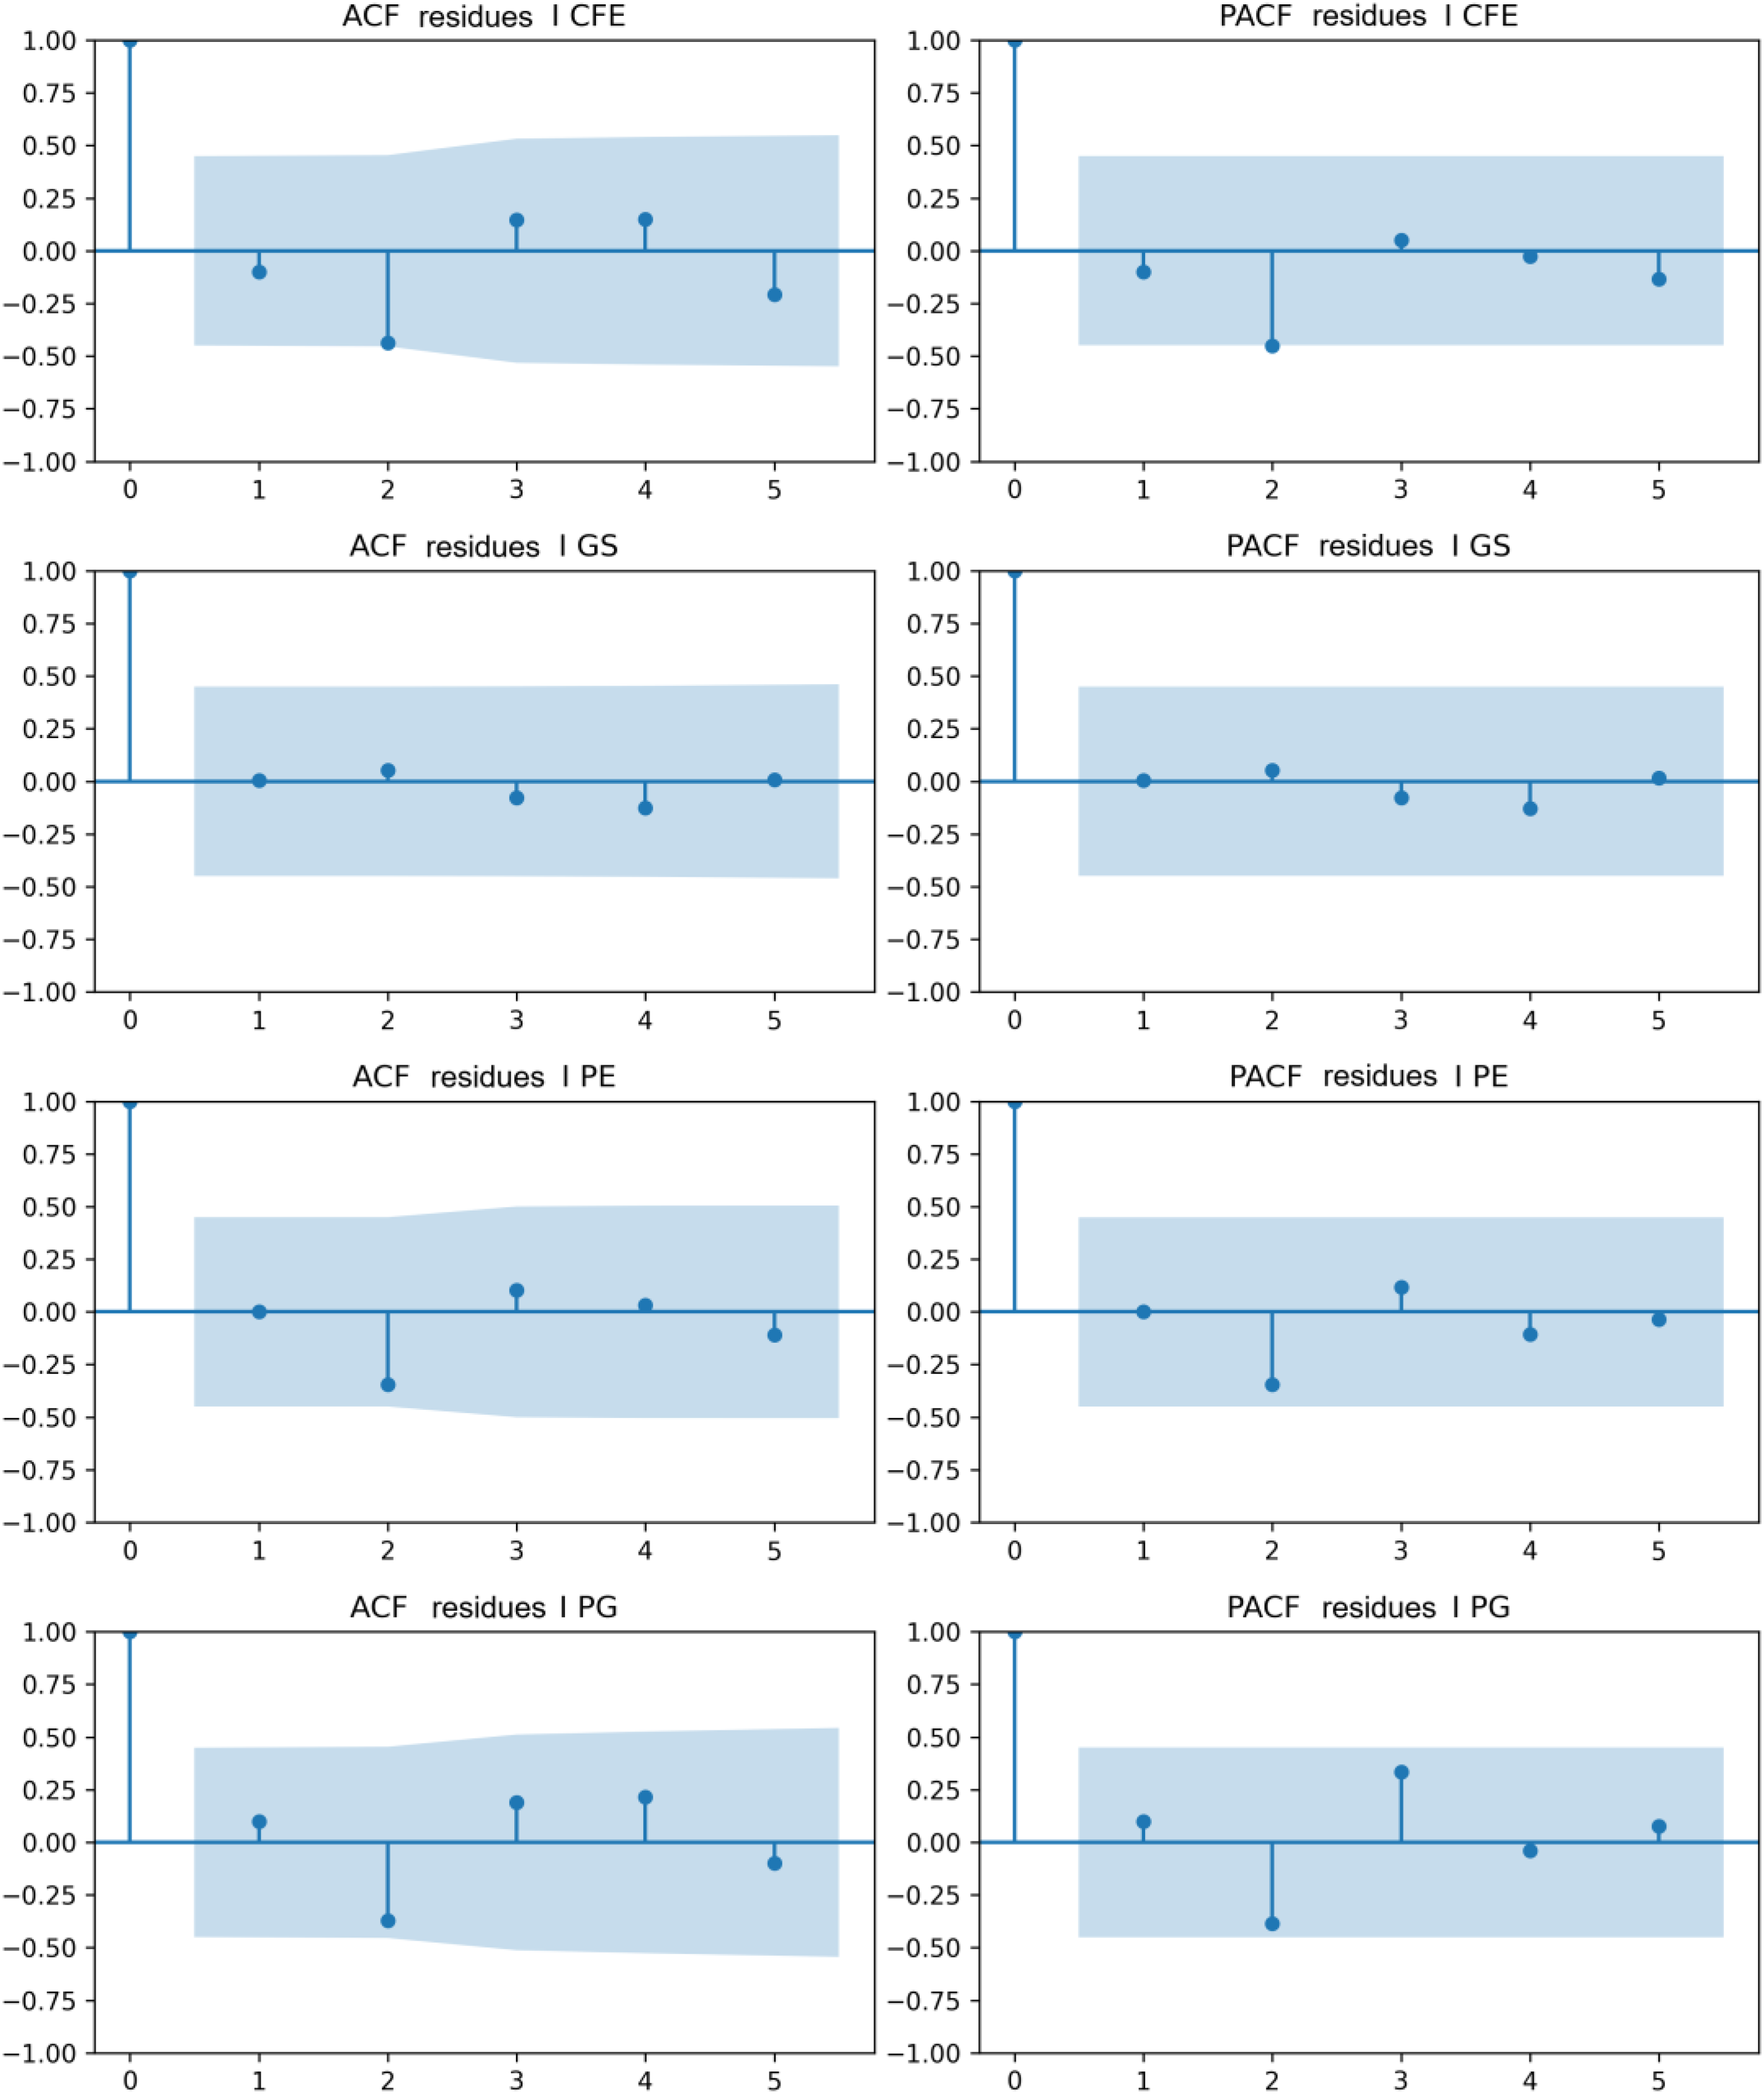
Autocorrelation functions (ACF) and partial autocorrelation functions (PACF). Source: Data processed by the authors.
The impulse response functions (Figure 10) illustrate how a unit shock in one of the series affects, over time, both the series itself and the other endogenous variables in the model. The following graph shows, for a 5-period horizon, the main responses of the series to shocks in each of the variables.
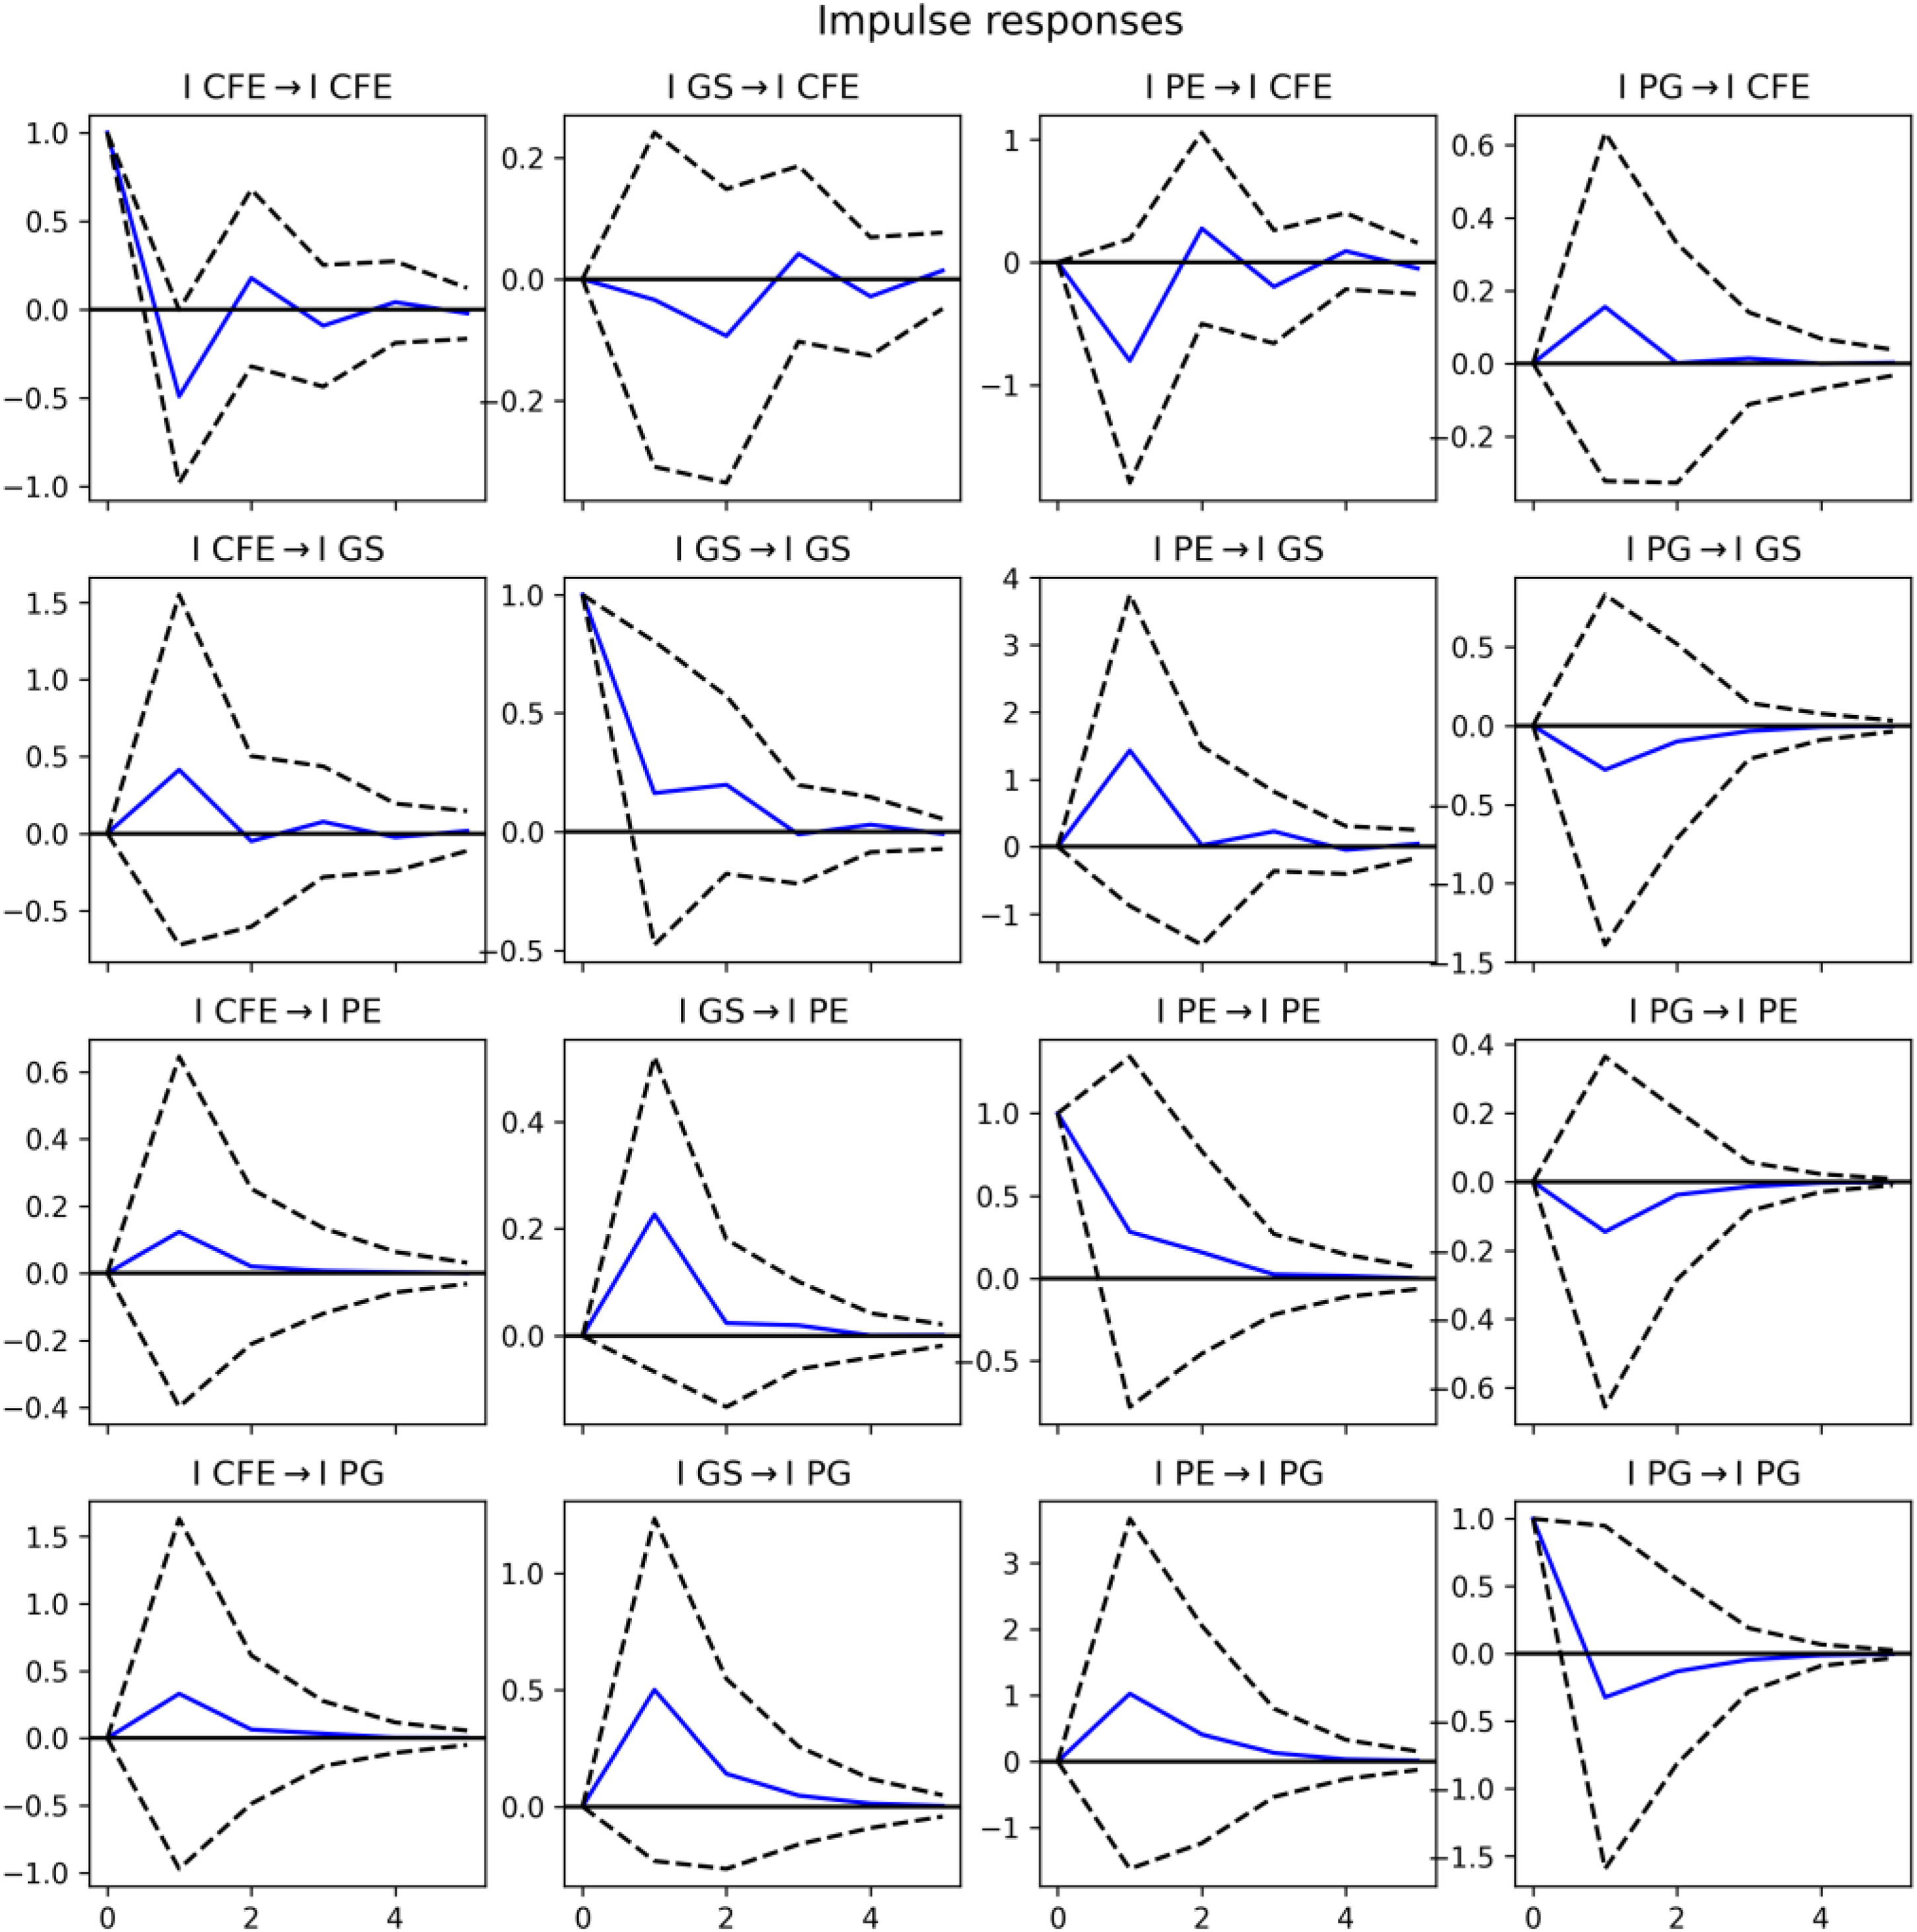
Impulse response functions. Source: Data processed by the authors.
Considering the results displayed in graphical form, it can be seen how a shock in IPE affects ICFE in the short term, which is consistent with the results of Granger causality tests indicating that IPE anticipates ICFE.
Based on the statistical analysis, it was highlighted that the VAR(1) model estimated for the ICFE, IGS, IPE and IPG series is validated by standard diagnostic tests, with no evidence of residual autocorrelation or heteroskedasticity in the analyzed equation. Out-of-sample validation indicates a reasonable predictive capacity over a short time horizon, and sensitivity analysis shows that the descriptive results are robust after excluding extreme observations. Granger causality tests and impulse response functions highlight an important role of the IPE series in anticipating the dynamics of ICFE.
The VAR model was implemented to derive the following statistical-mathematical equations, which will be utilized in future estimates of the resulting characteristics:


By adapting the VAR statistical-econometric model to the specifics of the phenomenon studied, the regression parameters were determined and the mathematical equations were completed. These will be used for the forecast.


Forecasted change rates.
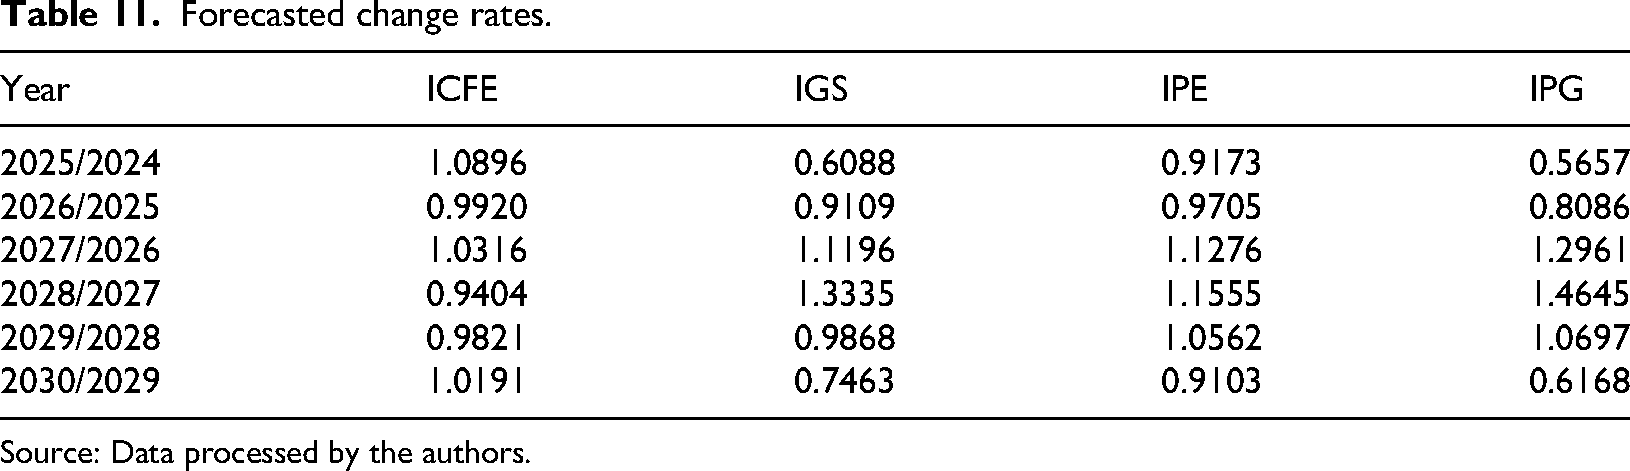
Source: Data processed by the authors.
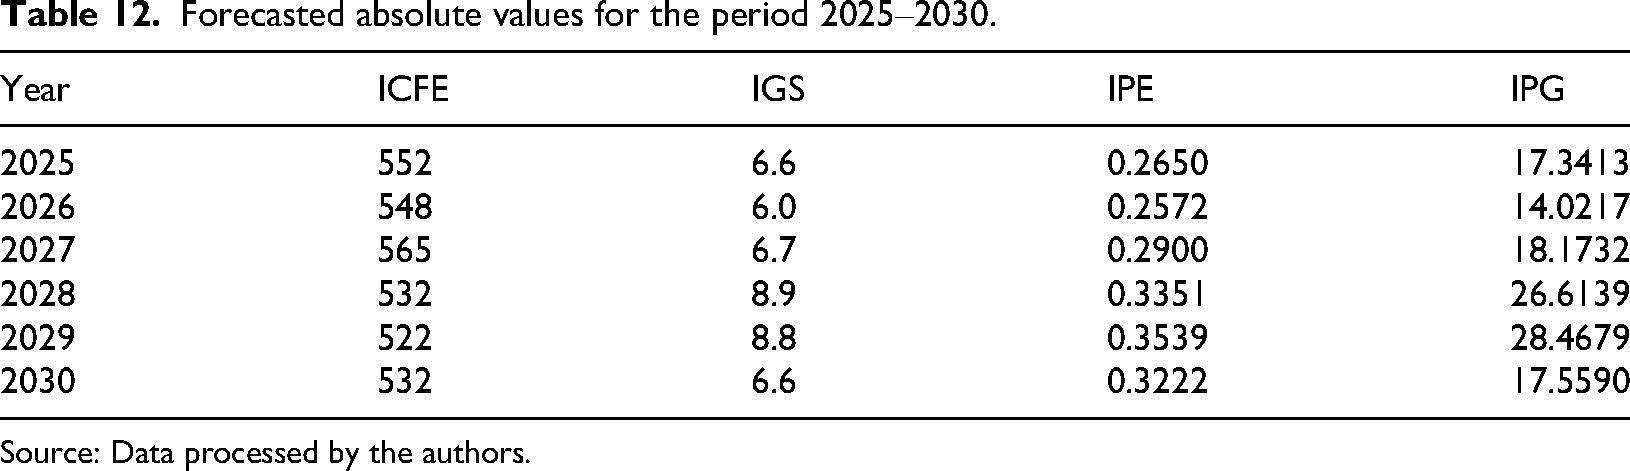
The calculation of the predicted absolute values for each variable is achieved through the utilization of the following relationship: Vt = the absolute value of the variable considered at the moment t Vt–1 = the absolute value of the variable considered at the moment t − 1 It/t–1 = the index of change between the moment t − 1 and t
The data regarding the forecasted absolute values for the variables under consideration for the period 2025–2030 have been meticulously calculated and are presented in Table 12.
Forecasted absolute values for the period 2025–2030.
Source: Data processed by the authors.
To facilitate the visualization and interpretation of the evolution of the studied variables, Figure 11 was prepared, considering both the reference period and the forecast period.
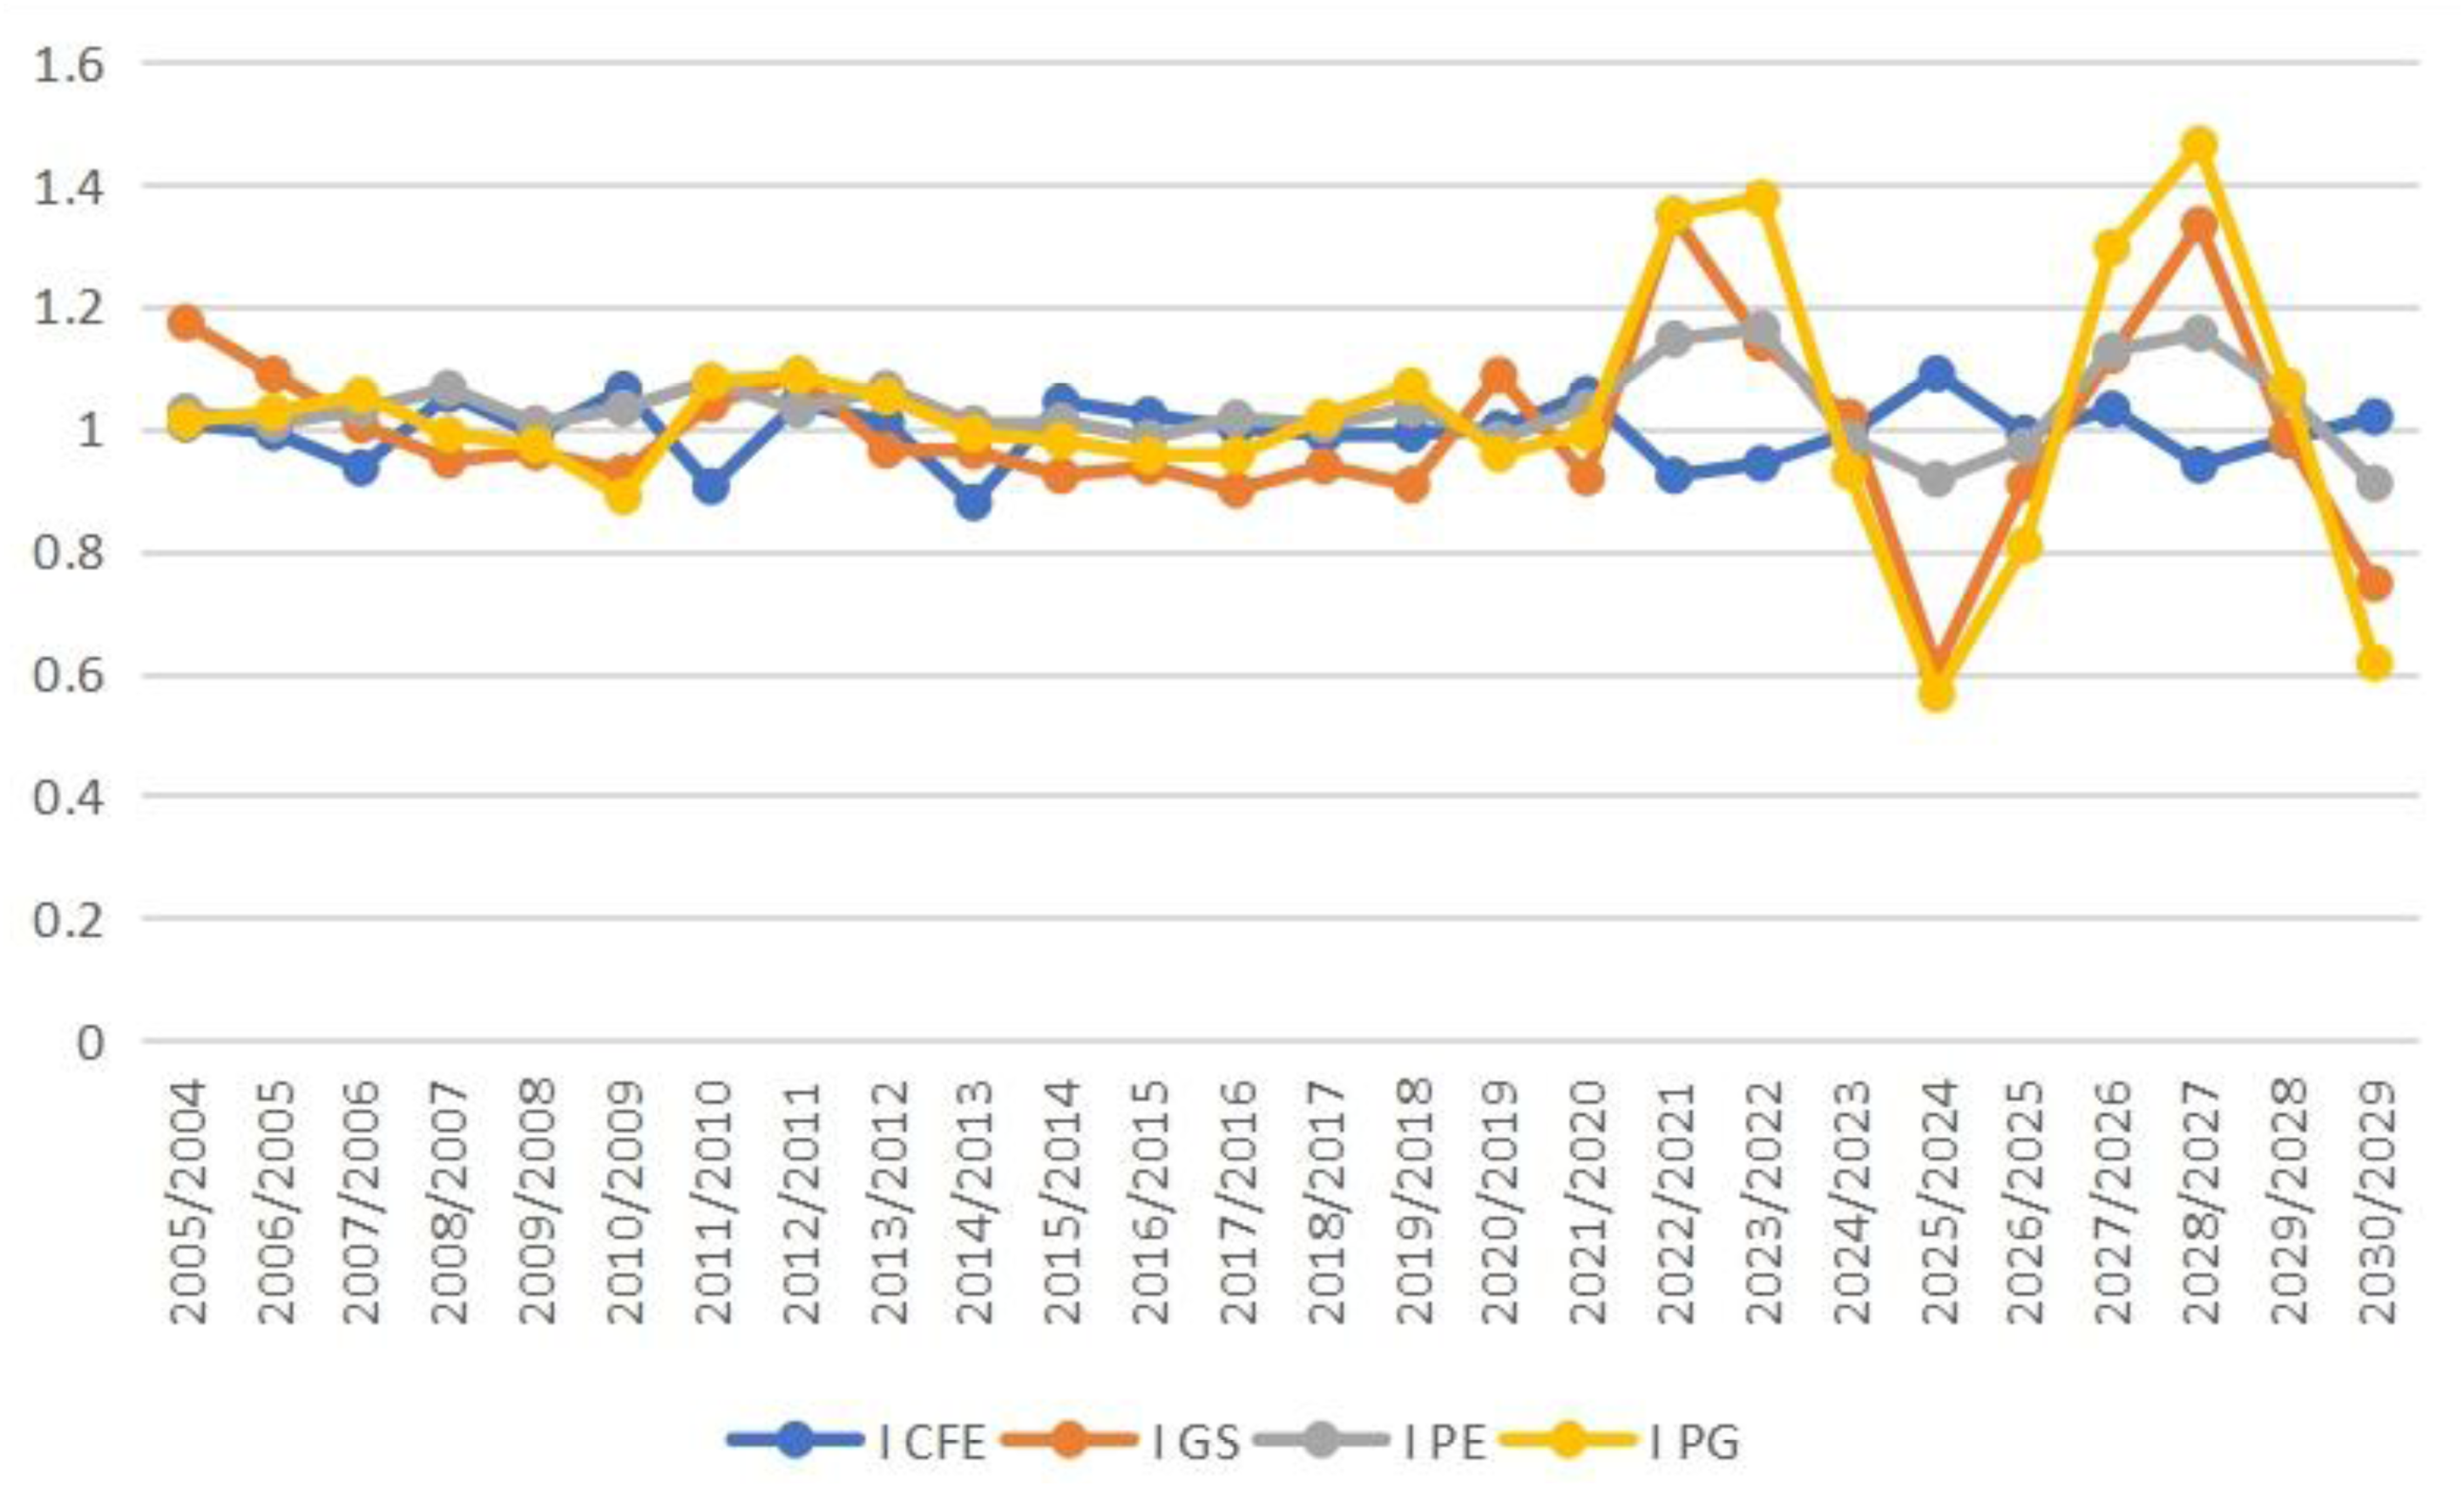
Evolution of the variables studied in the period 2004–2030. Source: Data processed by the authors.
The VAR model utilized in this study indicates that the future trajectory of the variables under consideration is of interest. Specifically, it is observed that if ICFE and IPE maintain their oscillatory patterns, IPG will exhibit a strongly oscillatory behavior, largely influenced by the shock induced by the armed conflict between the Russian Federation and Ukraine. The conflict, through the measures implemented by the Russian Federation to halt gas deliveries to Europe, has resulted in substantial increases in gas prices on the European market, with a 35% surge in 2022 and a 37% escalation in 2023, followed by a modest recovery in 2024. Concerning the evolution of the poverty level (IGS), it is observed that while the oscillations in the period 2004–2024 are moderately moderate, they are significantly influenced by the evolution of gas prices (IPG). This indicator (IGS) is predicted to exhibit an evolution in the forecast period that is analogous to that of the evolution of gas prices (IPG).
Discussion
The analysis carried out in the context of energy poverty contributes substantially to the understanding of trends in energy consumption, energy price dynamics, as well as the main socio-economic and political factors influencing the population's access to adequate energy resources. This approach allows the identification of vulnerable categories and the assessment of their degree of exposure to the risk of energy exclusion, while providing a relevant framework for the formulation of efficient and equitable public policies.
The analysis of the dynamics of final energy consumption in households highlights a relatively low annual variation. This apparent stability can be explained, from a dynamic perspective, mainly by the influence of annual temperature variations within the European Union, which determine seasonal energy consumption. However, beyond these climatic aspects, energy poverty continues to represent a significant structural problem (Simionescu, 2025; Śmiech et al., 2025). Economic fluctuations directly affect the capacity of households to maintain adequate energy consumption, which increases the vulnerability of certain social categories to economic shocks and financial instability.
Also, the dynamics of real GDP per capita generally reflects a sustained growth trend over time, specific to the economic development processes at the level of the European Union Member States. This upward trend is determined by structural factors such as productivity growth, public and private investments, as well as European economic integration. However, the positive trajectory of real GDP was temporarily disrupted by a series of external economic shocks with a global impact, such as the 2008 financial crisis, the COVID-19 pandemic or the energy crisis triggered by the conflict between Ukraine and the Russian Federation. These events had a significant negative effect on economic performance, directly affecting the population's income and, implicitly, the standard of living and access to energy resources (Barreiro-Pereira and Abdelkader-Benmesaud-Conde, 2025; Morina et al., 2022; Śmiech and Karpińska, 2025).
The positive evolution of the share of energy from renewable sources in gross final energy consumption can be explained mainly by the consolidation of the legislative framework at the European Union level, aimed at supporting the energy transition. The measures adopted, including the ambitious targets set by the “Fit for 55” and “Green Deal” packages, have generated financial incentives, favorable regulations and support mechanisms for investments in renewable energies, with an impact on the efficiency and sustainability of energy consumption by sector.
As for the population that is unable to maintain its home at an adequate temperature, this has registered, in the long term, a downward trend, highlighting progress in reducing energy poverty in several Member States of the EU. However, in recent years, a significant reversal of this trend has been observed, marking a sharp increase in the value of the indicator. This negative evolution can be mainly attributed to the sharp increase in energy prices, determined by geopolitical and economic factors, as well as generalized inflationary pressures. Thus, the capacity of vulnerable households to ensure a minimum level of thermal comfort has been seriously affected, highlighting the persistence and deepening of social inequalities in the context of the energy transition.
Electricity and natural gas prices have been strongly influenced by the global geopolitical context in recent years. In particular, Russia's invasion of Ukraine has generated a series of major disruptions in international energy markets, leading to heightened price volatility and significant increases, especially among industrial consumers. The EU's structural dependence on gas imports from the Russian Federation has amplified the impact of this conflict on energy security and on the costs borne by users. Both electricity and natural gas have experienced steep price increases, which have disproportionately affected vulnerable households and exacerbated the phenomenon of energy poverty in several Member States.
The VAR model used in this study highlights the fact that the future trajectories of the variables analyzed will show some more pronounced oscillations than in the previous period, especially with regard to the evolution of natural gas prices and the degree of energy poverty. The impulse response is the way in which an economy or an economic system reacts to exogenous or endogenous shocks such as financial crises or other disruptive events. In the context of the EU Member States, the impulse response highlights their vulnerability to potential economic shocks, in that the negative effects of these shocks can be transmitted quickly and intensely. At the same time, the analysis of the impulse response provides an interesting picture of how economic shocks can affect the economies of the EU Member States, demonstrating that vulnerability is not only an individual problem, but also a systemic one, requiring coordinated policies and common protection mechanisms.
Conclusions
From the study done by the authors and presented in this article, some theoretical, but also practical conclusions emerge. Thus, the first conclusion is that the analysis of the complexity of the phenomenon of energy poverty in the EU highlights the fact that this characteristic is determined by the interaction of various economic, social and geopolitical variables. Also, the evolution of the analyzed indicators reflects a varied and often unpredictable dynamic, which highlights both the progress, and the challenges encountered in this field. Another conclusion is that despite global economic shocks, such as the economic and financial crisis triggered in 2008 and the 2019 COVID-19 pandemic, real GDP per capita in the EU showed an upward trend, indicating a general improvement in the standard of living of the population. Even if there is an increase in the level of transport in European countries, energy poverty is a pressing reality that has generated intense concerns from public authorities. EU countries’ dependence on Russian energy resources and the outbreak of war have led to rising energy prices and increasing price volatility. This situation has made the population vulnerable, with the authorities having the task of reconfiguring the energy transition process and focusing on the social core—the consumer, employees, local communities, the population in general.
The EU has made notable progress in the transition to renewable energy sources. The creation of a favorable legislative framework and the adoption of innovative technological solutions have contributed to a substantial increase in the share of renewable energy in the final energy consumption, with a positive impact on energy sustainability, and the identification of new natural gas suppliers and the increase in the importance of liquefied natural gas have contributed to a reduction in dependence on conventional sources, especially from Russia. Of course, annual climate variations influence household energy consumption, contributing to the instability of the energy market. Although these effects are difficult to predict, they underscore the importance of developing new strategies to manage variable energy demand. The climate crisis also brings new challenges for energy transition and consumers, as large temperature variations, very cold winters and very hot summers apply the phenomenon of energy poverty.
Another conclusion that emerges from this study is that the increase in electricity and natural gas tariffs has a direct influence on the implications produced by this phenomenon, putting significant pressure on the budgets of families with low and medium incomes, thus increasing the degree of energy poverty, but it also accentuates social inequalities, disproportionately affecting disadvantaged communities. For these reasons energy poverty becomes an increasingly painful reality for the vulnerable population as gas and electricity prices rise, leaving them without affordable alternatives to keep their homes heated and lit, materializing in important influencing factors on energy poverty, forcing many households to reduce their energy consumption, an action that has negative effects on comfort and health. The economic impact of the increase in electricity and natural gas prices is felt most intensely among the low-income population, for whom the situation becomes a barrier to improving living conditions, with energy poverty spreading rapidly, threatening the stability and quality of life for many families. The fluctuations recorded throughout the analyzed period in electricity and natural gas prices radically influence the actions to combat energy poverty, requiring from this point of view urgent social protection measures and sustainable policies. Of course, the development of technological solutions is an important step toward the transition to sustainable energy sources, and collaboration between government, industry and non-governmental organizations can drive the development of the renewable energy sector. In addition, administrative measures can be considered. The countries of EU can enhance its competitiveness by completing the creation of the internal energy market, a complex process that began with the liberalization of national energy markets and must continue with the removal of trade barriers, the alignment of fiscal and pricing policies and the implementation of environmental and safety regulations.
Such integration would lower energy costs, improve energy security, and reduce CO2 emissions. Despite ongoing efforts to unify the market through the creation of the Energy Union, EU countries must respond to major challenges, namely energy dependency (the EU is the world's largest energy importer) and outdated energy infrastructure. The modernization of the energy infrastructure facilitates the increase in energy efficiency by adopting intelligent solutions, which reduce energy losses and optimize consumption, ensures energy security by being more resistant to breakdowns and cyber-attacks, also having an impact in terms of reducing carbon emissions by connecting to energy sources renewable energy, such as solar and wind energy, thereby reducing dependence on (polluting) fossil fuels.
At EU level, the efforts to improve the access of people to energy have materialized in creating and modernizing the legislative framework the main important elements being the revised Energy Efficiency Directive (EED), the Energy Performance of Buildings Directive (EPBD) and the Social Climate Fund (SCF). However, from an energy poverty perspective there are persistent implementation gaps: weak targeting, uneven national delivery capacity, and limit. Despite regulatory progress, a number of recurring shortcomings affect the effectiveness of the EU regulatory framework in tackling energy poverty. Difficulties in statistically defining energy poverty, combined with complex application procedures and co-financing requirements, lead to a regressive distribution of support, with homeowners with higher incomes and administrative capacity receiving priority access to energy efficiency and renovation subsidies, to the detriment of vulnerable groups.
A second set of gaps concerns governance capacity at national and sub-national level. Many countries have insufficient administrative resources, technical expertise and social policy integration to translate the requirements of the Energy Efficiency Directive (EED) and the Energy Performance of Buildings Directive (EPBD) into coherent strategies.
Despite the strengthening of the European regulatory framework, policies dedicated to energy poverty remain insufficiently articulated with housing, labor market and social protection reforms, which limits their ability to address the structural causes of the phenomenon. Poor integration with housing policy means that issues such as low-income levels, prohibitive rents and the low quality of the rental housing stock—especially in the private and informal housing segment—are treated piecemeal, through targeted interventions aimed at energy efficiency, without correcting the power imbalances between owners and tenants or the lack of adequate social housing supply. Similarly, the absence of substantial coordination with labor market policies and social benefit systems means that the economic vulnerabilities that generate and maintain energy poverty (job insecurity, insufficient wages, territorial inequalities of opportunity) are only marginally reflected in the design of energy measures. Thus, recently introduced regulatory instruments—from energy efficiency and renovation schemes to compensation funds—tend to alleviate the symptoms (high bills, reduced energy consumption) without profoundly altering the structure of income distribution, access to decent housing and the robustness of social safety nets, perpetuating a sectoral response to a problem with deeply intersectoral determinants.
This research presents a series of limitations mainly related to its aggregate approach at the level of all the Member States of the European Union, which tends to blur the deep heterogeneity of the energy poverty phenomenon between regions and families of countries. Comparative analysis at the level of the whole EU allows the identification of general patterns, but reduces the ability to capture the mechanisms specific to post-socialist contexts, in which the combination of low-income levels, low energy efficiency of buildings and high volatility of energy prices generates distinct configurations of energy vulnerability. Consequently, the results should be interpreted with caution when extrapolating to sub-regions with a particular socio-economic and institutional profile, such as Central and Eastern Europe.
On this basis, a priority direction for future research is to deepen the analysis of the energy poverty phenomenon in the countries of Central and Eastern Europe, which consistently rank first in European statistics regarding the inability of households to keep their homes adequately heated or cooled. In these countries, energy vulnerability is amplified by the characteristics of the housing stock built during the communist era, when energy was available at low prices and energy performance requirements were minimal or non-existent. The apartment blocks built during this period now concentrate a significant volume of low-income households, simultaneously faced with high energy losses, outdated technical infrastructure and limited capacity to co-finance deep renovation works. In addition, the sharp volatility of energy prices, combined with social protection systems often weaker than in Western Europe, amplify the risk of arrears accumulation and disconnection from utilities.
In this context, the authors propose, as a direction for future research, the systematic investigation of the impact of Just Transition mechanisms on the alleviation of energy poverty in these countries. The analysis will track the extent to which the financial and policy instruments associated with the Just Transition—including the Just Transition Fund, funds dedicated to the decarbonization of carbon-intensive regions and professional retraining measures—manage to reduce the structural vulnerabilities of households, support the renovation of the inefficient built stock and prevent the emergence of “transition losers.” Particular attention will be paid to the interaction between these mechanisms and national housing, social protection and regional development policies, to assess whether and how the Just Transition effectively contributes to a sustainable and equitable reduction of energy poverty in Central and Eastern Europe.
Footnotes
Funding
The authors disclosed receipt of the following financial support for the research, authorship, and/or publication of this article: This research was supported by grant from the Petroleum-Gas University of Ploiești, Romania, project number GO-GICS-30707/10.12.2024, within the Internal Grants for Scientific Research.
Declaration of conflicting interests
The authors declared no potential conflicts of interest with respect to the research, authorship, and/or publication of this article.
Data availability statement
The authors used public data.