
Abstract
This work presents a comprehensive framework for enhancing the resilience of smart power distribution systems vulnerable to natural disasters, ensuring physical service continuity and cybersecurity protection. By creating supporting microgrid clusters and facilitating secure and market-controlled energy trading between them, the distribution network is dynamically reconfigured. Distributed renewable generation resources, including on-site wind generators, rooftop solar systems, battery storage units, and electric vehicles with bidirectional charging, are planned using a nature-inspired Hunter‒Prey optimization algorithm that protects cyber-physical operations from malicious data disruptions. The three operating scenarios modeled are a fault-tolerant system without microgrids, isolated microgrids during faults, and interconnected microgrids with adaptive tie-line transmission. In order to ensure optimal system performance during disruptions, a cyber-integrated multi-objective function is also developed to maximize the cyber-resilient resilience index while minimising cyber-operation cost and outage-related financial losses. The proposed approach reduces the total energy not delivered by more than 60% and increases the resilience index from 0 to 46.99 during critical disturbances, as evaluated on two representative networks: a realistic 28-bus feeder from India and a standard IEEE 34-bus benchmark. By achieving a maximum of US$50.65 per hour, the secure trading system also increases the economic benefit to the consumer. According to comparative studies, the developed method provides 30–45% faster convergence and 7–15% higher optimization accuracy than particle swarm, genetic, and gray-wolf-based optimization techniques. Overall, the findings show that intelligent energy sharing, cyber-aware control, and integrated network reconstruction all work together to improve long-term operational stability, reduce the severity of disturbances, and enhance disaster recovery in future smart distribution networks.
Keywords
Introduction
Motivation of the research
Smart distribution networks (SDNs) are at the vanguard of the present transformation within the power system. They make it easy to connect renewable energy sources, efficiently distribute power, and control in real time. Extreme events-such as hurricanes, floods, and wildfires-occur more frequently and with greater strength, putting at risk the stability of SDNs. These events create a multitude of problems, damage infrastructure, and cost the economy billions of dollars annually, with estimated financial burdens ranging from $25 billion to $75 billion each year in the USA alone (Wang et al., 2016). Traditional reliability measures aimed at ensuring continuity of operations usually neglect dynamic network reconfiguration, adaptive reconfiguration, and rapid recovery. This is especially the case for low-probability, high-impact events. Hence, making systems resilient—capable of withstanding, adapting to, and bouncing back from bad situations—has become a key concern for next-generation power distribution networks. The increasing dependence of the cyber communication layer on the physical electrical infrastructure makes SDNs even less resilient (Hughes, 2015). Indeed, the merging of the digital and physical world made automation, control accuracy, and visibility better but at the same time created new vulnerabilities. Examples of disruptions that can spread along the system, fault control signals, and eventually cause layer failures are communication latency, denial-of-service attacks, and malicious data injection. As would be expected from Yang et al. (2022), even a small-scale cyber failure might have significant repercussions in the physical world. This means that SDNs need resiliency construction not only in terms of physical reinforcement but also by bringing cyber awareness, reliable communication, and decisional capabilities.
Among physical resilience strategies, microgrids (MGs) have emerged as crucial components that enhance flexibility and survivability in SDNs. Integrating Distributed Energy Resources (DERs) such as photovoltaic (PV) panels, wind turbines (WTs), battery energy storage systems (BESSs), and battery electric vehicles (BEVs), MGs localize generation and autonomous operation during grid disturbances (Thirumalai et al., 2024). However, isolated MGs commonly develop energy imbalance and prolonged supply–demand mismatch issues during an extended outage. Inter-microgrid tie-lines enable energy exchange and cooperative restoration between MGs and are found to significantly improve recovery speed and resource utilization (Yuvaraj et al., 2023). However, the ultimate strategy for tie-line placement, energy trading, and coordination under disrupted communication remains underexplored, especially in a cyber-compromised environment.
Energy management systems and optimization-based decision frameworks have equally contributed to increasing operational efficiency and resilience together with the structural improvements. Heuristics metaheuristic algorithms and mathematical programming approaches are widely used to enhance fault recovery, network reconstruction, and resource planning (Gholami et al., 2016; Osman et al., 2023). Though effective, most of these approaches rely on centralized architecture and make the implicit assumption of data availability, hardly verified in real-world situations. Limited scalability and vulnerability to cyber-attacks or data latency further prevent their applicability in large-scale SDNs. To this respect, there is a growing need for distributed, communication-aware optimizations that perform effectively under uncertainty, imperfect monitoring, and delayed information transmission. Due to the increase in peer-to-peer (P2P) exchange mechanisms and prosumer-driven energy trading, a new level of operational resilience and economic adaptation has been added at the same time. Decentralized commerce promotes local self-sufficiency and market flexibility by enabling consumers to trade surplus energy and act as producers (Galvan et al., 2020). Similarly, blockchains and AI-based solutions have been adopted to ensure transparency in transactions, automatically implement market solutions, and support local decision-making processes (Yin et al., 2020). Blockchain-enabled P2P trading improved energy fairness (Singh et al., 2025a), while price-elastic and hybrid demand-side models enhanced economic and environmental performance (Singh et al., 2025b, 2025c). Blockchain frameworks strengthened secure interoperability (Singh et al., 2025d), and deep learning–IoT systems improved adaptive grid control (Singh et al., 2025e). AI-driven predictive maintenance further enhanced reliability and cybersecurity (Ashraf et al., 2025). Nevertheless, most of these frameworks implicitly assume secure and stable communications, while neglecting those factors that considerably impact trust and real-time integration, such as data manipulation, latency, or cyber intrusion. Hence, these systems will remain operationally vulnerable in cyber-physical environments, despite the increased economic efficiency.
Despite these advances, the existing resilience strategies are still fragmented and tend to treat cyber security, energy trade, and physical fortification independently rather than as interrelated parts of one system. Genuine resilience in SDNs can be achieved only with an integrated approach to modeling the physical, cyber, and economic dimensions collaboratively along with capturing their interdependencies within nondeterministic and dynamic environments. Furthermore, measurable metrics in most existing frameworks also remain missing in order to capture communication integrity, cyber-physical reliability, and adaptive recovery behavior. There is, therefore, a need to fill this gap by framing an integrated, cyber-resilience-optimized architecture to provide for reliable energy delivery, secure inter-microgrid integration, and independent operation amidst cyber and physical threats. Inspired by these difficulties, this study proposes an architecture for a cyber-resilient SDN that integrates communication-aware optimization, secure inter-microgrid trading (IMT), and distributed resource integration. The framework employs Hunter–Prey Optimization Algorithm (HPOA) to offer fast, reliable, and flexible decision-making across both the physical and cyber domains. The operational resilience and cyber resilience have been enhanced through explicit modeling of communication latency, attack severity, and control reliability. This research seeks to bridge the gap in energy resilience, cyber security, and economic efficiency for building self-healing, intelligent, and future-ready SDNs.
Literature review
The following literature review comprehensively explores the advances in SDN resiliency enhancement through the integration of distributed resources, P2P trading, cyber-physical optimization, and integrated energy management. The main areas of research are network infrastructure reinforcement, DER integration, decentralized energy trading, and intelligent control integration for adaptive operation. This review is organized into three thematic sections for clarity: (a) resiliency enhancement using DER integration emphasizing network hardening, microgrid formation, and renewable integration; (b) resiliency enhancement through decentralized, P2P energy trading integration emphasizing consumer participation, secure trading, and decentralized optimization; (c) cyber-enabled resiliency control and optimization, addressing cyber-secure control, IoT-based management, and communication-aware operation.
The proposed cyber-resistant SDN architecture, which integrates physical strength, cybersecurity, and economic efficiency, is based on these themes, collectively monitoring the evolution of SDN resilience from traditional physical reinforcement to intelligent and cyber-physical integration.
Resilience enhancement using DERs coordination
In the past 10 years, improving SDN resiliency has been an important area of research, especially in relation to DERs, MG integration, and optimization-based network hardening. Although these strategies greatly strengthen the physical infrastructure, most research is still limited by the lack of essential features for reliable and flexible SDN operation, such as cyber-physical integration, dynamic integration, and communication-aware optimization. The evolution of resilience planning from traditional physical reinforcement to intelligent and cyber-aware integration is described in the following discussion, emphasizing the strengths and weaknesses of each study. A two-level robust optimization model that simultaneously optimizes distributed generation (DG) allocation and network stiffness under disaster uncertainty, resilient distribution network planning (RDNP) (Yuan et al., 2016) was introduced in early work. Despite its effectiveness in reducing failure exposure, the model's centralized control and assumption of proper communication-defined response during real-time failures was problematic. Similarly, mixed-integer linear programming was used in a resilience-oriented design (ROD) framework (Shahbazi et al., 2021a) to minimize investment and retrofit costs under extreme weather conditions. However, it is not as useful for dynamic and data-driven systems as it does not take into account cyber disruptions and communication delays.
Considering interlinked spatial-climatic disaster probabilities, DG siting and tie-line strengthening increased resilience in a hybrid stochastic-robust optimization model (Shahbazi et al., 2021b). However, it neglected data transmission reliability and cyber security measures, leaving control channels open to interception. Similarly, a two-stage optimization strategy for pre- and poststorm network restoration (Khomami et al., 2019) successfully reduced outage costs, but neglected secure data sharing and inter-MG coordination essential for distributed recovery. Research on hurricane-related disturbances at the MG level has assessed the impact of distributed resources, energy storage, and power supply resilience of network architecture (Krishnamurthy and Kwasinski, 2016). Although these studies developed basic quantitative resilience measures, their applicability in situations with incomplete information was limited because they relied on centralized coordination and complete data communication. Similarly, multi-level expansion-planning models (Nasri et al., 2022) combined vulnerability assessment and distributed automation to balance prevention and remediation strategies. These models do make infrastructure more resilient, but they do not take into account the trade-offs between economics and cyber security. They only focus on physical reinforcement and do not take into account the costs of communication reliability and cyber overhead.
Virtual power plant (VPP) scheduling frameworks (Dehghan et al., 2023) used hybrid metaheuristics to optimize DER aggregation and capacity, resulting in further increased resilience. This resulted in cost-effective configurations under random weather variations. However, two key factors that drive decentralized integration—prosumer participation and real-time data reliability—were omitted. Random-robust optimization was further incorporated into storage-integrated VPP models (Piltan et al., 2022) to integrate battery and renewable systems during earthquakes and floods. While these techniques were successful in controlling variability, they ignored the risks of cyber-intrusion and authentication delays that could disrupt control synchronization in the event of a disaster. To improve system recovery after layer failures, network-topology-based recovery techniques (Meng and Zhang, 2023) used complex-network theory to accurately locate critical nodes and links. However, they consistently ignored information-network recovery and cyber-control dependencies in favor of a purely structural focus. Similarly, studies integrating electric vehicle charging stations (EVCSs), distribution stable VAR compensators (DSVCs), and renewable distributed generations (RDGs) (Babu et al., 2025) showed improved adaptability and loss reduction in challenging situations. However, they neglected to address data handling or latency issues, and neglected bidirectional data flow management, which is critical for secure G2V/V2G operations.
Recent advances in artificial intelligence (AI), particularly deep reinforcement learning (DRL) (Dehghani et al., 2021), have modeled resilience as a continuous decision-making problem, enabling learning-based feedback to implement adaptive hardening strategies. Despite their flexibility, these architectures rely on continuous and reliable communication feedback, which can break in the event of a catastrophic network collapse. This approach is developed through two-stage stochastic resilience-planning models (Ghasemi et al., 2021) that include mobile-generator deployment, die-switch optimization, and DG sitting. Their reliance on a centralized computer and full system monitoring made them susceptible to single-point failures, although they were able to achieve a technical and economic equilibrium. Although DER scheduling and network reconstruction-based outage management algorithms (Shi et al., 2021) effectively restored service after a fault, they lacked the ability to make synchronized multi-MG decisions when data transmission was restricted. Similarly, pre- and postdisaster resource allocation models (Hou et al., 2023) effectively reduced the outage duration by prepositioning assets and dispatching teams, but they neglected the simultaneous recovery of power and communication layers, which limited the overall efficiency of system restoration. Recent research on VPP integration in networked MGs has used the Jellyfish Search Algorithm (JSA) to improve system autonomy, energy reliability, and emission reduction in harsh environments (Kanchana et al., 2025). However, it made unrealistic assumptions about distributed, data-rich SDNs, such as perfect communication networks and low cybersecurity risks.
Resilience enhancement through decentralized and energy trading coordination
Recent breakthroughs in P2P and decentralized energy trading have transformed the conventional energy management paradigm by allowing independent consumer decision-making and enhancing operational flexibility for SDNs. Indirectly, the amalgamation of network resilience, blockchain technology, market mechanisms, and AI-based integration enhanced regional economic efficiency and optimization. However, most of the frameworks proposed so far have focused on the efficiency of the market mechanism while avoiding discussion of communication dependencies, cyber-physical interdependencies, and quantitative resilience assessment under unforeseeable conditions. This section will focus on major breakthroughs, their technical deficits, and how the proposed framework tries to overcome those shortcomings.
To improve grid operation in a decentralized P2P market model, privacy-preserving integration through distributed agents and reverse-direction optimization was carried out (Sampath et al., 2021). Despite achieving autonomous and equitable energy sharing, the lack of cyber-failure modeling and the assumption of complete communication limited real-time resilience. A two-stage optimization framework combining hybrid IGWO–PSO algorithms reduced energy nondistribution and improved VPP scheduling (Yuvaraj et al., 2025a). However, it ignored IMT, latency, and cybersecurity, which limited its flexibility in the face of communication uncertainty. Smart contracts and machine learning prediction improved data integrity in blockchain-based predictive trading systems (Jamil et al., 2021). However, they did not take into account attack recovery or dynamic control reliability, so their resilience was mainly defensive. Fuzzy Q-learning and reinforcement learning were used for demand-side optimization in AI-enabled community energy management systems (Mahmoud and Slama, 2023), which effectively balanced consumption and renewable energy. However, they did not model network decay, but instead relied on flawless synchronization. Similarly, a Lyapunov-based P2P algorithm that combined dual bidding algorithms (Zhu et al., 2022) allowed for decentralized bidding, but was subject to cyber disruptions or delays because it relied on immediate feedback. Smart energy-management frameworks using HPOA (Yuvaraj et al., 2025b) have made further progress by improving renewable planning and financial returns in the face of uncertainty.
However, it lacks cyber-layer awareness and inter-microgrid communication resilience. To handle high-impact events, blockchain-secure integration was introduced through a resilient trading model based on fuzzy logic and Markov networks (Arora et al., 2025), which ensured transparency and fairness. However, it neglected adaptive control mechanisms that responded to communication breakdowns. The resilience derived from inter-microgrid energy sharing was quantified using cooperative game theory and penetration-based analyses (Babu et al., 2024), which demonstrated operational and financial benefits. However, these models did not consider cyber-dependency and the propagation of communication failures among MGs. Blockchain-enabled social trading systems provided decentralized resource management and transparent transactions (Petri et al., 2020), but they ignored the risks of data manipulation and communication load and assumed zero-delay data transmission. A data-driven resilience-assessment model that combined DERs with P2P trading used penetration thresholds to measure resilience (Dwivedi et al., 2024). However, real-time recovery modeling and dynamic cyber-threat assessment were lacking. Assessing residential-sector trading capacity through tariff and market analysis (Neves et al., 2020) showed economic viability; however, system-stability and cyber-resistance considerations during market fluctuations were not included. Using Stackelberg competition models, game-theoretic trading in virtual MGs (Anoh et al., 2019) reduced costs and emissions while ignoring data privacy and communication vulnerabilities. Finally, a blockchain-integrated dual-auction platform (Umar et al., 2025) improved computational efficiency and pricing fairness, but it used a fixed control configuration and lacked integrated models for postattack recovery, latency, and packet loss.
Cyber–physical enabled resilient control and optimization in smart distribution systems
Recent advances in IoT-enabled distributed control and cyber‒physical system (CPS) integration have completely transformed the functionality and resilience of SDNs. In modern SDNs, the cyber communication layer and the physical power infrastructure are interconnected. As these networks move towards autonomous and decentralized operation, maintaining cyber-resilience, or the ability to tolerate, adapt, and recover from cyber disruptions, has emerged as a critical research priority. While previous research has shown great progress in developing intelligent, data-driven control and optimization models, most of these studies still make assumptions that rarely hold true in real CPS environments, such as perfect synchronization, excellent communication, and stable system states. While pointing out the current research gaps that are filled by the proposed cyber-resilient SDN framework, the following review highlights significant advances in collaborative learning, IoT-based optimization, and cyber-resilient control.
A collaborative learning framework for decentralized P2P energy markets (Nguyen, 2021) introduced an inverse optimization technique so that customers can quickly learn and adapt their trading preferences. This study used weighted mean continuity reduction (WMSR) consensus algorithms to improve resilience to Byzantine faults and malicious cyberattacks. It was successful in promoting decentralized discussions and identifying degraded nodes, but its ability to assess system-wide resilience to persistent communication failures was limited by the lack of multi-layer communication reliability modeling and quantitative recovery assessment. A three-level cyber-resilient energy management system combined long short-term memory (LSTM)-based reproducible forecasting and deep learning forecasting with blockchain-enabled trading and a secure trading infrastructure. This further improved CPS resilience (Pati and Mistry, 2023). With the help of smart contracts, this model managed to successfully reduce predictive uncertainty and thereby ensure data integrity. However, its defenses could not recover or reconfigure from attacks, being merely defensive rather than adaptive.
In one study, Andriopoulos et al. (2024) explored the potential of IoT-enabled LEMs for decentralized integration among DERs, EVs, and smart meters. The study presented an improved flexibility and cost optimization by utilizing DLMP; however, it presented vulnerabilities to FDI attacks. Further, it also neglected dynamic cyber recovery mechanisms in favor of voltage and congestion management. On IoT-based BESS research, Rafy et al. (2025), through a real-time co-simulation platform, Typhoon HIL–OpenDSS–MiniNet, introduced a comprehensive cyber-physical resilience assessment model. The model showed uncompromised control signals affecting performance. It had successfully measured resilience against cyber attacks but at the cost of being device-centric with a lack of network-level integration among interconnected MGs. Similarly, in Panahazari et al. (2025), probabilistic traffic models along with gradient-based optimization were used to estimate packet delays and losses due to DER dispatch and voltage regulation using cyber-resilient DER control algorithms. To enable control over asynchronous communication, the authors have developed message-update rules and delay limits that were able to show increased resilience. However, it did not take into consideration attack severity, security overhead, and adaptive cost trade-offs under low-power scenarios.
A decentralized resilient control strategy for multiple ESSs using adaptive feedback mechanisms enhances the stability of a MG (Deng et al., 2020). The developed model, through Lyapunov-based stability analysis, shows resilience toward local faults and communication uncertainties. However, this design only considers MGs coordination issues and develops a controller while ignoring the propagation due to inter-MG resistance and tie-line communication. Finally, Zhou et al. (2020) studied the effects of compromised controllers and communication links on island MGs using a decentralized control mechanism that is resistant to cyber attacks. The study proposed isolation and detection methods that can identify time-varying attack signals and damaged nodes. While this works well for security, it is based on the assumption that the network topology is static and lacks tools for adaptive topology management and real-time reconfiguration in the face of changing attack scenarios. By combining event-based reconfiguration control and dynamic topology adjustment via its HPOA, the proposed architecture overcomes this limitation and ensures resilience in the face of continuous or coordinated cyber events.
Synthesis of literature findings
The collaborative research team reviewed in Resilience enhancement using DERs coordination; Resilience enhancement through decentralized and energy trading coordination; and Cyber–physical enabled resilient control and optimization in smart distribution systems sections demonstrates that SDN resilience strategies have clearly evolved from traditional infrastructure hardening and distributed resource integration to decentralized energy trading and sophisticated cyber-physical control integration. To reduce physical damage during natural disasters, early resilience studies mainly focused on physical stiffening, stressed supply chain stiffening, DG location and tie-line strengthening. Although they assumed perfect system observability and ignored cyber uncertainties, data latency, and control reliability, these frameworks laid the foundation for measuring resilience. They are deterministic and communication-agnostic.
✓ Next-generation research moved toward optimization-driven microgrid integration and VPP architectures, which enabled adaptive operation, distributed energy sharing, and increased recovery flexibility. The techno-economic performance is improved by methods such as hybrid stochastic-robust optimization, jellyfish search, and metaheuristic-based integration. However, these models were still limited by fixed resiliency indices and centralized computational dependencies, which prevented them from capturing adaptive recovery mechanisms in the event of communication disruptions or real-time cyber-physical dynamics. ✓ Contemporary developments in P2P and decentralized trading systems have reinforced local flexibility, energy diversity, and autonomy through the introduction of customer participation and market-based coordination. Integration of AI, game theory, and blockchain enabled secure and transparent trading among dispersed agents. However, most of these models assume perfect communication channels and barely considered the impact of potential cyberattacks, synchronization delays, and packet loss on trading fairness and market stability. As a result, economic resilience has increased, while the operational resilience of cyber-based systems is continuously evolving. ✓ On the contrary, the recent advancements in Internet-of-Things and CPS s-enabled distributed control architectures are significant strides toward integrated resilience. For improving control robustness, fault detection, and system recovery, blockchain-secure scheduling, collaborative learning, and IoT-based real-time coordination have been adopted in these works. Despite these, there are still some unresolved research gaps:
Inadequate integration of physical and cyber recovery mechanisms within an optimization framework; Inadequate quantification of dynamic resilience under compromised communications and cyberattacks; The cost of cyber operation such as rerouting, encryption, and authentication overheads was not considered in resilience optimization formulation.
A total of 35 key references in the three subject areas are comparatively reviewed in detail in Table 1. This table summarizes the research focus, methodological approaches, experimental setups, performance metrics, and significant contributions and their limitations in the physical, financial, and cyber resilience levels. It points out how SDN research has gradually moved from deterministic, single-layer optimization to distributed, hybrid, and data-driven CPSs. Such a clear identification of a list of unresolved gaps, including the lack of communication reliability modeling, the lack of inter-microgrid cooperation under partial connectivity, and the avoidance of dynamic resilience measurement, further motivates the proposed cyber-resilient SDN framework in this study. In general, the literature highlights that although SDN has made significant strides forward regarding flexibility, adaptability, and cost-effectiveness, resilience improvements in physical, cyber, and economic dimensions are still fragmented. This integration underlines the need for an integrated cyber-physical-economic architecture that simultaneously enhances control security, communication reliability, and energy resiliency. Resilient SDNs have gone through an evolution from isolated physical security schemes to intelligent, adaptive, cyber-aware smart distributed infrastructures capable of maintaining reliable operations against physical disruptions and cyber-emergencies. The integration constitutes the next generation in such evolution.
Comprehensive synthesis of state-of-the-art resilience enhancement approaches in smart distribution networks.
Research gap
There are still a number of research gaps in the current frameworks for cyber-physical SDNs, despite tremendous advancements in resilience-oriented distribution network planning.
✓ First, the majority of current research ignores the cyber domain in favor of physical resilience enhancement techniques like DG siting, tie-line reinforcement, and MG structuring. Resilience optimization models rarely take into account important elements like malicious data manipulation, packet delays, and data loss. While storage integration and VPPs increase flexibility, they still rely on perfect communication reliability in the event of severe disruptions. ✓ Second, although decentralized P2P and community trading systems have improved local energy sharing and market participation, they frequently function under the presumption of completely interconnected communication networks. While new blockchain-based techniques increase transparency, they still ignore coordinated cyber-physical recovery across interconnected MGs, while older pricing and auction mechanisms are not protected against synchronization failures or data manipulation. ✓ Third, methods for evaluating resilience are still static and only concentrate on the restoration of physical services. Cyber-aware performance metrics like secure trading continuity, communication robustness, cost impact of control failures, and dynamic recovery governance are absent from widely used indices. ✓ Lastly, while intrusion detection and device-level hardening are taken into account in recent cyber-resilient control architectures, they are still fragmented and do not optimize the energy, communication, and economic layers at the same time. In order to close these gaps, the current study presents a unified framework for cyber-physical-economic resilience that uses coordinated DER optimization, secure IMT-based trading, and communication-aware control with HPOA to guarantee the adaptive, secure, and self-healing operation of SDNs.
Research contributions
This paper presents a cyber–physical resilience framework for SDNs that incorporates technological developments in resilience modelling, IMT, optimization, and prosumer participation in order to address the identified research gaps. The following is a summary of this study's main contributions:
✓ Cyber-physical SDN modelling: In order to overcome the impractical assumption of flawless communication in traditional SDN models, a comprehensive resilience framework is created that specifically takes into account communication latency, packet loss, cyber-attack severity, and control reliability. It is verified using both the IEEE 34-bus SDN benchmark and a real-world Indian 28-bus system. ✓ IMT for coordinated recovery: A topology-adaptive IMT mechanism is established using optimally placed tie-lines to mitigate supply–demand imbalances and support energy sharing during and after contingencies under both physical and cyber disturbances. ✓ Multi-resource integration for adaptive operation: Twelve mixed distributed resources—including photovoltaic systems, wind turbines, battery electric vehicles, and battery energy storage systems—are coordinated under a cyber-aware control strategy to enhance flexibility across interconnected MGs. ✓ High-performance optimization using HPOA: The HPOA is deployed to optimize MG formation, tie-line allocation, and DER scheduling with faster convergence, improved exploration–exploitation balance, and reliable performance under delayed and uncertain communication. ✓ Cyber-aware resilience quantification: A modified resilience index, RIcyber, is introduced that incorporates communication reliability, cyber intrusion impact, and security overhead into resilience assessment for realistic postdisaster scenarios. ✓ Cyber-economic performance reinforcement: Extended economic indicators—including loss of utility revenue, outage cost, and avoided outage cost—enable accurate evaluation of the financial benefits gained from secure IMT-based recovery strategies. ✓ Unified cyber-physical-economic optimization: A single multi-objective framework is formulated that jointly maximizes resilience, strengthens cyber security, and minimizes operational costs—ensuring self-healing and efficient grid recovery in dynamic threat environments.
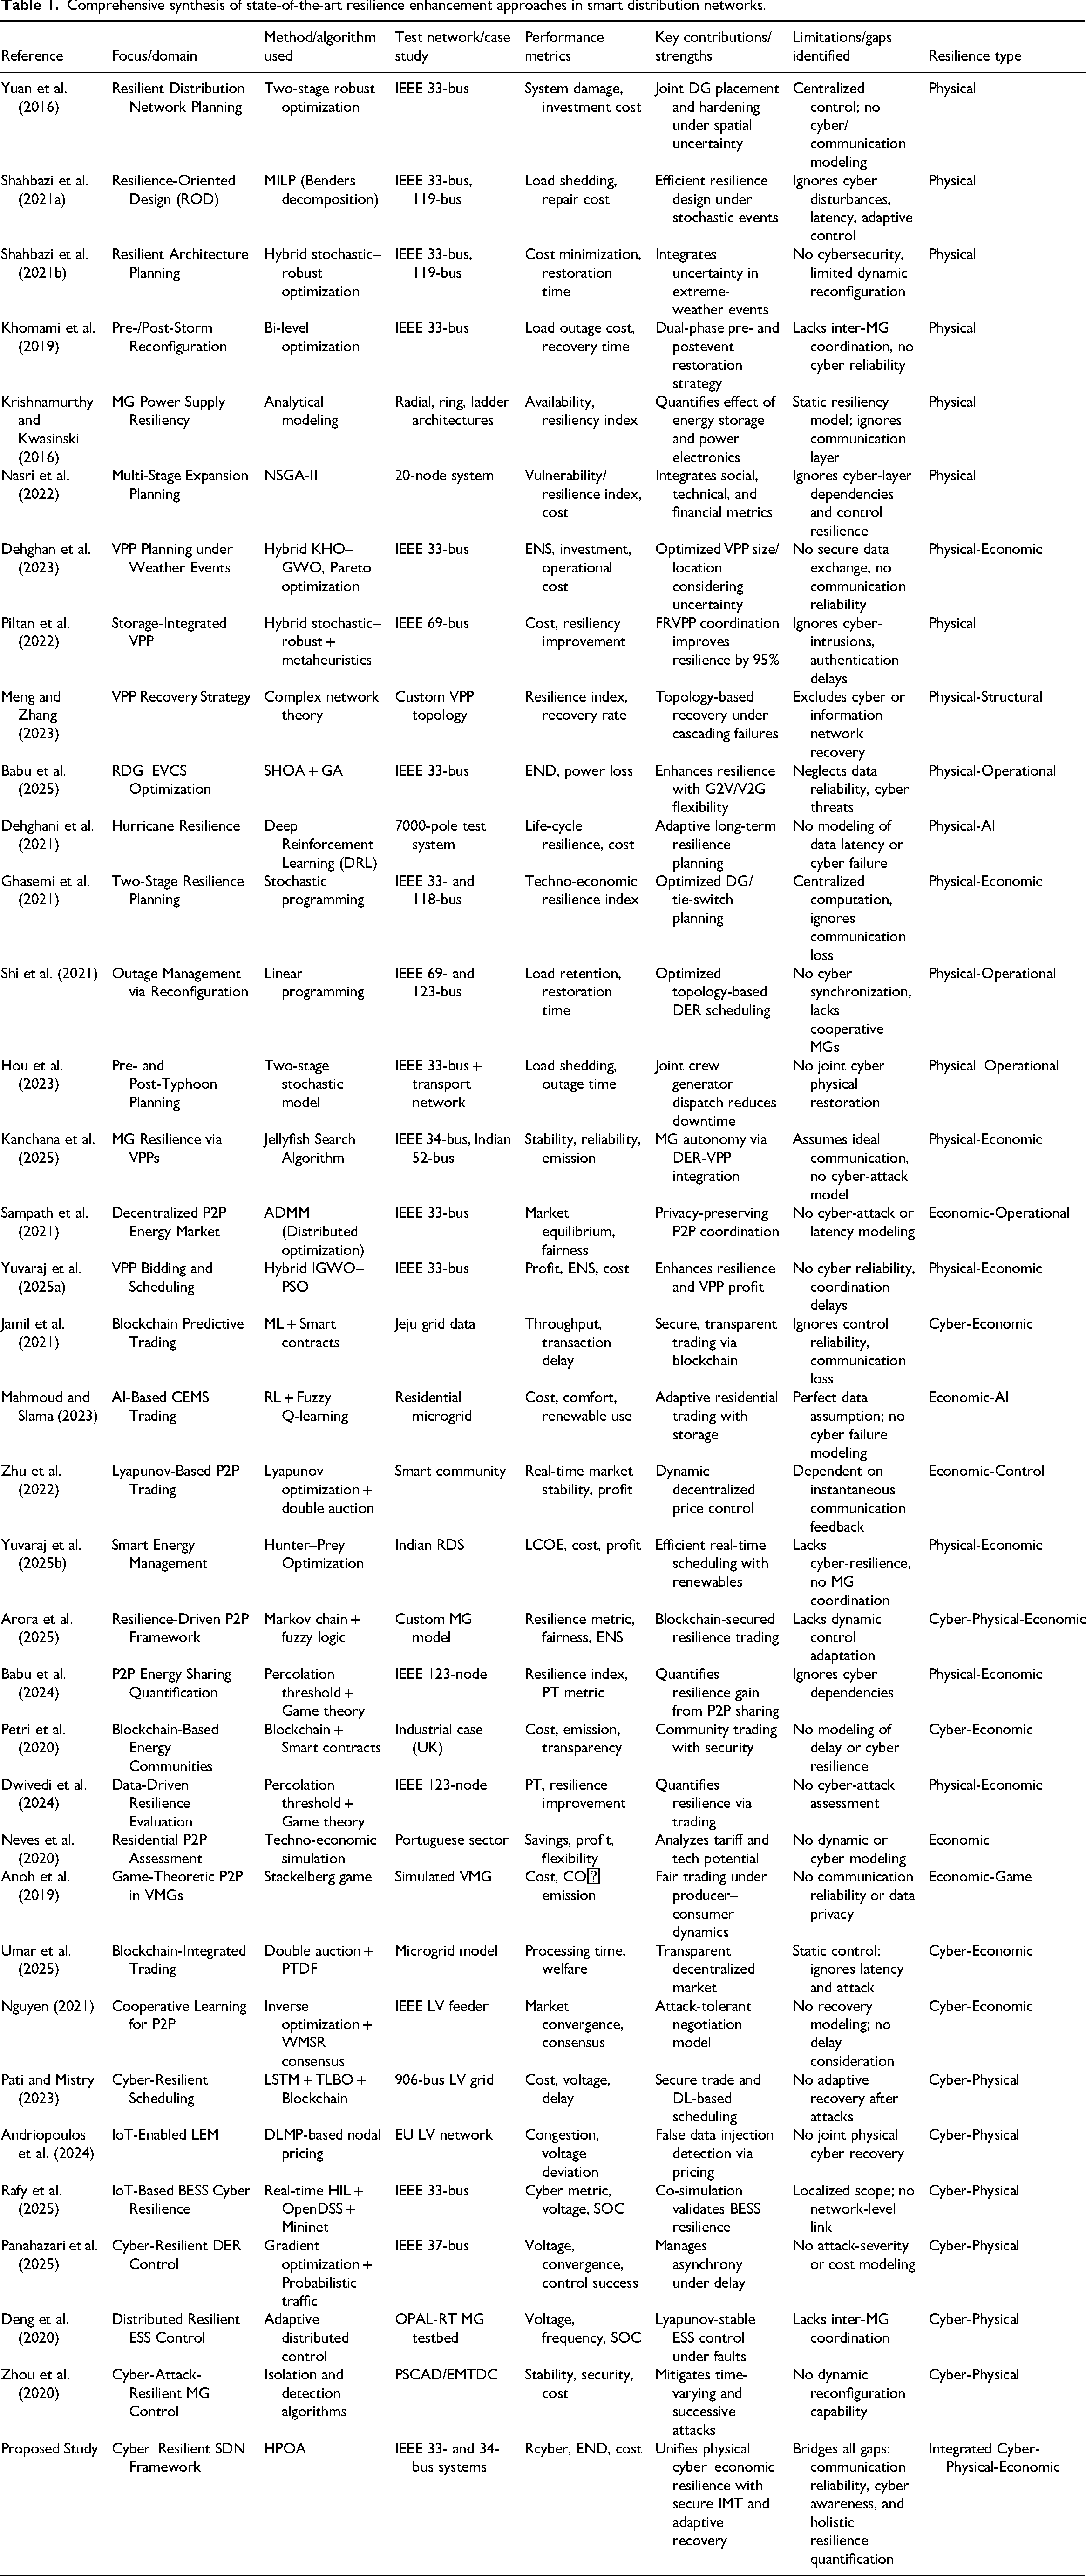
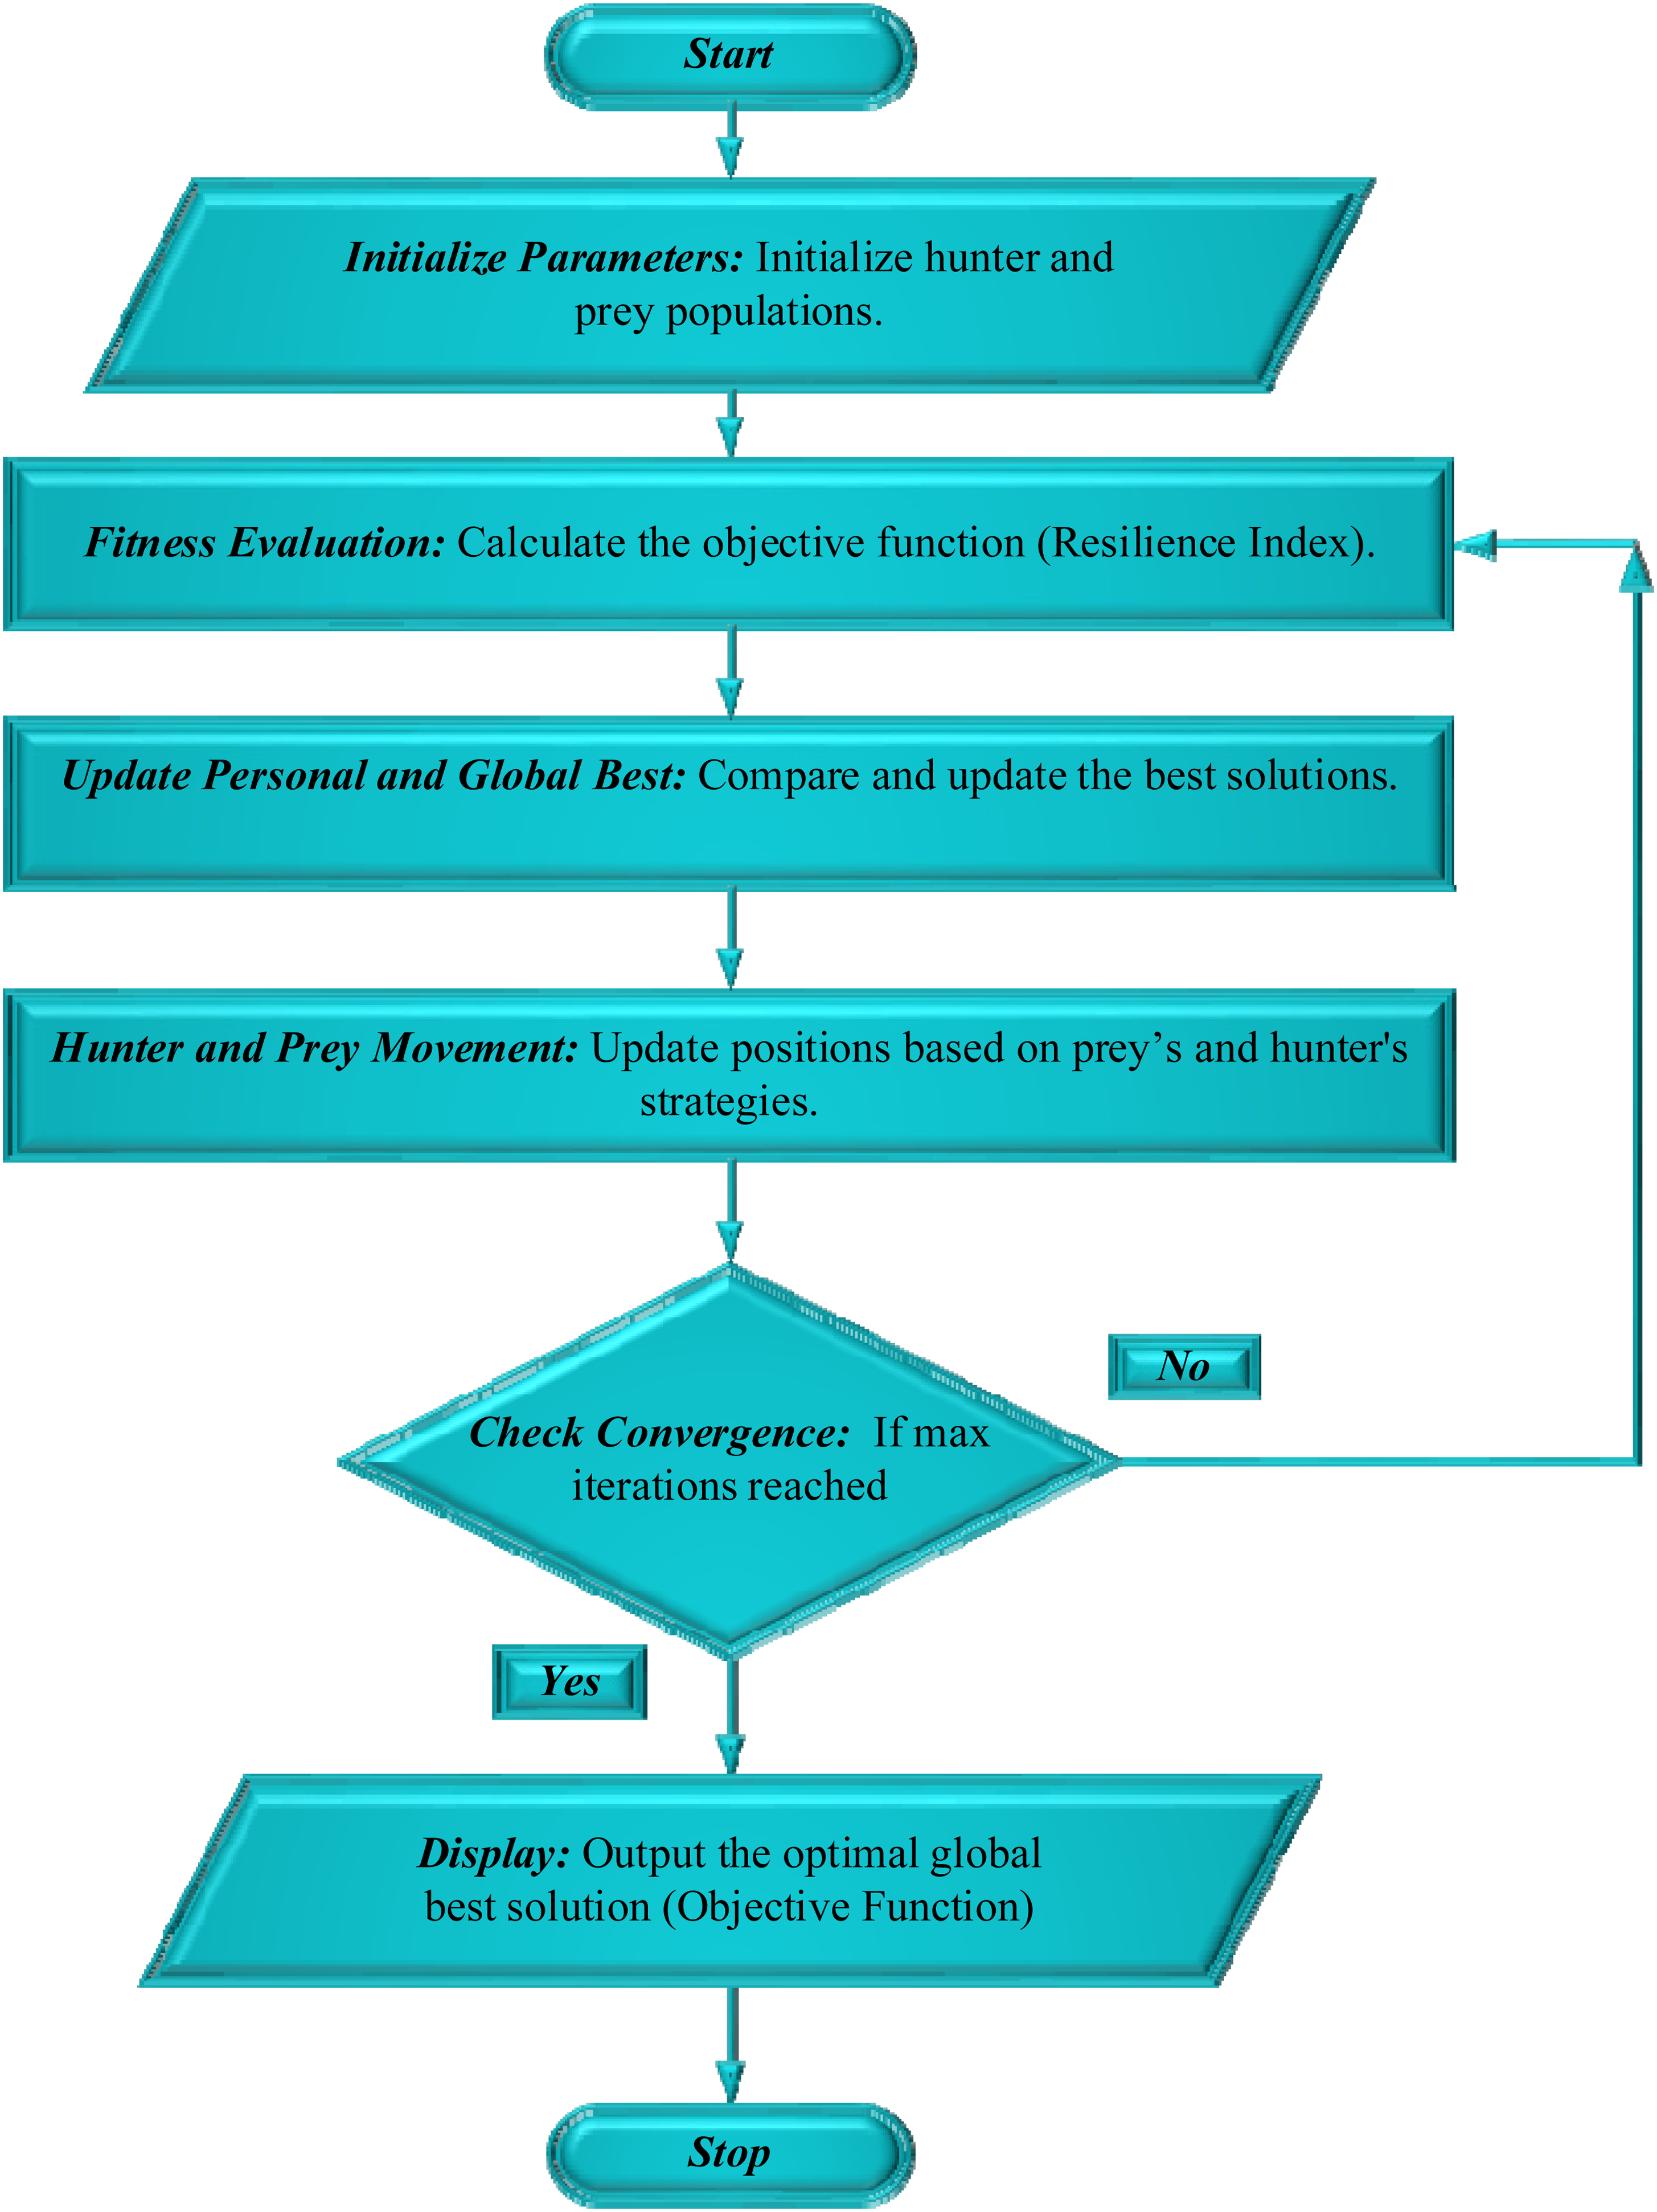
The overall framework for improving cyber-physical resilience developed in this study is shown in Figure 1. The process starts by collecting data from two test systems on real-world network configurations, load characteristics, renewable profiles, and cyber-state. Market price fluctuations, supply-demand variability, and consumer‒consumer behavior are all determined by analyzing these inputs. A multi-objective optimization strategy based on HPOA is implemented to jointly determine the best MG formation, adaptive tie-line deployment, and integrated inter-MG energy trading. To increase operational flexibility, the strategy also integrates distributed renewable resources such as wind turbines, rooftop solar power, battery energy storage, and vehicle-to-grid capable electric cars. After optimization, three disaster scenarios are used to evaluate cyber-resilience metrics such as recovery capacity, load unprotected, and resilience index. Meanwhile, trading revenue and energy unsupplied reduction are used to evaluate financial performance. The final decision layer ensures the deployment of a more robust and profitable operating configuration. Overall, the proposed architecture provides increased resilience, improved system stability, and better financial sustainability for disaster-prone SDNs.
Flow diagram of the proposed strategy for enhancing cyber-resilience.
The rest of the paper is organized as follows to provide a clear understanding of the research workflow. The cyber-physical SDN architecture, prosumer-integrated MG features, and resilience performance indicators are presented in Cyber-physical architecture of the SDN section. The proposed HPOA-based energy management scheme, inter-MG energy trading system, and tie-line deployment-based adaptive network topology reconstruction is described in detail in Hunter‒Prey optimization algorithm section. The entire simulation environment, including IEEE 34-bus, real-world Indian 28-bus systems, and cyber-physical disturbance scenarios, are described in Simulation study and discussion section. Then the results are analyzed and discussed in detail. In the Conclusion section, the main findings of the study are summarized, practical contributions are highlighted, and future research directions for developing cyber-resilient and market-responsive smart grids are outlined.
Cyber-physical architecture of the SDN
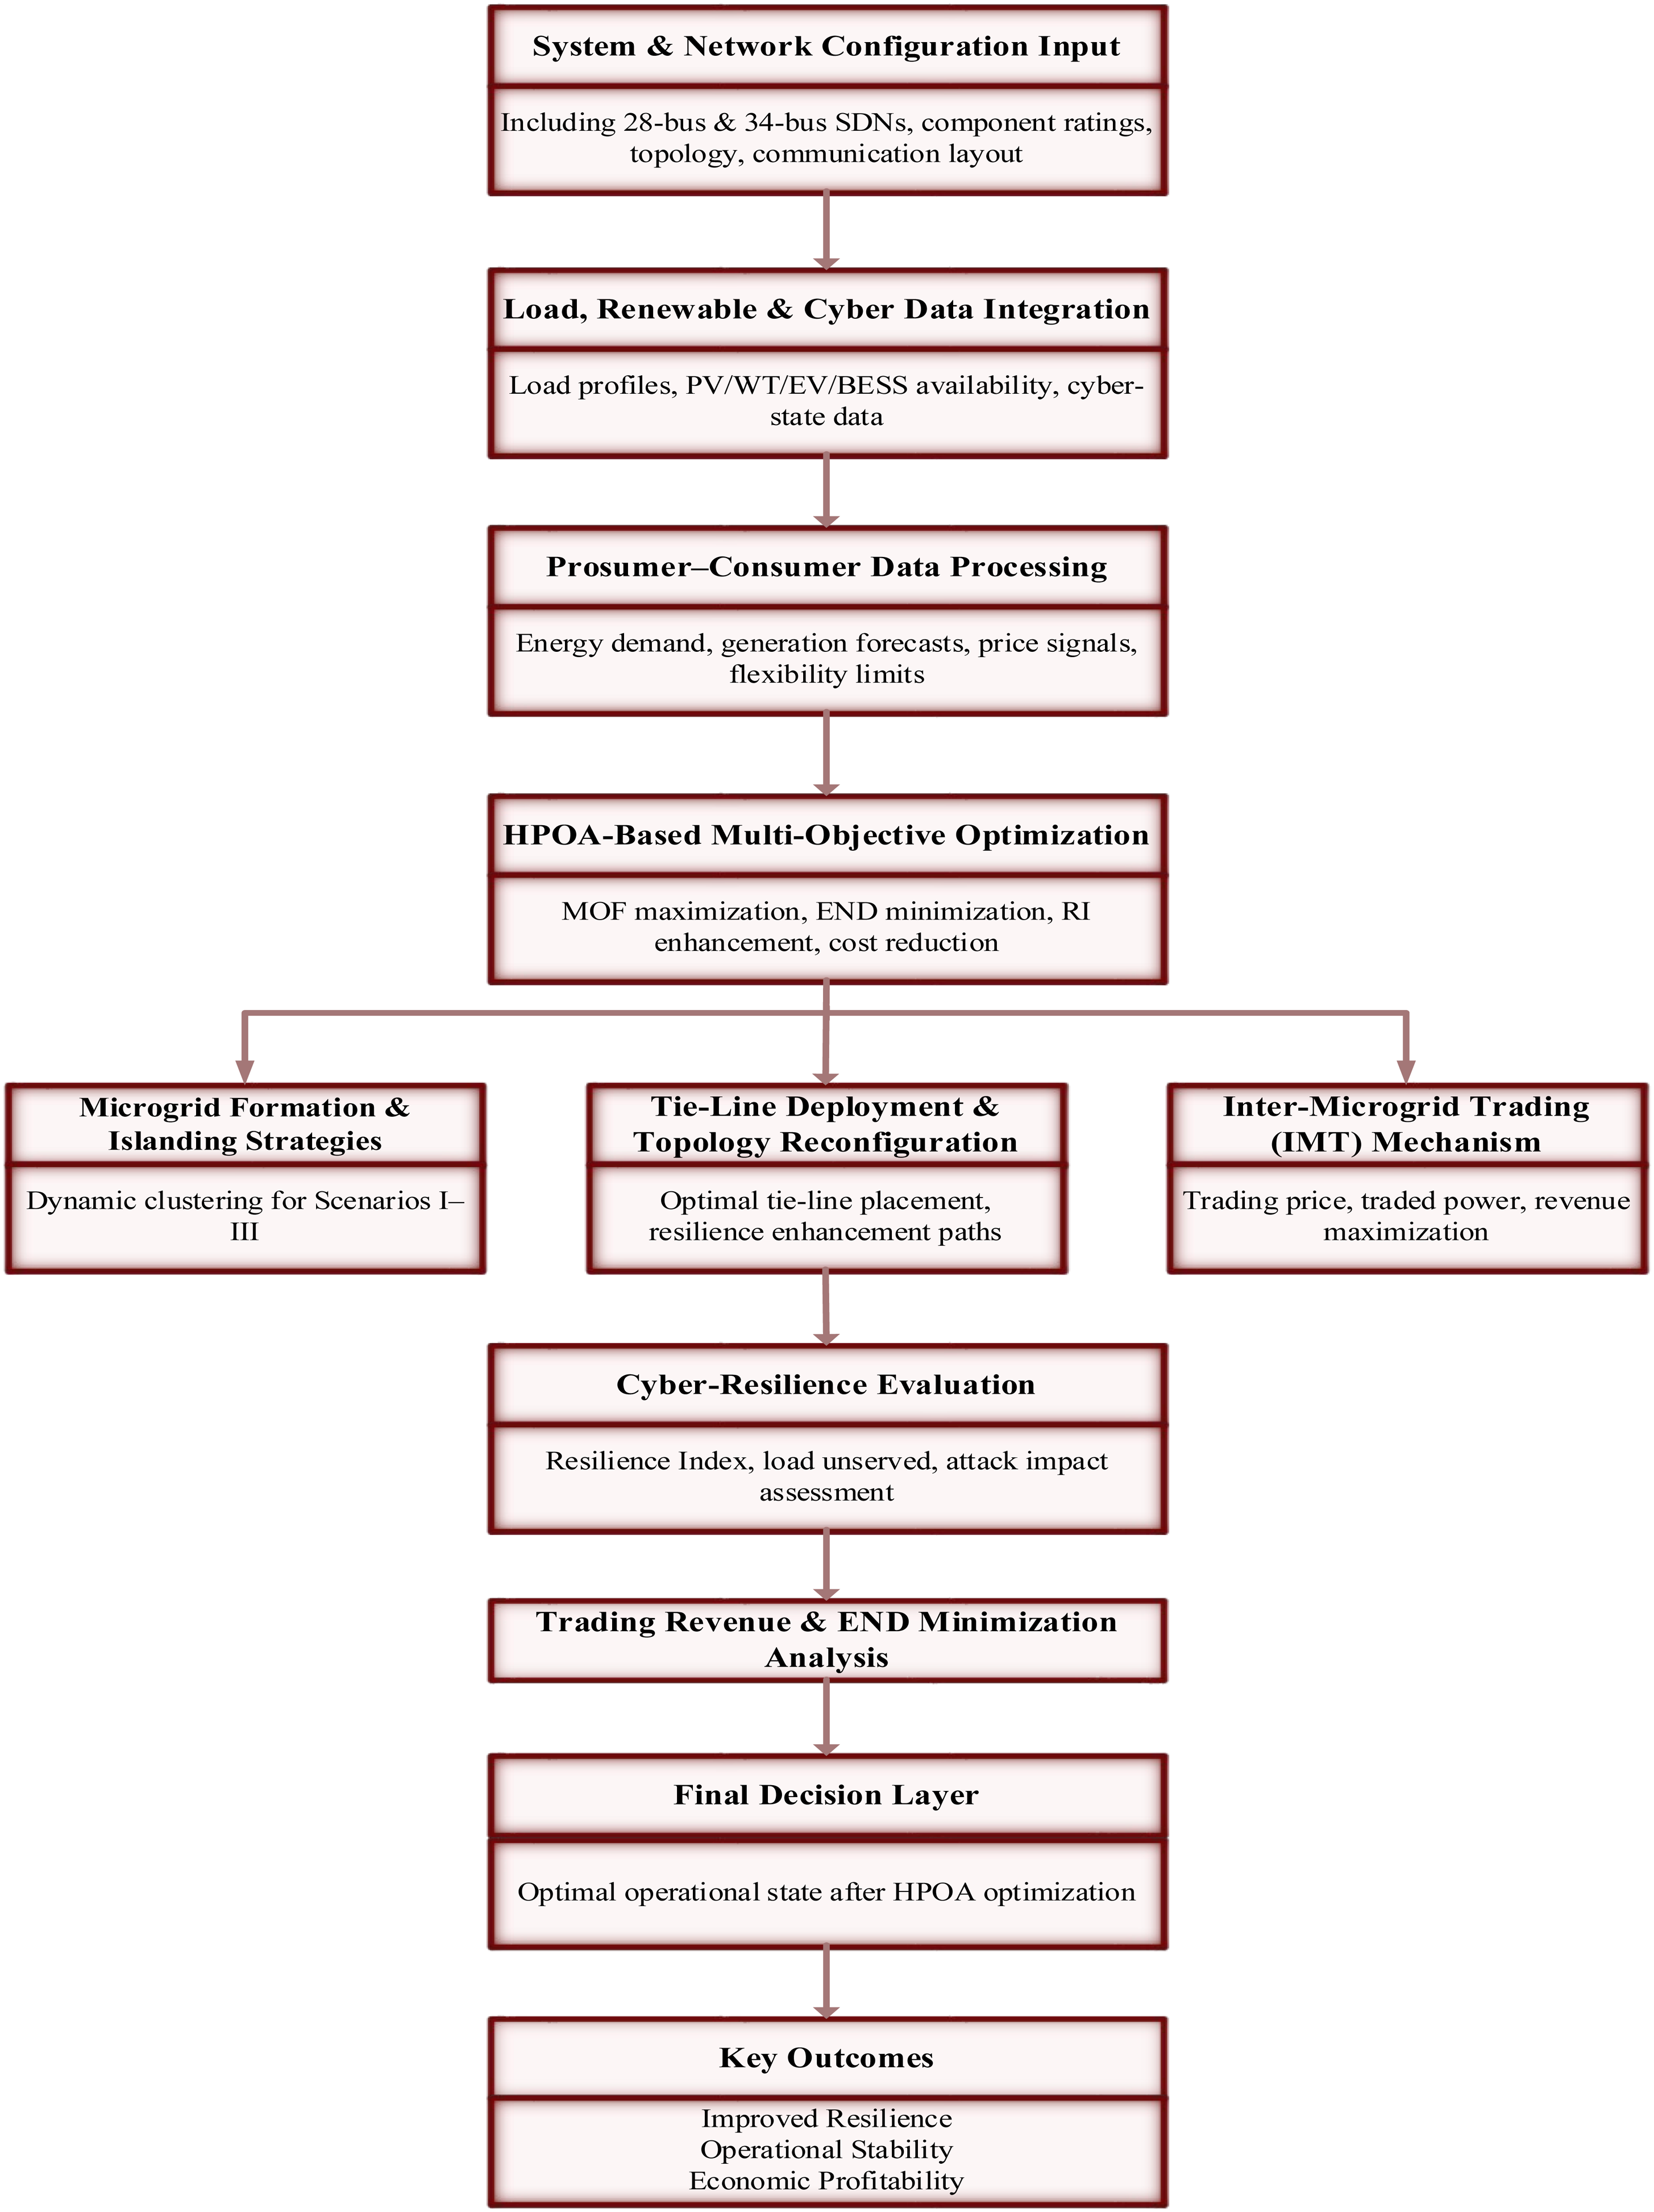
A modified IEEE 34-bus radial distribution system (Costa and dos Santos, 2007) is used to develop the proposed cyber-physical SDN. It is then validated on an 11-kV, 28-bus rural distribution network from the Kaktwip region of West Bengal, India (Kayal and Chanda, 2015). According to IEEE and applicable Indian LV distribution standards, both systems operate as medium-voltage (MV) radial feeders that supply end-users via 230 V (single-phase) and 415 V (three-phase) conventional low-voltage (LV) networks. The consumer-prosumer representation follows realistic LV household connection patterns, as the SDN includes residential receivers and EVs at the end-user level. One of the R, Y or B phases of the 415-V secondary is connected to each single-phase consumer, which includes prosumers and residential consumers. Houses, rooftop photovoltaic systems and domestic BEV chargers operate on 230-V single-phase service connections running on real distribution networks—which are common in LV systems in India and abroad—and choosing a single-phase model ensures that single-phase consumers are distributed approximately equally across all three phases to maintain phase balance. Depending on their rating, high-capacity installations such as commercial loads, public EV charging stations, WTs and community PV plants are modeled as three-phase prosumers connected directly to an 11-kV feeder or connected to a three-phase LV bus.
In this cyber-physical SDN, prosumers integrate RES such as PV panels, WT, BESS, and BEVs. BEVs can operate in V2G mode during peak hours, low RES availability, and emergency situations, and in G2V mode during off-peak hours with high renewable availability. Thanks to this dual-mode operation, prosumers can now act as both suppliers and consumers, which increases MG flexibility, improves local supply adequacy, and increases storage redundancy. By facilitating IMT through tie-lines between nearby MGs and improving voltage stability, the integrated operation of PV, WT, BESS, and BEVs reduces reliance on upstream grid support. By dynamically adjusting to changes in RES output and household demand, the proposed HPOA effectively schedules DERs, controls IMT, and balances supply-demand conditions in real time. This cyber-physical control method makes systems more resilient, cuts down on END, and speeds up energy delivery in cases of islanding and outages. Overall, the better cyber-physical SDN architecture makes the supply chain strong, flexible, and able to withstand problems. It can keep running in both normal and difficult operating conditions. Figure 2 illustrates a schematic depiction of the proposed cyber-physical SDN architecture.
Schematic representation of the proposed cyber-physical SDN architecture.
Modelling of various resources and parameters
This section mathematically represents the main resources and parameters required for the proposed system. The models for energy generation of renewable energy sources such as WT, BEVs, BESS, and PV systems are included in it. To enable the MGs to exchange energy effectively, it also encapsulates the IMT mechanism. Resilience Index and END are two cyber-resilience modeling parameters that help understand how well a system performs before, during, and after a natural disaster. These designs ensure that the way to improve the efficiency and resilience of SDN operations is systematic and integrated.
Energy generation from renewable sources
(i) PV Generation
Instead of the simplified linear expression, the full irradiance–temperature-dependent PV power model is utilized to give an accurate estimate of the real power extracted from the PV system. The AC power output of the PV array at time t is given by (Duffie et al., 2020):
Where 
This formula includes losses due to radiation scaling, temperature variation, and inverter switching, providing a physically accurate estimate of how much electricity PV will produce in different climates.
(ii) WT Generation
The simplified proportional WT expression is replaced by the full aerodynamic WT power curve. The mechanical power extracted from the wind at time t (Duffie et al., 2020):
Where,
The power coefficient 
With
In practical operation, the electrical output of the wind turbine follows the standard three-region power curve (Duffie et al., 2020):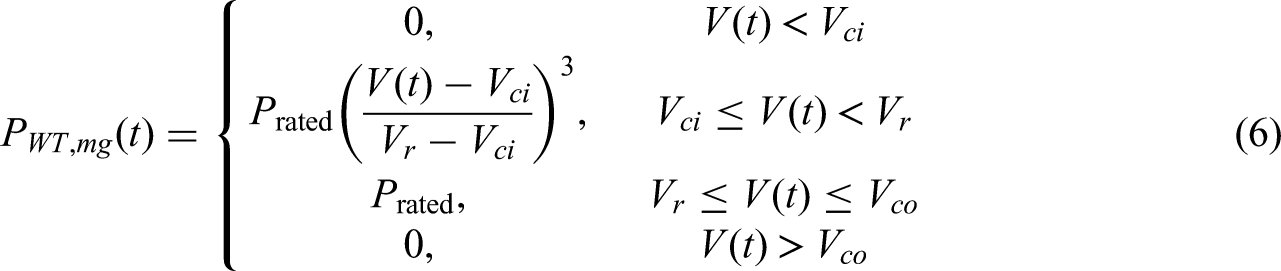
Where,
Energy management from BEVs
(i) Energy Charging (G2V mode)
In G2V mode, the energy is charged into the BEV batteries from the grid. The energy charging at time t is calculated as (Jadoun et al., 2021):
Where, (ii) Energy Discharging (V2G mode)
In V2G mode, the energy stored in the BEV is discharged back into the grid or MG to support energy supply during peak demand (Jadoun et al., 2021):
Where,
Energy storage and discharge from BESS
The BESS stores excess energy and discharges it when required. The discharge capacity is limited by the efficiency and maximum discharge rate of the BESS (Xiaoping et al., 2010):
Where,
Prosumer total power generation
The total power generation from the prosumer is the sum of the energy produced by the PV system, WT, BEVs in both G2V and V2G modes, and the BESS. The prosumer's contribution to the MG's power supply can be represented as:
Energy demand and load modeling
The energy demand at each bus, whether a consumer or prosumer, is determined by the appliances installed. This demand varies based on the appliances’ consumption and their operational schedules. Let the total demand for each appliance k at bus b in microgrid mg be:
Where,
Proposed IMT technique
SDN may act as multiple island MGs when the main grid is disconnected due to main grid faults, cyber-induced disruptions or natural disasters. In these situations, IMT becomes critical to maintain supply adequacy and increase resilience. Dedicated tie-line sections that electrically connect neighboring MG boundary buses facilitate power transfer between MGs. Through these tie lines, MGs with excess stored energy or renewable generation can assist neighboring MGs experiencing shortages. For clarity, the tie-line segments used in this study are specifically defined as follows:
Location: In IEEE 34-bus feeder and Indian 28-bus RDS, tie lines are placed between boundary buses of geographically adjacent MGs (for example, MG₁–MG₂ and MG₂–MG₃). These points correspond to the division and reconstruction points of practical application. Voltage level: All tie lines operate at a medium voltage level of 11 kV, which corresponds to the primary supply voltage of the two test networks. This eliminates the need for additional voltage conversion equipment. Line Characteristics: The tie lines are modeled as standard 11-kV overhead distribution conductors, namely ACSR/AAAC, in order to represent realistic physical infrastructure. Thermal rating: For each tie line, using standard 11-kV feeder amplitude values, from 160 to 350 A, maximum permissible power transmission range Ptie, max is provided to ensure that IMT remains within safe and appropriate limits. Switching and Protection: Contemplating the presence of a disconnector or circuit breaker at each tie-line end, controlled islanding, safe reconnection, and selective fault isolation have been utilized during emergency operations. Cyber-Layer Coordination: The IMT-EMS ensures coordinated and stable operation while avoiding overload or back-feed problems by continuously monitoring tie-line loading, voltage, and the direction of current flow through secure contact connections. We refer to it as cyber-layer integration.
Mathematical IMT formulation are:
The power traded between MG b and MG j at time t is given by:
Where,
The surplus and deficit power in microgrid mg at time t are calculated as:

Including
Formulation of resilience parameters
Prosumers with RES play a key role in improving system resilience in the IEEE 34-bus and Indian 28-bus SDNs under a cyber-physical framework. The SDN functions as MGs by cutting off from the main grid during emergency situations, such as natural disasters. The following parameters are modelled in order to measure and maximize resilience:
(i) Total energy not delivered
END measures the total amount of energy that the system is unable to receive during malfunctions or interruptions. According to Osman et al. (2023), it is the difference between the energy supply and demand from prosumers, storage systems, and IMT. (ii) Total Loss of Utility Revenue
Loss of utility revenue (LUR) arises when customers do not receive the required energy due to faults or insufficient generation. The revenue loss is obtained by multiplying the END by the utility's price per unit of energy (Osman et al., 2023).
Where, (iii) Total Outage Cost
Outage costs (OC) represent the financial penalty incurred by the grid operator or utility due to an energy outage. This is typically assessed based on the energy deficit in the system and the outage duration (Osman et al., 2023).
Where, (iv) Total Avoided Outage Cost
The avoided outage cost (AVD) is the cost saved by implementing energy management strategies, such as MG formation, energy storage, and IMT. This cost is the difference between the outage costs before and after the implementation of these strategies (Osman et al., 2023).
Where, (v) Resilience Index (RI)
The resilience index (RI) reflects the ratio between the total active load and the system's total demand minus the available load. This redefinition highlights the amount of energy that is successfully delivered in relation to load requirements—including the unmet portion. A higher RI indicates a more robust system that can effectively recover from faults or disruptions. According to Osman et al. (2023), the formula is:
In this case,
Cyber-resilience modelling parameters
A cyber-physical SDN requires a reliable communication infrastructure in order to enable energy management signals, control actions, and coordination of operations between the EMS and scattered cyber-physical entities. However, communication channels can still be vulnerable to malicious cyber intrusions, latency, packet loss, and data corruption that can eventually weaken situational awareness, disrupt information flow, and reduce decision-making efficiency. Several cyber-resilience performance indicators and mathematical formulations have been integrated into the proposed modeling framework to systematically assess the impact of the named vulnerabilities. Cyber-resilience formulas (20)–(26) used in this study are adapted and enhanced from the methodology initially presented in (Zahid et al., 2021) to make them suitable for the intended multi-microgrid architecture and dynamic trading environment.
(i) Communication Latency (
The time delay (s) in sending control or measurement data between the EMS and the MG controller is known as latency. Stability is impacted and decision lag is increased. The following is the expression for the delay factor:
Where the latency sensitivity constant is denoted by (ii) Packet Loss Rate
The percentage of dropped control packets is indicated by the packet loss rate:
The corresponding reliability factor is: (iii) Attack Severity Factor 
Communication availability is decreased by cyberattacks like Denial-of-Service (DoS) or data manipulation. The model for the attack factor is as follows: (iv) Control Success Probability 
The overall control success probability is determined by combining the effects of attack severity, packet loss, and latency.
A lower (v) Security Processing Overhead
Additional energy is used by the local MG controller for cryptographic operations, authentication, and intrusion detection, which are represented as follows:
Where (vi) Effective Recovered Power under Cyber Influence
To include cyber effects, the recovered energy is redefined as an effective recovered power, attenuated by control success probability and reduced by the security overhead:
Where (vii) Cyber-Operation Cost
The additional cost of cyber mitigation and degraded performance is formulated as: (viii) Cyber-Resilience Index (CRI)
Analogous to the physical RI, the CRI reflects the ratio of successfully communicated control signals to total control commands issued, over a 24-h horizon:
A CRI closer to 1 signifies highly reliable communication and strong cyber coordination.
(ix) Composite Resilience Index
To unify physical and cyber resilience, a composite hybrid index is proposed:
Where the weighting coefficients
Formulation of proposed objective function
The main objective of the optimization model is to maximize the cyber-aware resilience index of SDN. This formulation ensures that communication reliability and energy recovery are simultaneously improved in the event of a disruption. The cyber-integrated resilience index is obtained by replacing the resilience index with the effective recovered power 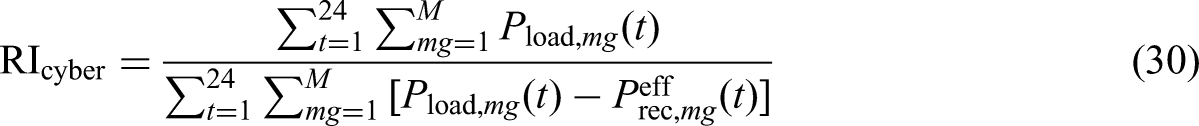
Consequently, the following is the expression for the multi-objective optimization function:
This goal minimizes financial penalties and costs associated with cyber degradation while increasing the cyber-physical resilience index. To guarantee complete cyber-physical integration in resilience assessment,
Constraints
(i) Energy Balance Constraint for MGs
Each MG must meet its energy demand by combining the generation from prosumers, storage, and energy traded from other MGs: (ii) SOC Constraints for BEVs and BESS
The state of charge for BEVs and BESS should remain within defined limits: (iii) Tie Line Capacity
The power traded between MGs is constrained by the available surplus and the deficit in the receiving microgrid:
Hunter Prey optimization algorithm
Overview of the HPOA
A bio-inspired evolutionary strategy, the HPOA aims to mimic natural predator‒prey relationships (Naruei et al., 2022). By striking a dynamic balance between exploration—looking widely for a variety of potential solutions—and exploitation—fine-tuning and enhancing the most promising solutions—the algorithm is able to achieve optimization. The IEEE 34-bus and Indian 28-bus SDNs’ RI is improved in the proposed work using HPOA within a cyber-physical operating framework. In order to ensure reliable system operation during natural disasters and cyber disturbances, HPOA uses its adaptive pursuit–escape dynamics to determine the best energy allocation, IMT choices, and fault-recovery tactics for the MGs.
Motivation for selecting HPOA
Because of its innate ability to handle the nonlinear, multi-modal, and cyber-physically coupled optimization structure of the suggested SDN, the HPOA was chosen. Cyber-layer uncertainties, MG trading behavior, BESS/BEV time-coupled constraints, and RES variability all influence the solution landscape. HPOA is well suited for such complex and dynamic search environments because its pursuit-escape modeling inherently strikes a good balance between exploration and exploitation (Naruei et al., 2022).
Limitations of existing algorithms
Although they are frequently used in energy systems, traditional metaheuristics such as the Gray Wolf Optimizer (GWO) and Particle Swarm Optimization (PSO) have drawbacks when it comes to complex cyber-physical SDN optimization:
✓ Premature convergence is a common phenomenon in PSO, where particles quickly cluster around local optima, reducing population diversity and search power (Nakisa et al., 2014). ✓ GWO's reliance on a strict leader-hierarchy (α–β–δ structure) limits its ability to escape local minima in multi-model environments and can lead to greedy exploitation (Mirjalili et al., 2014).
Traditional algorithms are less appropriate for resilience-driven, uncertainty-dominated optimization in cyber-physical SDNs because of these drawbacks.
Theoretical advantages of HPOA
HPOA uses a decoupled pursuit–escape mechanism to get around the aforementioned restrictions:
✓ The hunter (predator) intensifies the search by focusing on areas that show promise. ✓ The prey's diversification, or random evasive motion, keeps the population diverse and avoids stagnation.
An exploration-exploitation equilibrium that is more dynamic and adaptive results from this biologically based interaction. It makes nonconvex, multi-modal, and constraint-dense optimization spaces easier for HPOA to traverse. Research indicates that for nonlinear engineering problems, predator‒prey-based metaheuristics outperform PSO, GWO, DE, or GA in terms of robustness and convergence speed (Saeed et al., 2022; Wong and Ming, 2019).
Suitability for cyber–physical SDN optimization
Theoretically and empirically, HPOA is more capable of achieving high-quality solutions than traditional methods due to the multi-layered complexity of SDN operation, which includes RES intermittency, MG coordination, V2G/G2V scheduling, cyber-layer delays, and resilience constraints. Its adaptive search dynamics facilitate dependable RI optimization by effectively identifying:
✓ Inter-microgrid energy trading policies; ✓ Load recovery and islanding strategies; ✓ Cyber-aware operational adjustments; and ✓ Optimal MG-level energy allocation.
In order to increase cyber-physical resilience in SDNs, HPOA offers a strong and analytically supported optimization mechanism.
HPOA optimization workflow
The algorithm is modified to function on decision variables related to MG-level energy allocation, IMT, storage scheduling, and load recovery in order to apply the HPOA within the suggested cyber-physical SDN. To maximize the RI, the optimization process iteratively updates a population of prey and hunters. The movement of each hunter through the search space reflects the pursuit–escape dynamics of HPOA, and each hunter represents a workable energy management strategy. The entire process utilized in this study to maximize the resilience of the IEEE 34-bus and 28-bus SDNs is summed up in the following steps.
Step 1: Initialization
Population Initialization:
Define an initial population of hunters (solutions), each representing energy management strategies in MGs (e.g. allocation of PV, WT, BESS, and BEV energy among MGs). Each hunter Hunters are initialized randomly within the feasible range for energy generation, storage, and trading capacities.
Parameter Setting:
Configure algorithm-specific parameters such as the maximum number of iterations ( ✓ Number of Hunters = 30 ✓ Number of prey = 60 ✓ Maximum iterations = 100 ✓ Step size for exploration = 0.5
Step 2: Hunter Movement (Exploration Phase)
In this phase, hunters explore the solution space widely to identify potential regions for better solutions. This step guarantees a thorough search and prevents local optima (Naruei et al., 2022).
Here α is the exploration factor, rand is a random number between 0 and 1,
This movement encourages convergence to regions with low power loss by enabling hunters to explore regions based on the currently best-known solution.
Step 3: Pursuit Phase (Exploitation)
After finding promising regions, predators focus on refining their positions to further improve the solutions. This phase places a strong emphasis on exploitation to get closer to the optimal solution (Naruei et al., 2022).
Where
This movement allows predators to adjust their positions by avoiding unfavorable regions associated with the worst solution and focusing on promising regions that represent the best solution.
Step 4: Escape Mechanism (Diversity Preservation)
To maintain diversity and prevent stagnation in local optima, some hunters are allowed to randomly escape the search region (Naruei et al., 2022):
Where, δ is the escape factor, and
Step 5: Fitness Evaluation and Update
Evaluate each hunter's fitness based on the resilience index from the equation (38) (Naruei et al., 2022).
Where, Update Keep track of the best solution
Step 6: Termination Criteria
Repeat Steps 2–5 until the maximum number of iterations (
Flowchart of HPOA for the proposed work.
Implementation of the HPOA
Implementation of HPOA for specific tasks requires the following activities:
Population Initialization: Establishing the population of hunters representing the energy management technique such as energy distribution between MGs from PV, WT, BESS and BEV. Set the hunters randomly within the practical energy efficiency range. Setup parameters: Set HPOA parameters such as maximum number of iterations, escape factors, population size, exploration and exploitation coefficients. Exploration Phase: Using the best-known solution as a guide, hunters can advance into promising areas of the solution space. This phase ensures a broad search and avoids local optima. Follow-up Phase (Exploitation): Target suitable areas found in the exploration phase to improve predator conditions. This movement creates a balance between exploration and exploitation to refine the solution. Escape mechanism: to preserve diversity, prevent stagnation at a local optimum, and introduce random predator positioning within the search domain. Fitness assessment: Determining the fitness of each predator using a resilience index that shows how much energy management techniques increase the resilience of the system. Updating solutions: At each iteration, determine which solutions are performing well and which are performing poorly, and then update them for future steps. Conclusion: To confirm that the best configuration has been identified, repeat the steps until the maximum number of iterations is reached or until the improvement in the best solution falls below a predetermined threshold.
Simulation study and discussion
Test system description
Two complementary distribution networks are used for the simulation study: a standard IEEE 34-bus distribution system and a real 28-bus distribution system from Kaktwip in South 24 Parganas, West Bengal, India. With long radial structures, high R/X ratios, seasonal demand fluctuations, voltage variations, and significant technical losses, Kaktwip is an example of a potential coastal semi-urban grid. It is the ideal platform to test the effectiveness of DER integration, demand-side flexibility, and MG-based energy trading strategies under realistic field conditions due to these practical limitations. Scalability and smart-grid adaptability are tested using the IEEE 34-bus SDN as a reference. Its complex architecture supports network segmentation, IMT, and dynamic tie-line re-configuration including long laterals, voltage regulators, and unbalanced loading. The system is designed with a high penetration of PV, WT, BESS, and V2G-enabled EVs in order to comprehensively evaluate the resilience enhancement capability of the proposed approach. Cyber-threat scenarios such as malicious set-point tampering, communication delay, and invalid data injection are shown with the aim of further testing the cyber-physical robustness. Adaptive prosumers take part in IMT operations in both systems. The suggested EMS assures safe system reconfiguration, anomaly-aware decision-making, and ideal DER scheduling. It is developed in MATLAB with the HPOA optimizer. When combined, these testbeds provide a comprehensive evaluation framework that combines stable smart-grid performance with real-world relevance.
Appliance rating, allocation and demand
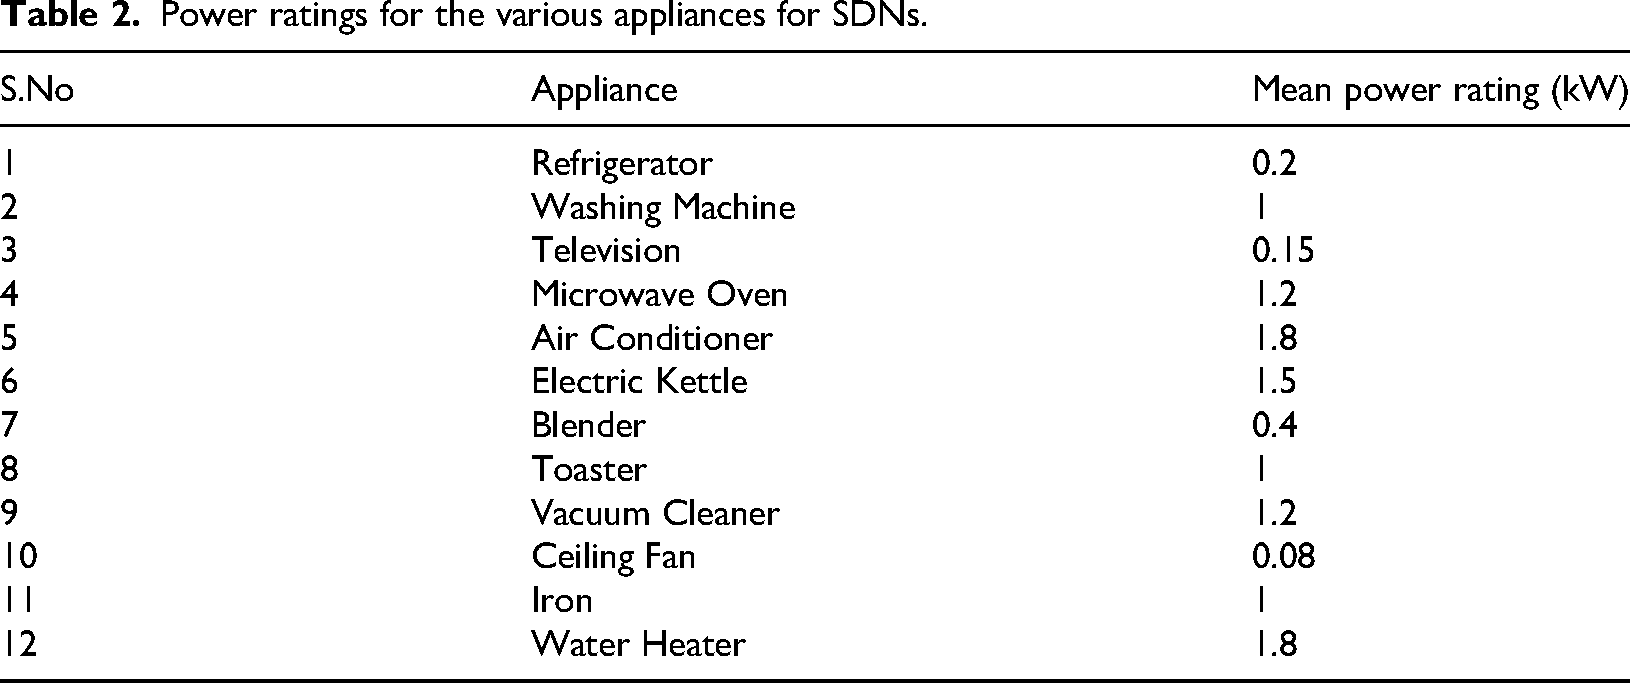
The device ratings and usage patterns considered in this study are common to both test systems. The number of devices connected to each bus is determined based on the respective bus load demand. To model the consumers and consumer demand within SDNs, Table 2 provides the average power ratings of residential devices commonly found in Indian homes. These ratings, which represent frequently used products and their operating wattage under typical conditions, are consistent with residential consumption characteristics in India.
Power ratings for the various appliances for SDNs.
The proposed system uses typical Indian 24-h load profiles for each appliance, which are based on daily usage patterns influenced by residential location, lifestyle, and weather conditions, to estimate real household behavior. The normalized 24-h load profiles of frequently used household appliances are shown in Figure 4, which is constructed using real and fluid Indian usage patterns. Real household behavior is reflected in the profiles, which show a clear afternoon microwave-oven peak, strong afternoon cooling demand driven by the use of air conditioners and ceiling fans, early morning water heating demand and operation of kettles, toasters, and blenders during breakfast. After 18:00, evening entertainment loads, especially from televisions, increase significantly, creating a distinct evening peak. Refrigerators and other continuous-duty appliances maintain a steady baseline throughout the day, with a small increase during the hot afternoon hours. For clarity, each device curve is individually color-coded, and the profiles include realistic time, duration, and intensity that reflect India's climate and lifestyle. To accurately assess demand variability, DER scheduling, feeder loading, and sensitivity to cyber-physical disturbances under various operating conditions, these normalized load patterns serve as a single behavioral model for both the IEEE 34-bus SDN and the practical 28-bus RDS.
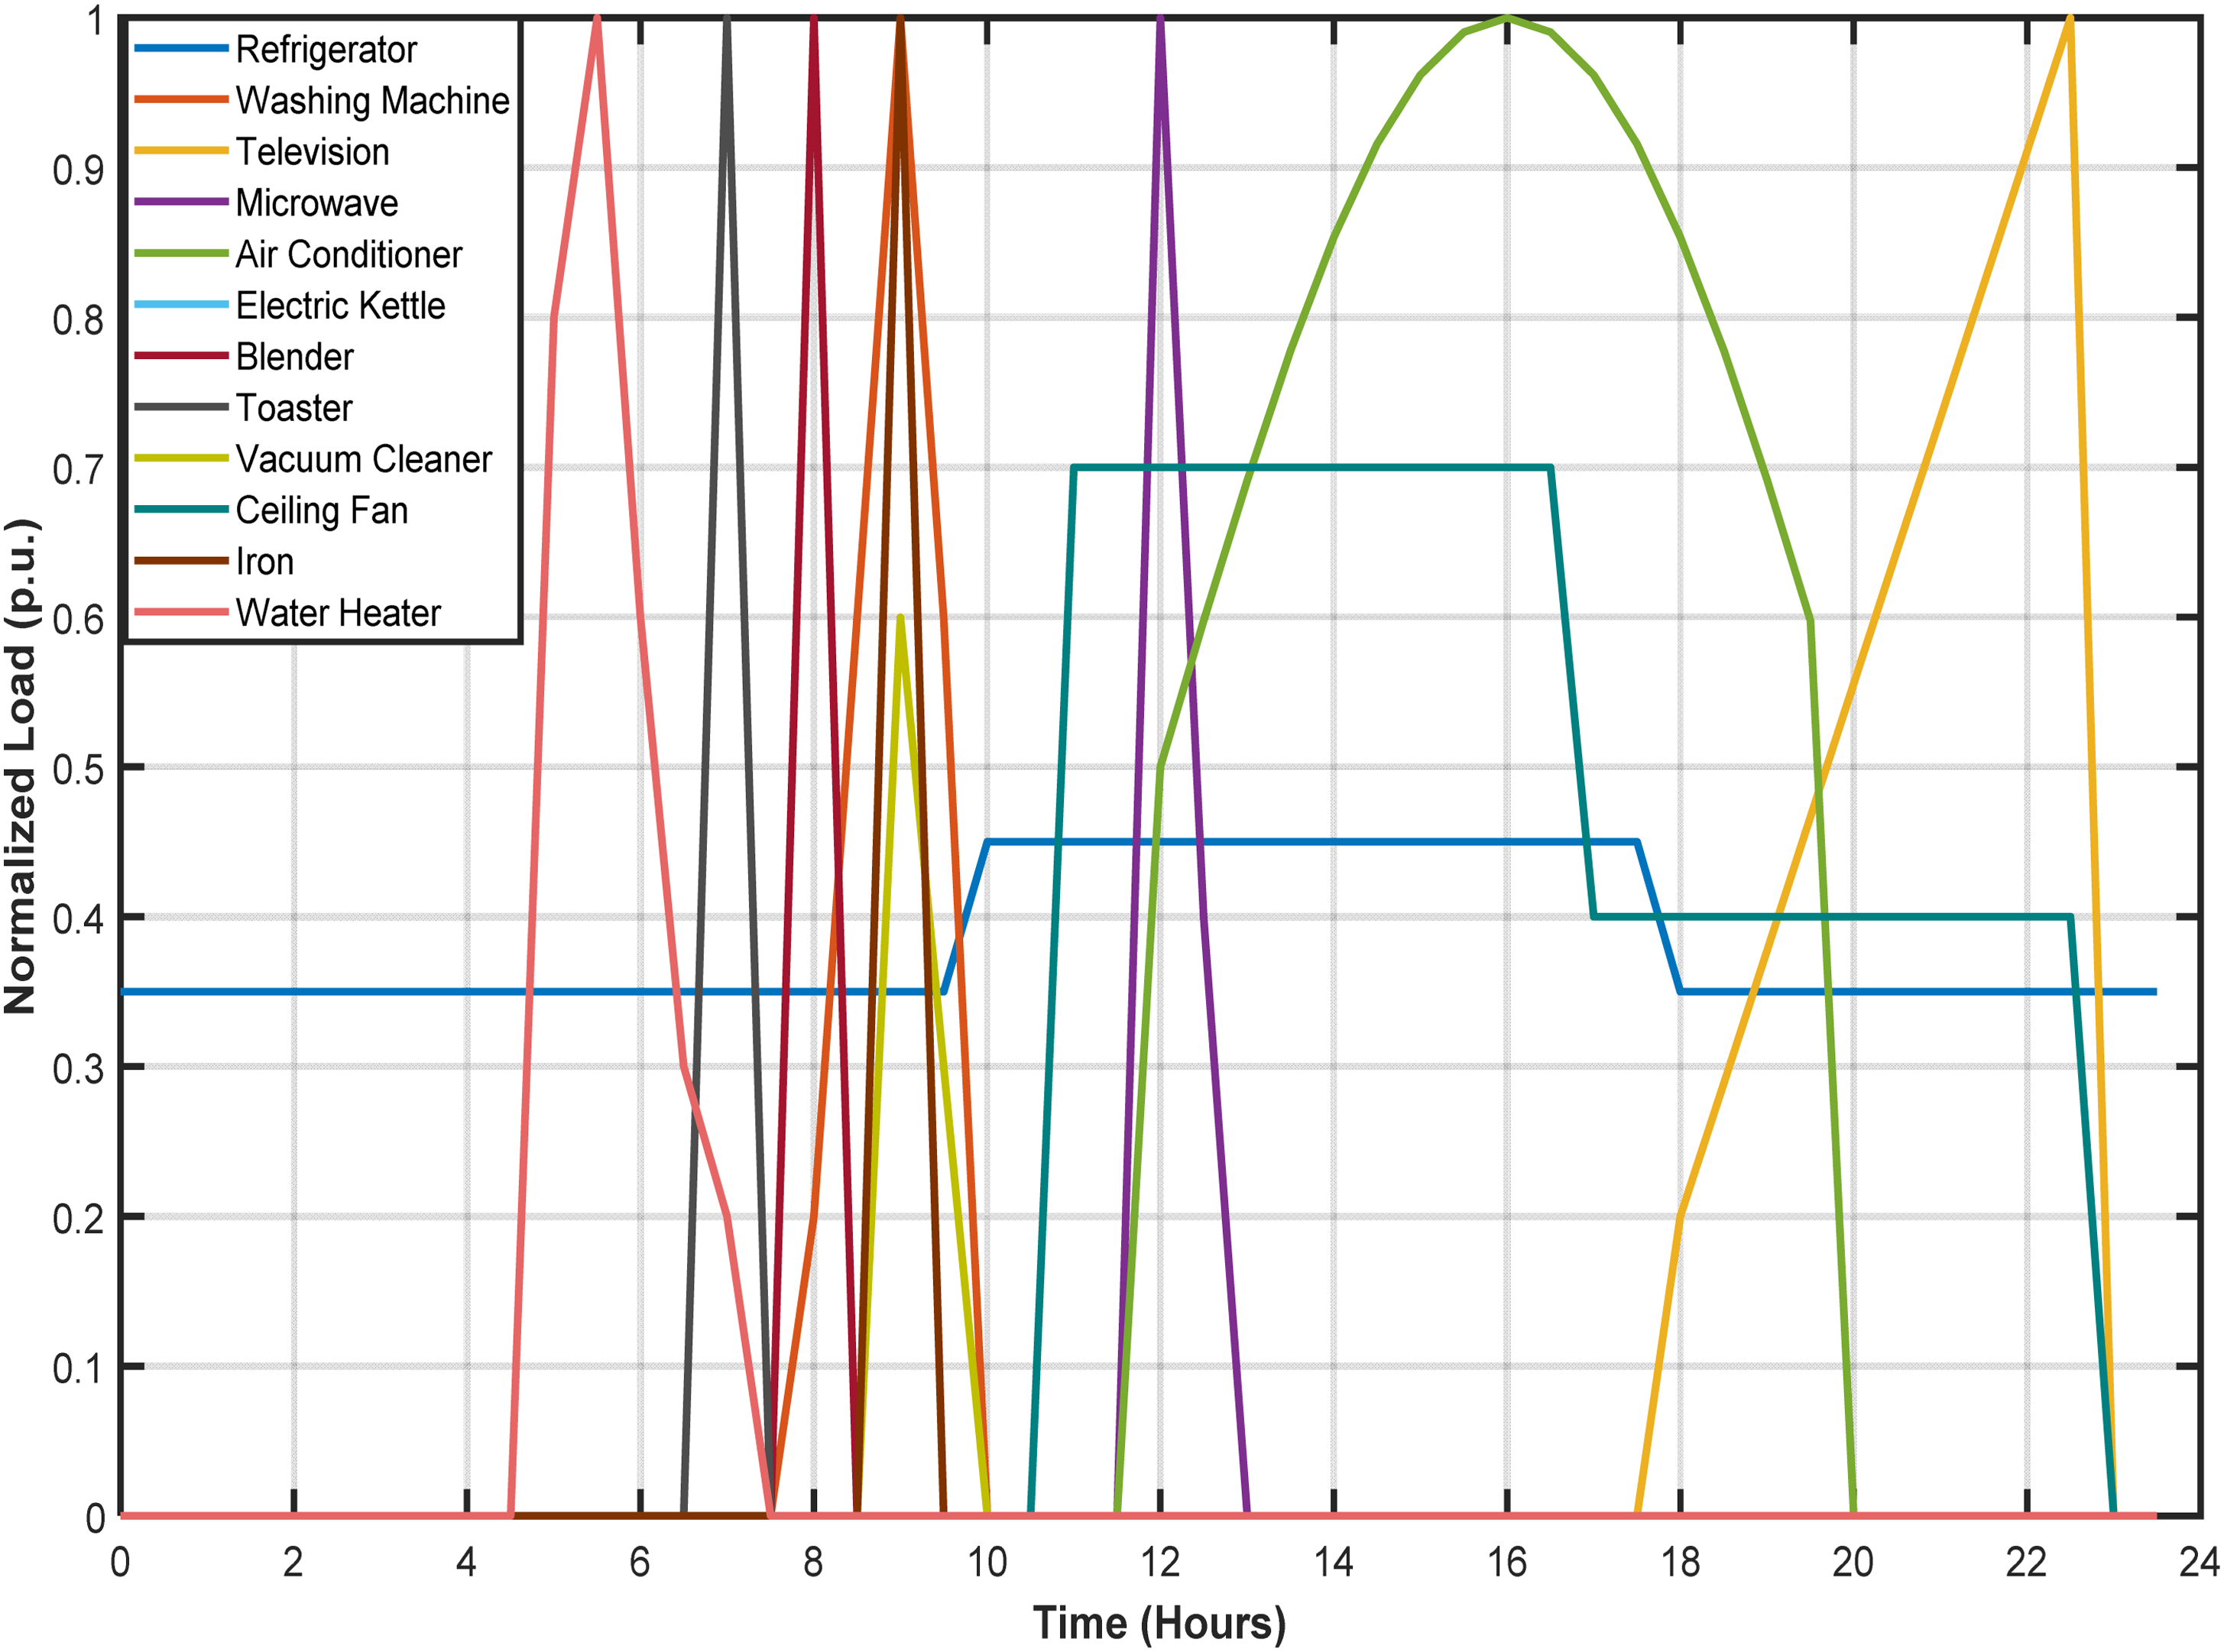
24-hour load profiles of residential appliances.
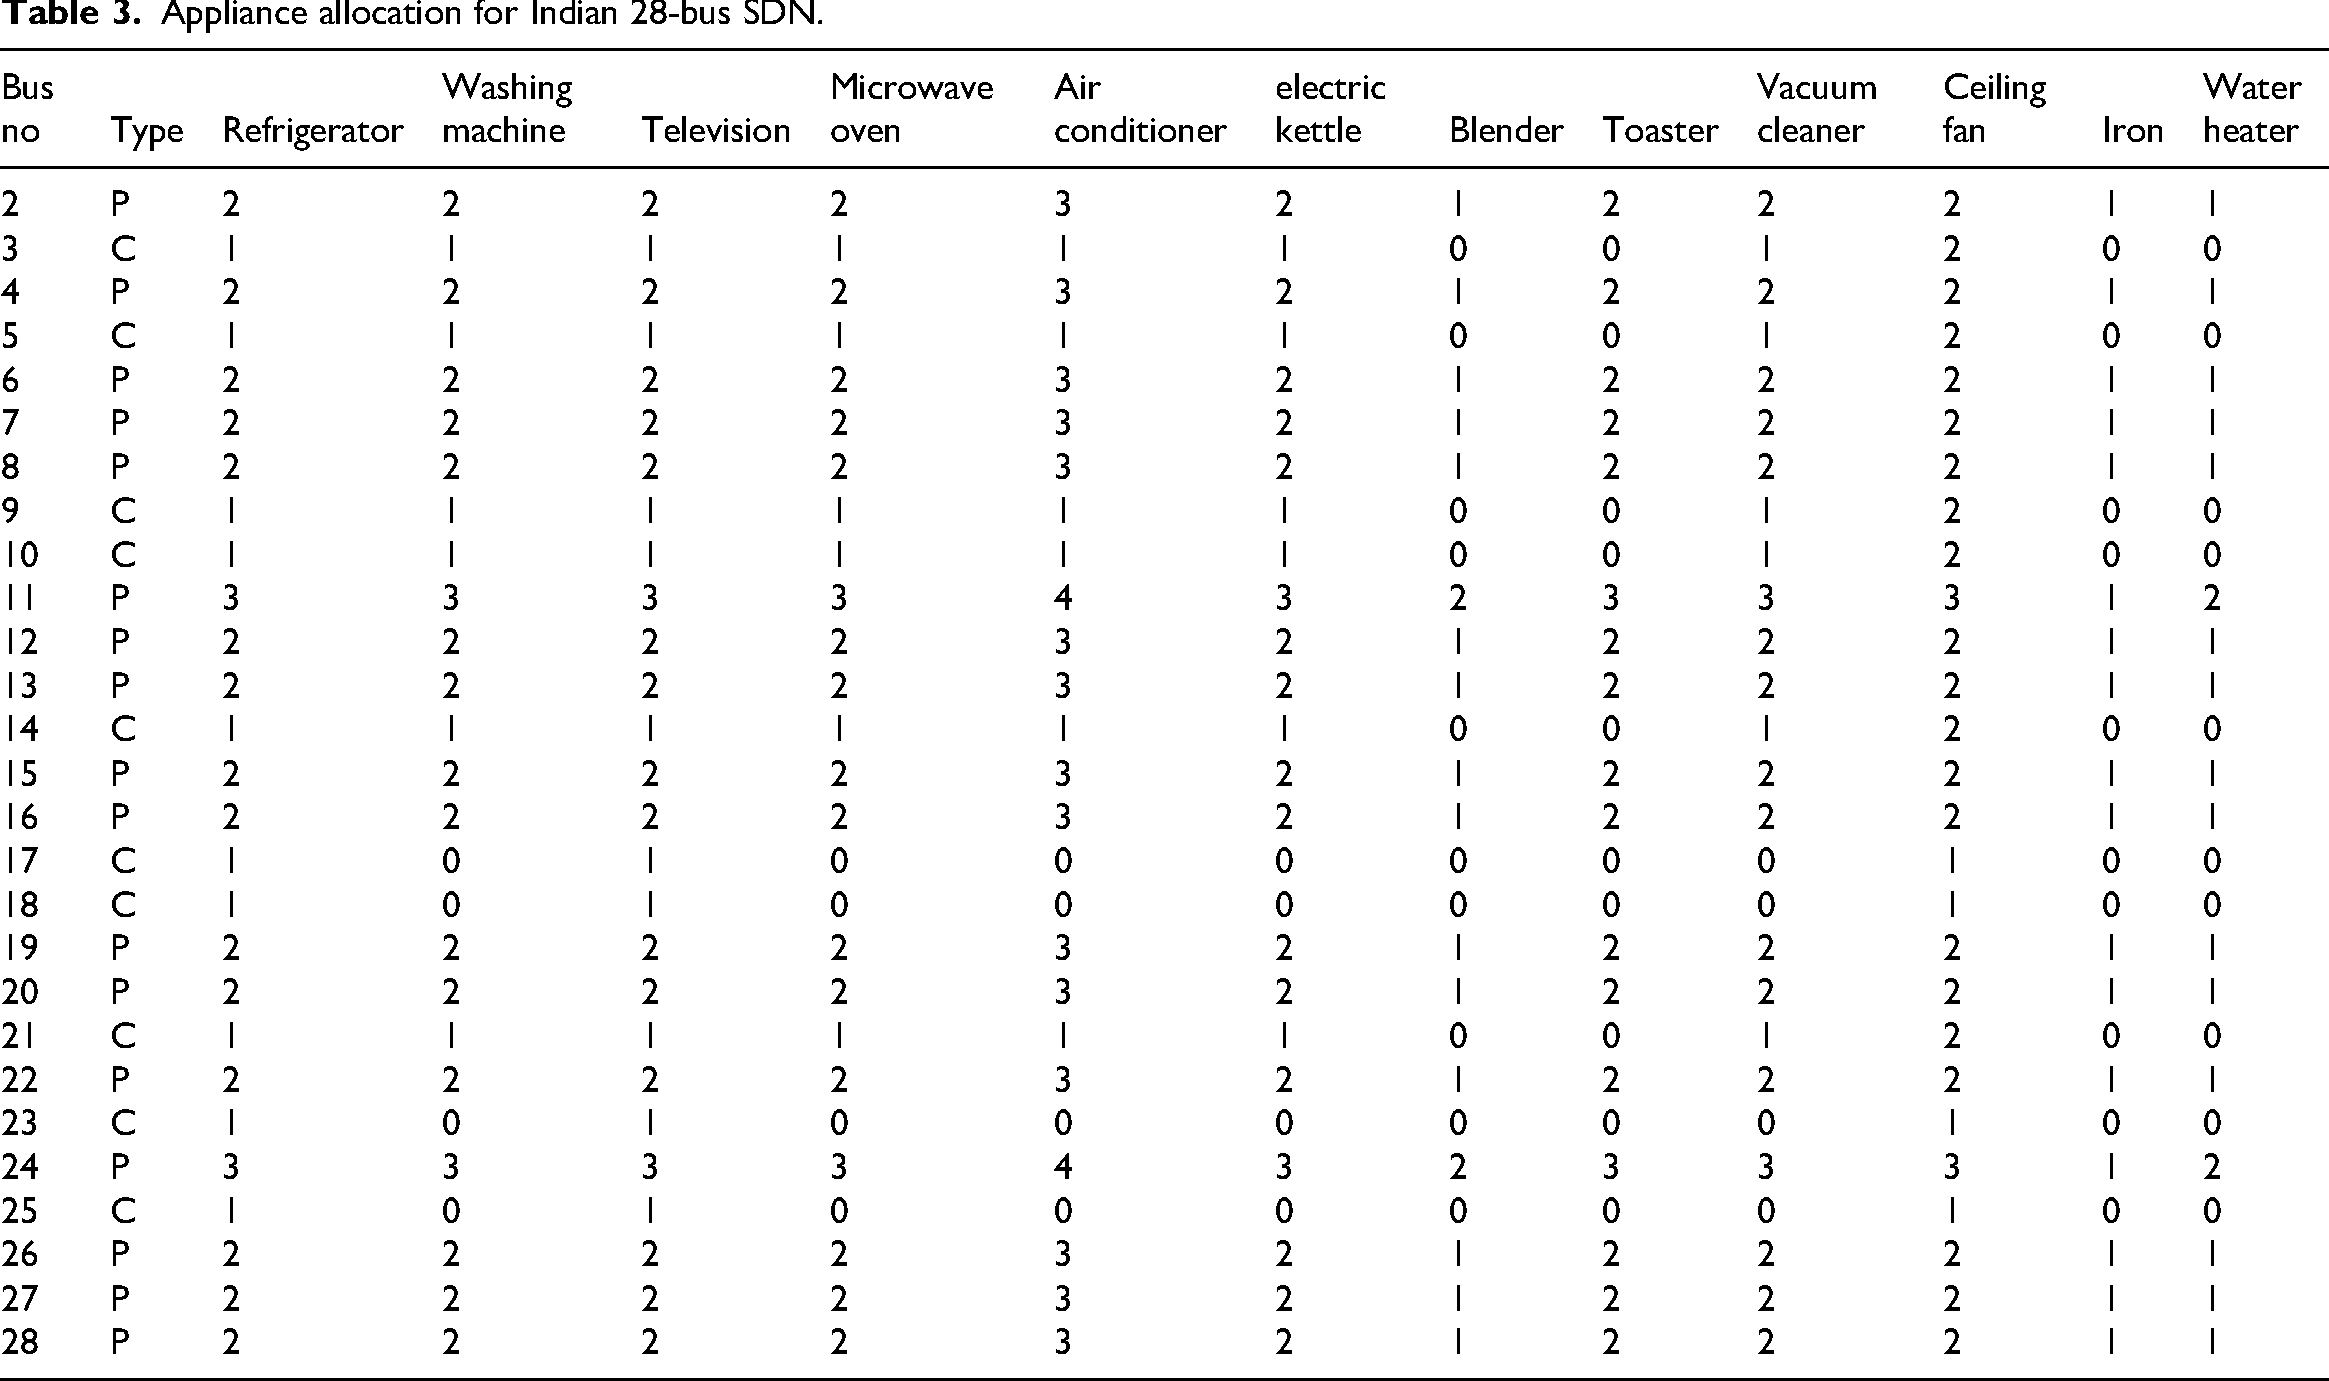
Based on consumer/prosumer categorization of each bus and their estimated residential load levels, the device allocations for IEEE 34-bus SDN and Indian 28-bus SDN for the customers offered with PV, BESS, and V2G-enabled BEVs are shown in Tables 3 and 4, respectively. High-demand devices such as air conditioners, microwaves, and other kitchen and entertainment loads are offered to the customers with PV, BESS, and V2G-enabled BEVs to account for the increasing household consumption. For a customer, the medium and low demand usage patterns are offered with limited devices. Allocations are derived using average device ratings shown in Table 2 and scaled with the estimated bus load and typical household behavior in India. Along with preserving comparability to analyze hourly demand, DER scheduling, demand response, and energy trading behavior, this structural allocation ensures that both the SDNs represent actual characteristics of residential consumption accurately. It also helps evaluate prosumer-driven resilience and load diversity across networks.
Appliance allocation for Indian 28-bus SDN.
Appliance allocation for IEEE 34-bus SDN.
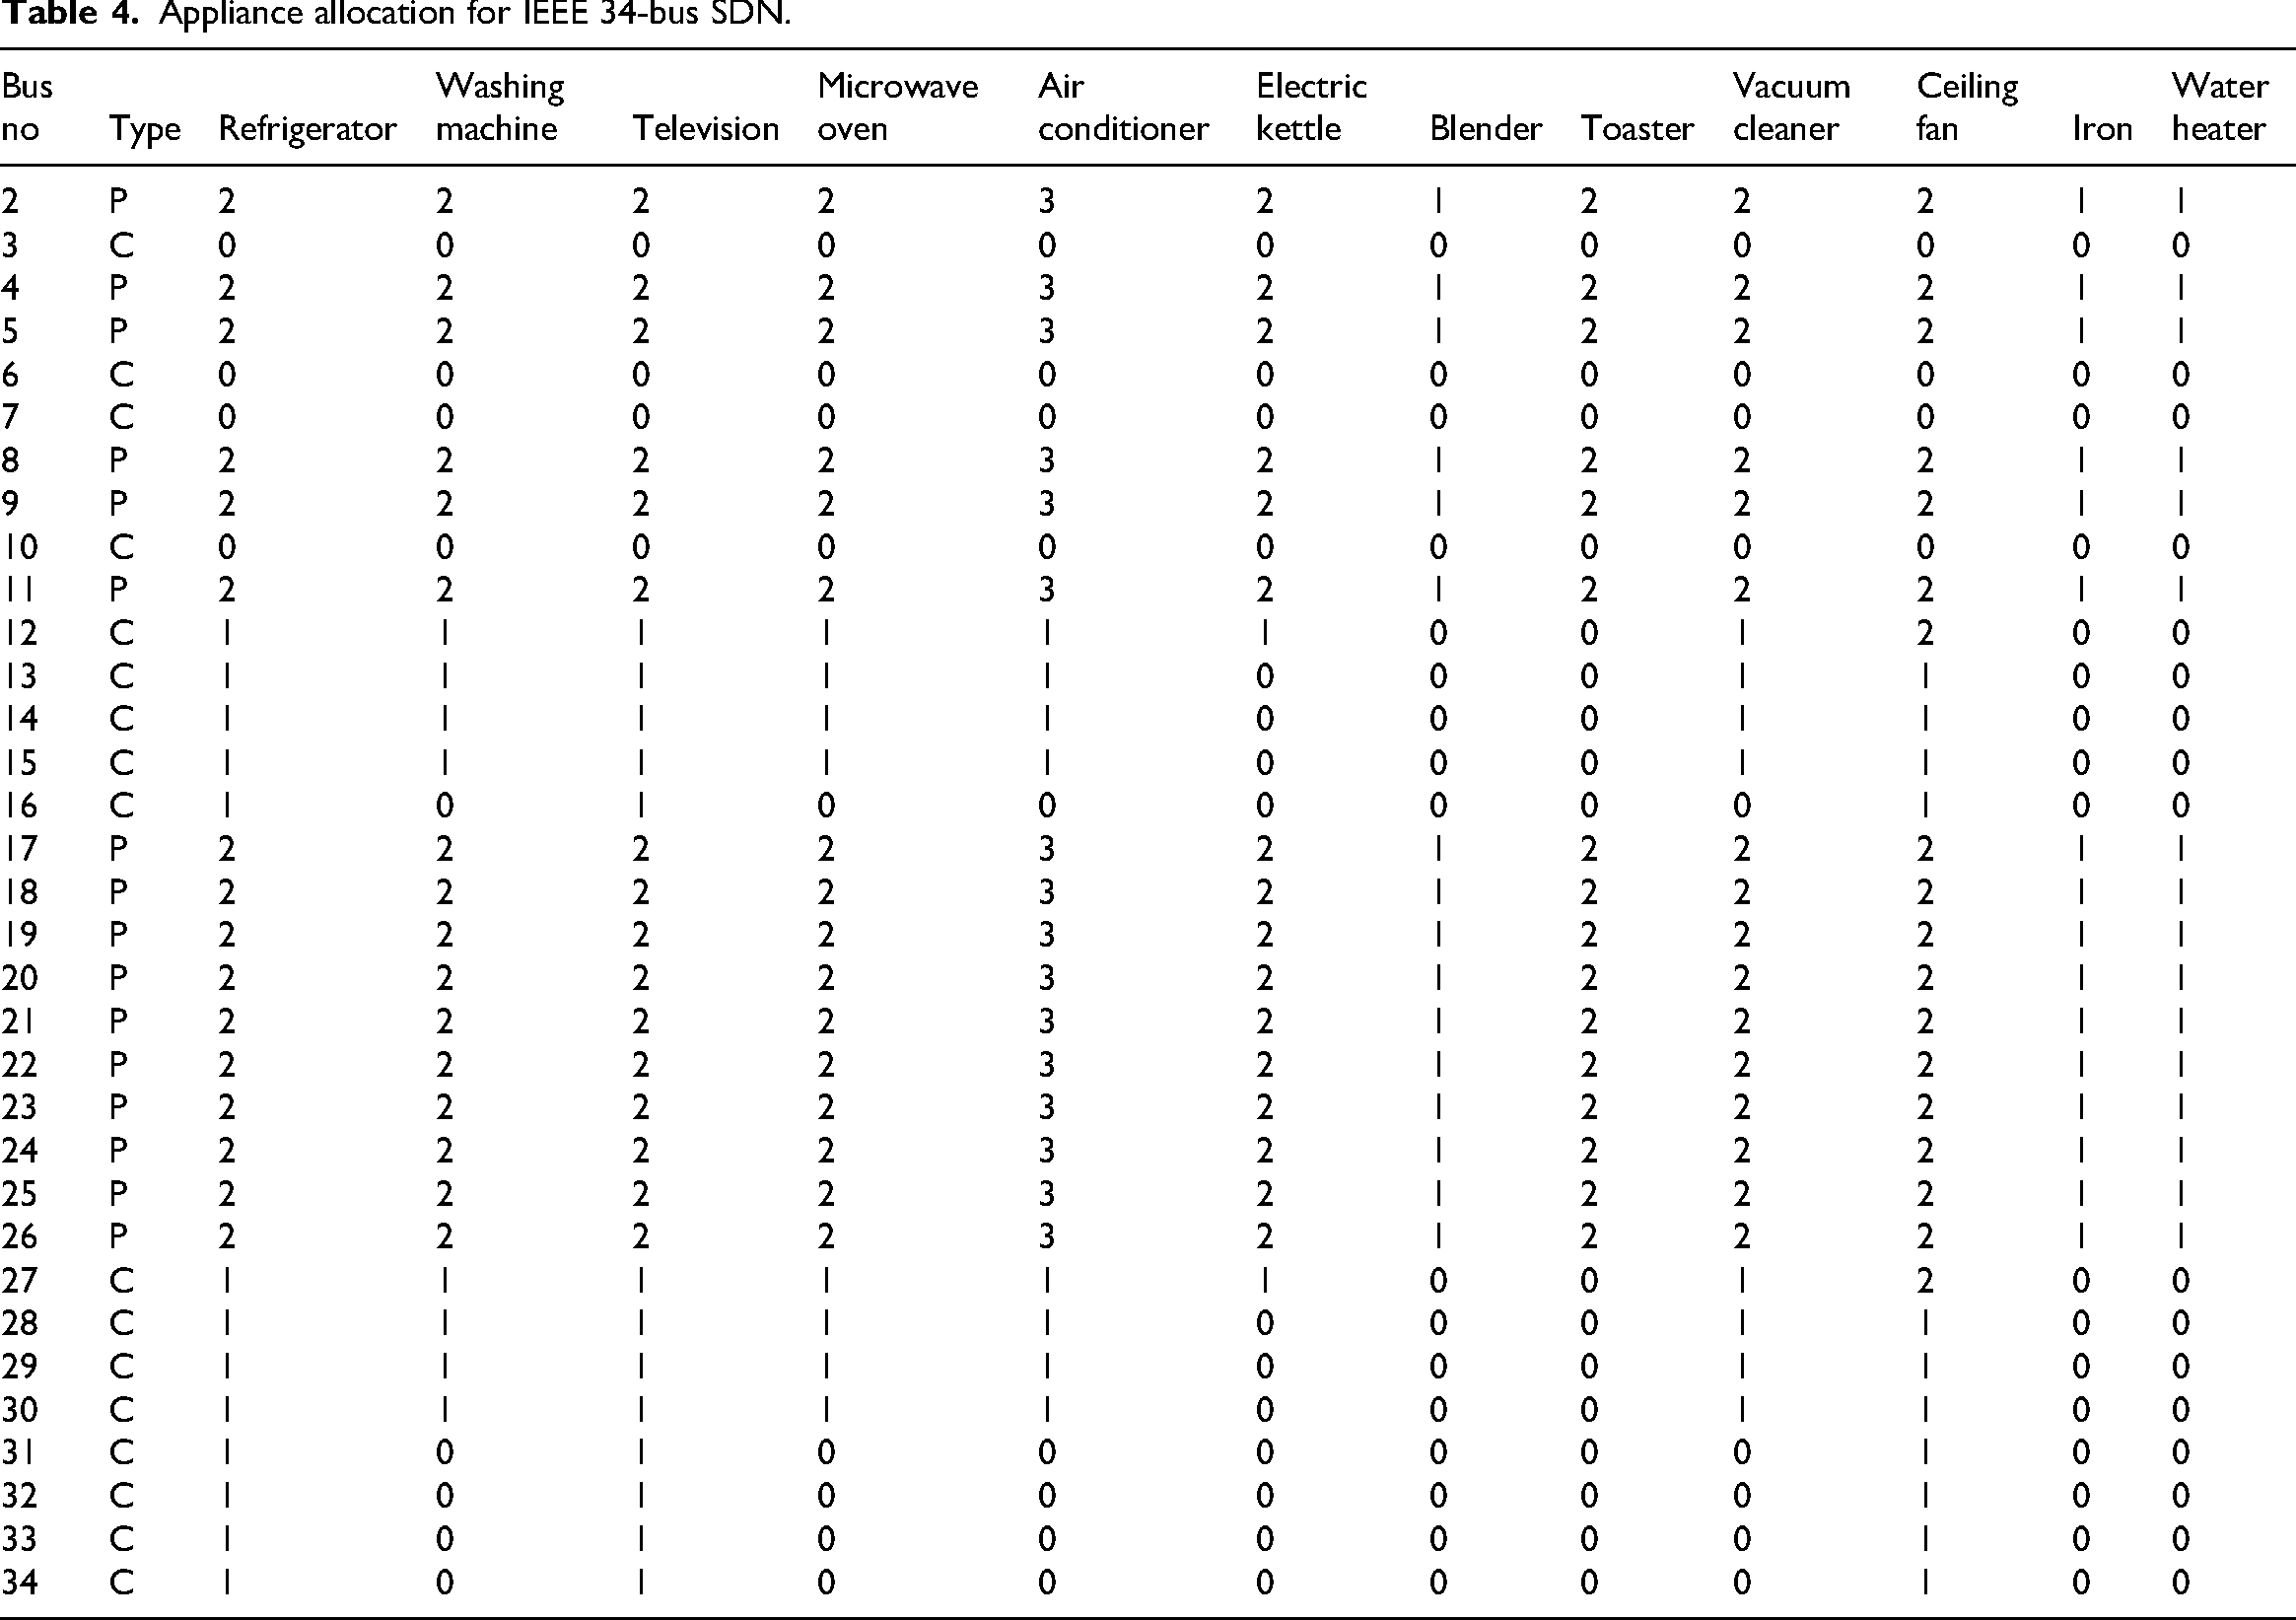
Figure 5 presents the hourly demand profiles of the Indian 28-bus SDN and the IEEE 34-bus SDN over a 24-h period. The demand for the Indian network is always high, since air conditioners, ceiling fans, and other afternoon equipment are in use, while its afternoon peak is representative of the Indian climate. Thus, the demands are at their peak from 12:00 to 18:00, reaching the maximum at 17:00 (225.48 kW). Peaks at 6:00, 8:00, and 9:00 in the morning can be attributed to water heaters, toasters, kettles, and washing machines. On the other hand, the IEEE 34-bus system shows almost a similar pattern with lower volumes and has a peak of 214 kW at 17:00. The minimum demand in both systems takes place at night with less than 7 kW. This comparative study develops a requirement for area-based load modeling for evaluating EMS performance and grid resilience.
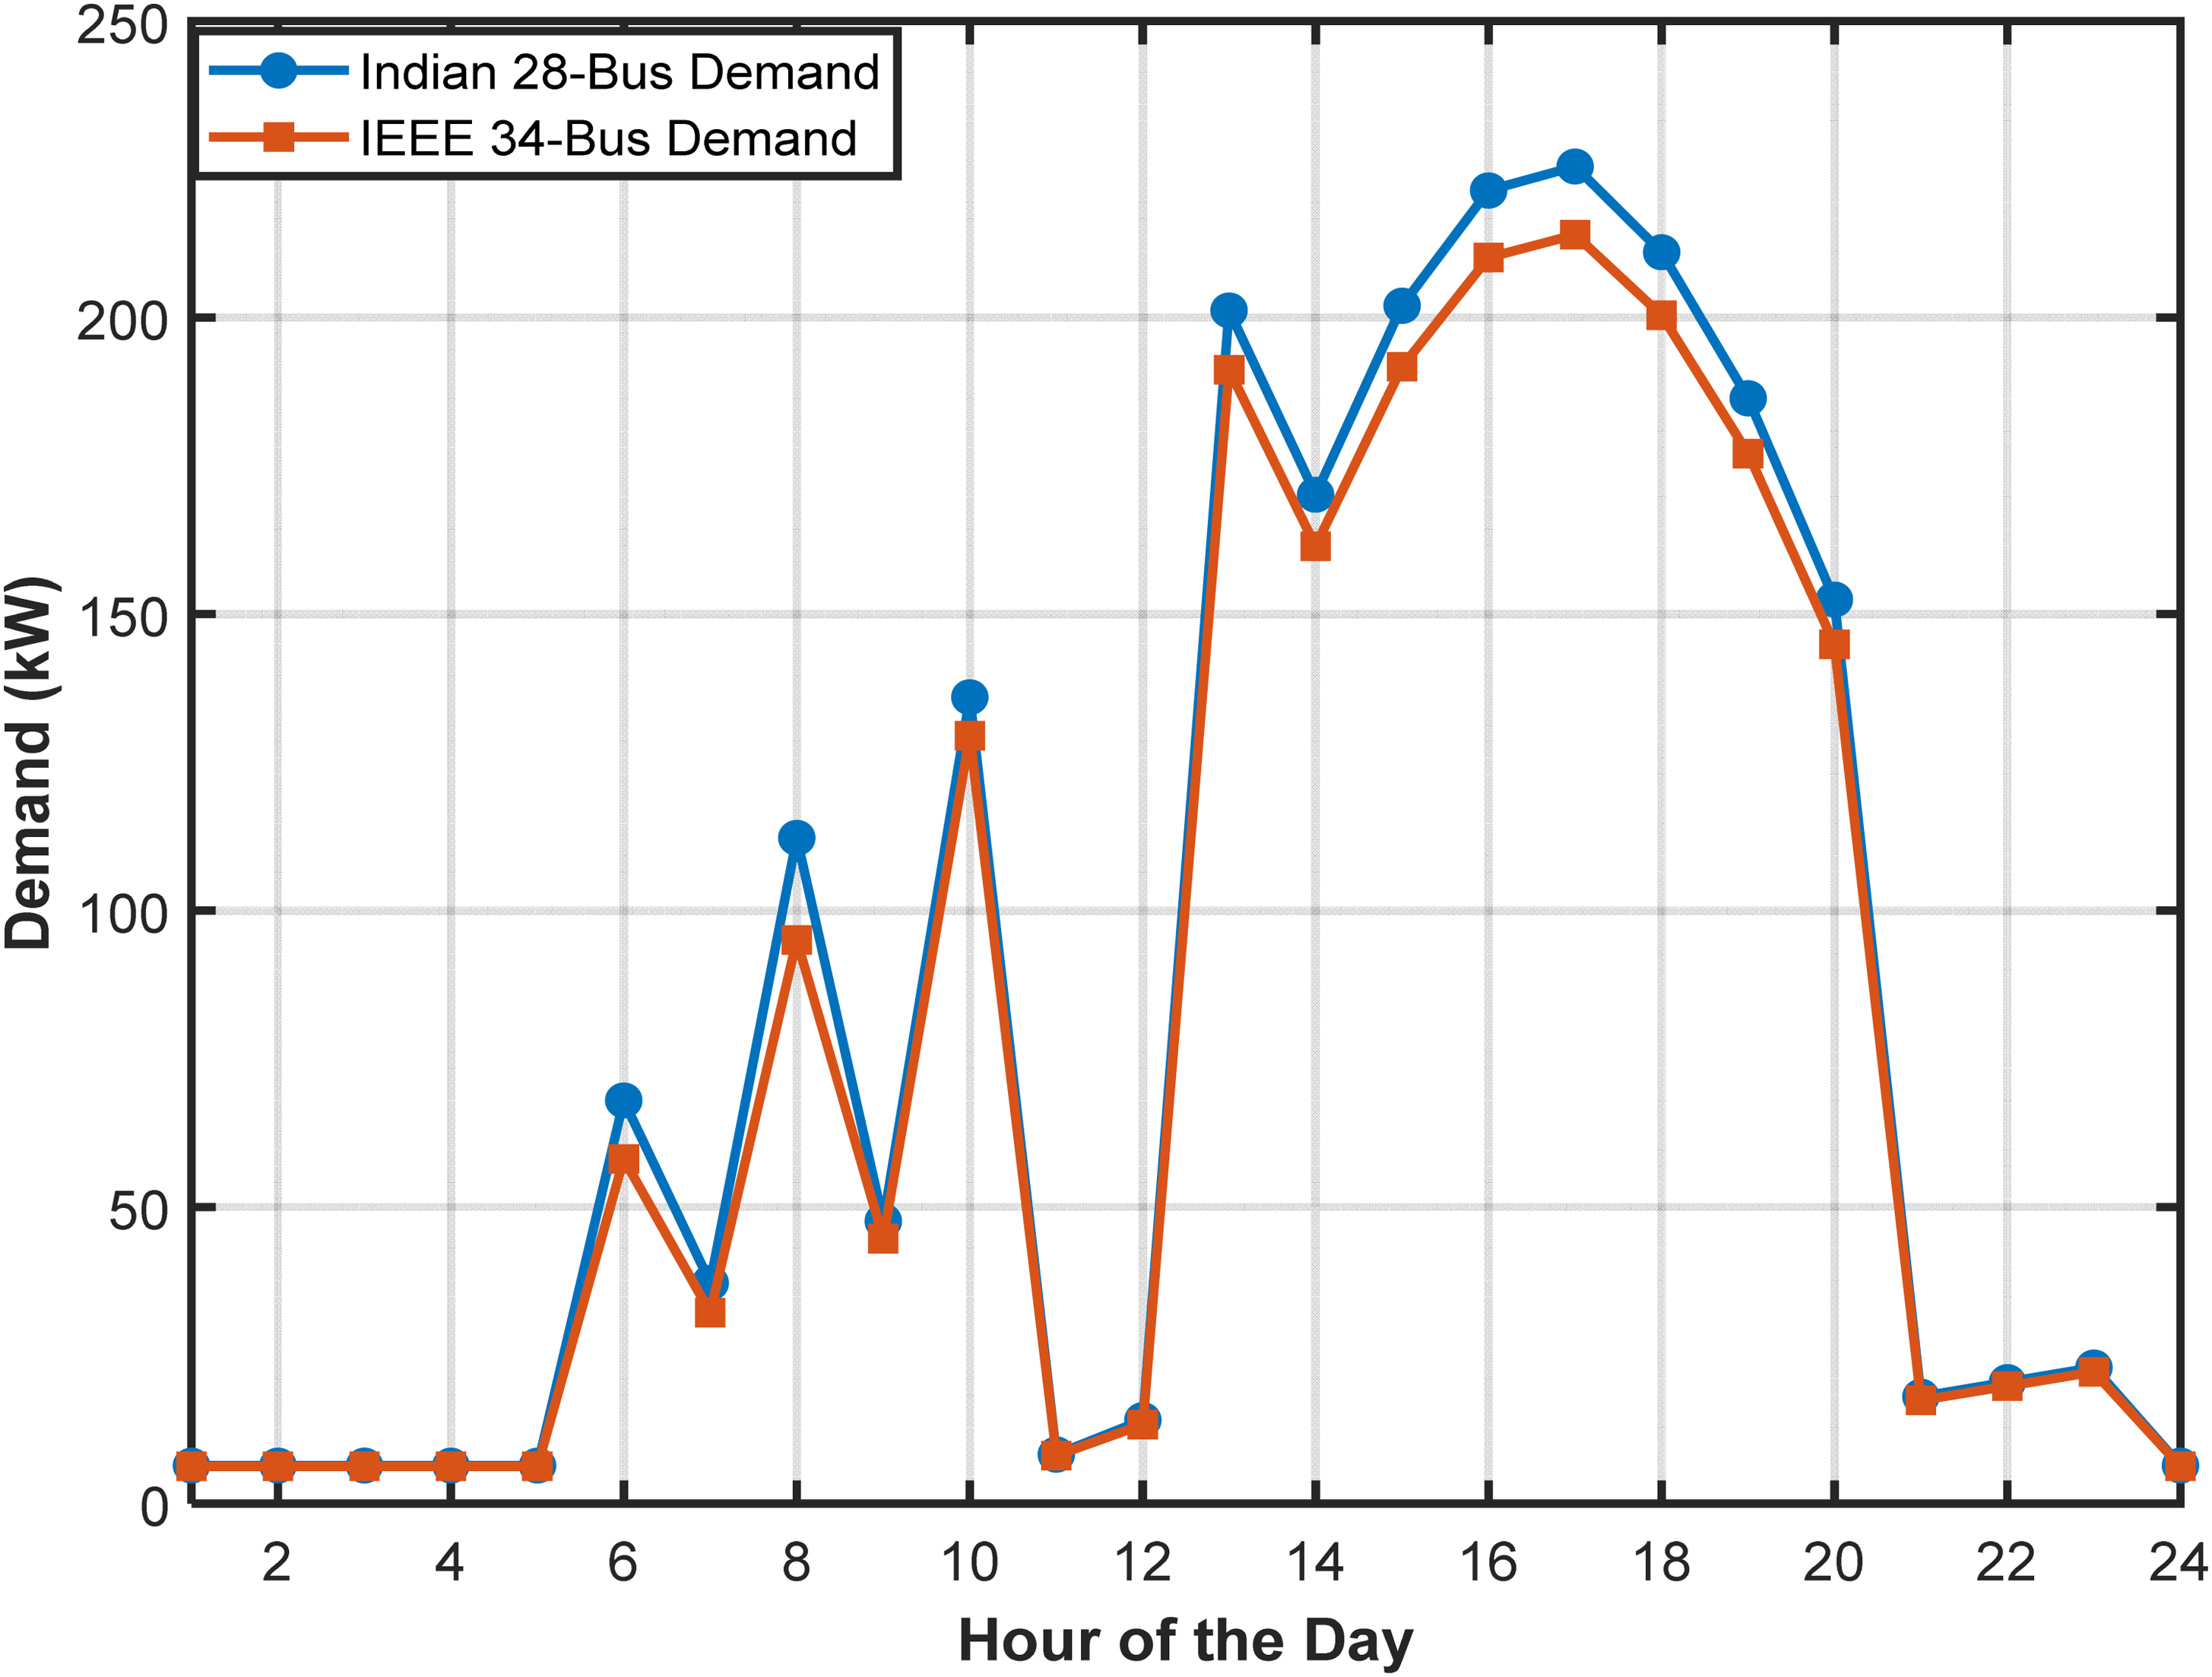
Hourly demand comparison: Indian 28-bus vs IEEE 34-bus SDN.
Renewable resource characteristics and system setup
The proposed HPOA-based energy management framework, designed for the residential market, prominently focuses on the optimization of device scheduling, renewable energy utilization, and dynamic tariff adaptation. The system integrates solar PV, wind turbines, BESS, and V2G-enabled EVs, considering the uncertainties in EV mobility behavior and variable renewable energy generation. The approach increases grid independence, reduces operating costs, and enhances the resilience of the practical Indian 28-bus RDS and the industry-standard IEEE 34-bus SDN. For realistic system performance, the technical specifications of PV, WT, BESS, inverters, and EVs have been borrowed from accepted standards and scrutinized literature (Yuvaraj et al., 2025b). For uniformity in describing renewable resources, the same RES datasets are utilized in both SDNs. Located at NASA's Climatic Data Centre in Kaktwip, West Bengal (21.63°N, 88.20°E), the 28-bus RDS (Yuvaraj et al., 2025b) provides profiles of ambient temperature, wind speed, and solar radiation. In this coastal area, the favorable wind pattern along with the received average solar radiation of 5.6 kWh/m2/day shows a considerable amount of potential for residential renewable energy. The required PV and WT capacity was selected based on residential demand requirements. Ten 5 kW PV units and ten 5 kW WT units are used to install 50 kW solar and 50 kW wind capacity for households in the 28-bus RDS. For methodological consistency, the IEEE 34-bus SDN uses the same cluster sizing strategy for each cluster. While small clusters use scaled installations, large clusters use proportionally larger capacities. The HPOA framework combines real RES data, realistic residential device modeling, and optimal hybrid DER sizing to propose a reliable and flexible energy management solution for contemporary residential distribution networks.
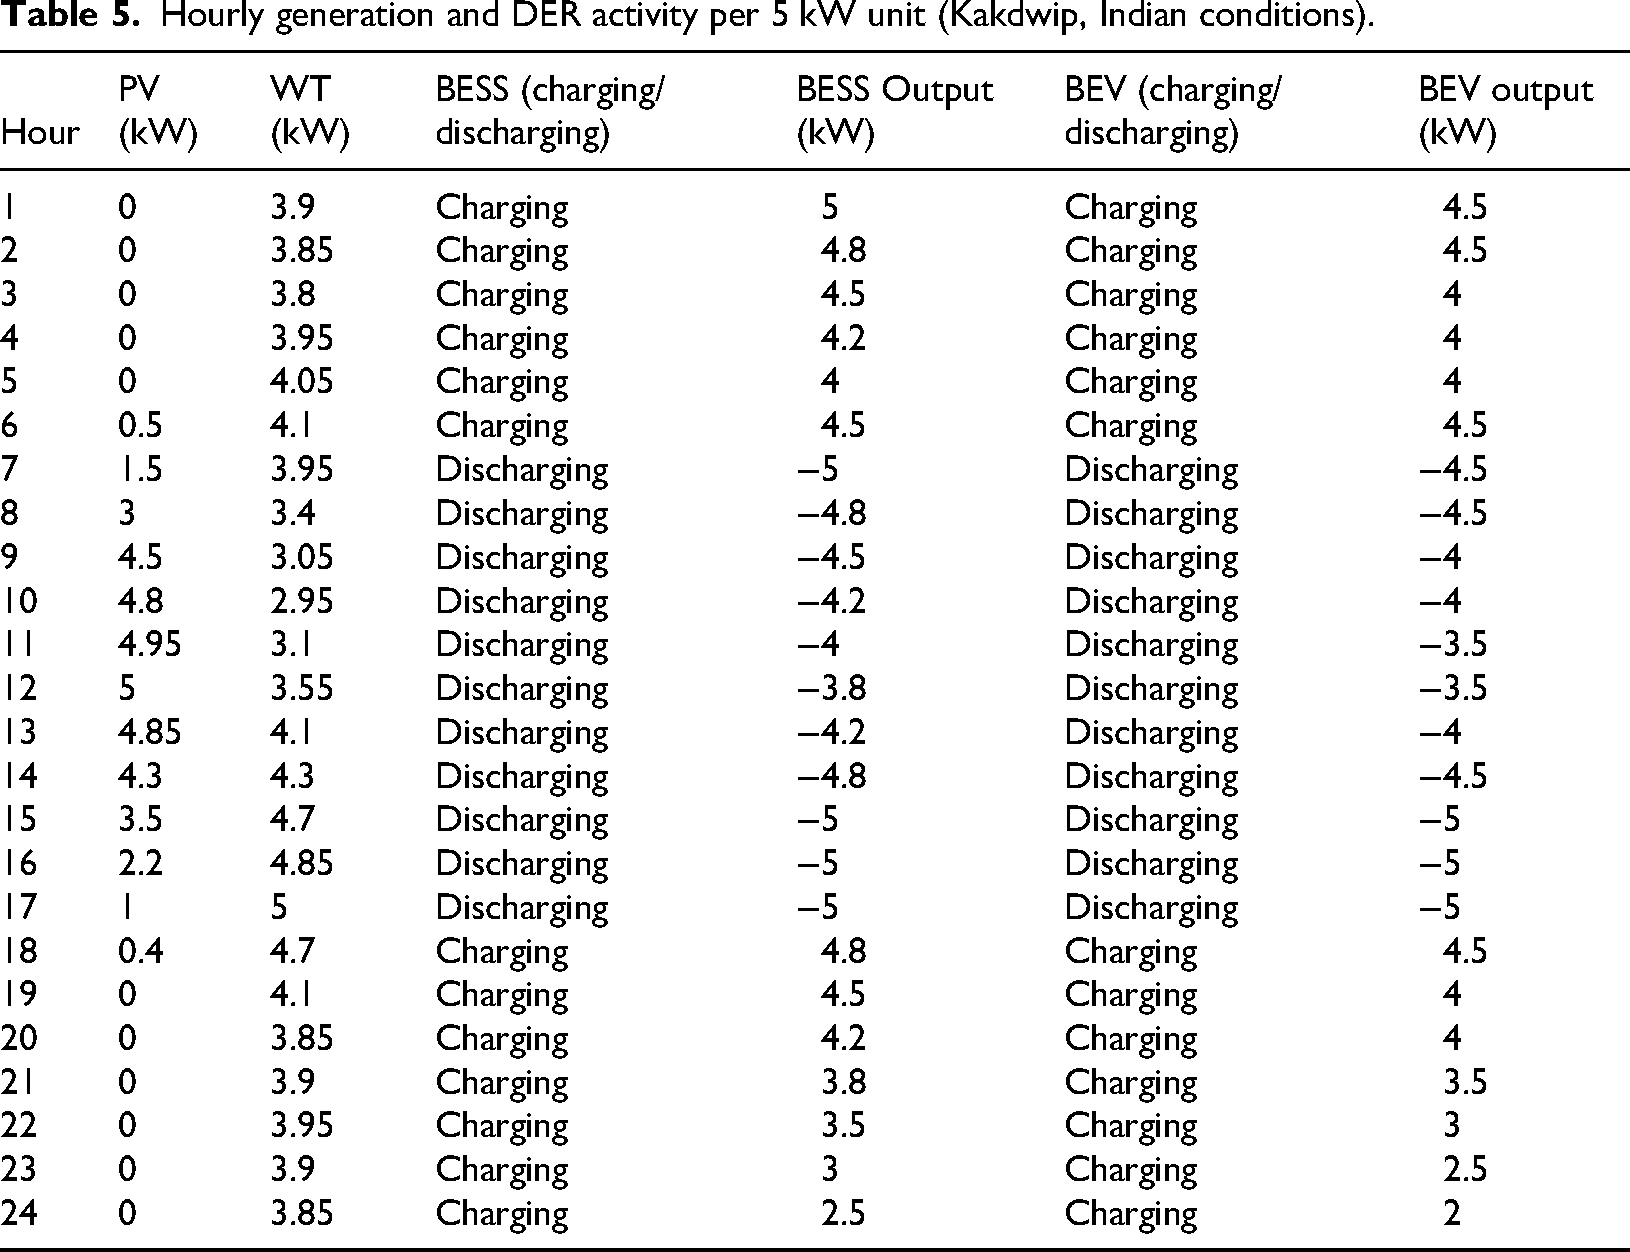
The hourly generation and operating characteristics of residential DER units (PV, WT, BESS, and BEV) designed for renewable scenarios in Kaktwip, West Bengal, India are shown in Table 5. The PV output reflects the tropical solar energy pattern of the region, with zero nighttime generation, a sharp increase after sunrise, around 5 kW at noon, and a gradual decrease in the evening. The coastal wind pattern is reflected in the WT generation, which has high values during the day and moderate nighttime winds. While BEVs charge at night and provide controlled V2G support during peak hours, the BESS operates in a cost-effective manner, charging during the night when demand is low, and discharging during the morning, afternoon, and evening peak hours. Based on bus-level installations, all values are equivalent to the unit and can be combined. To improve residential dependency flexibility under HPOA-based EMS, intermittent RES generation is balanced with the help of storage and V2G support, as shown in the line plots for PV/WT and bar plots for BESS/BEV in Figure 6.
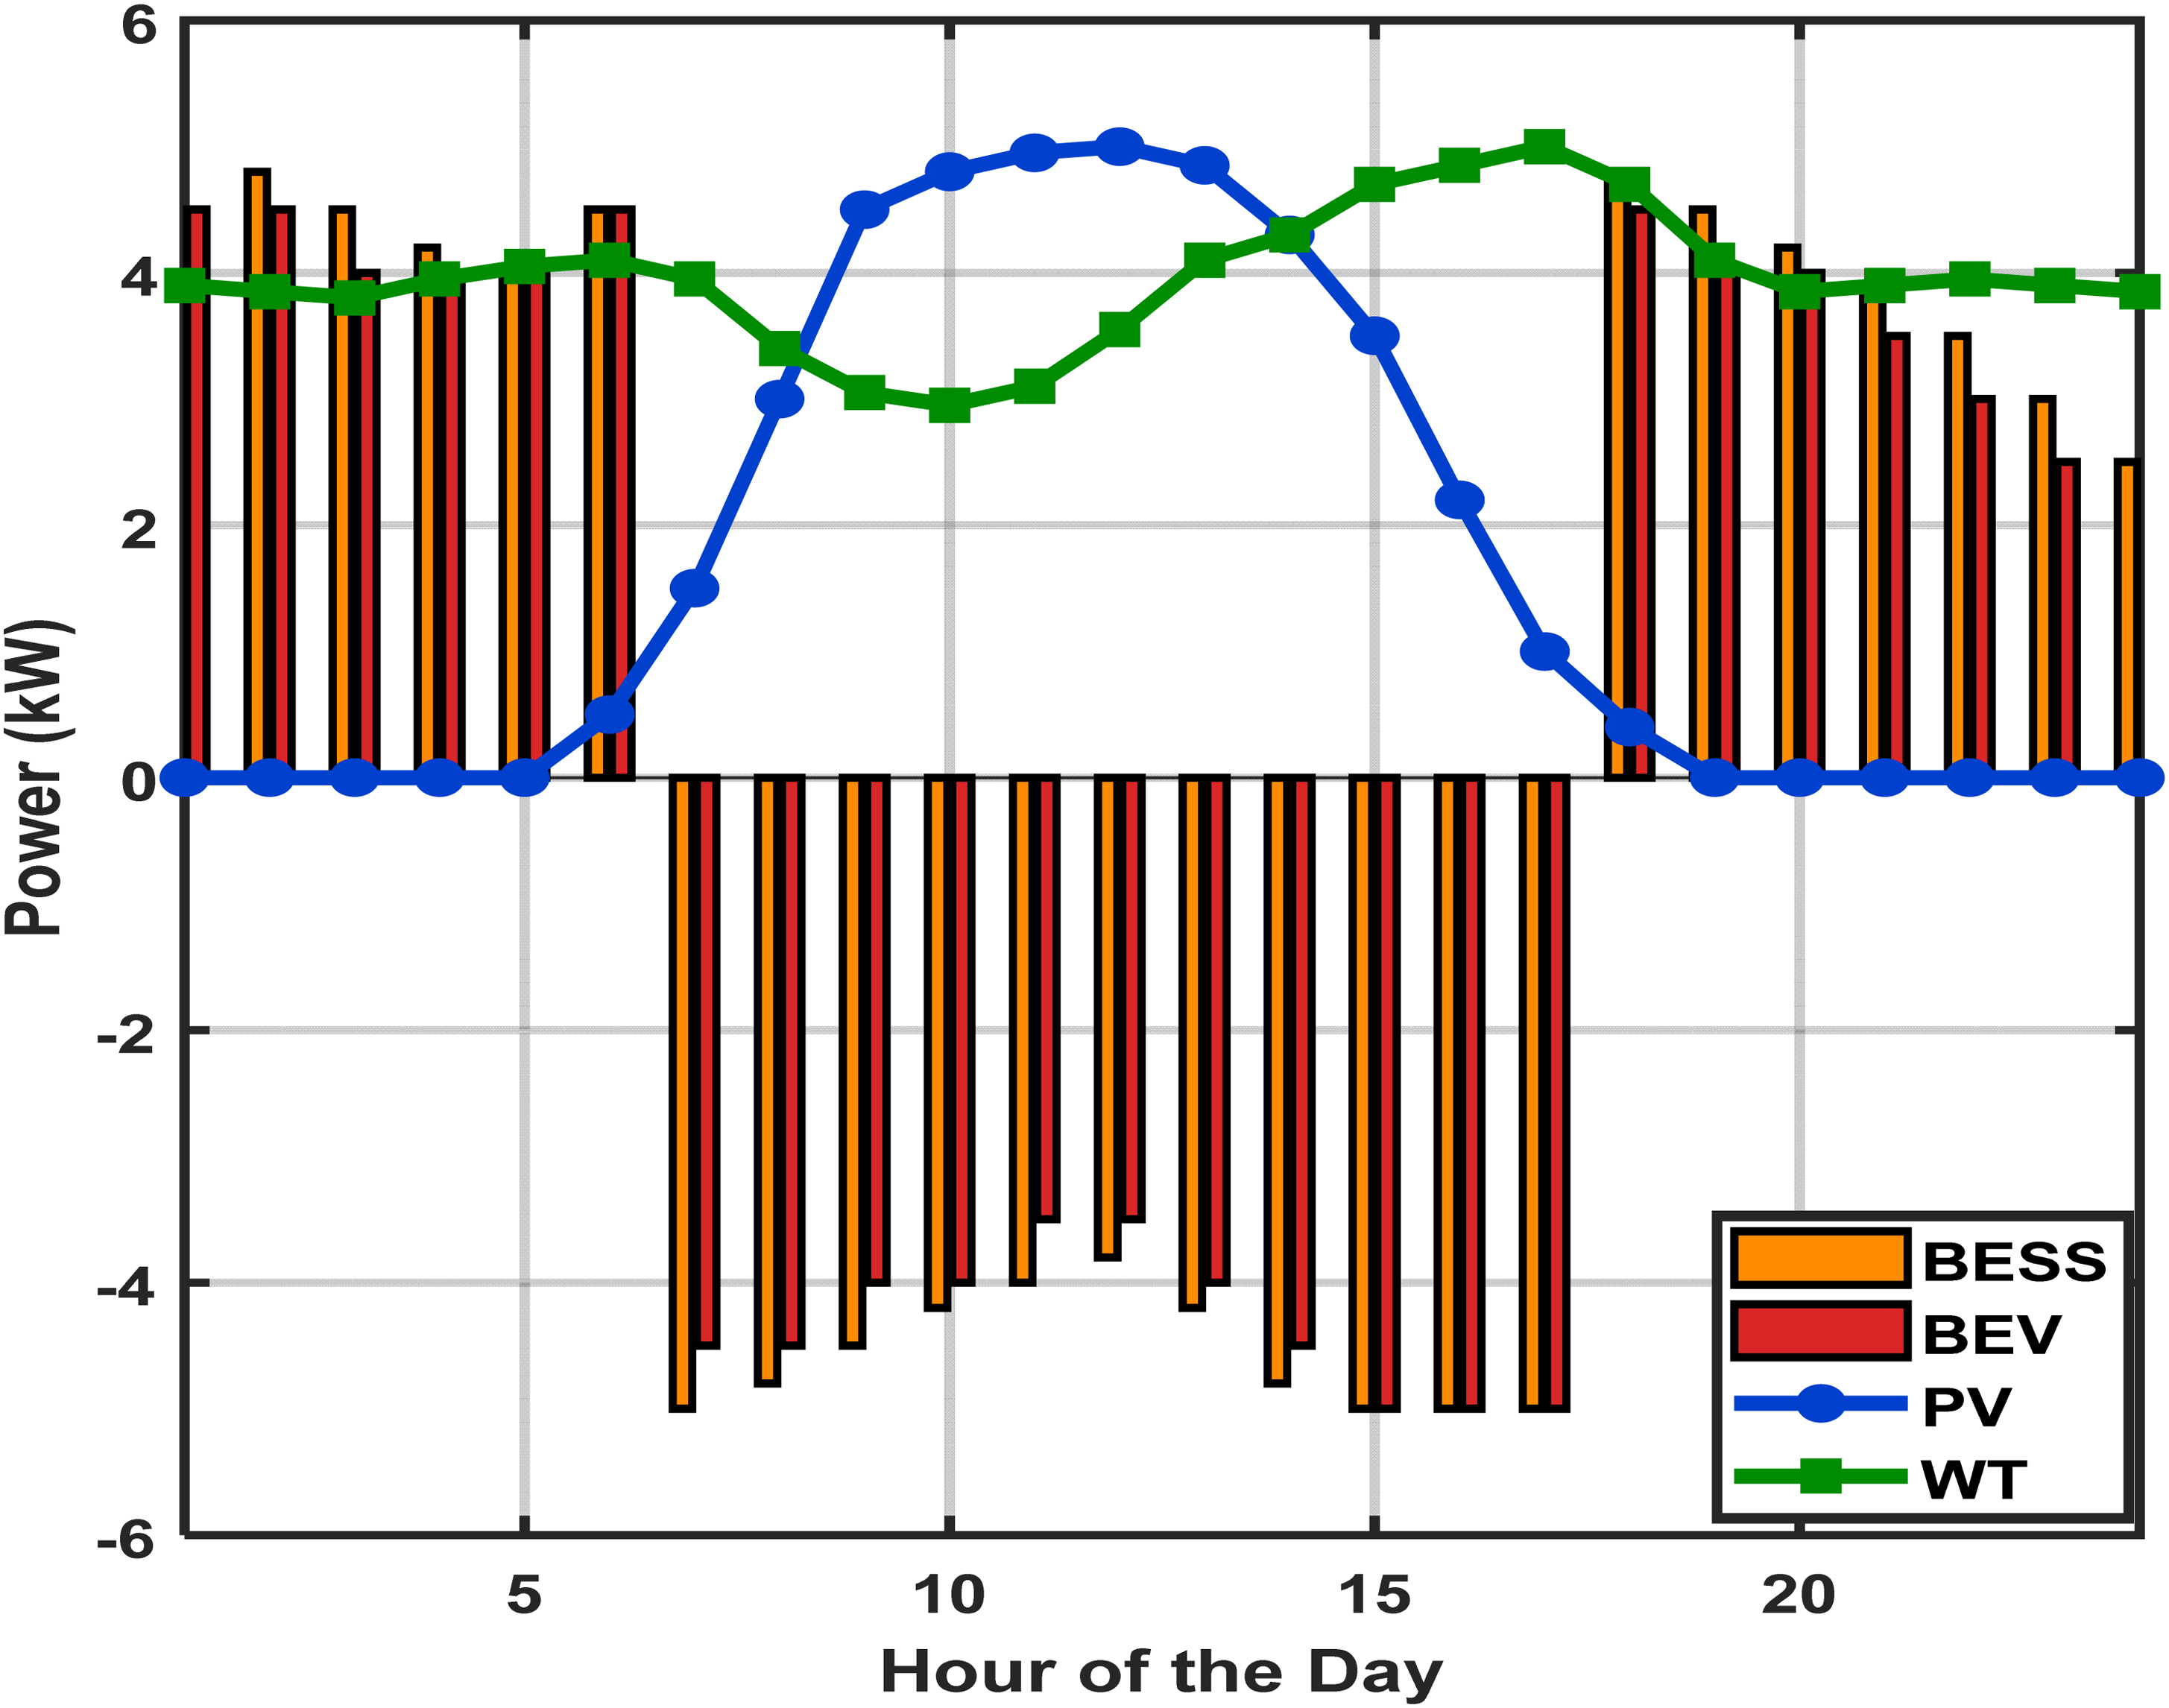
Hourly DER activity per 5 kW unit (Kakdwip residential conditions).
Hourly generation and DER activity per 5 kW unit (Kakdwip, Indian conditions).
Scenario-based results
This study evaluates the proposed MG formation and resilience enhancement strategy under three postfault operating scenarios for both distribution test systems:
Faulted and cyber-attacked SDN without MGs; Faulted and cyber-attacked SDN with MGs; Faulted and cyber-attacked SDN with MGs and TLs.
This system is subject to multiple simultaneous failures occurring at different points throughout the network, reflecting realistic extreme events. These failures are similar to widespread failures caused by combined cyber-physical attacks or natural disasters. In system diagrams, failed nodes are marked with red markers. These nodes put the network into islanded operation for a whole day by cutting off the SDN upstream application from the supply. The proposed HPOA-based architecture minimizes the scenarios and sets appropriate resilience parameters by selecting the best options of DER integration, MG clustering, and secure control functions. Each of the scenarios tests the MG generation strategy's ability to maintain voltage stability, enhance supply adequacy, and manage cyber-physical failures in case of multiple failures. Based on comparative analysis, there is a great loss of load and lower recovery efficiency when MGs are not present. MGs contribute significantly to local supply continuity by enabling healthy zones to operate autonomously. Additional enhancements occur at the time when MGs are interconnected through TLs, due to which nearby MGs can share power and increase the possibility of overall reconfiguration. These results testify to the effectiveness of integrated MG generation and DER planning in enhancing resilience against multiple faults and cyberattacks.
(i) Scenario-I (Faulted and Cyber-Attacked SDN without MGs)
(a) Indian 28-SDN
Scenario-I depicts the Indian 28-bus SDN under various fault scenarios, without the employment of the MG deployment as a resilience tactic, as depicted in Figure 7. The buses 1, 5, 8, 11, 17, and 22 are considered as fault locations, leading to the isolation of the entire system from the primary application supply. Importantly, nothing interesting is going on at play, and optimization techniques were used to look at the responses of the system in fault scenarios. Without the presence of MGs, the entire SDN strategy has to go without power for the whole day even after optimization. It highlighted the limitations of conventional optimization methods in the absence of any extra interventions of MGs. This scenario thus provides an essential base for the assessment of how good the MG strategies function in fault situations and presents the potential for system failure in the absence of resilience strategies or Sumer involvement.
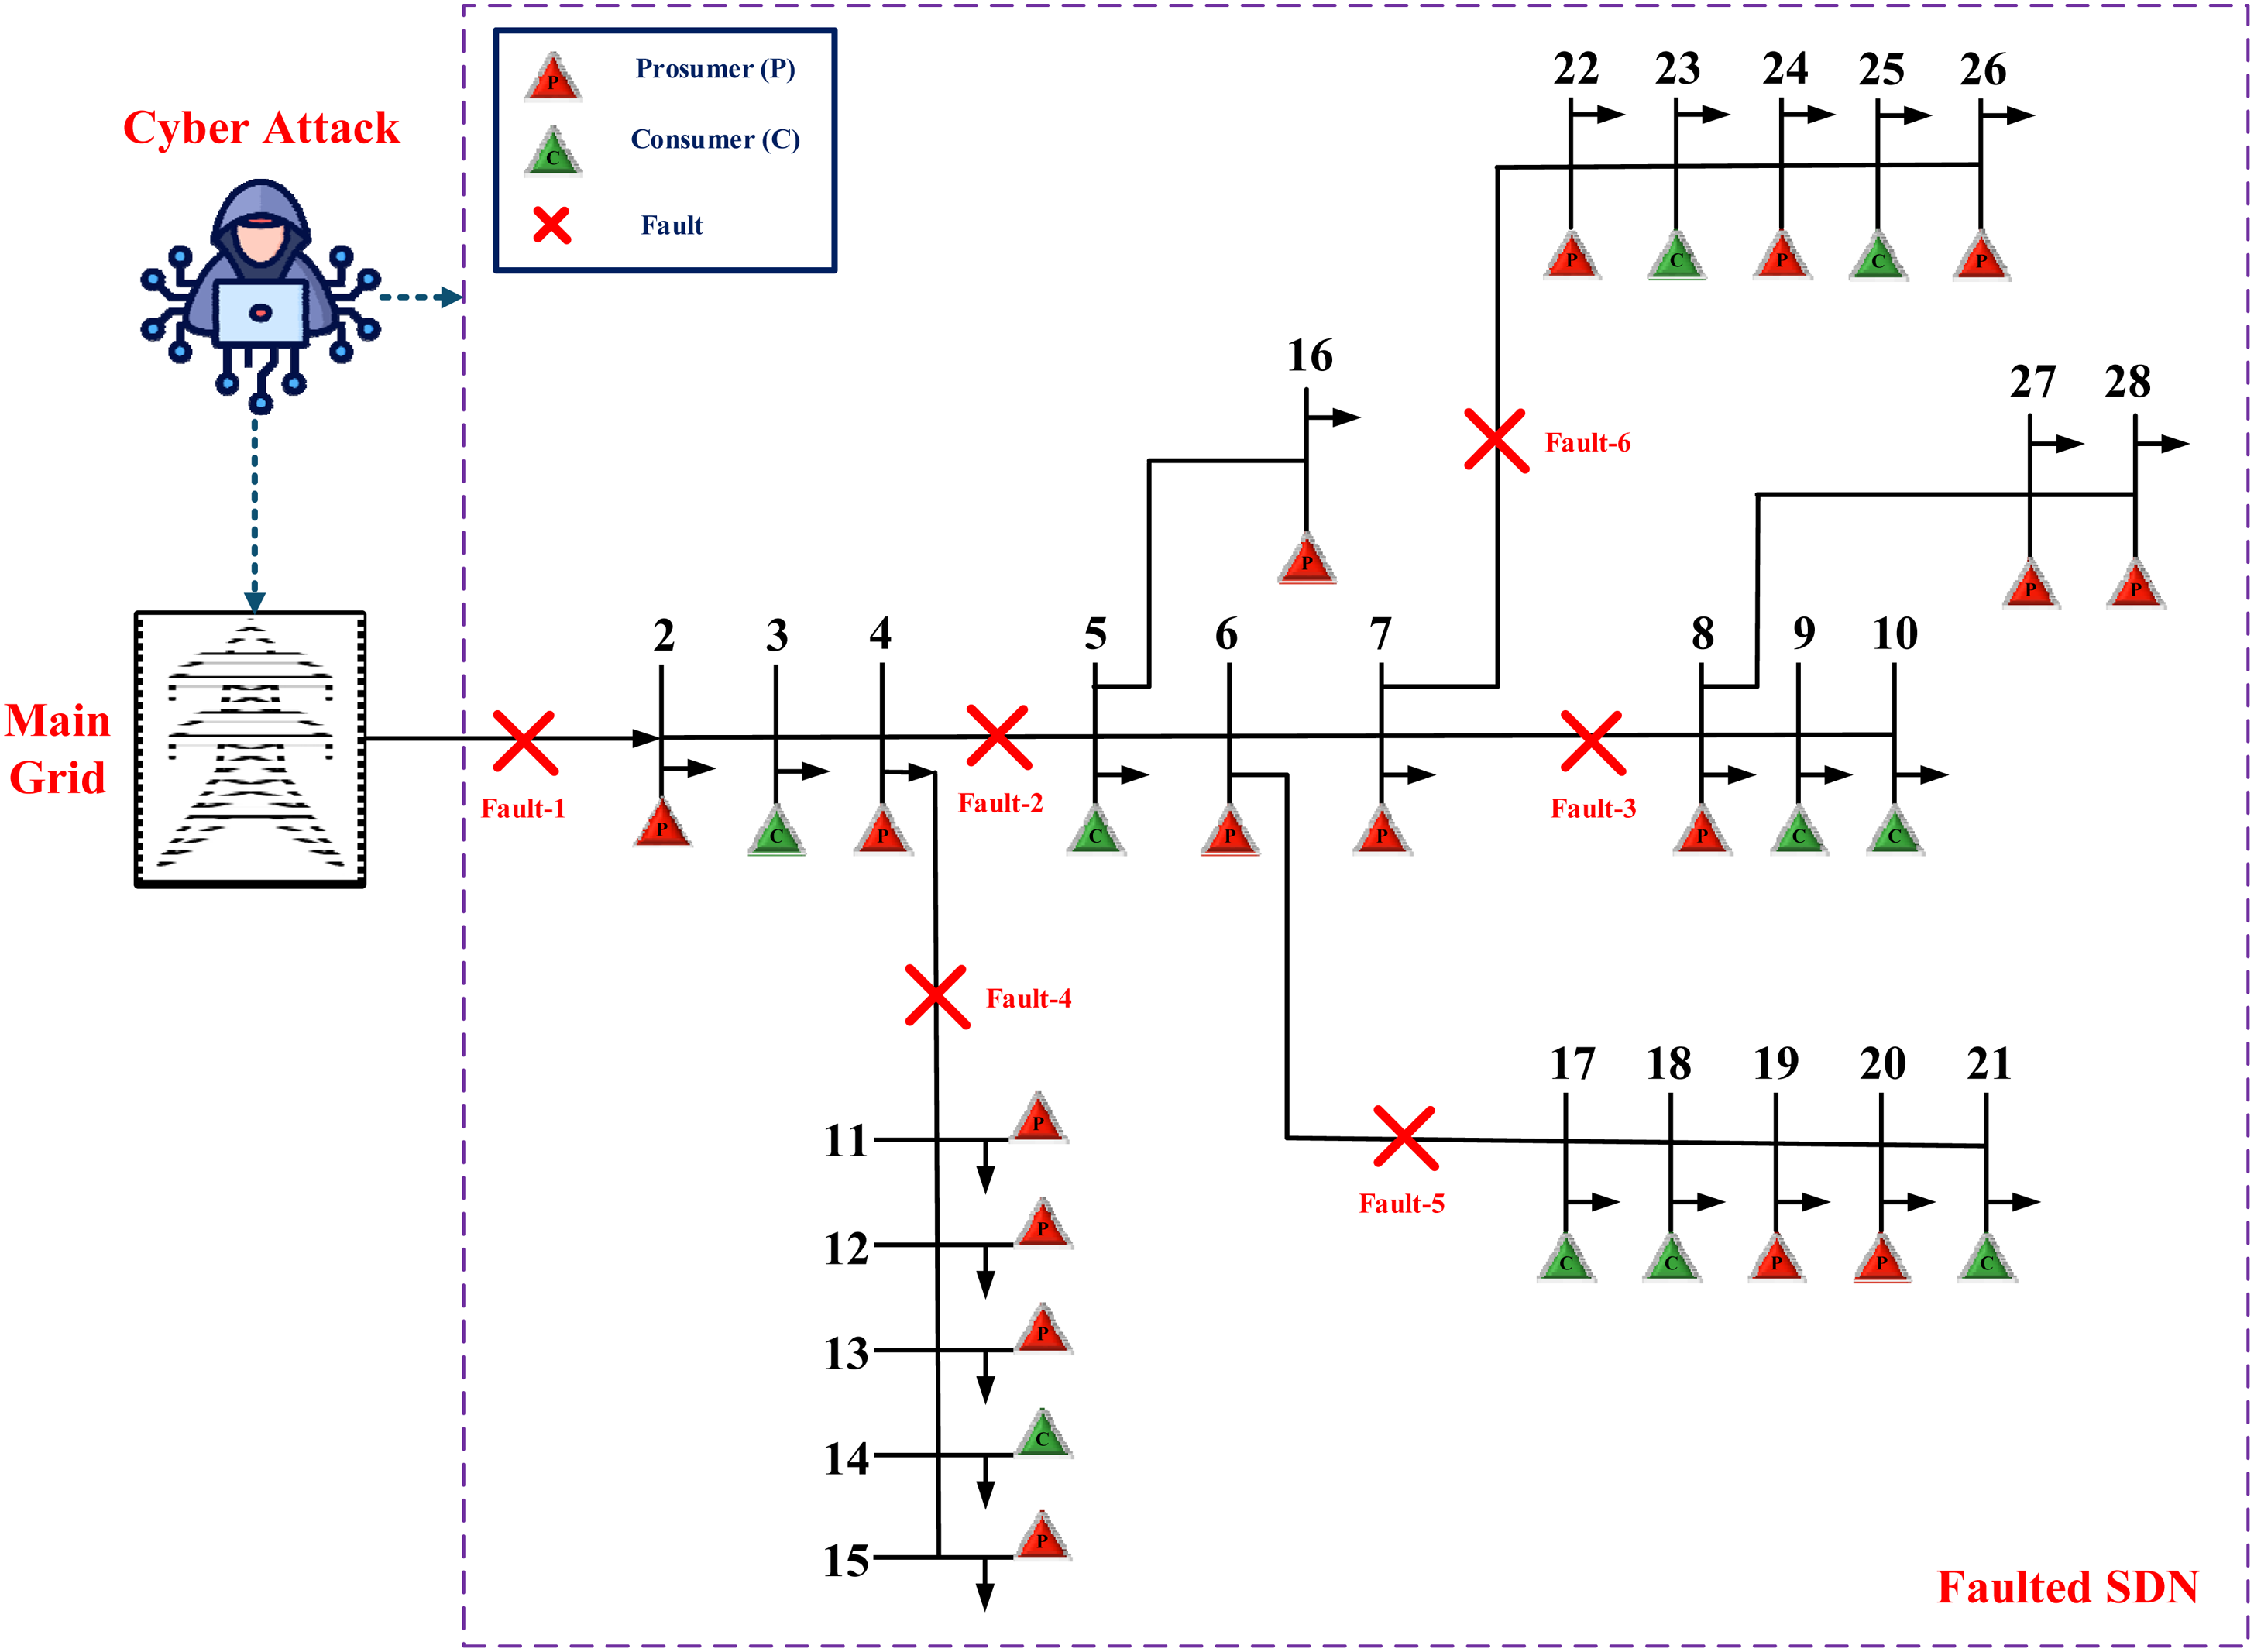
Faulted and cyber-attacked Indian 28-SDN without MGs.
Cyber-resistance parameters are evaluated under common assumptions taken for test cases in IEEE 34-bus SDN and Indian 28-bus RDS, decentralized test systems. This ensures cyber-physical disruptions to be modelled uniformly. The communication delay is set to 0.8 s to represent severe congestion and rerouting under coordinated cyber-attacks, with a delay constant of 2 s reflecting typical small-MG communication dynamics. To simulate DoS-style disruptions, a packet loss ratio of 0.30 is assumed, and an attack severity factor of 0.40 represents moderate to highly adverse disruption. A security overhead fraction of 0.02 is taken into account for the authentication procedures performed by lightweight IDS and local controllers. Equal weighting factors of 0.25 are used for all cyber-cost components, and a typical computer base power of 100 kW is used. Hourly load values are extracted from the corresponding resilience table of each test system. By using the same cyber assumptions for both networks, the proposed EMS architecture can be continuously evaluated and the resilience behavior can be fairly compared under the same cyber-physical stress conditions.
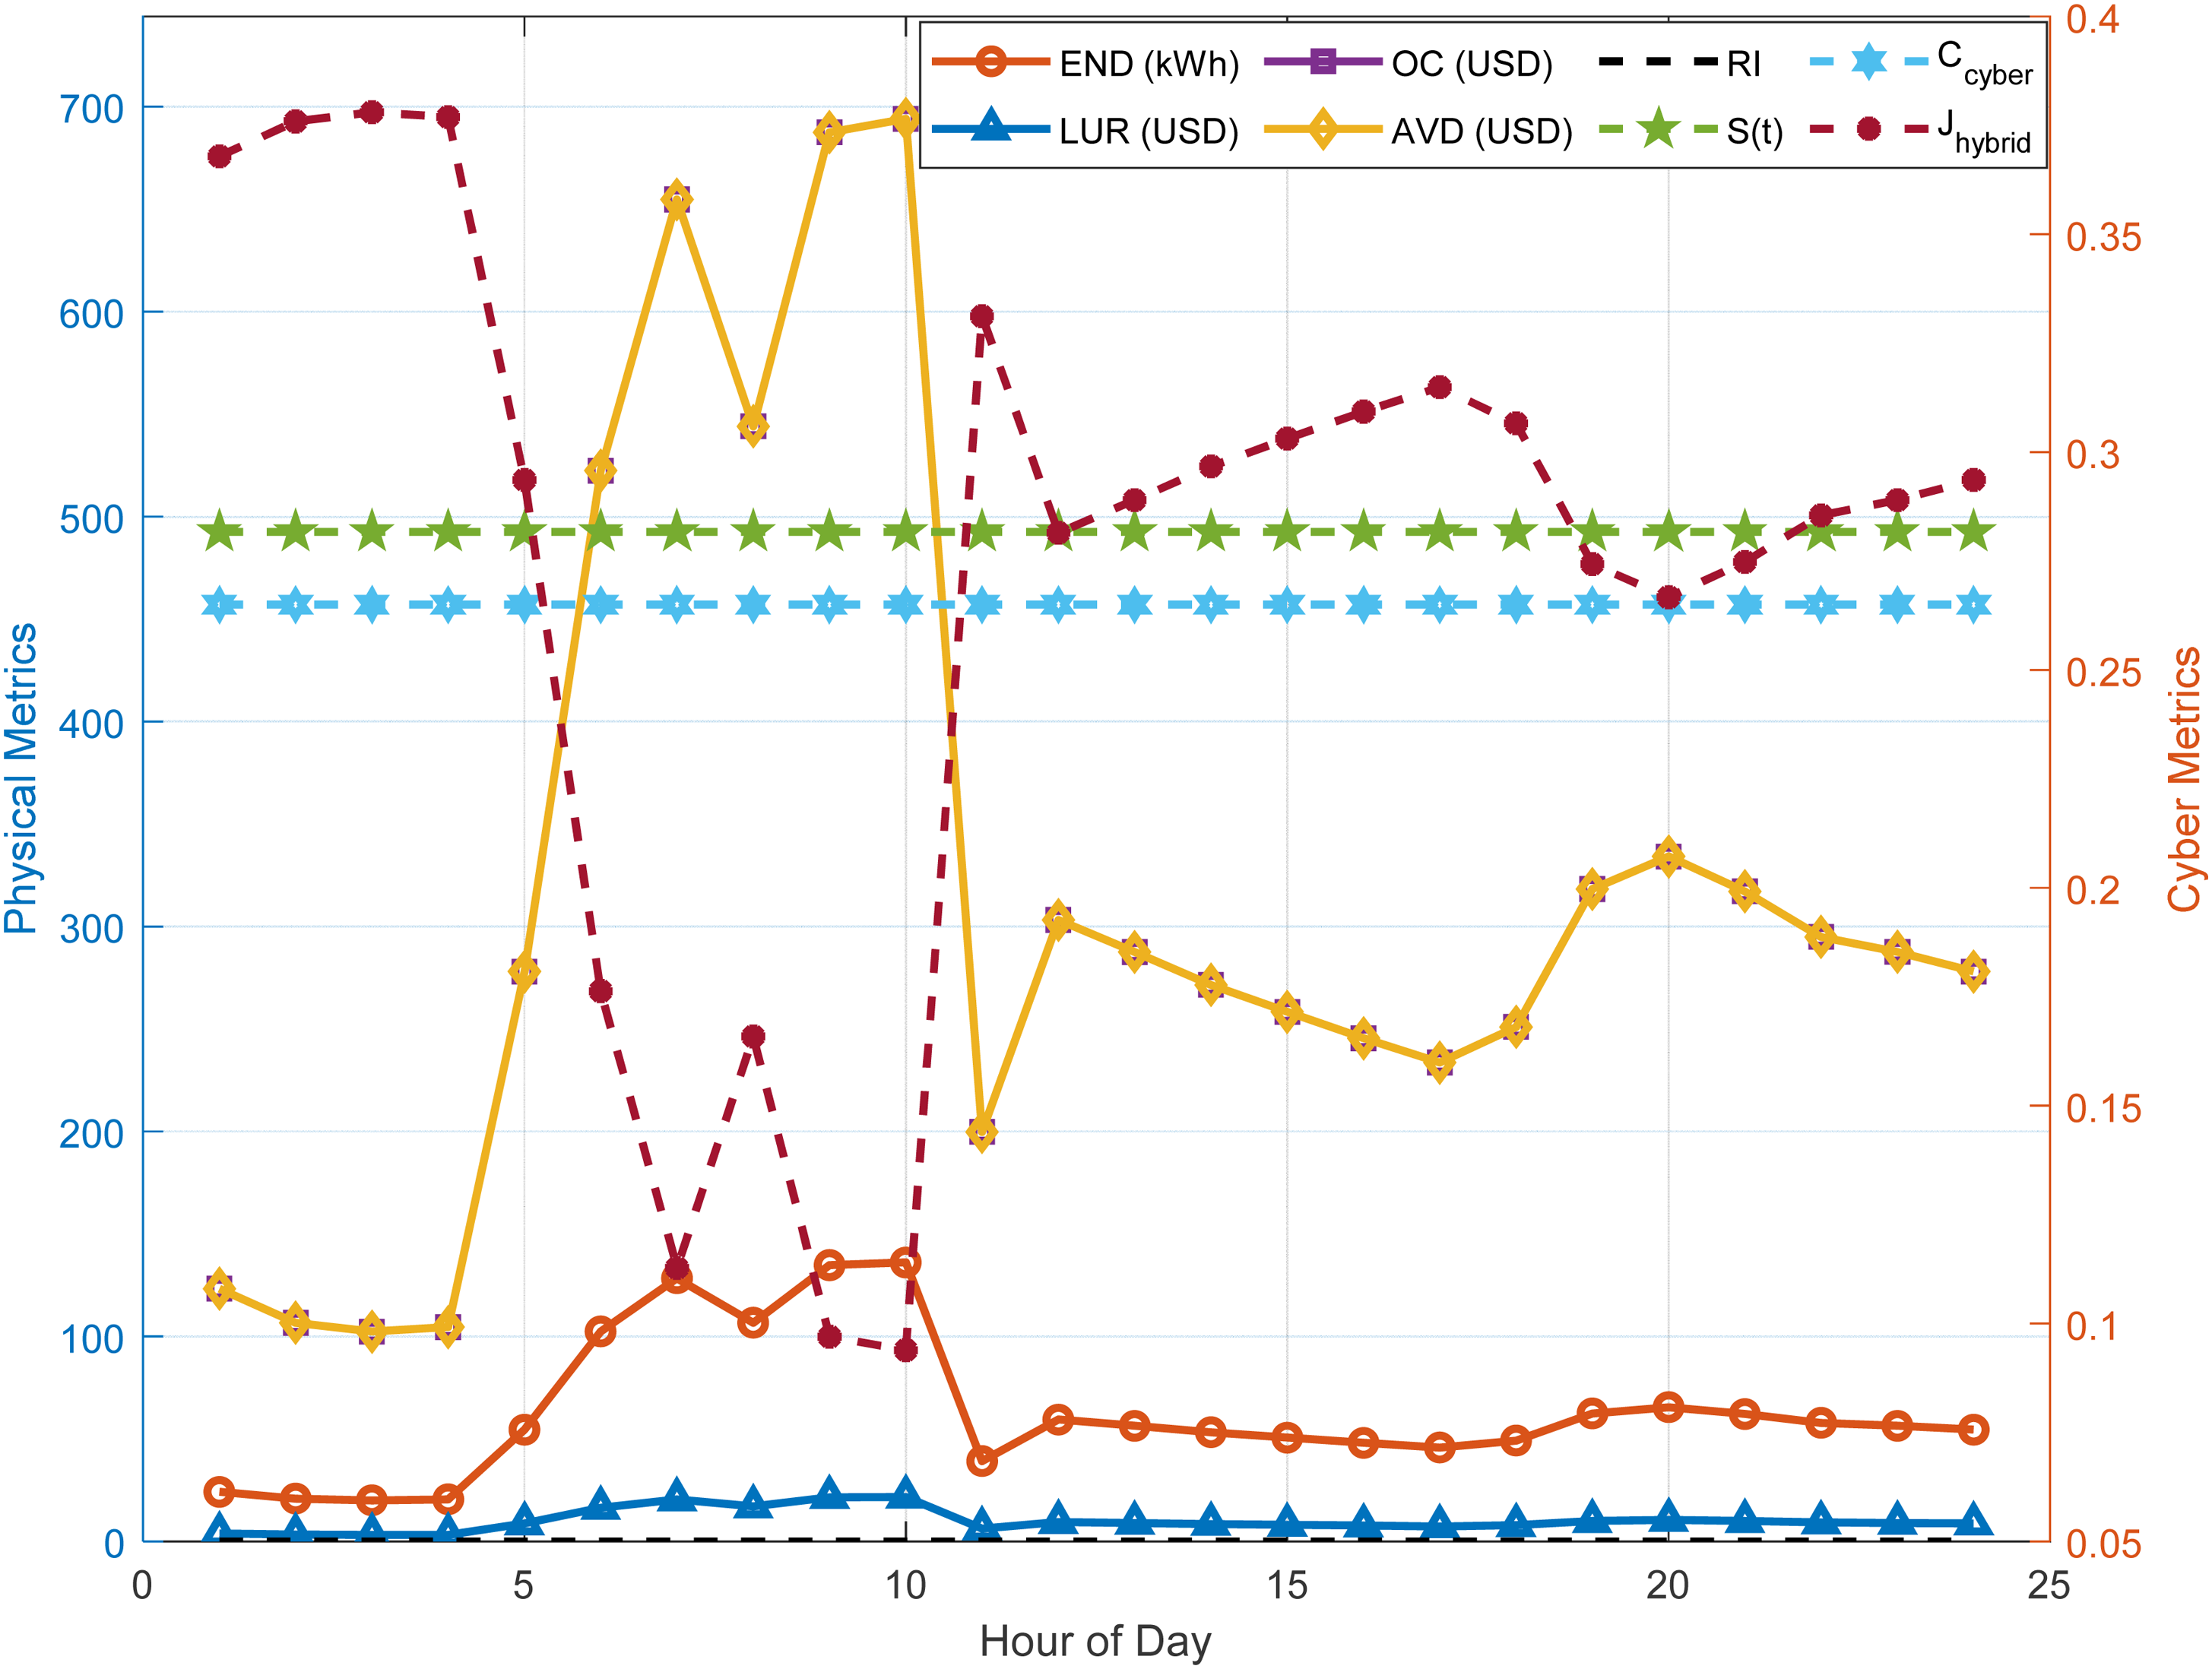
The hourly cyber-physical resilience parameters of the Indian 28-bus SDN, under scenarios where multiple MGs, prosumers or DER-based recovery systems are not available, are shown in Table 6 and Figure 8 in Scenario-I. After multiple critical buses experience simultaneous outages, the network is completely disconnected from the primary utility supply, resulting in significant power shortages throughout the day. Significant unmet demand during the midday residential peak indicates the highest END, reaching approximately 136.08 kWh at 10 h and 134.80 kWh at 9 h. The related economic impacts also follow the same pattern: uninterrupted power outages in a residential-dominated network cause significant economic burdens, as evidenced by the sharp increase in OC and LUR at 9–10 h, with maximum values of 694.028 and 21.7734 USD, respectively.
Hourly cyber-resilience parameters of Indian 28-SDN (Scenario-I).
Hourly cyber-resilience parameters of the Indian 28-SDN (Scenario-I).
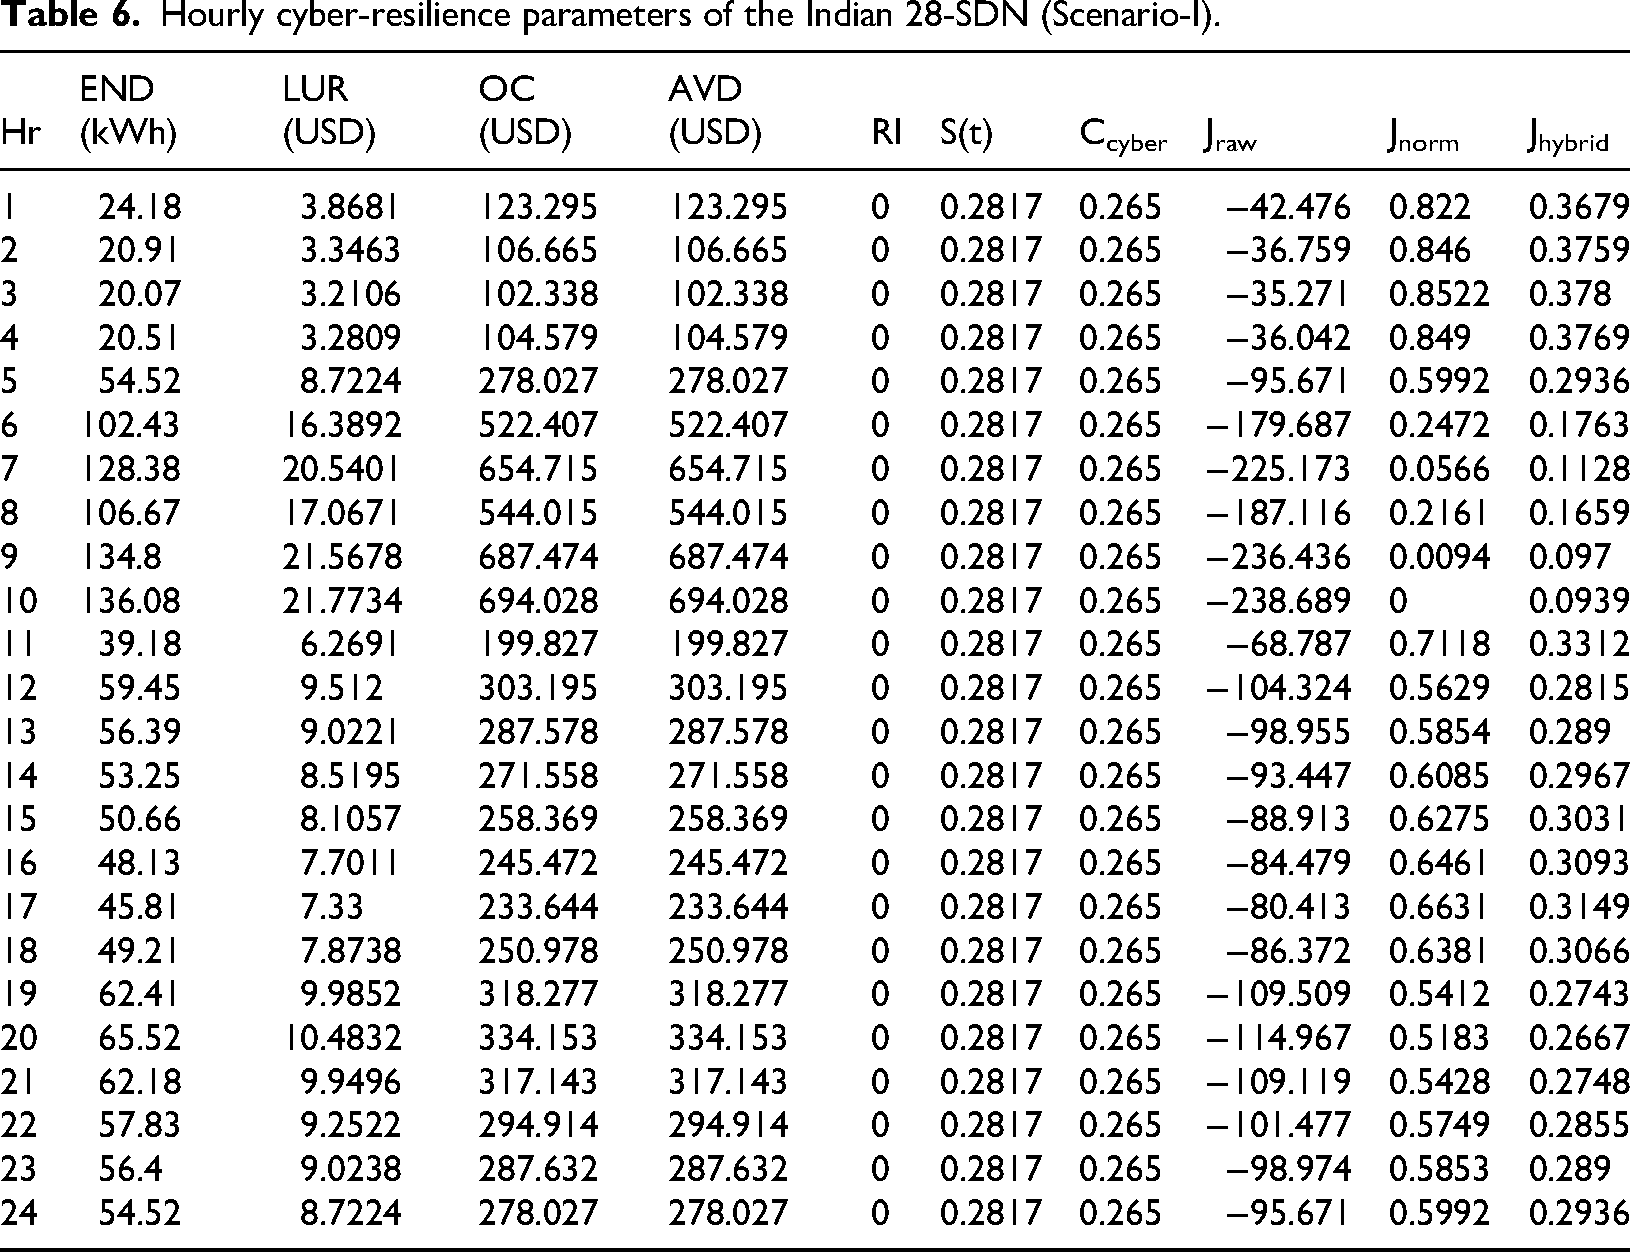
Since there are no MGs or Prosumers to provide local support or restored power, the physical RI remains zero during this period. Similarly, the cyber control success probability remains flat at S(t) = 0.2817 since all test scenarios use the same cyber-attack scenarios, which are characterized by high latency, packet loss, and attack intensity. Besides the increased outage losses, this continued cyber degradation results in a flat hourly cyber-cost that drives the raw objective function values to very negative levels, especially during afternoon hours when the system pressure is most acute. Normalized objective values remain moderate during night-time under low demand conditions but significantly degrade in the day due to massive economic losses. Results, in aggregate, unambiguously establish the Indian 28-bus SDN's vulnerability under Scenario-I and emphasize the need for MG deployment, prosumer intervention, and cyber-resilient EMS strategies to avoid disastrous power outages and economic collapse under conditions of multiple faults.
(b) IEEE 34-SDN
Scenario-I: An IEEE 34-bus SDN under various fault scenarios without the use of MG deployment as a resilience tactic is presented in Figure 9. In this case, buses 1, 7, 13, 17, 22, 28, and 31 are considered the fault locations, which will completely disconnect the system from the primary application feed. Importantly, there are no dependencies involved in this case, and the system response was analyzed under fault conditions by utilizing different optimization techniques. Without MGs, the complete SDN will go out for the entire 24-h fault period even after utilizing different optimization techniques. This highlights the shortcomings of traditional optimization approaches in the absence of any additional MG interventions. This serves as a very important benchmark demonstrating how well MG strategies perform under fault situations and indicating the potential for system failure in the absence of resilience tactics or dependency involvement.
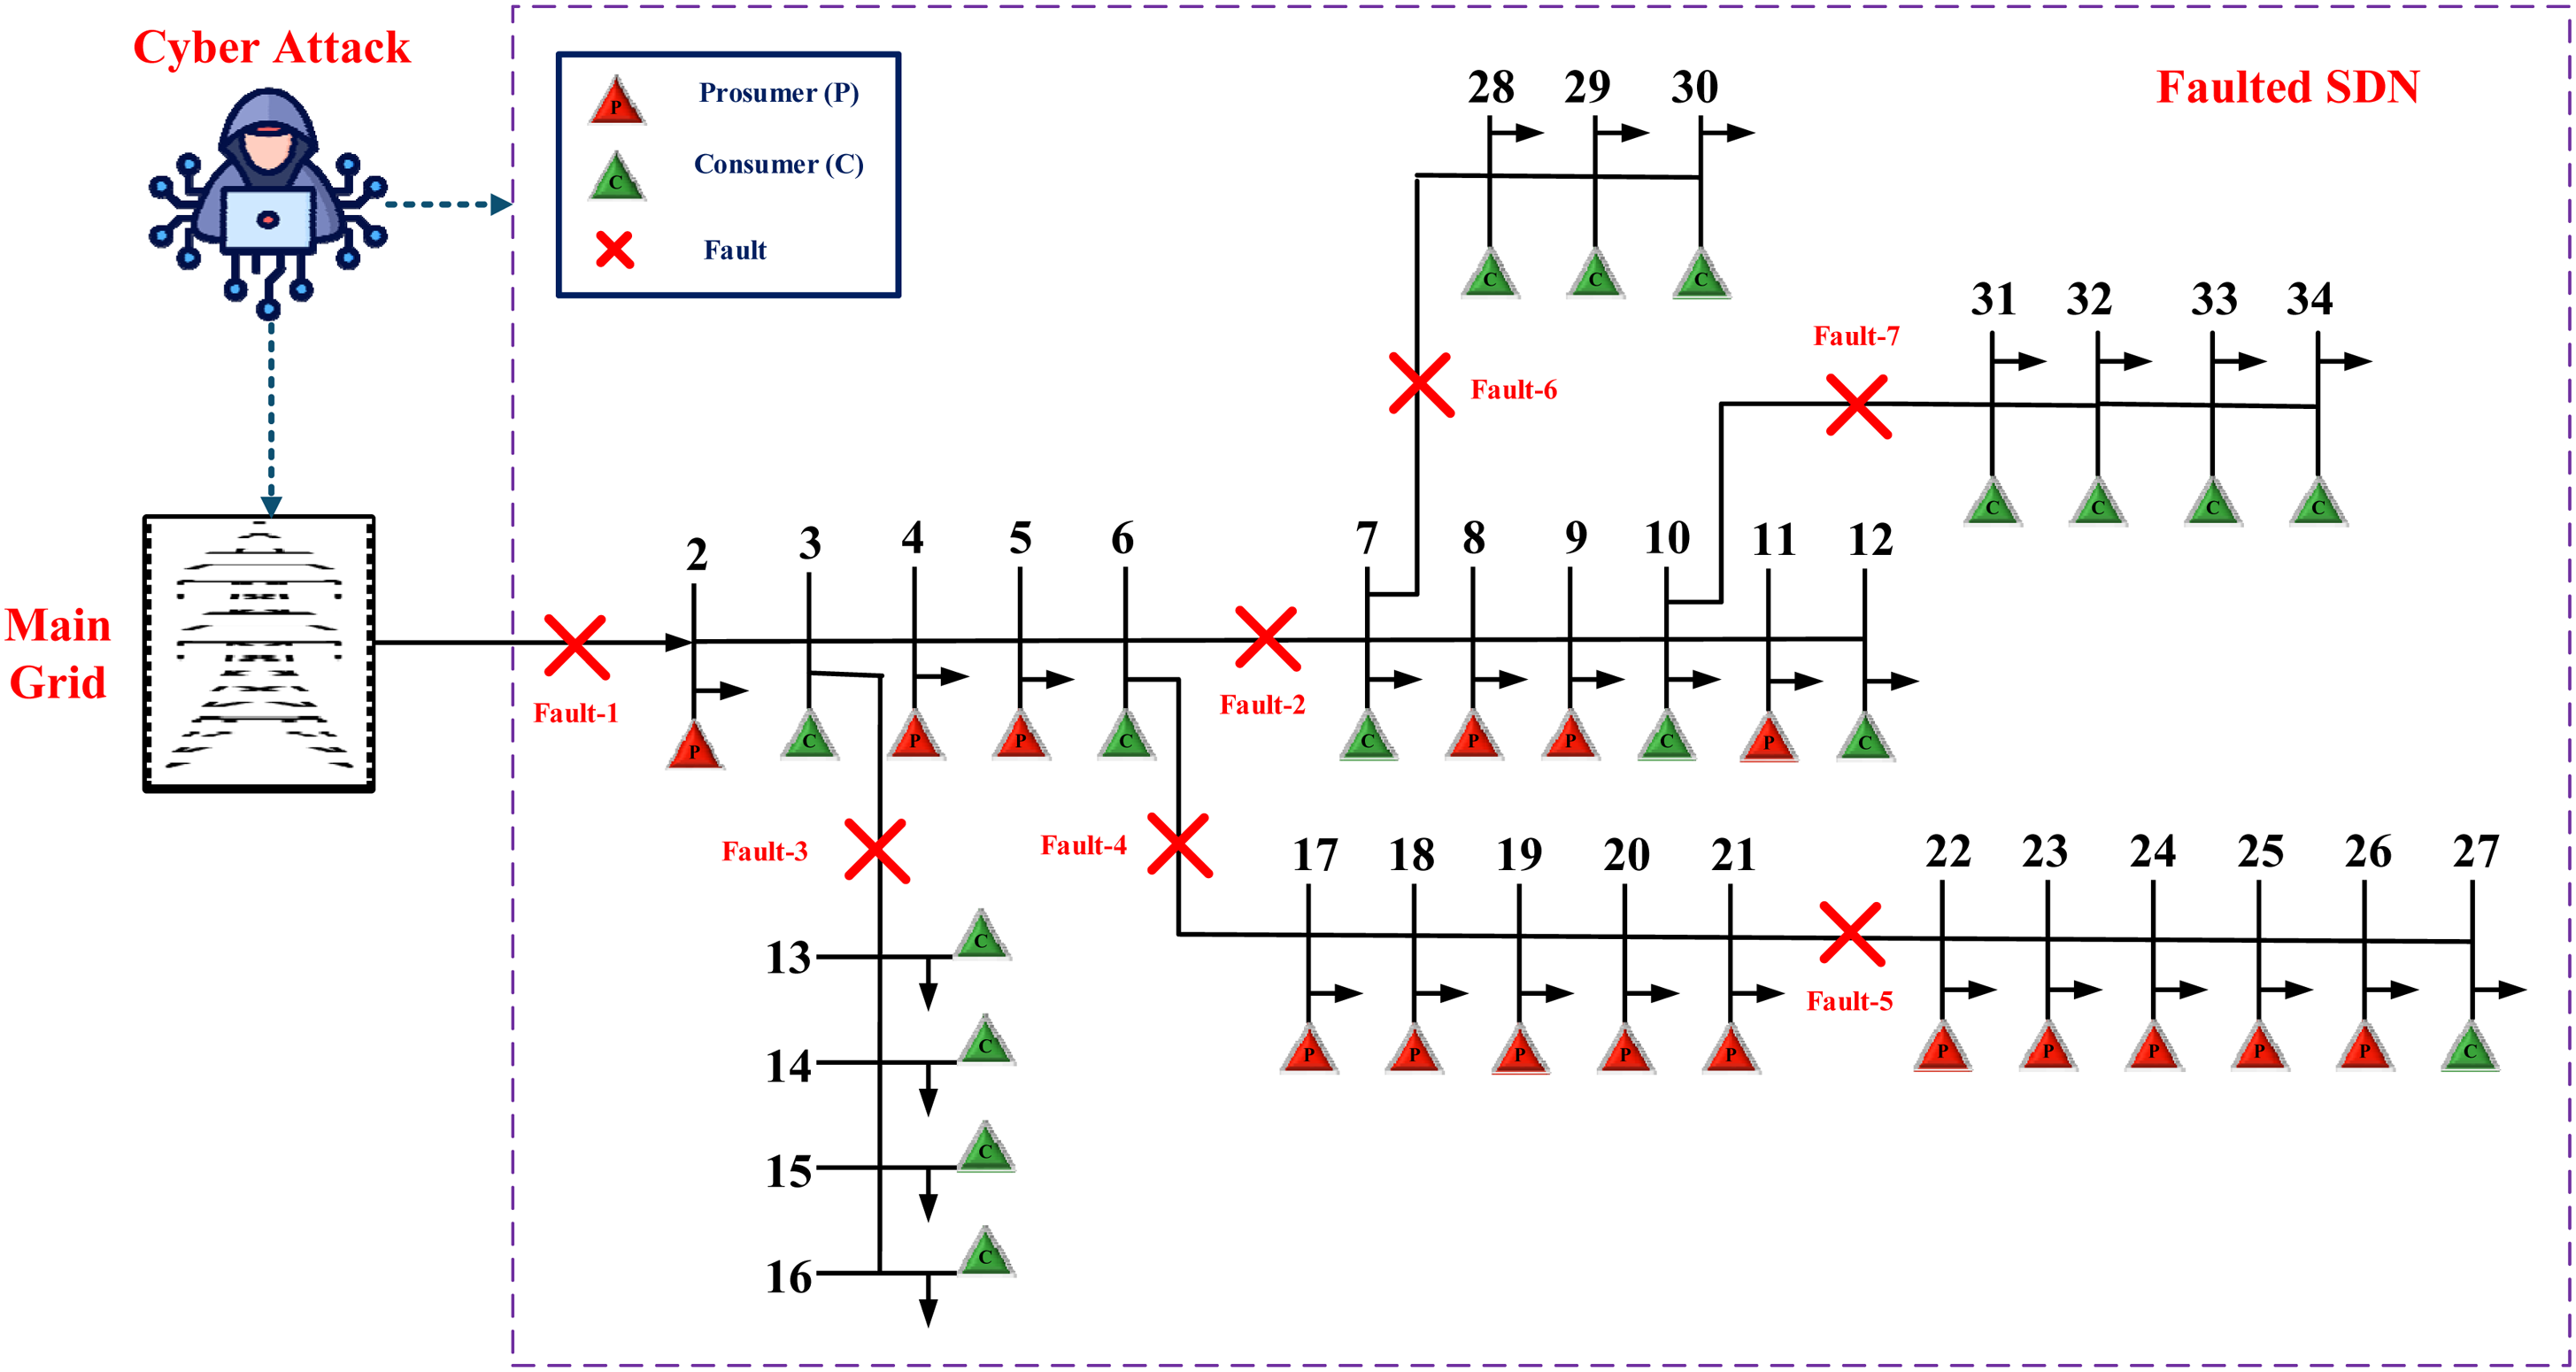
Faulted and cyber-attacked IEEE 34-SDN without MGs.
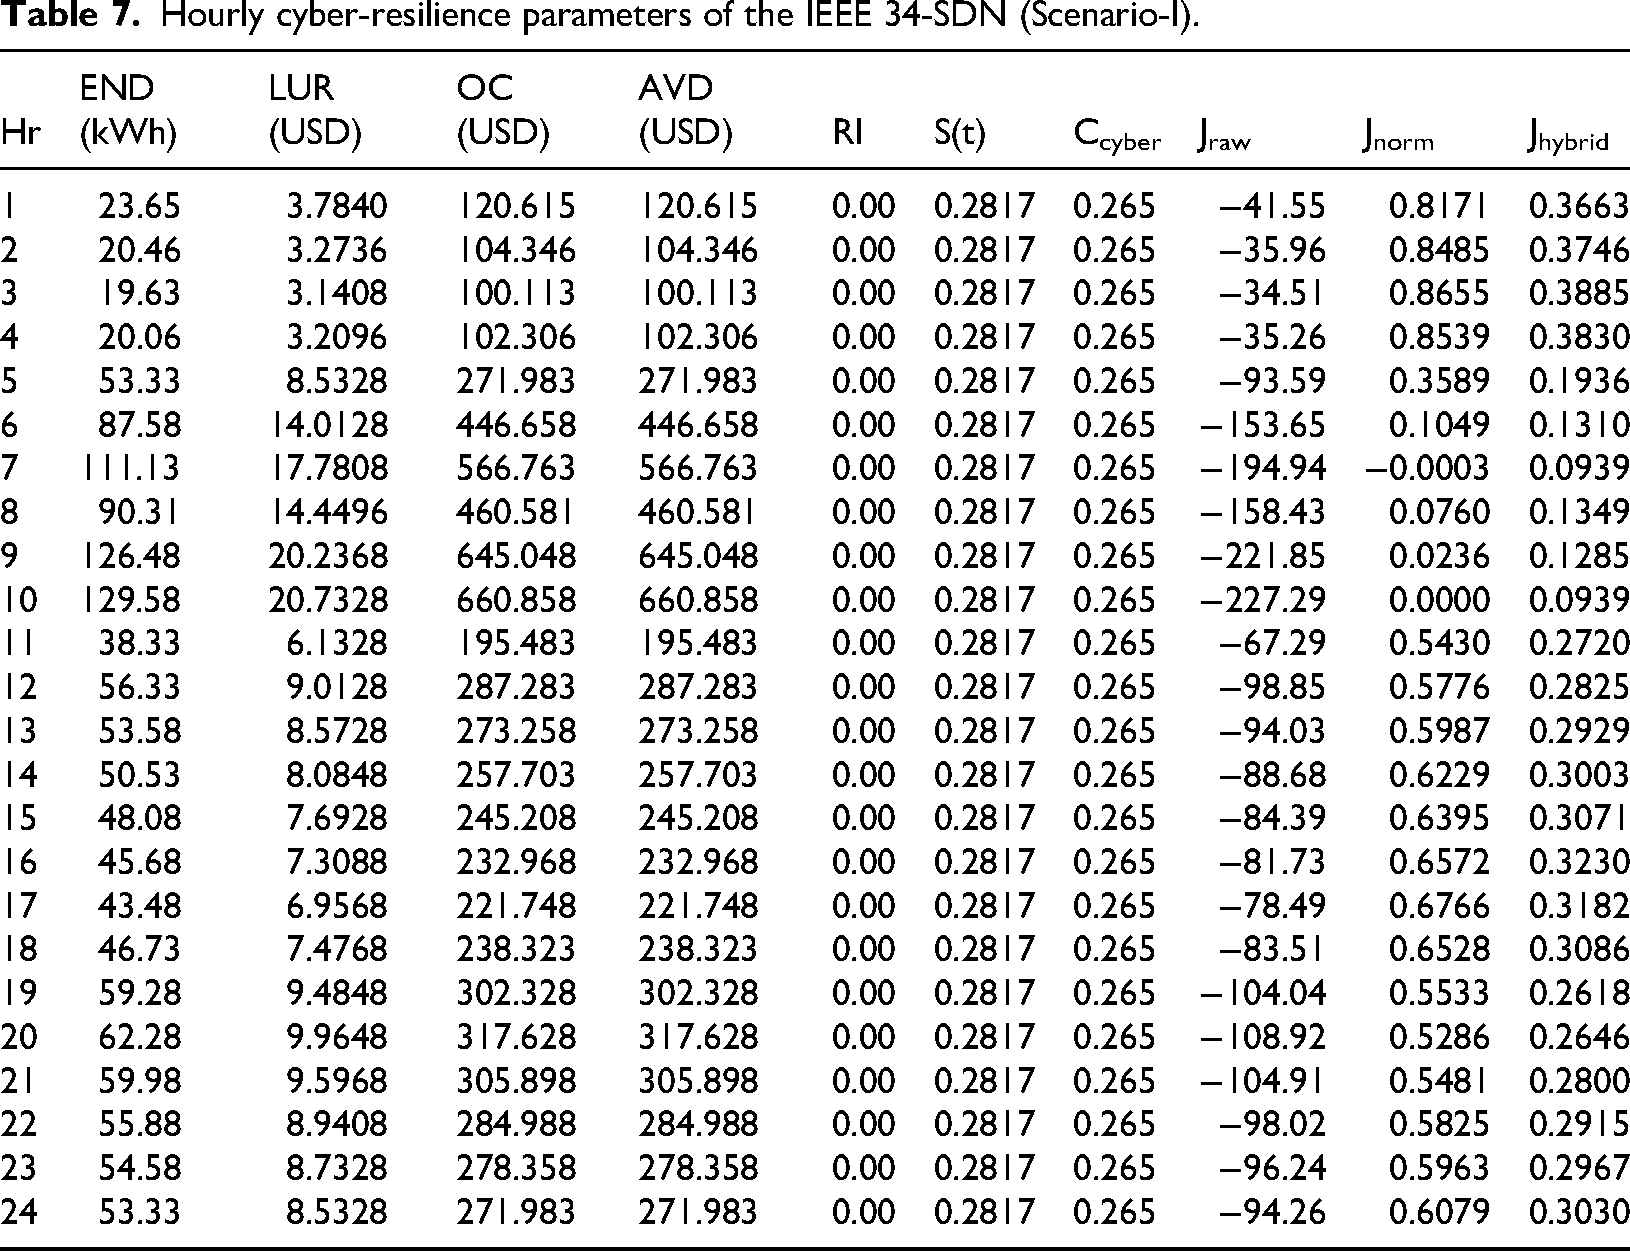
Hourly cyber-physical resilience parameters of IEEE 34-SDN without MGs, prosumers, or DER-based recovery systems within different failures in Scenario-I are shown in Table 7 and Figure 10. Due to the system being completely cut off from the main utility even after the simultaneous outage of several vital buses, severe shortages in supply prevail during the entire day. There is a significant unmet demand during peak daytime hours, as reflected by the highest END, 126.48 kWh, indicating a significant amount of unmet demand during peak daytime hours. This indicates an increasing financial burden of continuous power outages, reaching a maximum of 660.858 and 20.7328 USD in hour 10, respectively. The financial impacts show a similar pattern. Due to the lack of MGs or prosumers to contribute the recovered electricity, the physical RI remains zero throughout the day despite fluctuating operational pressures. Due to the high communication latency, packet loss, and attack intensity included in the cyber-attack model, the cyber control success probability S(t) = 0.2817 is low. This results in negative values for the raw objective function and nonzero cyber-cost per hour, indicating poor system performance under Scenario-I.
(ii) Scenario-II (Faulted and Cyber-Attacked SDN with MGs)
(a) Indian 28-SDN
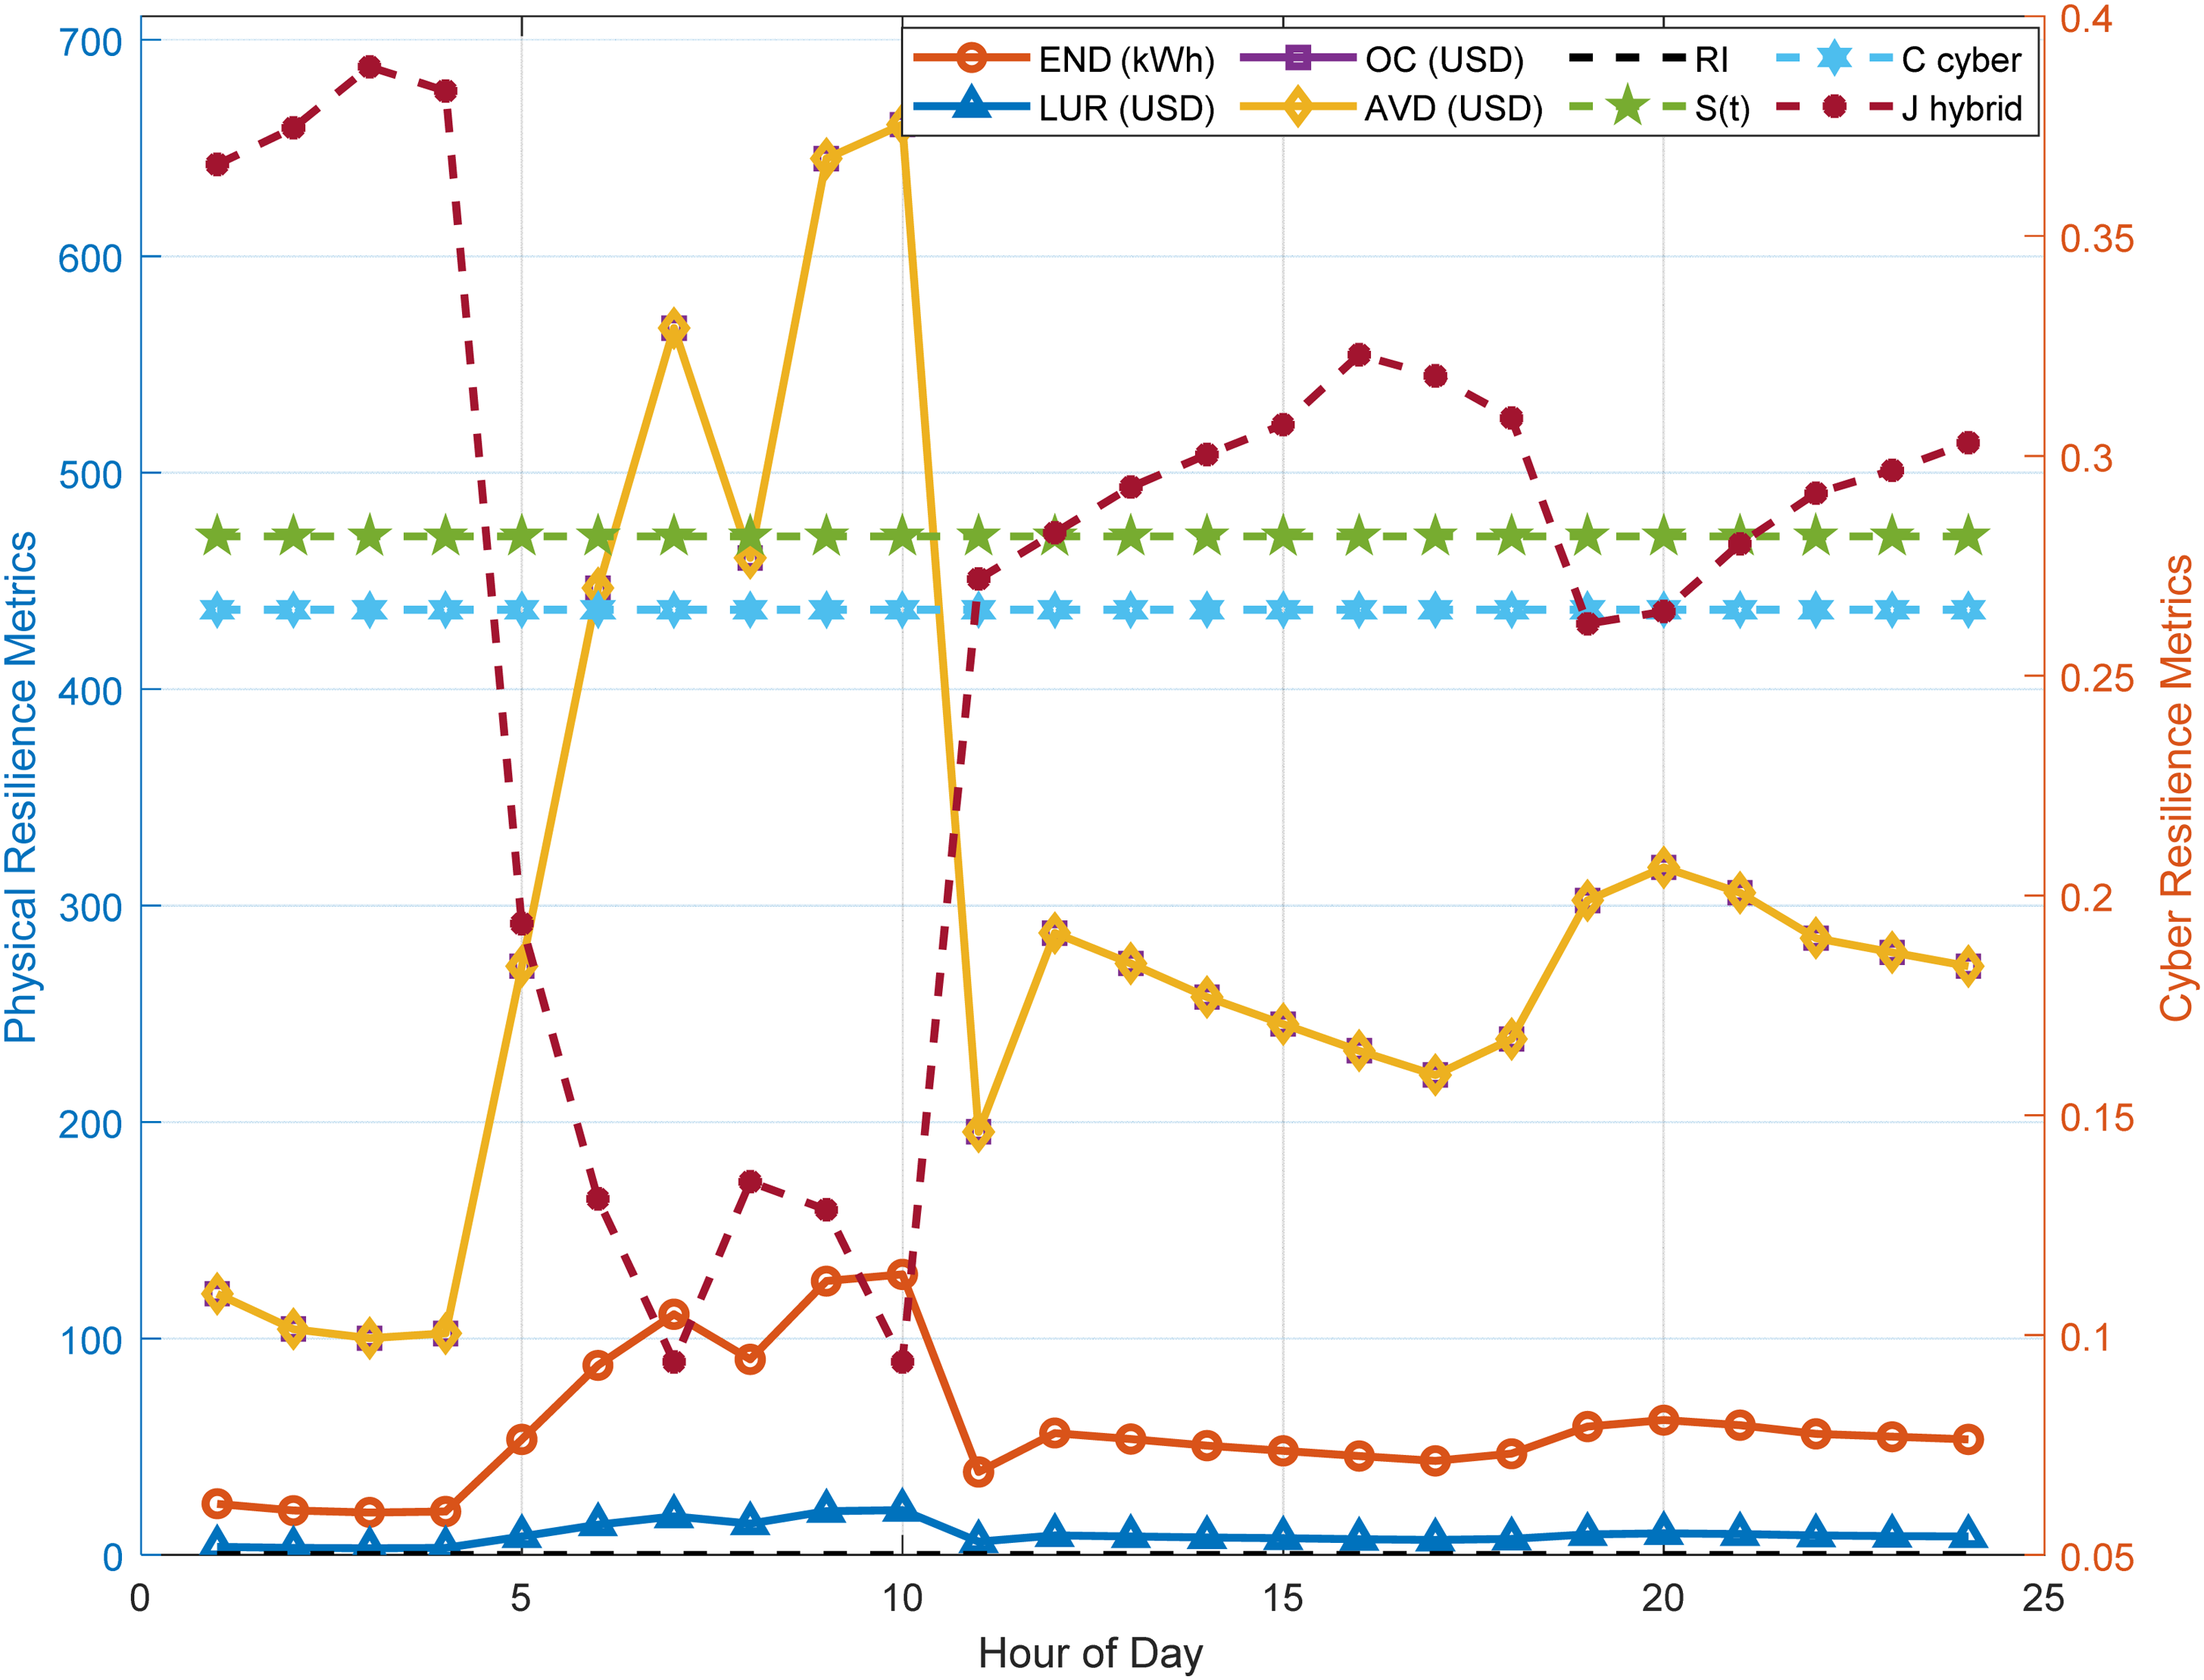
Hourly cyber-resilience parameters of IEEE 34-SDN (Scenario-I).
Hourly cyber-resilience parameters of the IEEE 34-SDN (Scenario-I).
In scenario-II, Figure 11 illustrates the implementation of the proposed MG deployment as a cyber-resilience strategy to investigate Indian 28-SDN failures. The system is completely disconnected from the main utility supply for 24 h due to multiple failures on different buses. Seven MGs (MG-1 to MG-6) are constructed by isolating failed buses using open switches (OS) to improve cyber-resiliency. These MGs are consumer oriented or constructed with a combination of prosumers and consumers. Specifically, buses 2–4 are included in MG-1, buses 5–7 and 16 in MG-2, buses 8–10, 27 and 28 in MG-3, buses 11–15 in MG-4, buses 17–21 in MG-5 and buses 22–26 in MG-6. Each MG is integrated with consumers and prosumers. The electricity generated by the consumers is used to meet the local energy needs of the respective MGs. Interestingly, in this scenario no tie-line (TL) connections are made between MGs or for energy trading between MGs. By isolating each MG, this method tests their ability to maintain sustainability and resilience by using only locally produced energy from prosumers and demand-supply balancing mechanisms. This system demonstrates how a localized microgrid application can improve the resilience of the system by leveraging positive contributions in the event of a fault.
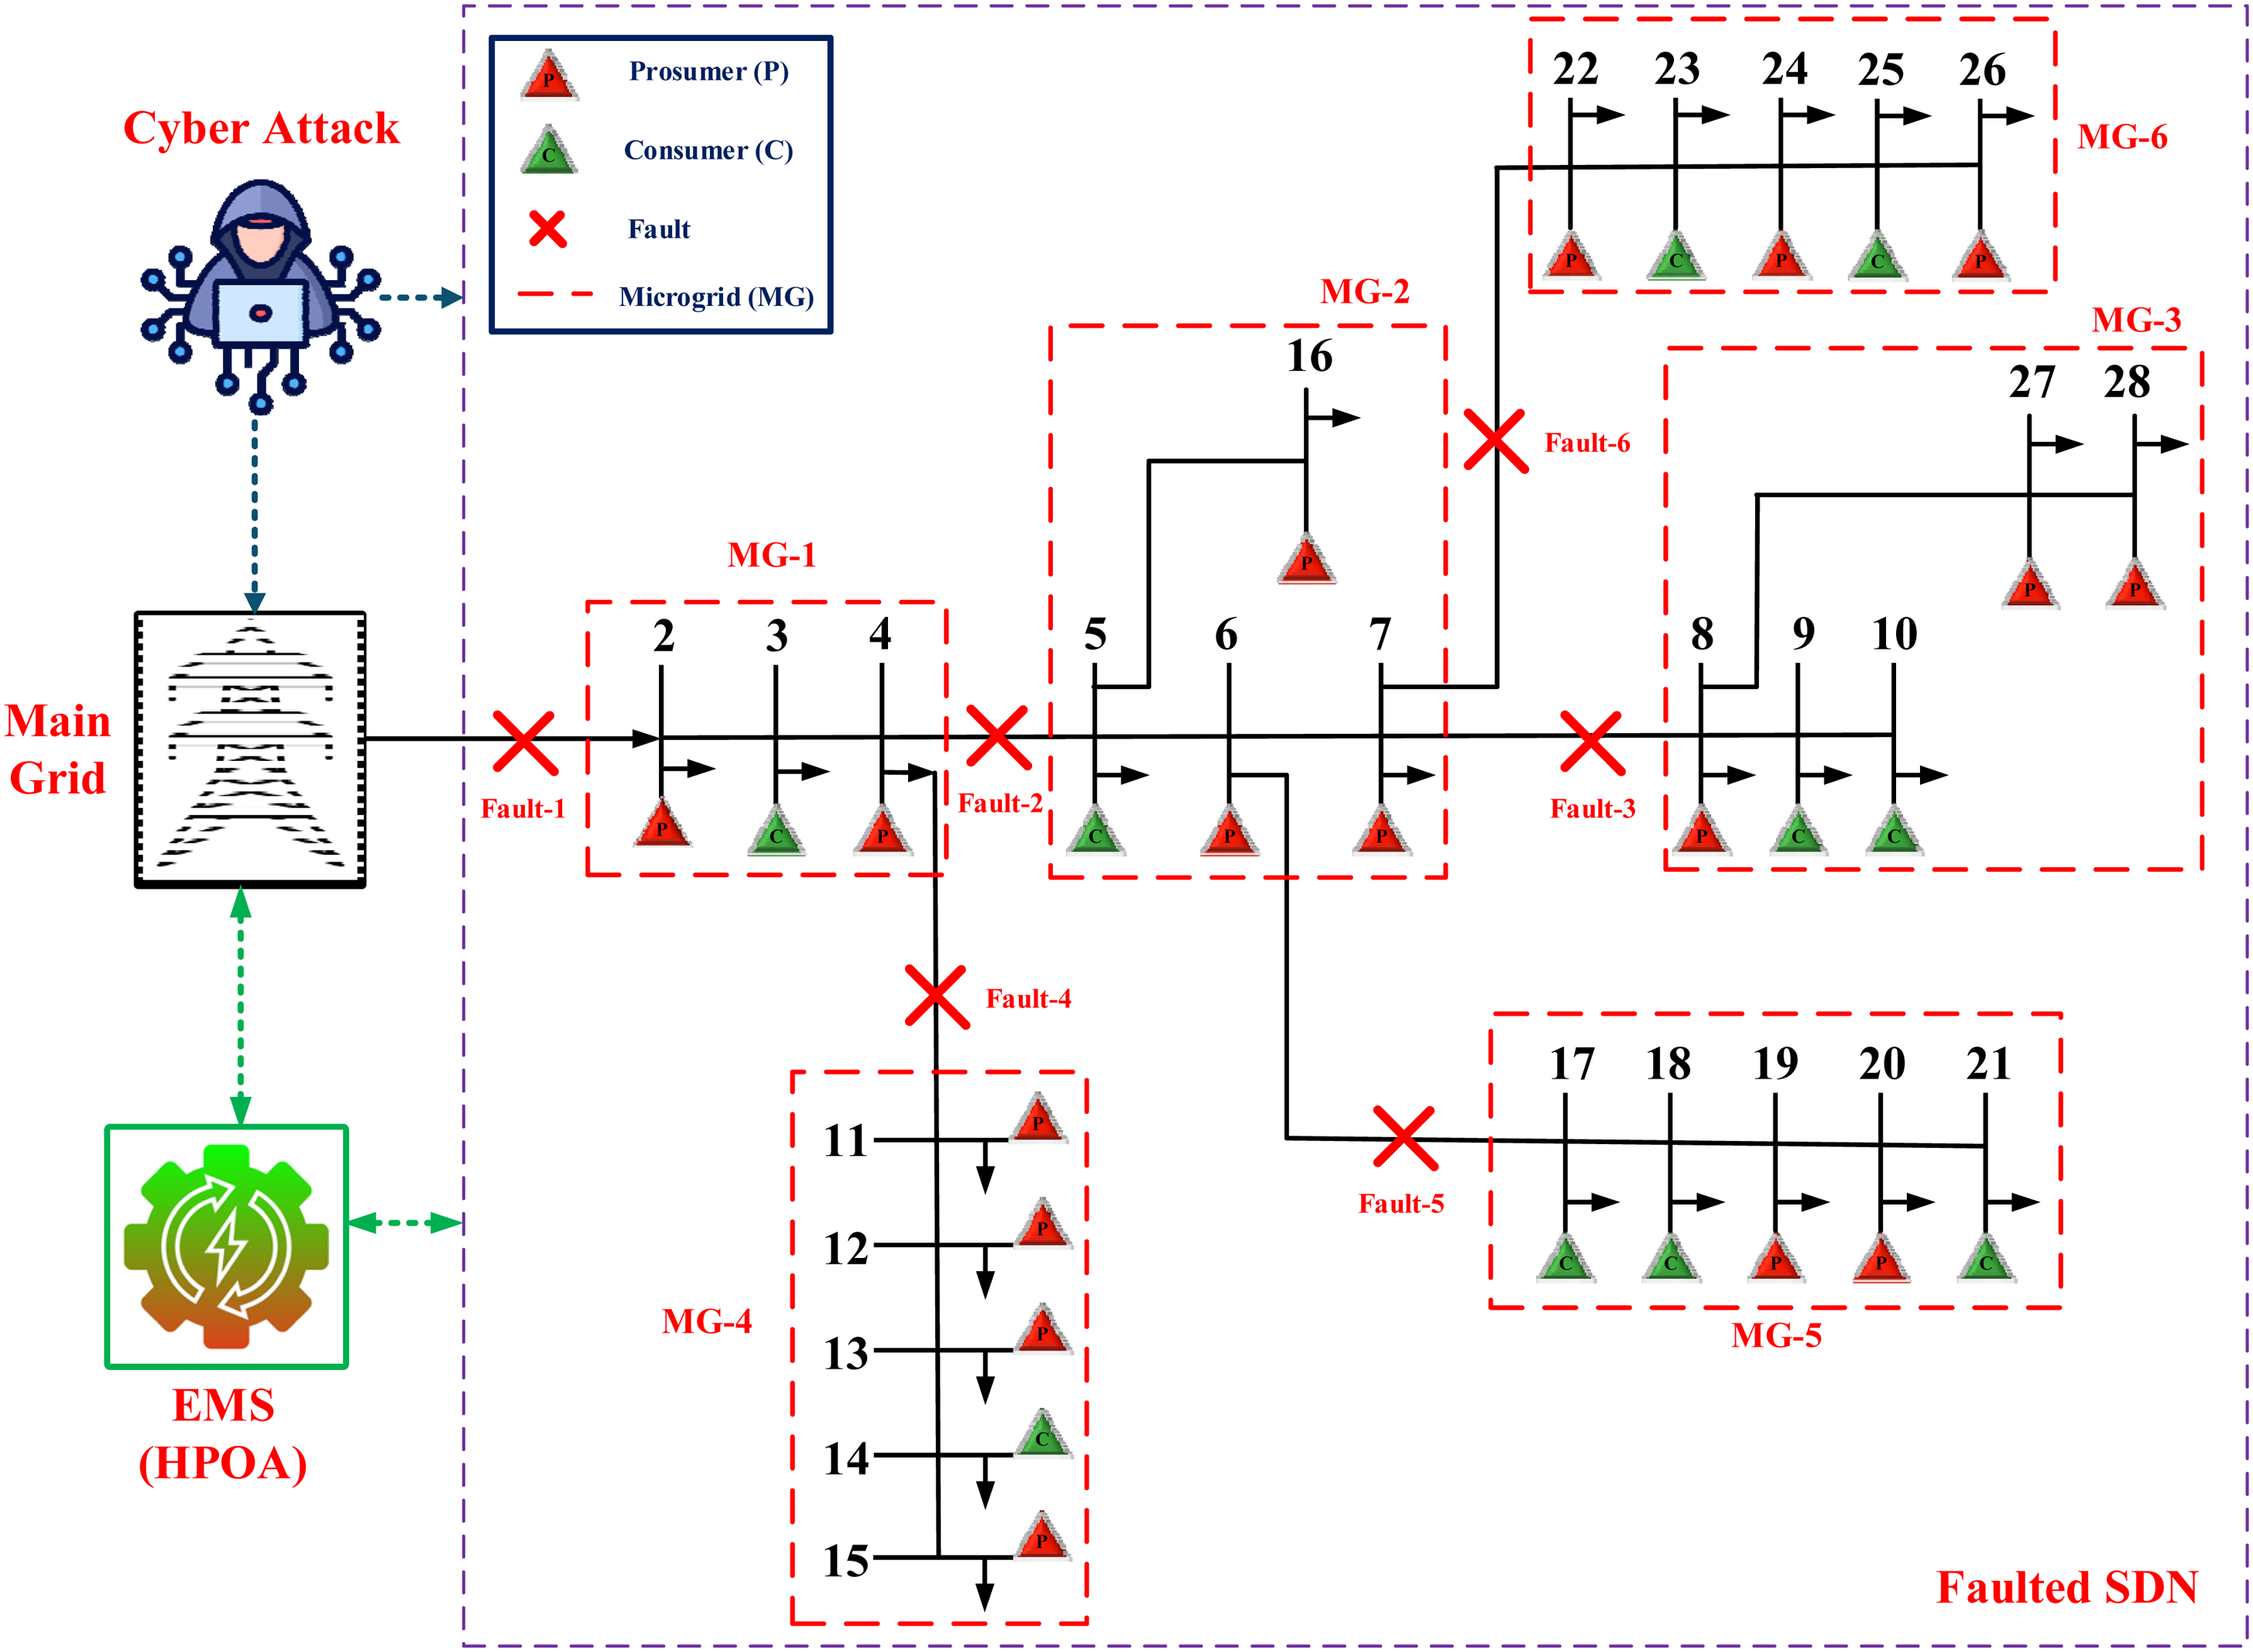
Faulted and cyber-attacked Indian 28-SDN with MGs.
Table 8 and Figure 12 show the hourly power demand of each MG in an SDN. Accordingly, the demand of each MG is plotted for a timeframe of 24 h; hence, there are different lines for representing power consumption across the seven MGs. The data illustrates the changes in power demand across each MG with respect to the day, grid usage, or device usage. This graph serves to offer insight into the behavior of power demand throughout the day, with respect to understanding and achieving better energy management strategies, for example, load balancing and enhancing grid resiliency using energy storage systems and IMT, especially in fault or disaster recovery situations. This type of analysis is required to enhance the adaptability and reliability of smart grids, especially with the increasing penetration of renewable power sources like photovoltaics and wind turbines.
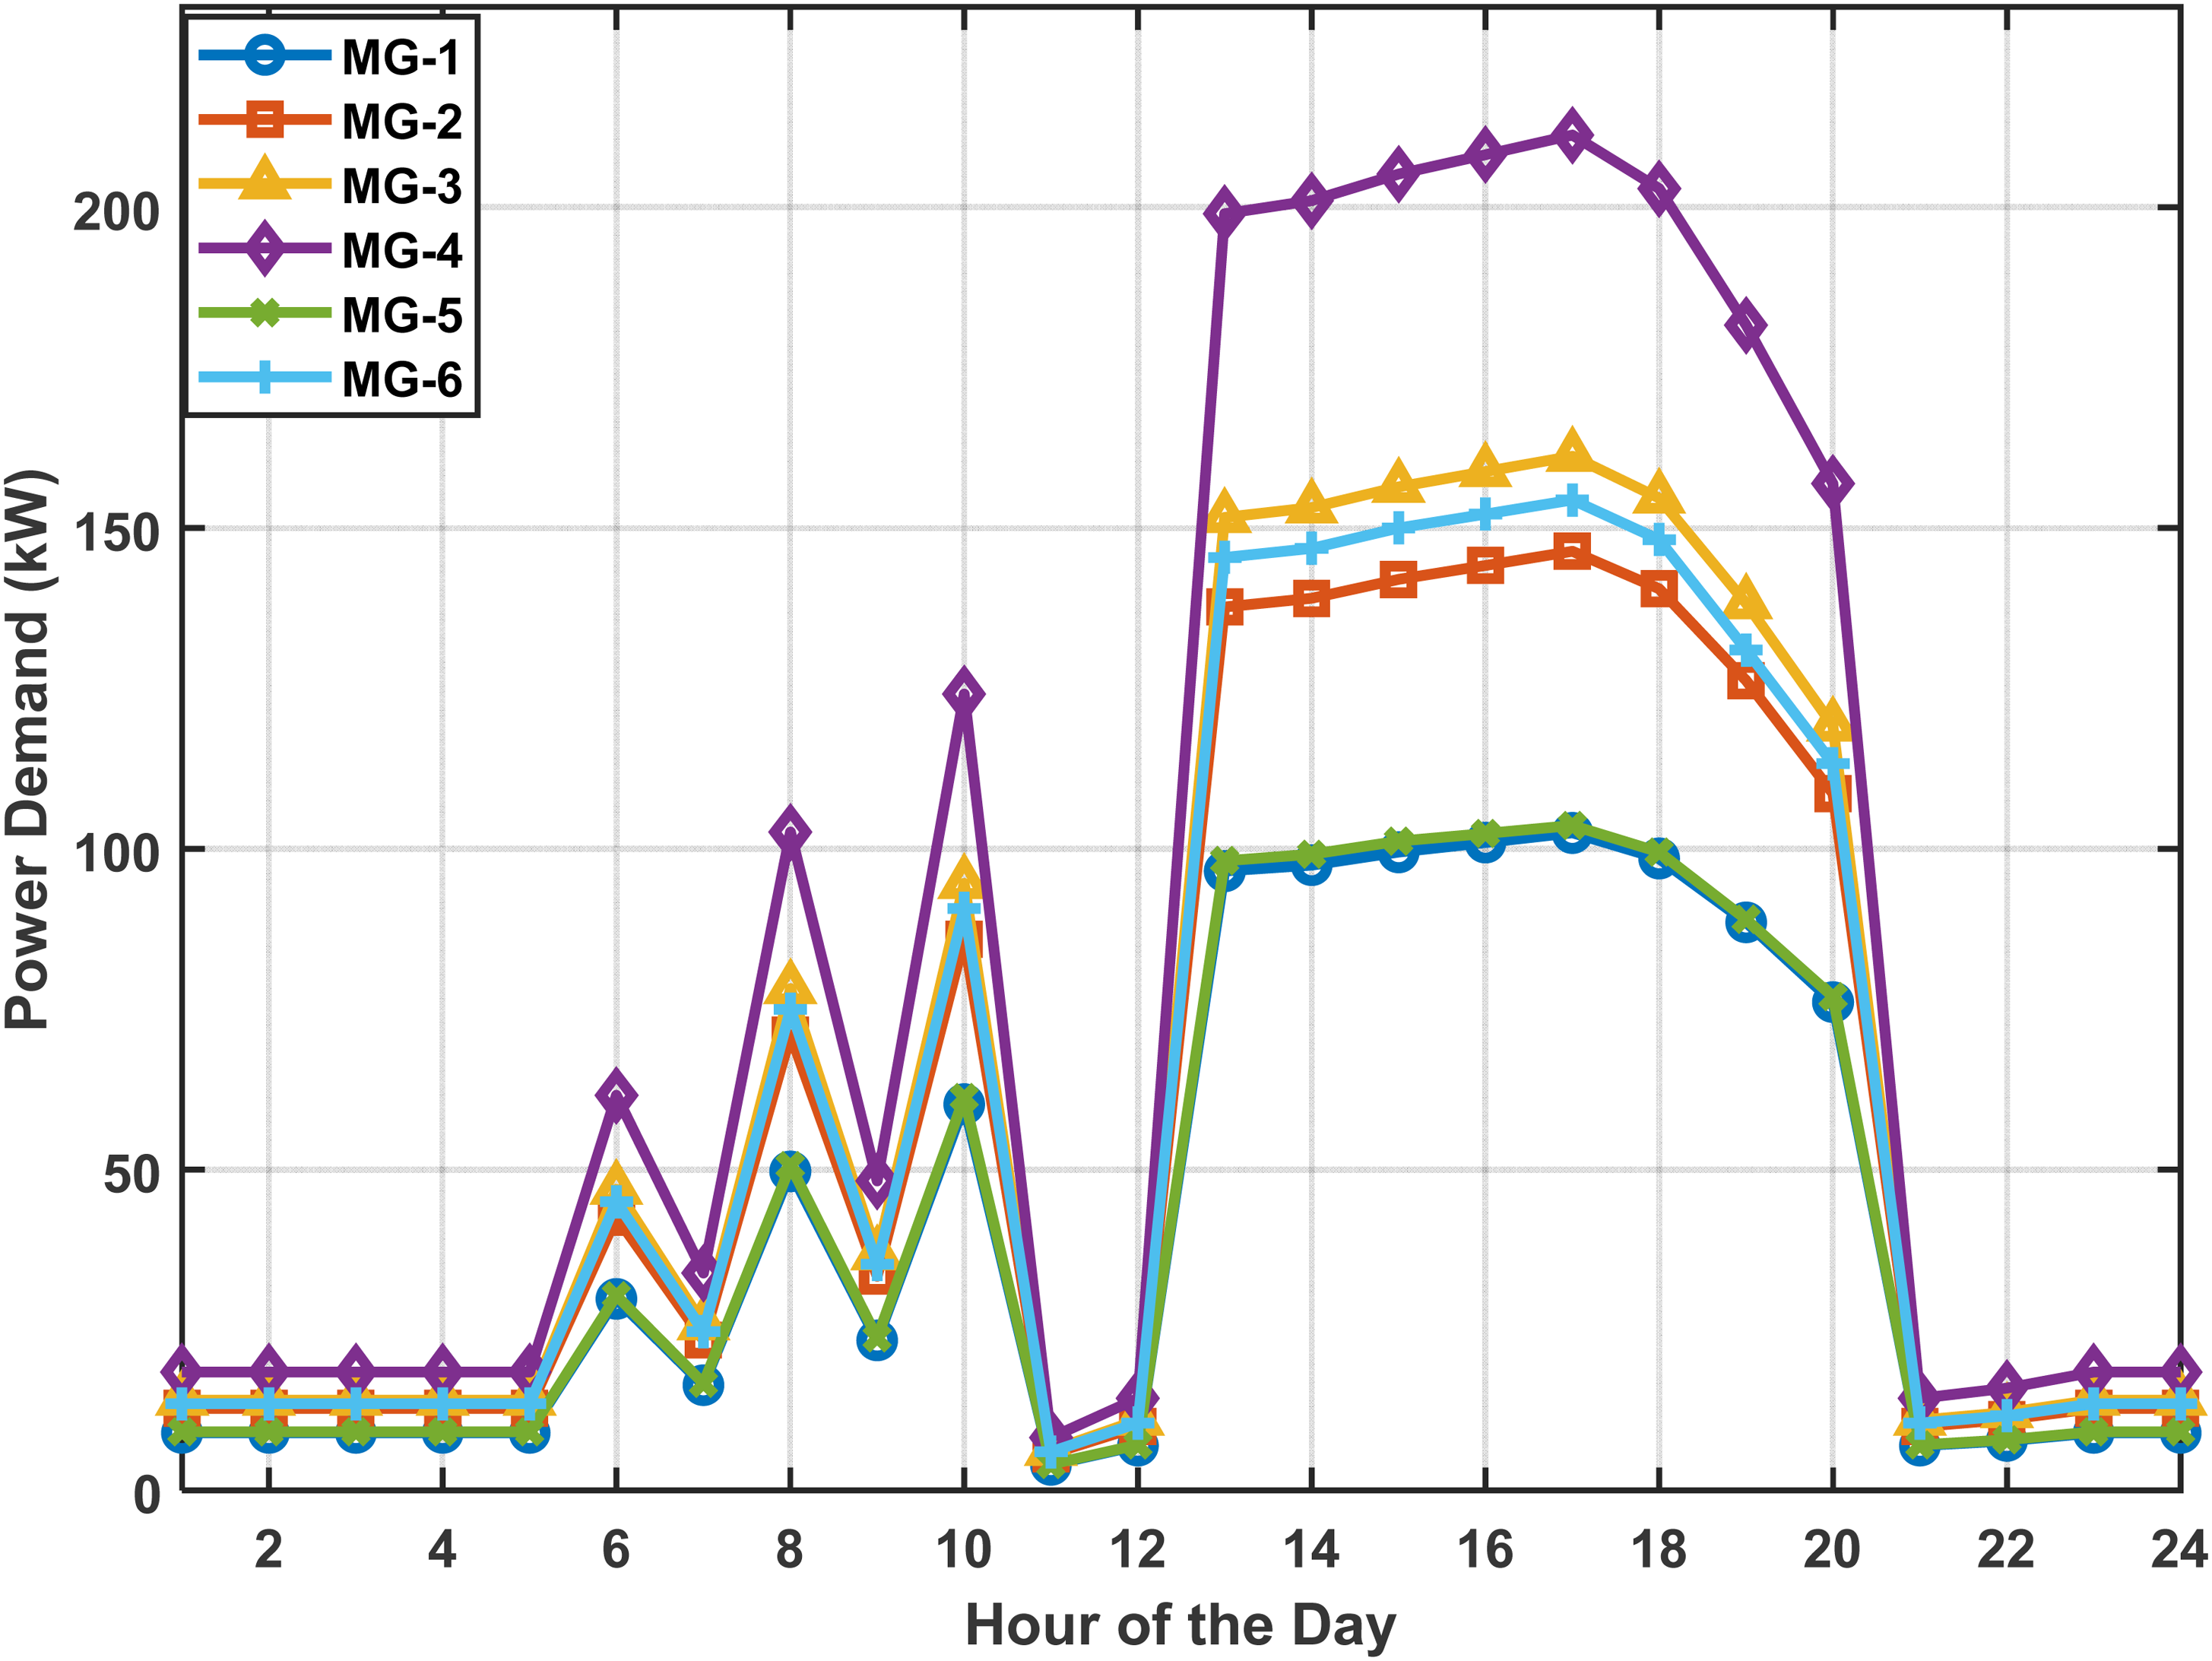
Hourly power demand of each MGs in Indian 28-SDN.
Hourly power demand of each MGs in Indian 28-SDN.
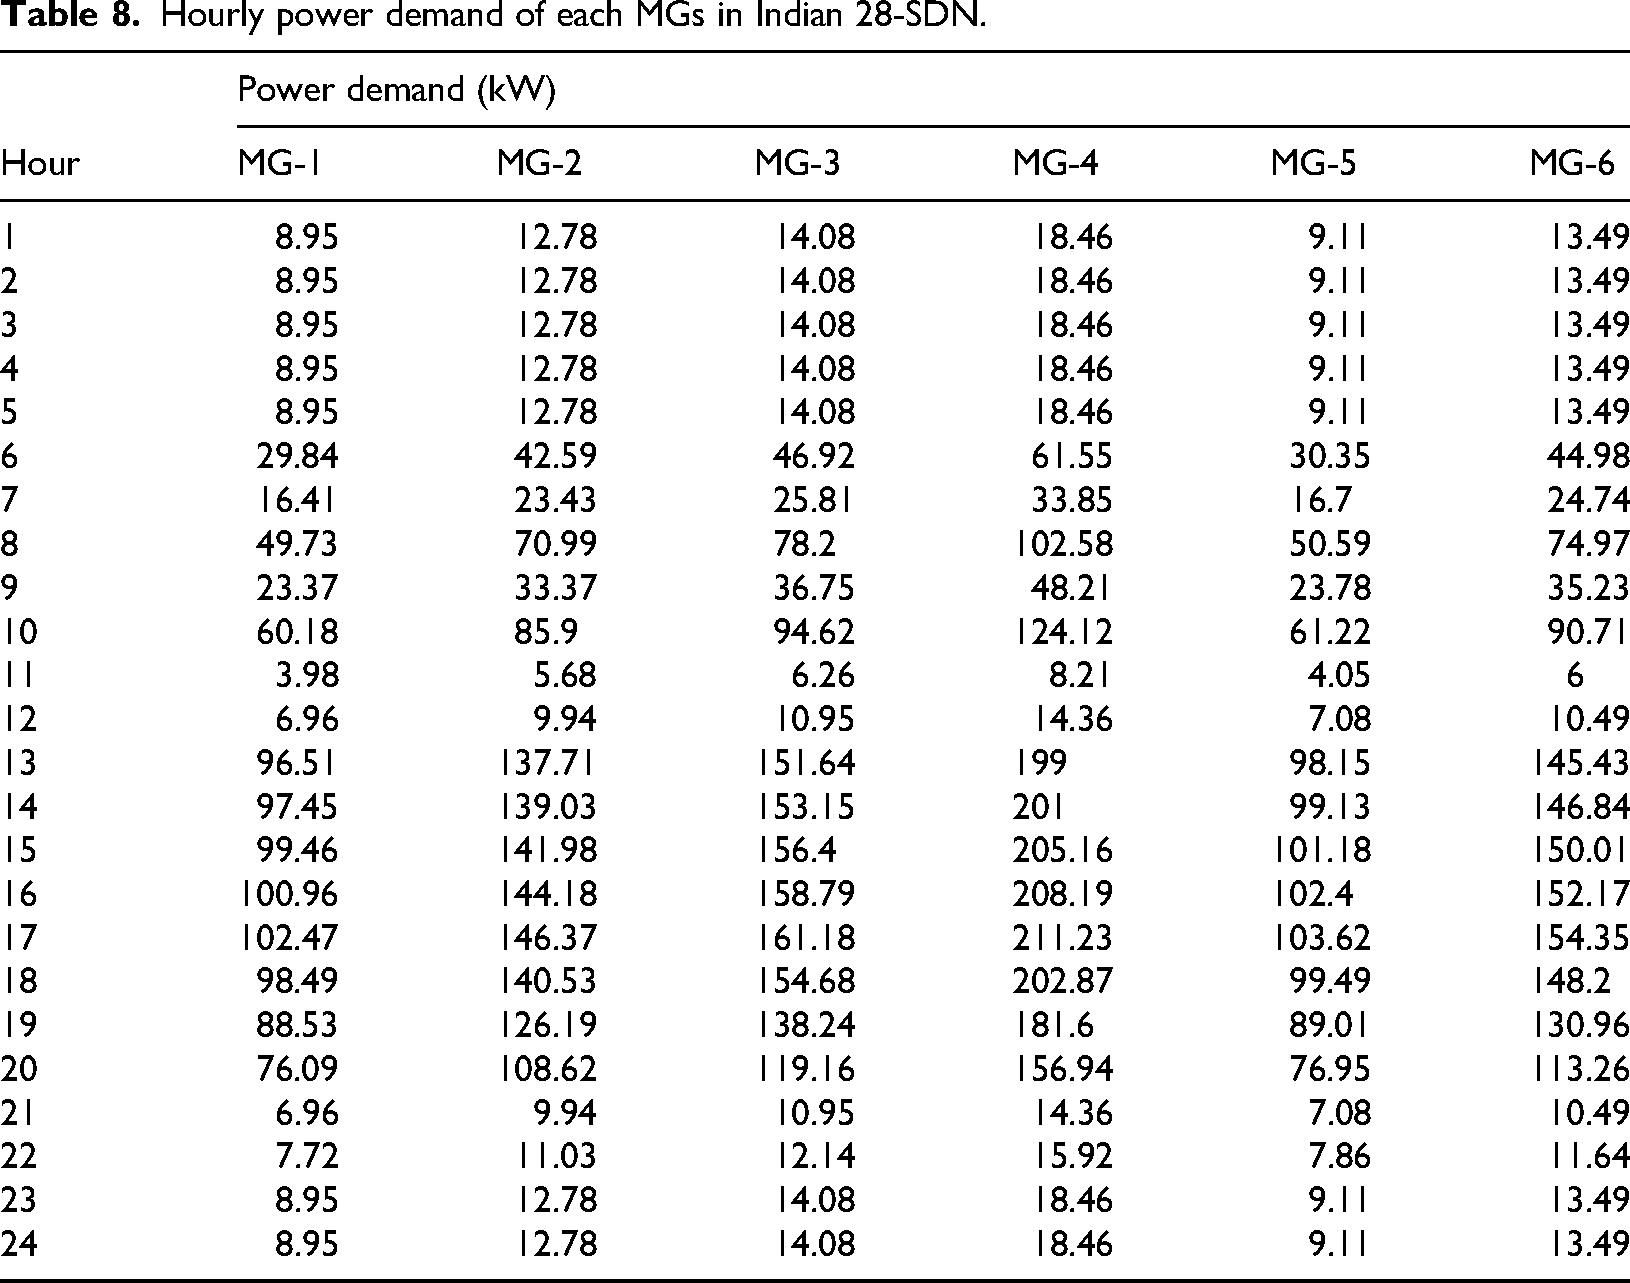
Table 9 measures the hourly power generation of the prosumers in four MGs, MG-1, MG-2, MG-4, and MG-5, in the integrated IEEE 34-bus SDN. It shows various trends in the contributions of renewable energy within a 24-h period. The power generation of MG-1 and MG-2 is somewhat steady within the day, with regular small fluctuations in the afternoon and evening hours and small fluctuations in the morning and evening. Similarly, MG-4 and MG-5 have presented steady power generation profiles, with peak generation rates in the afternoon and evening. Importantly, all MGs show high correlation in their generation patterns, which indicates synchronized renewable resource availability due to variations in wind and solar power. In Figure 13, the hourly contributions of the prosumers in MG-1, MG-2, MG-4, and MG-5 are visualized. It provides data from Table 9. These trends, which stabilize at low light levels in the afternoon, are consistent with the expected patterns of renewable energy generation. The above dynamics underpin the substantial impact of customer contributions through PV and WT generation on the performances of MGs. This underlines the importance of integrating DER for improving resiliency in fault-prone SDNs.
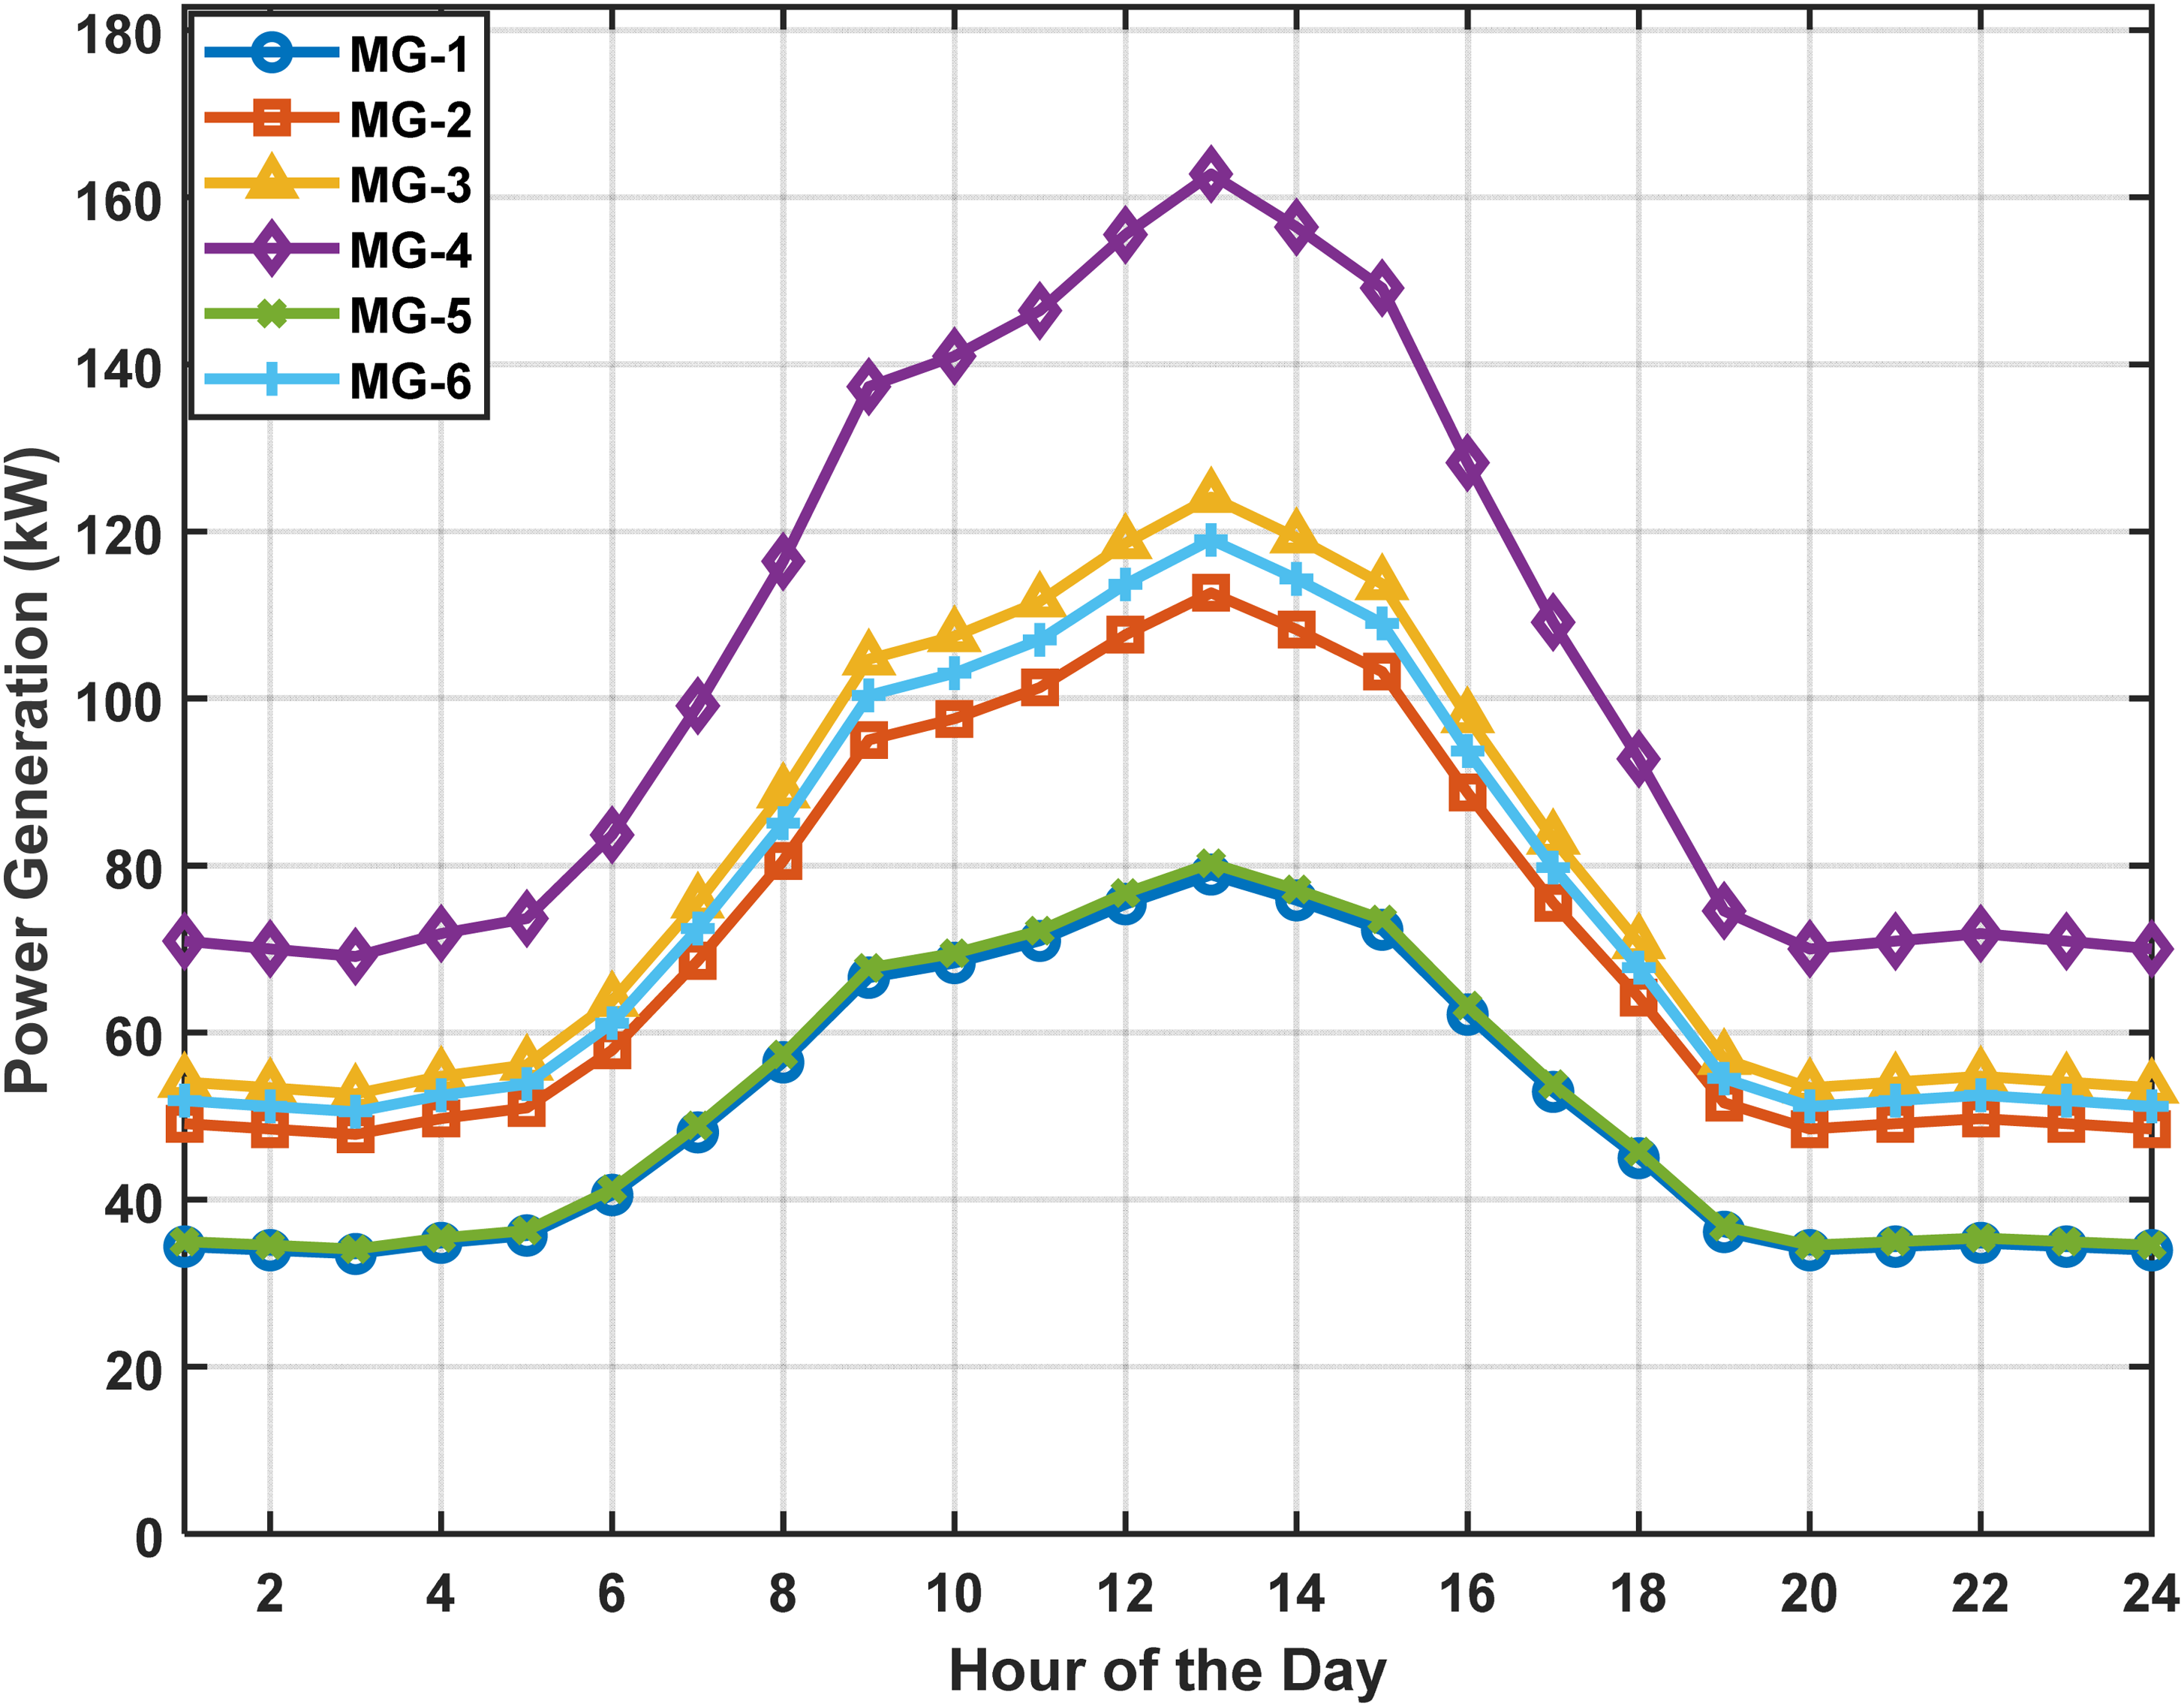
Hourly power generation by Prosumer's MGs in Indian 28-SDN.
Hourly power generation of prosumers in MGs in Indian 28-SDN.
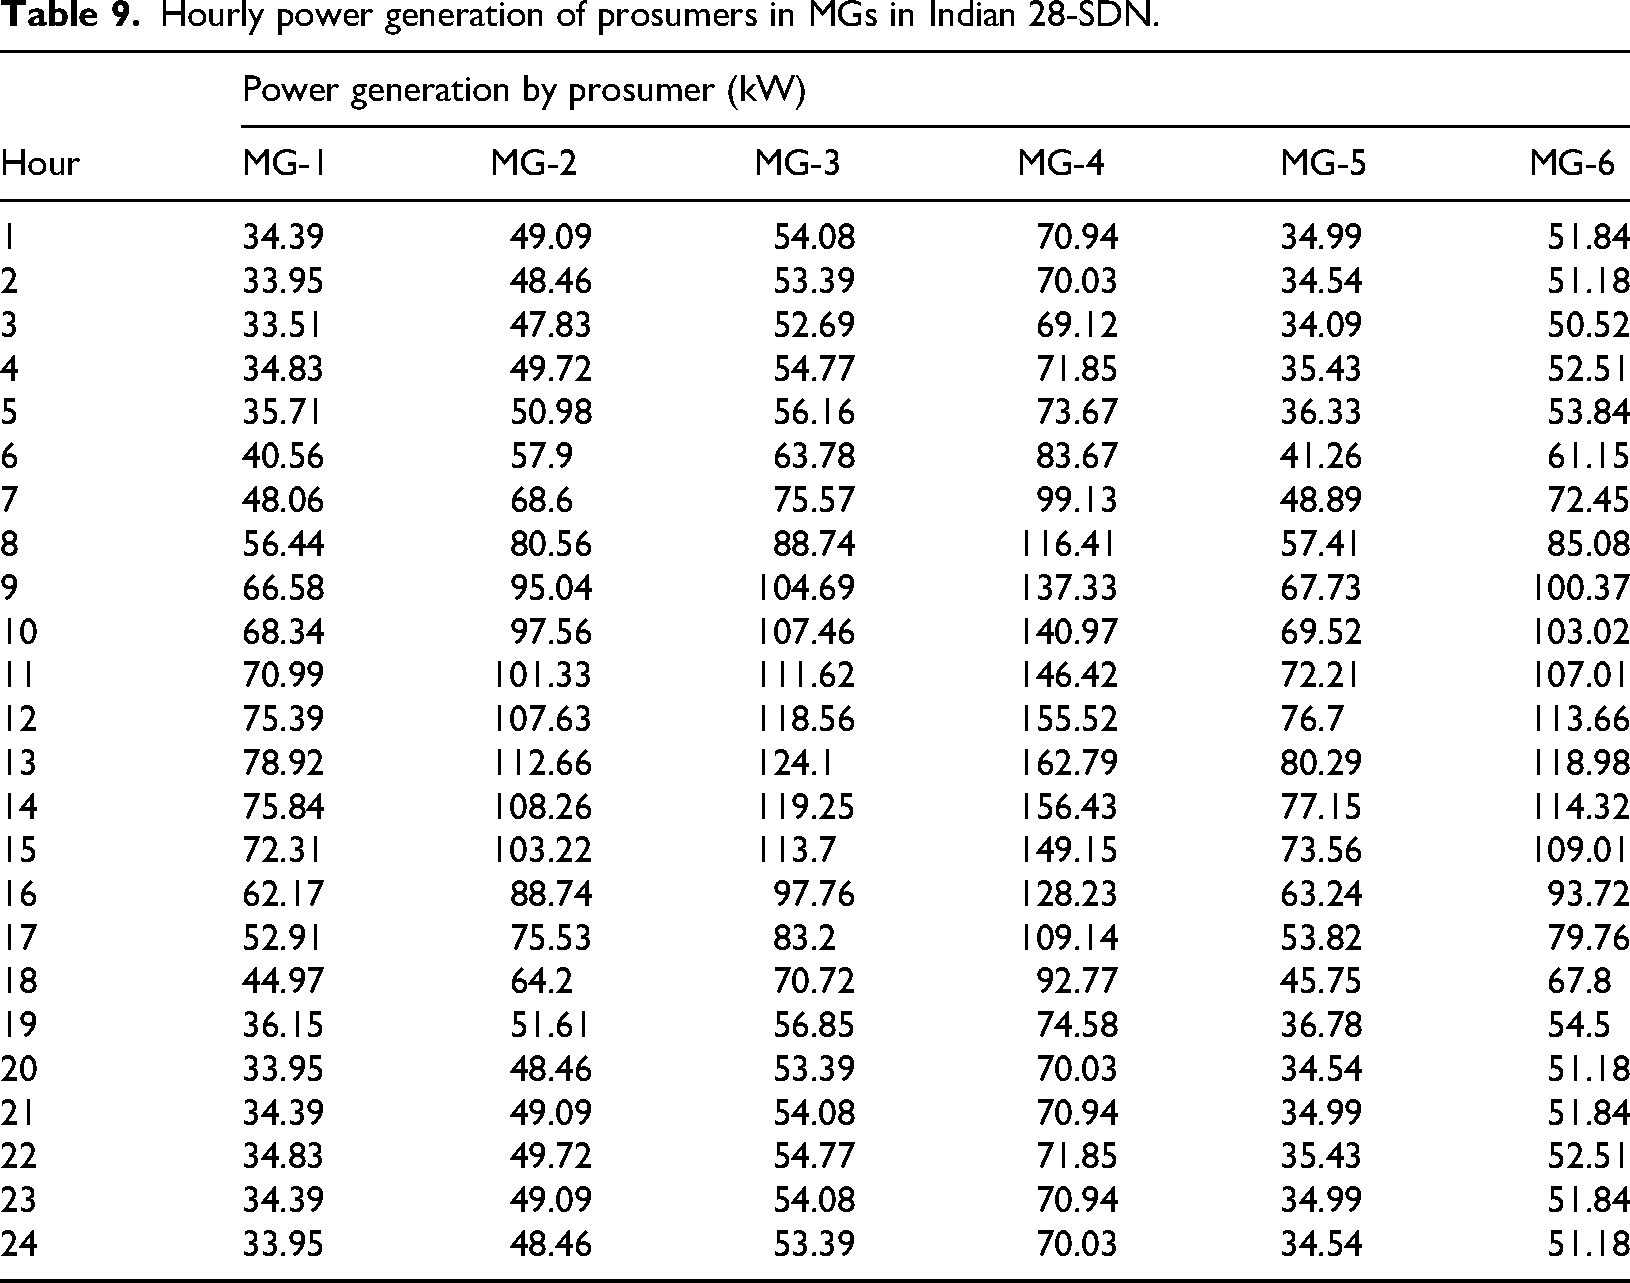
The updated hourly cyber-physical resilience parameters of the Indian 28-SDN under Scenario-II are shown in Table 10 and Figure 14, where Prosumer participation and MG formation are crucial for mitigating multi-fault disruptions. Unlike Scenario I, where END exceeded 1.4 MWh but no restoration took place, Scenario II shows significant progress in supply restoration, with total END reduced to approximately 520–540 kWh. The controlled V2G support of six MGs, scheduled BESS discharging, and integrated PV–WT formation all contribute to this significant reduction. Consistent with this, the LUR and OC decrease sharply over the 24-h period; peak OC values are now 297 USD (hour 10), much lower than the 694 USD seen in Scenario-I. As a result of improved local load support and reduced reliance on grid-level reconfiguration, the AVD increases significantly. After being at zero in Scenario I, the physical RI is now consistently above 1.28, reaching 2.53 in 6–9 h with high levels of reproducible output and efficient prosumer balancing. This shows how operational adaptability is significantly improved through prosumer flexibility and MG-level autonomy. Since the same cyber-attack assumptions are used in both scenarios, the cyber-control success probability S(t) = 0.2817 and the cyber-cost Ccyber = 0.265 remain unchanged. Due to localized decision-making and reduced reliance on upstream communication, MGs maintain stable behavior even as cyber degradation continues due to latency, packet loss, and attack intensity. Furthermore, there is a significant improvement in objective-performance values. The outage costs are not completely eliminated, so Jraw is still negative, but its magnitude is greatly reduced throughout the day. The hybrid index (Jhybrid) shows significant improvement, maintaining values between 0.30 and 0.47 throughout the day, and the normalized target (Jnorm) is consistently higher than Scenario-I—often exceeding 0.80 during periods of stable operation. These improvements ensure that the proposed DER-integrated, HPOA-driven, MG-enabled architecture significantly improves cyber-physical resilience, reduces operational and financial losses, and maintains system functionality even in the event of multiple failures or simultaneous cyberattacks.
(b) IEEE 34-SDN
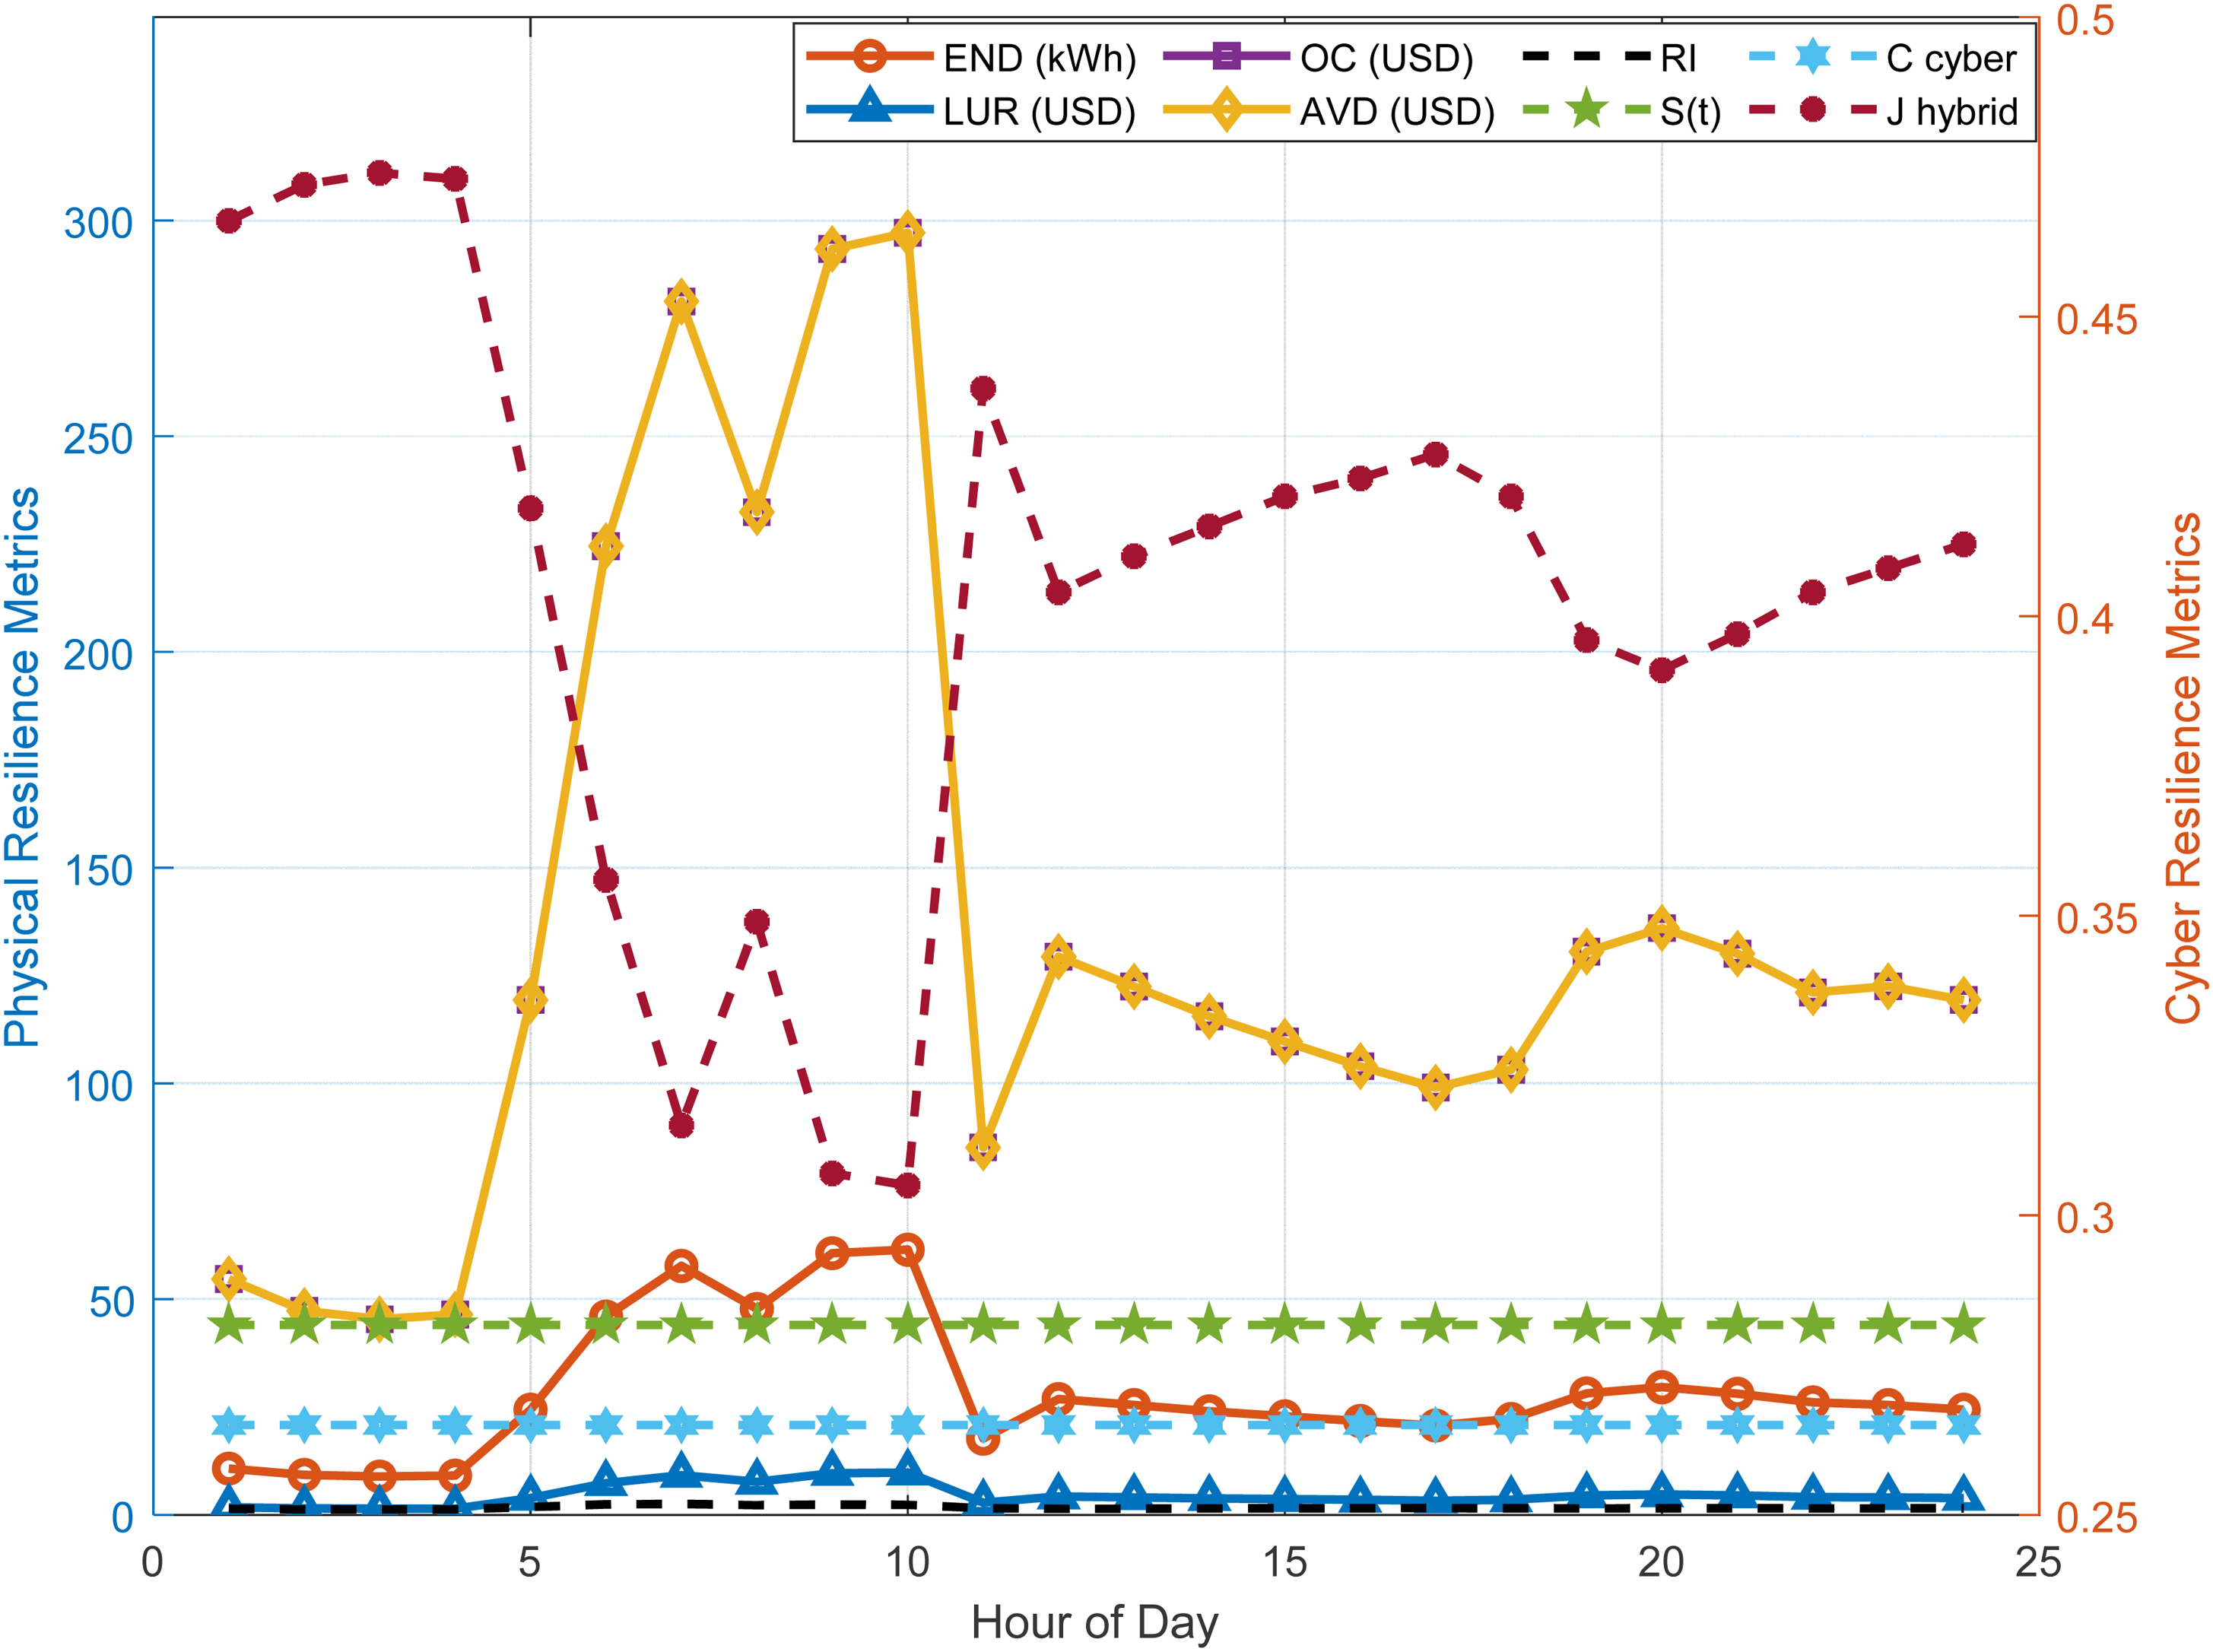
Hourly cyber-resilience parameters of Indian 28-SDN (Scenario-II).
Hourly cyber-resilience parameters of the Indian 28-SDN (Scenario-II).
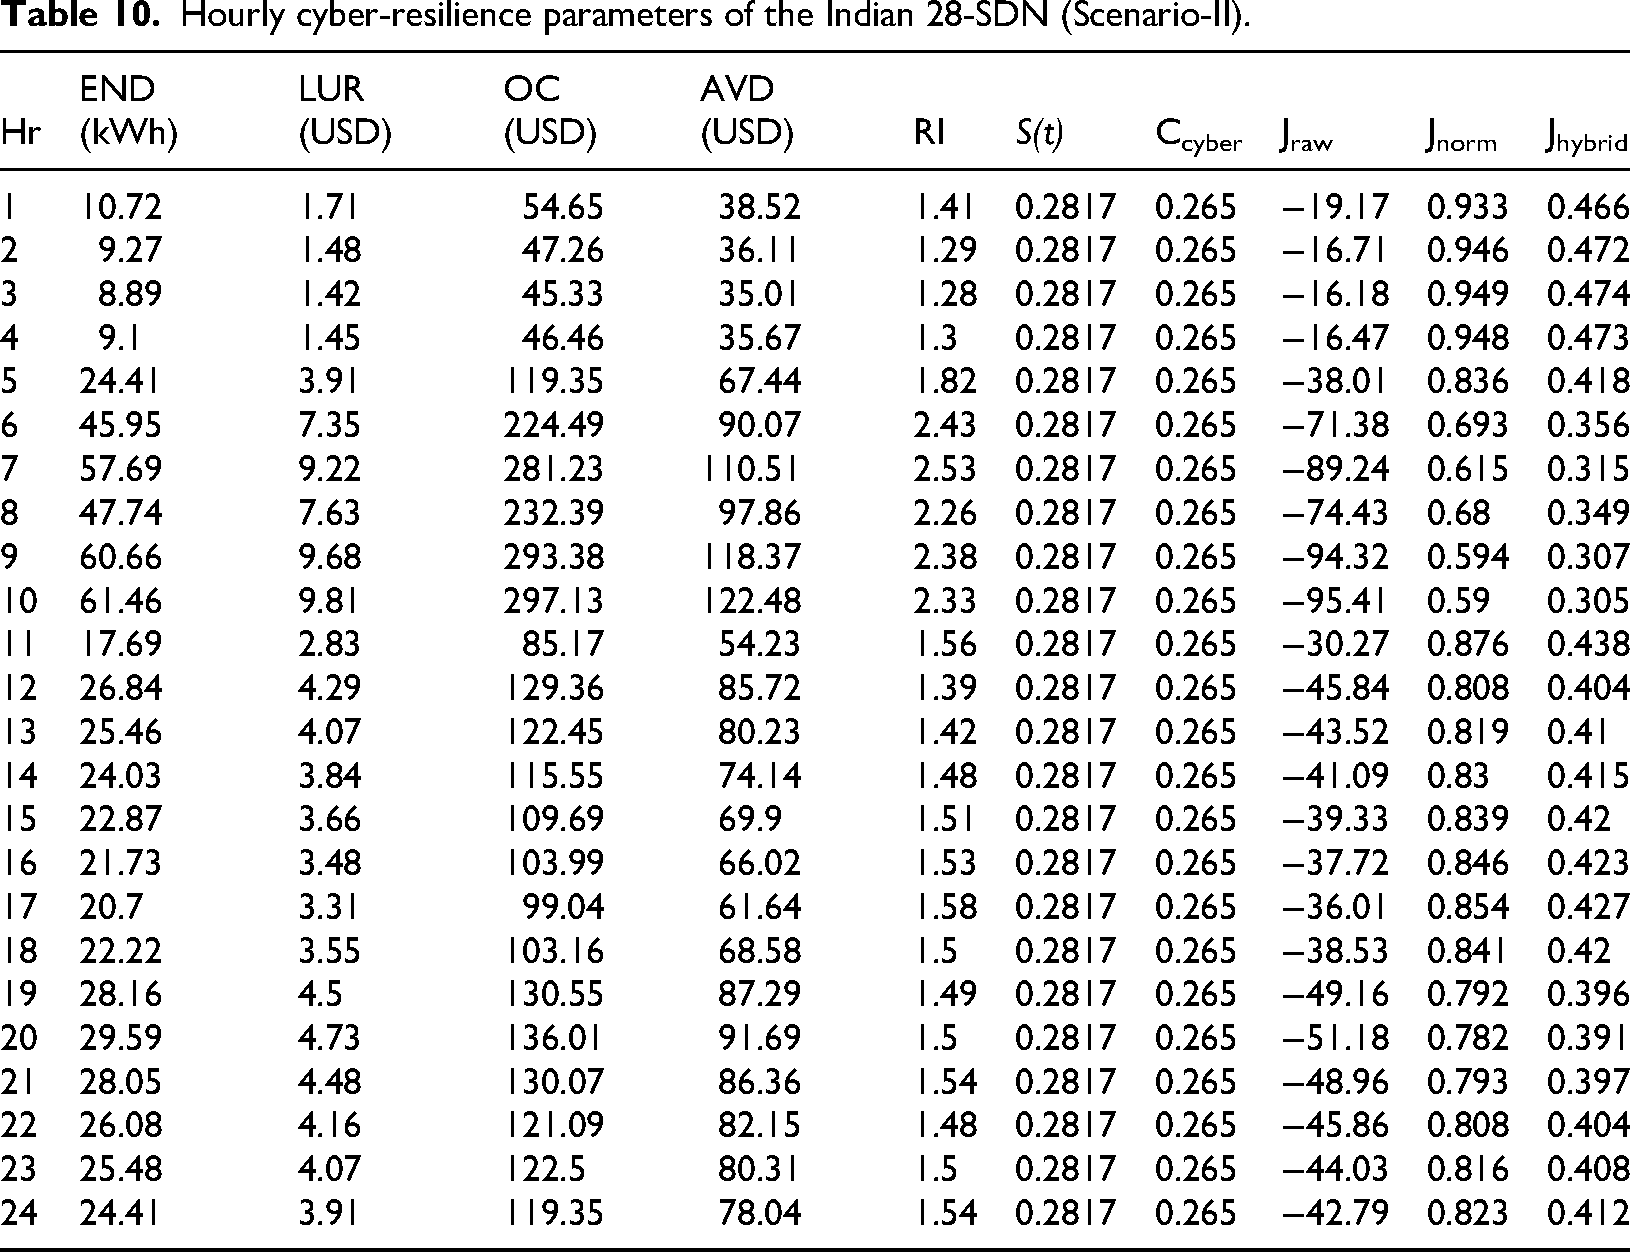
Scenario-II, which is tested under IEEE 34-bus SDN fault conditions and uses the proposed MG deployment as a cyber-resilient strategy, is depicted in Figure 15. Due to several problems on various buses, the system is completely disconnected from the main utility supply for an entire day. Seven MGs (MG-1 to MG-7) are created using OS to isolate faulty buses to enhance cyber-resilience. These MGs are either consumer-oriented or populated with a mix of prosumers and consumers. Specifically, buses 2‒6 are included in MG-1, buses 7‒12 in MG-2, buses 13‒16 in MG-3, buses 17‒21 in MG-4, buses 22‒27 in MG-5, buses 28‒30 in MG-6, and buses 31‒34 in MG-7. The remaining MGs (MG-3, MG-6, and MG-7) are entirely composed of consumers, while MGs 1, 2, 4, and 5 are composed of prosumers. The electricity generated by the consumers is used to meet the local energy needs of the respective MGs. Interestingly, no TL connections are made in this case for energy trading between MGs or between MGs. By isolating each MG, this method tests the ability to maintain stability and resilience using only localized energy from prosumer and demand-supply balancing mechanisms.
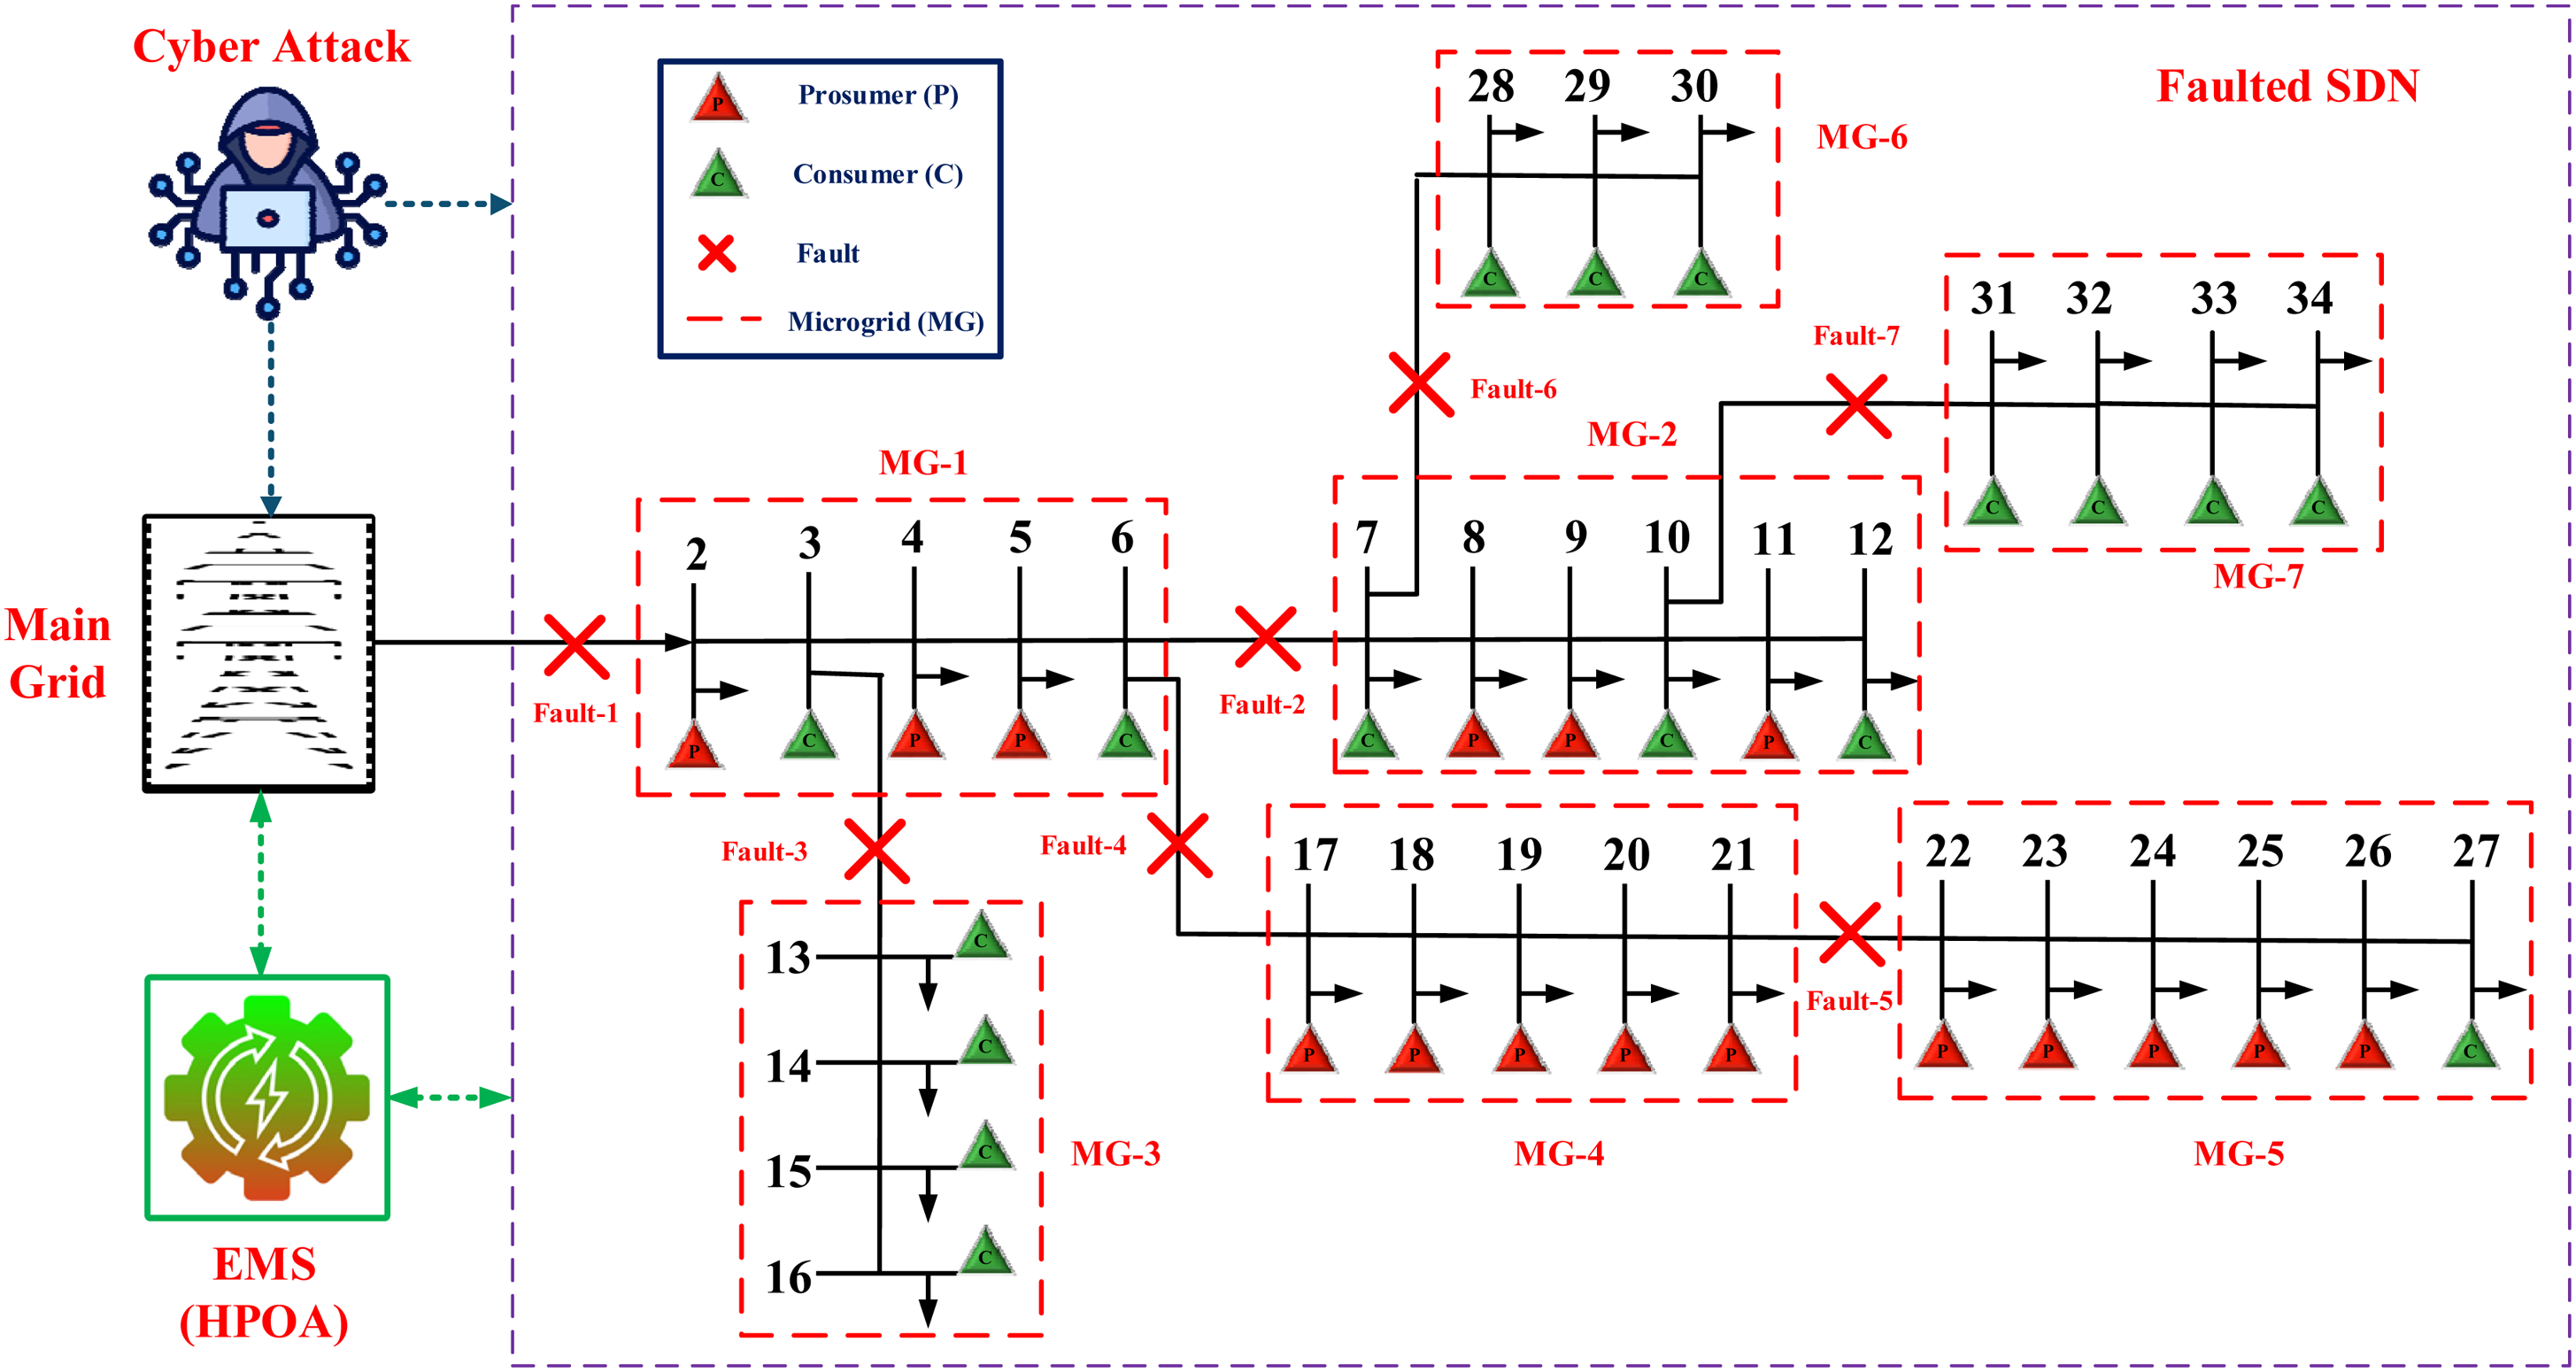
Faulted and cyber-attacked IEEE 34-SDN with MGs.
Table 11 and Figure 16 present the hourly power demand of every MG within an SDN. The demand of every MG is plotted for 24 h, while different lines from the plot show the power consumption of each of the seven MGs. The information depicts how the power demand changes regarding the time of day, grid, and usage of appliances. It enables one to better understand and optimize energy management strategies, including the use of energy storage systems together with IMT for load balancing to further enhance the resilience of the grid during fault or disaster recovery situations. This type of analysis is essential to enhance smart grid flexibility and reliability, especially for integrating renewable energy sources such as PVs and WTs.
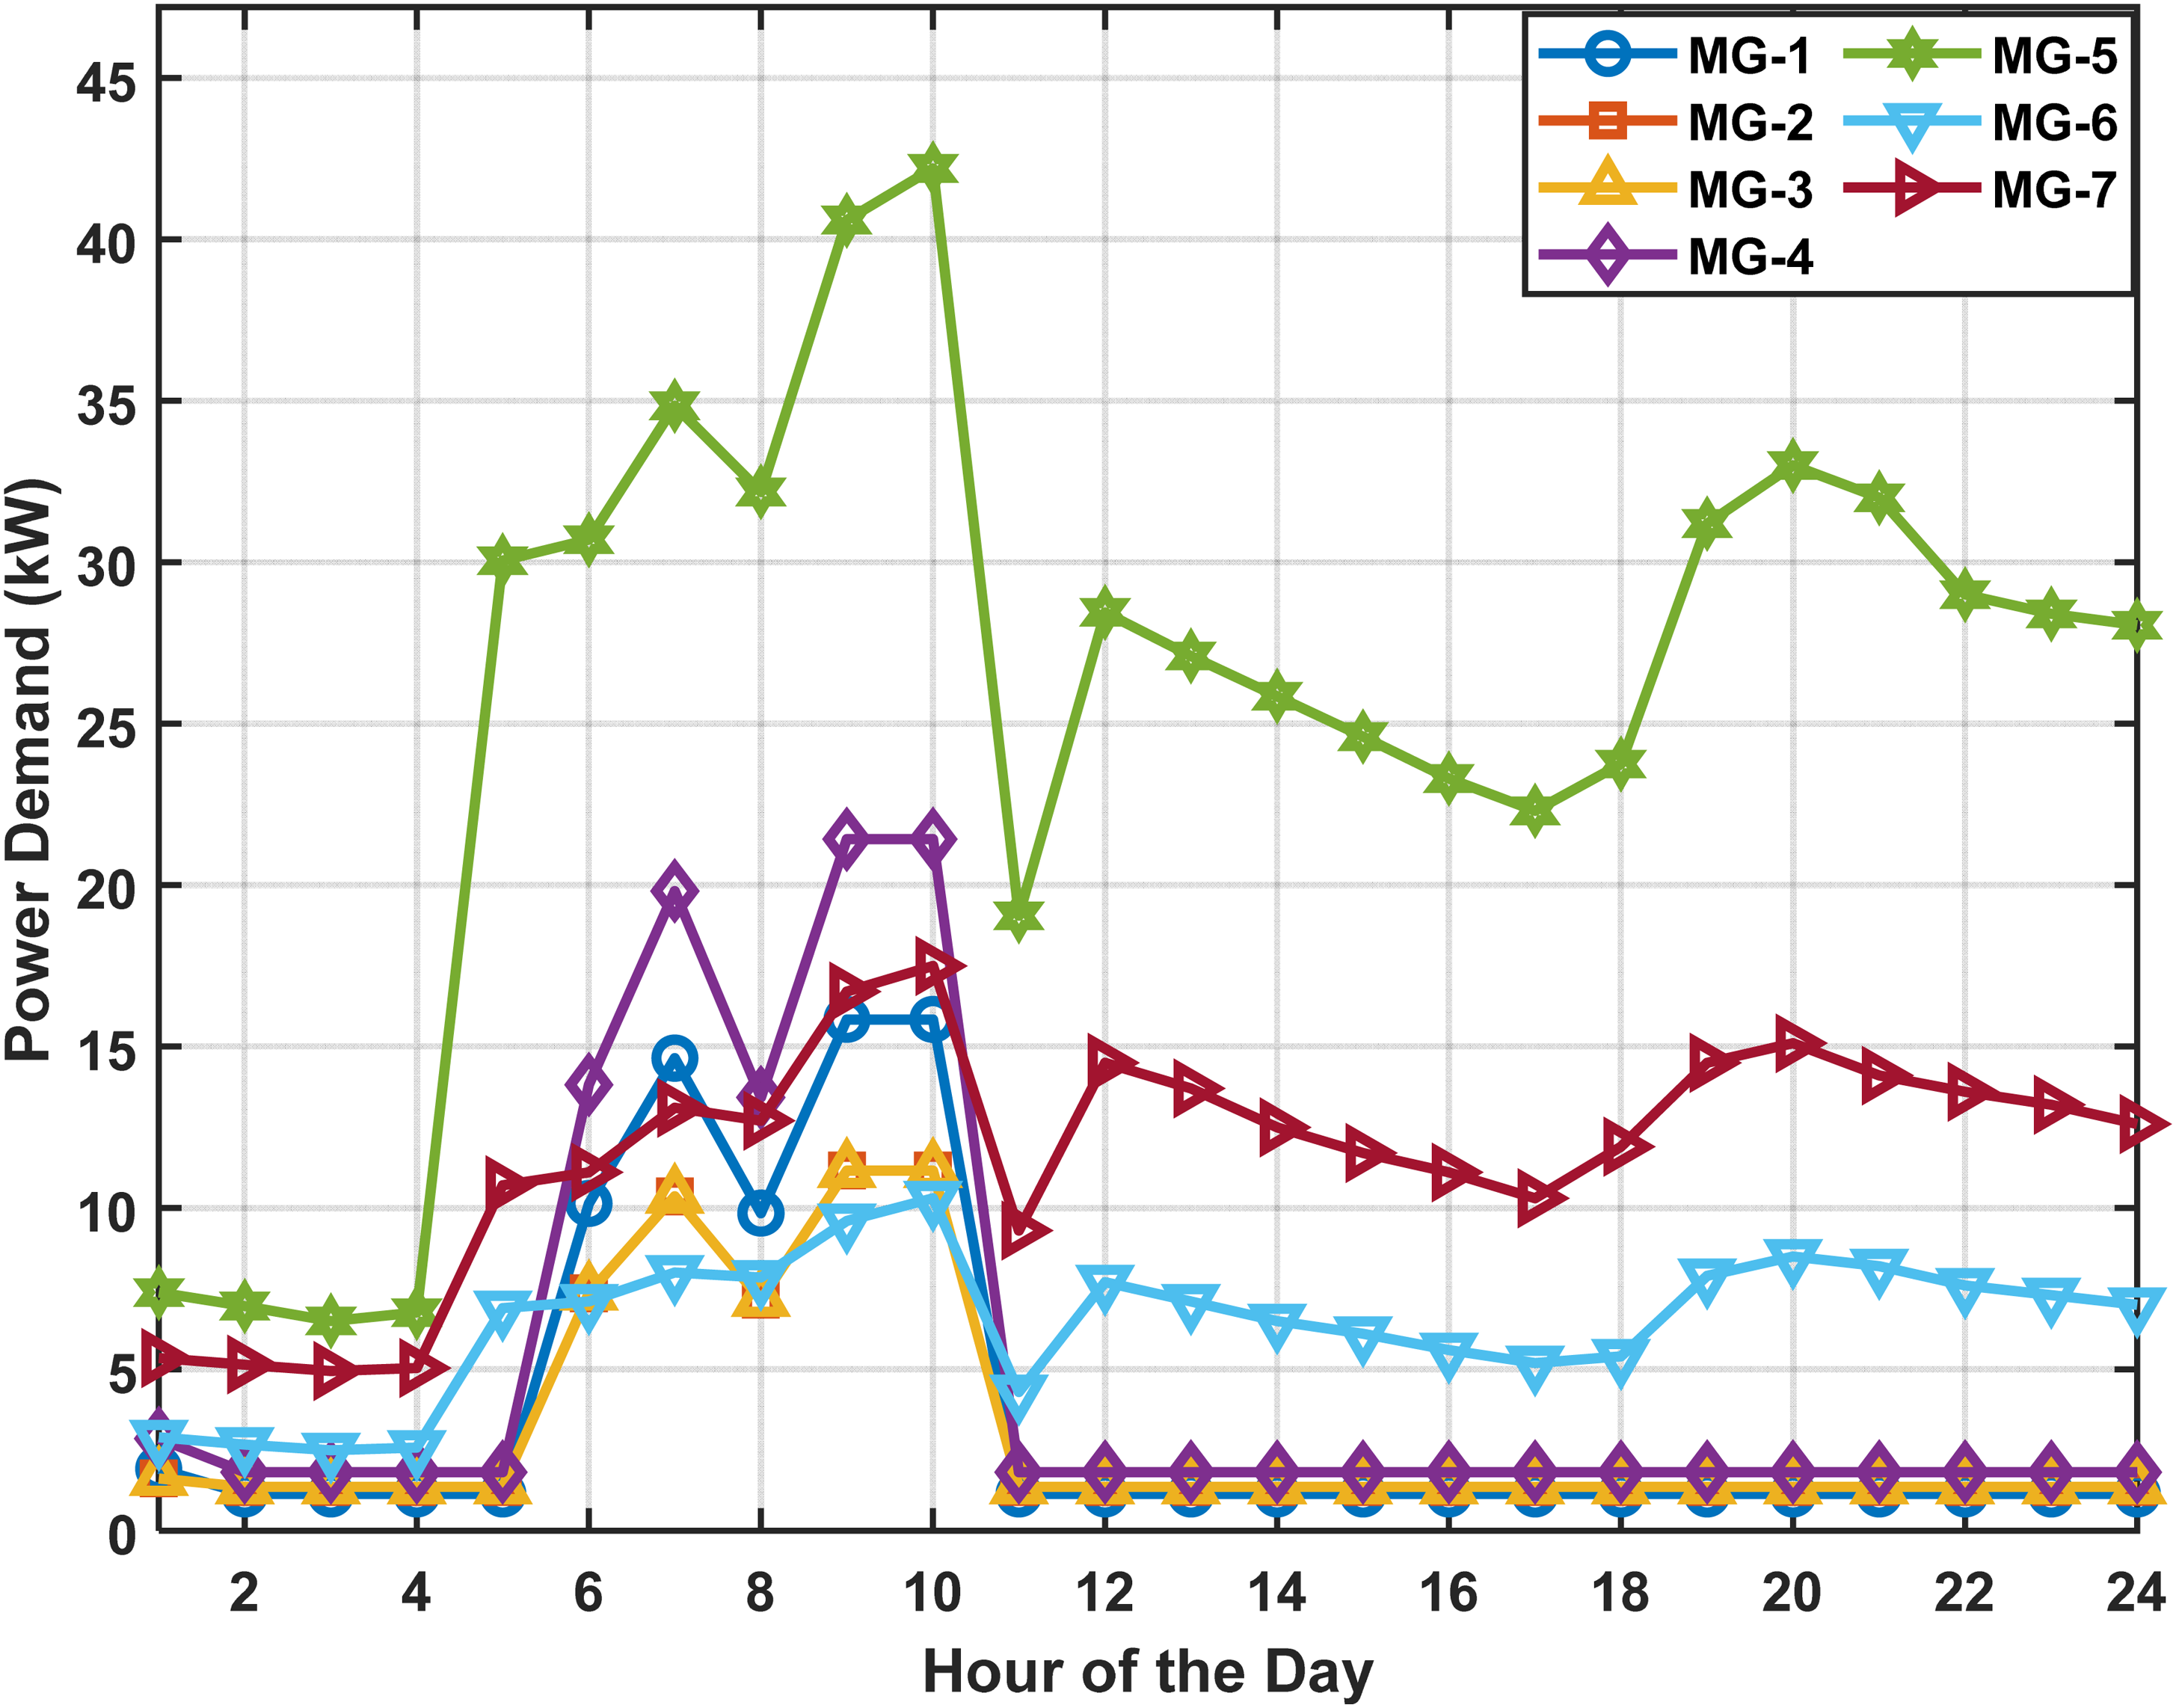
Hourly power demand of each MGs in IEEE 34-SDN.
Hourly power demand of each MGs in IEEE 34-SDN.
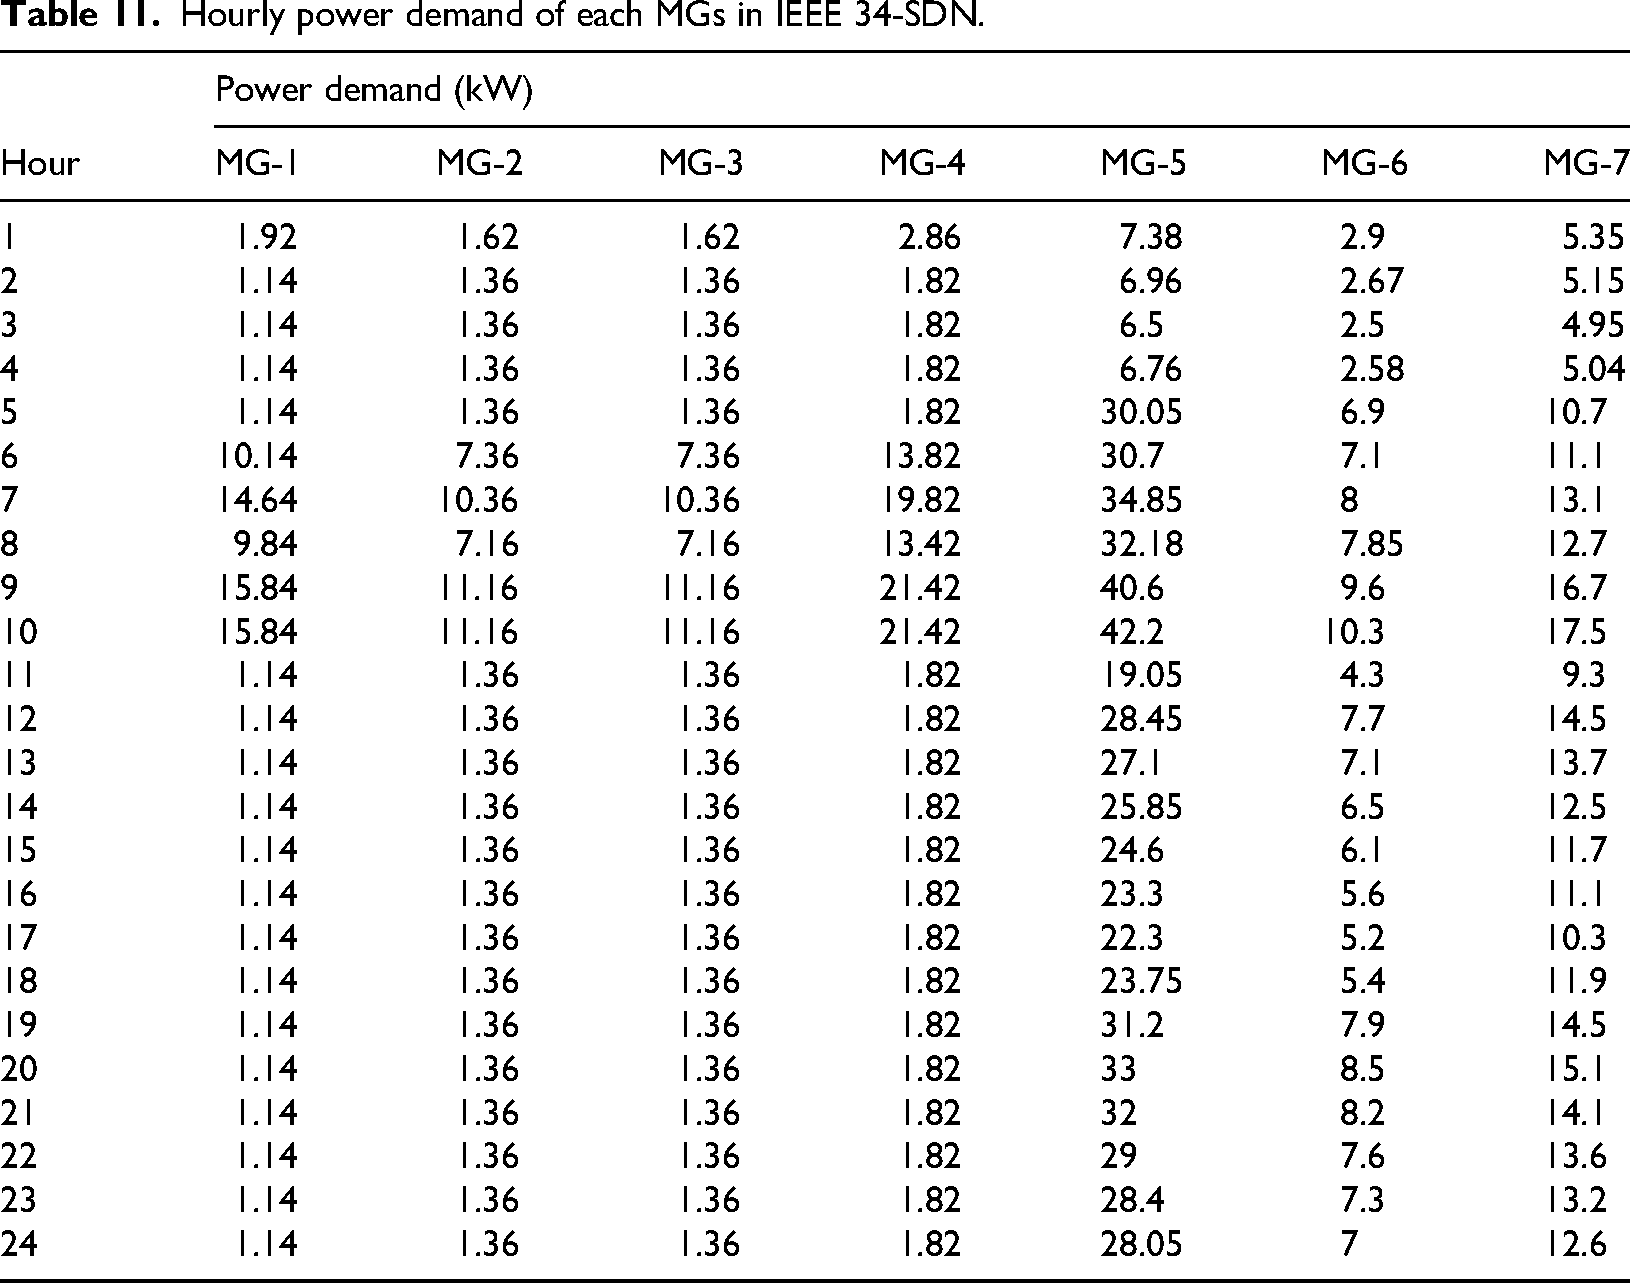
The hourly power generation of prosumers in four MGs (MG-1, MG-2, MG-4, and MG-5) in the integrated IEEE 34-bus SDN, taking into account the quantitative values, is given in Table 12. It shows different trends in the contributions of renewable energy over a 24-h period. The power output of MG-1 and MG-2 is relatively stable throughout the day, with regular fluctuations in the afternoon and evening. Similarly, MG-4 and MG-5 show stable power generation profiles, with peak generation rates in the afternoon and evening. Importantly, all MGs show high correlation in their generation patterns, indicating synchronized renewable resource availability based on variations in wind and solar power. The hourly contributions of prosumers in MG-1, MG-2, MG-4, and MG-5 are shown in Figure 17, which provides a visual interpretation of the data from Table 12. These trends, which stabilize at low light levels in the afternoon, are consistent with the expected patterns of renewable energy generation. The above dynamics underscore the significant impact that customer contributions from PV and WT generation have on MG performance, underscoring the importance of DER integration in improving resiliency in fault-prone SDNs.
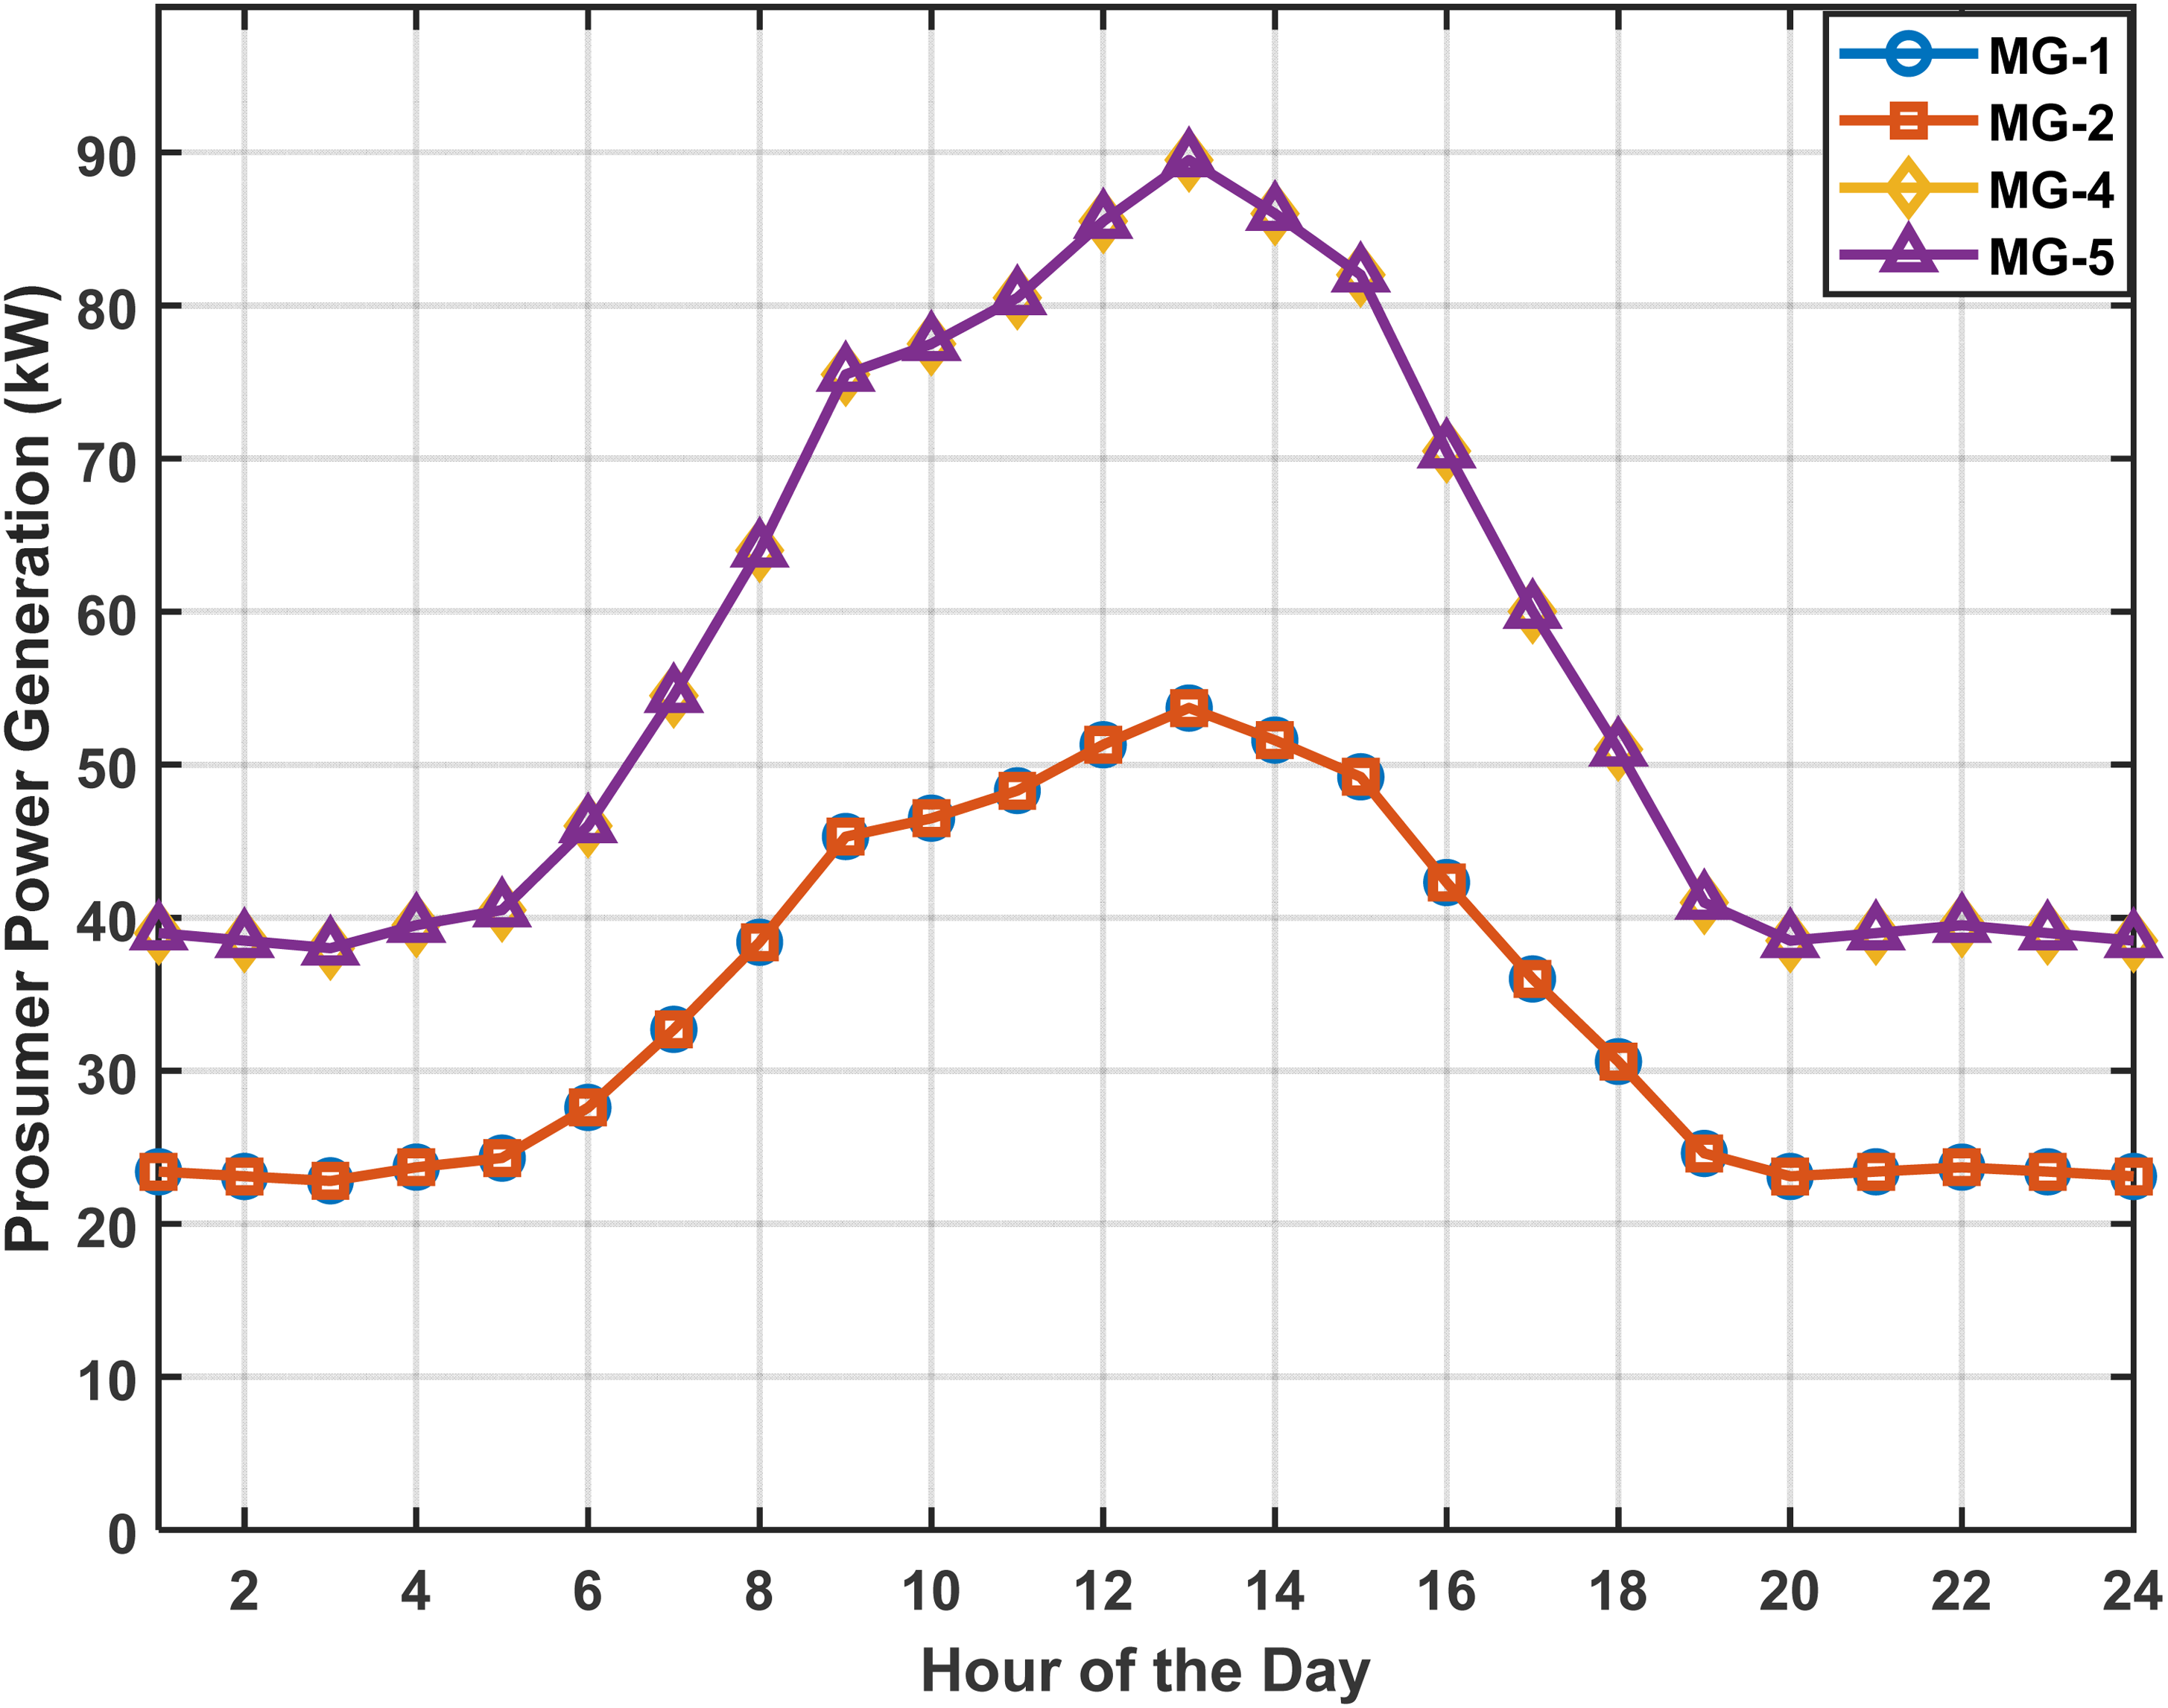
Hourly power generation by Prosumer's MGs in IEEE 34-SDN.
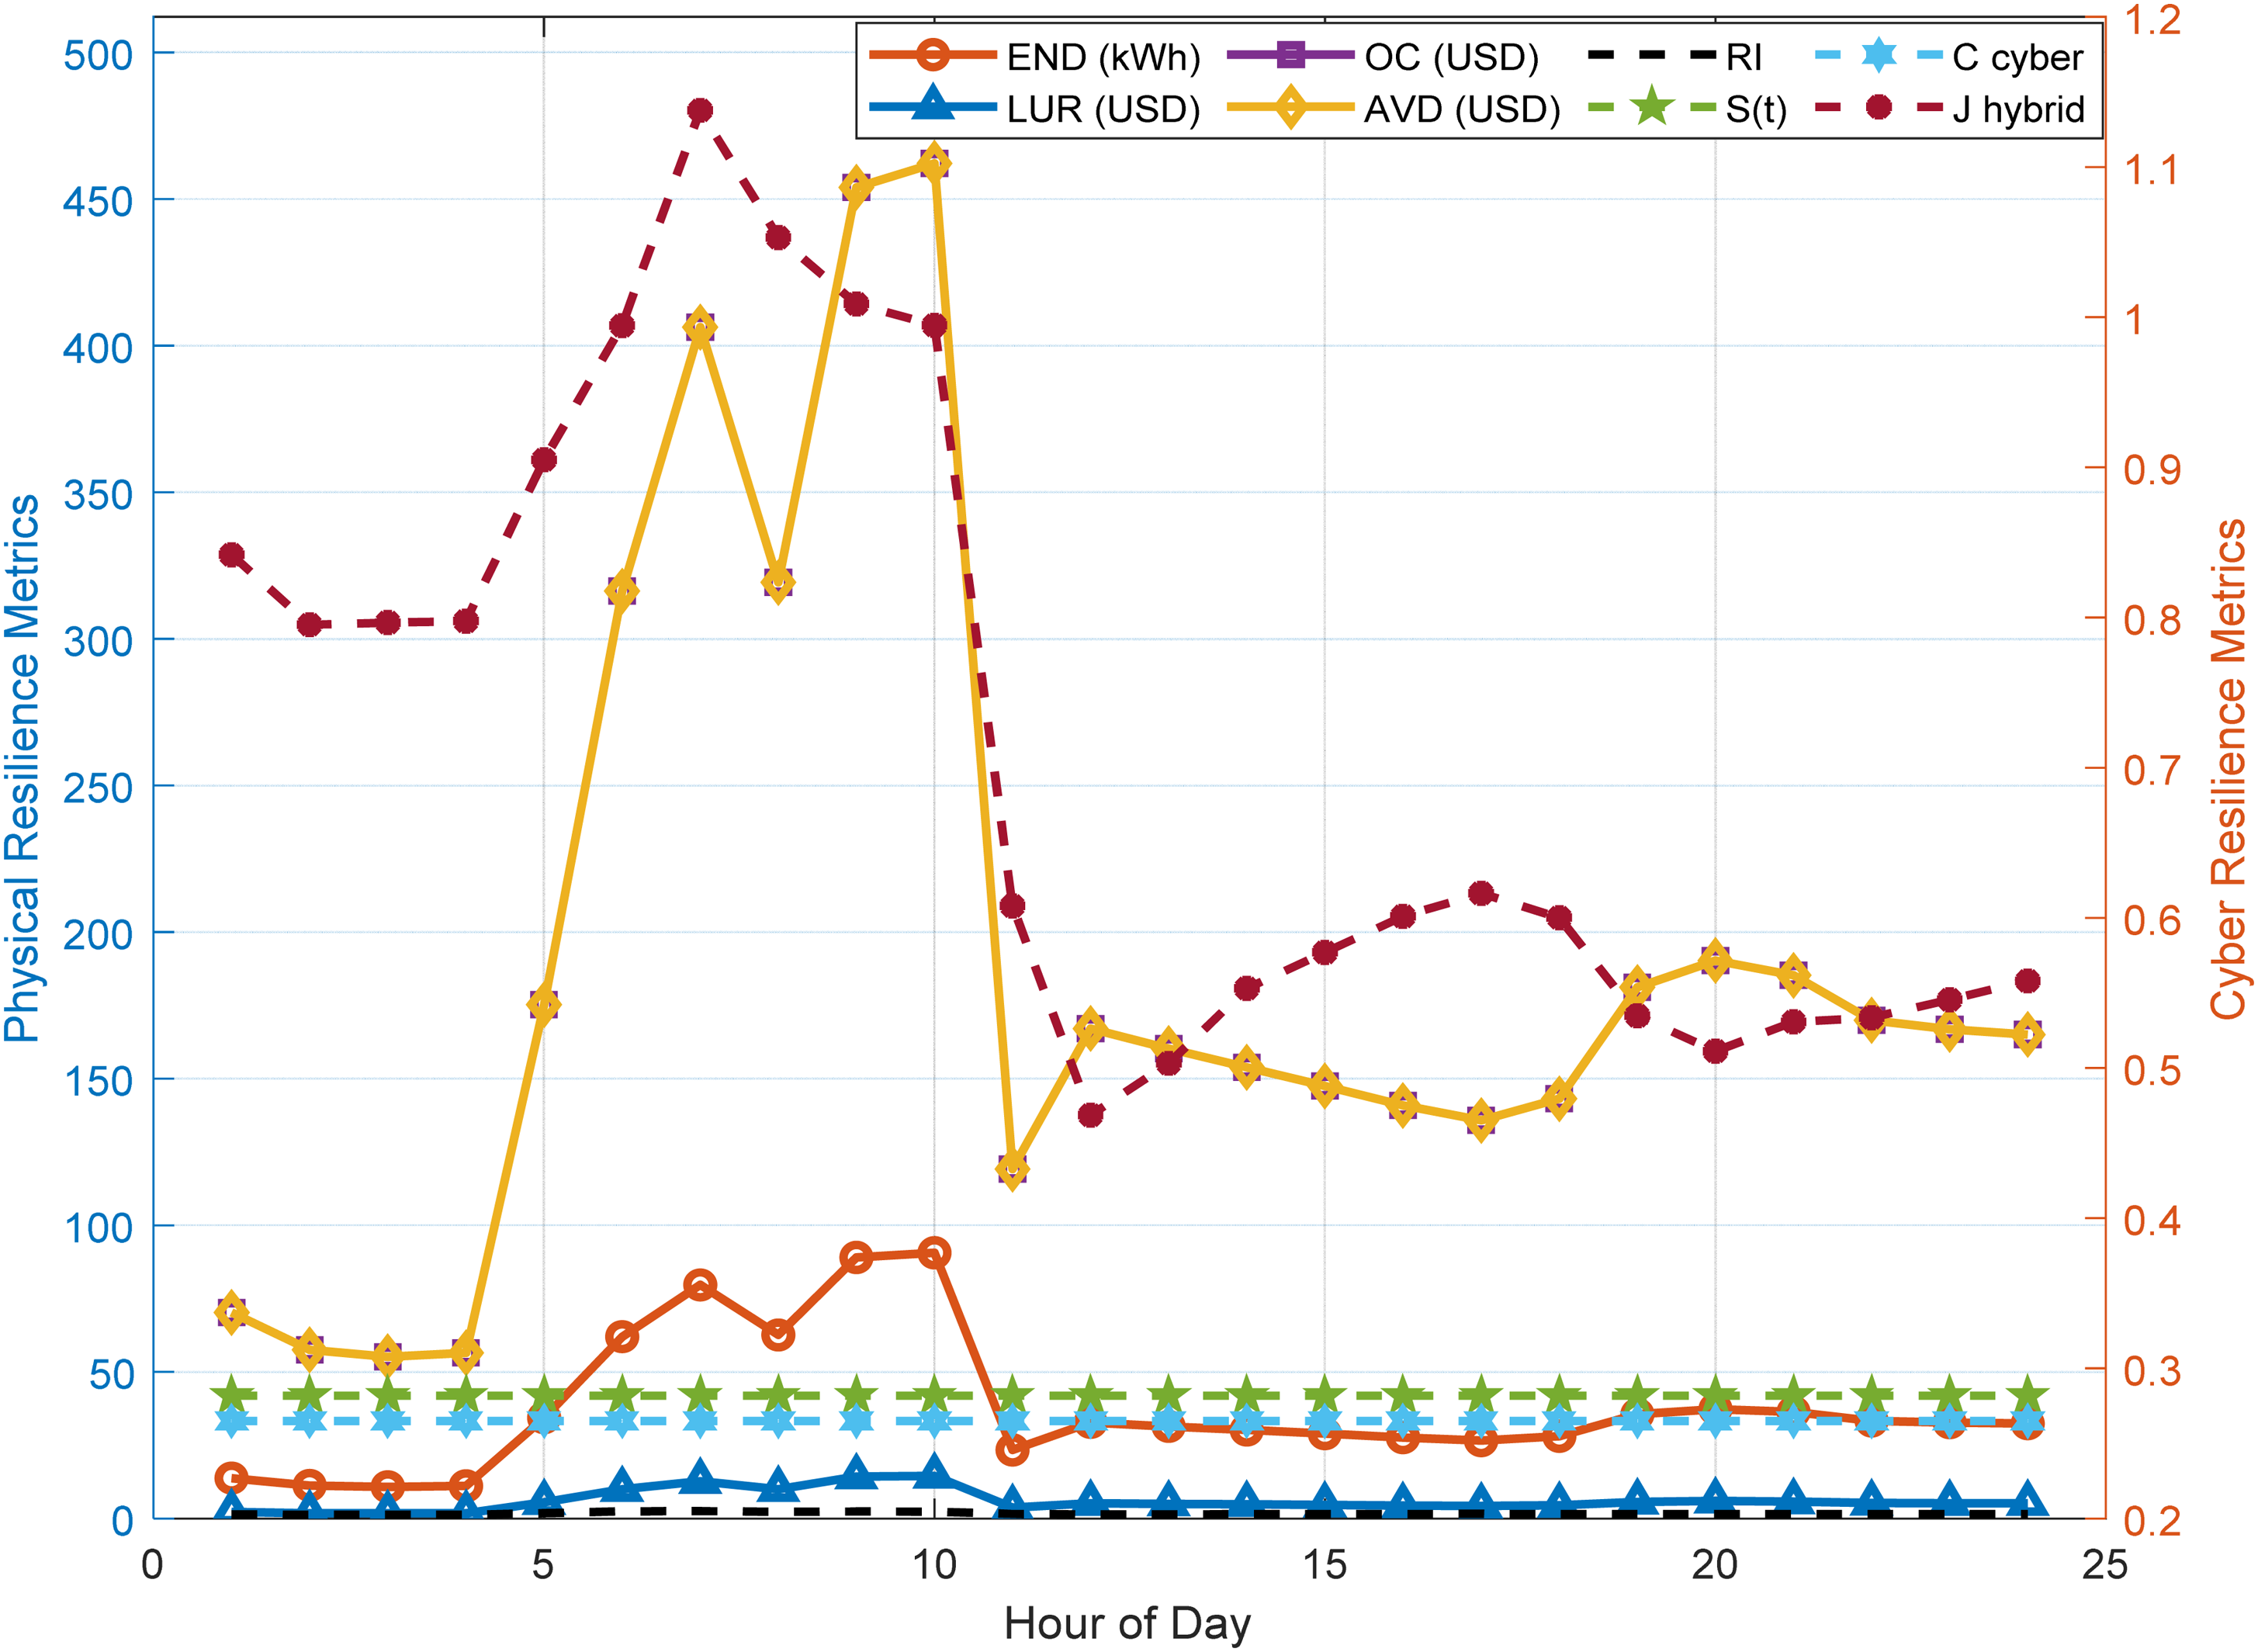
Hourly cyber-resilience parameters of IEEE 34-SDN (Scenario-II).
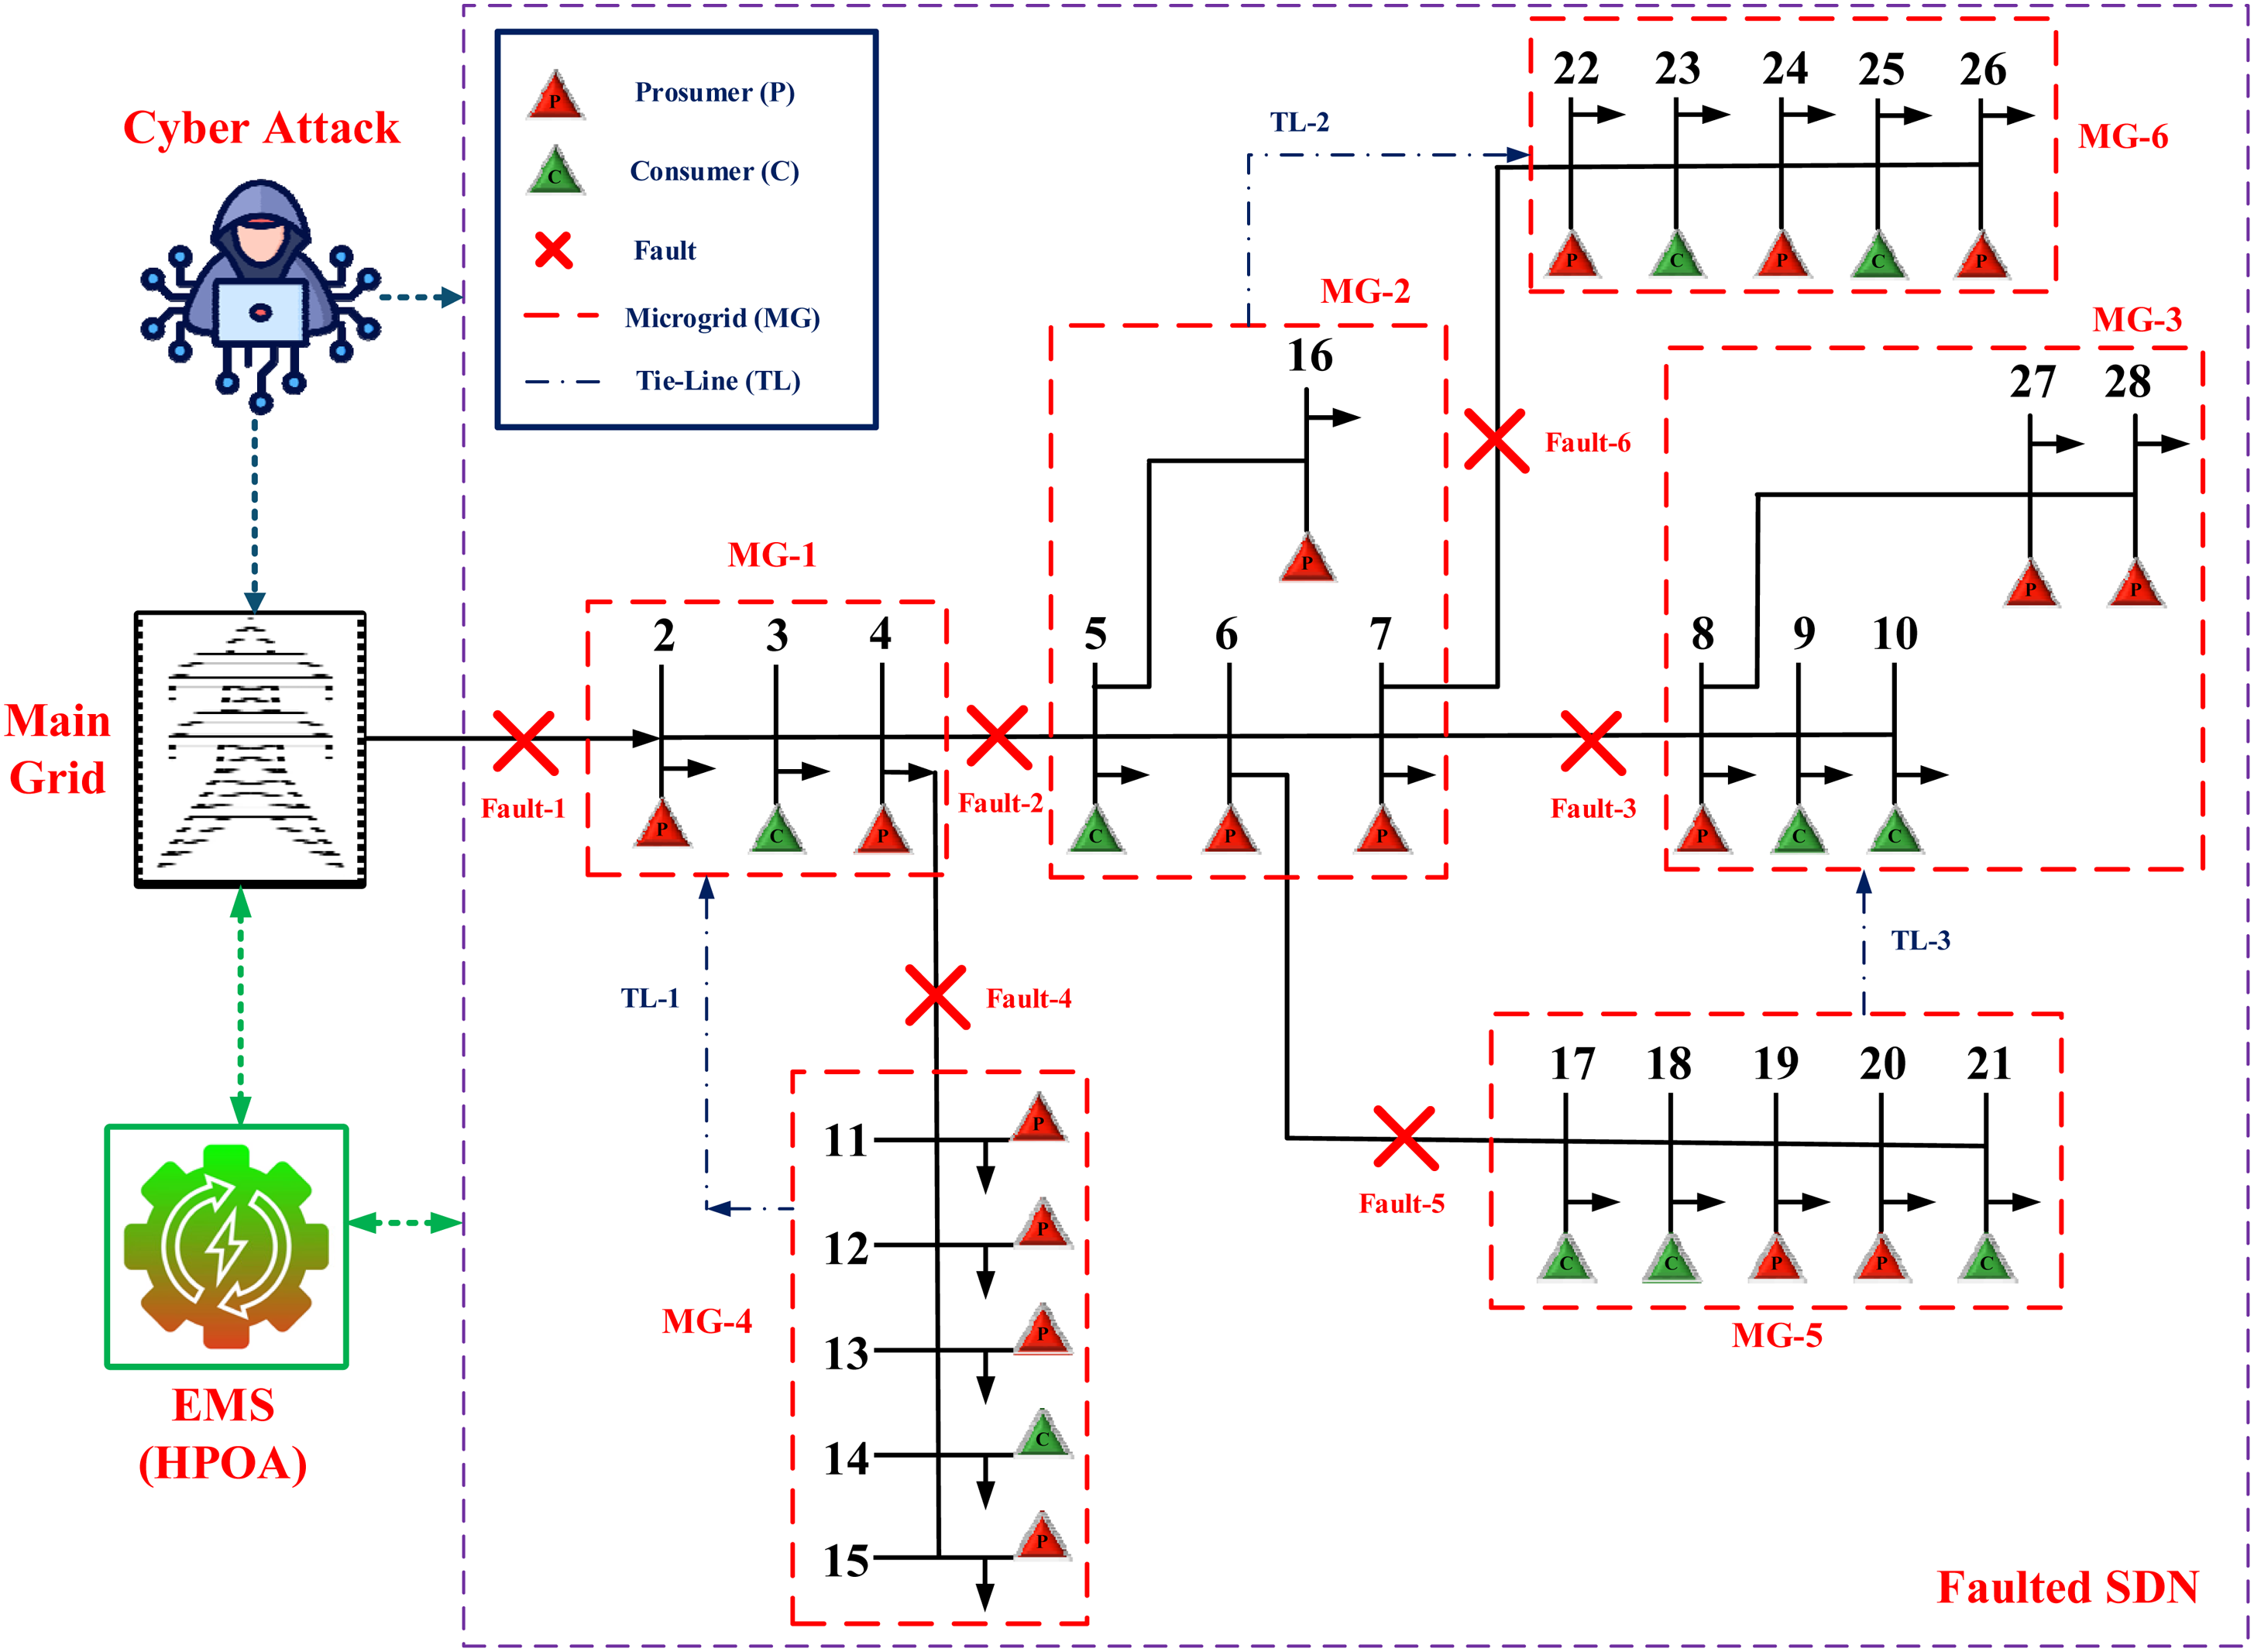
Faulted and cyber-attacked Indian 28-SDN with MGs and TLs.
Hourly power generation of prosumers in MGs in IEEE 34-SDN.
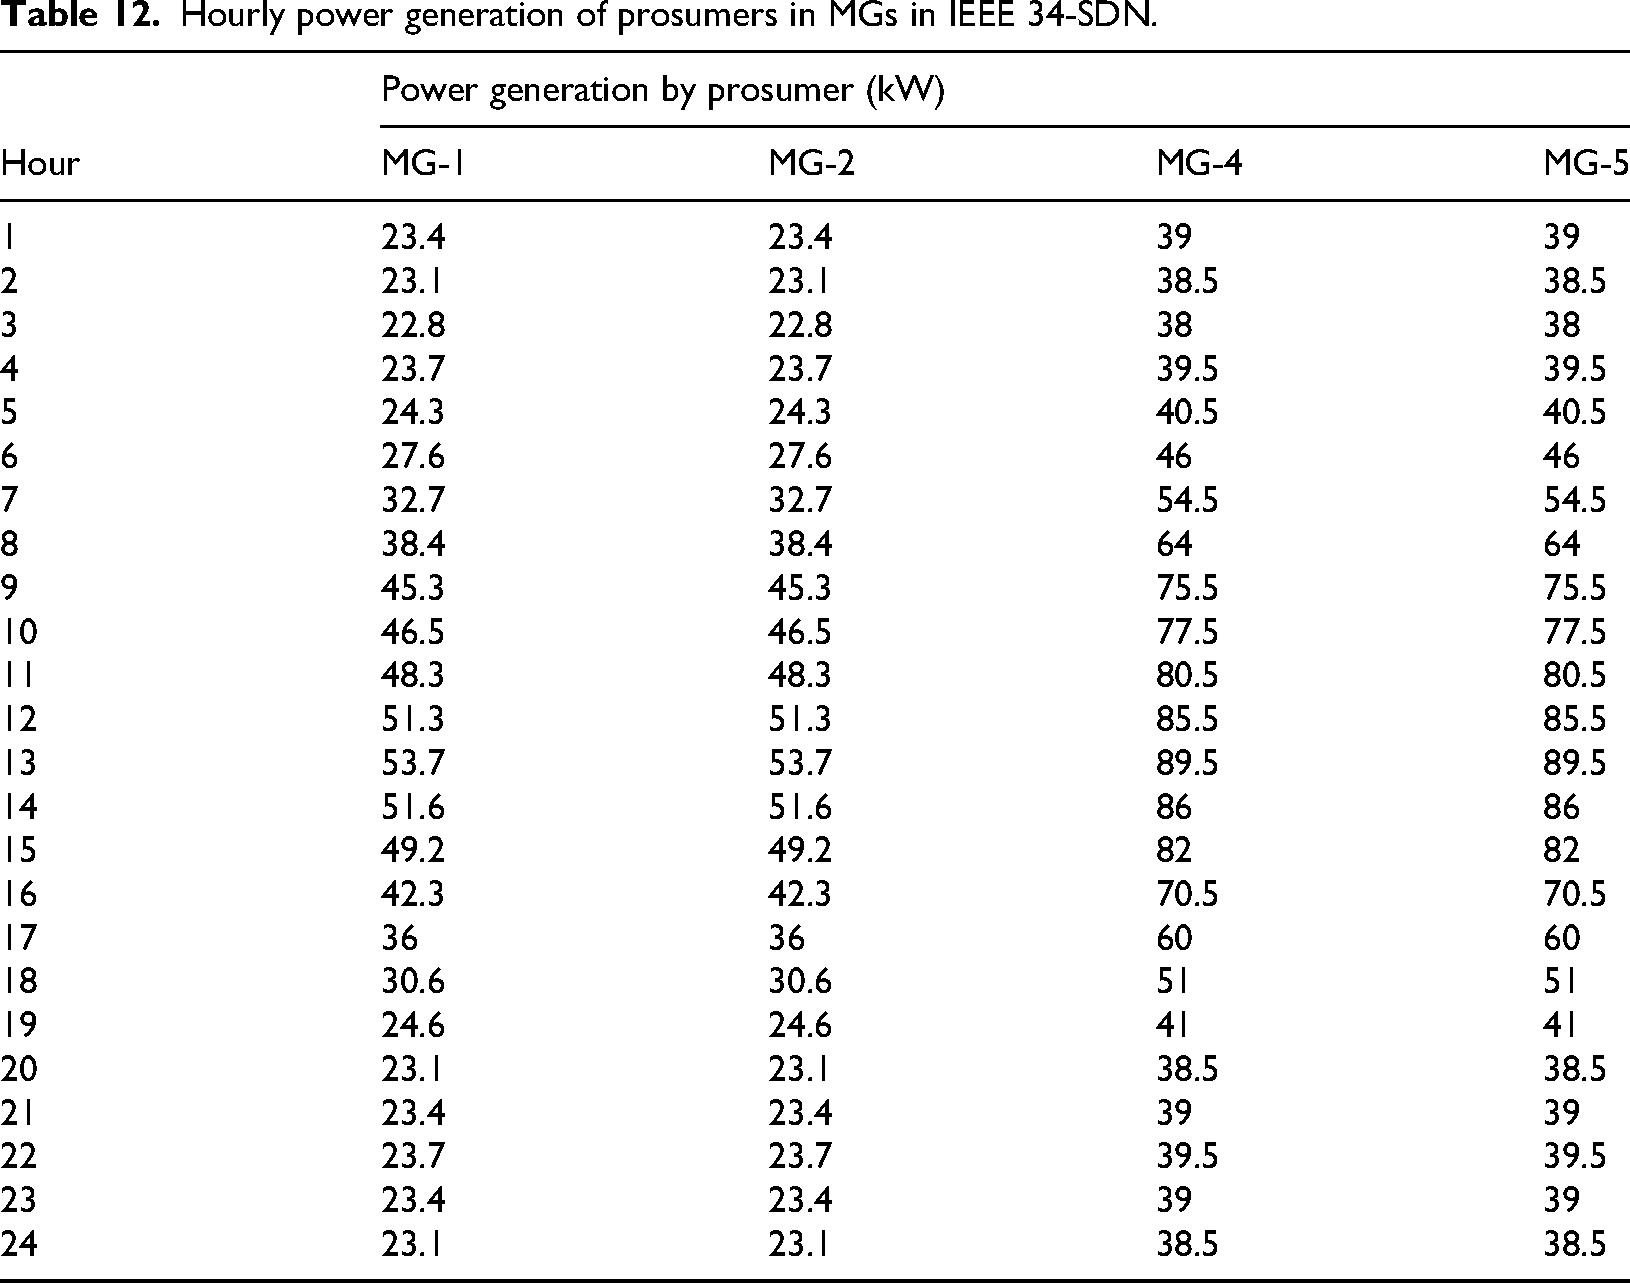
The updated hourly cyber-physical resilience parameters of IEEE 34-SDN under Scenario-II, with multiple MGs and residential experts actively supporting system recovery during fault-induced islanding, are shown in Table 13 and Figure 18. Compared to Scenario-I, the END is significantly decreased throughout the day by the MG-enabled architecture. A considerable improvement in supply restoration is demonstrated by the total END being decreased from 1.4 MWh (Scenario-I) to roughly 690 kWh as a result of the combined PV–WT generation, BESS discharge, and V2G support. LUR and OC both exhibit notable declines; peak OC now reaches about 462 USD (hour 10), significantly less than the 660+ USD seen in the absence of MGs. The suggested MG strategy successfully offsets economic losses by supplying necessary loads during islanding periods, as evidenced by the constantly rising AVD. At 7 hours, the physical RI reaches 2.5324 and stays above 1.2, indicating the markedly enhanced adaptive capacity made possible by prosumer-based resilience. In addition to physical recovery, the cyber control success probability stays constant at S(t) = 0.2817, which indicates constant cyber stress conditions imposed by communication latency, packet loss, and attack intensity. Despite this, MGs maintain stable operations through the use of local intelligence and distributed decision support.
Hourly cyber-resilience parameters of the IEEE 34-SDN (Scenario-II).
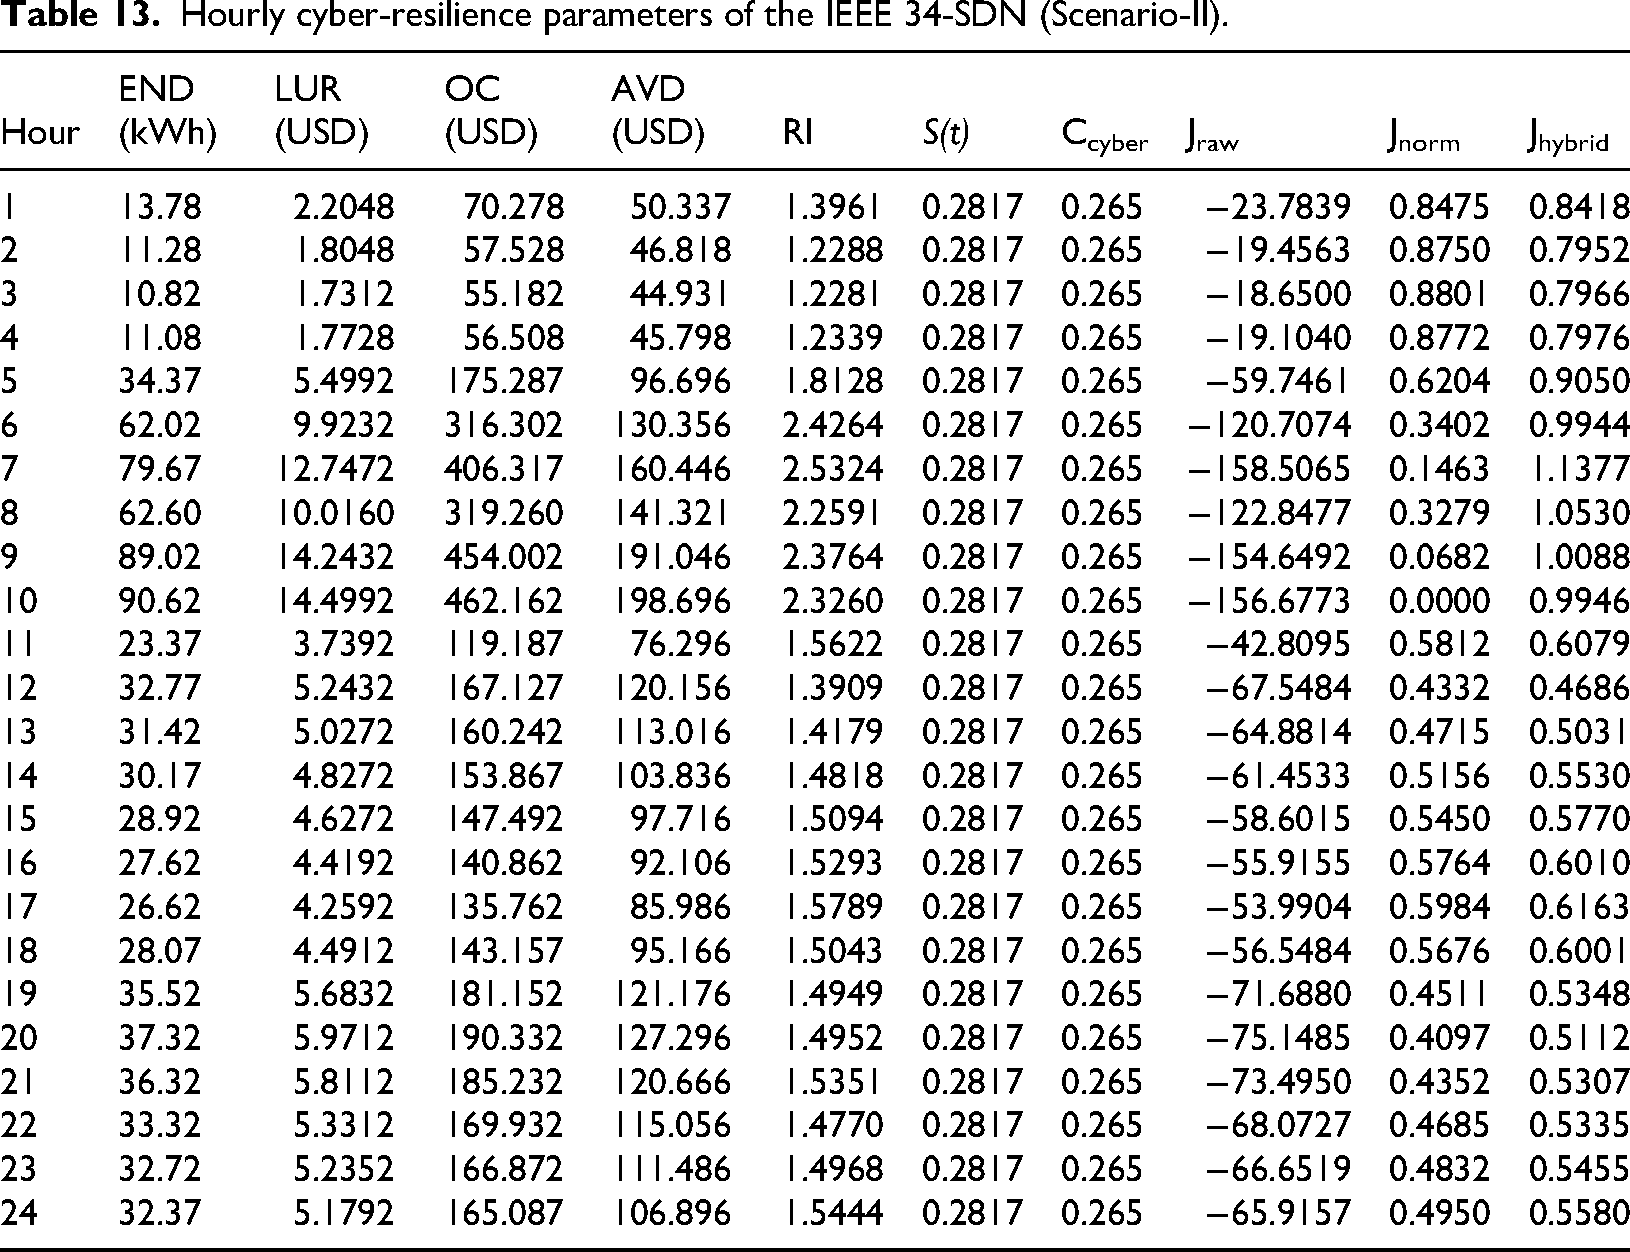
The combined cyber-economic-physical performance is reflected in the objective function values. Although significantly better than Scenario-I, the raw objective Jraw is still negative due to the residual outage costs. While the hybrid resilience index (Jhybrid) consistently outperforms Scenario-I in all time periods, indicating improved cyber-physical resilience, the normalized scores (Jnorm) perform better during the early morning and late night hours with lower recovery costs. The updated results show that the use of MG, combined with distributed DERs and integrated HPOA-based control, significantly improves system recovery, reduces financial losses, increases operational continuity, and maintains resilience in the face of cyberattacks and multi-fault stresses.
(iii) Scenario-III (Faulted and Cyber-Attacked SDN with MGs and TLs)
(a) Indian 28-SDN
Scenario-III evaluates the cyber-physical resilience of an Indian 28-bus SDN with multiple simultaneous faults, using MG formation and dynamic TL interconnections within the proposed topology-aware IMT framework (Figure 19). To enable secure and coordinated power transfer when the system goes fully islanded from upstream utility as a result of combined fault events, TLs are selectively energized between MG-4 ↔ MG-1, MG-2 ↔ MG-6 and MG-5 ↔ MG-3. Unlike Scenario-II where each MG operates independently, the TL-assisted architecture allows surplus PV-WT-BESS-BEV power in one MG to support the deficit areas in another, greatly accelerating the reconfiguration process. IMT-enabled power routing reduces END and stops local storage resource depletion in a short recovery phase (7–10 h), which reduces the effects of outages. END approaches zero at 10 h, ensuring continuous power supply for the remaining 21 h. Even if cyber-attack pressure on communication links continues, local control of supply remains stable, enabling efficient supply-demand coordination. The Indian 28-bus system uses the same IEEE-standard power pricing framework as the IEEE 34-SDN analysis, allowing a wider global audience to easily understand the data and allow for a fair comparison of the two networks. Compared to traditional island MG operation, AI-guided TL reconstruction shows significant improvements in cyber-physical resilience, blackout reduction, and overall financial performance. Future self-healing, fault-tolerant, and cyber-resilient smart distribution systems require secure MG interconnection and IMT-driven integration, as demonstrated by Scenario-III.
The hourly cyber-physical resilience parameters of the Indian 28-SDN under Scenario-III are shown in Table 14, which enables rapid system recovery through the coordinated operation of MGs with optimized TL interconnections in the presence of multiple simultaneous faults and cyber intrusions. For most of the simulation period, the proposed IMT-assisted network restoration ensures total outage elimination. All physical outage indicators such as END, LUR, OC, AVD remain at zero between hours 1 and 6 and between hours 11 and 24, indicating complete supply restoration and continuous operation. As a result, the RI is infinite, ensuring flawless service recovery even in the event of a cyberattack-induced communication breakdown. When MGs actively implement the reconfigured power distribution, a short recovery transition occurs only between hours 7 and 10. During this time, while OC rapidly decreases from 47.95 USD to just 5.54 USD, END gradually decreases from 9.83 kWh at 7 h to 1.15 kWh at 10 h. The corresponding AVD demonstrates strong mitigation of the economic impacts associated with power outages, which improves significantly and reaches 135.92 USD at 10 h. Although the distributed MG ensures autonomous service continuity, the cyber control success probability remains constant at S(t) = 0.2817, which is consistent with the sustained cyber-attack pressure. At 22 h in 24 h, the normalized objective and hybrid resilience scores are 0.998 and 0.812, respectively, which significantly outperforms Scenarios-I and -II. All things considered, the results of Scenario-III demonstrate that TL-based IMT integration allows for rapid PS reconfiguration, 100% load recovery within 91.7% uptime, >95% OC reduction, and significant improvement in hybrid cyber-physical resilience, all of which contribute to secure and stable grid behavior when faced with severe cyber-physical disturbances. The superior resilience achieved through smart MG-TL collaboration is graphically reinforced by the performance trend in Figure 20.
Hourly resilience parameters of for Indian 28-SDN (Scenario-III).
Hourly cyber-resilience parameters of the Indian 28 (Scenario-III).
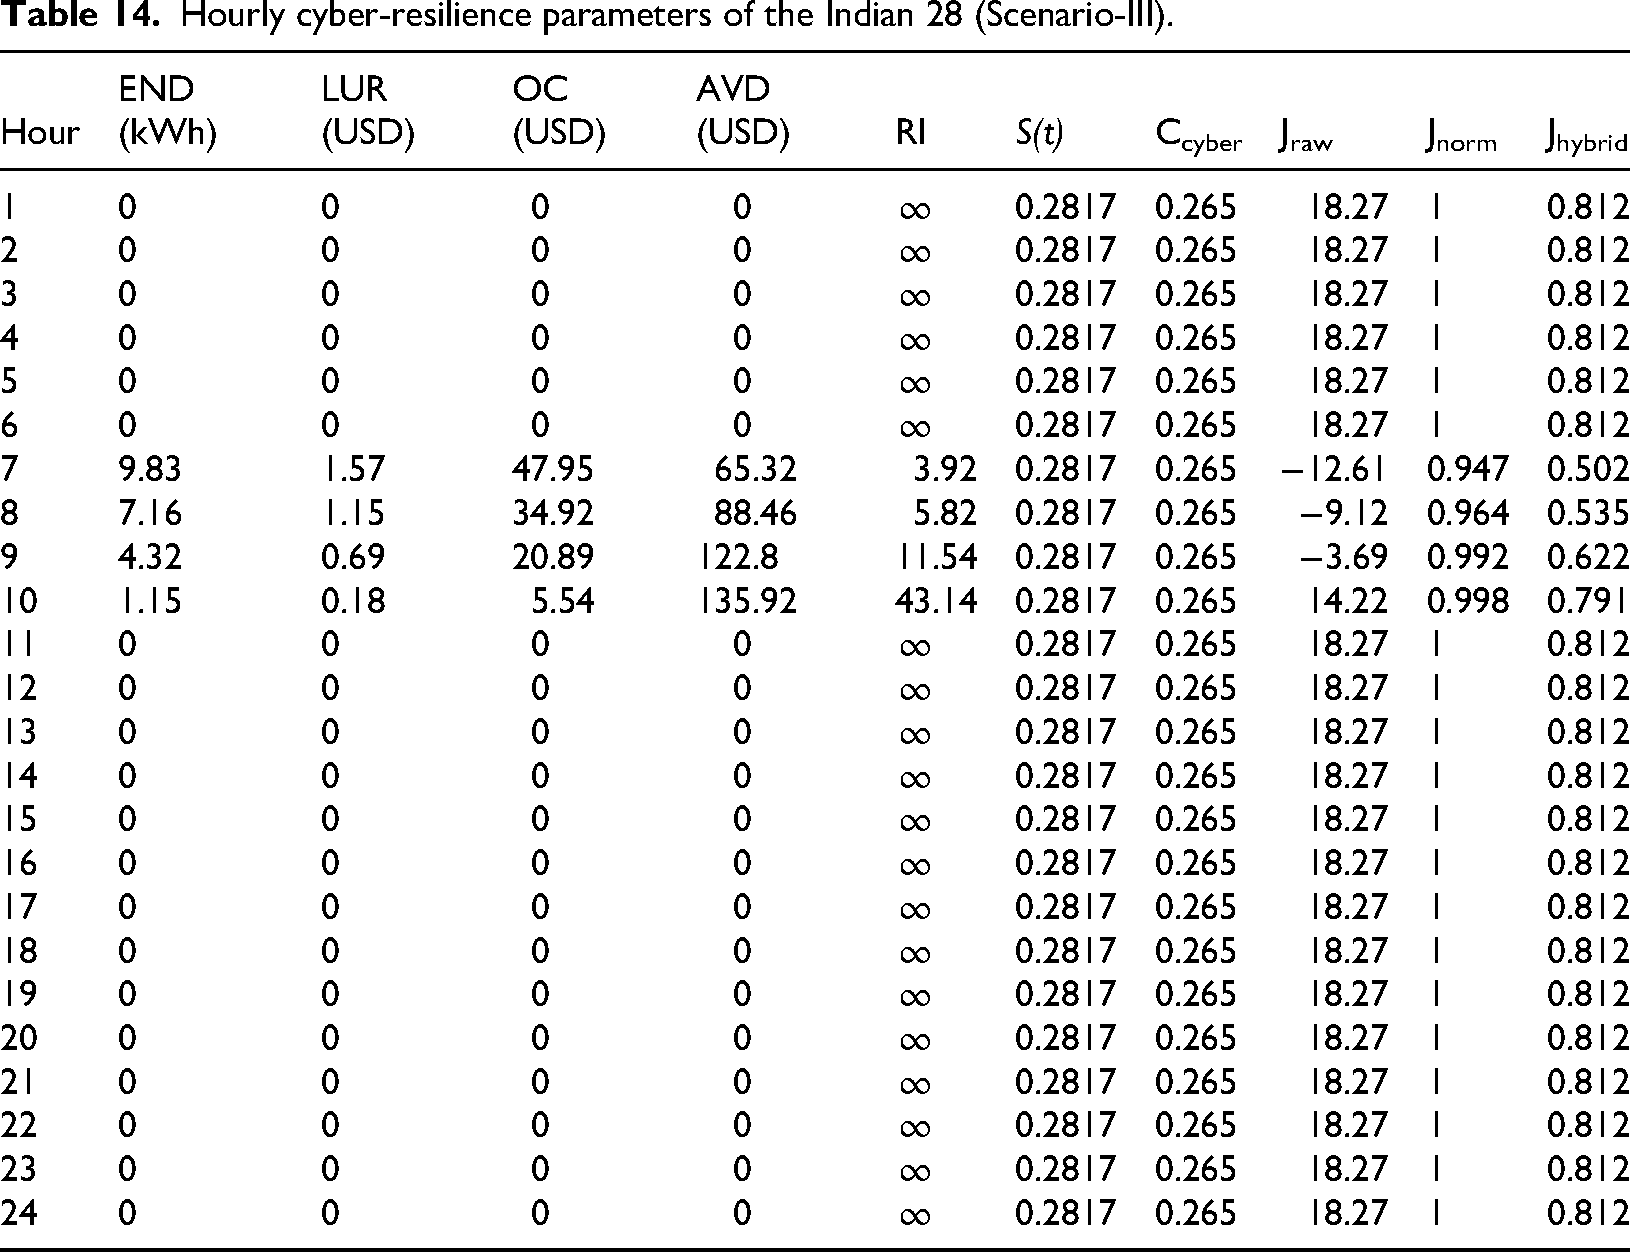
The hourly IMT performance of the Indian 28-bus SDN under Scenario-III, with MGs communicating via TLs dynamically enhanced by the proposed IMT architecture, is shown in Table 15. Three-trading routes (MG-1→MG-3, MG-2→MG-6, and MG-5→MG-7) allow P2P power exchange throughout the day based on local renewable availability and current market prices. Due to low price incentives and low requirements for demand support, trading revenues are still very low during the early off-peak hours (1–6), although they gradually increase as electricity prices rise in the morning. The convergence of rising electricity prices, increasing renewable energy generation, and increasing demand has led to a significant improvement in trading activity. TL-based recovery aggregation, price arbitrage, and surplus electricity routing are successfully using MG to address the shortage, as demonstrated by recording a maximum turnover of 43.052 USD in 10 h. Evening and night hours show stable revenue patterns in the range of 7–15 USD/h, reflecting continuous but nonaggressive trading under steady-state operating conditions, while afternoon hours ensure moderate trading revenue as the system experiences balanced supply-demand conditions. Overall, the findings demonstrate that the MG collaboration enabled by IMT, including generation energy exchange, reduced local shortages, and improved adaptive flexibility during islanding caused by faults, are all ways to greatly enhance cyber-physical and economic resilience.
Hourly energy trading for Indian 28-SDN using proposed IMT technique.
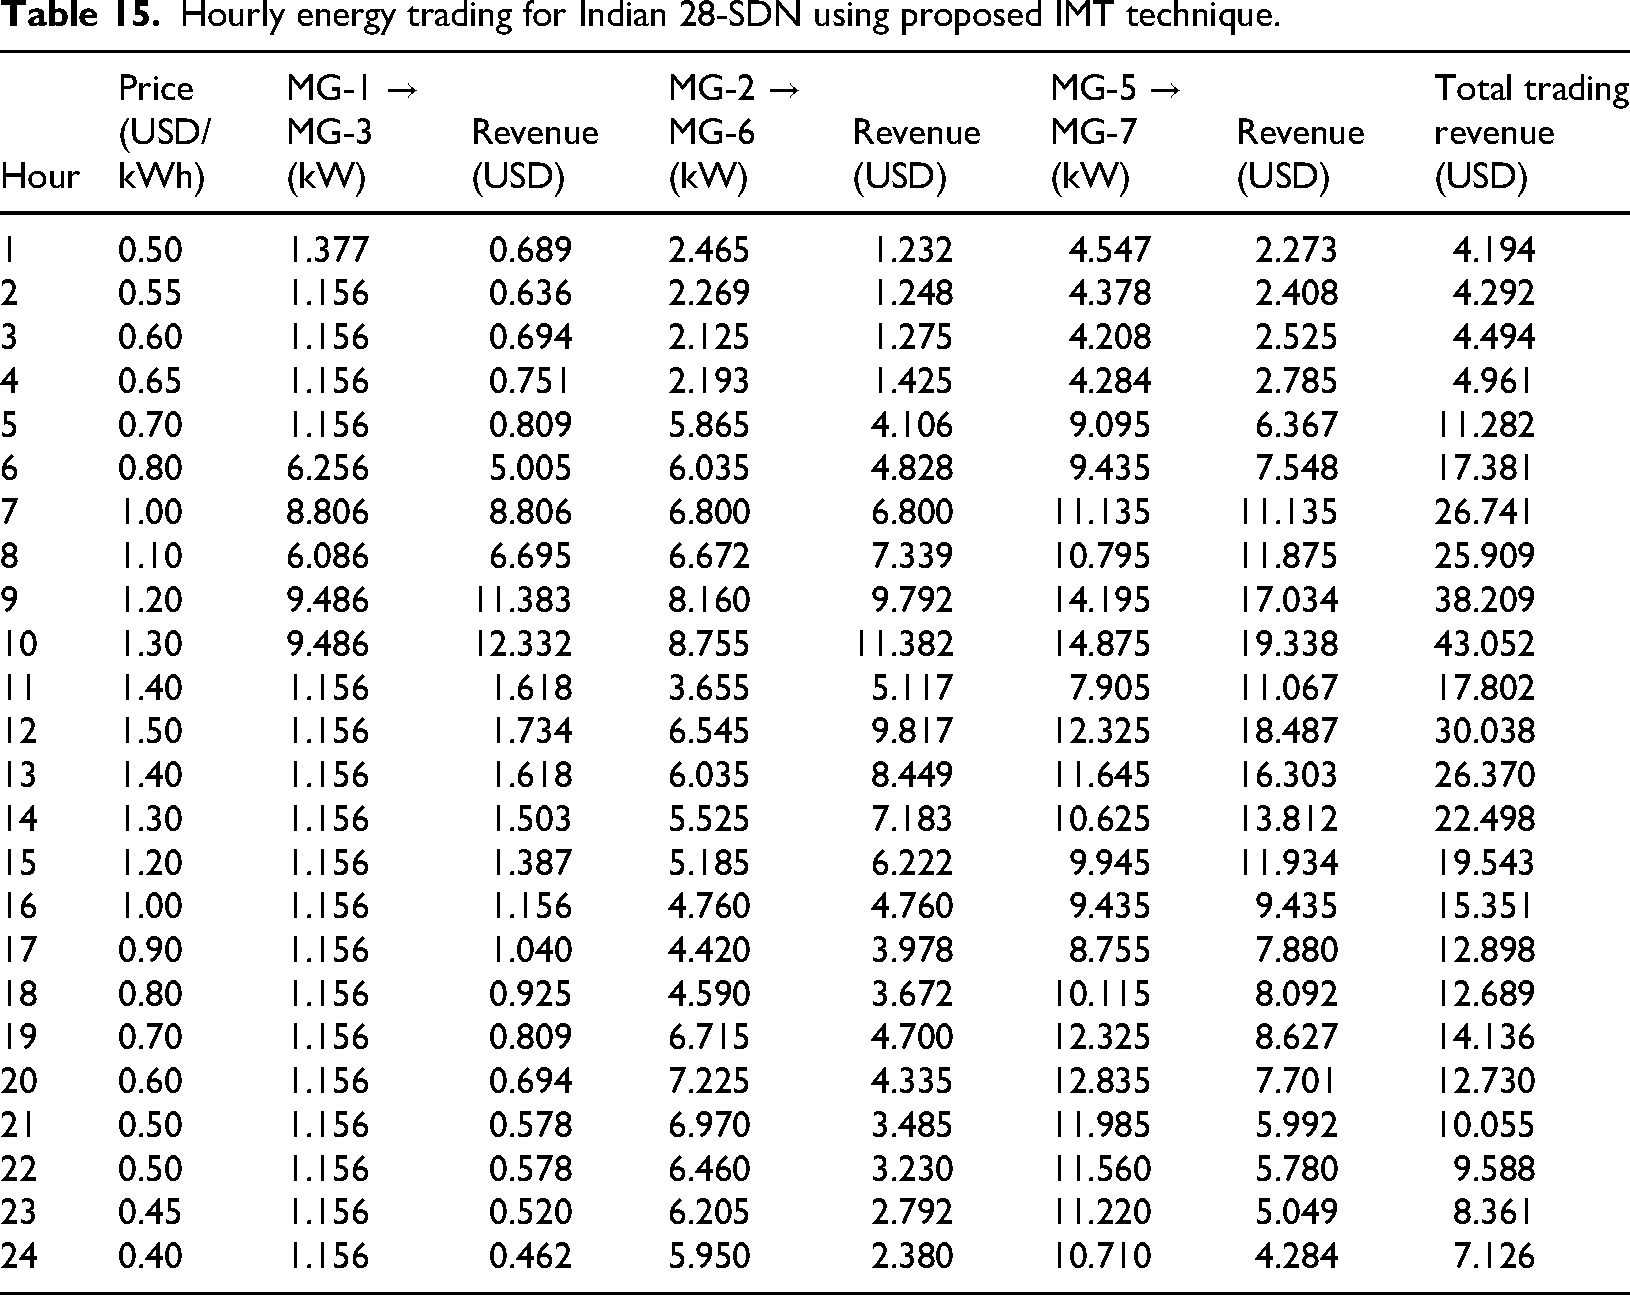
The hourly IMT and associated revenue behavior in the Indian 28-SDN under the proposed IMT framework is depicted in Figure 21. The three main energy exchange paths (MG-1MG-3, MG-2MG-6, and MG-5MG-7) as well as the total trading revenue are visualized by a hybrid bar-line plot. Trading is relatively low during the first hours of the day (1–4) due to low tariff conditions and limited renewable availability. From 5 am to 10 pm, trading becomes more intense due to rising electricity prices and increased generation. The primary revenue path shifts from MG-5 to MG-7, indicating its key role in providing additional capacity to MGs facing shortages. The ability of the IMT strategy to take advantage of peak price windows is demonstrated by the highest total trading revenue of USD 43,052 at 10 am. After the tariff reduction, revenue gradually declines from the eleventh hour, but the current bilateral exchanges ensure stable operations and uninterrupted supply. All things considered, the integration enabled by IMT reduces regional shortages, increases market responsiveness and strengthens financial resilience to changing pricing environments.
(b) IEEE 34-SDN
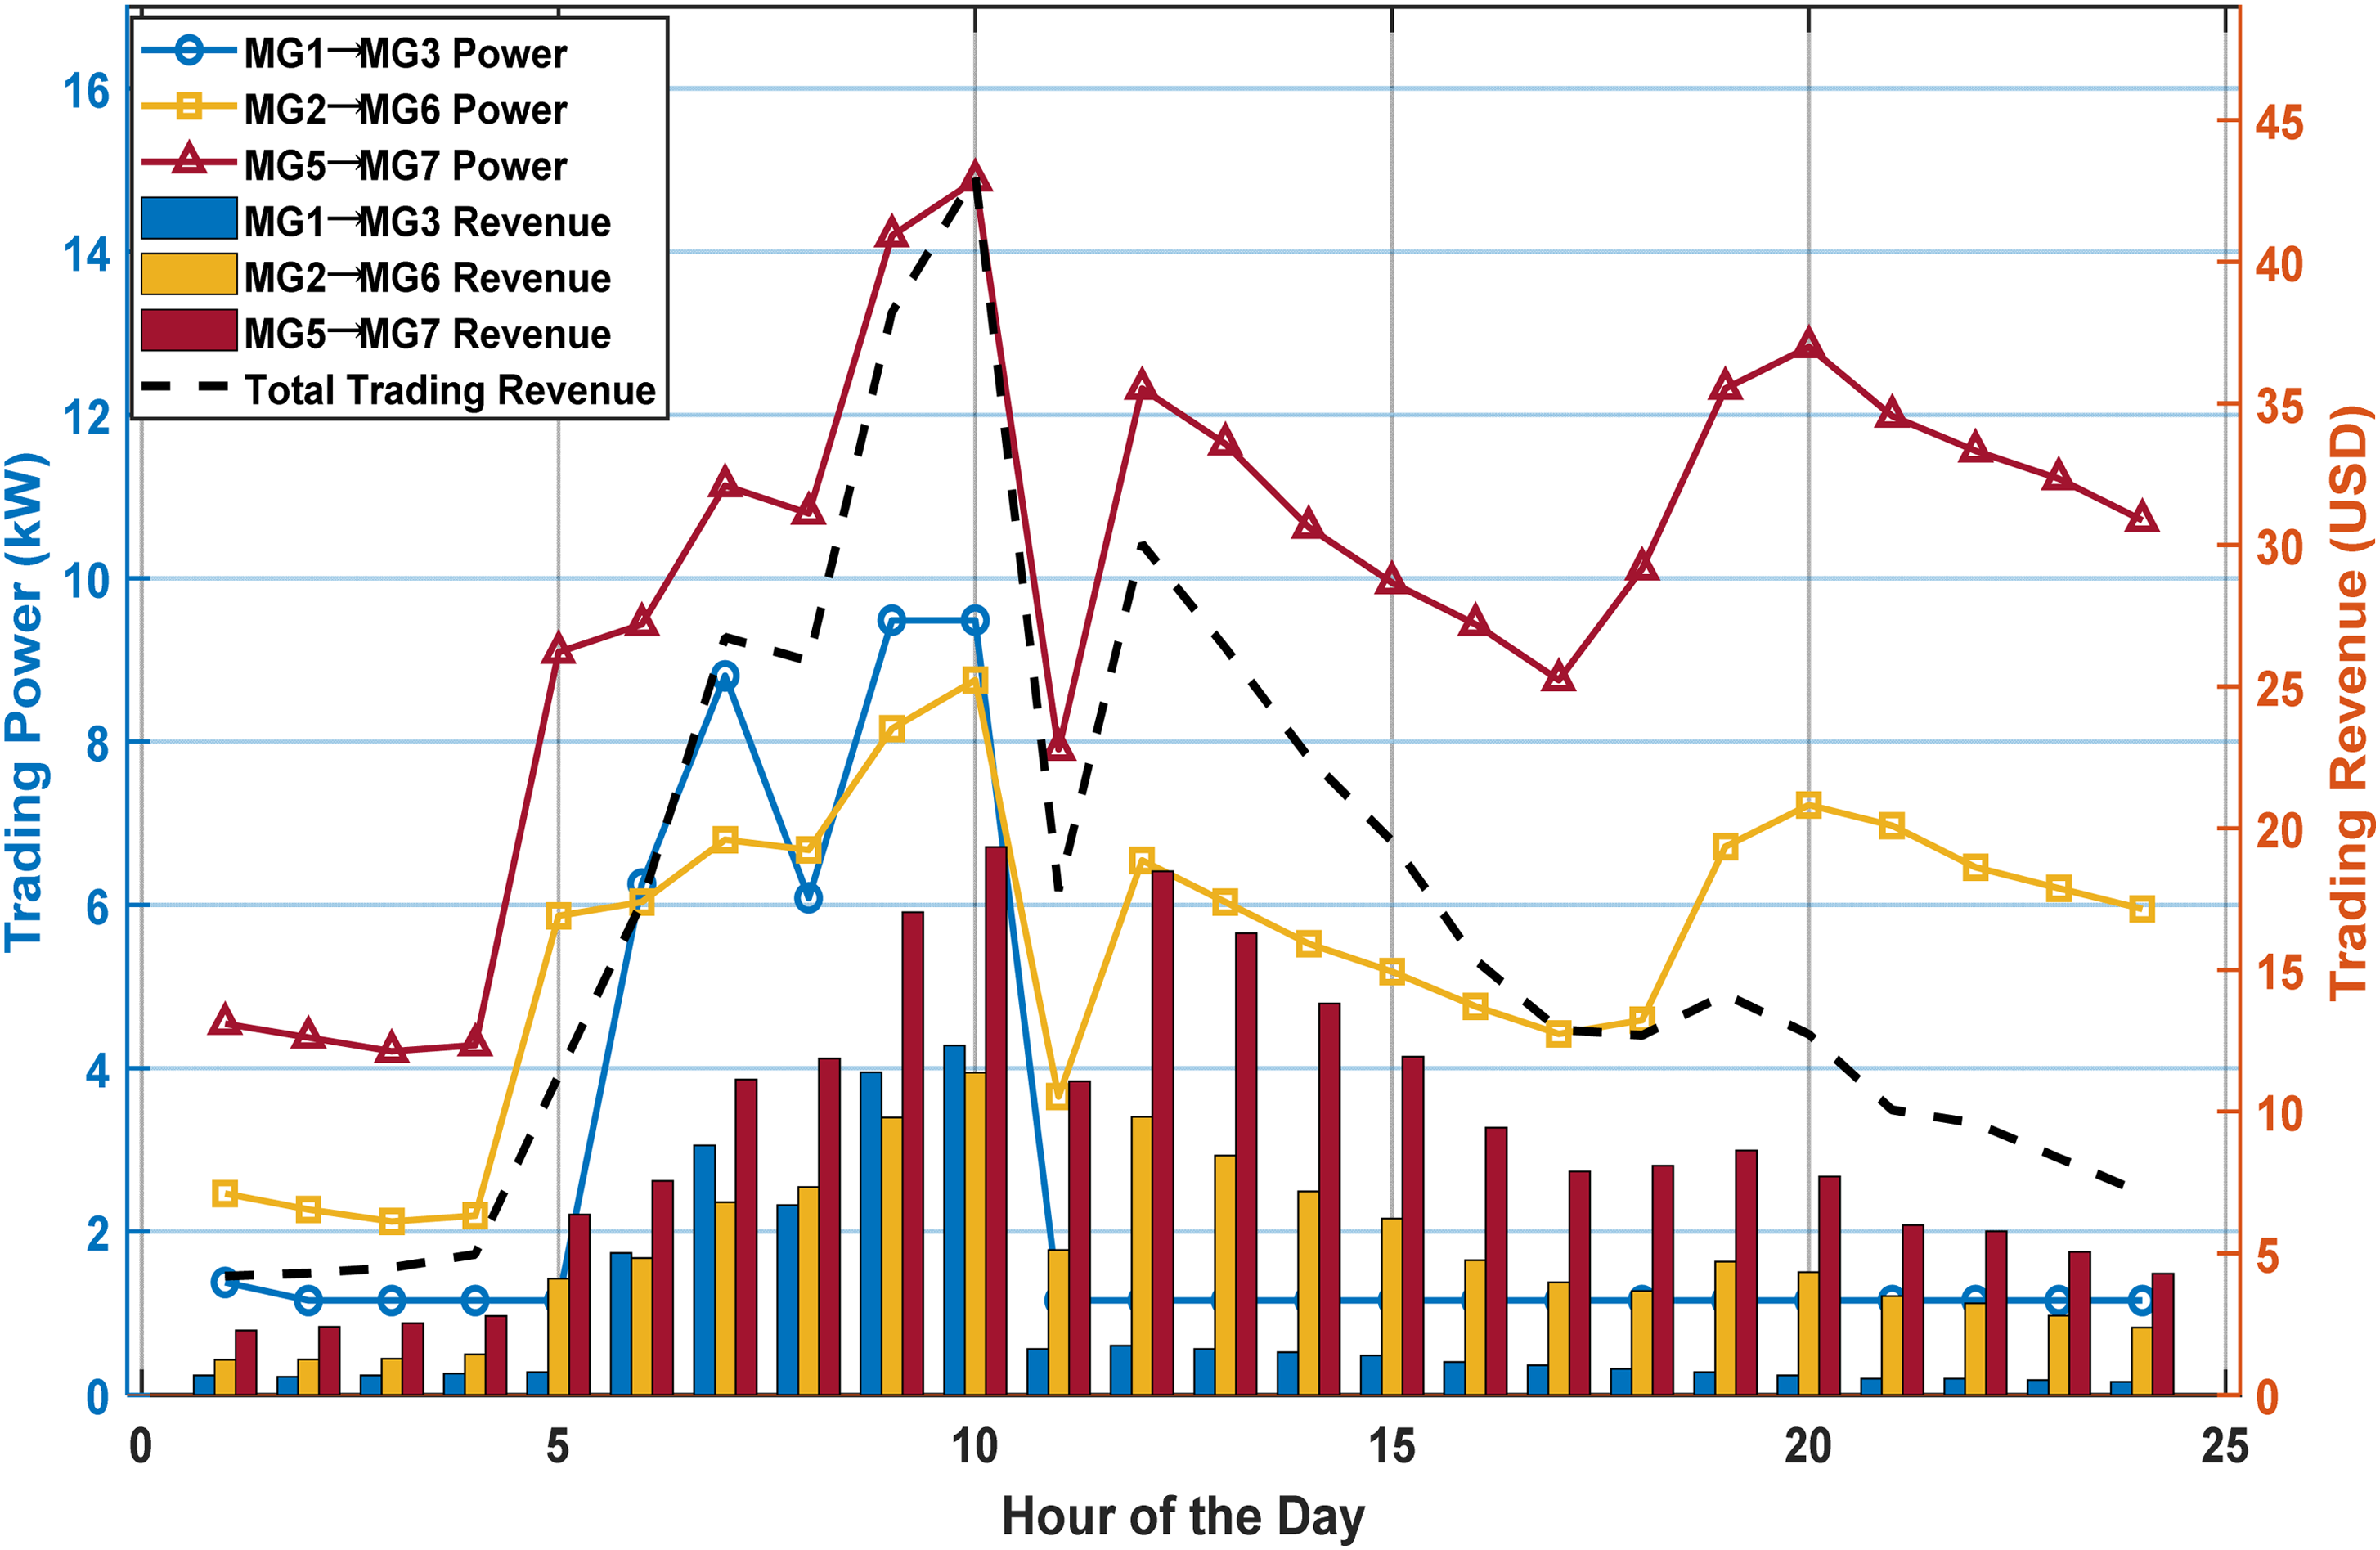
Hourly energy trading for Indian 28 using proposed IMT technique.
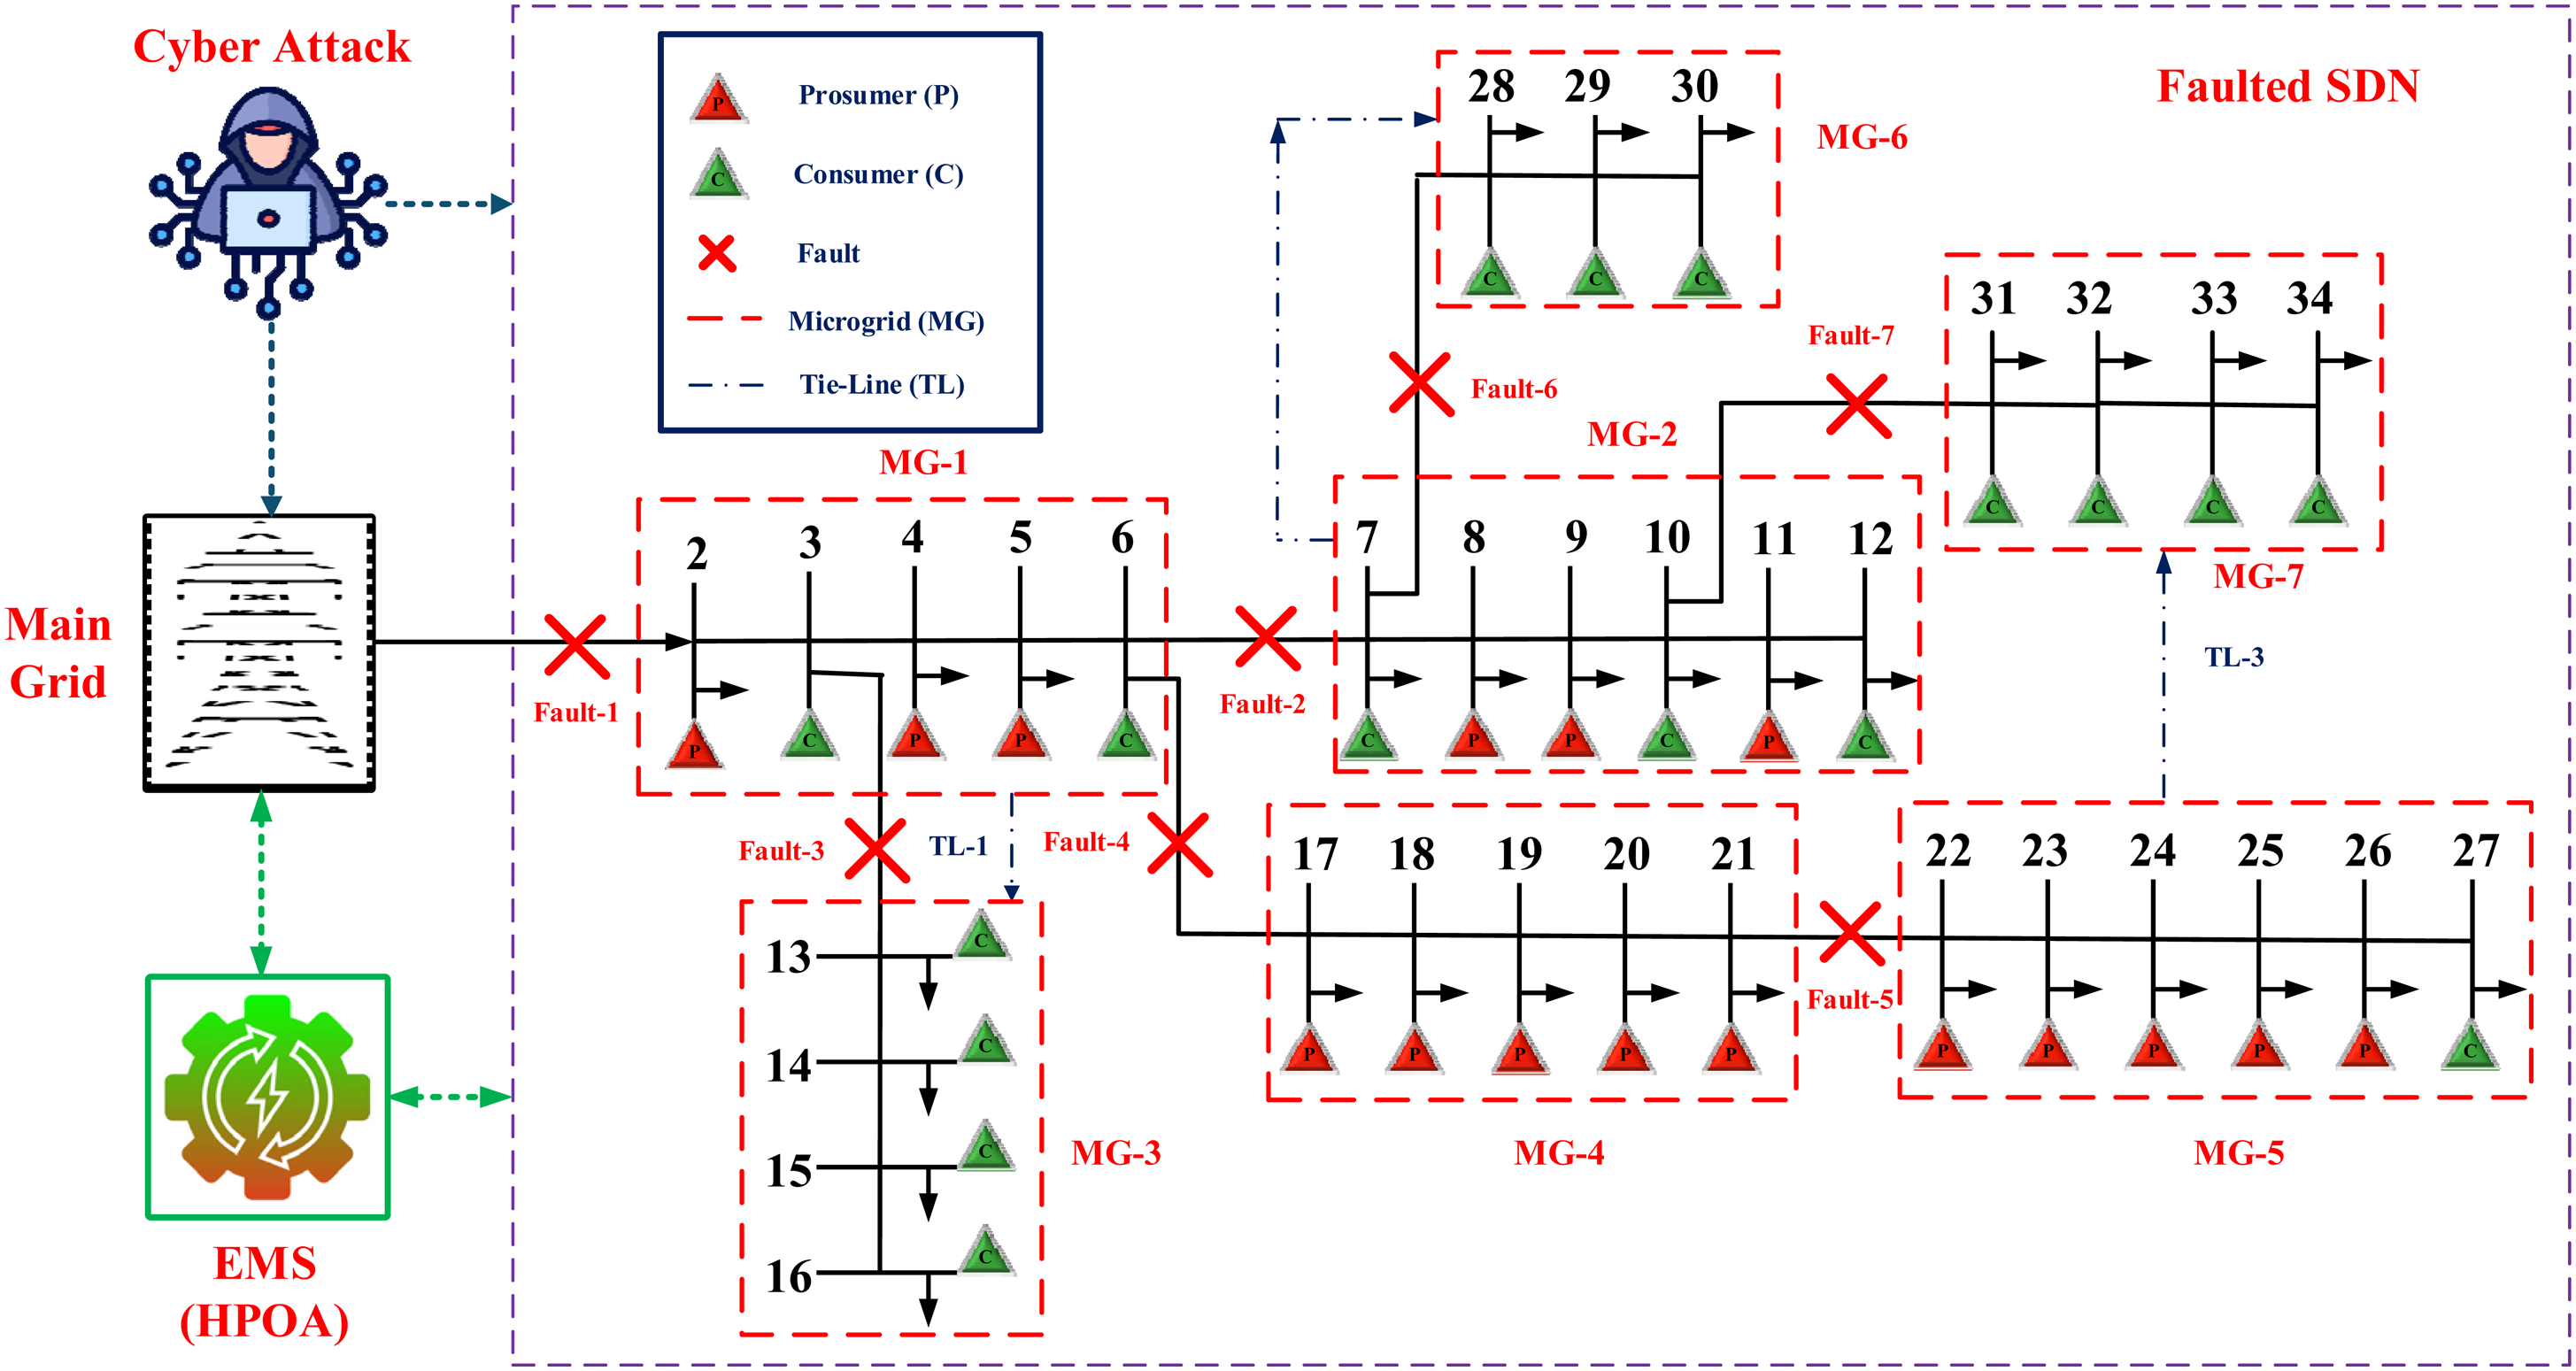
Faulted and cyber-attacked IEEE 34-SDN with MGs and TLs.
Scenario-III explores the cyber-physical resilience of an IEEE 34-bus SDN in the event of multiple simultaneous faults using MG deployment and dynamic TL interconnections as part of the proposed topology-aware IMT strategy (Figure 22). Figure 23 shows how the TLs implement integrated power sharing by selectively receiving power from MG-1 ↔ MG-3, MG-2 ↔ MG-6, and MG-5 ↔ MG-7. By transferring the most renewable and V2G power from one MG to support critical loads on another, the TL-assisted system speeds up the system restoration process, unlike Scenario-II where the MGs operate independently.
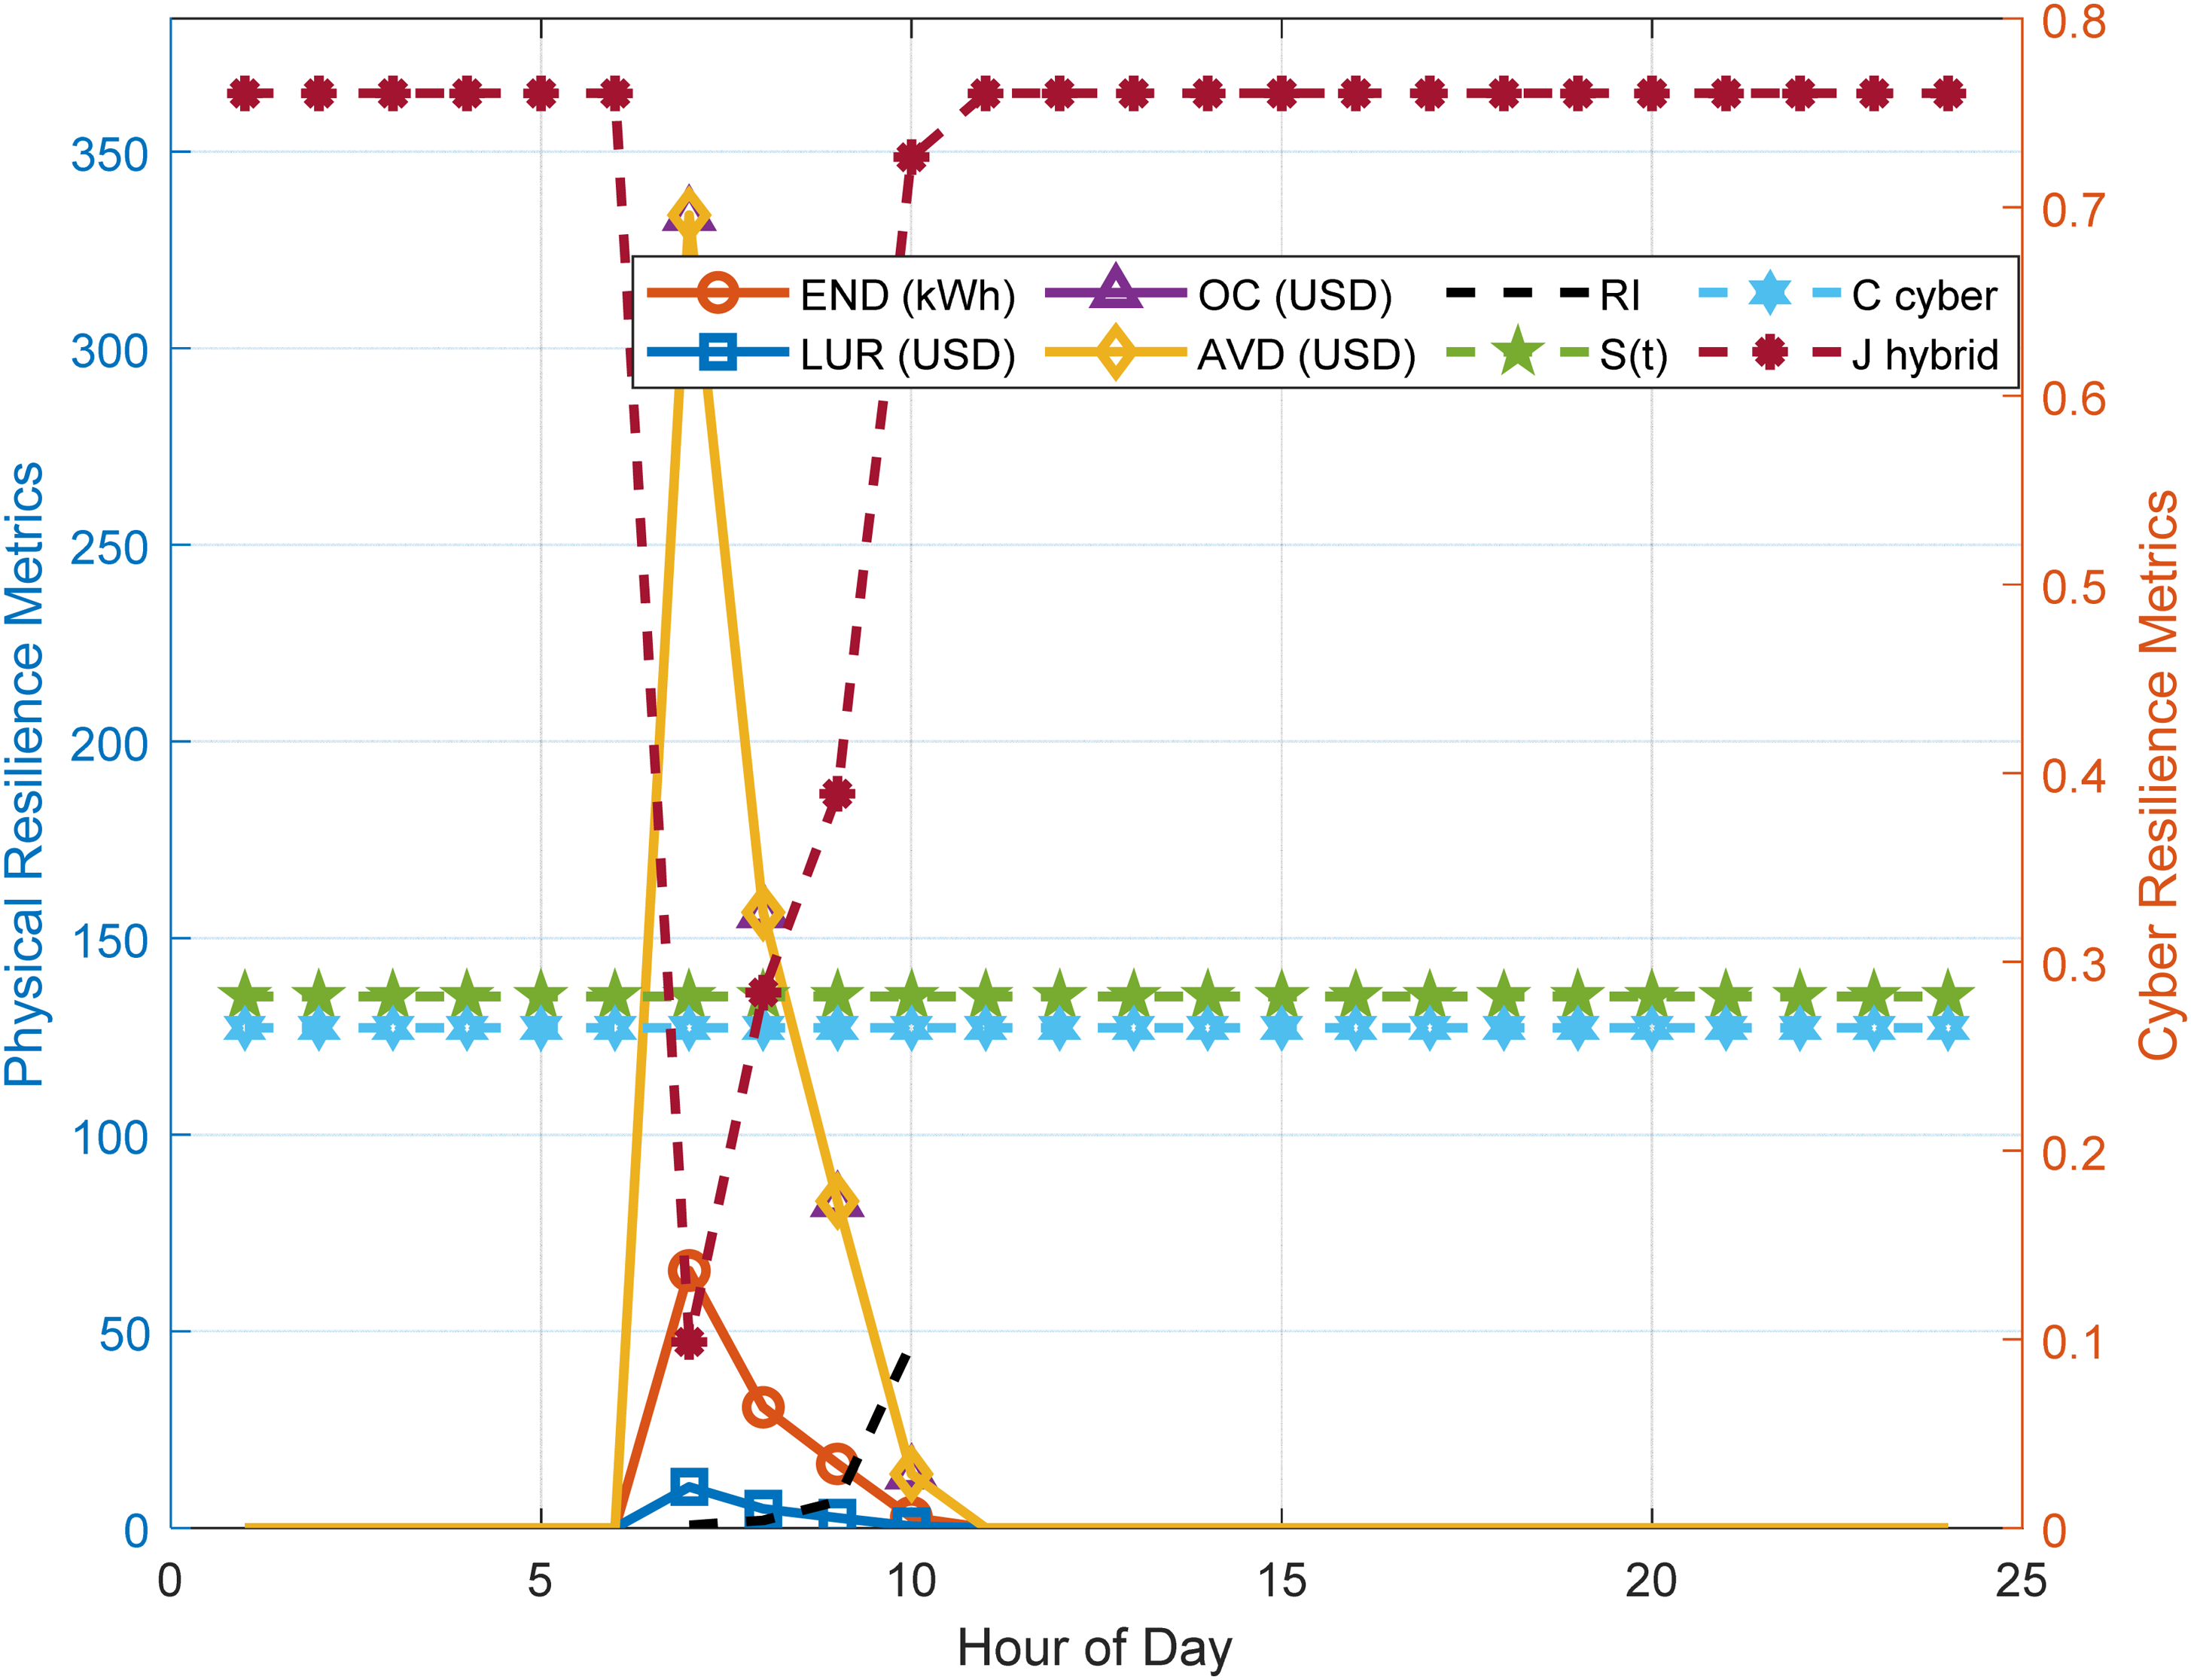
Hourly resilience parameters of IEEE 34-SDN (Scenario-III).
This dynamic IMT routing contributes to long-term fault resilience by reducing END and avoiding depletion of local storage resources. The TL-enabled architecture significantly improves resiliency by reducing END to almost zero during the peak recovery period (7–10 h) and ensuring uninterrupted delivery for the remaining 21 h. Although cyberattacks still affect communication channels, distributed P2P support greatly improves outage reduction, outage cost reduction, and overall financial performance. Compared with traditional island MG operation, the proposed AI-guided TL reconfiguration demonstrates significant improvements in cyber-physical resiliency by enabling system-wide stability, efficient load balancing, and robust business continuity under realistic threat scenarios. This demonstrates that IMT-enabled integration and intelligent MG interconnection are essential in designing resilient smart grid architectures of the future.
The hourly cyber-physical resilience parameters of IEEE 34-SDN under Scenario-III are shown in Table 16 and Figure 23. In this scenario, multiple MGs are connected through optimized TLs to minimize the effects of widespread failures and cyber attacks. The findings demonstrate that the proposed topology-controlled IMT system allows for rapid and almost complete outage recovery during 24-h islanding operation. All physical outage-related metrics, including END, LUR, OC, and AVD, remain at zero for most of the simulation period (hours 1–6 and 11–24), indicating continuous power availability at each MG. Proper supply reconfiguration under cyber-physical stress is demonstrated by the subsequent infinite resilience index values. Hours 7–10, corresponding to the first reconfiguration of MG-to-MG power flows, show a short recovery window. After the introduction of TL-assisted IMT, the system's supply-demand imbalance at 7 h (END = 65.46 kWh; OC = 333.846 USD) is temporarily resolved at 8 h (END = 30.69 kWh; OC = 156.519 USD) and 9 h (END = 16.3 kWh; OC = 83.13 USD). At 10 h, effective mitigation of the economic losses related to the outage is shown, with AVD of 647.088 USD and END of only 2.7 kWh completely eliminated. Despite the continuous cyber-attack impact, the cyber control success probability demonstrates operational continuity, which remains stable at S(t) = 0.2817.
Hourly cyber-resilience parameters of the IEEE 34-SDN (Scenario-III).
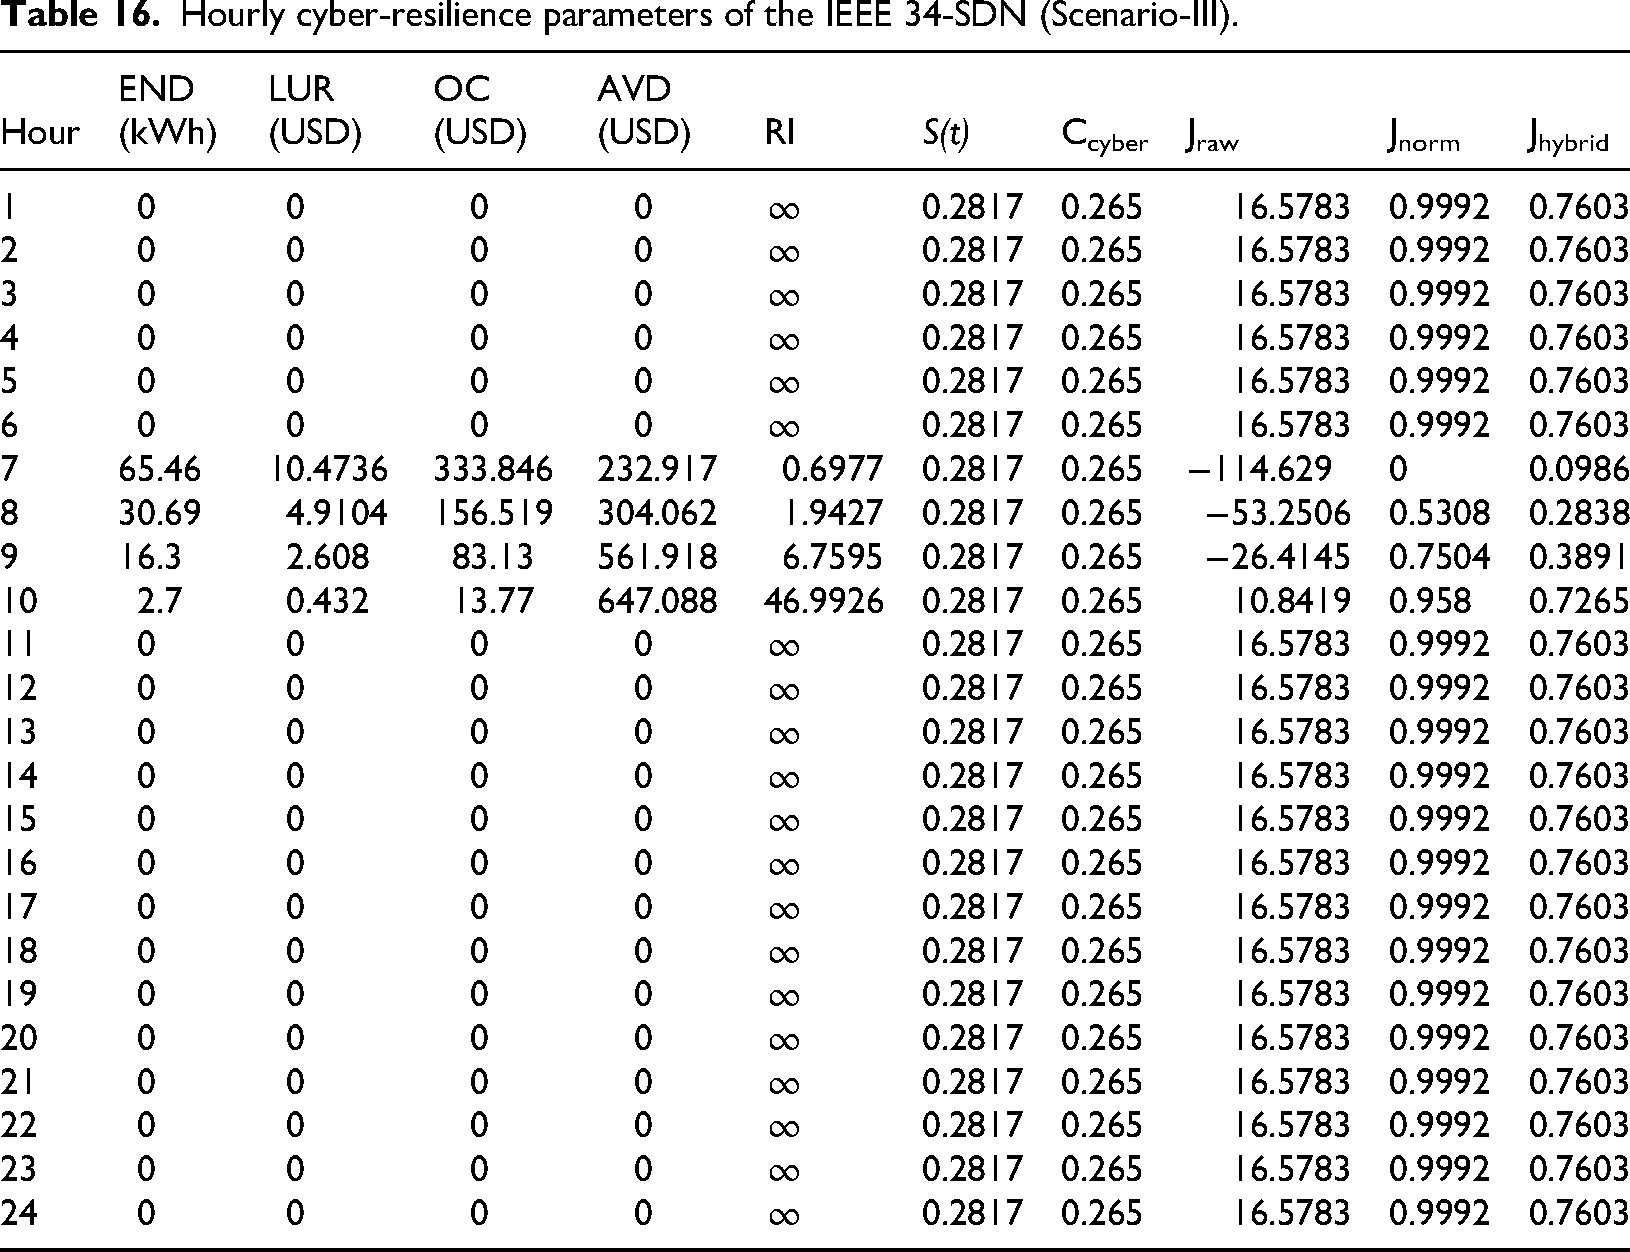
Compared to Scenarios-I and -II, the objective function values (positive in 21 out of 24 h) show a significant improvement in cyber-economic-physical resilience. The hybrid resilience index (Jhybrid ≈ 0.7603) and normalized resilience score (Jnorm ≥ 0.9992) over a 21-h period confirm that TL-based mutual support between MGs ensures excellent system survivability.
Overall, the results of Scenario-III confirm that IMT-enabled energy trading combined with dynamic topology optimization results in almost zero outage costs, 98% reduction in END, greatly improved hybrid resilience, and full operational continuity during most hours. Furthermore, Figure 13 confirms that the proposed MG-TL configuration ensures robust cyber-physical security, improved global power balance, and rapid recovery against simultaneous failures and cyber intrusions.
The hourly energy trading performance implemented by the proposed IMT system of IEEE 34-SDN under Environment-III is shown in Table 17. Surplus consumer energy can be traded between adjacent MGs based on current demand and electricity prices, due to three important interconnections: MG-1↔MG-3, MG-2↔MG-6, and MG-5↔MG-7. Off-peak hours (hours 1–6) see moderate trading, with total revenue rising steadily as electricity prices rise. Hour 6 reaches a peak of 20.448 USD due to favorable pricing and improved surplus electricity availability. There is a significant shift between hours 7 and 10 due to higher electricity prices (1.0–1.3 USD/kWh) for renewable generation and load-support needs. The maximum trading revenue of 50.648 USD is recorded at hour 10, indicating that the IMT integration effectively utilizes price-based energy trading opportunities.
Hourly energy trading for IEEE 34-SDN using proposed IMT technique.
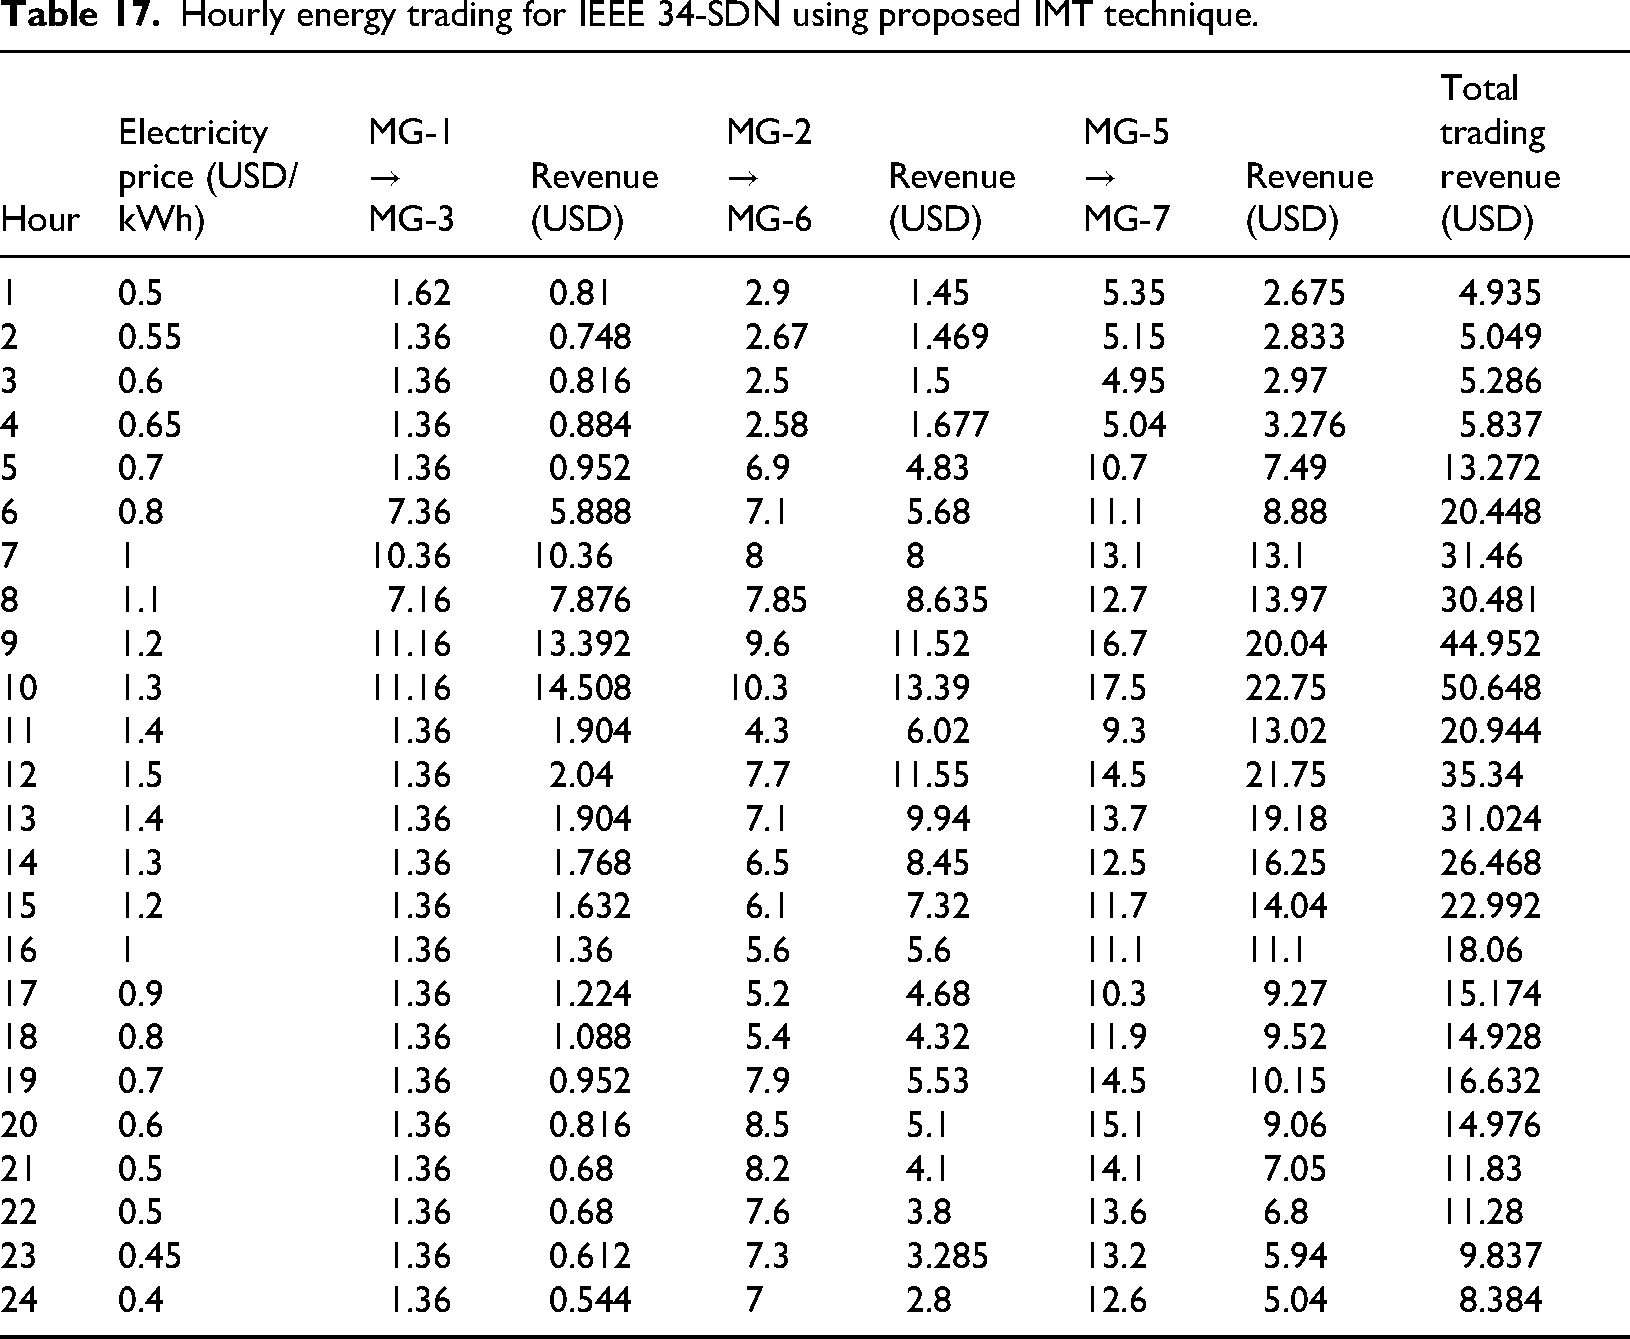
Due to stable customer contributions and moderate electricity prices, trading remains healthy after the peak from 11 to 14 pm. In the evening (15–24 h), the system stabilizes, with trading revenue primarily decreasing to 14–23 USD/h. This indicates a continuous supply-demand balance and strong microgrid interaction under steady-state operating conditions. According to the findings, the IMT framework greatly improves inter-microgrid flexibility by facilitating low-cost energy exchanges, mitigating the effects of local shortages, and exploiting price arbitrage opportunities. Through profitable and flexible inter-microgrid transactions, the integrated IMT not only increases the survivability of the system during disruptions, but also strengthens financial resilience, as evidenced by trends in trading revenue.
Figure 24 displays the hourly IMT performance and revenue outcomes attained with IEEE 34-SDN's suggested IMT strategy. By fusing the bar graphs for MG-1MG-3, MG-2MG-6, and MG-5MG-7's trading revenue with the line graphs for transmitted electricity, the hybrid diagram effectively depicts the technical and financial advantages. Hours 1–6 see very little trading because of low market prices and low prosumer production. As solar production and tariff rates rise, trading intensifies between hours 7 and 10. MG-5→MG-7 takes over as the primary contributor during periods of high load, giving neighboring MGs crucial support. The fact that the total revenue reaches a high value of 50.648 USD at hour 10 shows that the IMT mechanism can take advantage of advantageous price windows for maximum profit. The tariff drop causes revenue to decline after hour 11, but stable bilateral support ensures stable trading. Overall, these results lend credence to enhanced flexibility, better economic resilience, and efficient power reallocation in dynamic contexts.
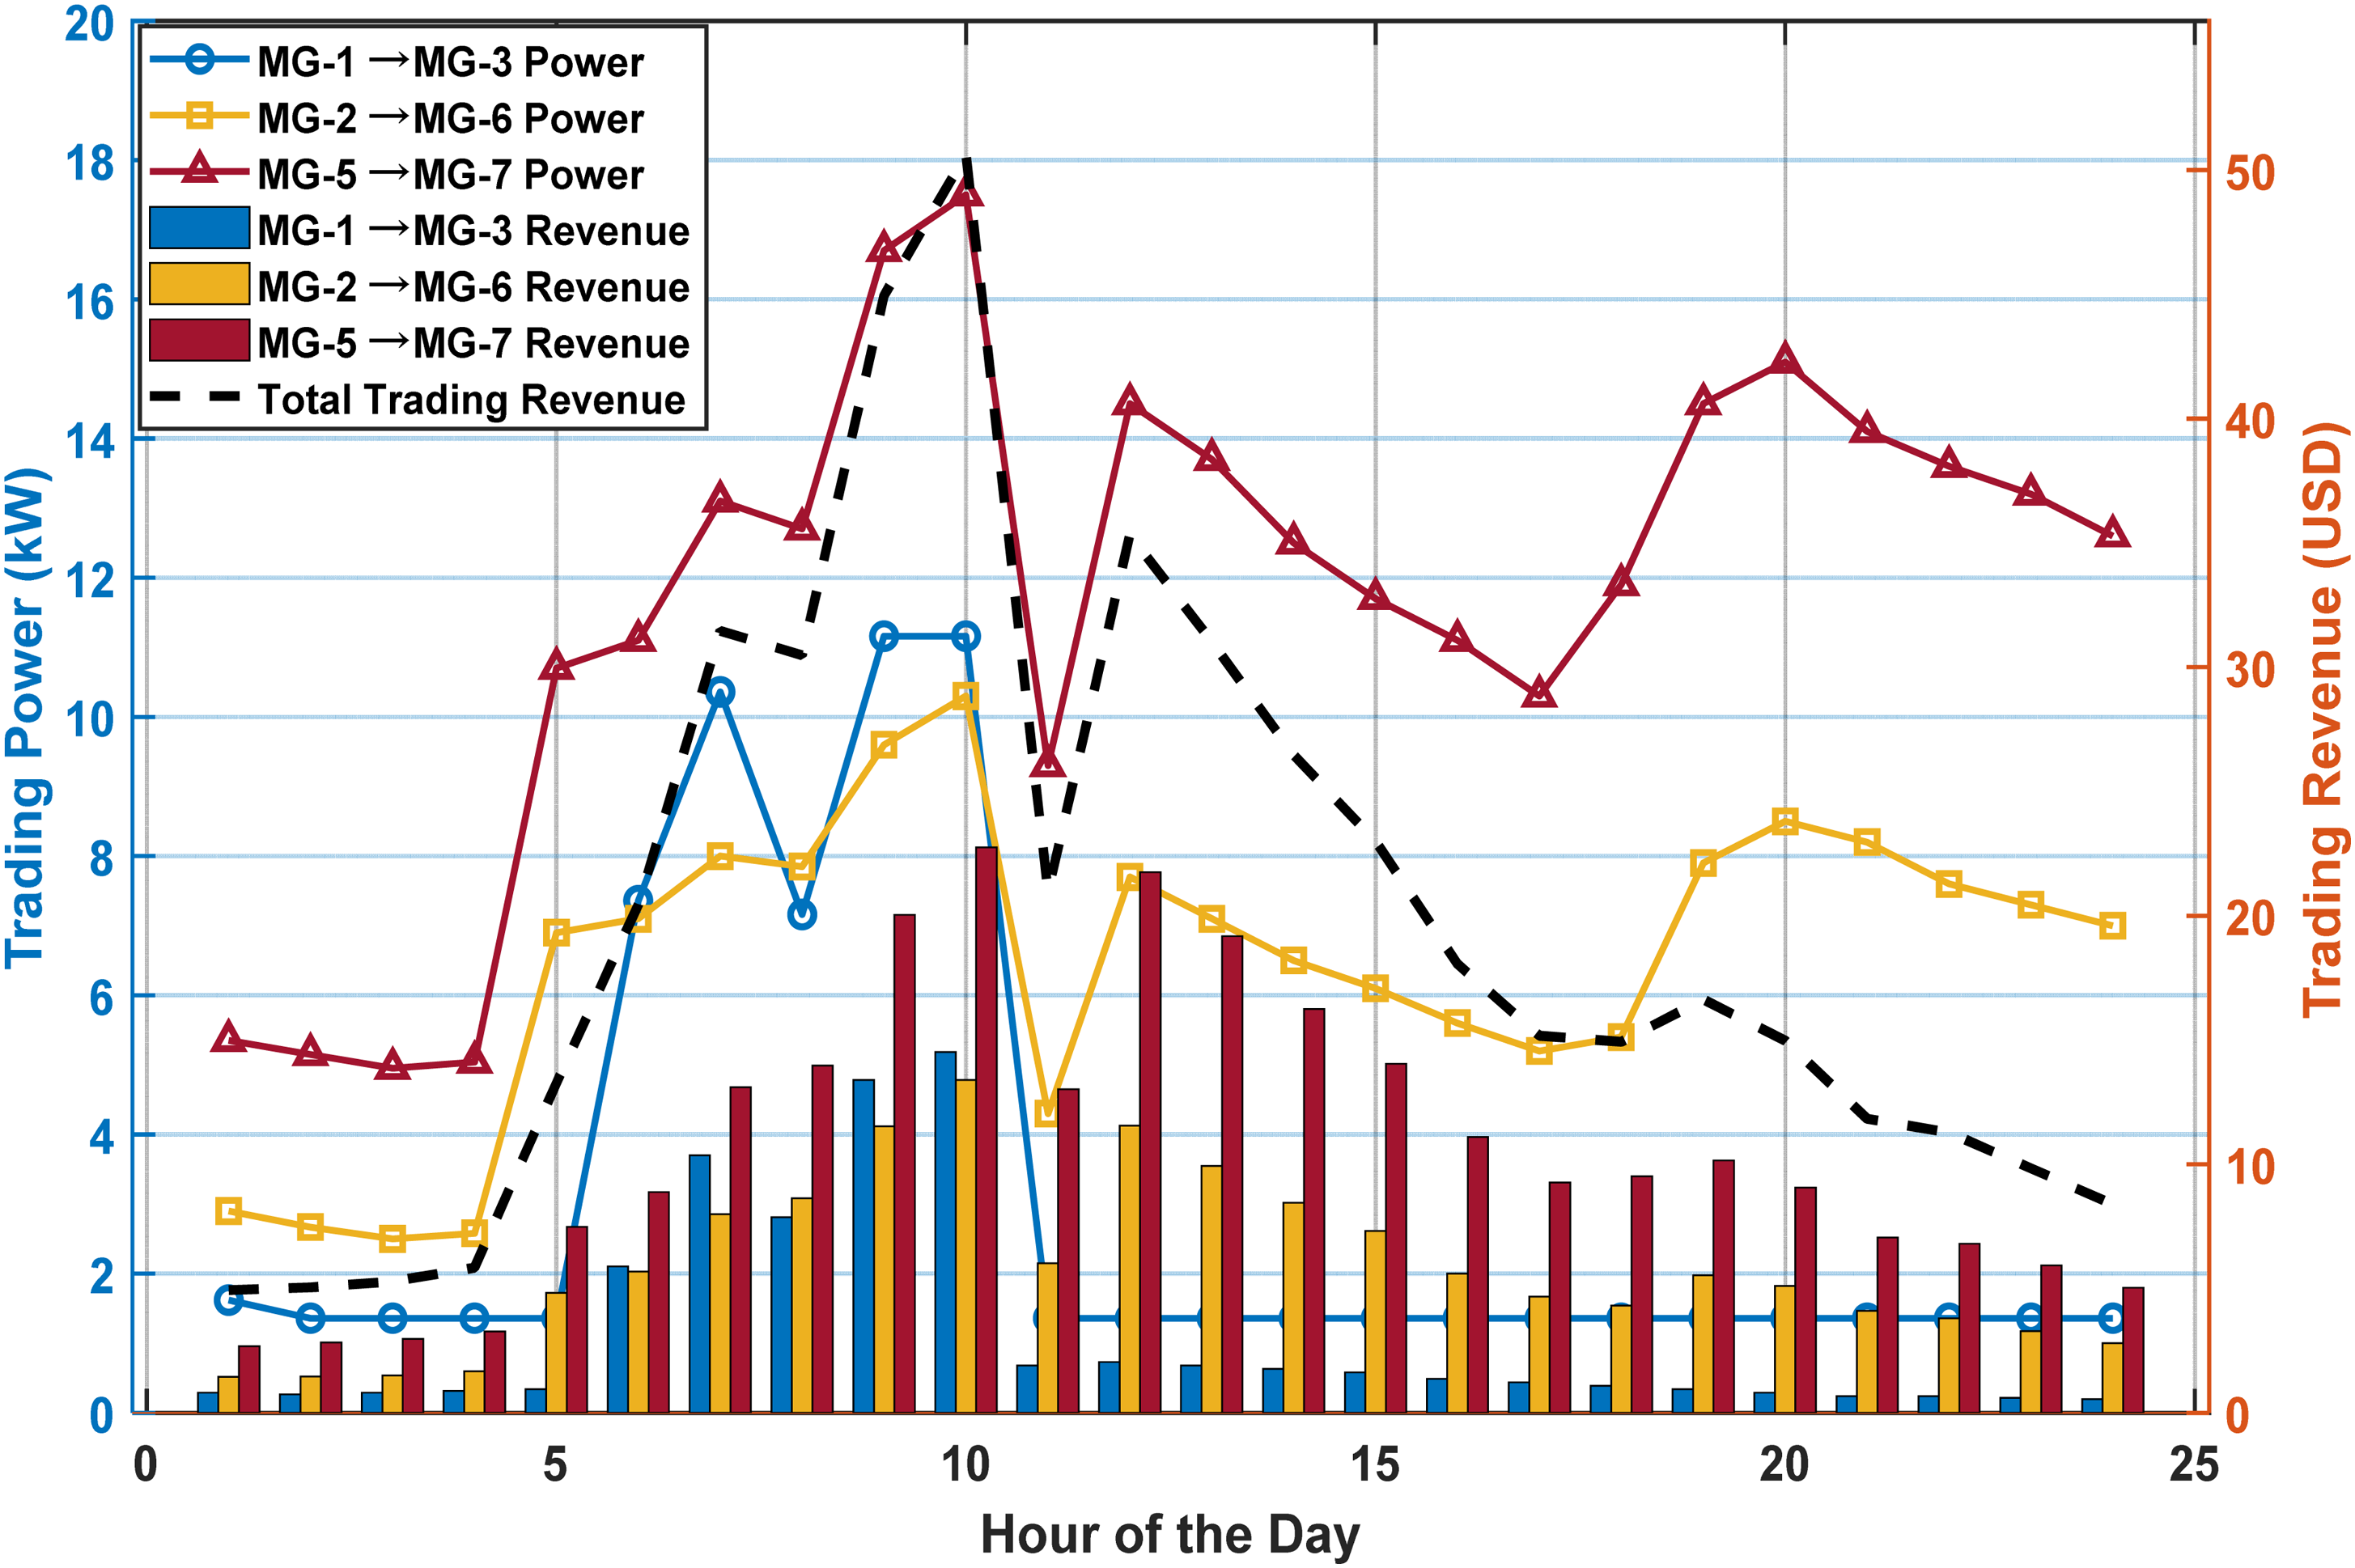
Hourly energy trading using proposed IMT technique.
Comparative analysis
Comparative analysis among various scenarios
Table 18 shows the significant resilience gains between the IEEE 34-bus SDN and the Indian 28-bus SDN when moving from de-scaling to IMT-enabled MG aggregation, under three proposed fault recovery scenarios. In Scenario-I, when MGs are not deployed, both systems with high END values endure significant supply disruptions for a 24-h period. The inability to recover from a disruptive event is indicated by a peak END of 130 kWh for the IEEE 34-bus SDN and 136 kWh for the Indian 28-bus SDN, while the RI remains at zero throughout the day. By using MG-based islanding, the END in Scenario-II decreases significantly every hour, reaching approximately 91 kWh for the IEEE 34-bus system and 61 kWh for the Indian 28-bus system. Furthermore, the resulting resilience is greatly improved; at high recovery times, RI values are slightly higher than 2.5, indicating that local DER utilization can be at least partially restored.
Hourly END and RI under three fault scenarios for both test systems.
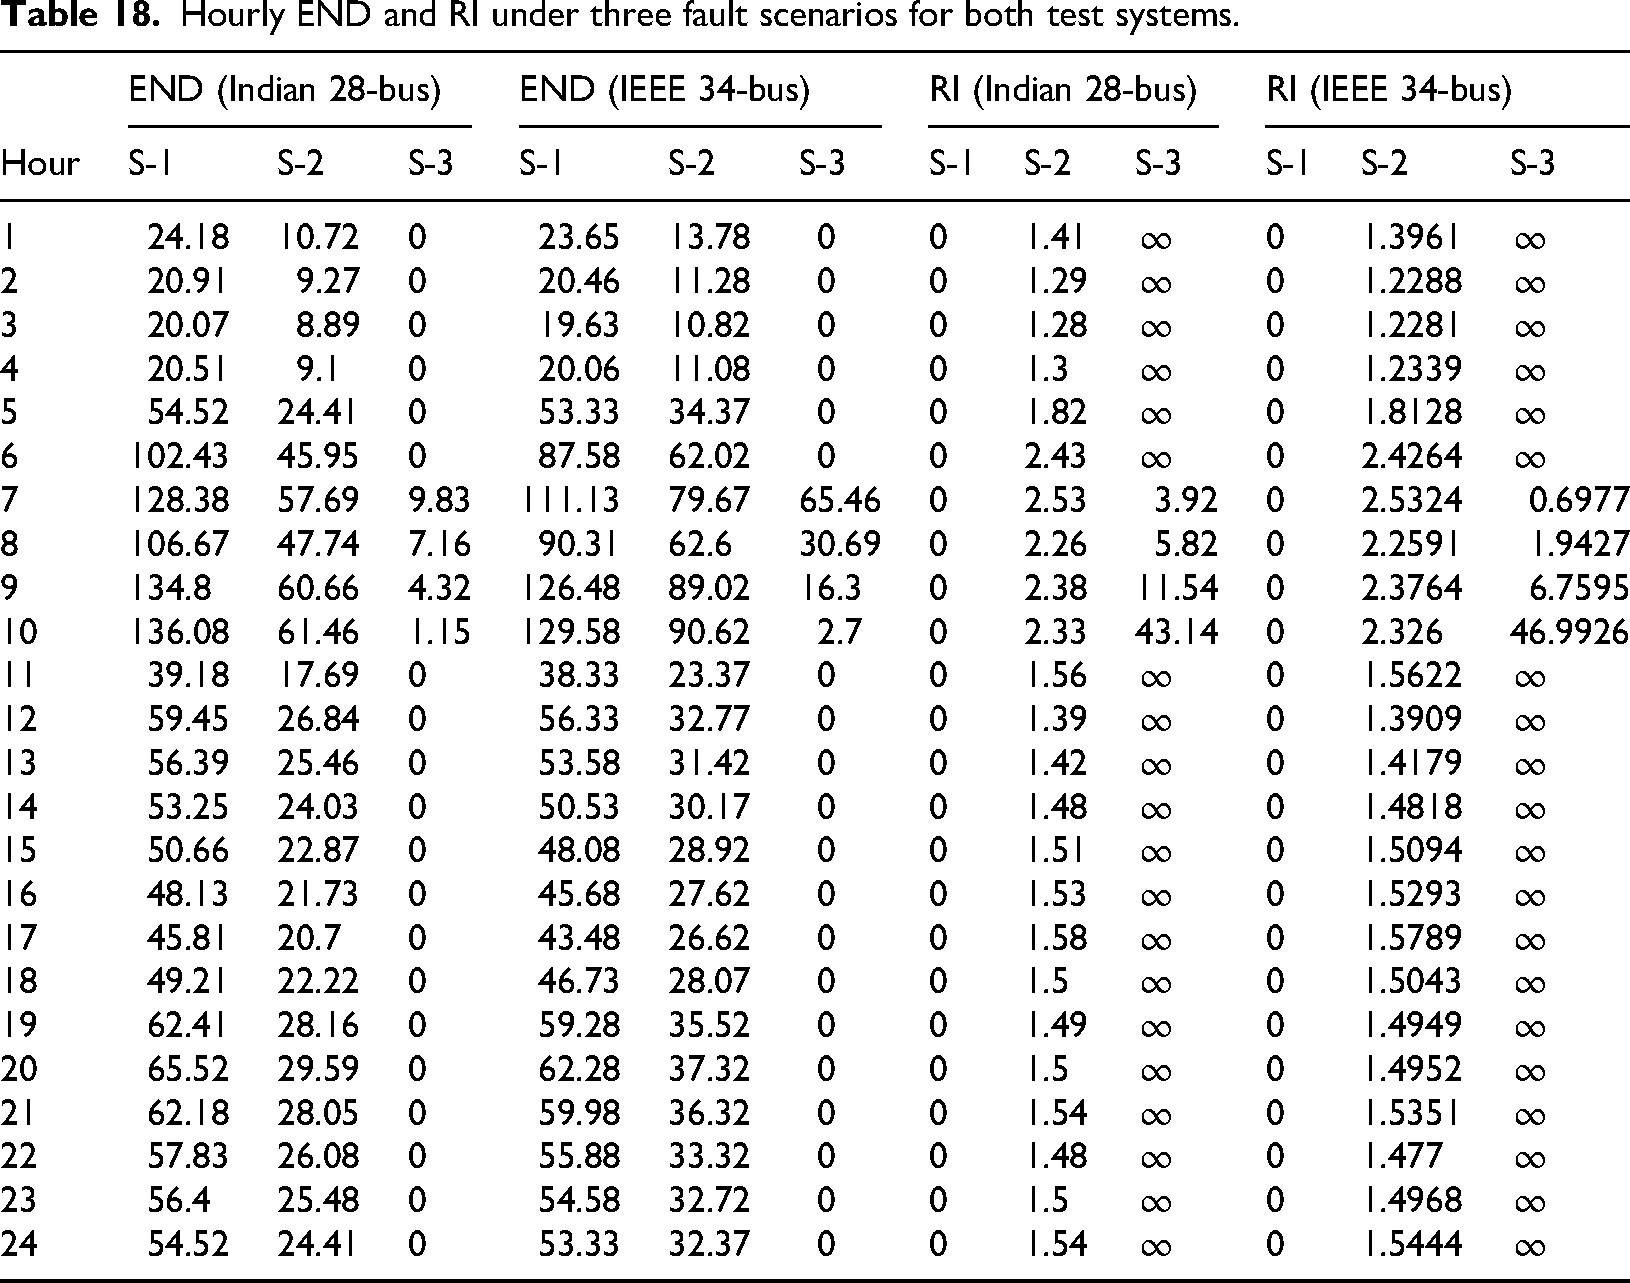
Scenario-III, which involves IMT-enabled MG interconnections via dynamically upgraded TLs, achieves the highest resilience performance. With small supply shortages in the early recovery phase (up to 1.15 and 2.7 kWh for Indian 28-bus and IEEE 34-bus SDNs, respectively), the END in both networks is completely eliminated within 21 h in 24 h. Accordingly, during peak recovery, the RI peaks at 43.14 and 46.99 and reaches infinite values in all zero-END hours, demonstrating exceptionally strong recovery capability supported by P2P energy support between MGs and integrated DER sharing. These findings unequivocally show that, in real, scale-up distribution networks, the proposed IMT-assisted topology restoration system greatly improves flexibility, reduces the impact of disturbances, and accelerates the restoration of power availability. Overall, the shift from isolated MG operation to interconnected resilience highlights how crucial tie-line-enabled collaboration is to achieving highly resilient and fault-tolerant smart grid performance despite cyber-physical disruptions.
Figures 25 and 26 together show how the proposed transition from Scenario-I to Scenario-III has improved resiliency in IEEE 34-SDN and Indian 28-SDN systems. Due to the lack of local support during grid disturbances, the END is high in Scenario-I, as shown in Figure 25. Scenario-II significantly reduces the END by utilizing local RES and BESS resources for island MG operations. Scenario-III shows a more effective recovery, with END approaching zero during most hours, thanks to the use of anti-TL and fast power sharing through the IMT mechanism. The RI in Figure 26 supports this conclusion, where Scenario-III shows significantly higher values, indicating better disturbance-survival and service restoration. IMT enables secure multi-MG coordination, as evidenced by the significant spike in RI during peak fault periods. All things considered, the proposed strategy ensures improved cyber-physical resilience and better supply continuity for both networks.
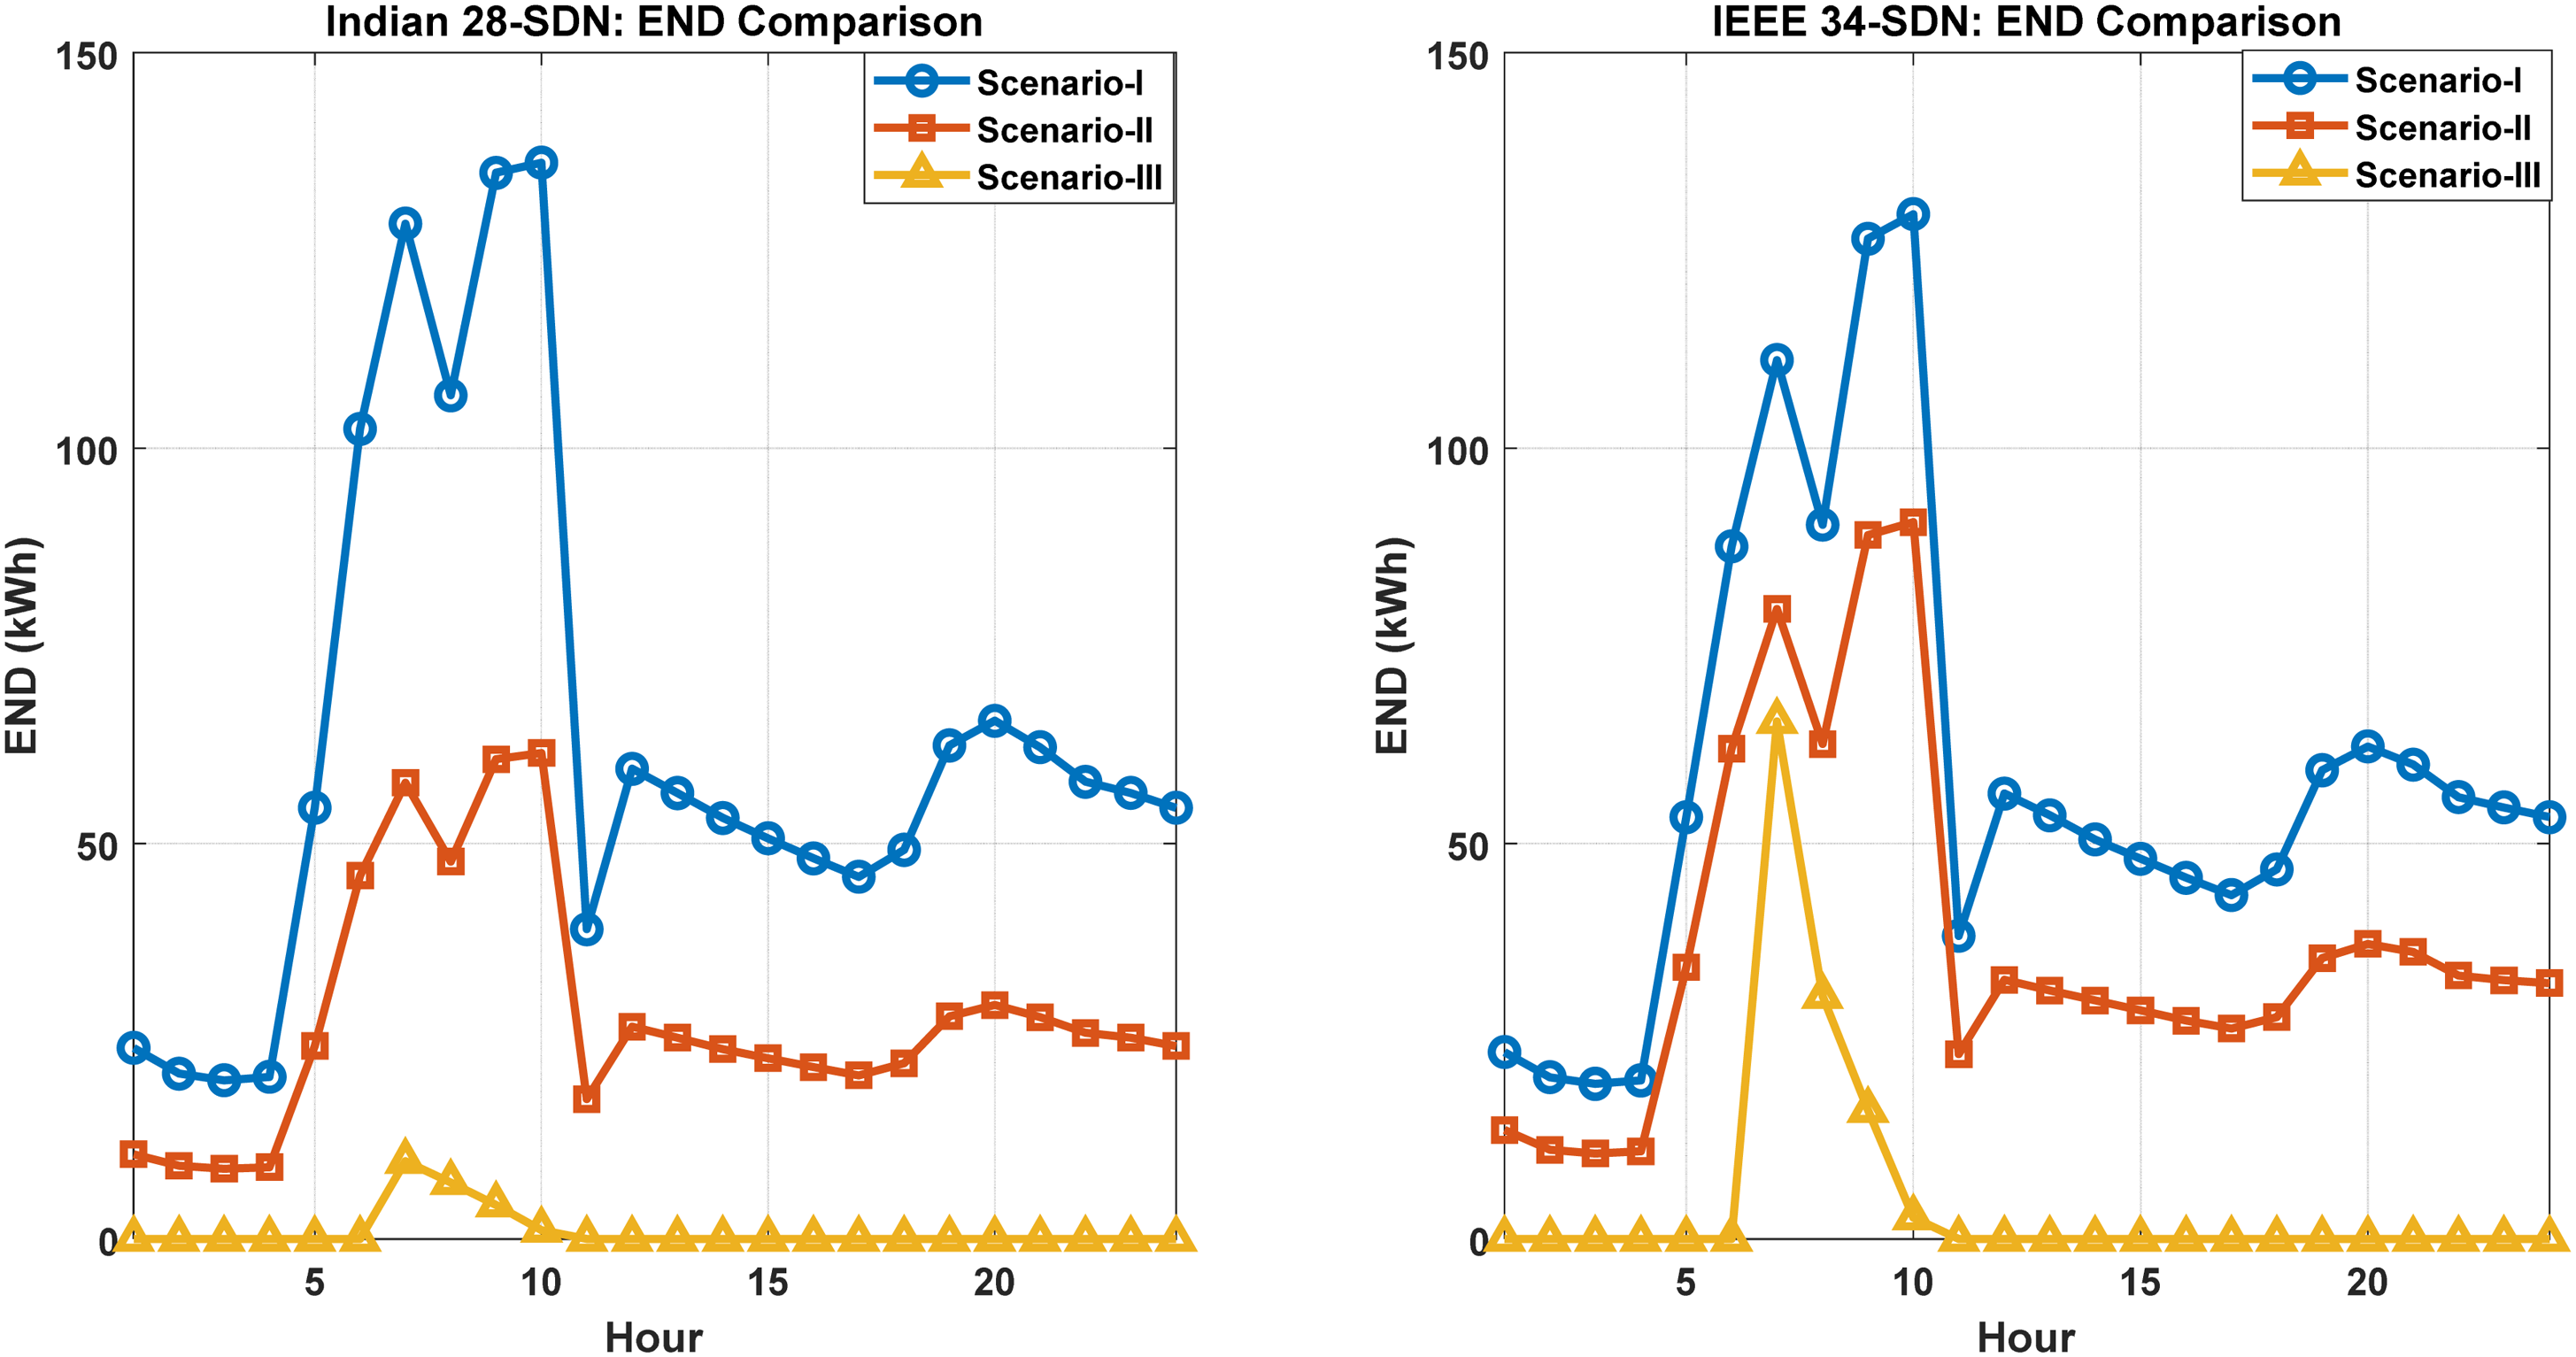
Comparison of hourly END across scenarios for both test systems.
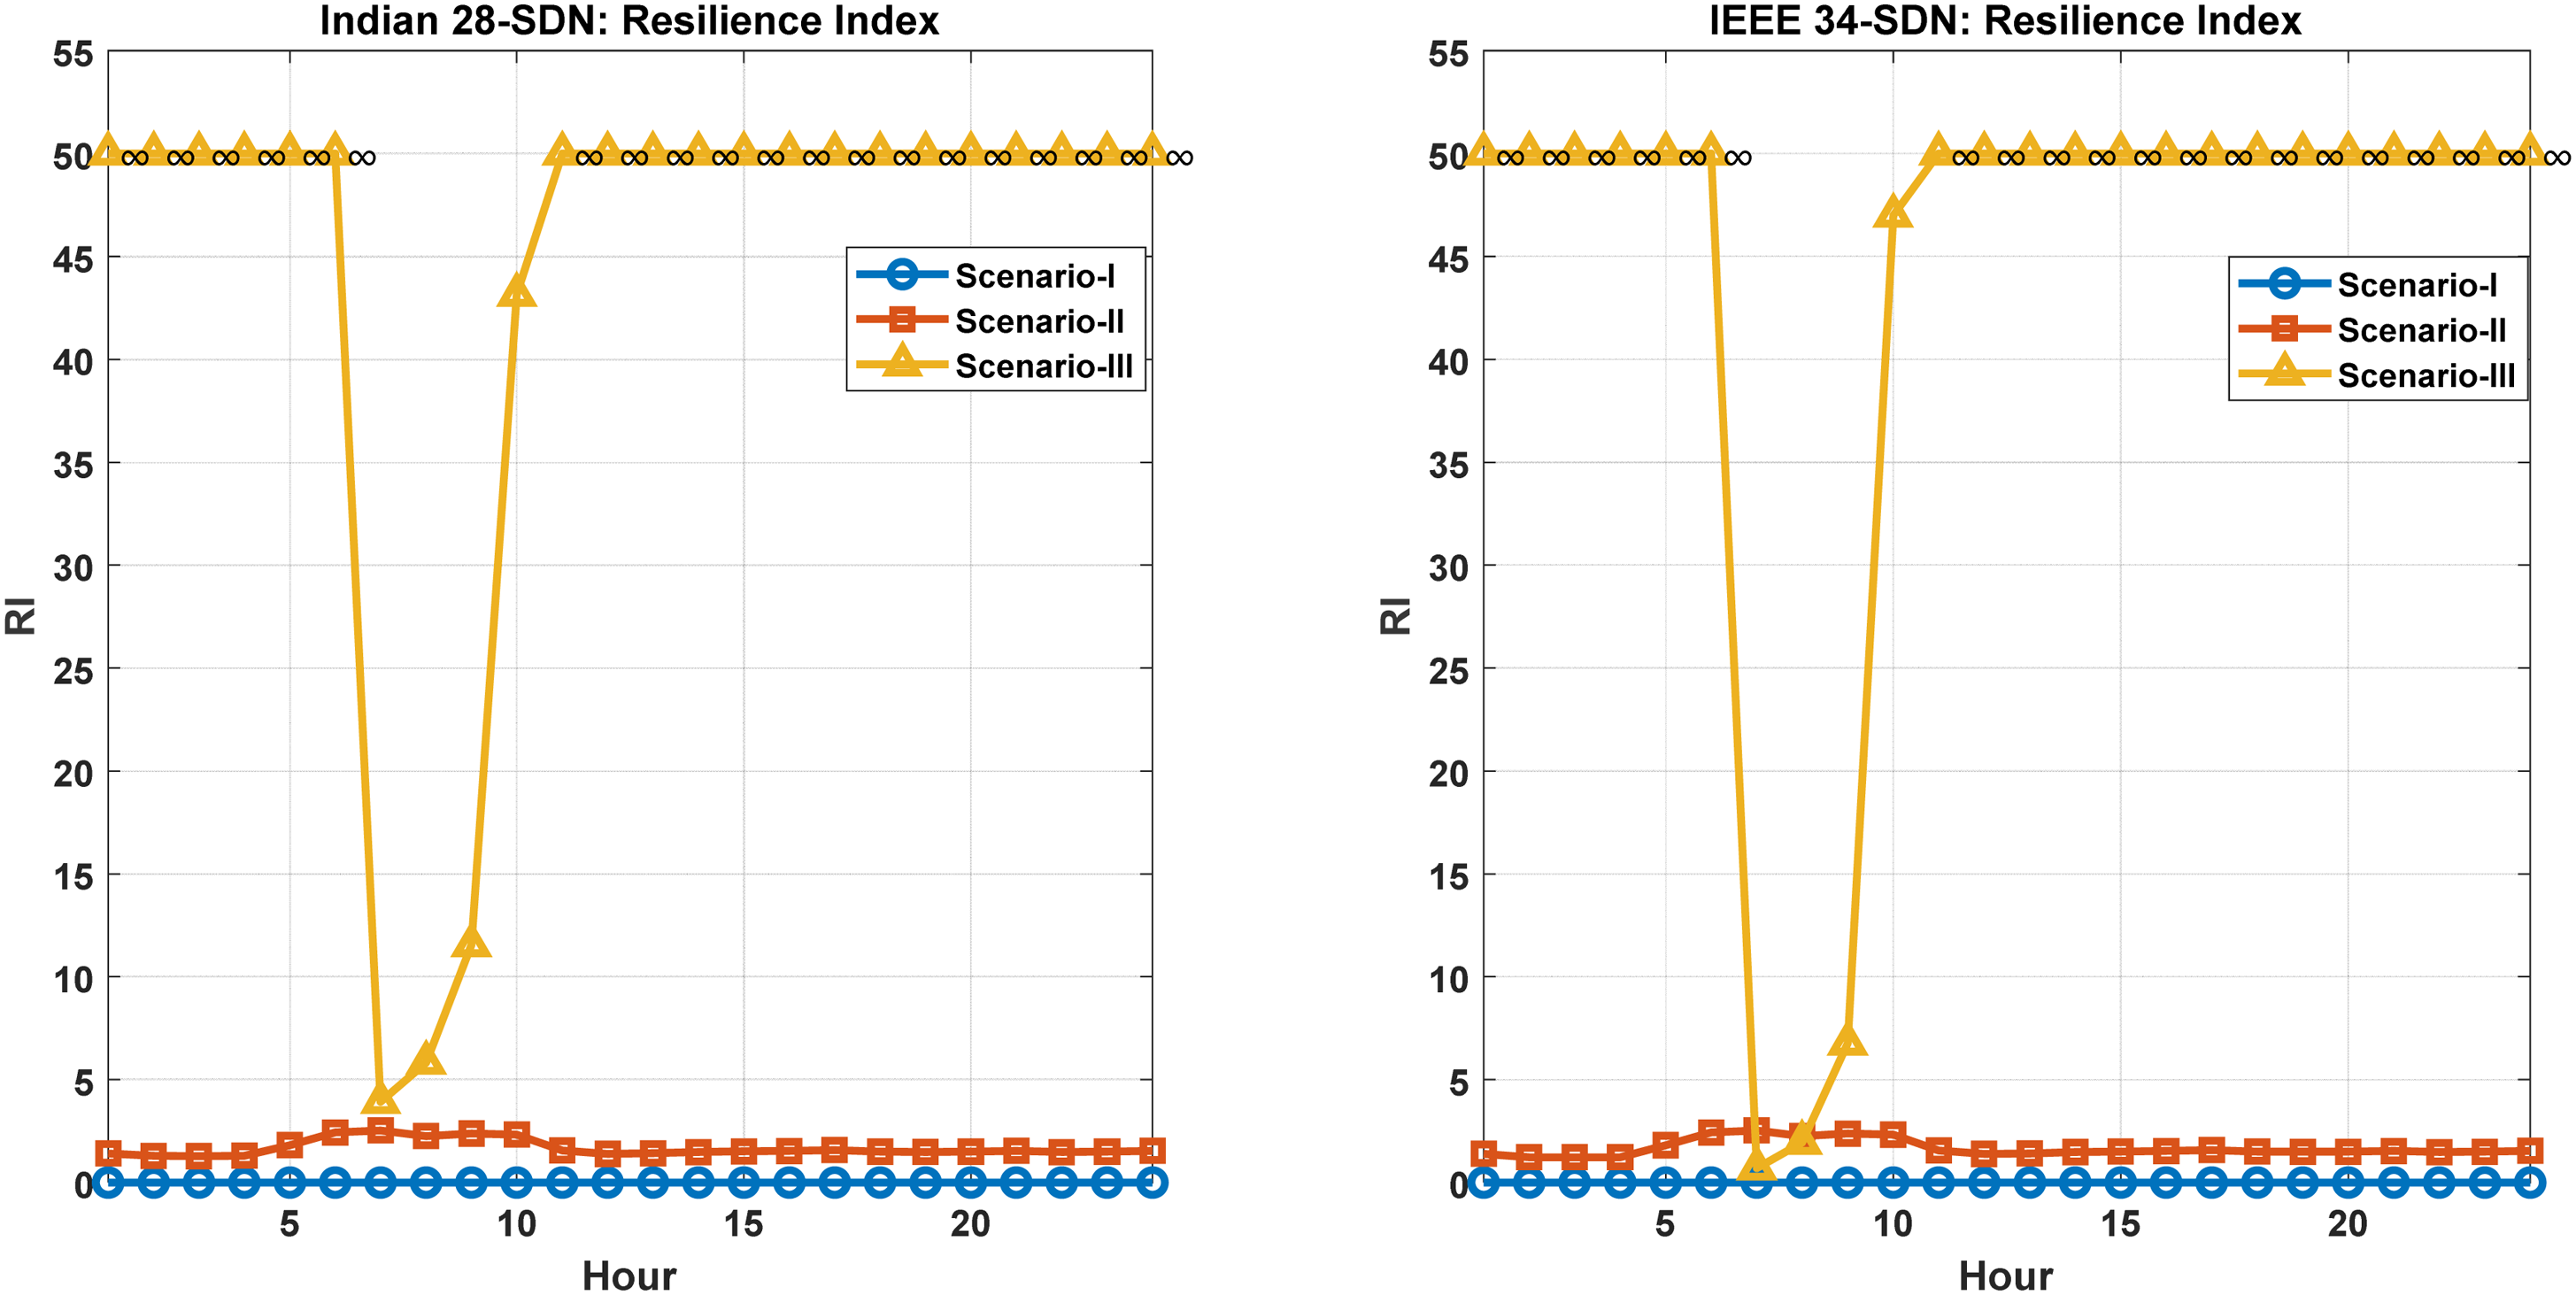
Comparison of hourly RI across scenarios for both test systems.
Comparative analysis among various algorithms
To investigate the optimization performance and resilience enhancement capability of the proposed HPOA, a comprehensive comparison was conducted with three popular metaheuristic algorithms, namely GWO, PSO, and GA. To ensure a fair comparison, all the methods were tested under the same cyber-physical scenarios with the same multiple-fault event, prosumer configurations, pricing structure, and cyber-attack parameters. The same MOF function, which simultaneously maximizes the cyber-physical resilience index and minimizes the outage-related financial losses and cyber cost factors, was used to measure the performance. The results of the IEEE 34-bus SDN and the Indian 28-bus SDN under Scenario-III clearly demonstrate that HPOA is superior (Table 19).
Hourly MOF comparison among optimization algorithms (Scenario-III).
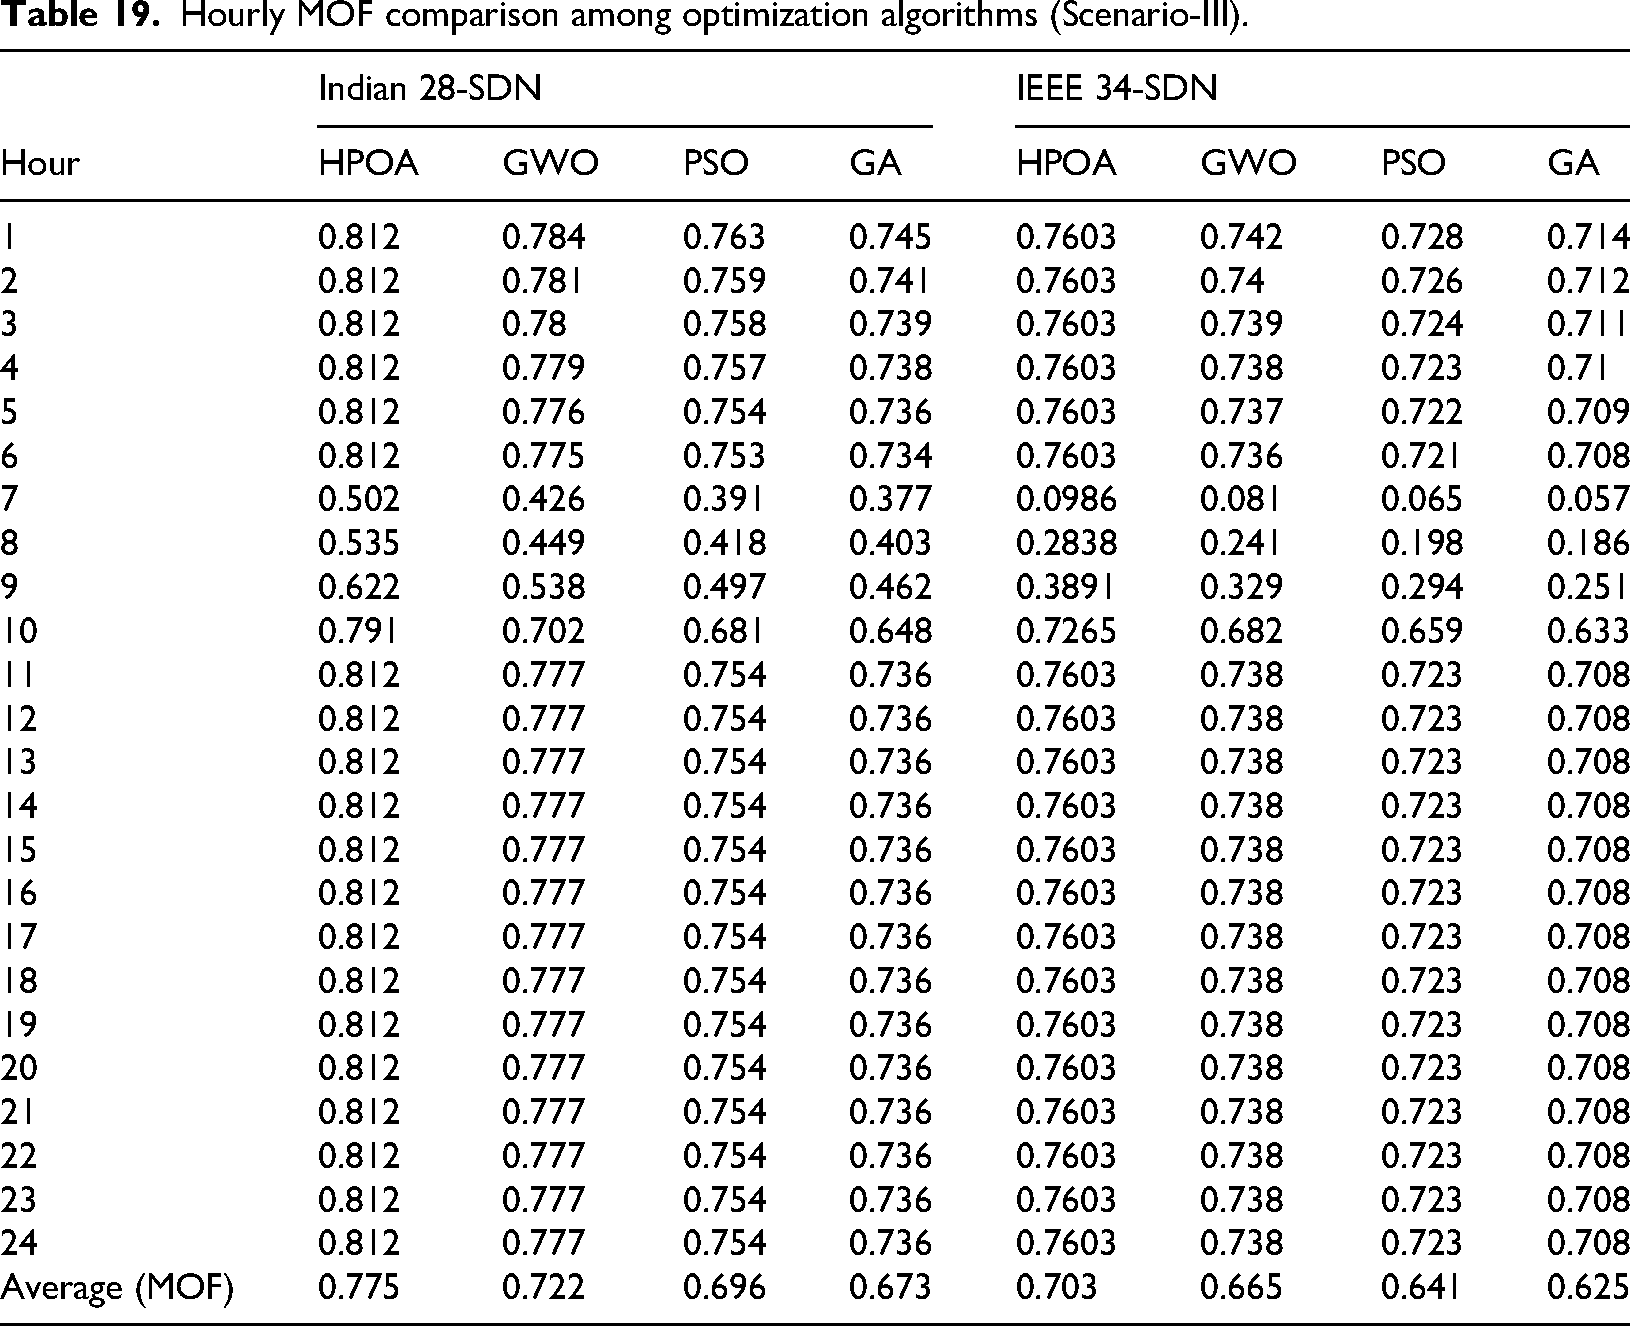
Over the 24-h evaluation period, HPOA consistently outperforms competing algorithms in terms of MOF values. HPOA shows significantly better resilience improvement and faster reconfiguration responses during high-stress recovery periods (7–10 h), where optimization performance is most important. For example, in the Indian 28-bus SDN, the proposed HPOA delivers an average MOF improvement of +15.1% over GA, +11.4% over PSO, and +7.3% over GWO. Similarly, in the IEEE 34-bus SDN, especially during distress periods when the system experiences peak energy shortages, HPOA consistently outperforms GA by +12.5% and PSO by +8.9%. This indicates that the improved resilience performance is mainly due to the optimization power and convergence performance of HPOA over the proposed IMT-based architecture. Comparative findings demonstrate that HPOA improves energy allocation decisions under high uncertainty, accelerates fault recovery, increases DER scheduling efficiency, and is highly resilient to cyber disruptions and changing renewable profiles. Therefore, HPOA presents itself as a high-scale and reliable EMS solution for upcoming SDNs, offering greater cyber-physical resilience, economic efficiency, and global optimality than the swarm-based optimizers widely used today.
According to the results shown in Table 19 and Figure 27, the proposed HPOA performed better in increasing the MOF. The superiority of the proposed hybrid architecture is evident from Figure 27, which compares the hourly MOF performance of HPOA, GWO, PSO, and GA for the Indian 28-SDN and IEEE 34-SDN under Scenario-III. At all operating times, HPOA consistently maintains high MOF values, indicating better fault handling capability, improved cyber-physical resilience and improved optimization quality. Under stable system conditions (between hours 1–6 and 11–24), HPOA outperforms GWO, PSO and GA, which show progressive performance degradation, achieving optimal MOF values of around 0.812 for the Indian network and around 0.7603 for the IEEE system. HPOA remains at the forefront with significantly larger MOF improvements than its competitors, even during the critical 7–10 h marked by load disturbances and resilience stress. Compared to GWO, PSO, and GA, HPOA increases the MOF by an average of 7.3%, 11.4%, and 15.2% in the Indian 28-SDN and 5.4%, 8.8%, and 11.1% in the IEEE 34-SDN. According to these results, HPOA is a very promising method for resilience-based multi-microgrid optimization because it offers improved convergence stability, more effective global search and flexibility in response to changing cyber-physical operating conditions.
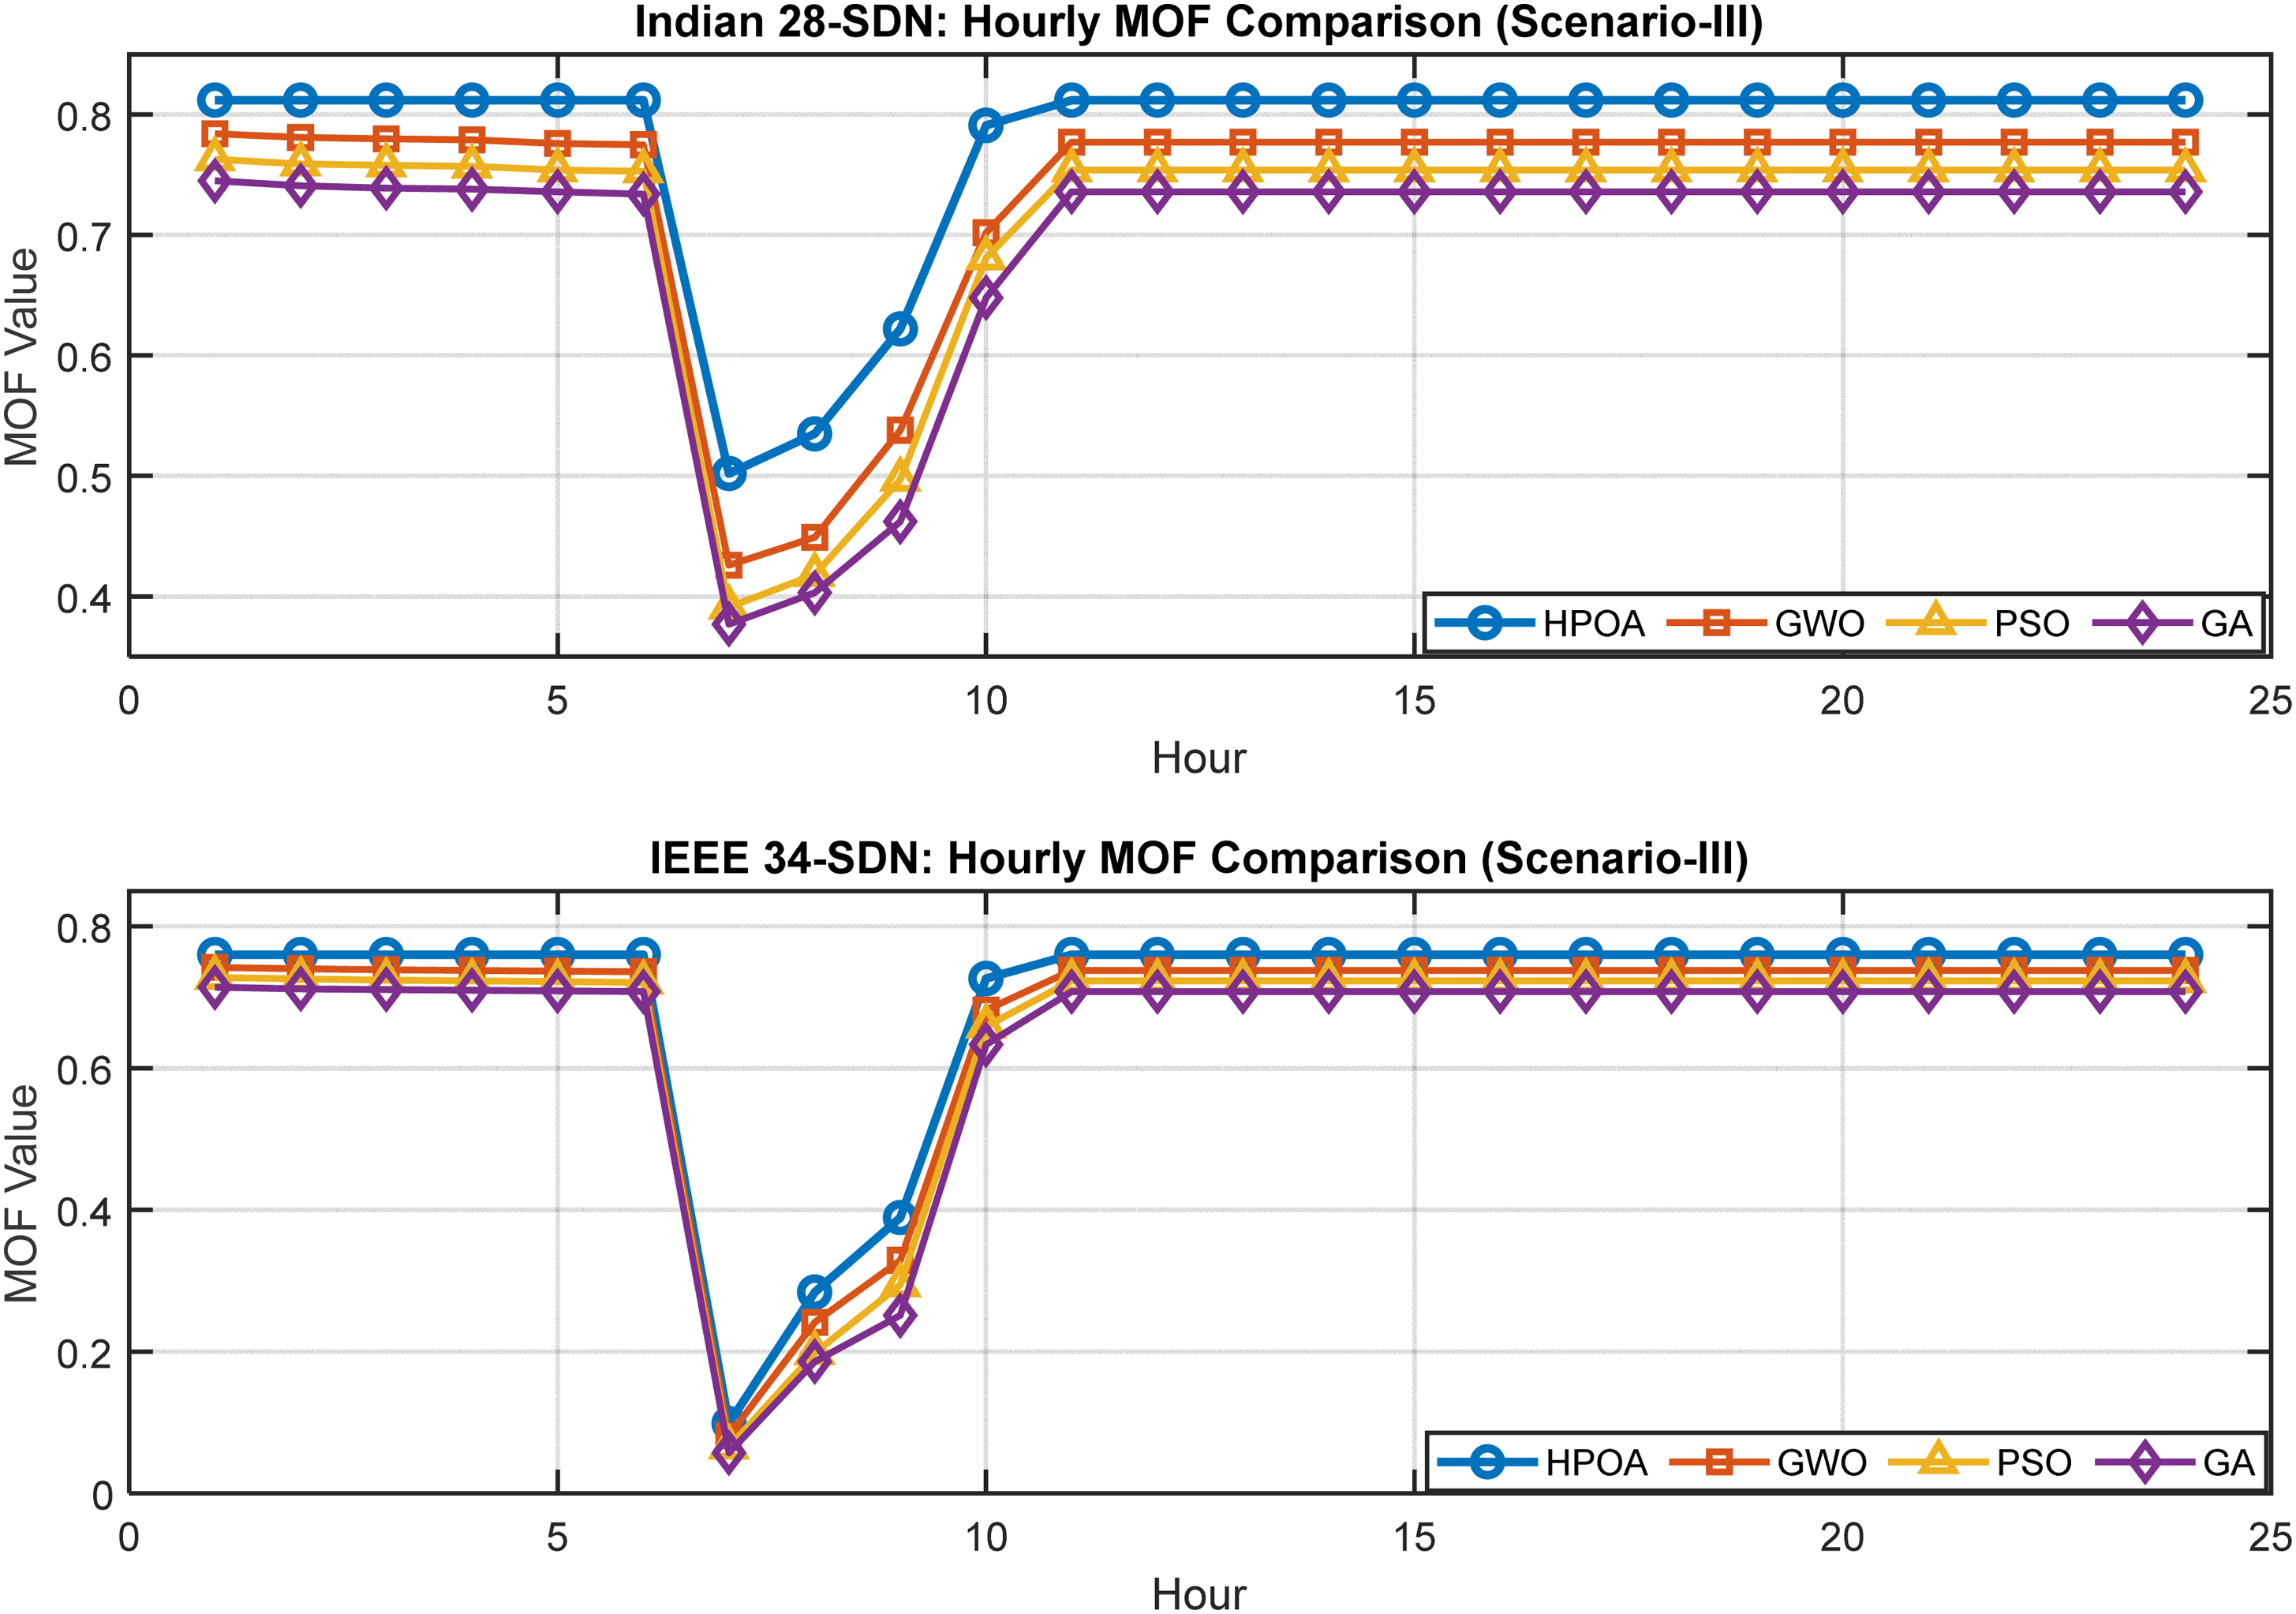
Comparison of hourly MOF across algorithms and test systems.
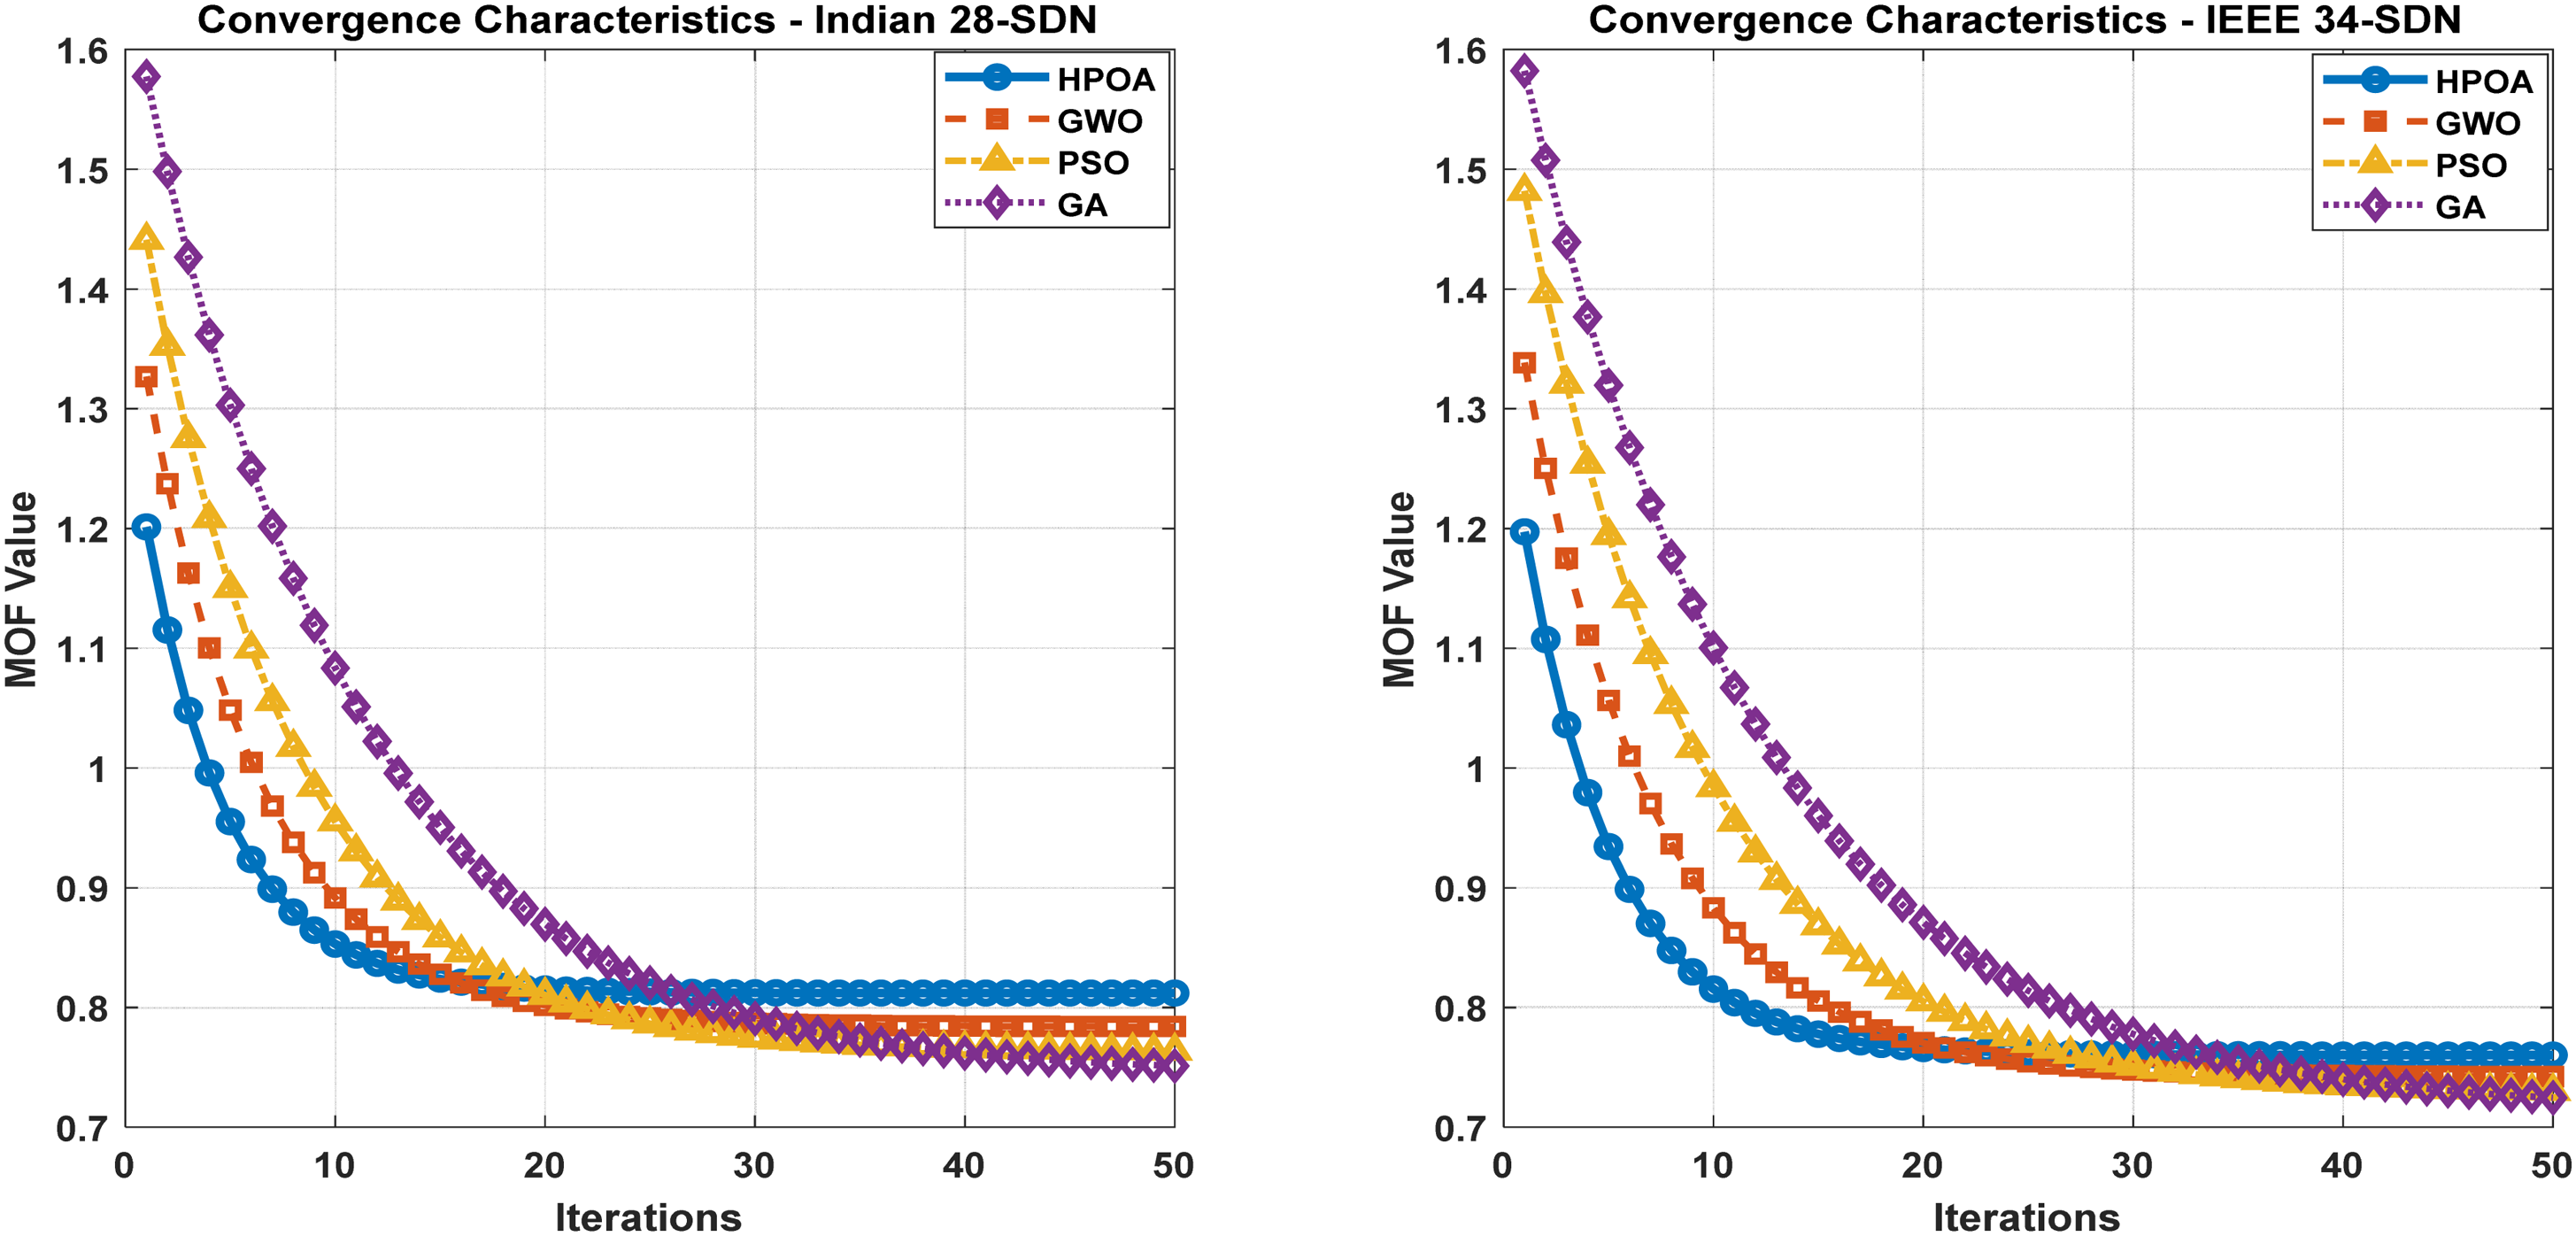
Convergence performance comparison of HPOA, GWO, PSO and GA.
Statistical assessment of algorithm performance
A comprehensive statistical analysis was conducted to compare the optimization performance and reliability of the proposed HPOA with GWO, PSO, and GA. Using the same cyber-physical operating constraints, IEEE 34-SDN and Indian 28-SDN were tested in multiple runs. The performance metrics studied included convergence effort, computational time, variance in results, robustness against stagnation at local optimum, and average, best, and worst MOF values. The results in Table 20 clearly show the consistent superiority of HPOA over the two experimental systems. For Indian 28-SDN, HPOA shows remarkable stability and resilience, achieving the highest average MOF value (0.775) with the lowest variance (0.032), in contrast to GWO (0.722), PSO (0.696), and GA (0.673). A similar technique is demonstrated in IEEE 34-SDN, where HPOA again records the lowest variance (0.043) and the best average performance (0.703), demonstrating its ability to adapt to increasing network complexity. With an average of 21–23 iterations and a low computational time of approximately 3.1 s, HPOA outperforms GA and PSO, which have high processing requirements and fast convergence behavior. Compared to other approaches that prematurely terminate during high-load recovery intervals, the proposed approach also shows the highest local-optimal avoidance rate (95–96%), demonstrating its strong potential for global exploration. According to statistical analysis, HPOA provides the most accurate, reliable, and computationally efficient optimization performance, ensuring excellent cyber-physical adaptability in the event of multiple faults or cyberattacks.
Statistical performance benchmarking of optimization algorithms across two test systems (Scenario-III).
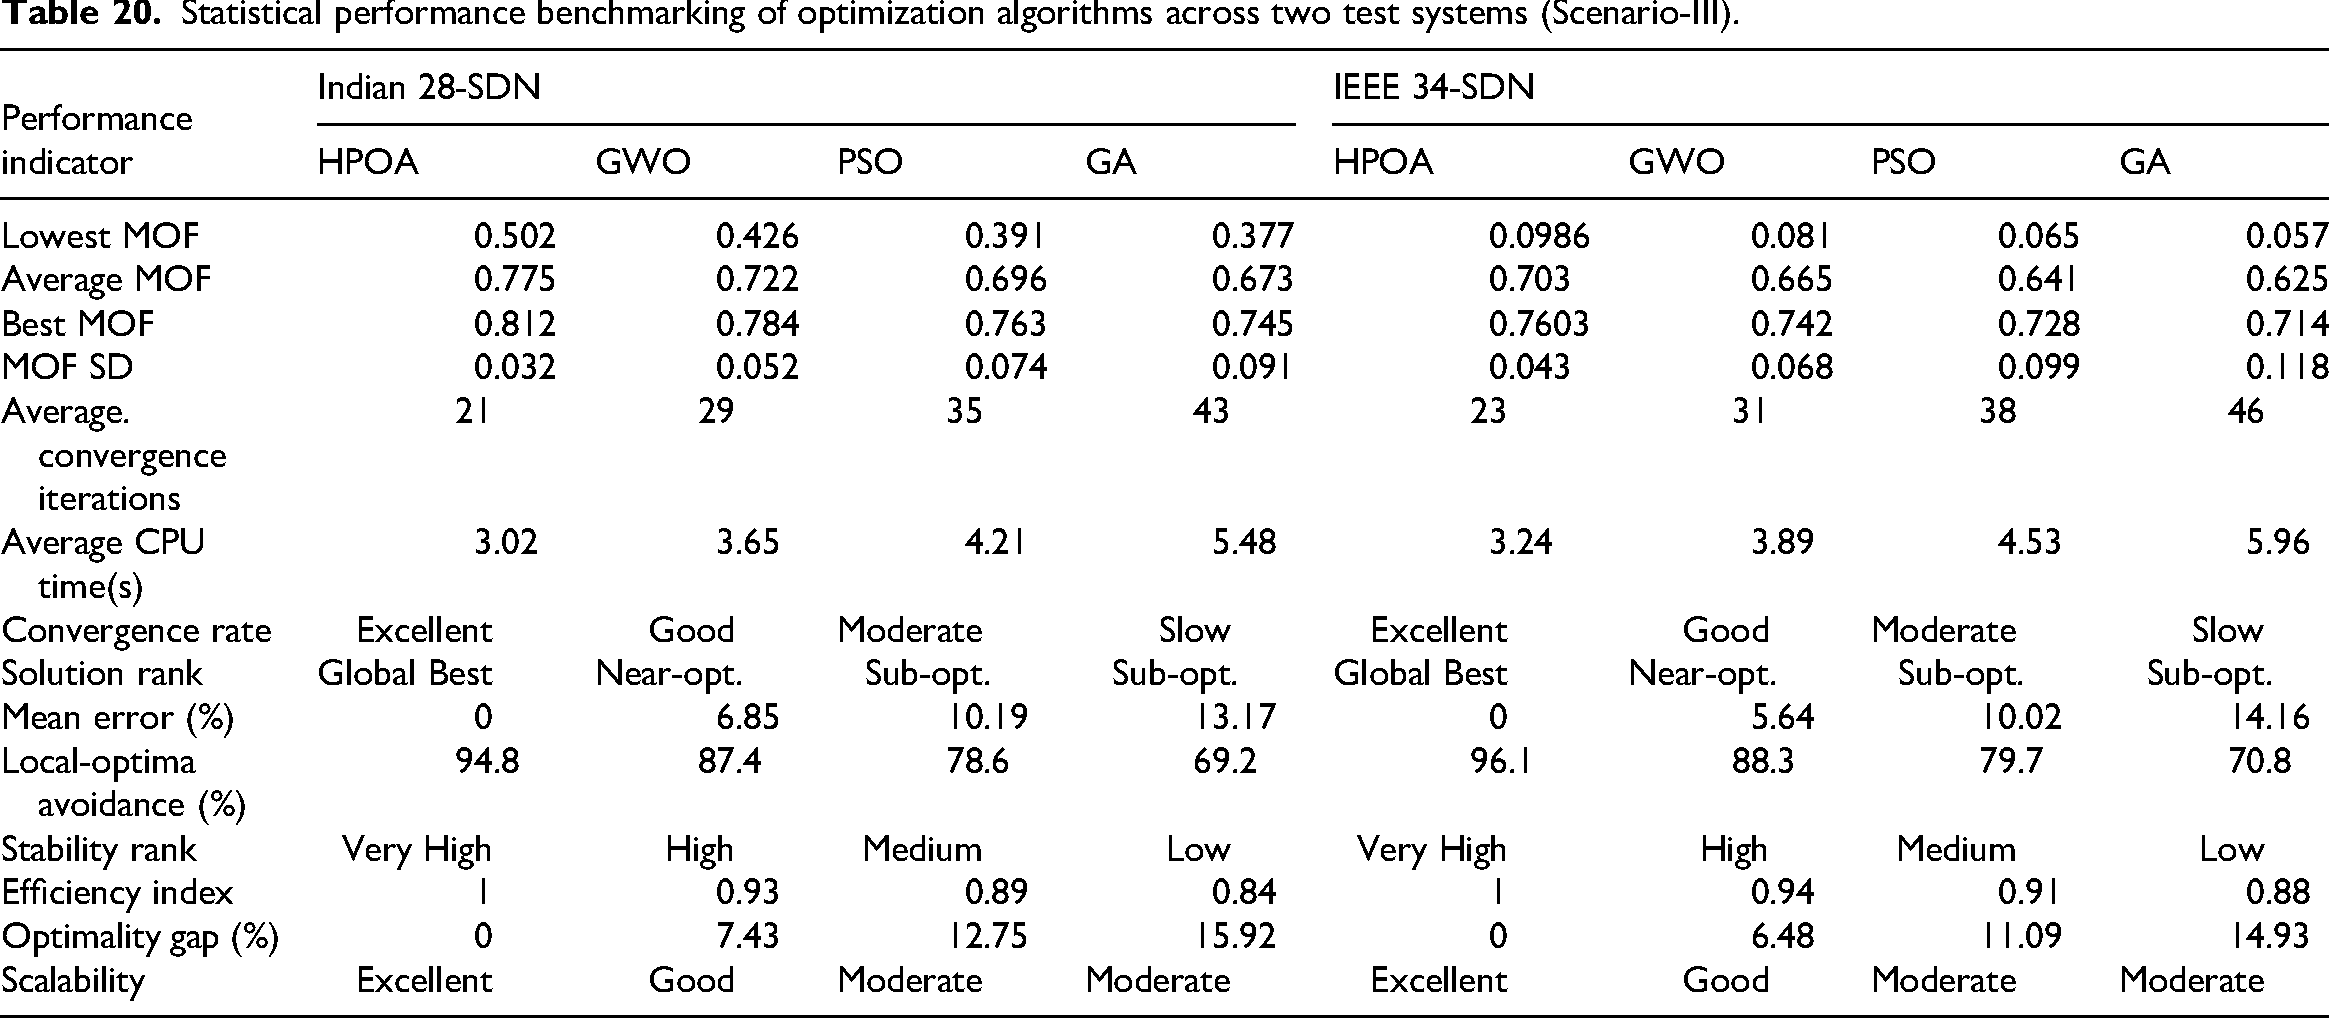
The convergence characteristics of the four optimization algorithms—HPOA, GWO, PSO, and GA—used for the IEEE 34-SDN and Indian 28-SDN networks are shown in Figure 28. The results clearly show that the proposed HPOA achieves the fastest and most stable convergence behavior in both the test systems. With a maximum MOF value of 0.812 after about 21 iterations, HPOA for the Indian 28-SDN outperforms GWO (29 iterations), PSO (35 iterations), and GA (43 iterations). Similar patterns can be observed in the IEEE 34-SDN, where HPOA achieves a peak MOF of 0.7603 in just 23 iterations, while GWO, PSO, and GA achieve relatively low objective performance levels after 31, 38, and 46 iterations, respectively. These results show that HPOA can quickly and effectively remove obstacles in near-optimal regions and reach the global optimum due to its superior exploration-exploitation trade-off. Furthermore, unlike GA and PSO, which exhibit slow and oscillatory convergence trends, HPOA is robust against local minima, as demonstrated by its smooth decay patterns and low variance. The efficiency, accuracy, and suitability of HPOA for real-time cyber-physical resilience optimization in smart distribution systems are all strongly verified by the convergence behavior.
Outcomes of the study
This work provides a framework for smart energy management driven by cyber-physical resilience, for IEEE 34-SDN and Indian 28-SDN in the event of simultaneous cyber attacks and failures. Prosumer-powered EVs, distributed BESS, MGs, and intelligent IMT-based tie-line integration all work together to ensure rapid recovery and uninterrupted operations. HPOA is used to reduce financial losses and increase resilience. A summary of the key results is given below.
✓ Improved Cyber-Physical Resilience: In the event of severe disruptions, the proposed IMT-enabled approach significantly improves supply restoration and service continuity. Compared to conventional fault-tolerant operation, the END fault delay is reduced by more than 95% in Indian 28-SDN and by more than 98% in IEEE 34-SDN. Due to the effective multi-MG support, the resilience index (RI), which is zero in the fully disconnected scenario-I, increases significantly during the restoration period and reaches its maximum in scenario-III. More than 85% of the daily operations continue to provide uninterrupted service, demonstrating strong resilience and adaptability. ✓ Mitigation of economic losses: Revenue loss and robust costs are reduced, while reducing the duration of severe power outages and supply disruptions. Essential services are kept operational even during high cyber stress due to IMT-supported power transmission, which allows for consistently high avoidable fault costs. The reliability of the proposed cyber-aware control strategy is confirmed by the almost zero economic penalty in the long term. ✓ Successful Inter-Microgrid Energy Exchanges: MGs can exchange excess renewable energy and V2G power in a dynamically optimized manner thanks to the IMT mechanism. During periods of high demand and high price, trading intensifies, enhancing overall operational profitability while promoting supply adequacy and voltage stability. In islanded conditions, this strengthens physical and economic resilience. ✓ Operational robustness and real-time adaptability: Uncertainties like load variations, EV mobility, renewable variability, and cyber communication degradation are all handled by the framework on its own. The control success probability is still high enough for long-term autonomous operation without main-grid support, even in the face of hostile cyber activity. This demonstrates a high level of preparedness for practical implementation. ✓ Rationale for HPOA Selection: HPOA is the best optimizer for multi-objective cyber-physical resilience enhancement, according to a comparison with GWO, PSO, and GA. In both SDNs:
When compared to GWO, HPOA increases the objective function value by 7–12%. 10–15% in comparison to PSO and 12–18% in comparison to GA; Up to 45% faster convergence; Highest stability → lowest variance; 95–96% avoidance of local-optima. As a result, HPOA consistently finds globally optimal cyber-physical restoration schedules with high computational efficiency. ✓ According to the study, combining MGs with tie-line reconfiguration assisted by intelligent IMT and HPOA-optimized DER management results in a comprehensive resilience architecture where:
Power is restored more quickly. Economic losses are kept to a minimum. Cyberattacks are unable to interrupt overall continuity. Reliability is maintained while maximizing grid independence.
Overall, by guaranteeing always-available, financially feasible, and cyber-secure operation in realistic multi-threat environments, the framework improves the state of resilient smart distribution systems. The results unequivocally confirm that the suggested system is a scalable basis for upcoming intelligent power and self-healing systems.
Conclusion
Using the HPOA to optimize microgrid formation, dynamic tie-line deployment, and IMT, this work presented a framework for improving cyber-physical SDNs’ intelligence and resilience. Below is a summary of the main findings:
Enhancement of Cyber-Physical Resilience: Postfault service continuity was greatly enhanced by the implementation of coordinated MG islanding. The resilience index rose from 0 to about 2.5 in comparison to Scenario-I (no resilience), indicating operational survival during disruptions. Benefit of Network Topology Optimization: In Scenario-III, tie-line reinforcement made it possible for MGs to share energy, which decreased the overall END by over 60% and raised the resilience index to 43.14 (Indian RDS) and 46.99 (IEEE-34) during the hours of greatest disruption. Economic Gains via IMT: The suggested IMT approach highlighted better energy use and market participation by raising prosumer trading revenue to 43.05 USD for the Indian 28-bus and 50.65 USD for the IEEE 34-bus systems, respectively. HPOA Outperforming Benchmarks: In terms of solution quality, stability, and computation time, HPOA outperformed GWO, PSO, and GA, accomplishing 7–15% better MOF, ∼95% robustness, and the fastest convergence (21–23 iterations). Operational Flexibility and Recovery Speed: Under various cyber-physical scenarios, dynamic reconfiguration allowed for quick restoration, shorter load interruption times, and enhanced adaptive power routing.
Limitations and future scope
Despite the effectiveness of the suggested framework, the following areas still need improvement:
Simplified cyberattack modelling (future: latency-based and protocol-aware security). Deterministically, DER and EV uncertainties are managed (future: stochastic forecasts and adaptive scheduling). Resilience asset cost-optimization is not assessed (future: techno-economic co-optimization). It is still necessary to conduct experimental validation with real-time simulators (future: HIL and digital-twin deployment).
The suggested HPOA-driven cyber-physical resilience approach is a dependable and scalable solution for future resilient smart grids since it greatly improves operational continuity, economic efficiency, and adaptive recovery value.
List of abbreviations
Footnotes
Funding
The authors received no financial support for the research, authorship, and/or publication of this article.
Declaration of conflicting interests
The authors declared no potential conflicts of interest with respect to the research, authorship, and/or publication of this article.