
Abstract
The measurement of rock mechanics parameters is the basis for the classification of surrounding rock and the design and optimization of supporting parameters in underground engineering. Therefore, the rapid and accurate measurement of rock mechanics parameters is of great significance in ensuring the safe and efficient construction of underground engineering. However, there are still some problems to be solved in the determination of rock mechanics parameters, such as complicated process, long time consuming and high cost. To solve the above problems, a method of rock mechanical parameters determination while drilling based on the hunter-prey optimizer (HPO)-backpropagation (BP) neural network is proposed. Laboratory rock drilling tests and rock mechanical parameters determination tests are carried out. Based on the HPO-BP neural network method, a relationship model between drilling engineering parameters and rock mechanical parameters is established. The results show that there is little difference between the rock mechanical parameters obtained by the verification centralized test and the predicted rock mechanical parameters. The determining coefficients R2 of uniaxial compressive strength, cohesion force c, and internal friction angle φ are 0.9778, 0.9772, and 0.9817, respectively, and the mean difference rates are 1.36%, 3.78%, and 0.81%, respectively. It is proved that the relationship model between drilling engineering parameters and rock mechanics parameters based on the HPO-BP neural network has a good effect on the prediction of rock mechanics parameters, and can effectively measure rock c–φ parameters quickly and accurately.
Keywords
Introduction
Determination of rock physico-mechanical parameters such as uniaxial compressive strength, cohesion, and angle of internal friction is the basis of perimeter rock classification, support parameter design, and optimization for underground projects (Liu et al., 2018; Wang et al., 2018; Wu et al., 2018). Therefore, how to quickly and accurately determine the rock physical and mechanical parameters is of great significance to ensure the safe and efficient construction of underground projects. At present, the determination of rock mechanical parameters is mainly carried out through indoor mechanical tests. However, this method requires on-site peripheral rock drilling and coring, and the core is transported to the laboratory for testing, which is time-consuming, costly, and unable to obtain the mechanical parameters and structural characteristics of the rock body under the real environment on site.
Numerous domestic and international studies have shown that there is a close correlation between drilling engineering parameters and rock mechanical parameters, proving the feasibility of predicting rock mechanical parameters from drilling engineering parameters (Aalizad and Rashidinejad, 2012; Kahraman, 1999; Song et al., 2011; Wyk et al., 2014; Yue et al., 2004). Therefore, numerous scholars have used digital drilling equipment to study the off of drilling engineering parameters and rock mechanical parameters through methods such as energy analysis and machine learning. Panahandeh et al. (2021) propose to predict concrete compressive strength, cohesion, and angle of internal friction by using drilling speed, drill pipe speed, power, and torque as input parameters. Mpagazehe et al. (2013) simulated the formation drilling bit by the discrete element method, and conducted rock drilling experiments under laboratory conditions to investigate the effects of rock mechanical properties, feed force, and drill pipe rotation speed on the drilling speed. Jefferson et al. (2007) found a clear linear relationship between both uniaxial compressive strength and Columbia indentation experiments, which can be used as a predictive means of characterizing the real-time strength of a formation. Li and Itakura (2012) considered the drilling process as an axial and rotary indentation process and constructed an analytical model, which was validated by indoor and field tests. Huang and Wang (1997), Mostofi et al. (2011) and Yaşar et al. (2011) have established empirical equations for the correlation between drill-following parameters and uniaxial compressive strength (UCS) through field or indoor experimental studies. However, there are fewer studies on the relationship between drilling engineering parameters and rock c–φ parameters. For mechanical analysis methods, extensive indoor testing (Tan et al., 2009) and numerical simulations (Akin and Karpuz, 2008; Huang et al., 2013; Jaime et al., 2015) have shown that, the rock is in ductile damage mode when the instantaneous depth of cut of the single row of cutting edges of the drill is small, the cohesive force c of the rock and the angle of internal friction φ play a controlling role in the rock cutting damage process. Wang et al. (2019) proposed a mechanical model of cutting edge rock breaking without presetting the damage surface, and derived the rock ultimate cutting force based on the slip line theory, so as to establish the relationship between drilling engineering parameters and rock c–φ parameters.
Moreover, most of the existing equipment can only indirectly determine the engineering parameters near the drill bit through the relevant instruments and sensors on the surface, which is often far from the real value. In this article, the shield tunnel boring simulation with drilling test system can be used to test the drilling parameters near the drill bit, which solves the problem that the existing equipment cannot detect the engineering parameters near the drill bit, resulting in a large error in the test results.
Based on this, this paper uses the shield tunnel boring simulation with drilling test system to carry out indoor rock solid drilling test, and establishes the relationship model between drilling engineering parameters and rock mechanical parameters based on the predator optimization algorithm hunter-prey optimizer (HPO)-backpropagation (BP) neural network method, which realizes the fast and accurate determination of the rock mechanical parameters, and provides a new way of thinking for the determination of the rock mechanical parameters.
Experimental program design
Test equipment
The equipment used for the test is the shield tunnel boring simulation follow-drilling test system, as shown in Figure 1.
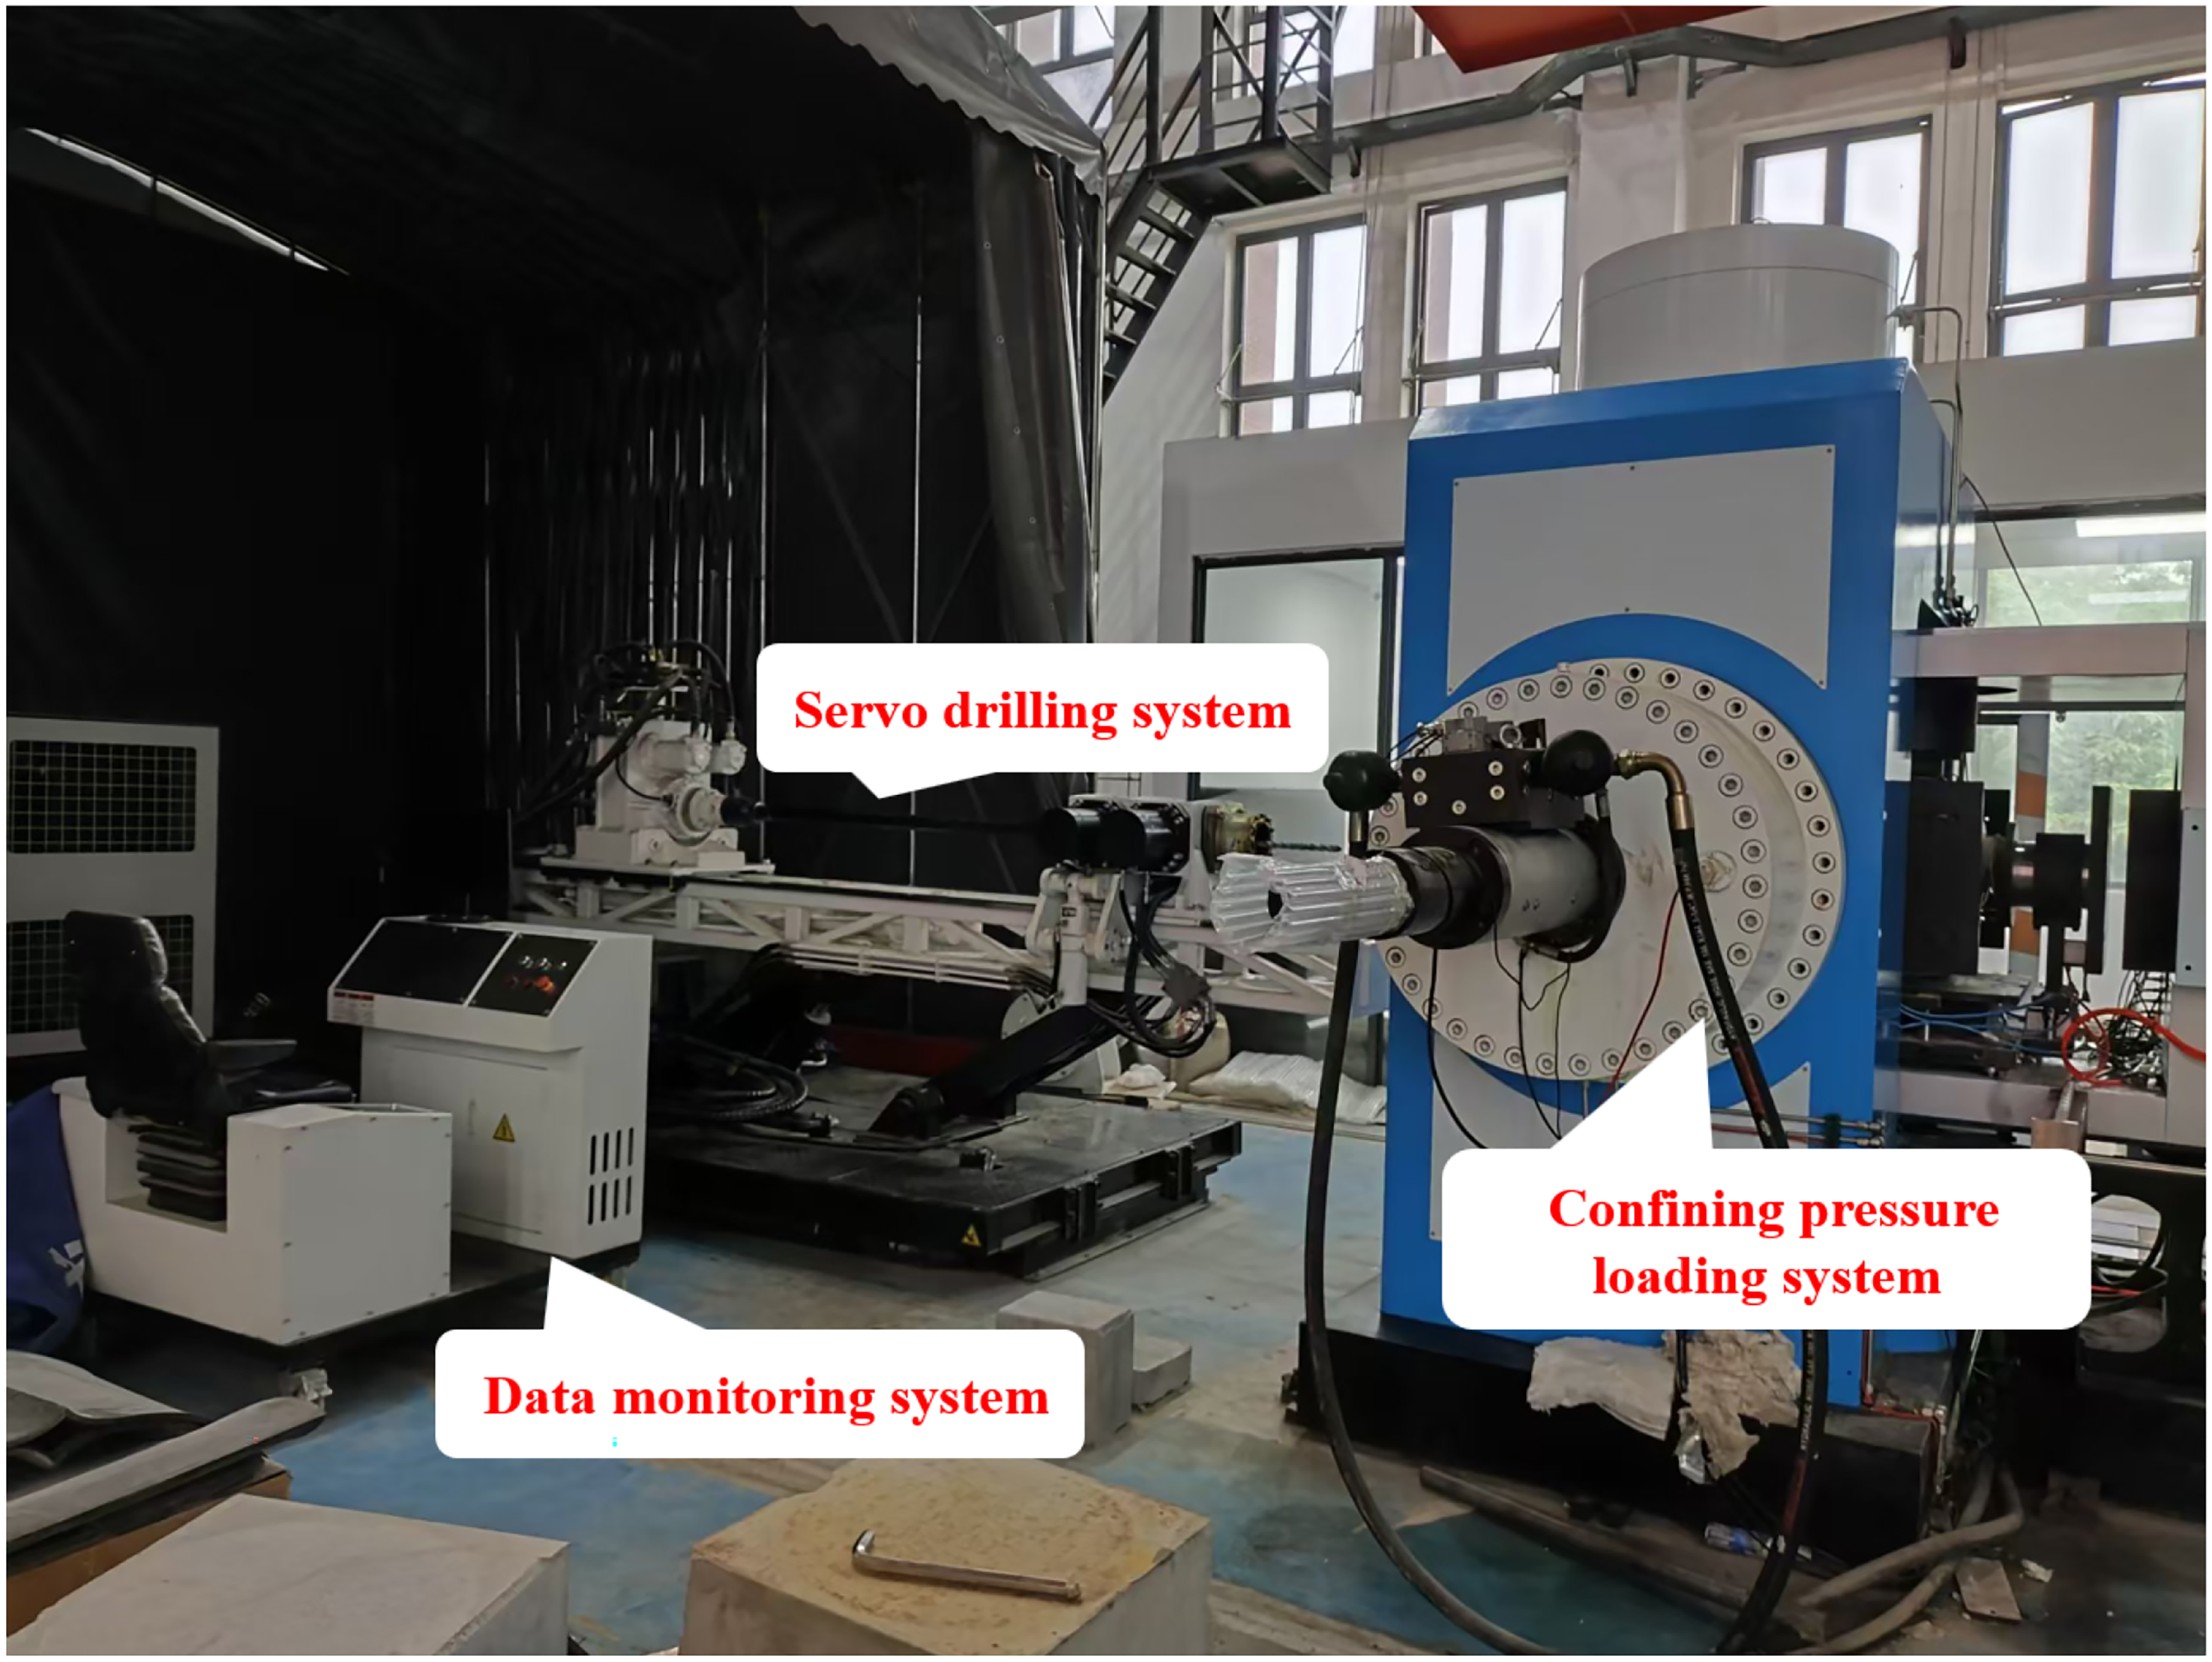
Shield tunnel boring simulation drill-following test system.
This system includes servo drilling system, confining pressure loading system, and data monitoring system. The maximum feeding force of the equipment is 300 kN, the maximum torque is 10,000 N.m, and the maximum rotation speed is 164 r/min (with continuously variable speed). The hydraulic components of the system are driven by electricity to achieve various functions. The main sensors are pressure sensors and displacement sensors, with a collection frequency of 50 Hz.
Experimental materials and program design
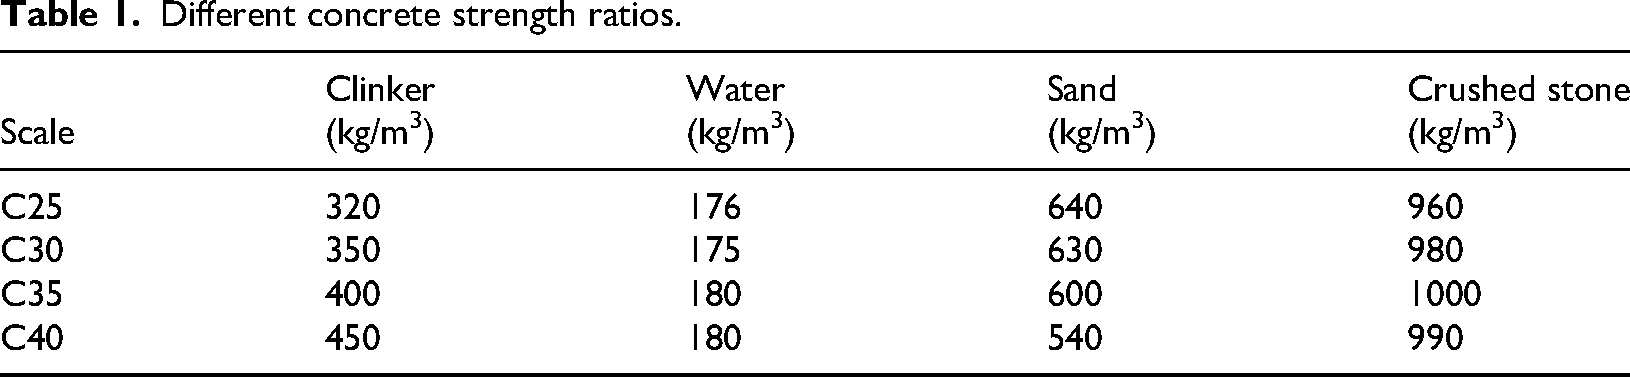
In this section, concrete will be used as the test material, and the concrete specimens will be proportioned according to four strengths, as shown in Table 1, with eight sets of each type of specimen. Concrete specimens C25 numbered A1–A8, C30 numbered B1–B8, C35 numbered C1–C8, C40 numbered D1–D8, the dimensions of the specimens were all 300 mm × 300 mm × 300 mm (length × width × height).
Different concrete strength ratios.
The test will utilize a control mode that regulates drilling pressure and RPM to monitor drilling depth, drilling time, RPM, drilling pressure and torque. The rotational speed is divided into three levels: 41, 82, and 164 r/min, There are three levels of drilling pressures: 1000, 1225, and 1450 N.
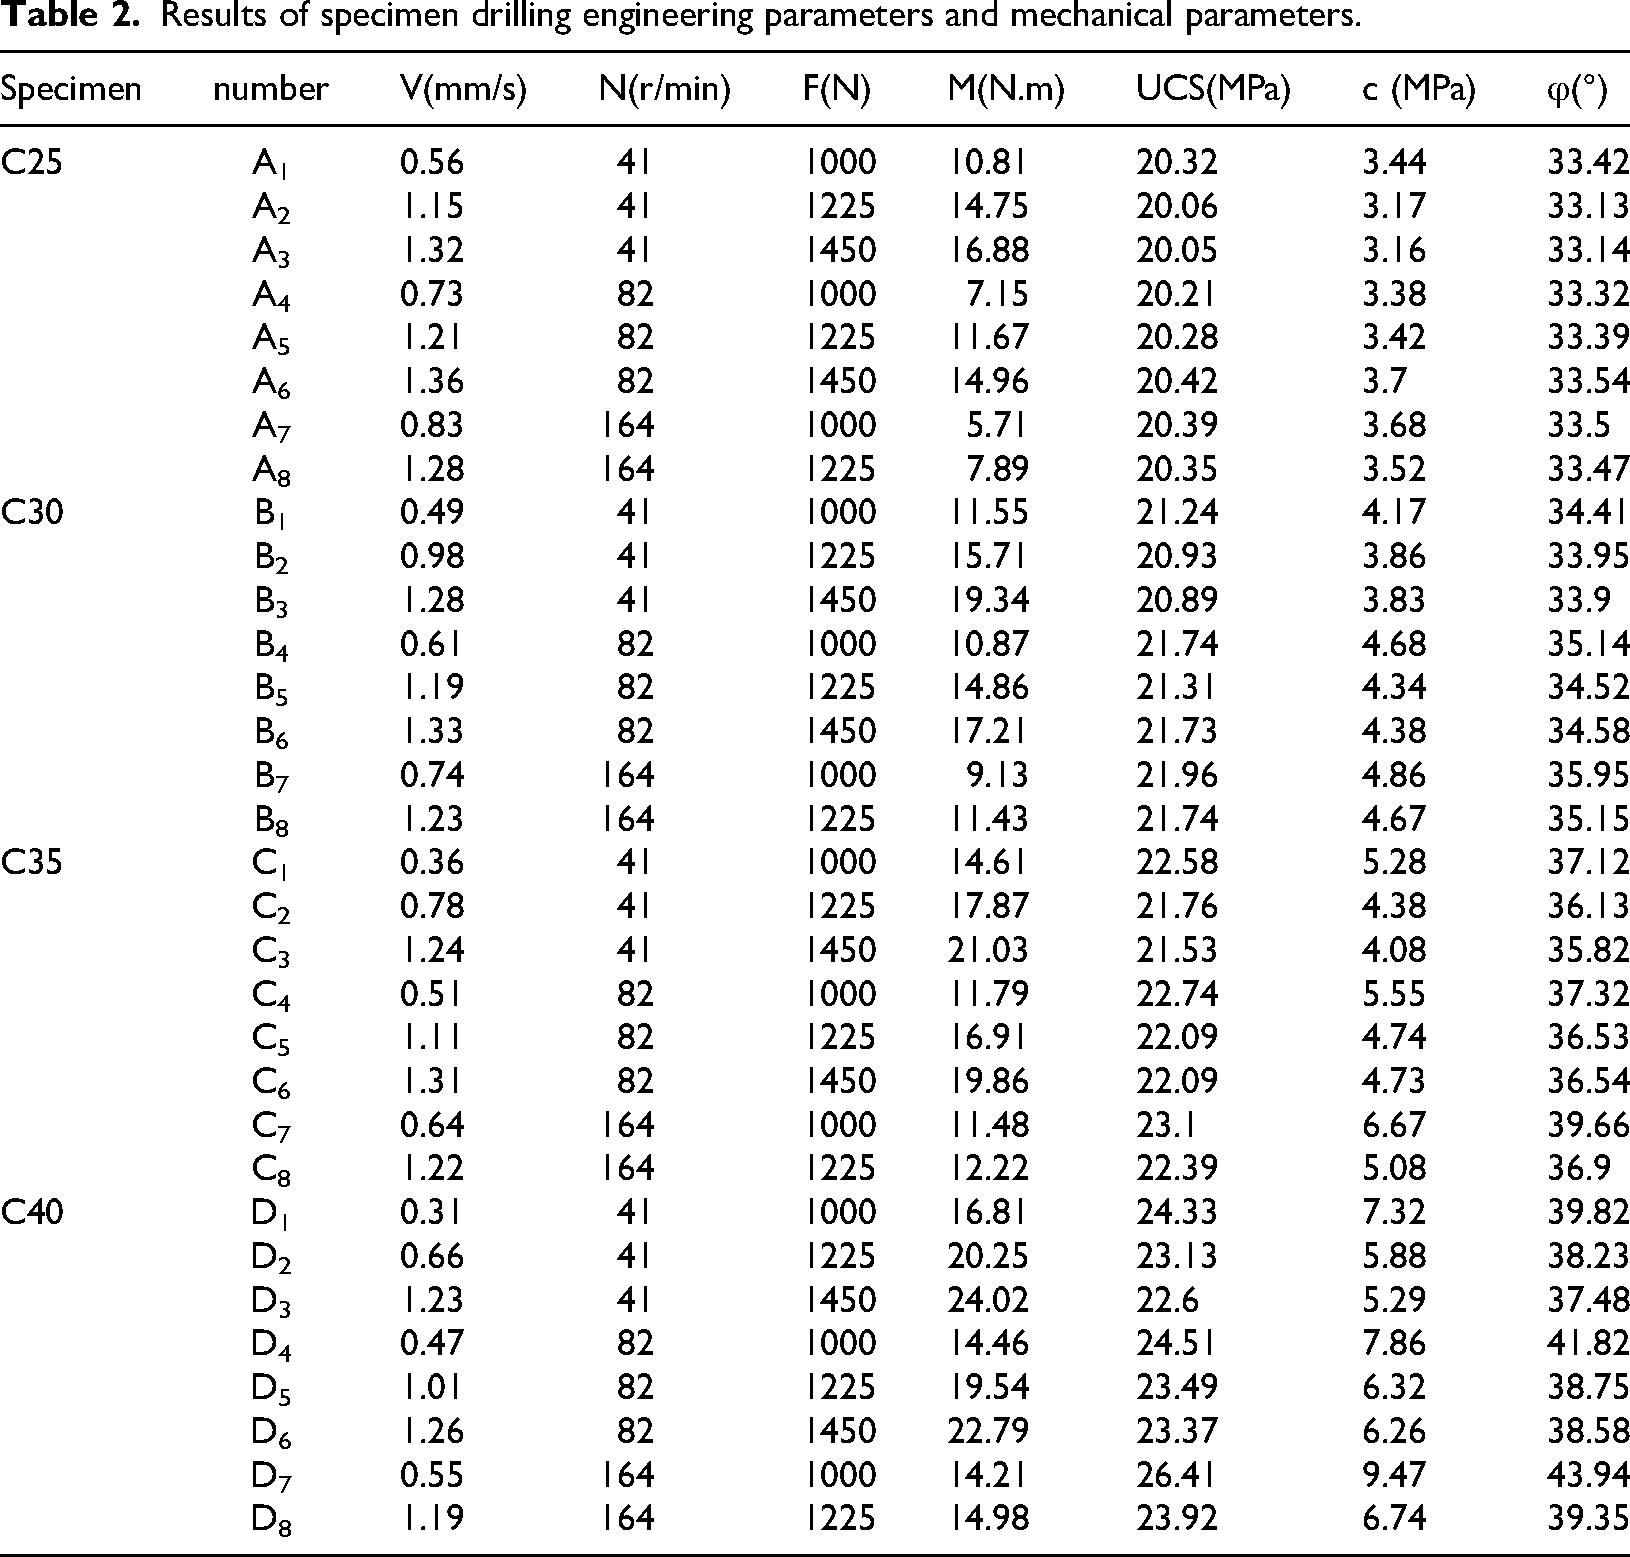
The specimens were subjected to indoor live drilling tests, and the drilling engineering parameters (drilling speed, rotational speed, drilling pressure, and torque) of the specimens were measured, and uniaxial compression and triaxial compression tests were conducted, and the uniaxial compressive strength UCS, cohesive force c, and the angle of internal friction φ of the specimens were measured, and the specific data are shown in Table 2.
Results of specimen drilling engineering parameters and mechanical parameters.
HPO-BP neural network algorithm
BP neural network
BP neural network is an artificial neural network based on error BP algorithm, which is used to process the nonlinear mapping relationship of input data. It is more suitable for exploring the response relationship between drilling engineering parameters and rock mechanics parameters in this article. The network structure is shown in Figure 2.
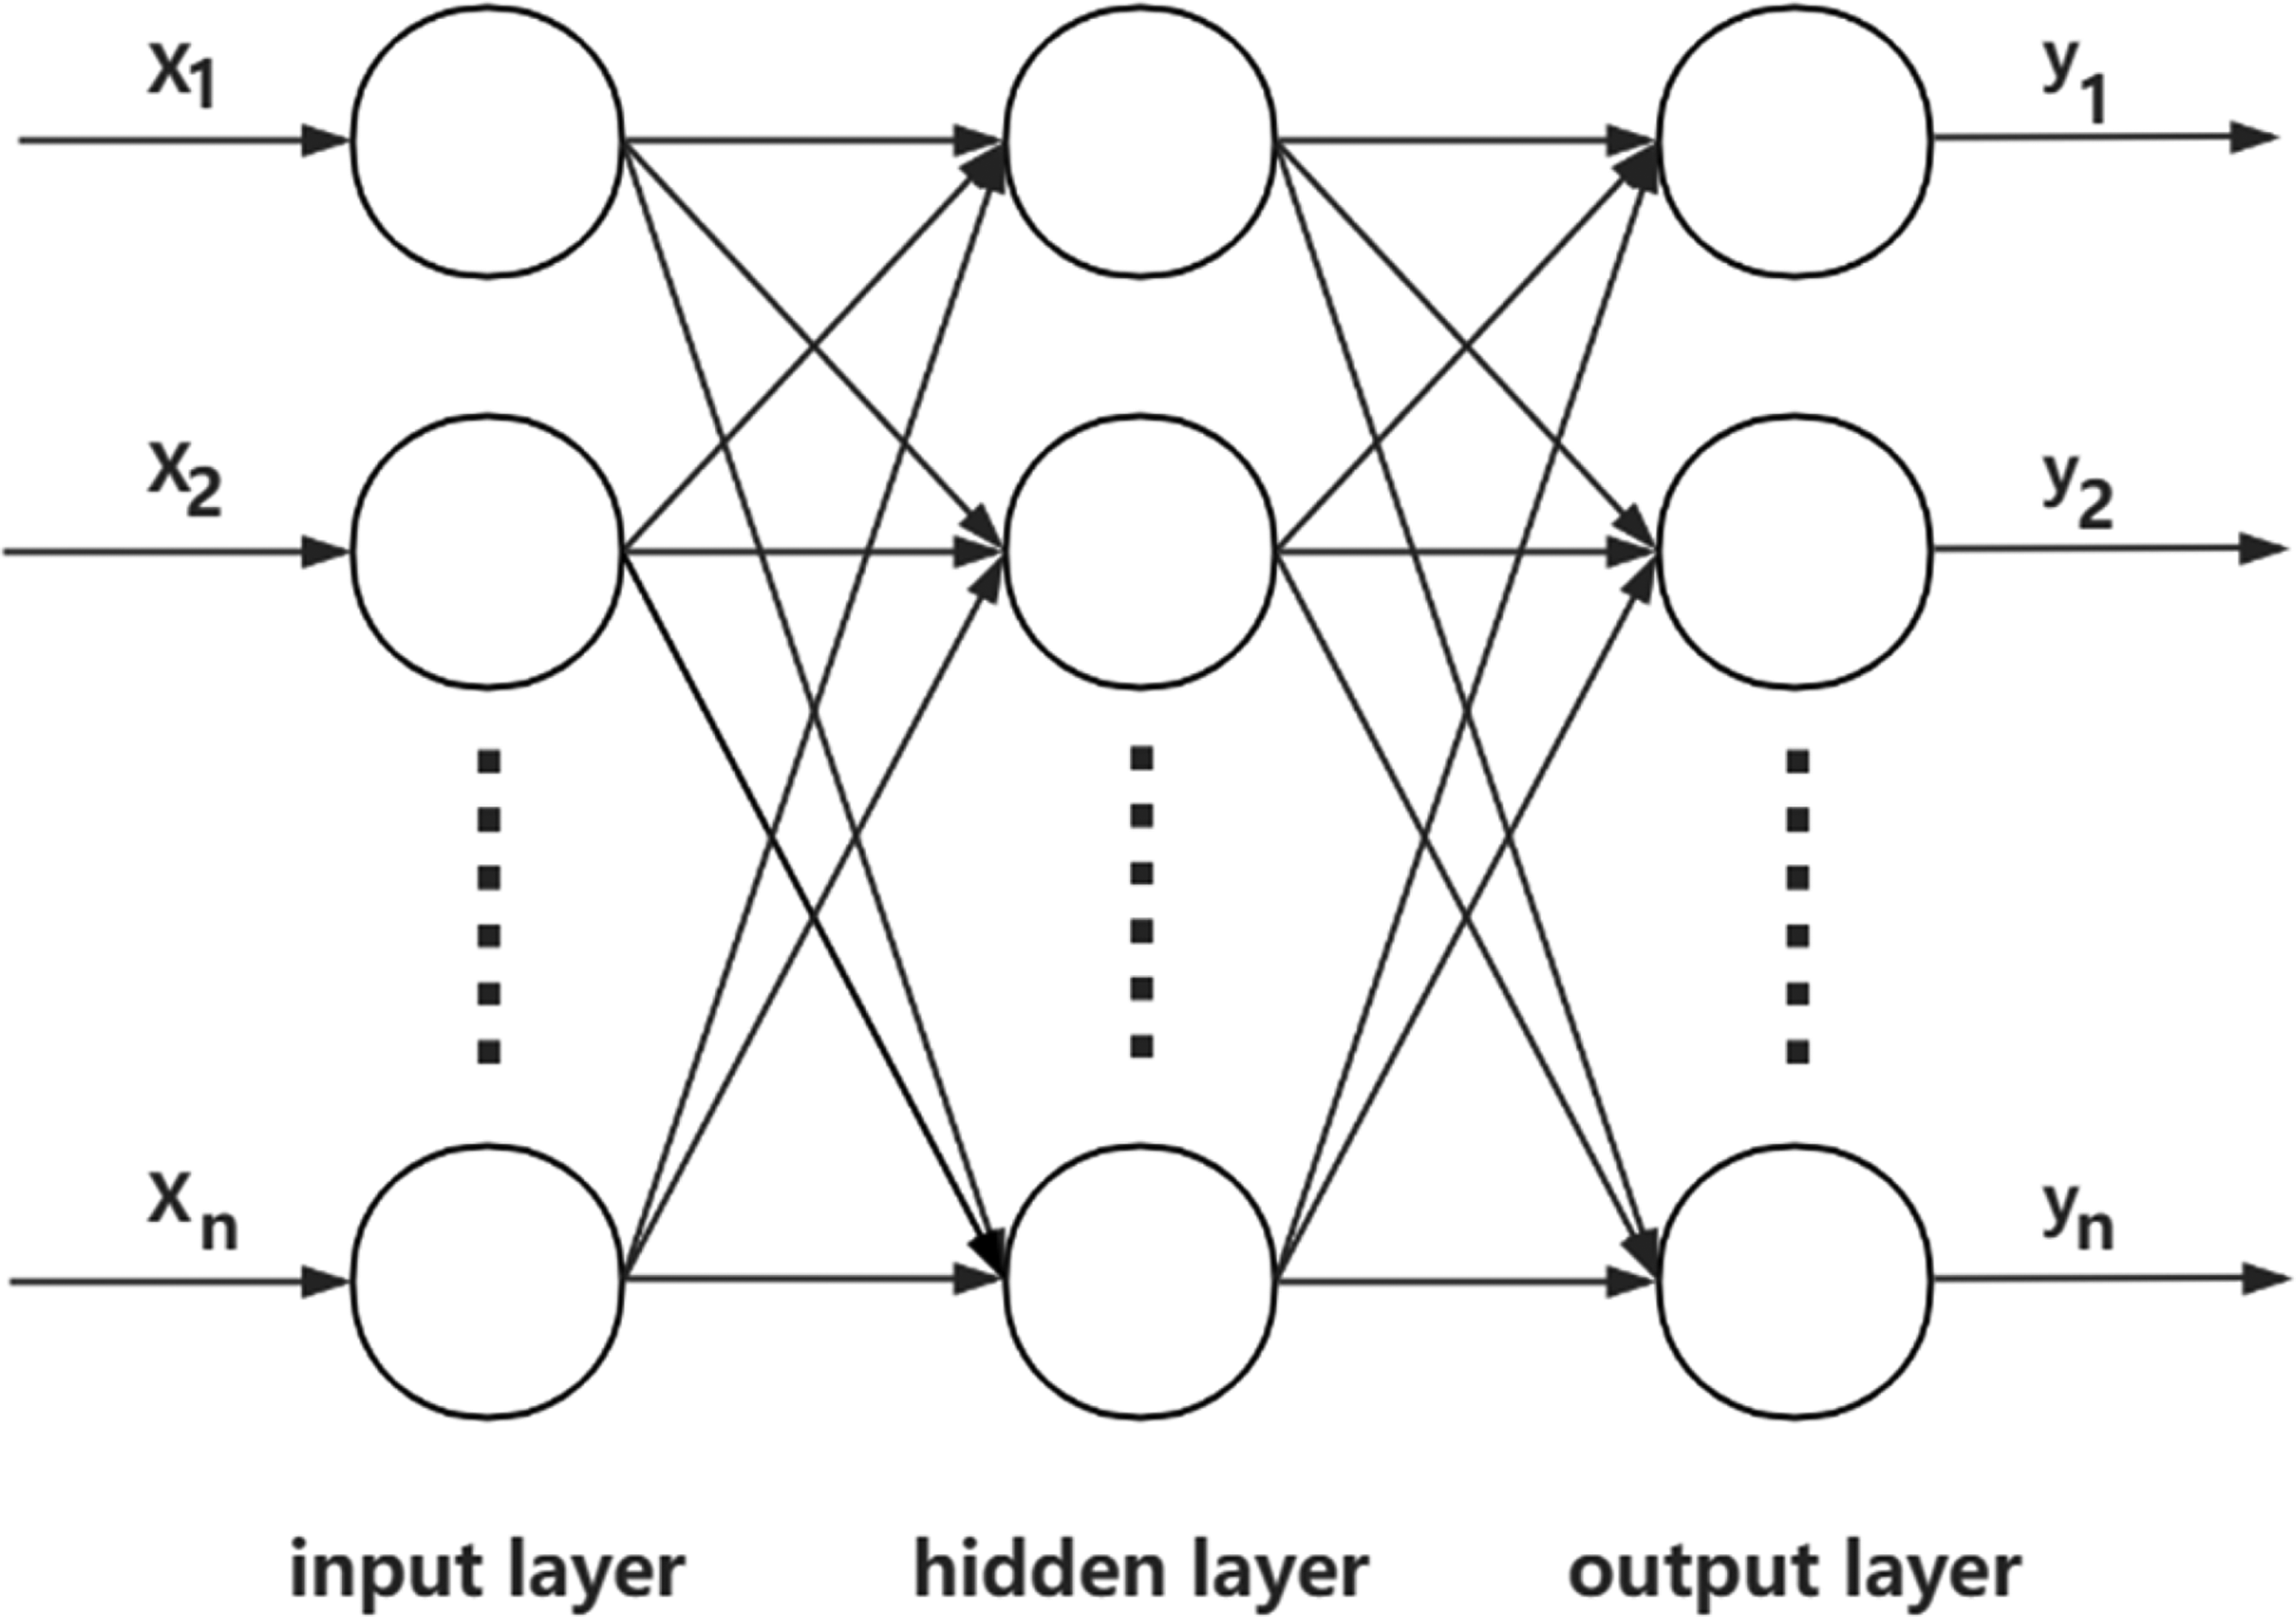
Bp neural network organization chart.
Due to the different network structures, the prediction accuracy of BP neural networks varies, and the probability of overfitting problems greatly increases. This is mainly due to the inappropriate initial state selected during network training, which leads to weights and thresholds falling into local optimal solutions, ultimately resulting in the inability to converge to a state where the model can accurately output training samples, leading to poor stability. Regarding this issue, swarm intelligence optimization algorithm is one of the common methods for optimizing the initial weights and thresholds of BP neural networks, which can effectively improve the predictive performance of the model. This article attempts to select the emerging swarm intelligence optimization algorithm in recent years - Hunter Optimization Algorithm (HPO) - to optimize the BP neural network (Naruei et al., 2022). This algorithm simulates the process of animal hunting to optimize the problem, and has the characteristics of fast convergence speed and strong optimization ability.
Predator optimization algorithm (HPO) principles
As with existing optimization algorithms, the predator population performs a random initialization of the position settings within the search range:
Where: xi is the location of the predator or prey; d is the number (dimension) of the problem variable; ub is the maximum value (upper bound) of the problem variable; and lb is the minimum value (lower bound) of the problem variable.
For the predator's search mechanism, the mathematical model is:
Where: xi,j(t + 1) is the predator's next iteration position; xi,j(t) is the current predator position; C is the balance parameter between exploration and exploitation; Z is an adaptive parameter determined by a specific formula; Ppos(j) is the prey position; μ(j) is the average of all the positions; and Z is an adaptive parameter determined by a specific formula.
C、Z and μ(j) are calculated as follows:


Where: i is the number of current iterations; MaxI is the maximum number of iterations; the value of C decreases from 1 to 0.02 during the iteration;
R2 is a random number in [0,1]; IDX is the index value of the vector
Calculating the prey position Ppos requires first calculating the Euclidean distance with the formula:
The search agent with the largest distance from the location mean is considered prey (Ppos),the formula is:
If the maximum distance between the search agent and µ is taken into account in each iteration, it results in the algorithm having delayed convergence. According to the hunting scenario, the predator will move to a new prey location for the next hunt after successfully capturing the prey. Therefore, a decreasing mechanism will be considered to solve this problem:
Where: N is the number of search agents.
Replace equation (7) with the following:
The value of kbest is equal to N at the beginning of the algorithm. the prey is the last searching individual that is furthest away from the average position μ of the searching individuals and is captured by the predator. The best safe position is assumed to be the best global position, under this assumption the prey has a better chance of survival and the predator may choose other prey. Equation (11) is used to update the prey position:
Where: xi,j(t + 1) is the next iteration position of the predator; xi,j(t) is the current predator position; Tpos(j) is the globally optimal position; R4 is a random number in the range [−1,1]; the cos function and its input parameters allow for globally optimal positions of the next prey position at different angles and radii and improve the performance of the development phase.
Equation (12) is obtained by combining Equation (2) with Equation (11), selecting the predator and prey, introducing a random number R5 in the range [0,1], when R5 < β, the algorithm takes the route of the predator, i.e., it is computed according to Equation (2), and when R5 ≥ β, the algorithm takes the route of the prey, that is, it is computed according to Equation (11):
Where: β is the adjustment parameter.
HPO-BP neural network
The HPO algorithm randomly generates a certain number of search agents, each of which in turn has a vector set of a certain spatial dimension. For the initial weights and thresholds optimization problem of a BP neural network, this vector set is then a potential optimal solution of the network weights and thresholds, and the total number of weights and thresholds to be optimized in the network structure determines the spatial dimension of the vector set. The structure of HPO-BP neural network is shown in Figure 3.
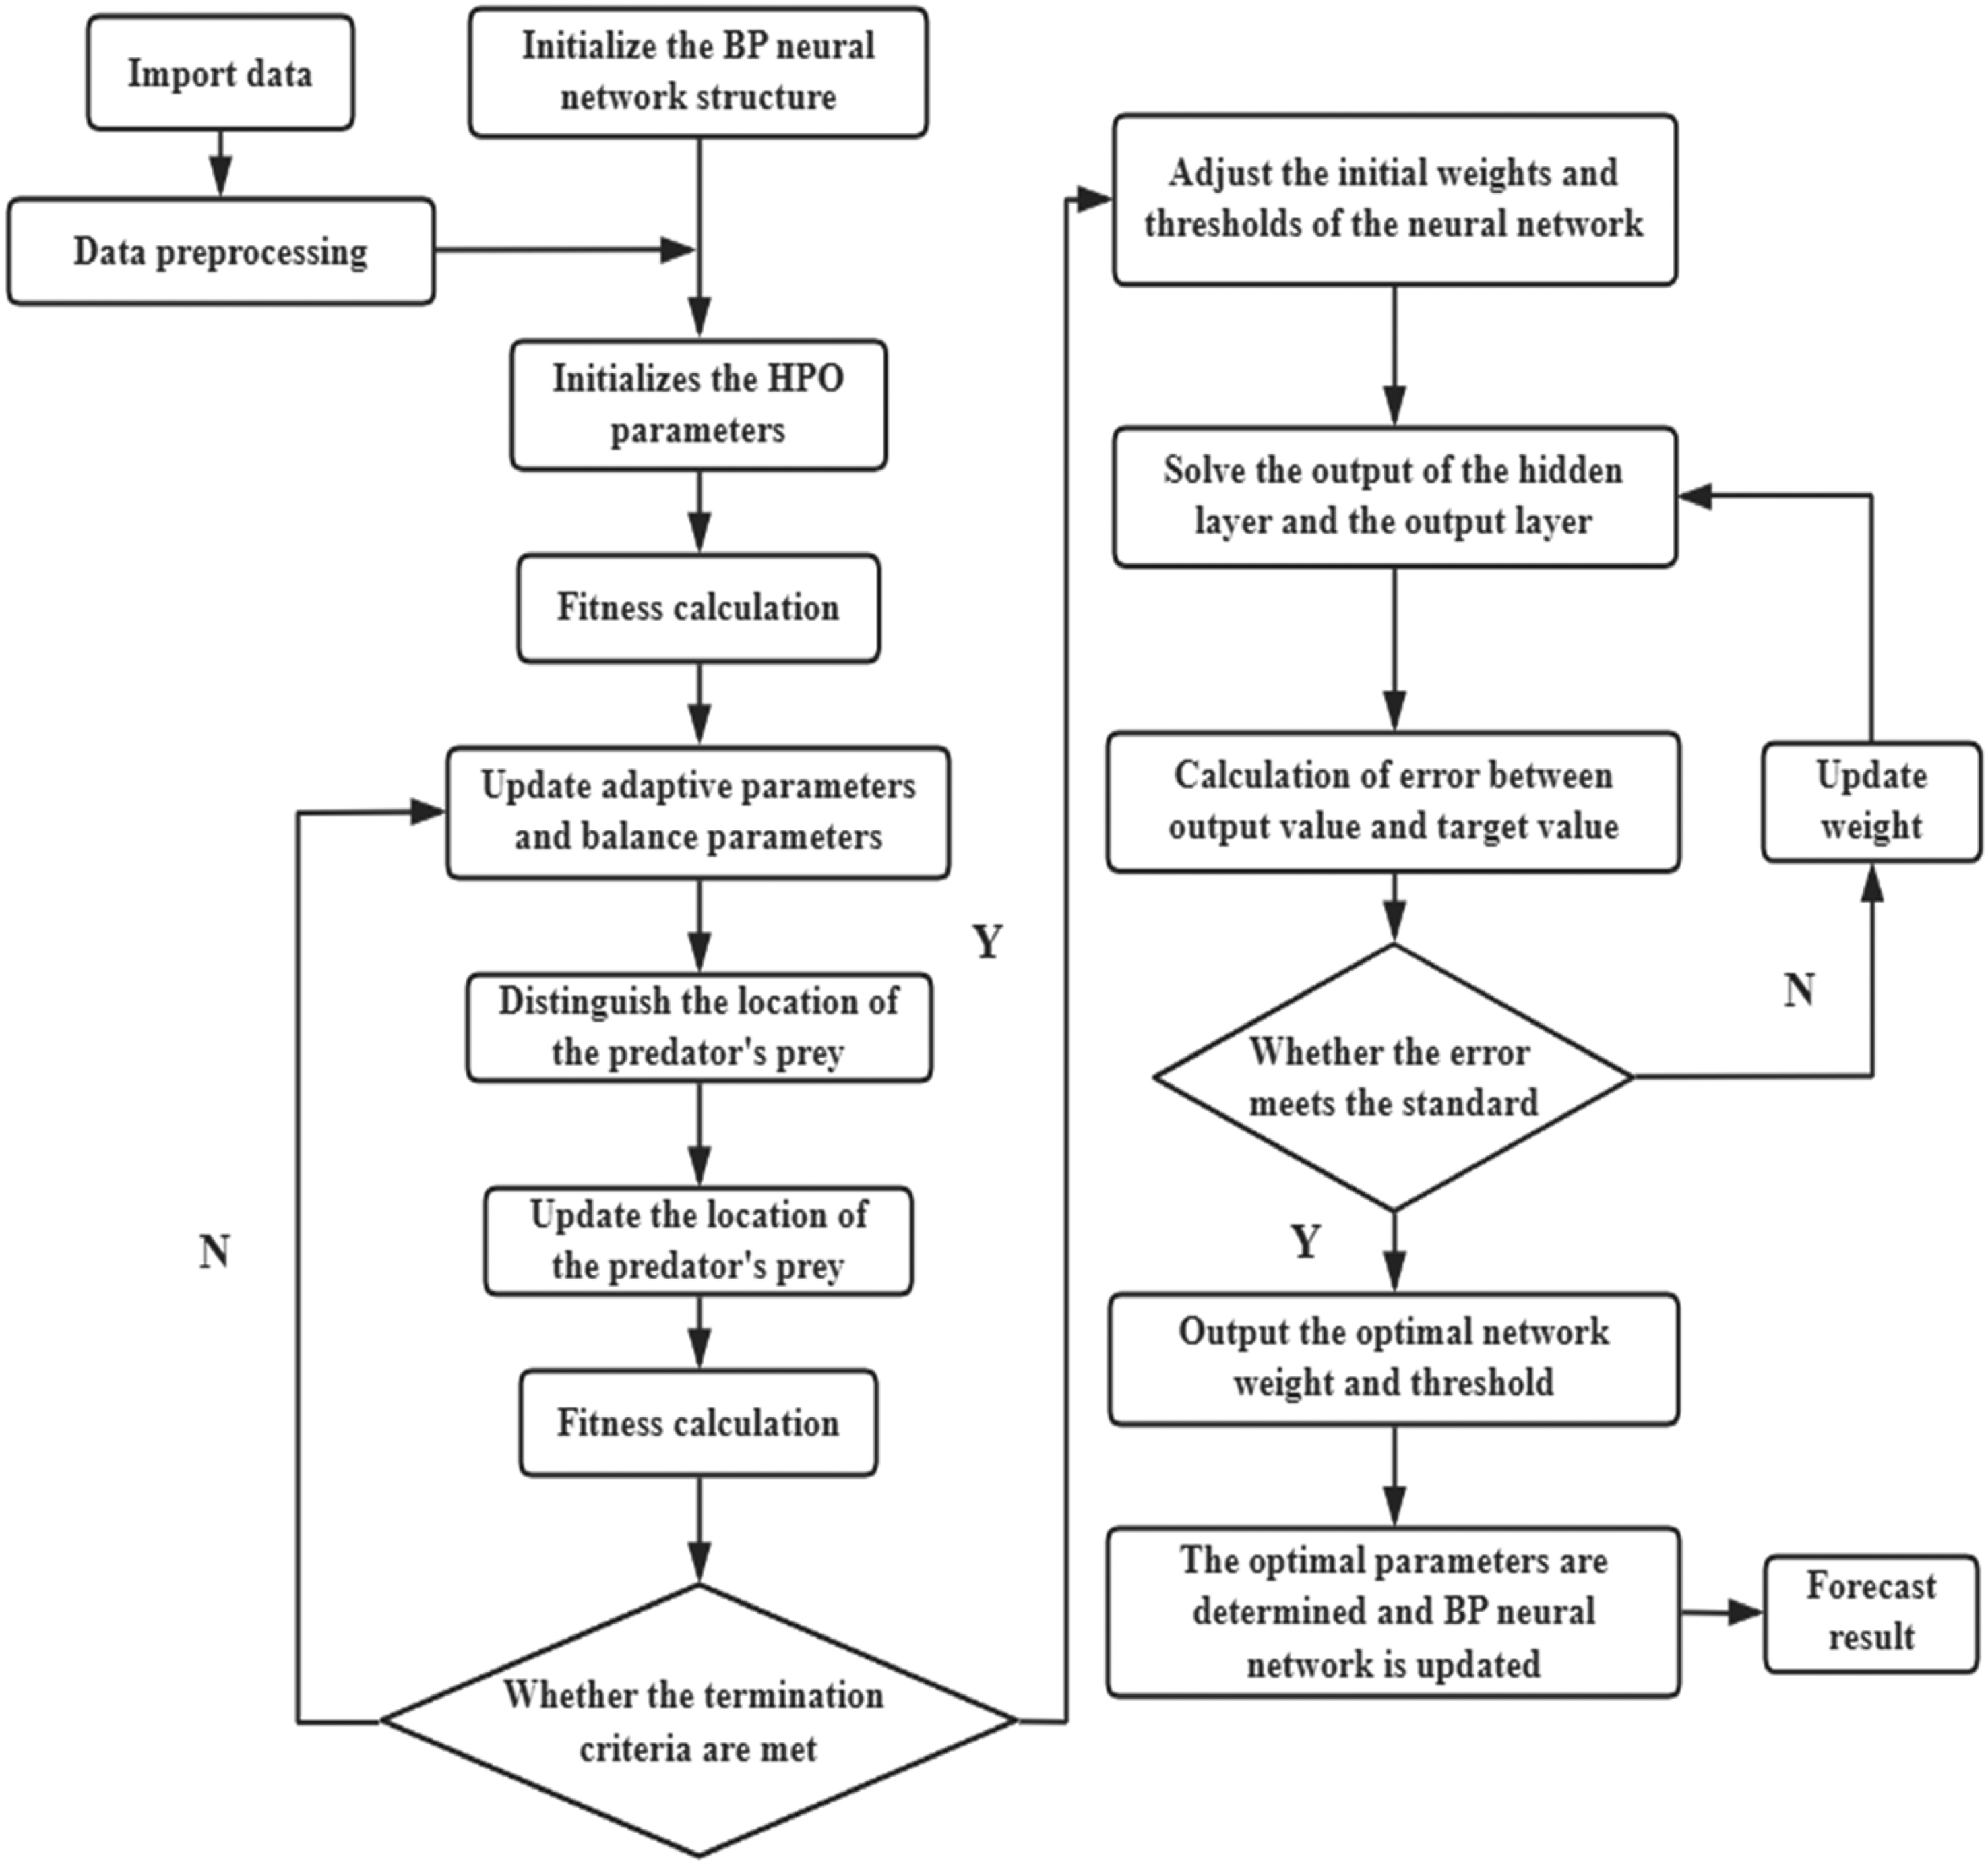
HPO-BP neural network structure diagram.
Modeling the relationship between drilling engineering parameters and rock mechanical parameters based on HPO-bp neural network
Modeling the relationship between drilling engineering parameters and rock l-mechanical parameters
Based on the HPO-BP neural network method, the relationship model between drilling engineering parameters and rock mechanical parameters was established for the rapid determination of rock mechanical parameters, and the schematic diagram of the model is shown in Figure 4. The drilling speed V, rotational speed N, drilling pressure F, and torque M are set as input parameters, and the uniaxial compressive strength σc, cohesive force c, and internal friction angle φ are set as output parameters.
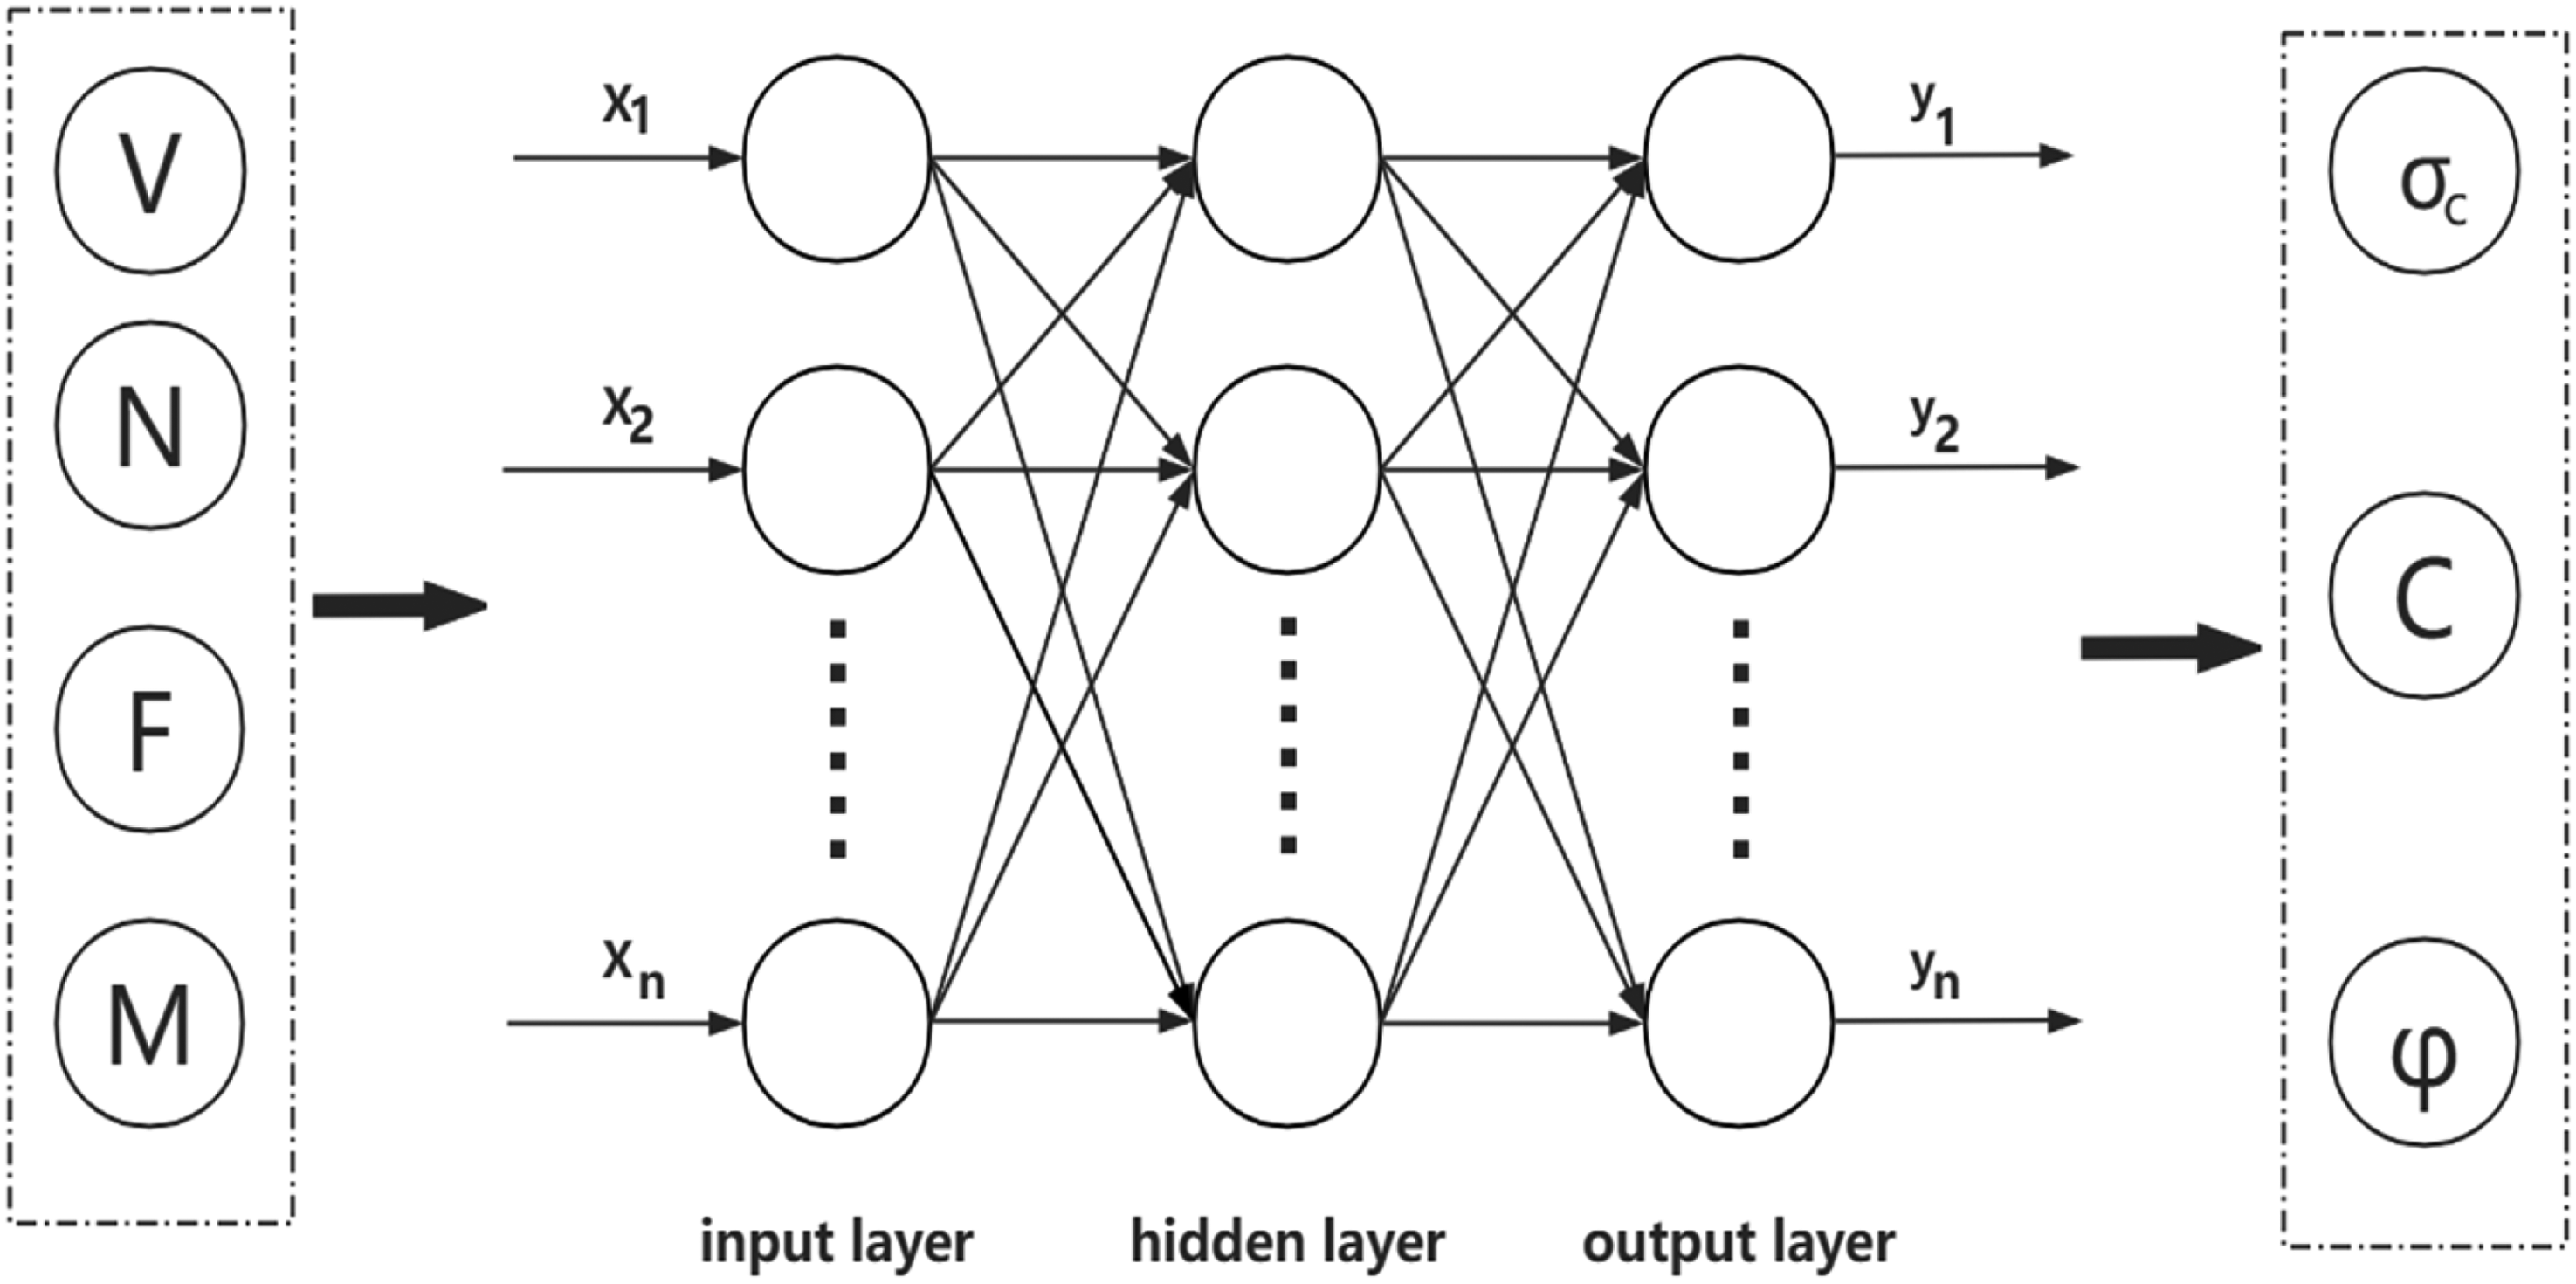
Model plot of drilling engineering parameters versus rock c-φ parameters.
Based on the optimization of BP neural network by hunter-prey optimizer (HPO), the final settings of each parameter are: the population size is 50; the maximum number of iterations is 100; the activation function is ReLU; the number of hidden layers is 2, the number of neurons in the first layer is 32, and the number of neurons in the second layer is 50.
Based on the indoor rock drilling test and triaxial compression test to get 32 sets of test data in Table 2, 26 sets of test data will be used as the training set of the model for model training, to establish the relationship model between drilling engineering parameters and rock mechanical parameters, and the remaining 6 sets of test data will be used as the validation set of the relationship model between the drilling engineering parameters and the rock mechanical parameters for the validity of the model.
Absolute coefficient R2 and discrepancy rate γ are introduced to evaluate the relationship model between drilling engineering parameters and rock mechanical parameters established based on HPO-BP neural network optimization algorithm. R2 measures the proportion of changes in the dependent variable that can be explained by the model, reflecting the fitting effect of the model on the actual values. the closer the value of R2 is to 1, the better the predictive effect of the model is, and the closer it is to 0, the worse the predictive effect of the model is. The difference rate γ indicates the degree of deviation between the predicted value and the experimental value, and the smaller the value is, the smaller the gap between the predicted value and the experimental value calculated by the model is. R2 and γ are calculated as follows:

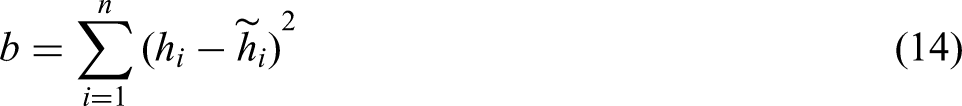
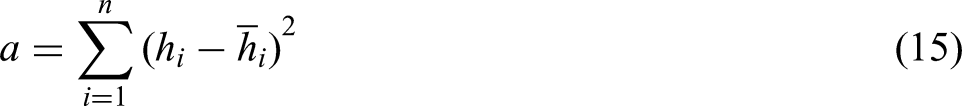
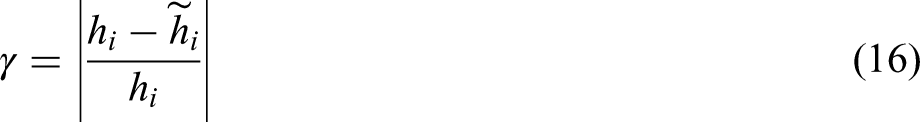
Where: hi is the test value of the ith specimen;
In the training set, the uniaxial compressive strength UCS, cohesive force c and internal friction angle φ predicted by the modeling of the relationship between the drilling engineering parameters and the rock mechanical parameters are plotted against the uniaxial compressive strength UCS, cohesive force c and internal friction angle φ obtained from the tests, as shown in Figures 5 to 7. The values of the rock mechanical parameters predicted by the model are close to those obtained from the tests.
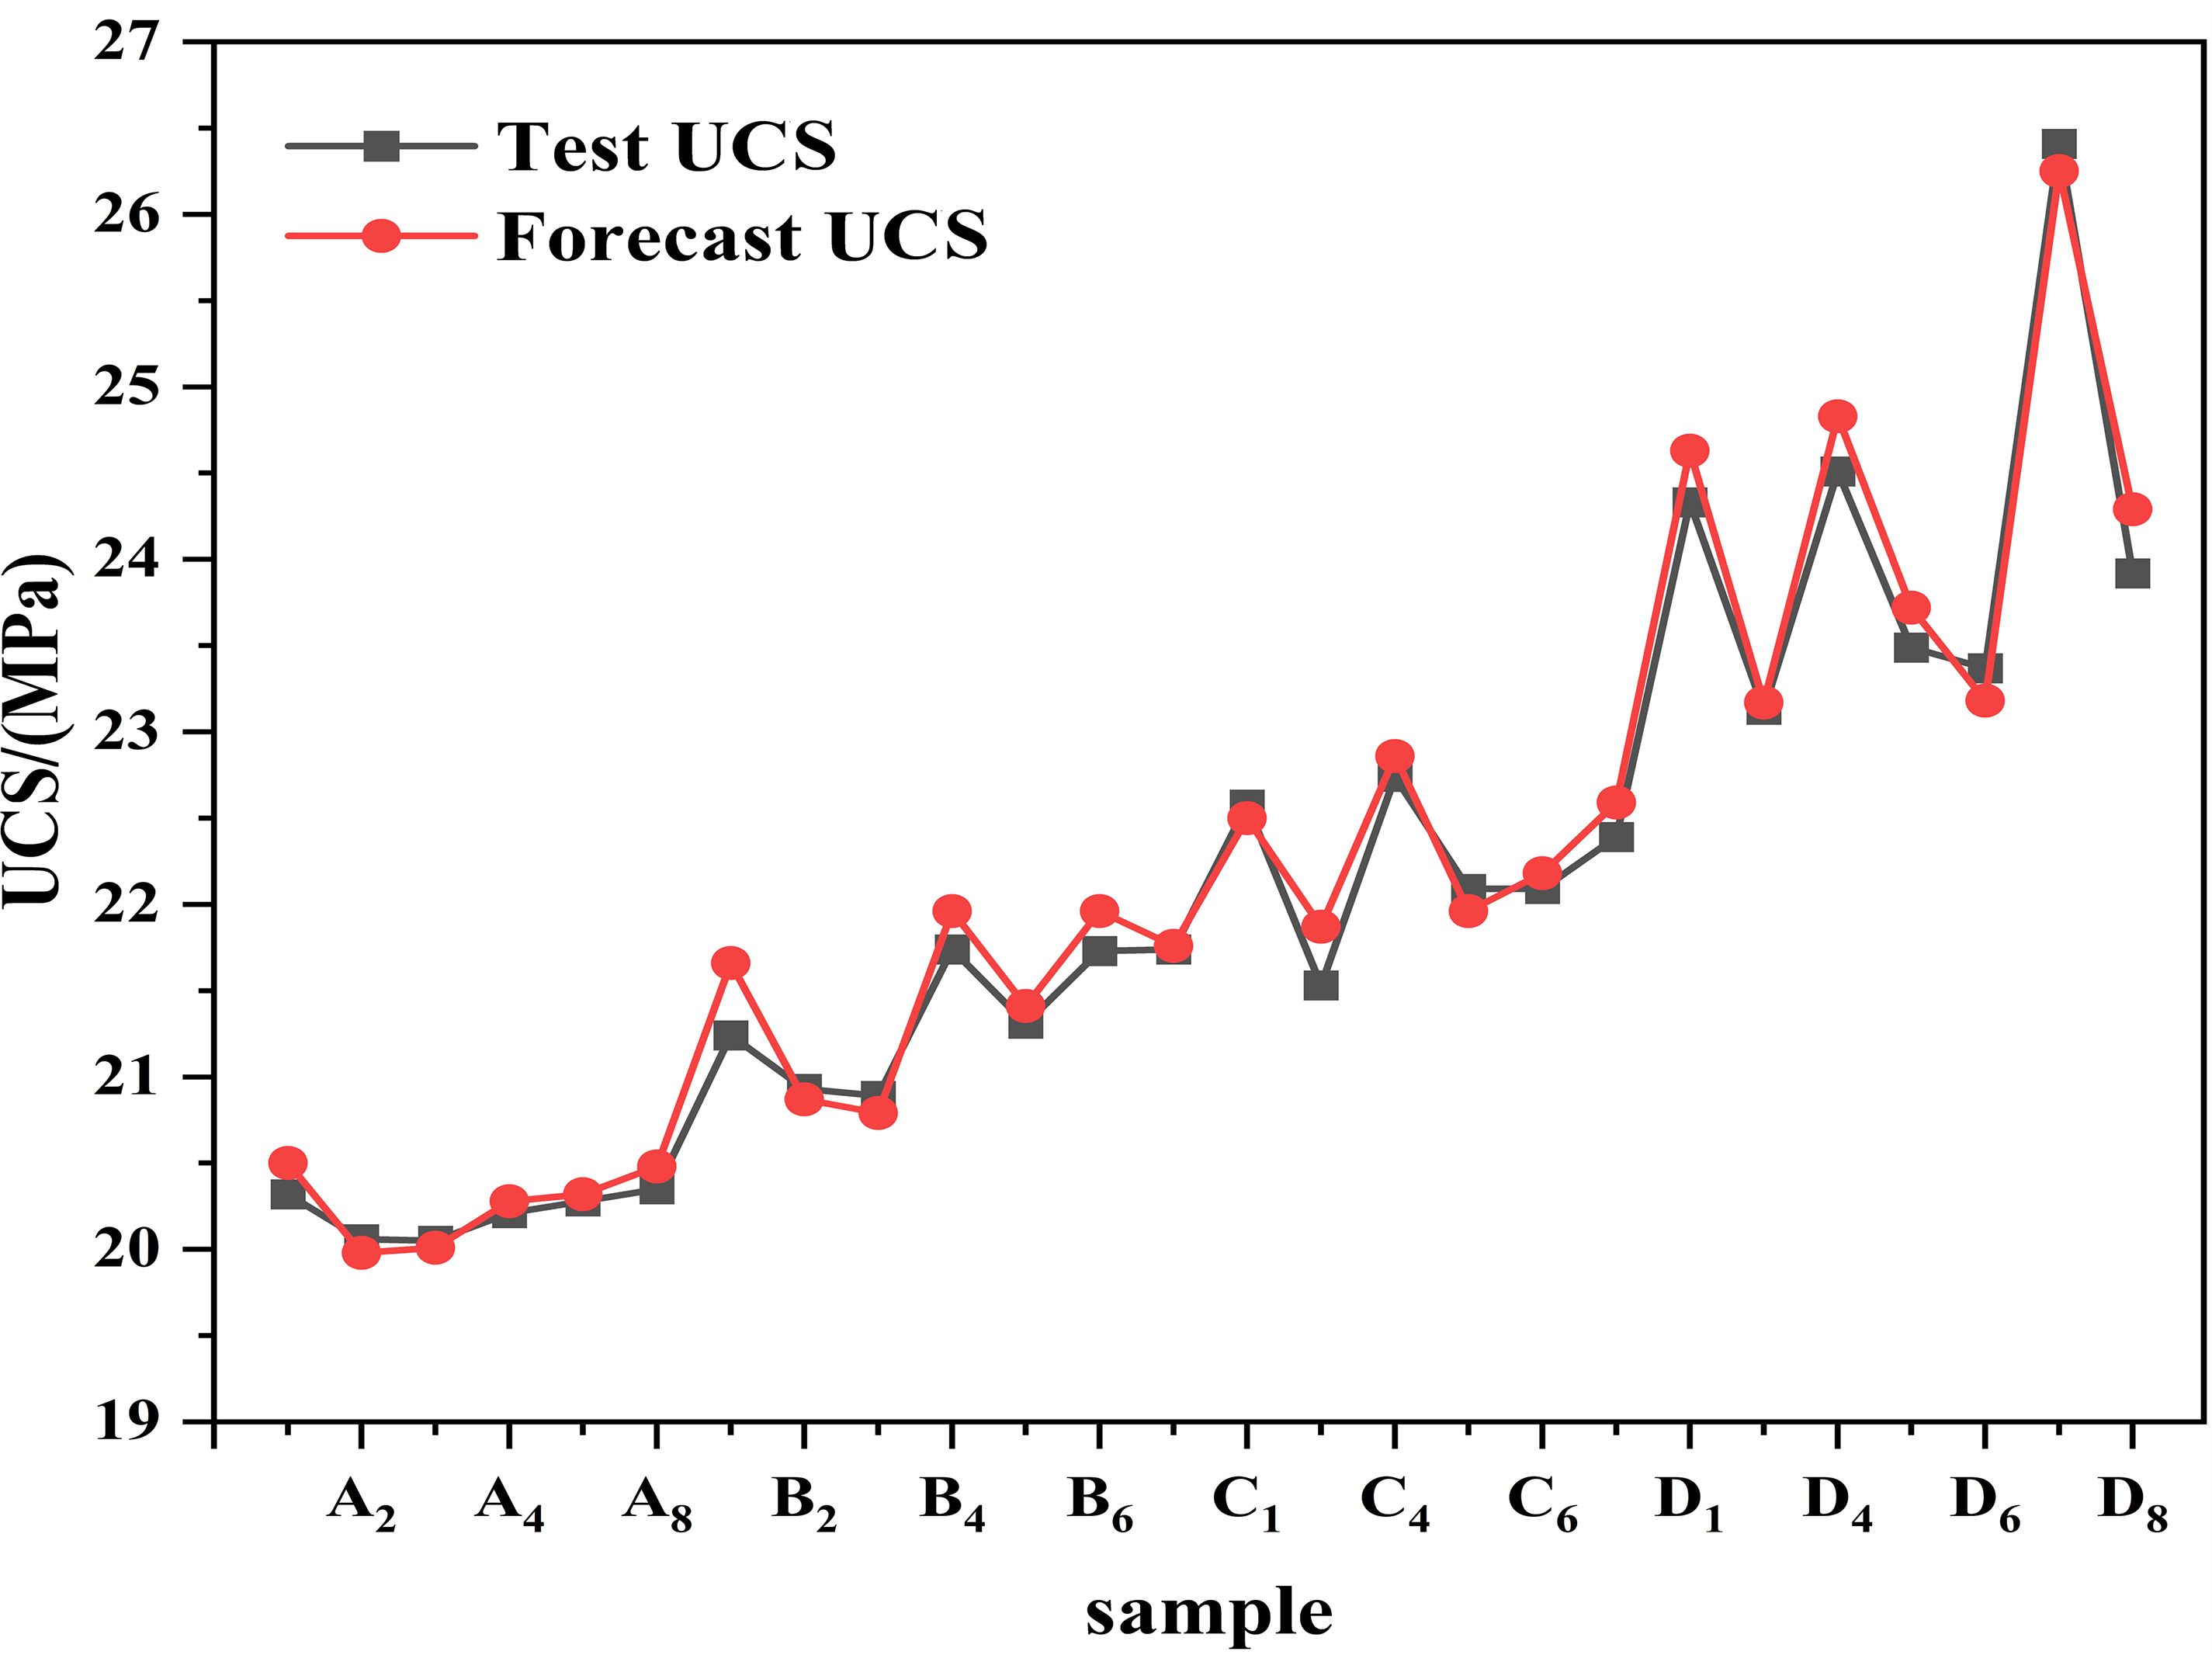
Plot of predicted vs. tested uniaxial compressive strength UCS (training set).
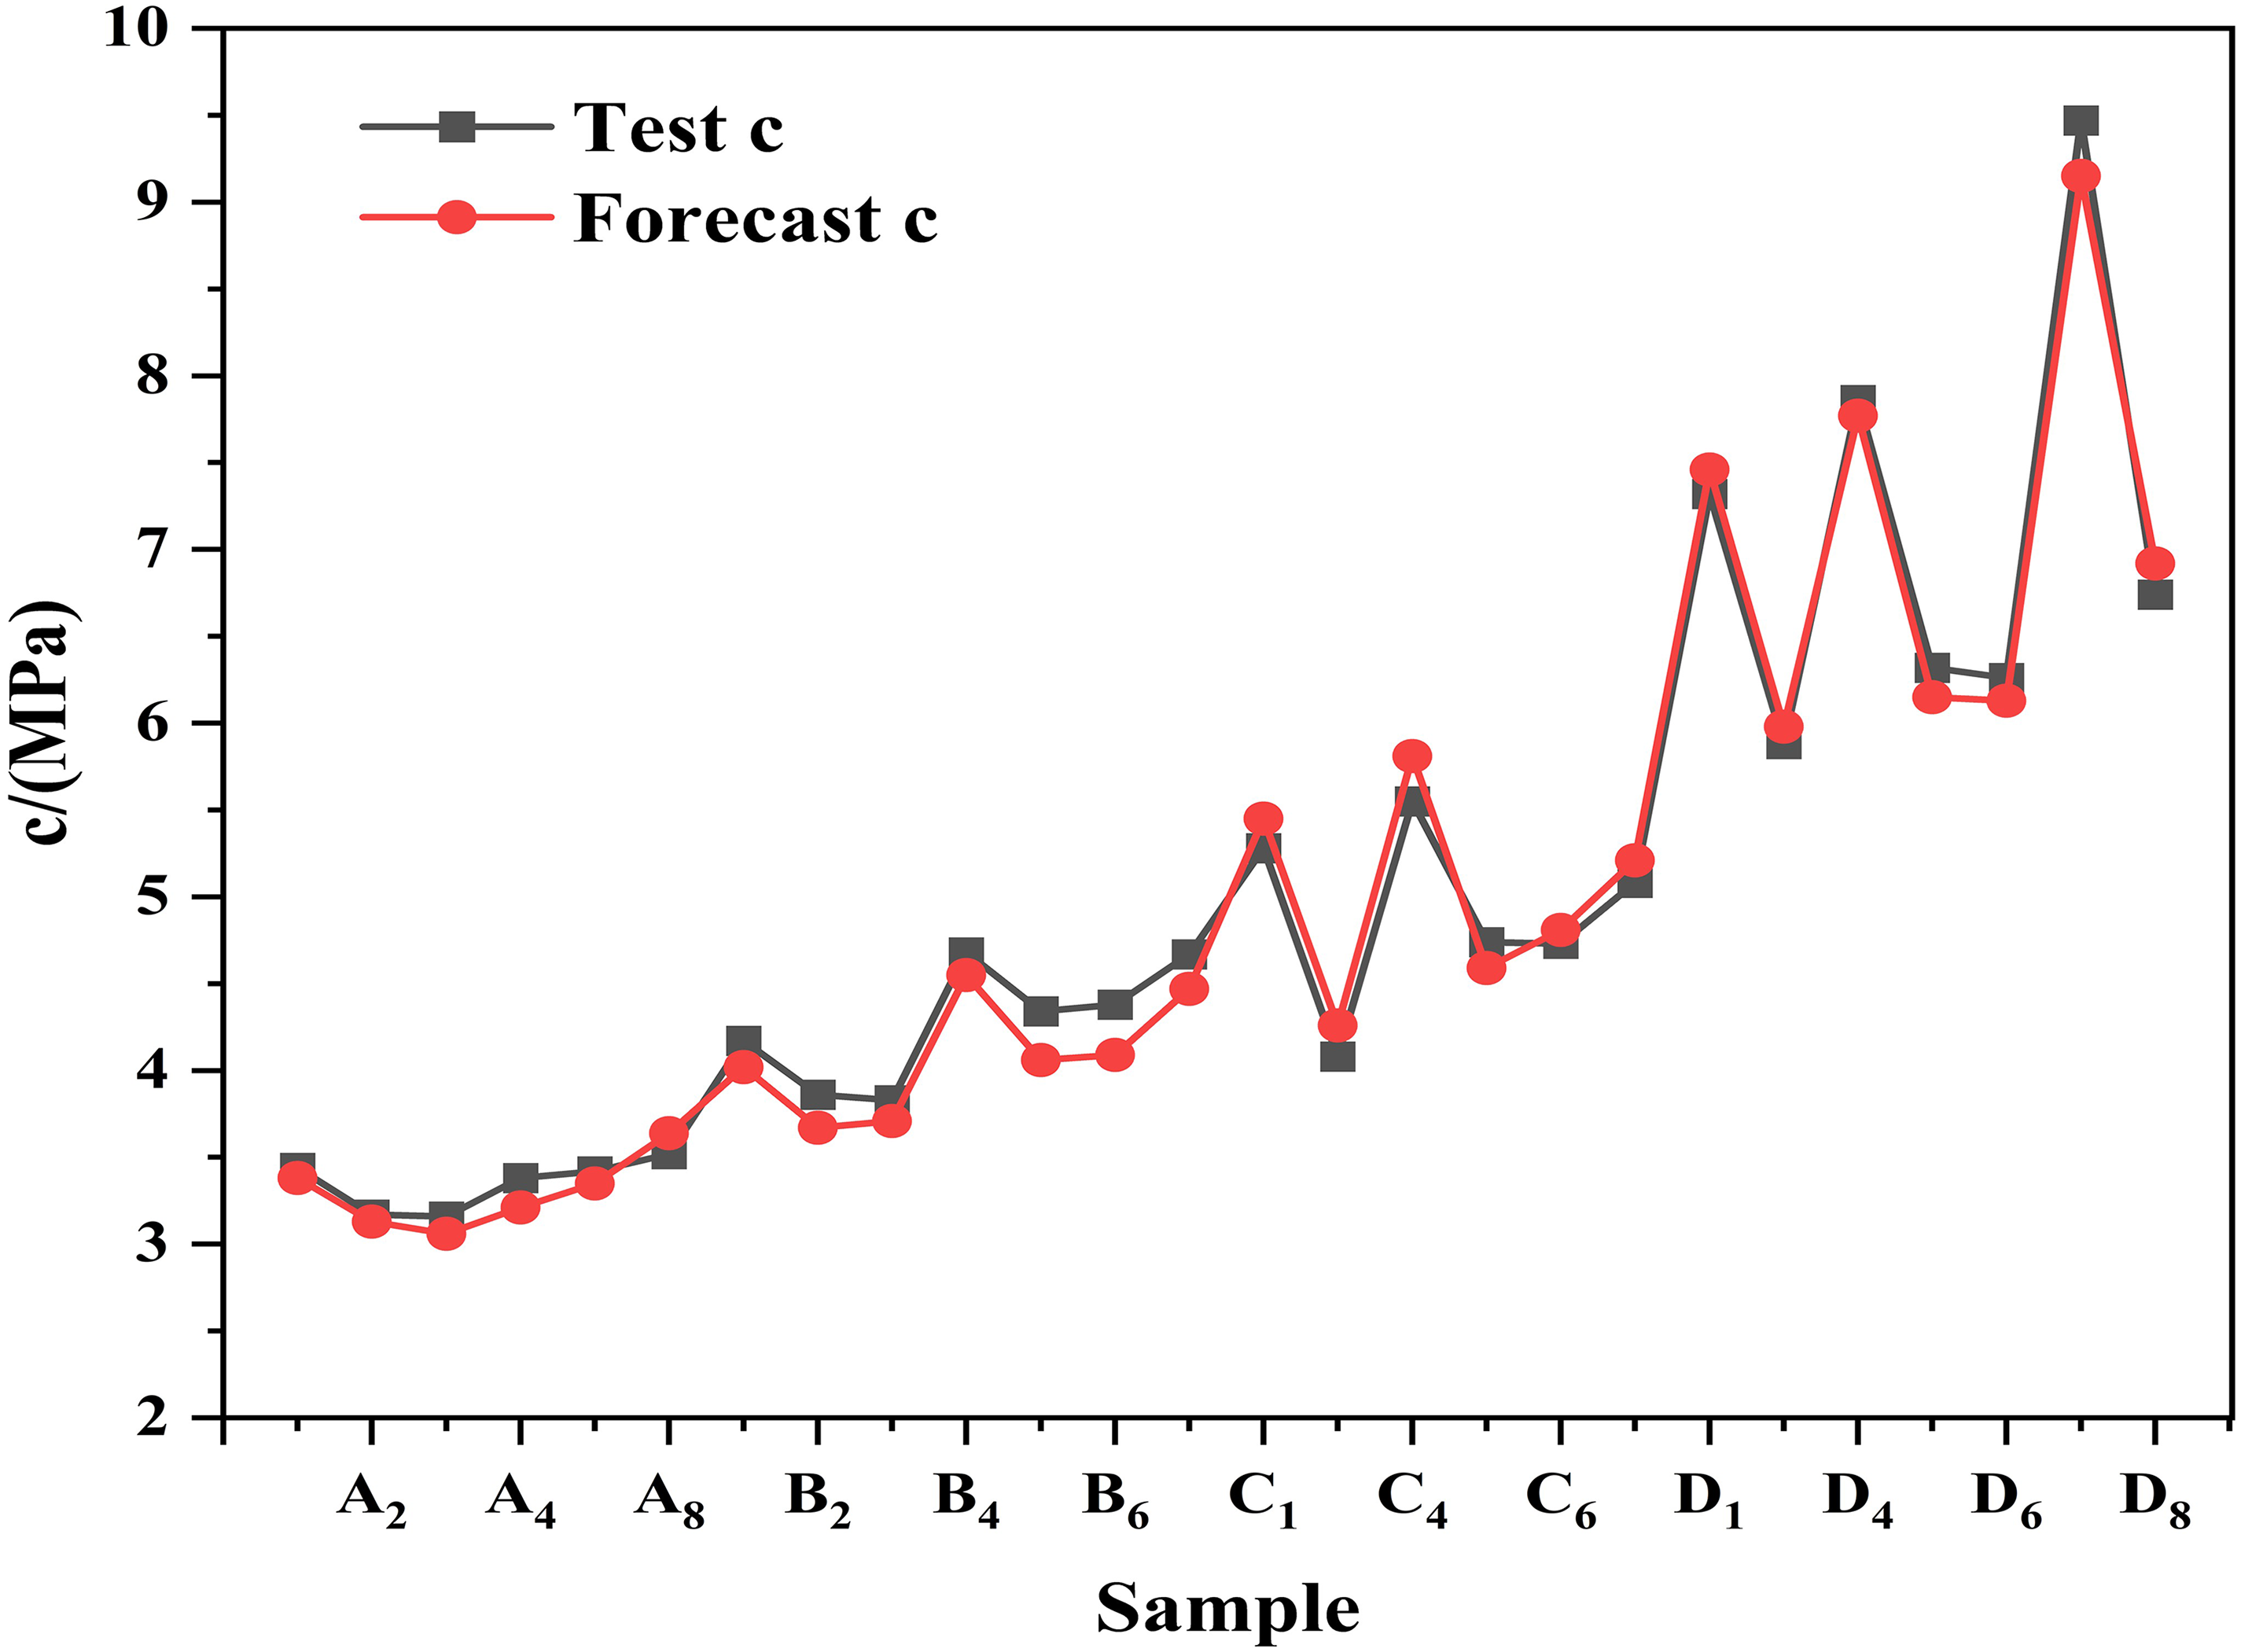
Plot of predicted vs. experimental values of cohesion c (training set).
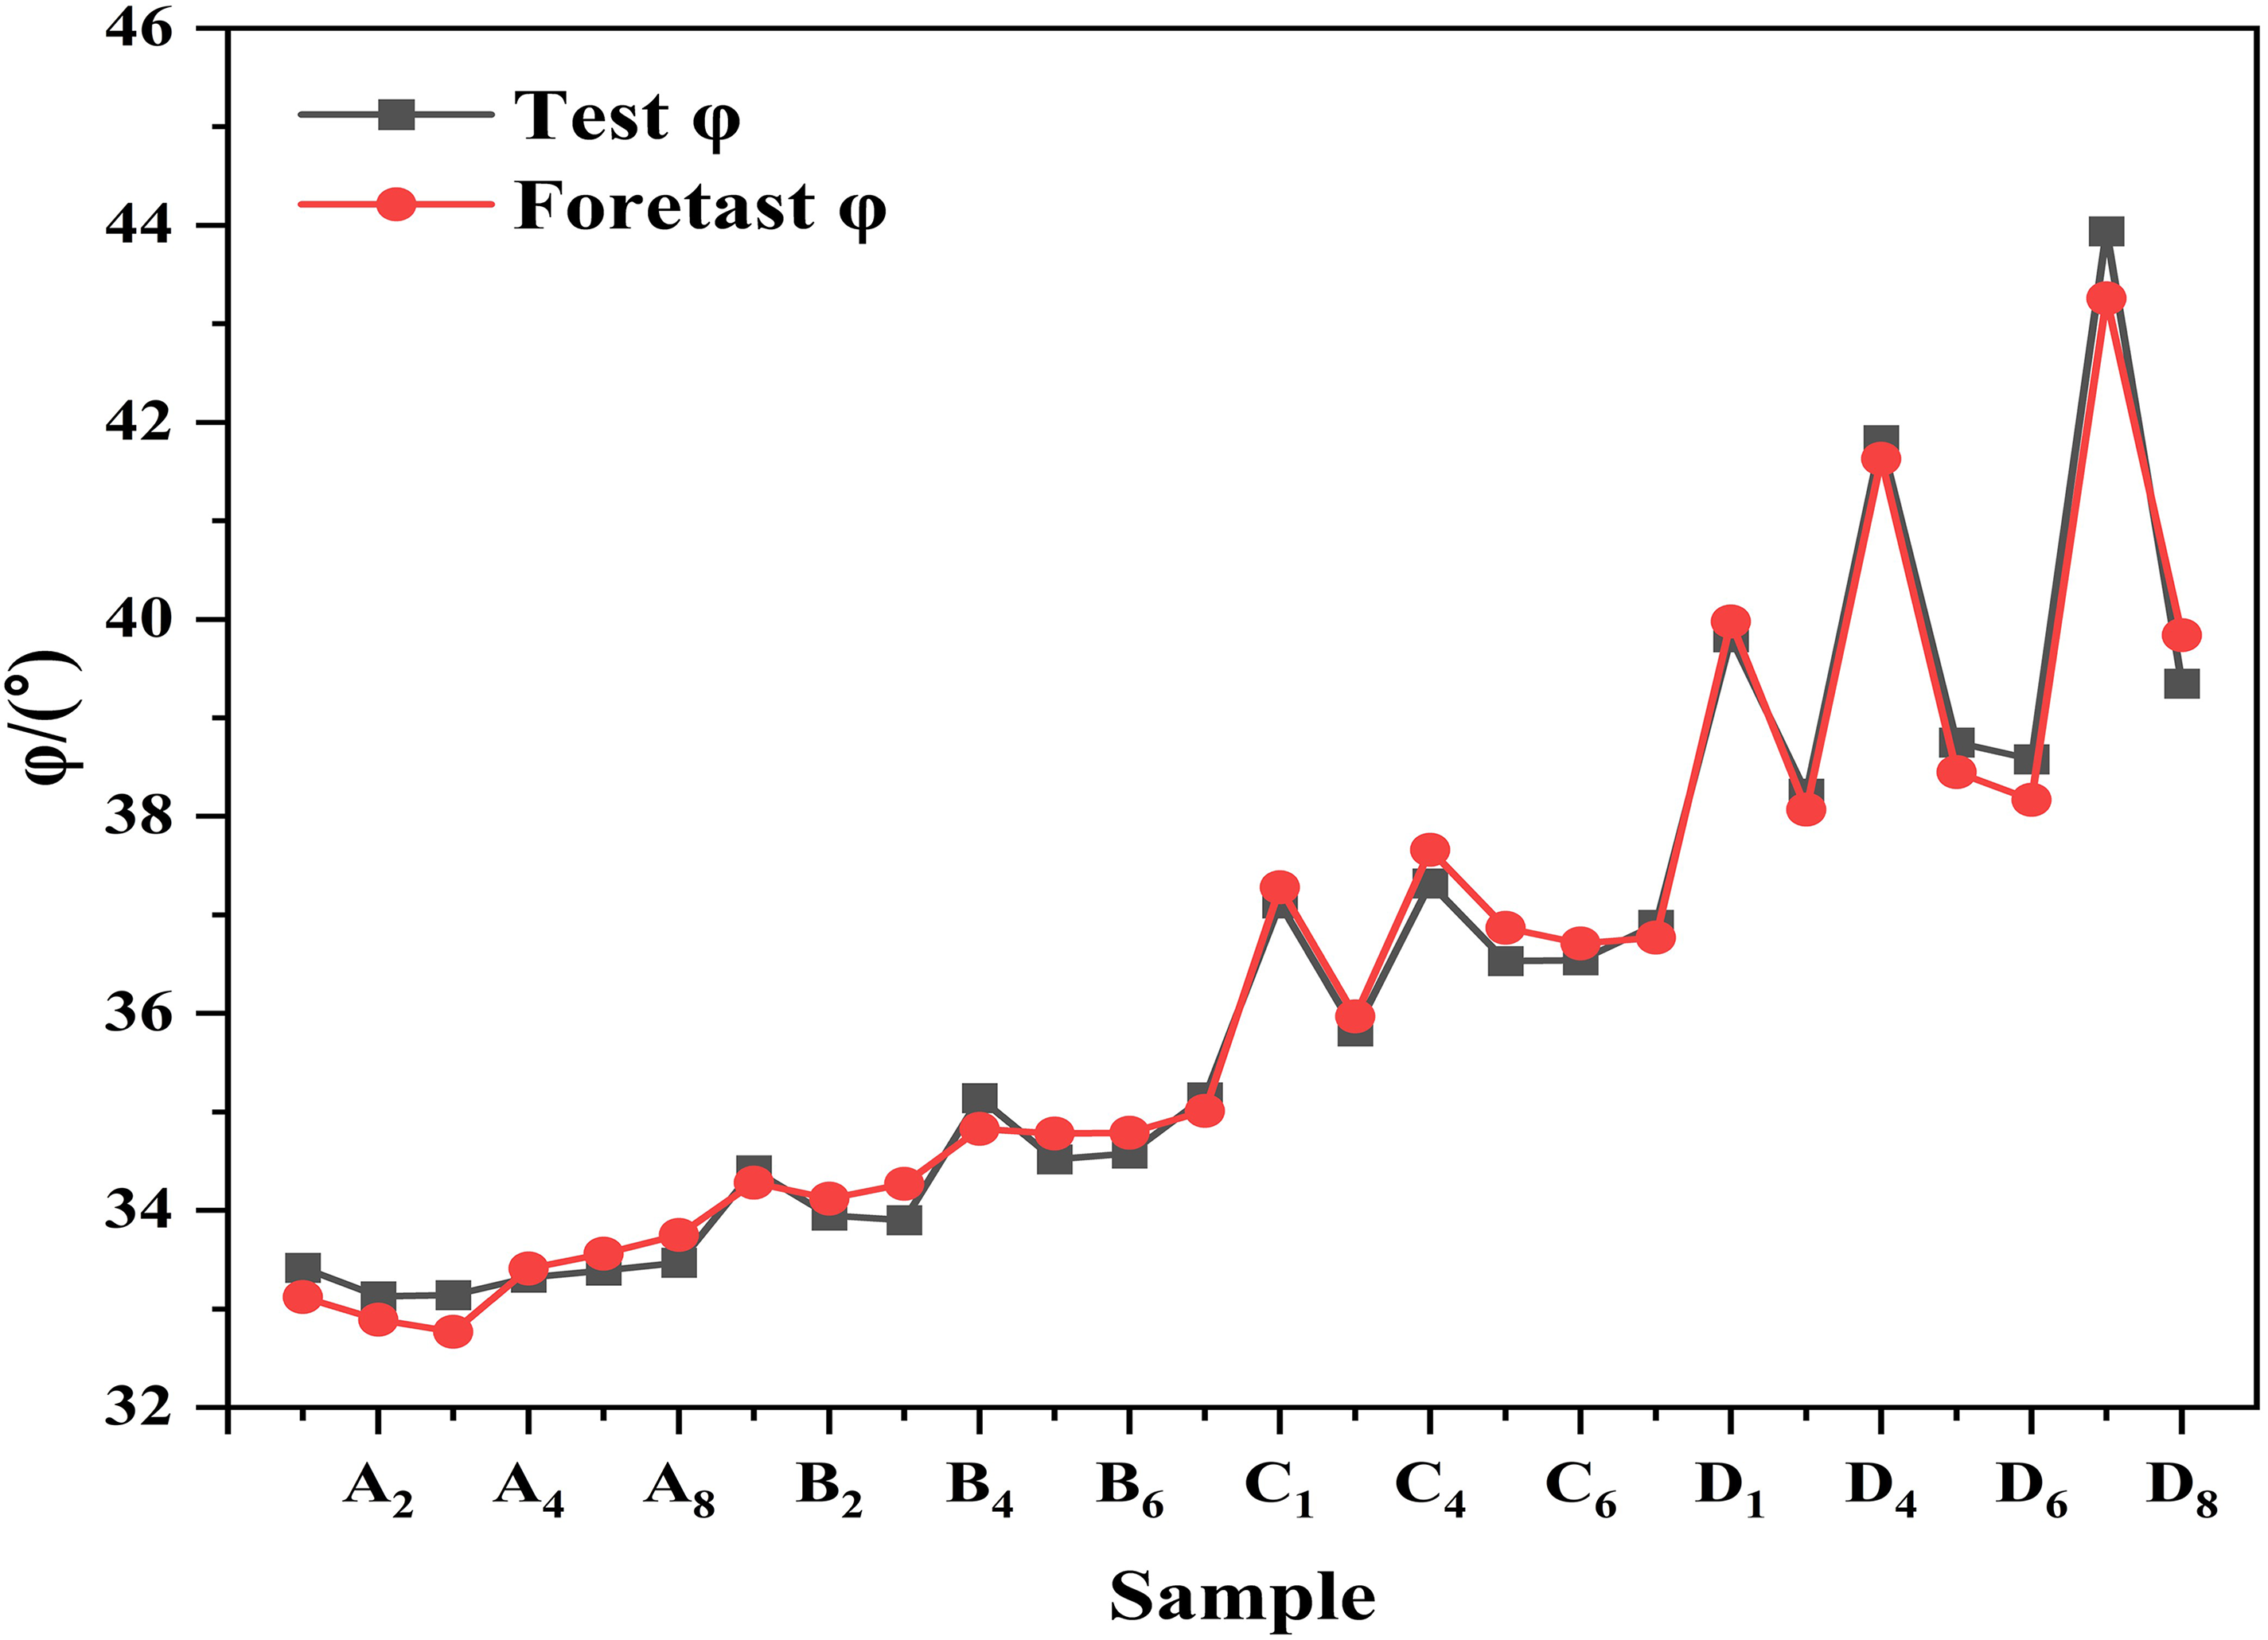
Plot of predicted vs. experimental values of internal friction angle φ (training set).
The performance of the model evaluation metric R2 is shown schematically in Figures 8 to 10. The R2 of the uniaxial compressive strength UCS, viscous cohesion c and the angle of internal friction φ are 0.9887, 0.9893 and 0.9897 respectively, which indicate that they are more correlate.
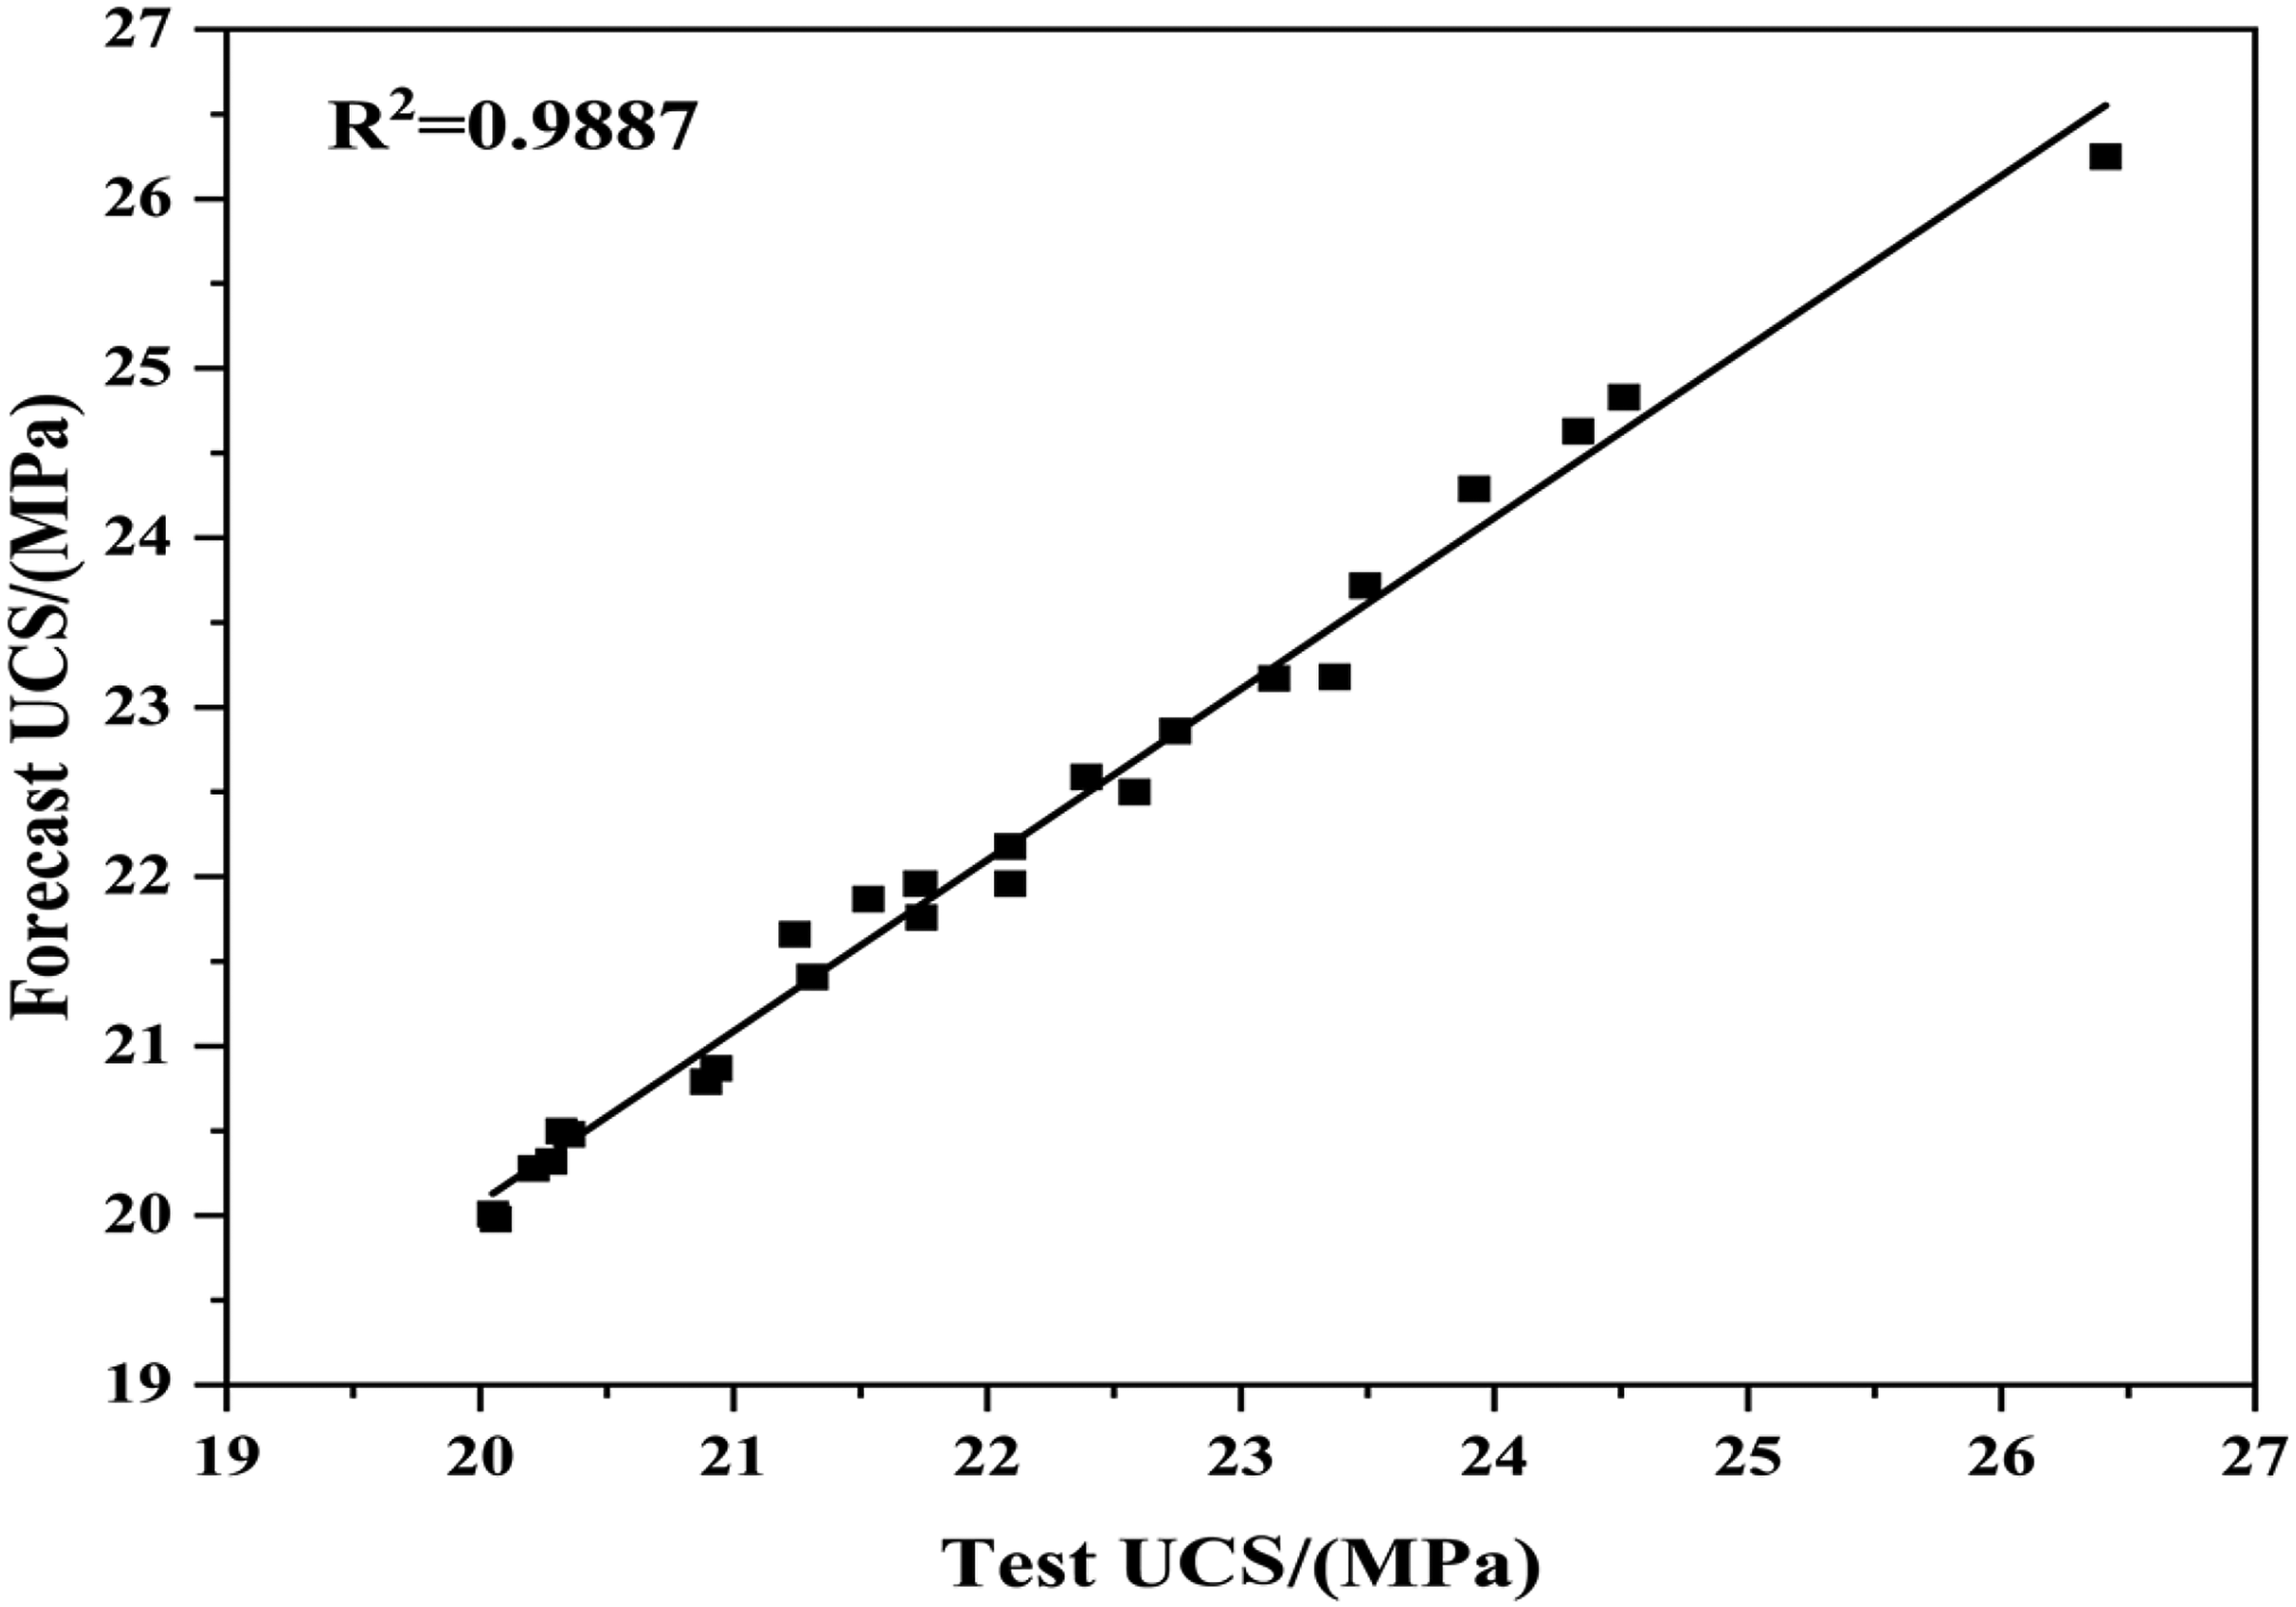
Uniaxial compressive strength UCS coefficient of determination R2 (training set).
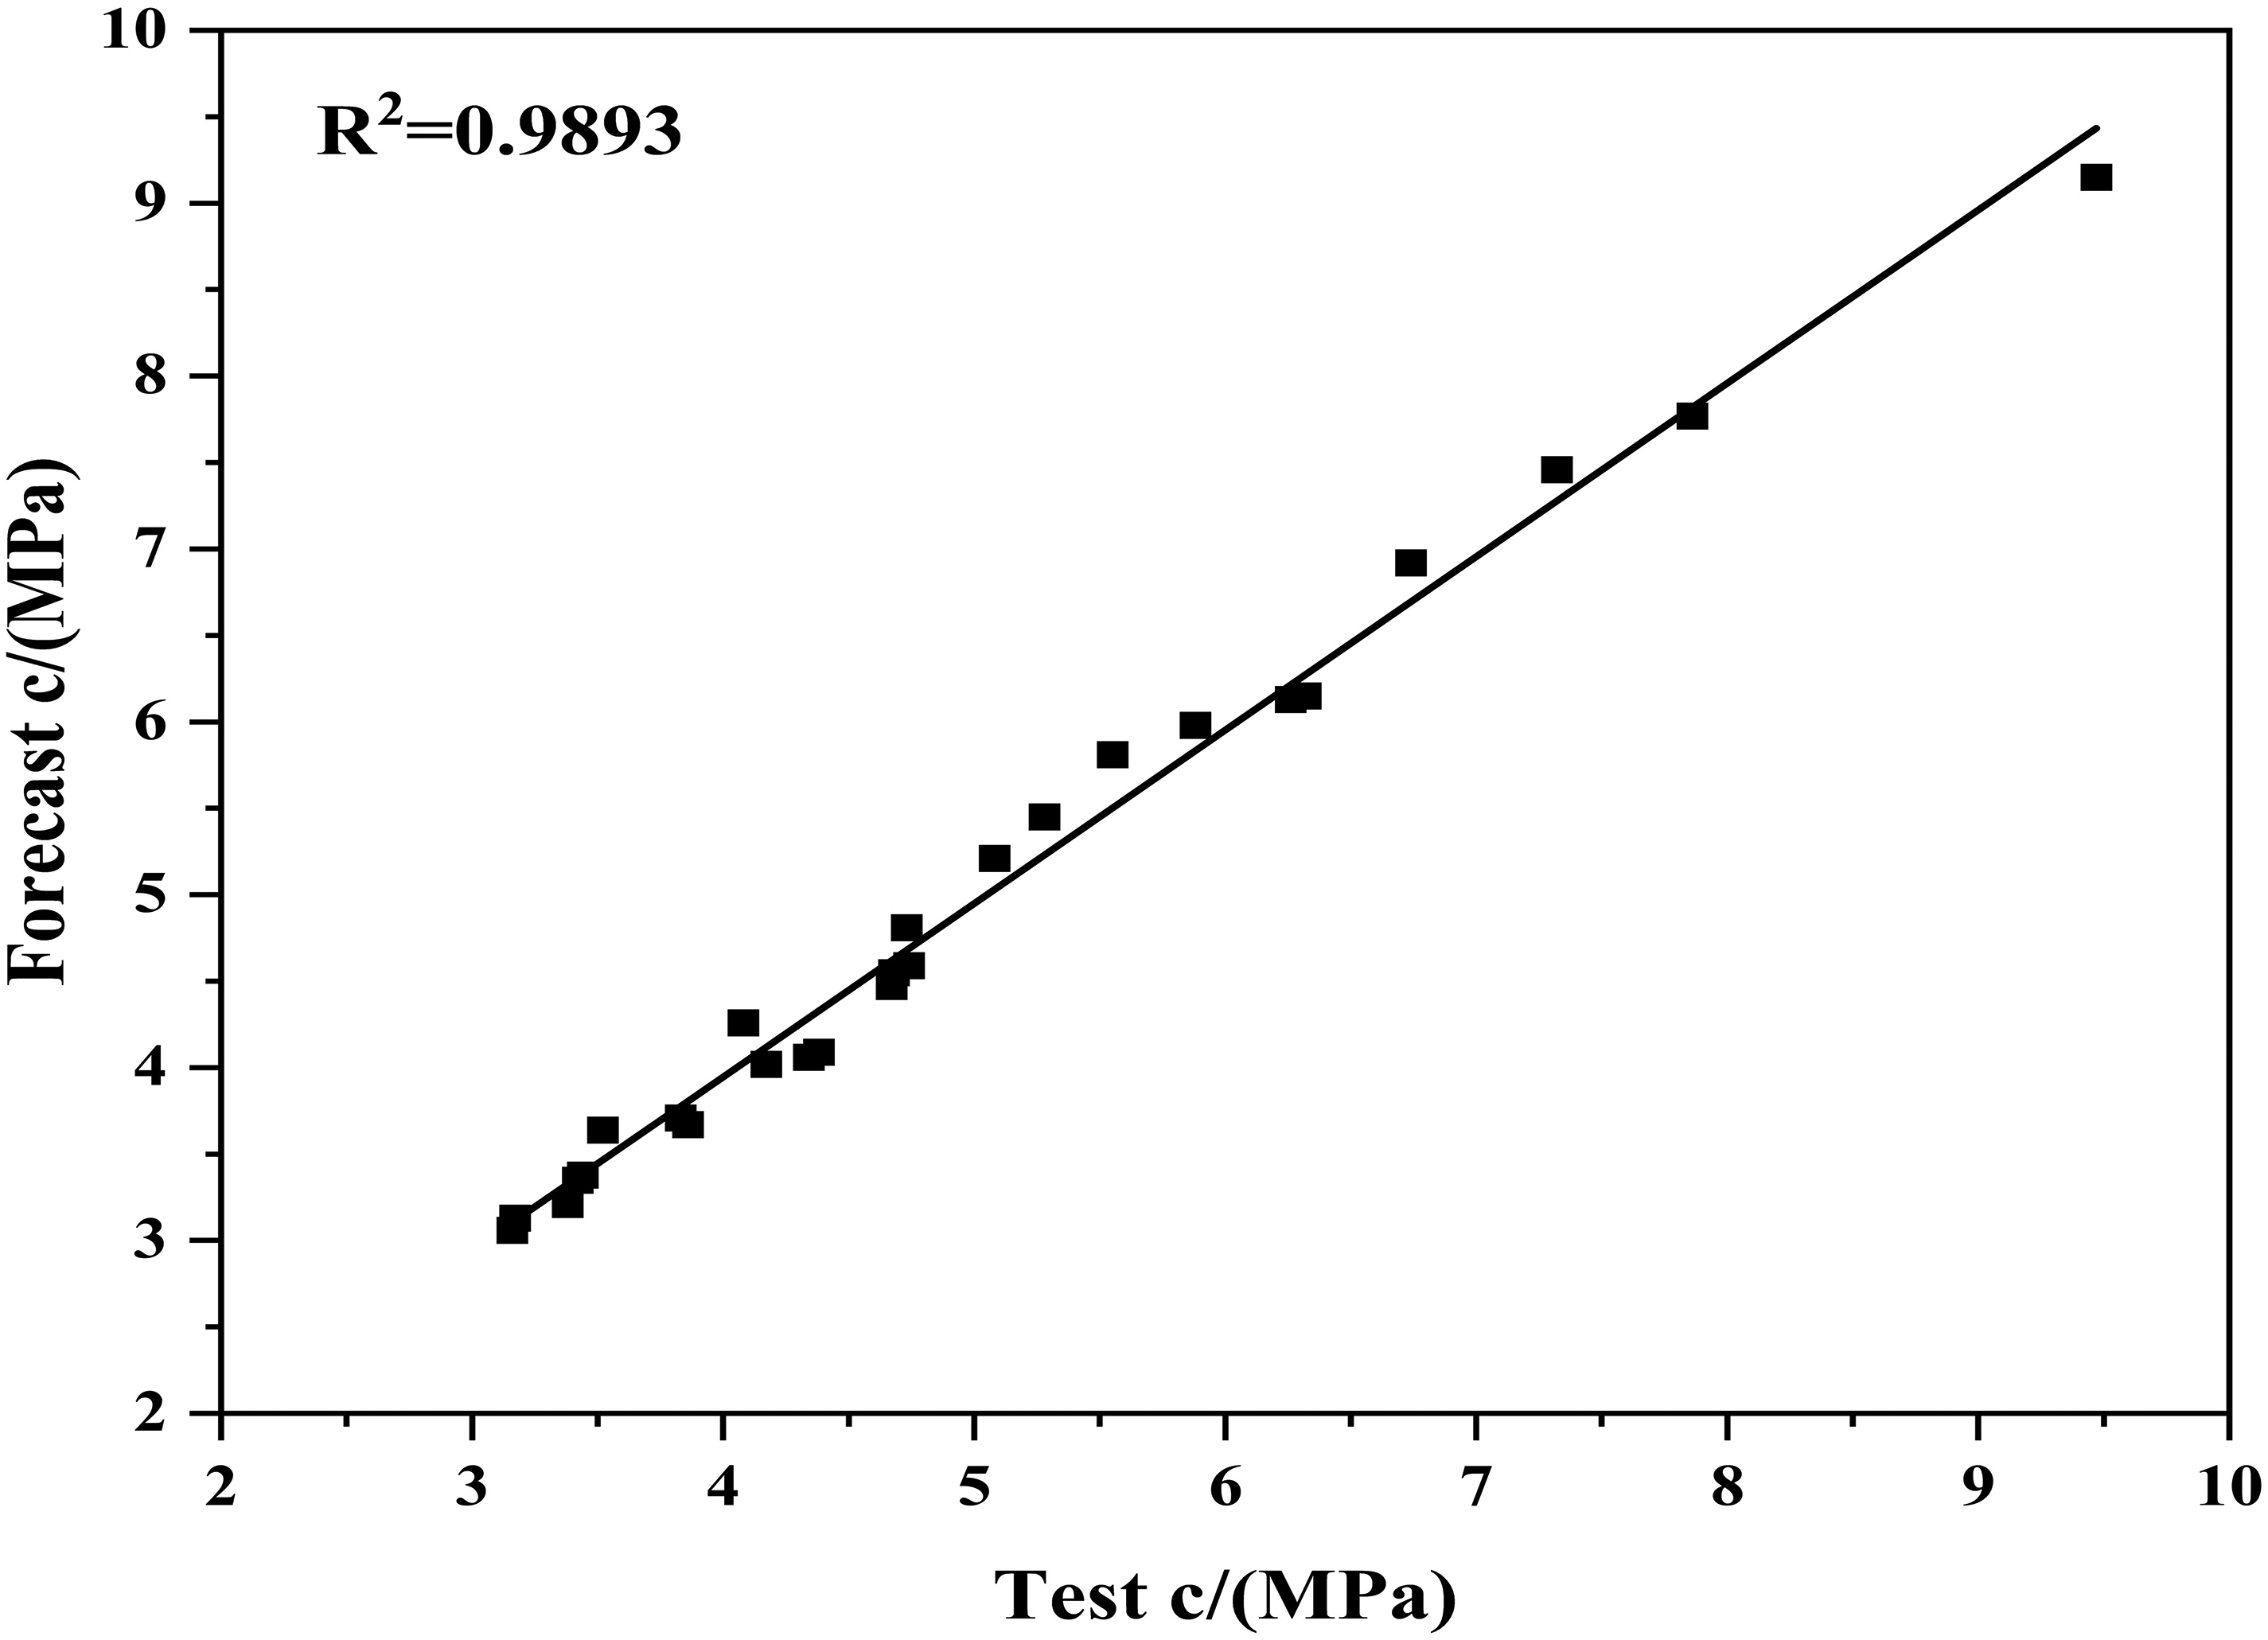
Cohesion c coefficient of determination R2 (training set).
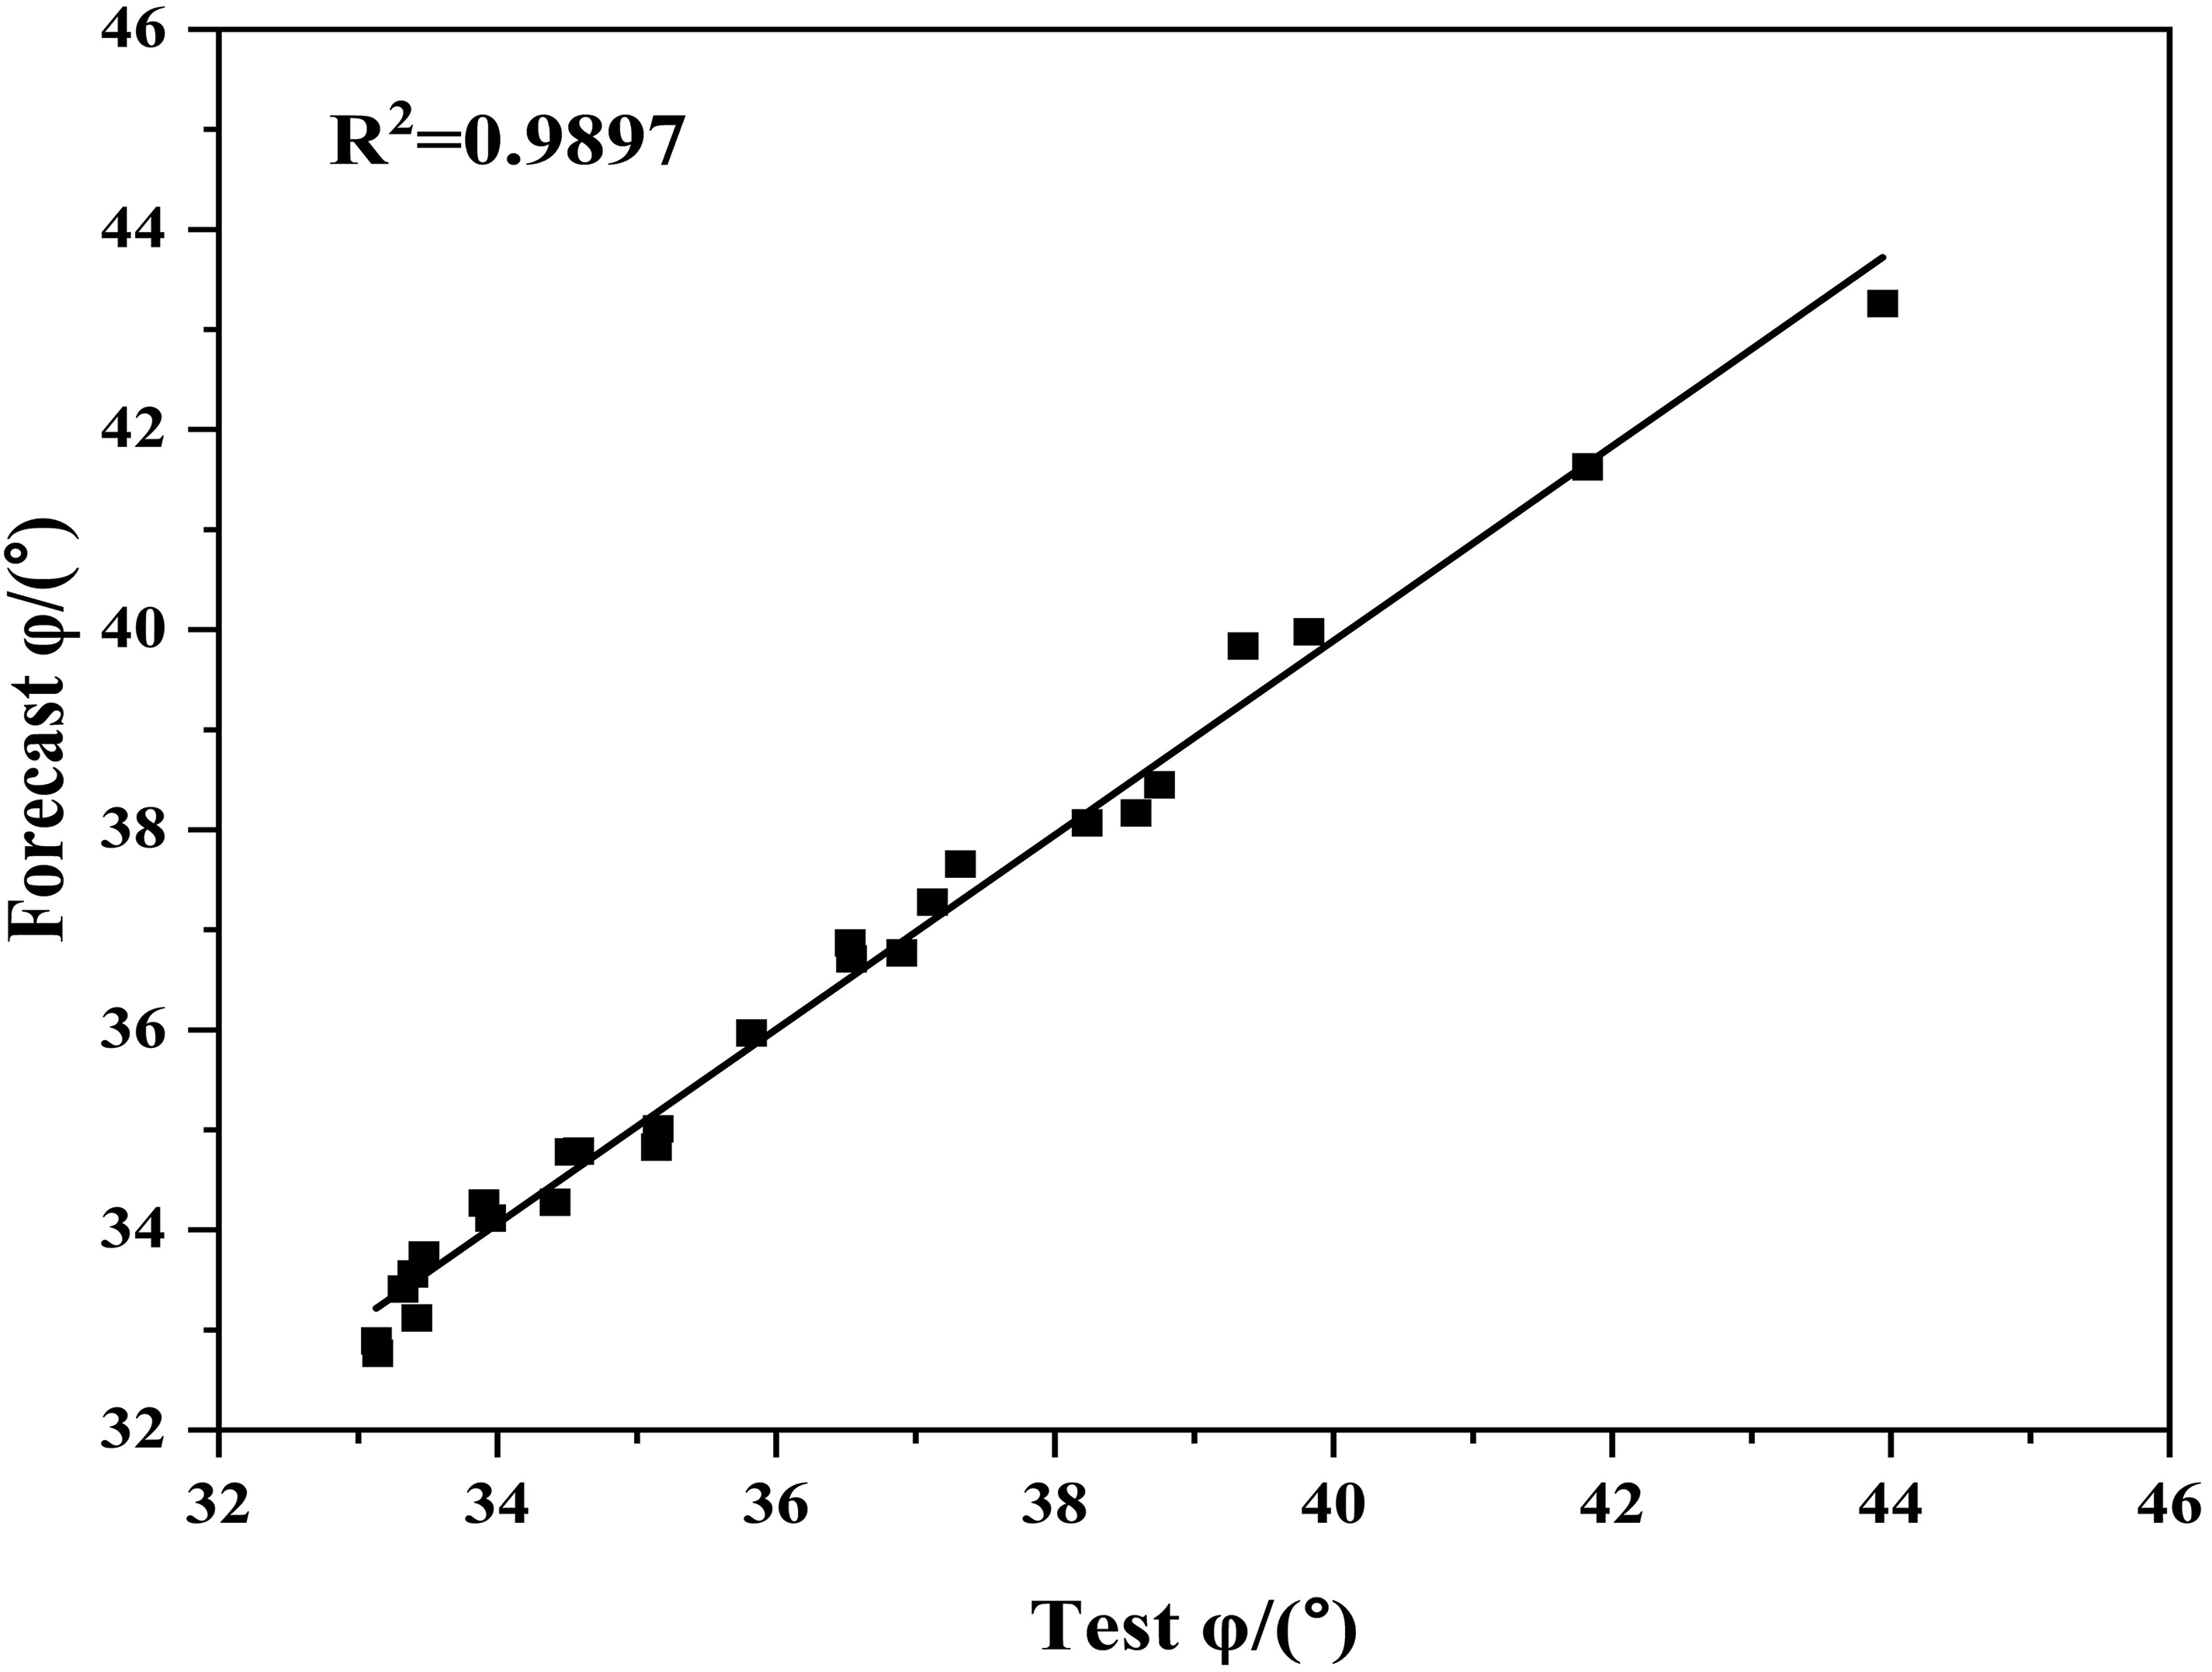
Coefficient of determination R2 for angle of internal friction φ (training set).
As shown in Figures 11 to 13, the mean values of the difference rates of uniaxial compressive strength UCS, cohesive force c and internal friction angle φ are 0.73%, 3.22% and 0.71%, respectively, which indicate that the model prediction accuracy is good.
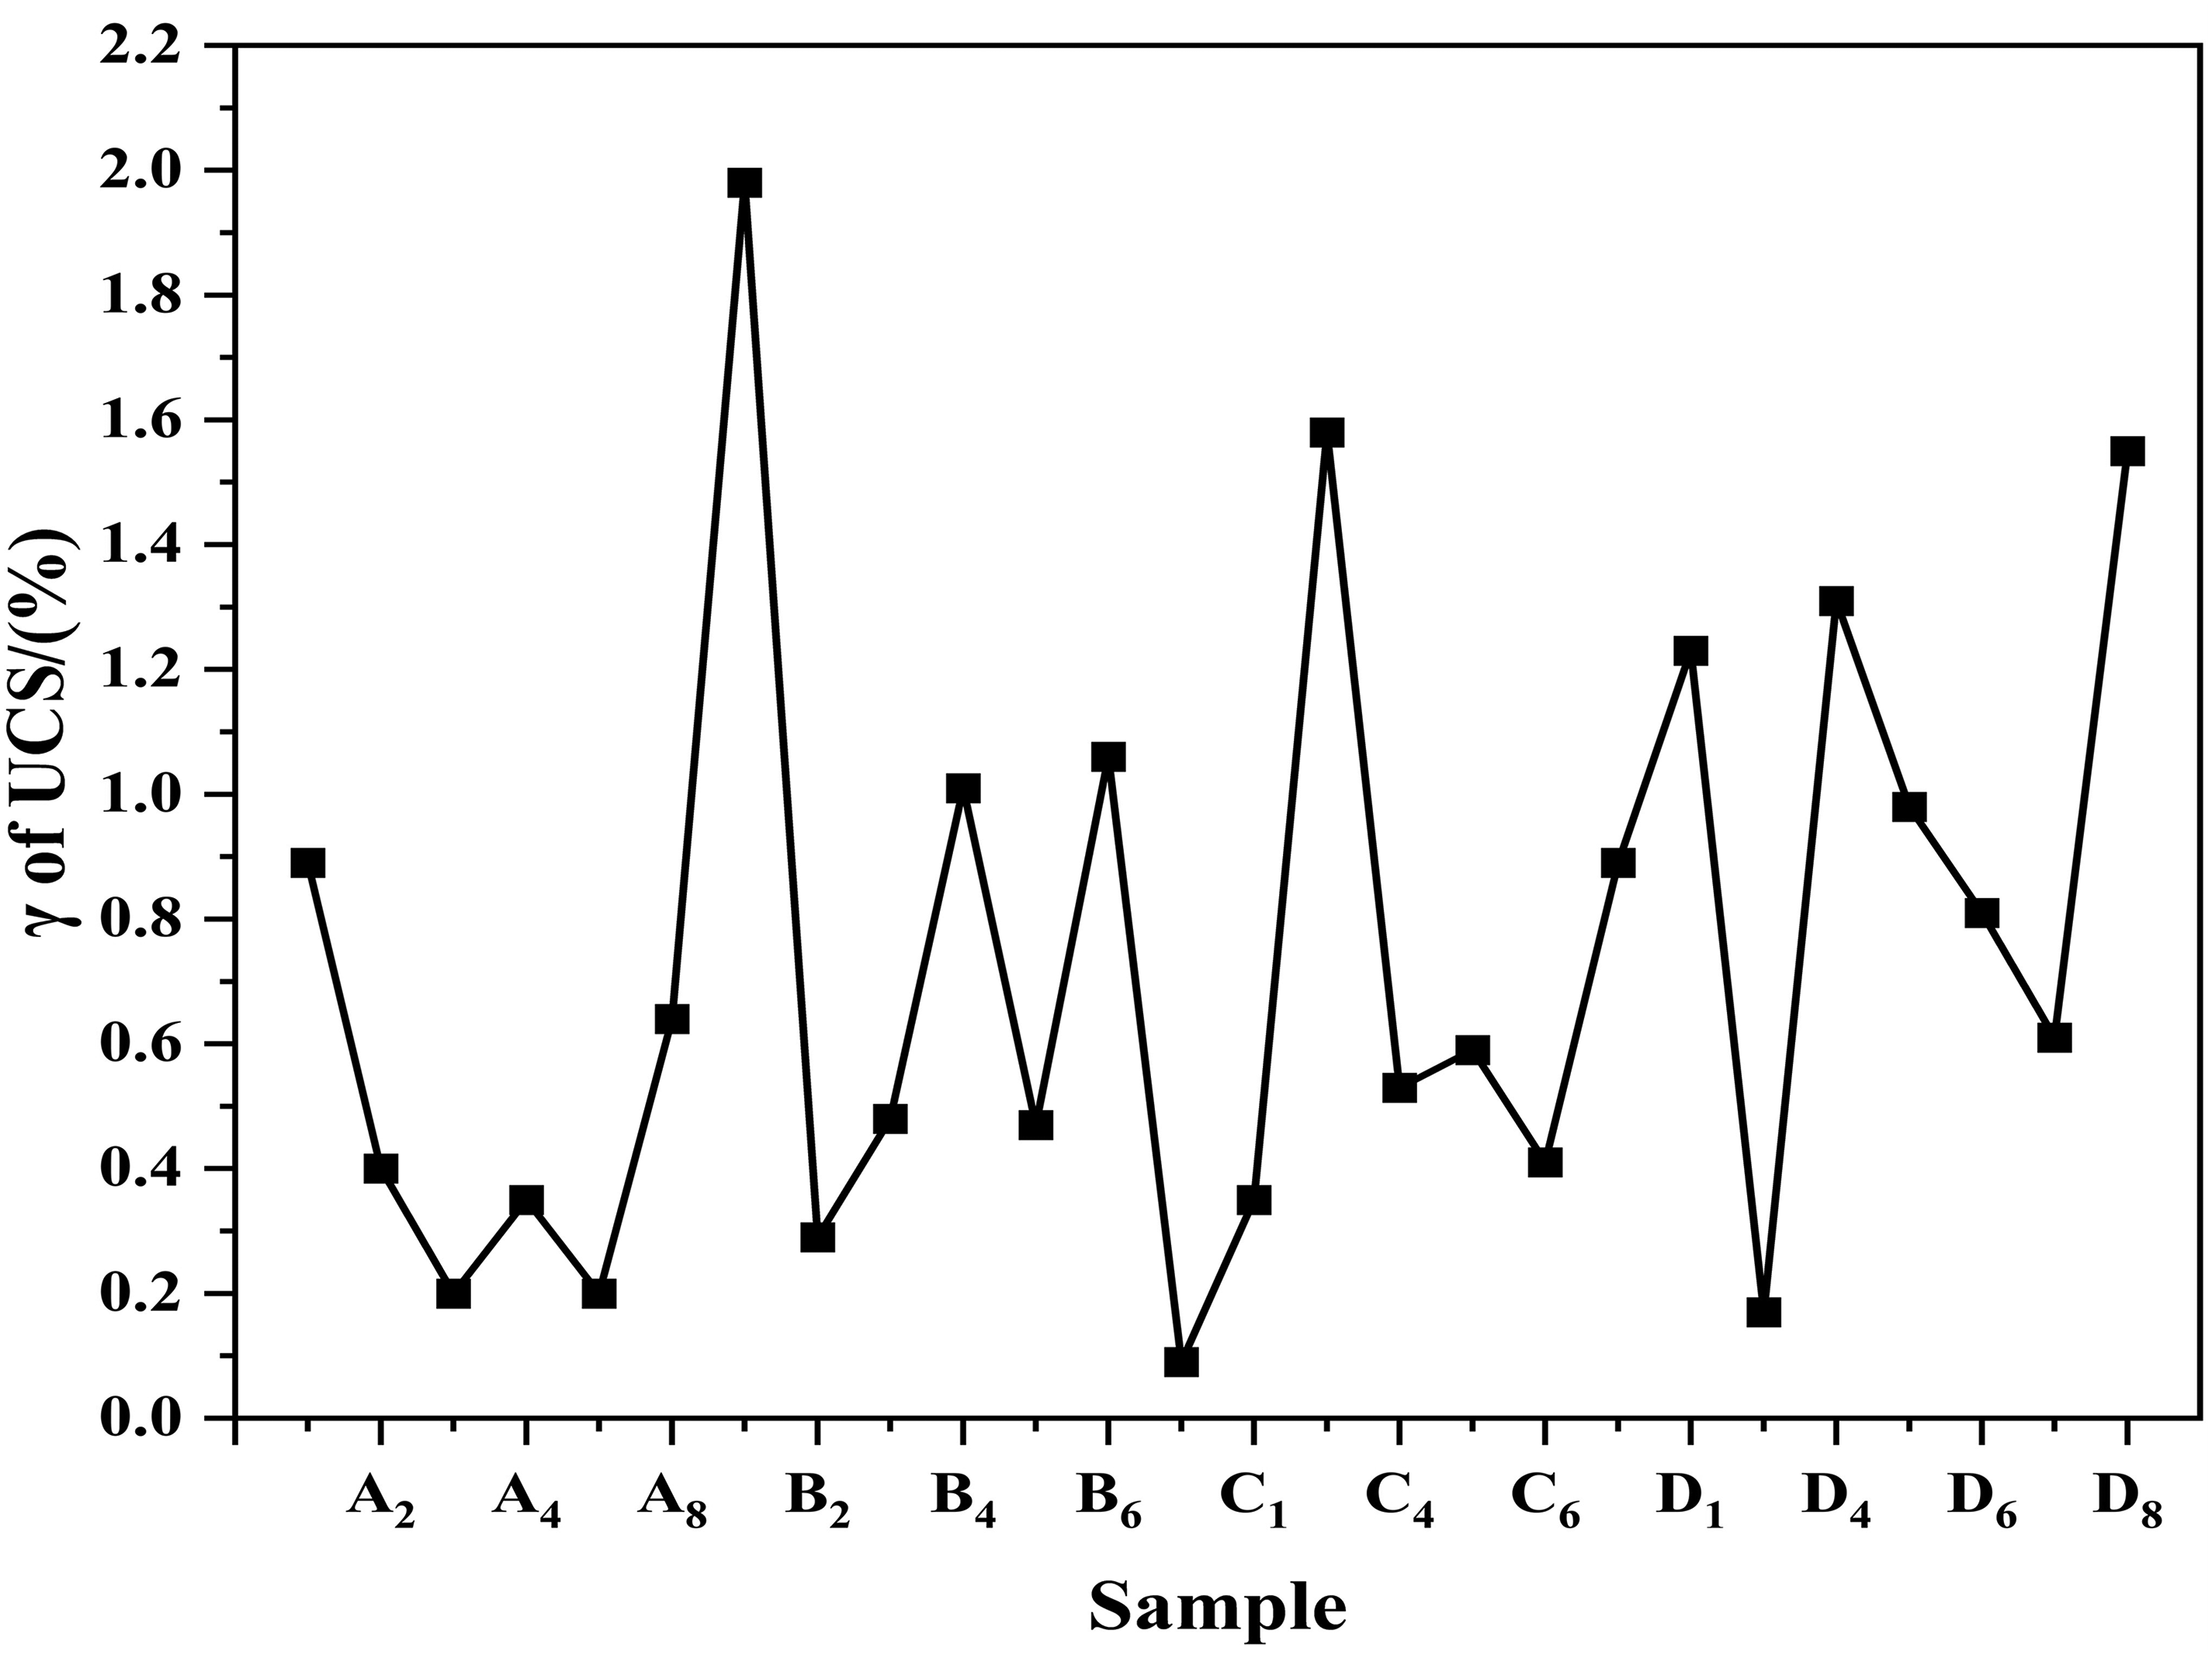
Uniaxial compressive strength UCS variance rate γ (training set).
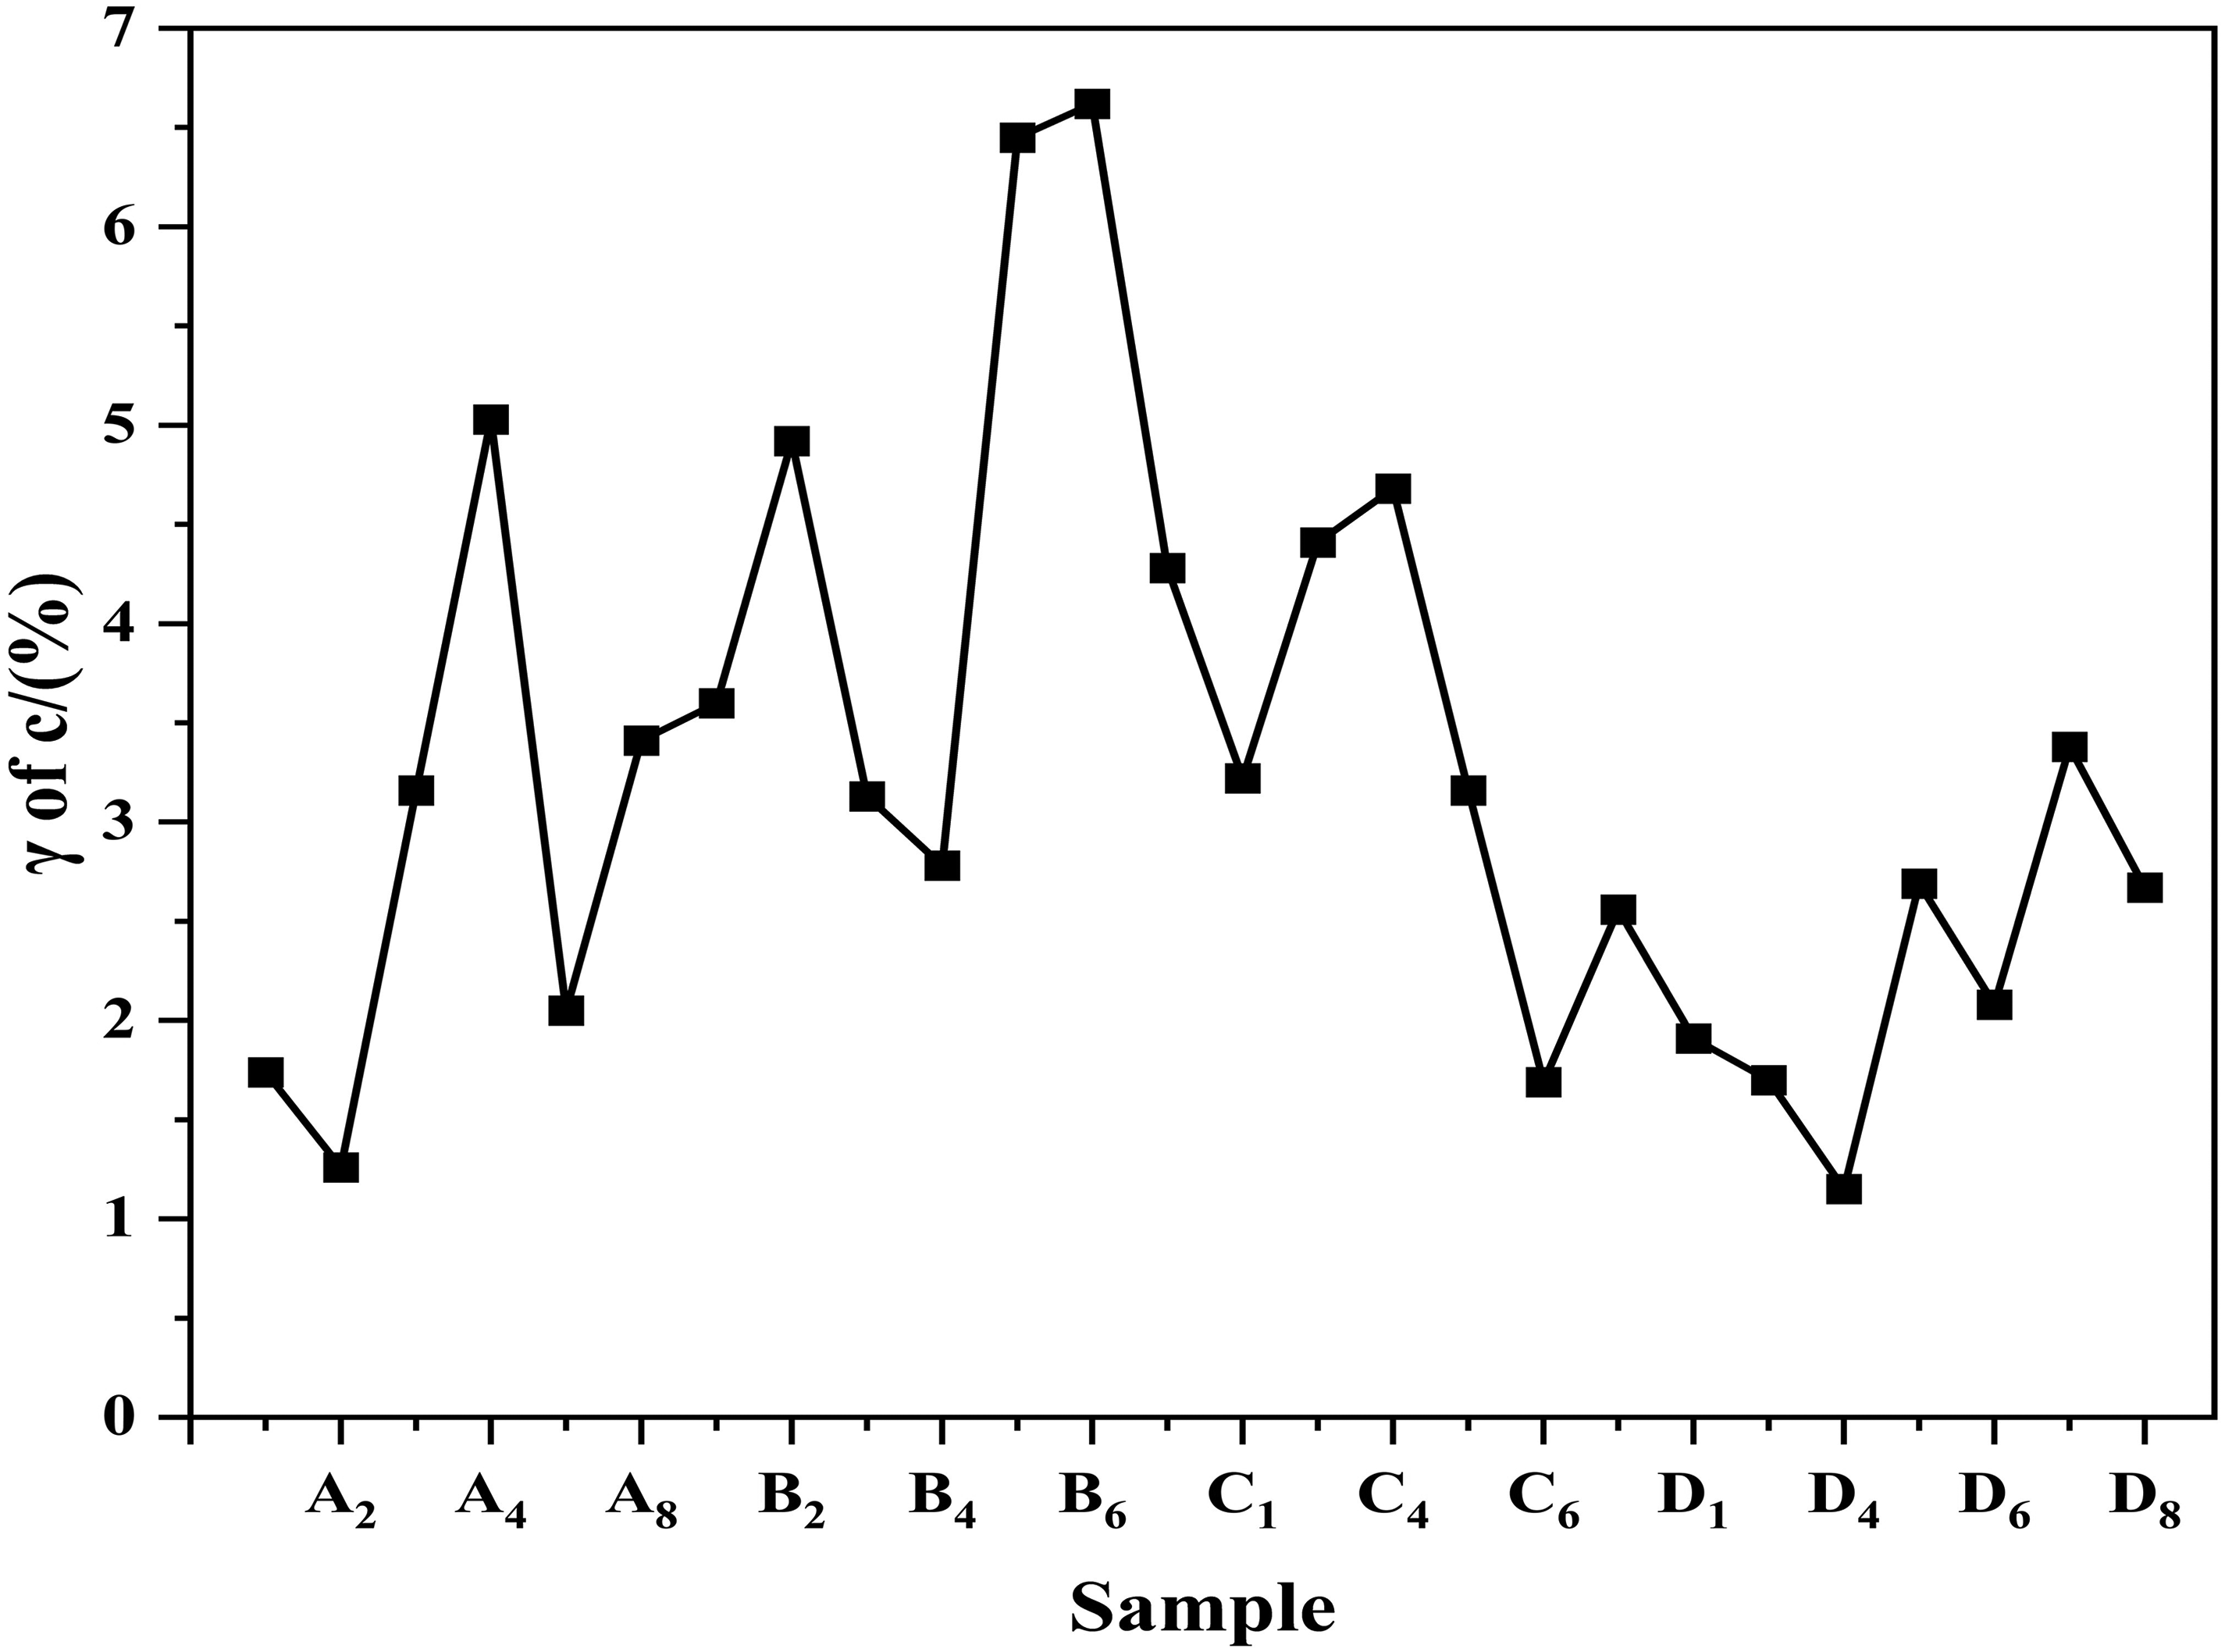
Cohesion c variance rate γ (training set).
Internal friction angle φ variance rate γ (training set).
Evaluation of modeling relationship between drilling engineering parameters and rock mechanical parameters
In the validation set, the uniaxial compressive strength UCS, cohesive force c and internal friction angle φ obtained from the model prediction are plotted against the uniaxial compressive strength UCS, cohesive force c and internal friction angle φ obtained from the test, as shown in Figures 14 to 16. The values of the rock mechanical parameters predicted by the model are close to those obtained from the tests.
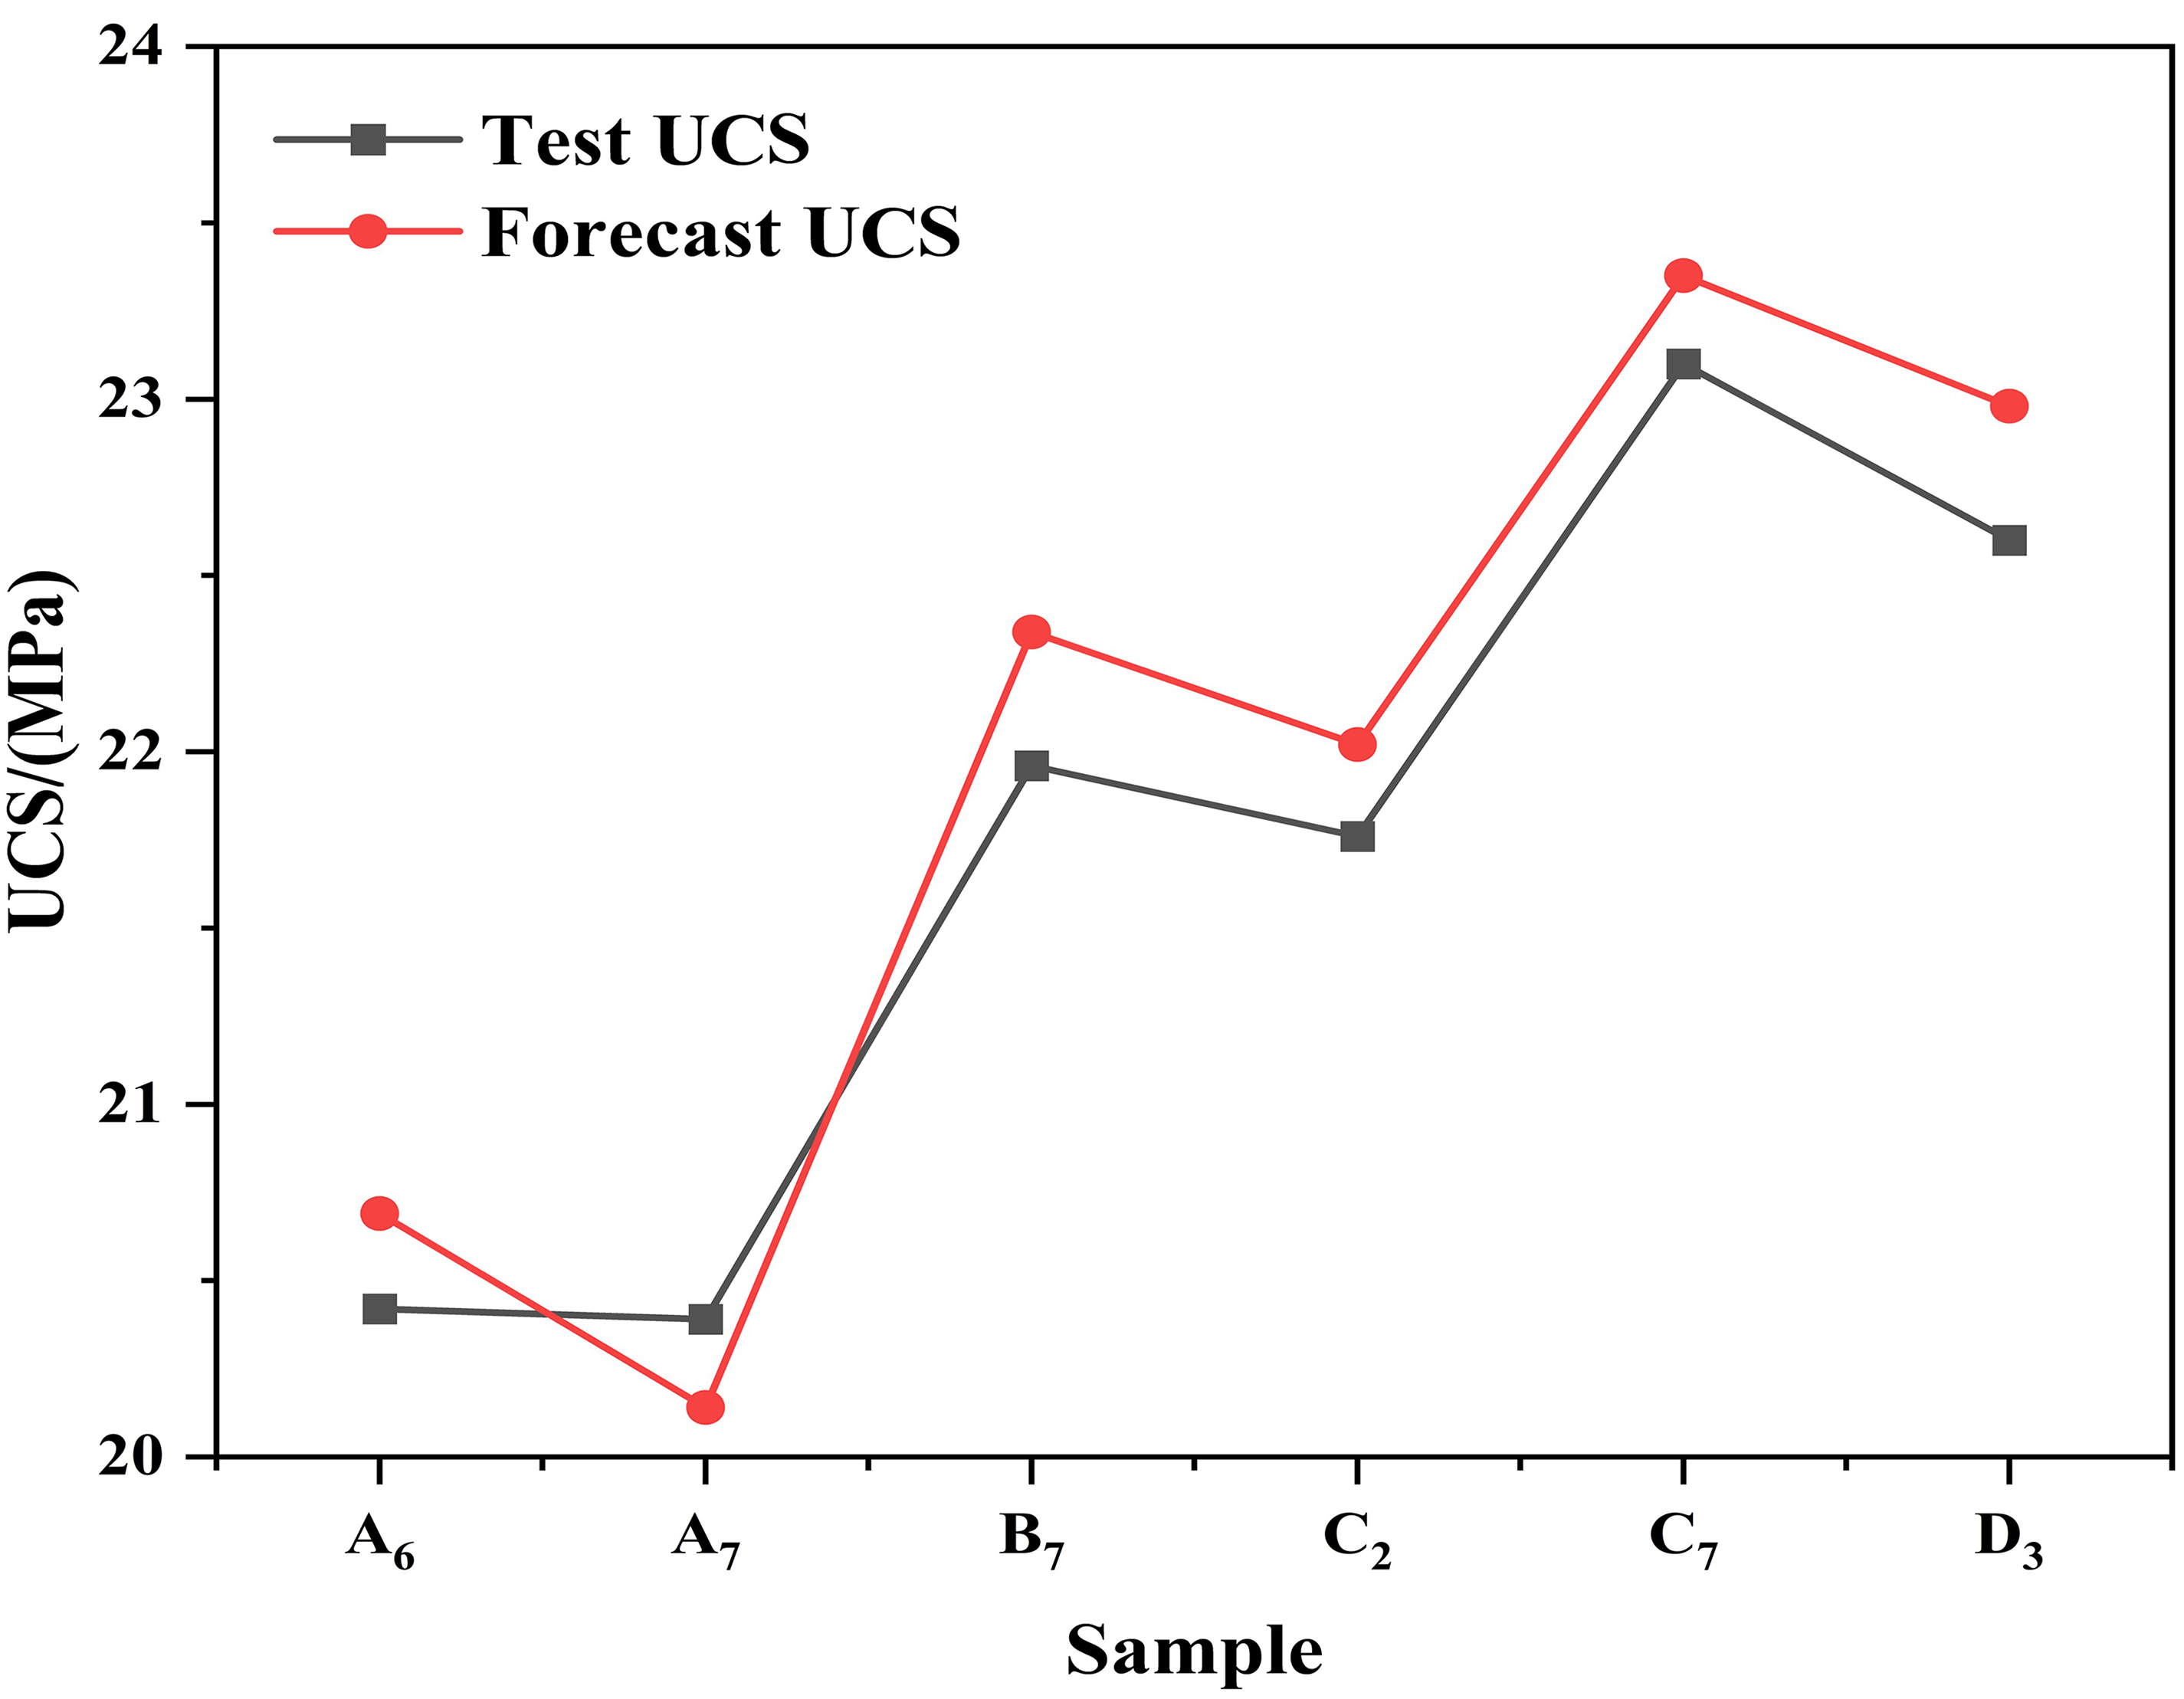
Plot of predicted vs. tested uniaxial compressive strength UCS (validation set).
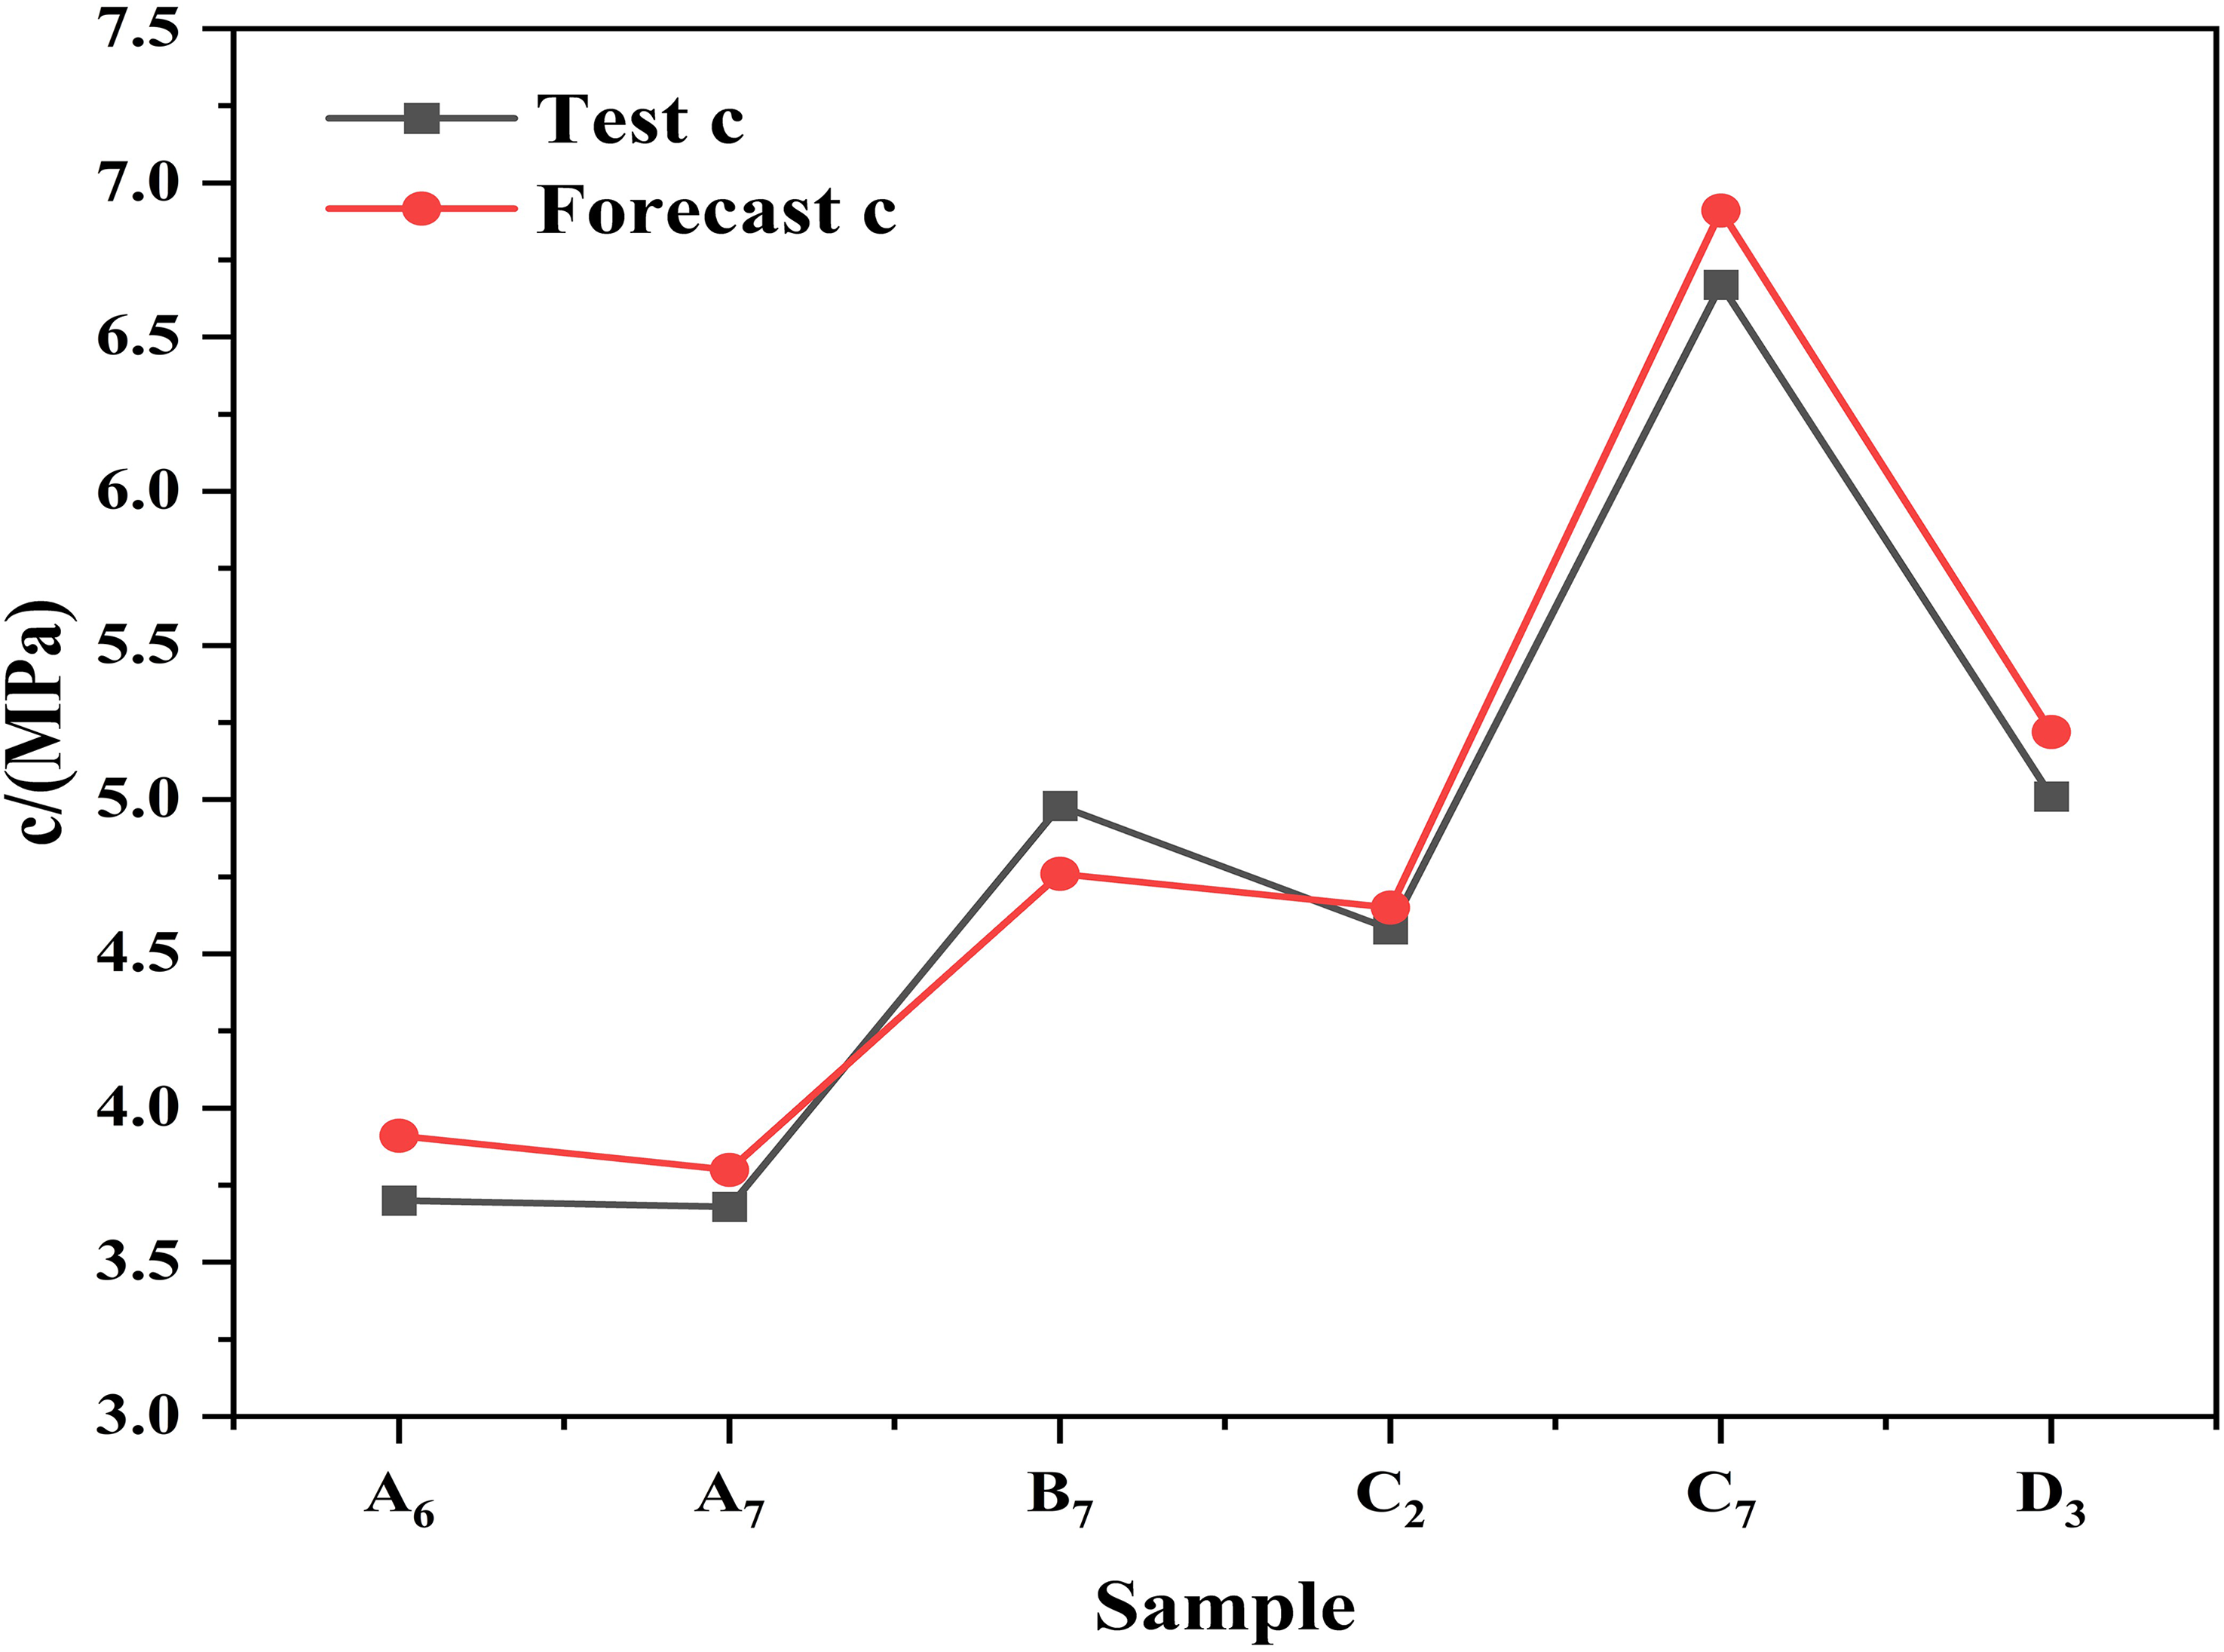
Plot of predicted vs. tested values of cohesion c (validation set).
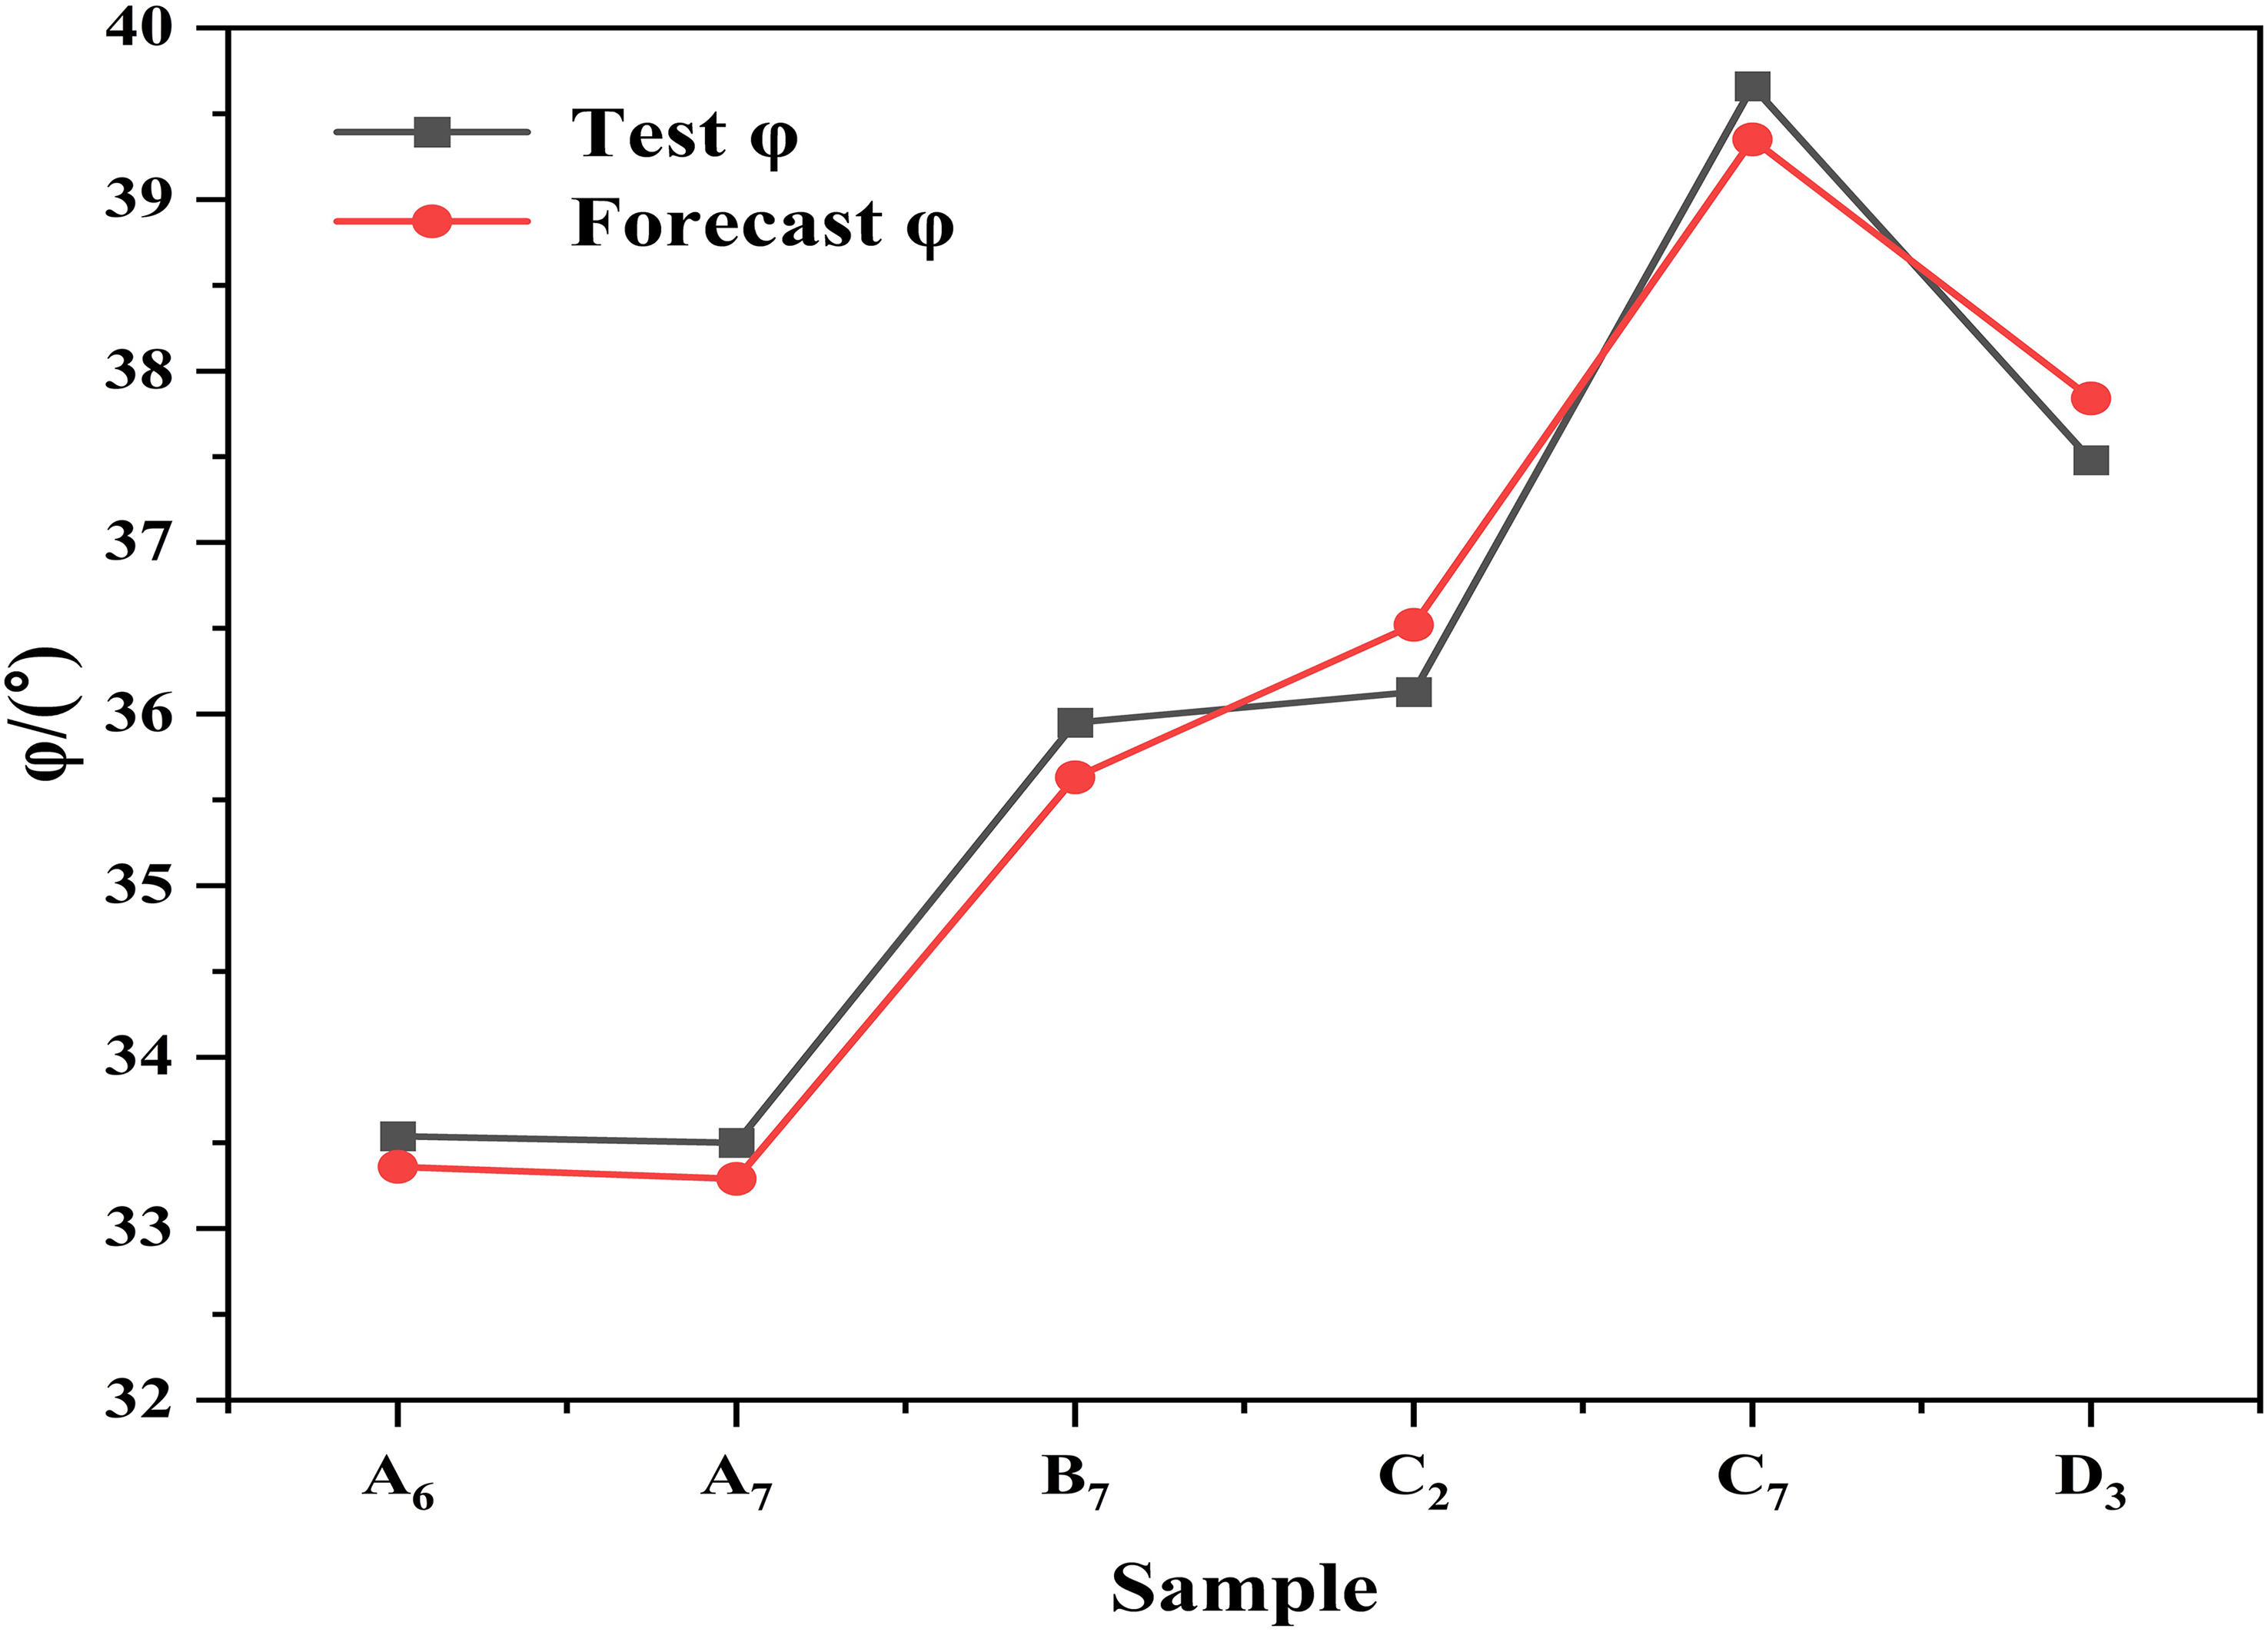
Plot of predicted vs. experimental values of internal friction angle φ (validation set).
The performance of the model evaluation metrics, R2, is shown in Figures 17 to 19. The R2 of the uniaxial compressive strength UCS, viscous cohesion c and the angle of internal friction φ are 0.9778, 0.9772 and 0.9817 respectively, which indicate that they are more correlate.
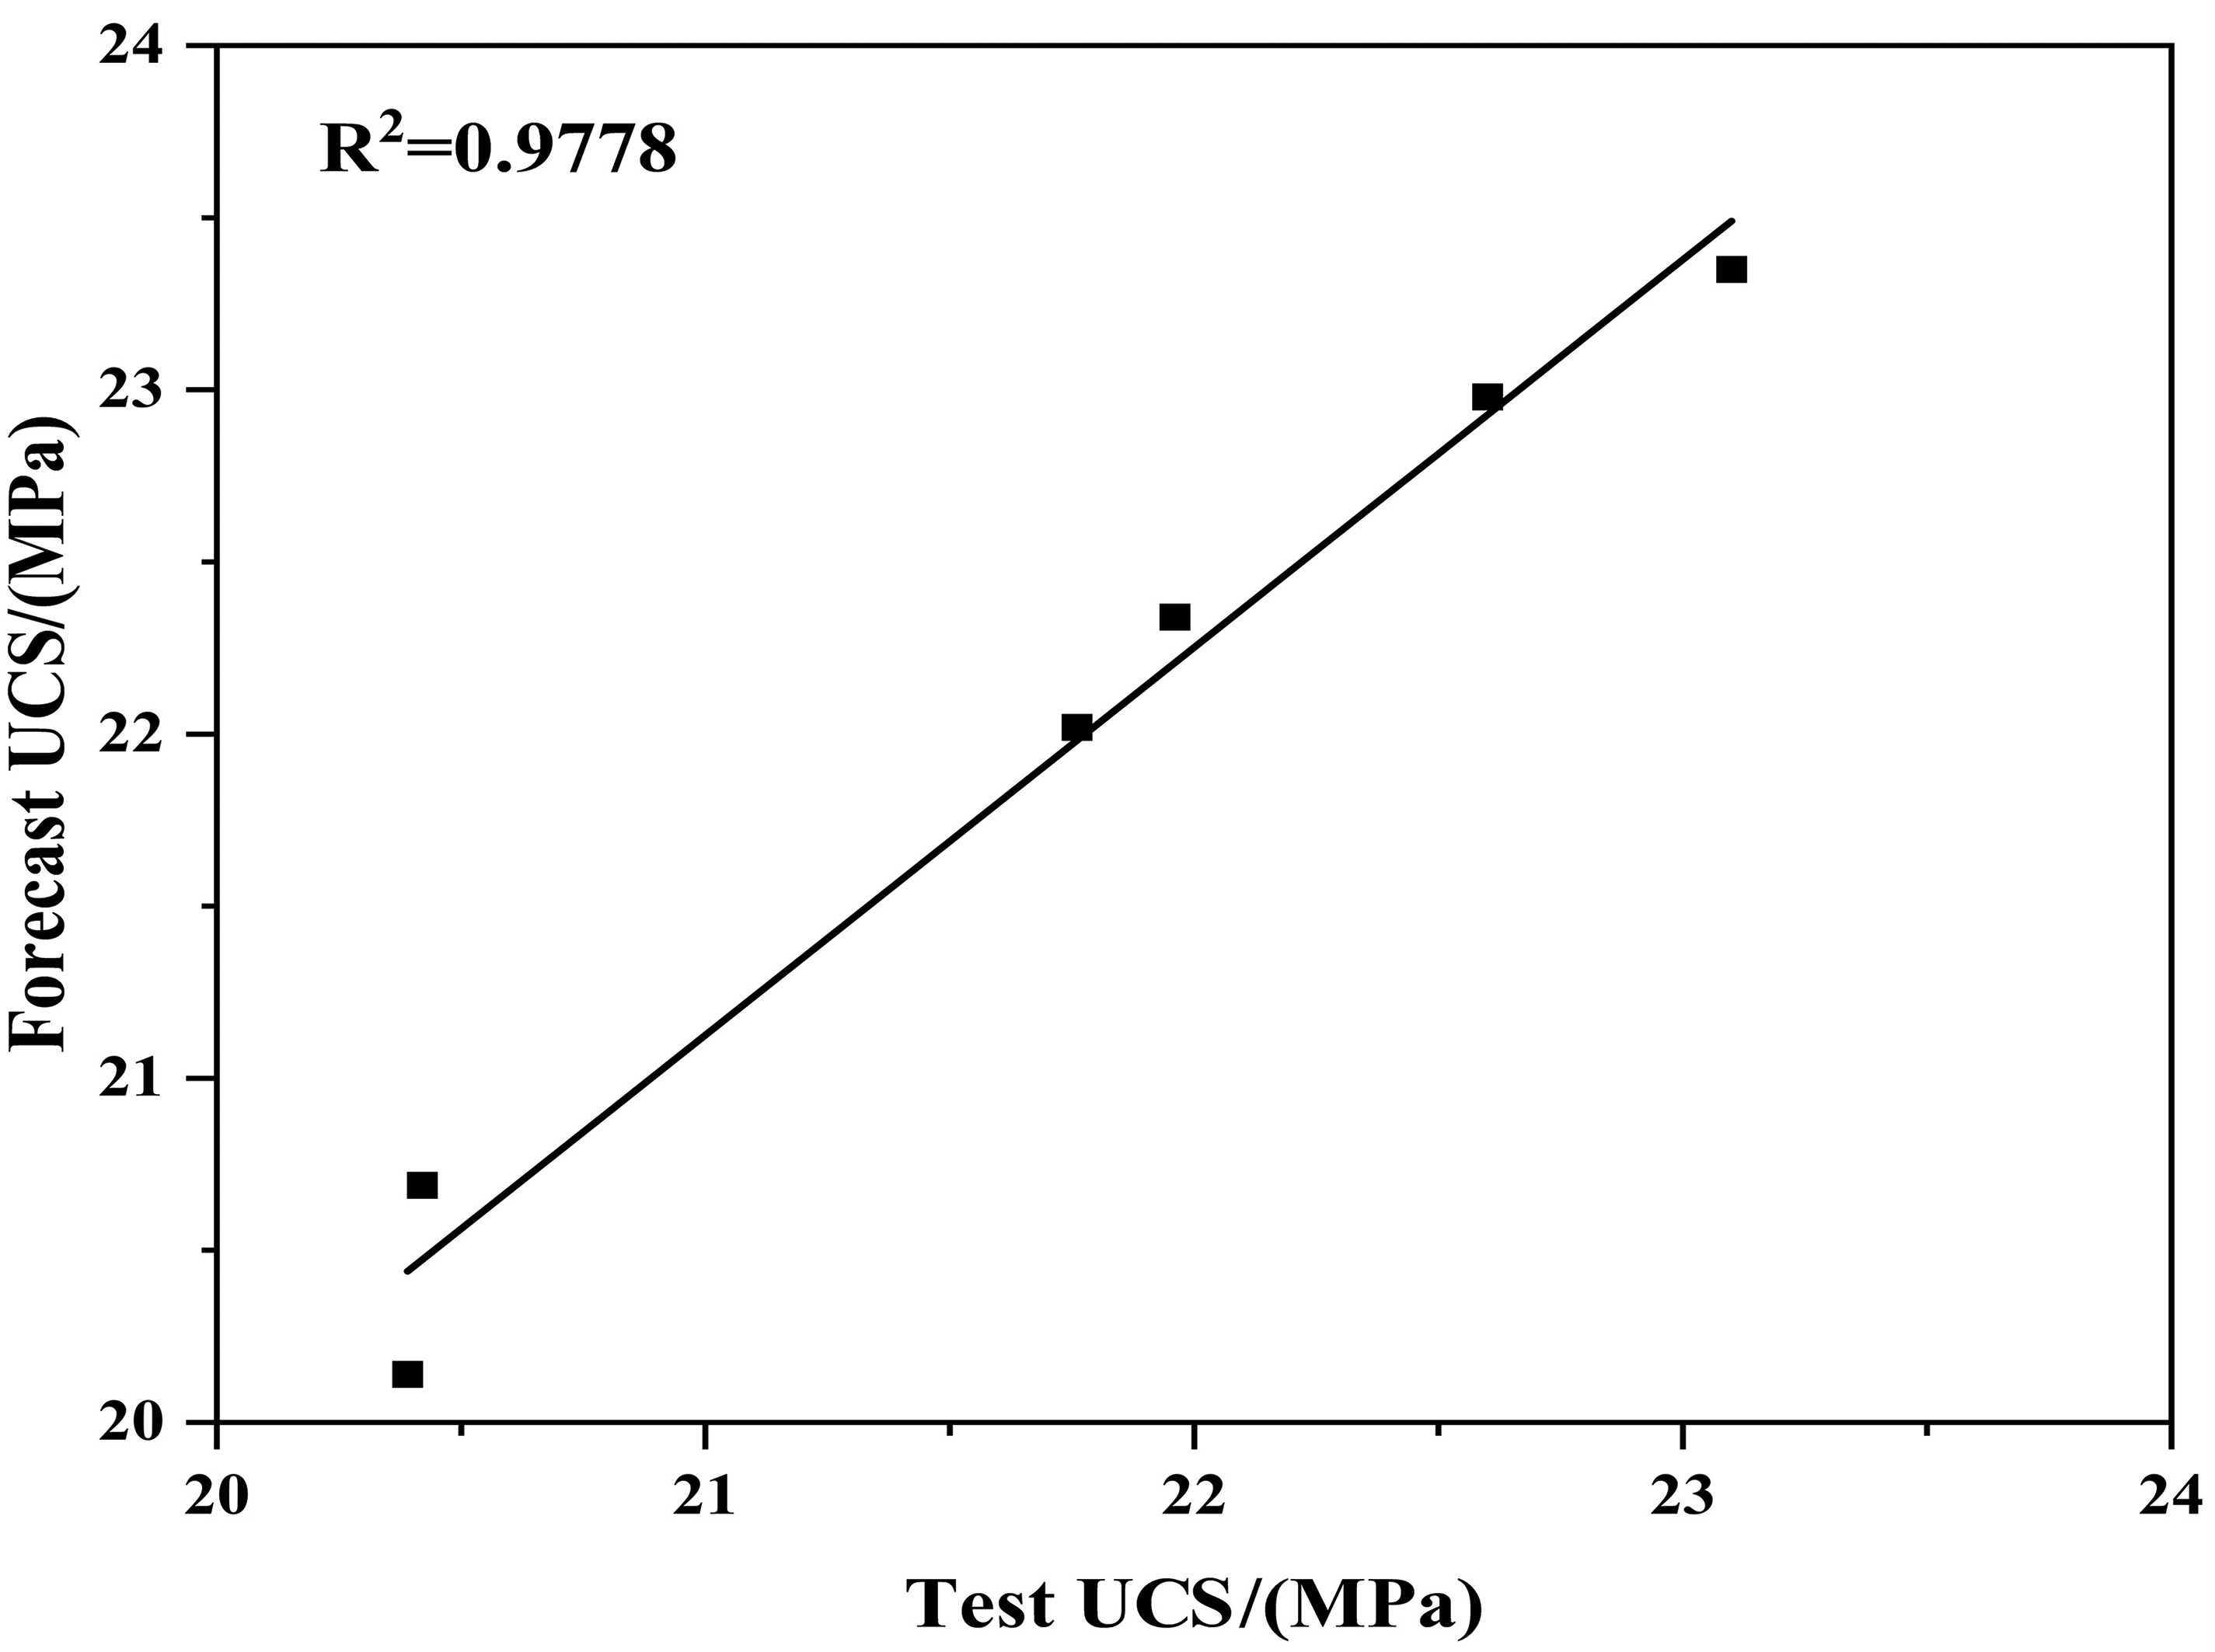
Uniaxial compressive strength UCS coefficient of determination R2 (validation set).
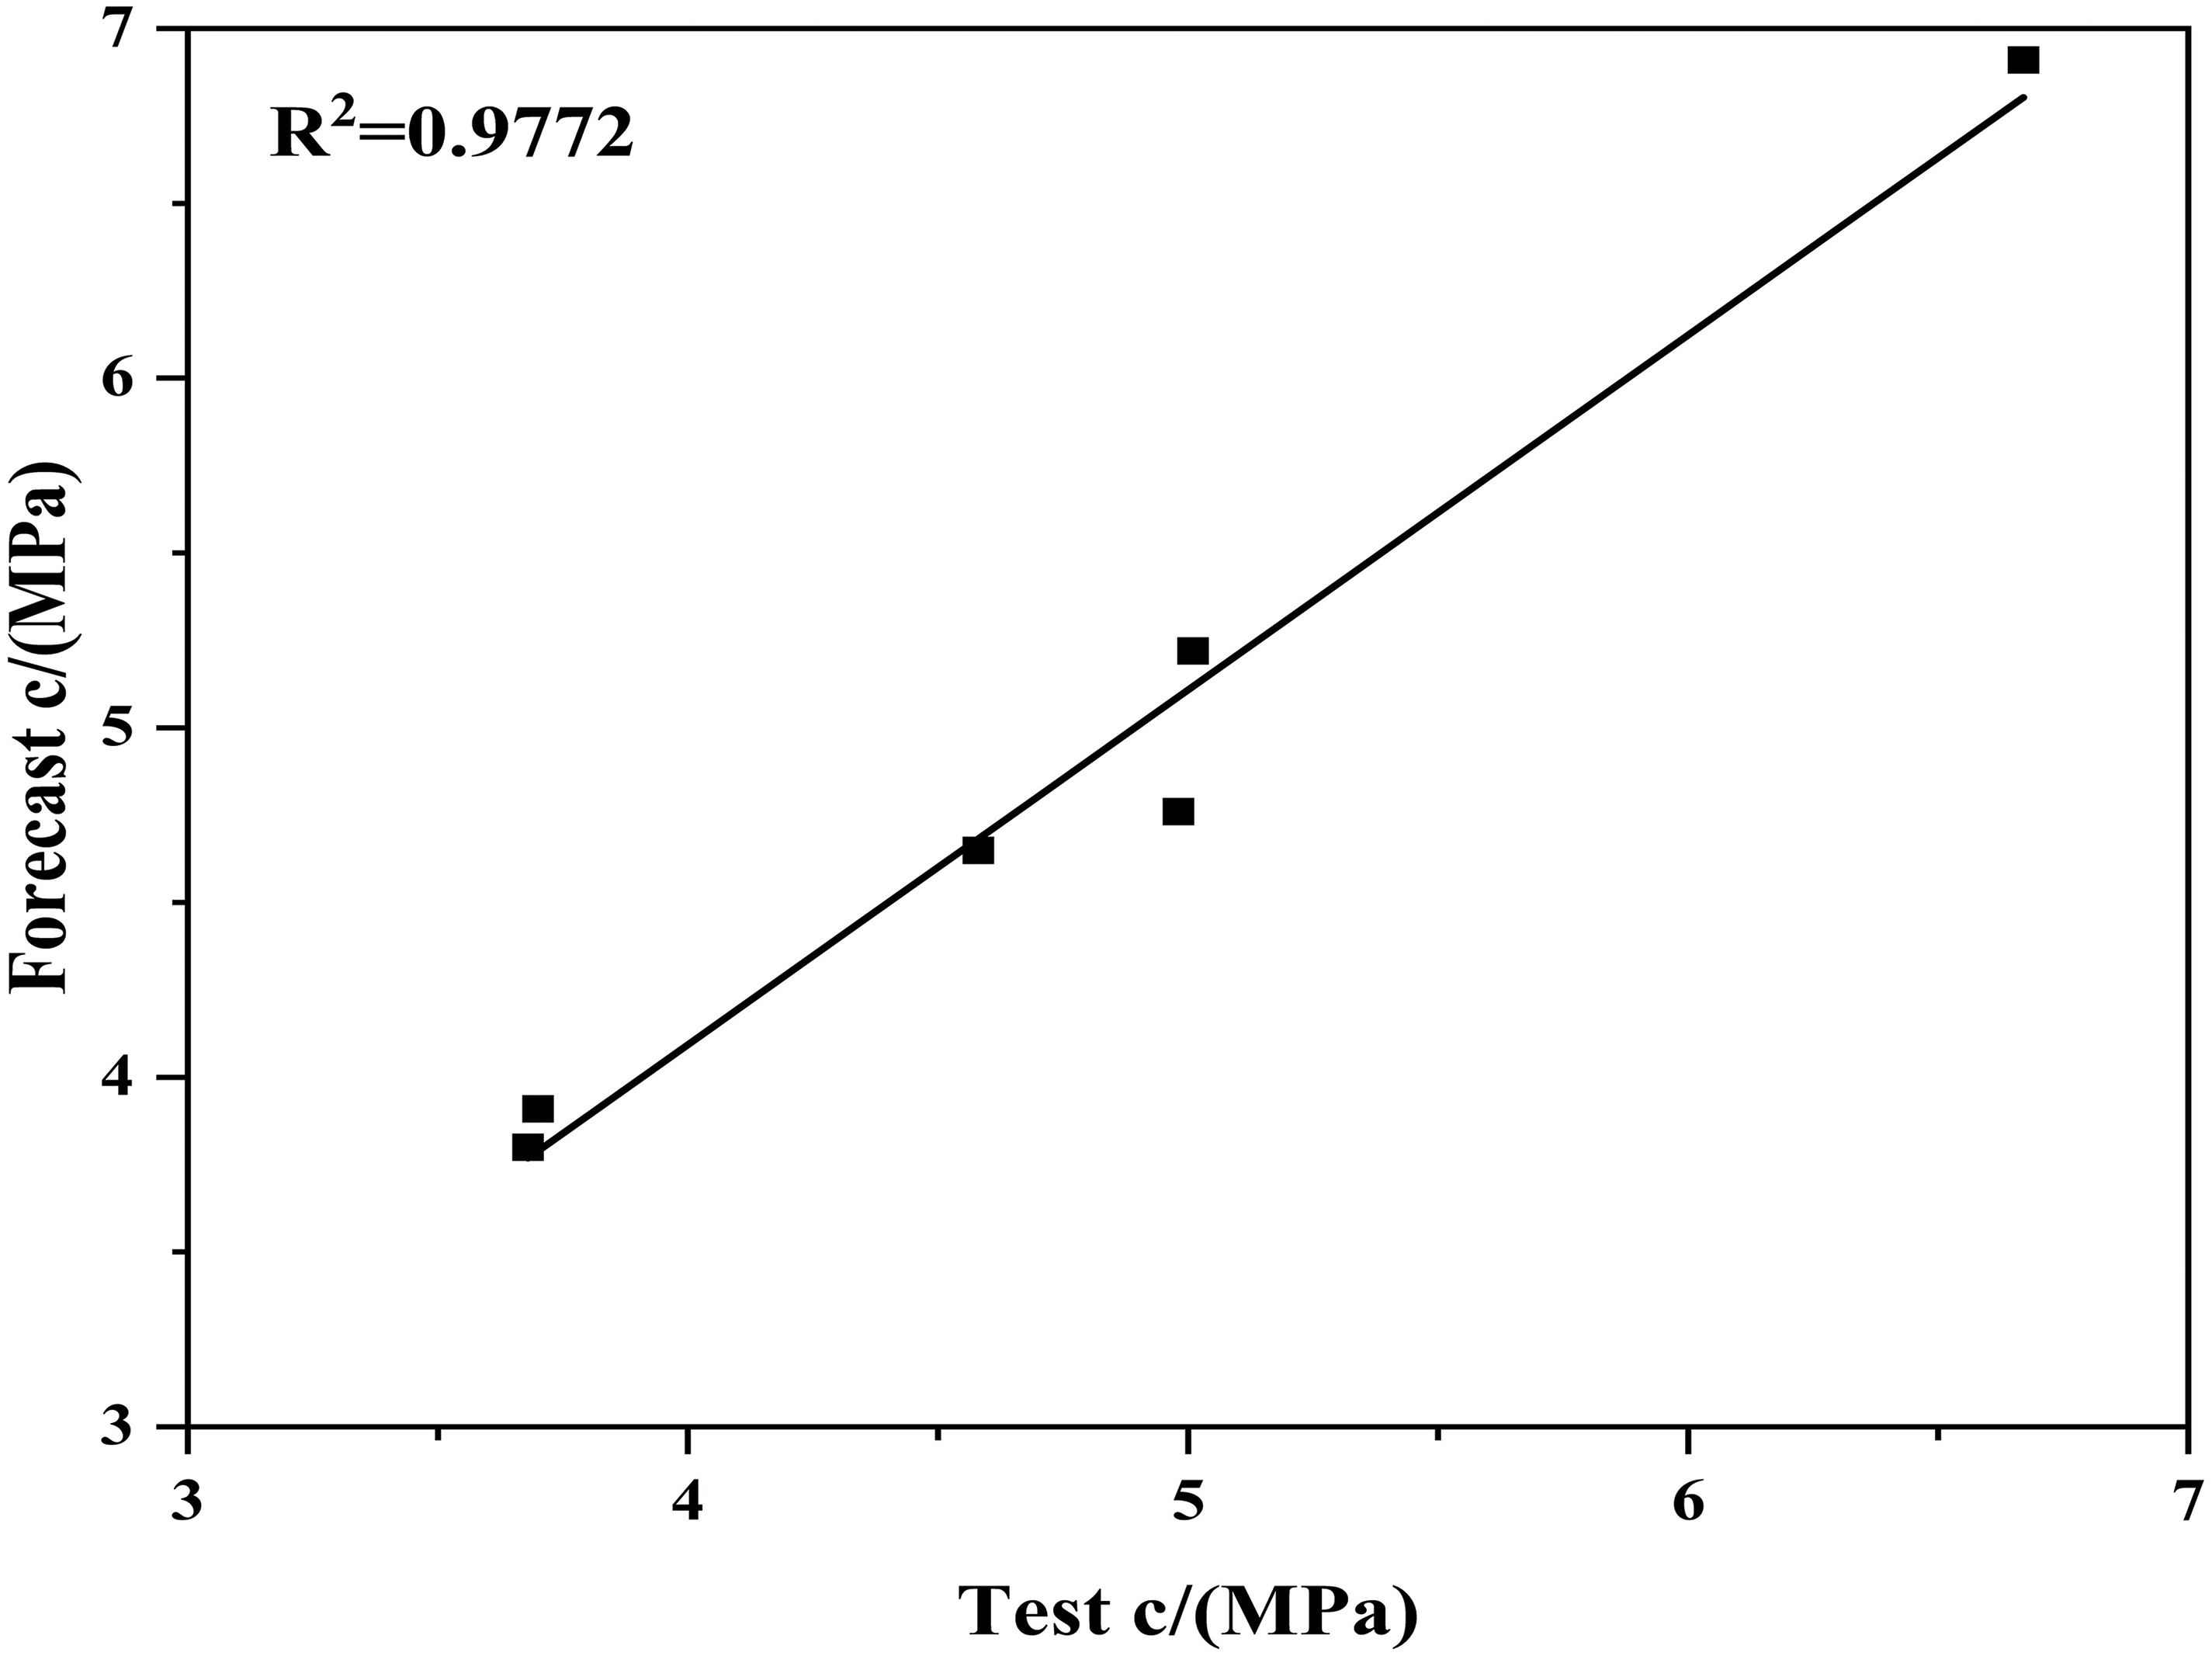
Cohesion c coefficient of determination R2 (validation set).
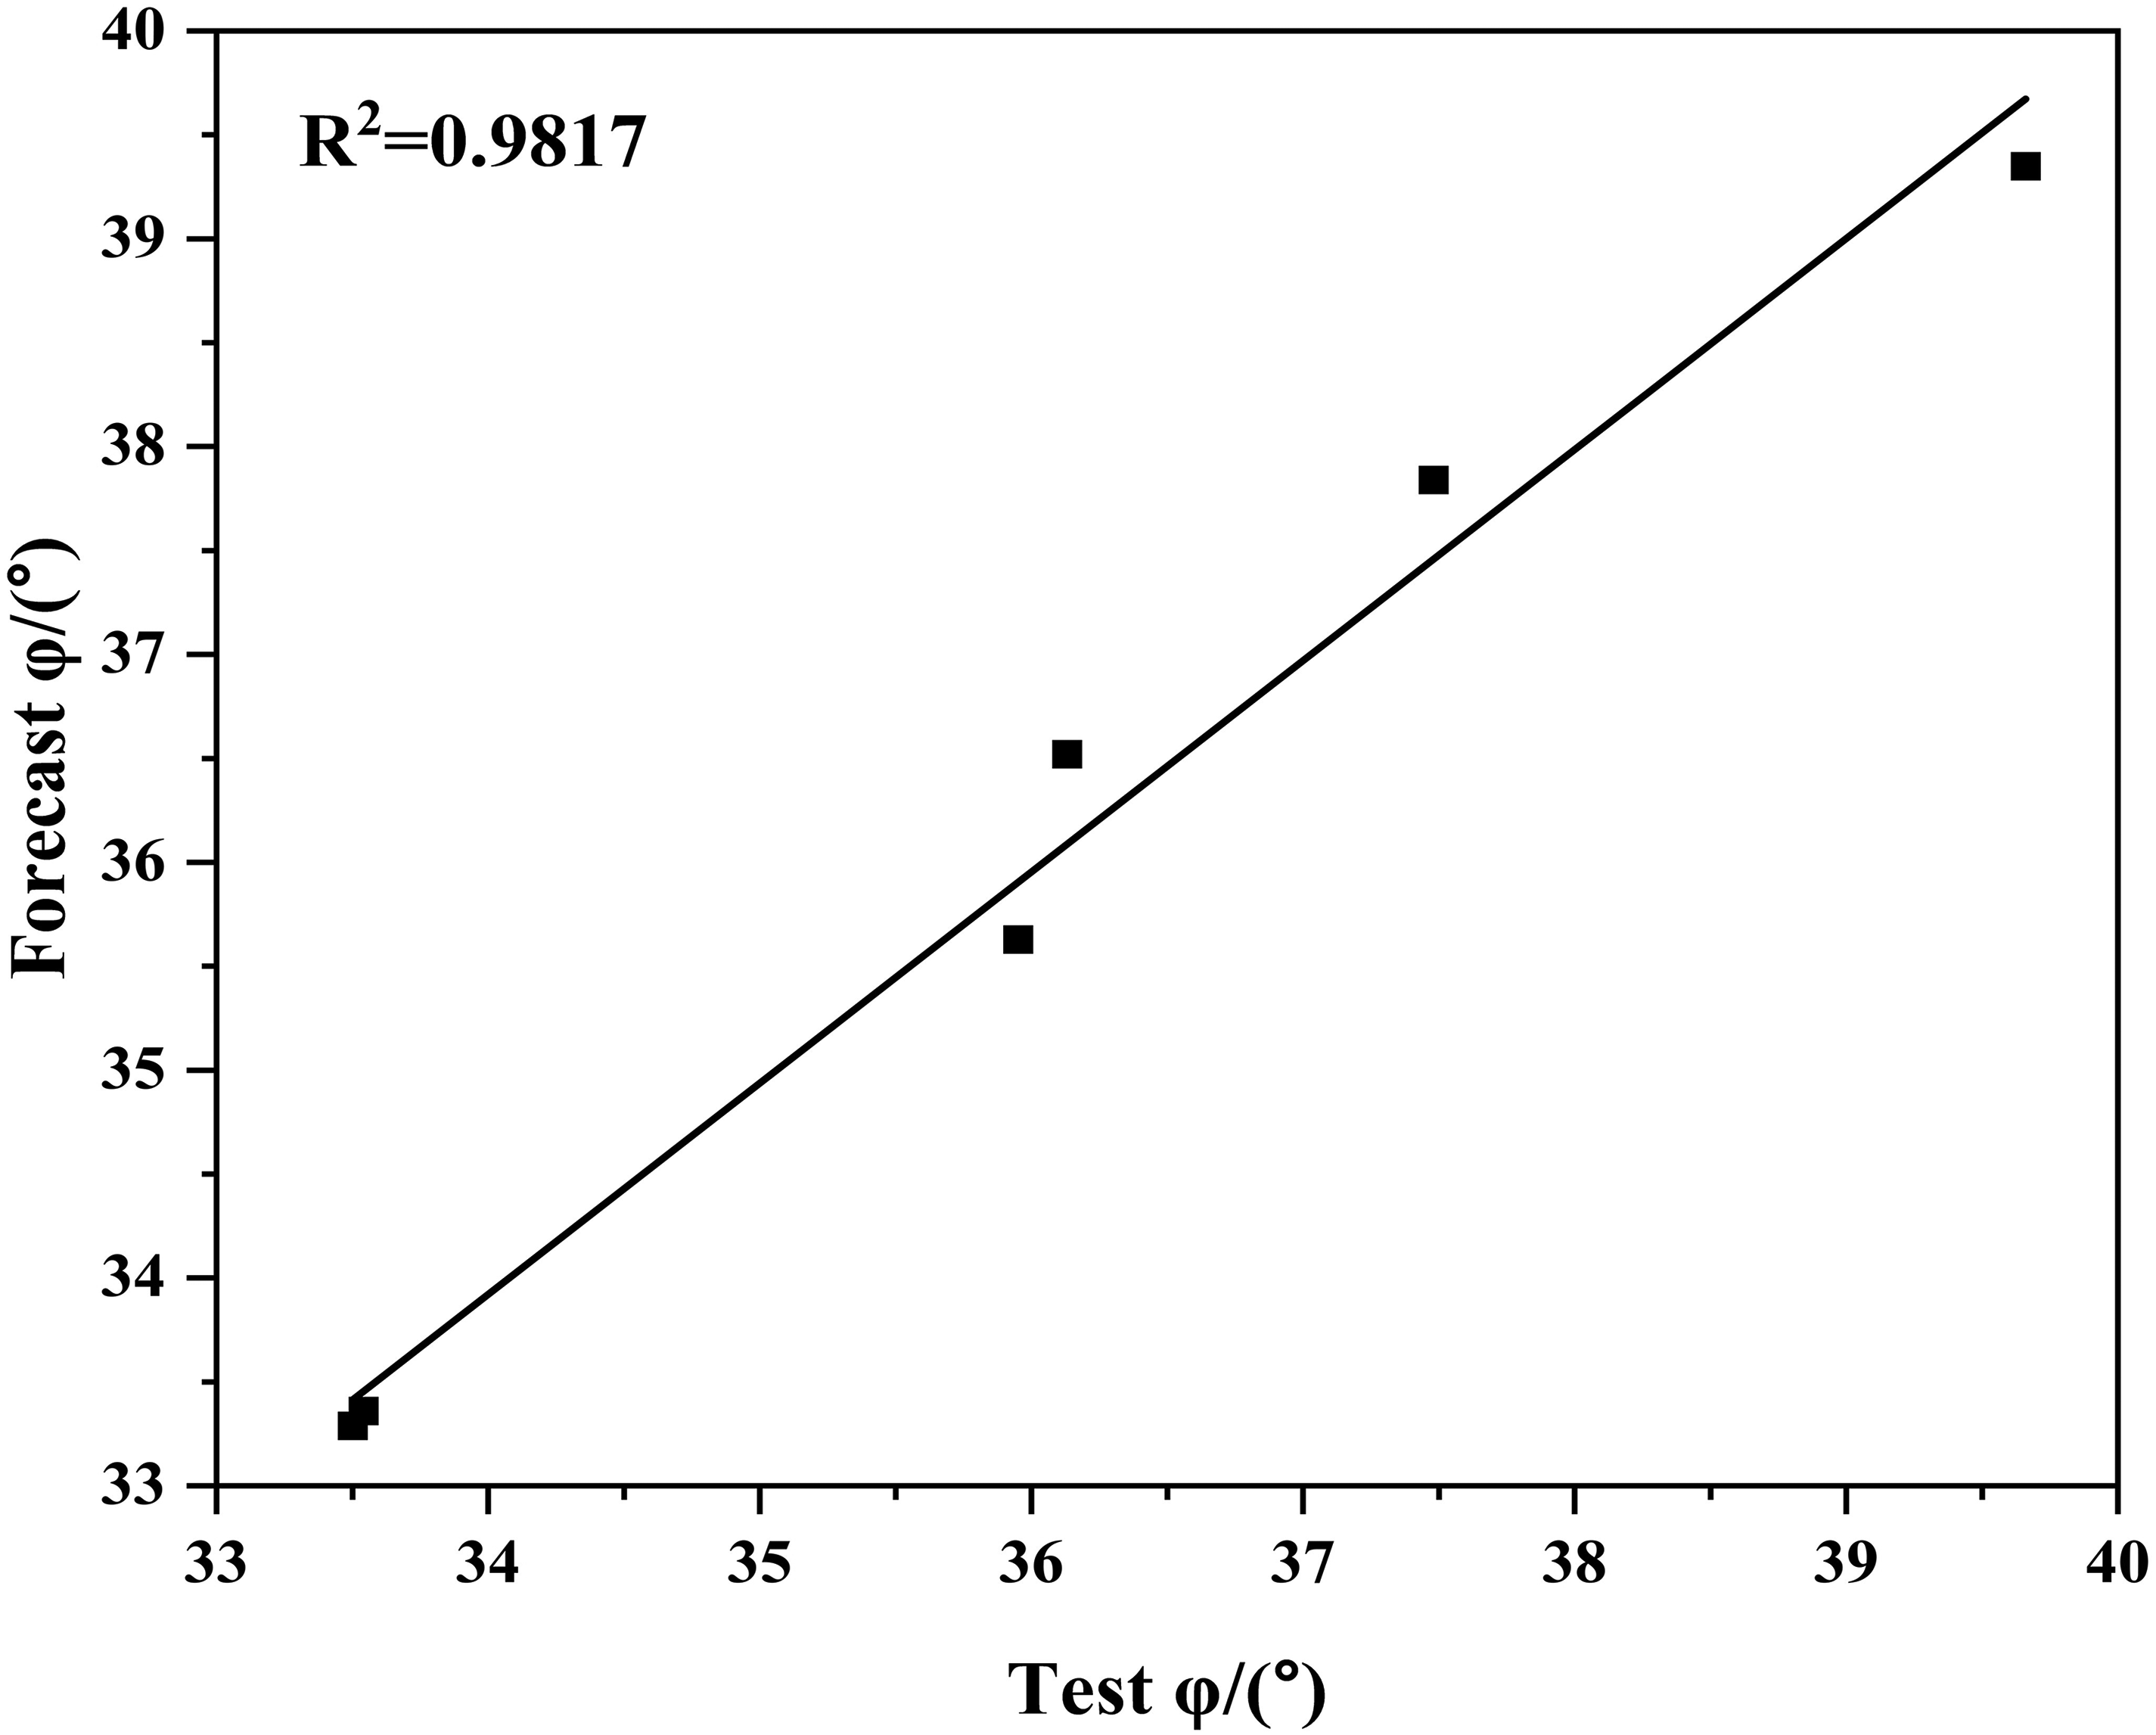
Coefficient of determination R2 for angle of internal friction φ (validation set).
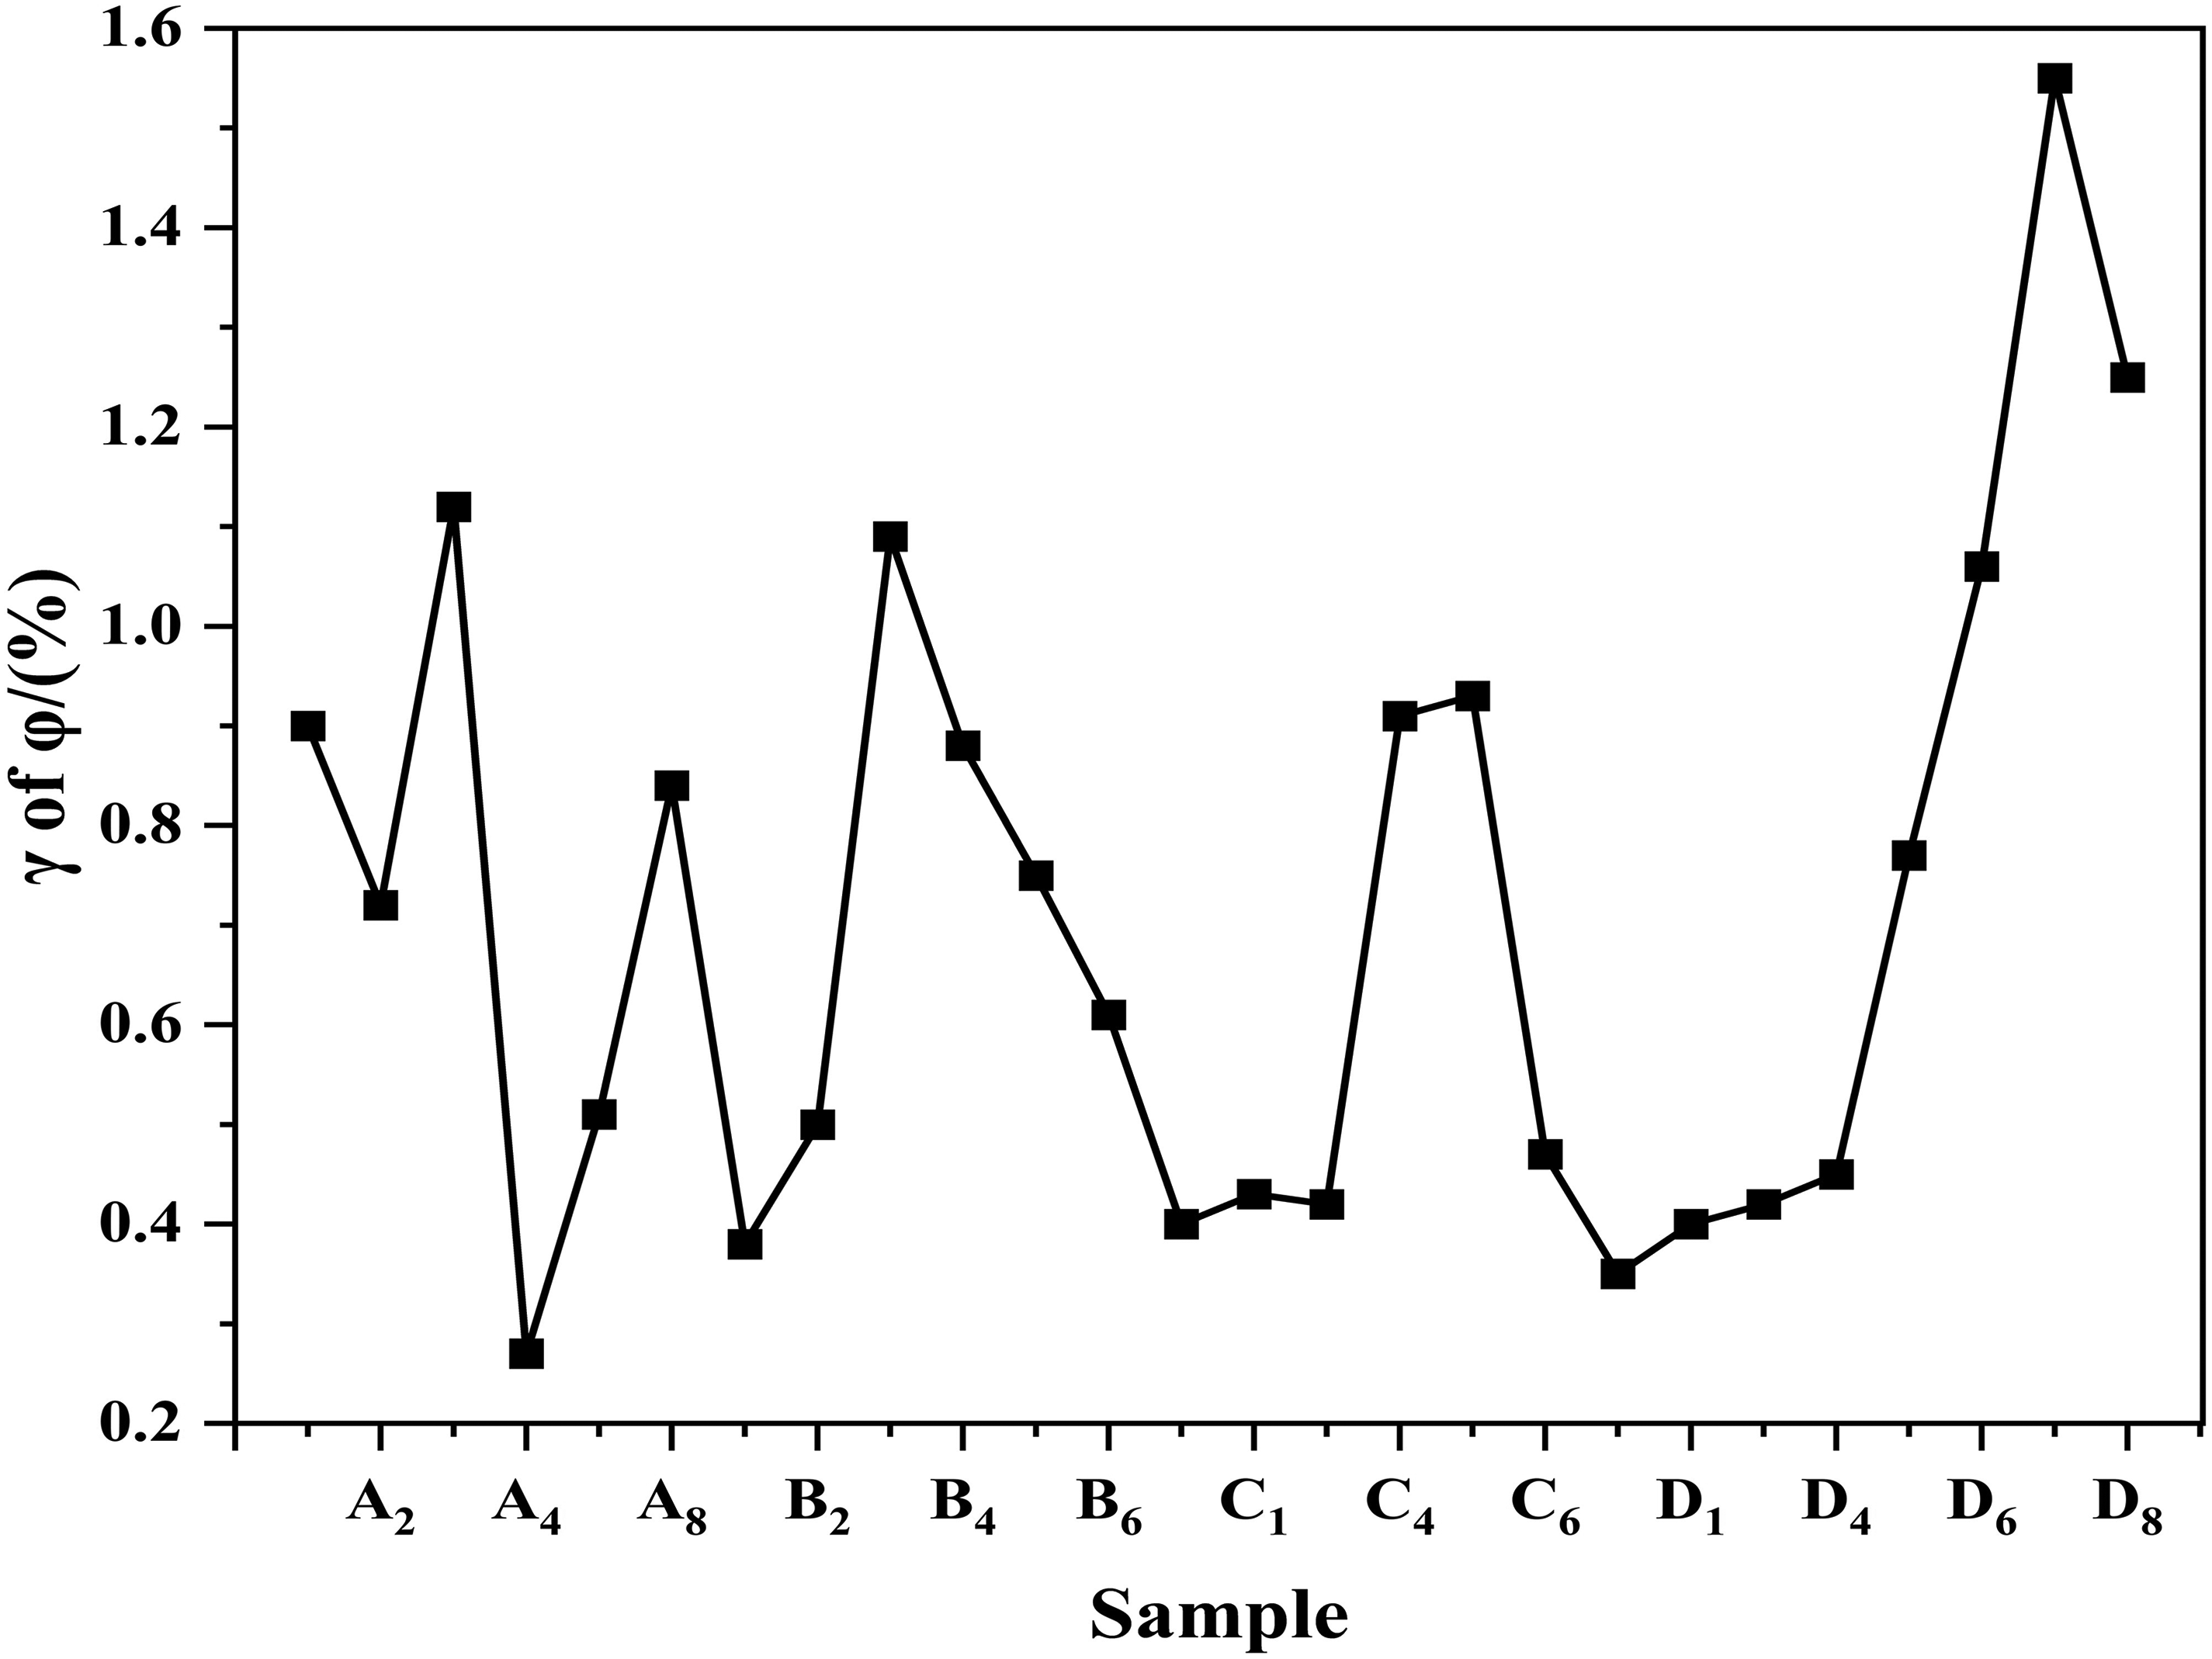
As shown in Figures 20 to 22, the mean values of the difference rates of uniaxial compressive strength UCS, cohesive force c and internal friction angle φ are 1.36%, 3.78% and 0.81%, respectively, which indicate that the model prediction accuracy is good.
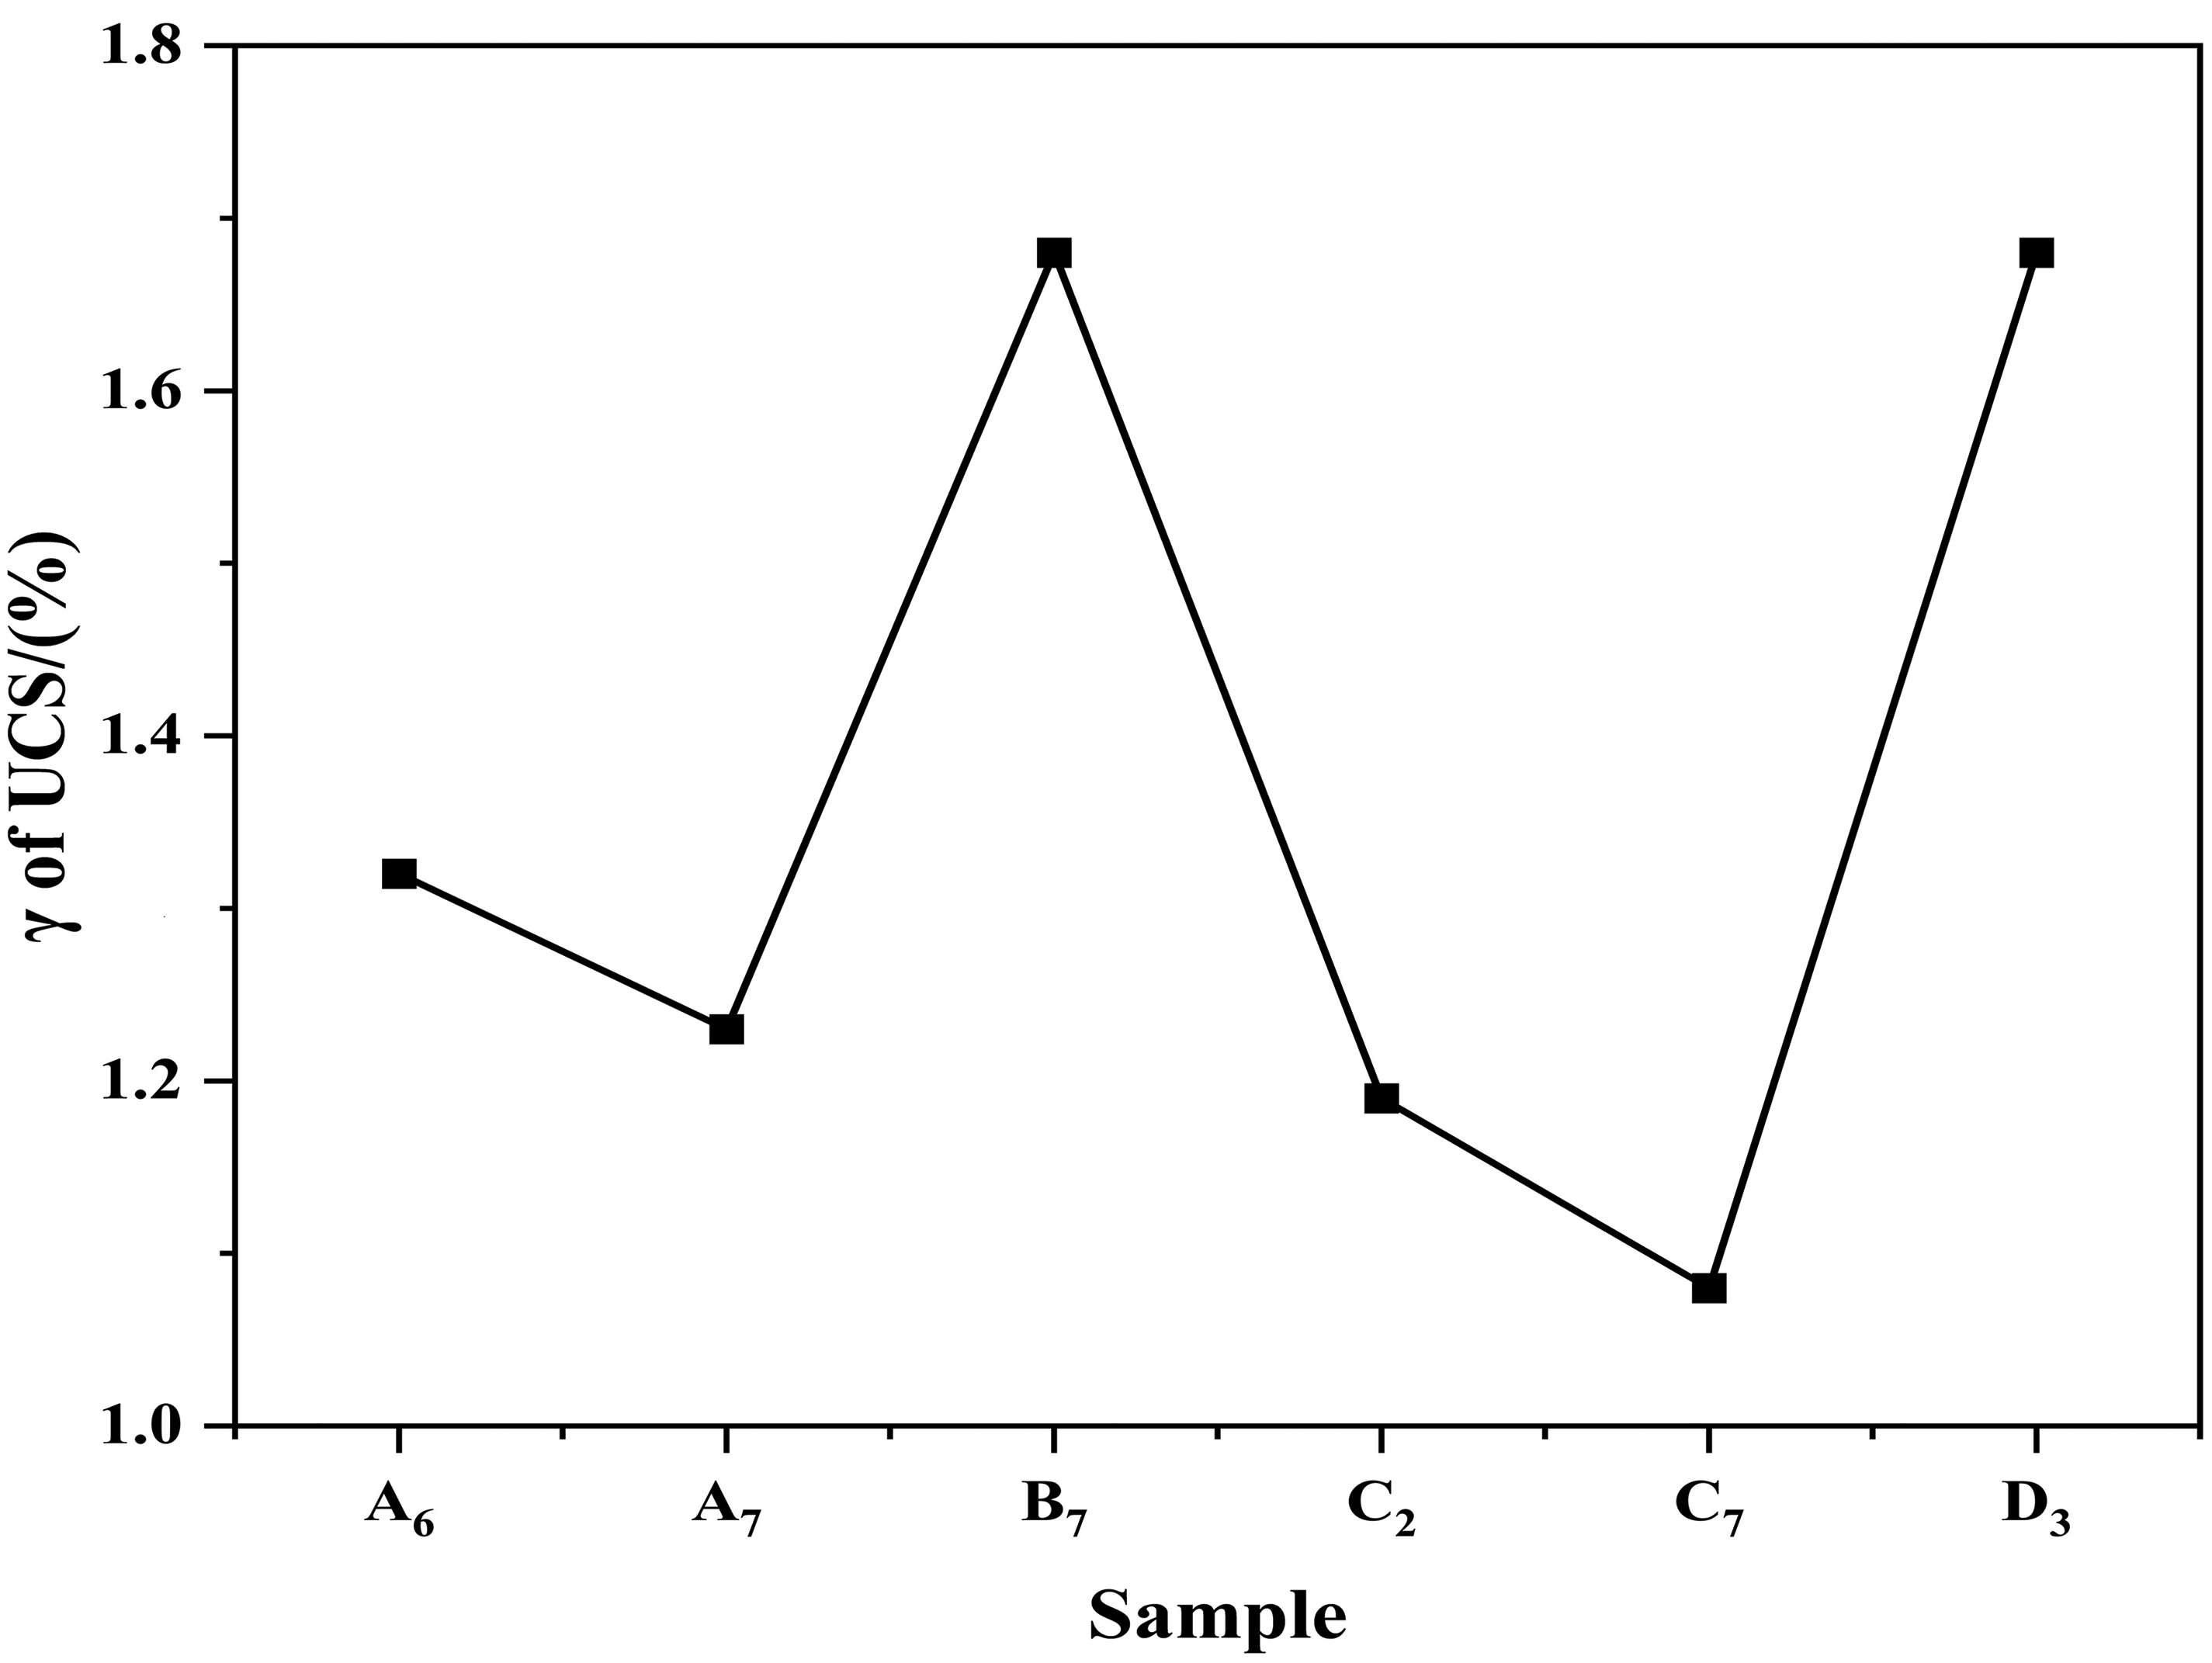
Uniaxial compressive strength UCS variance rate γ (validation set).
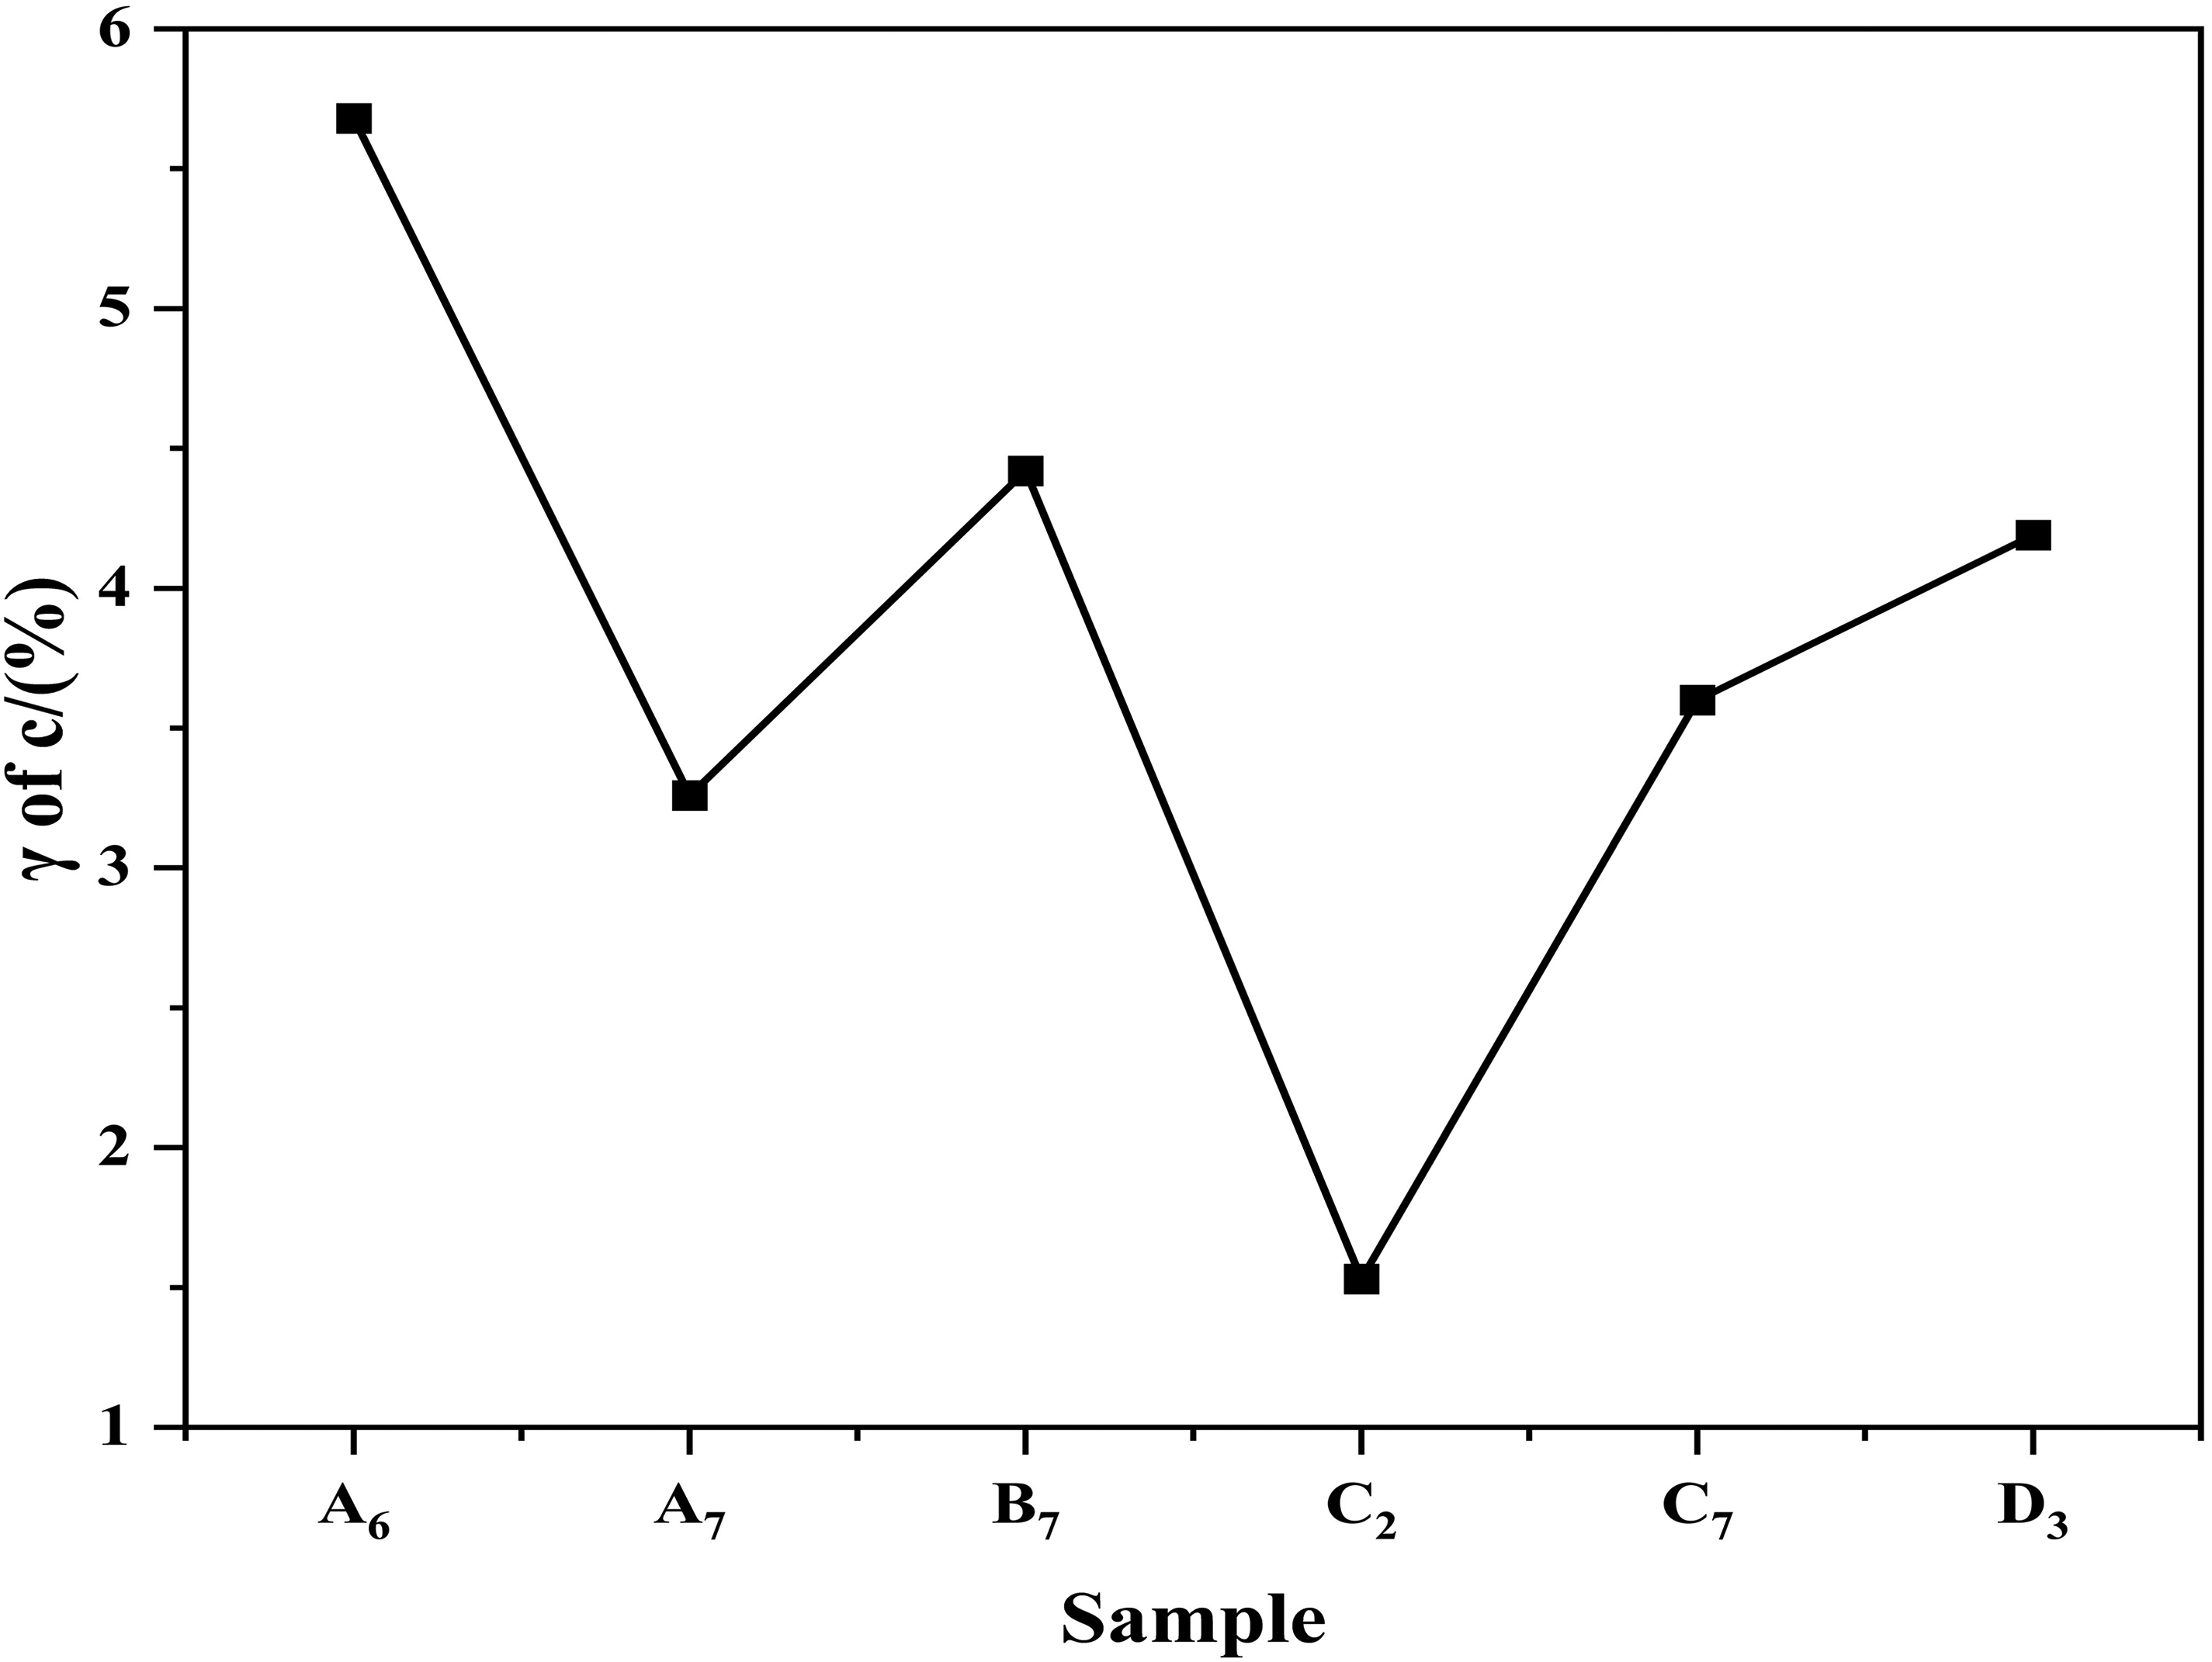
Cohesion c variance rate γ (validation set).
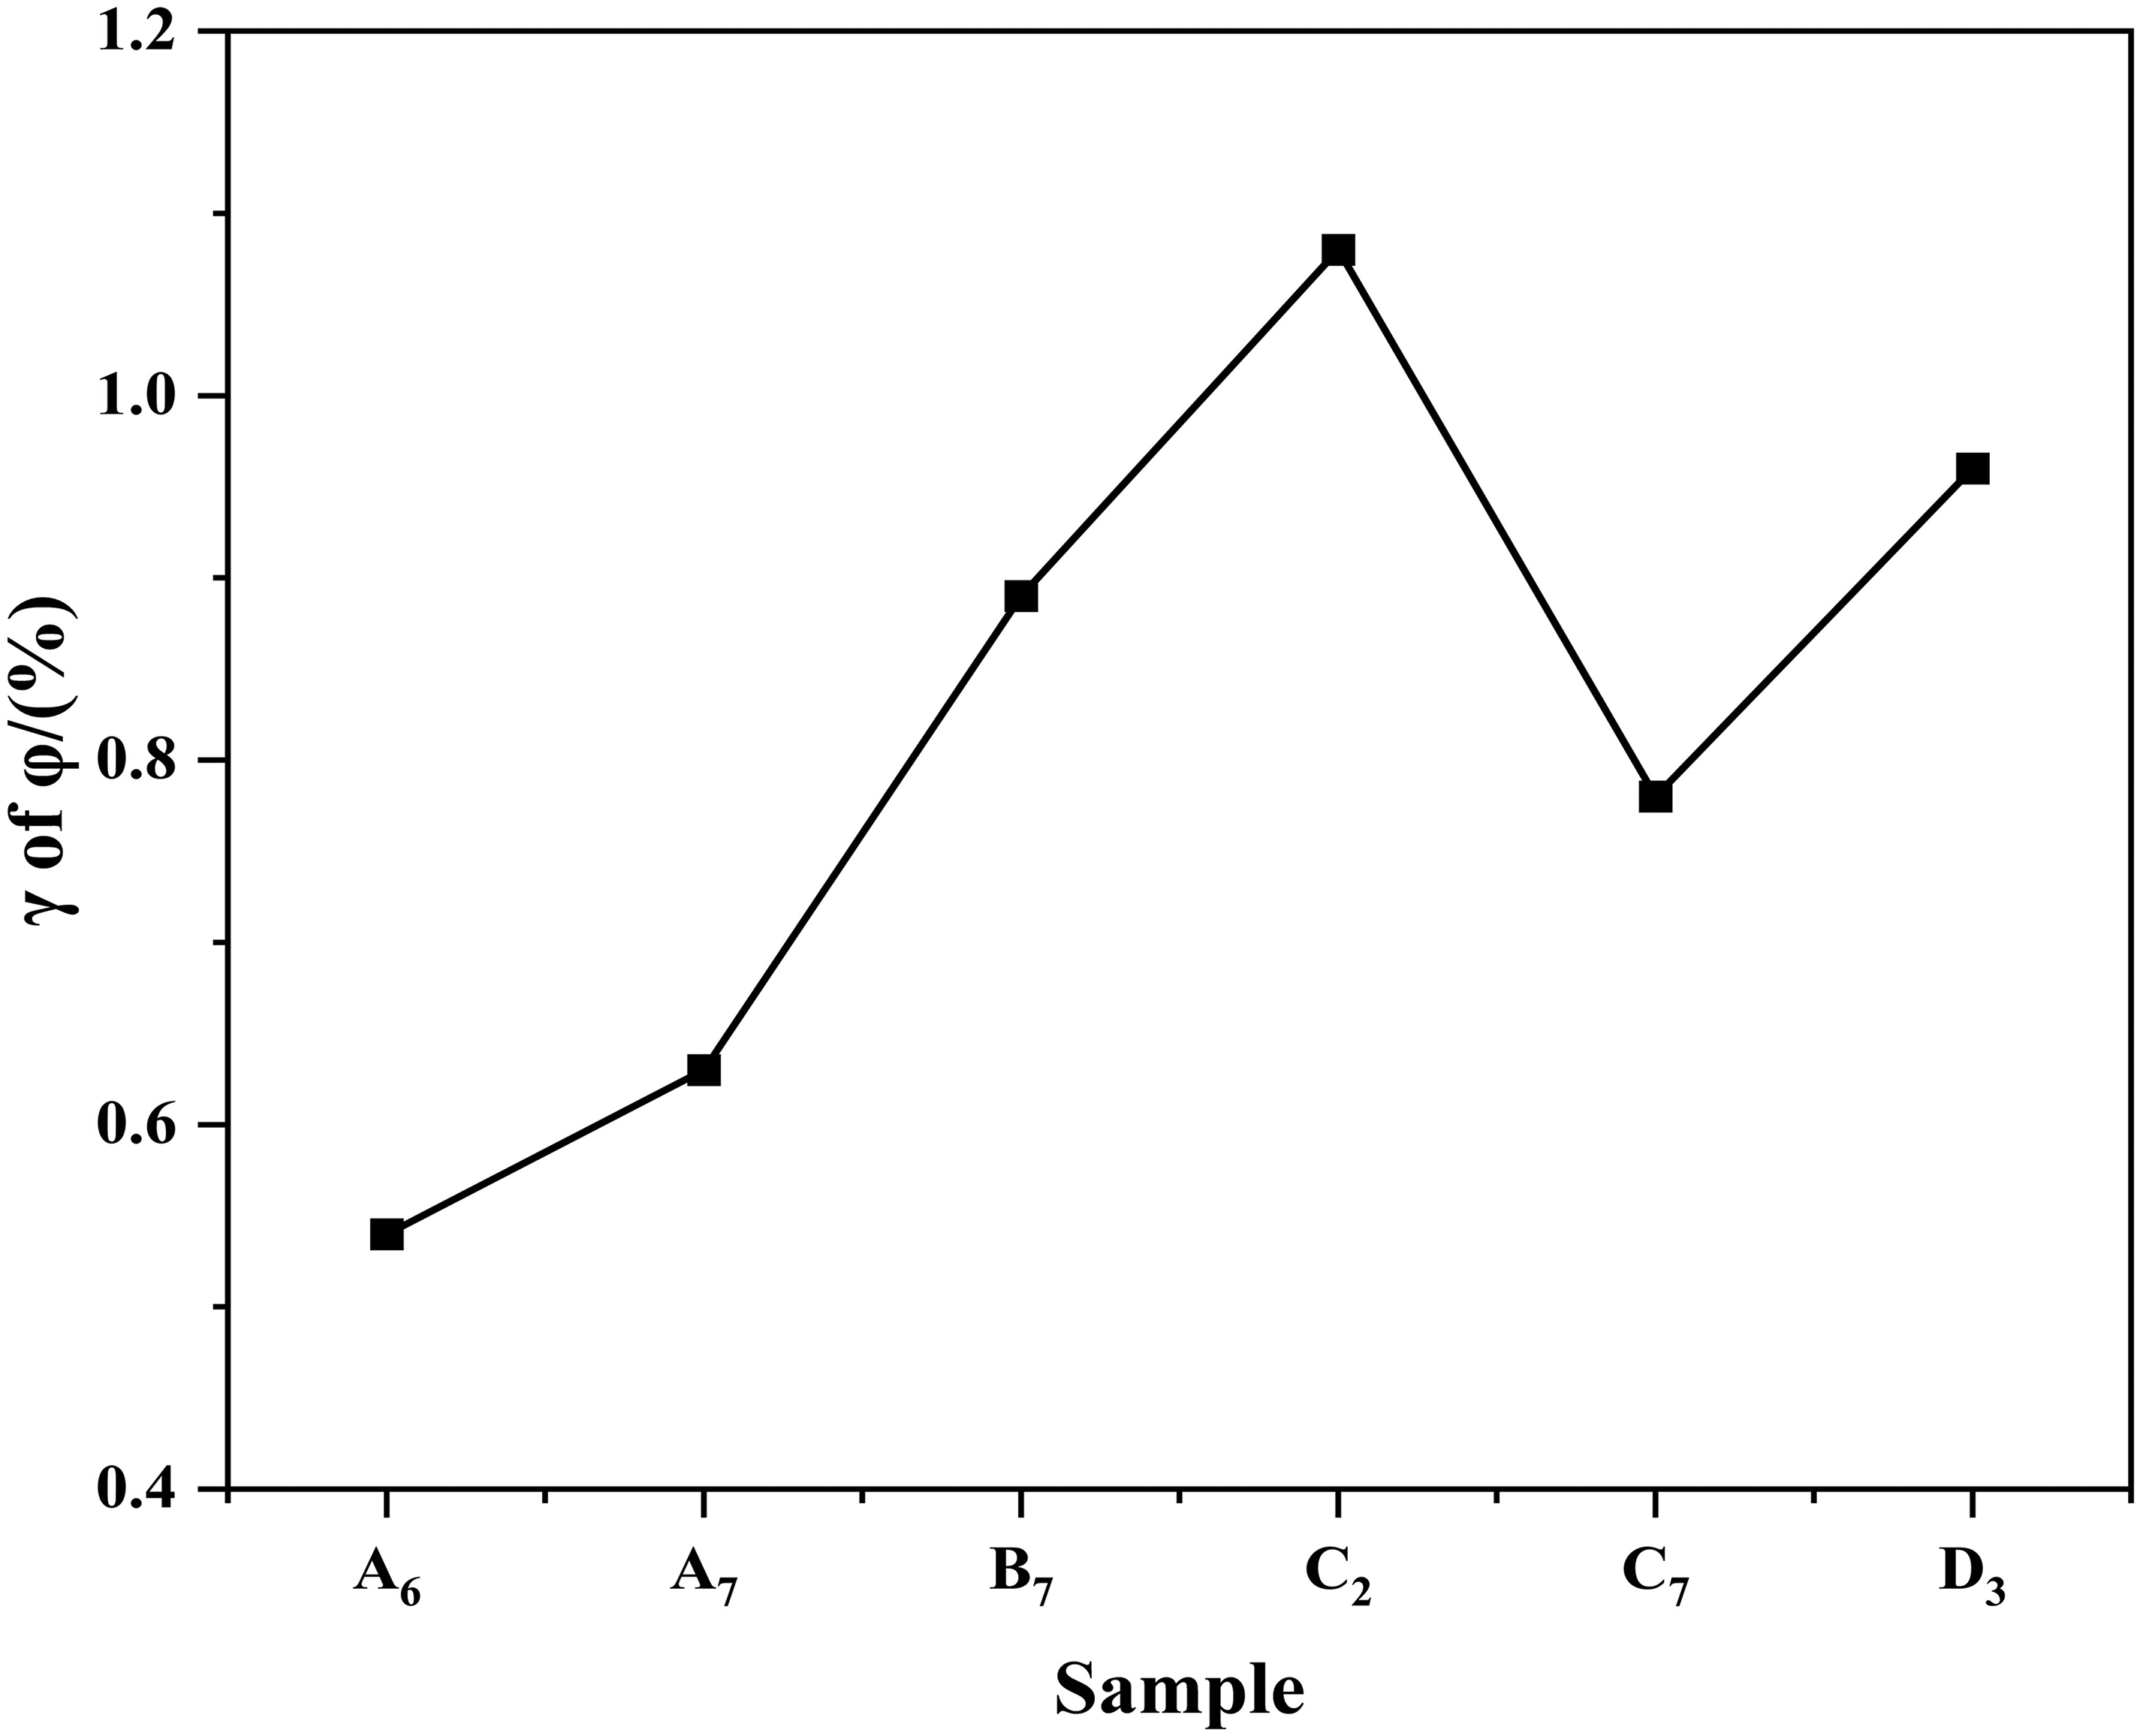
Difference rate γ of internal friction angle φ (validation set).
Based on the above analysis, it can be seen that the relationship model between drilling engineering parameters and rock mechanical parameters established based on the HPO-BP neural network optimization algorithm shows good prediction effect with good generalization ability in the prediction of rock mechanical parameters.
Conclude
This paper uses a shield tunnel excavation simulation drilling test system to conduct indoor rock drilling experiments. Relevant drilling engineering parameters are obtained through drilling detection near the drill bit, and a relationship model between drilling engineering parameters and rock c - φ parameters is established based on the Hunter Optimization Algorithm (HPO) - BP neural network method. The rapid and accurate determination of rock c - φ parameters is achieved, providing a new approach for the determination of rock c - φ parameters.
The difference between the rock mechanical parameters predicted by the model in the validation set and those obtained from the tests is relatively small, and the coefficients of determination R2 for the uniaxial compressive strength UCS, cohesive force c and the angle of internal friction φ are 0.9778, 0.9772, and 0.9817, and the mean values of the difference rates are 1.36%, 3.78%, and 0.81%, which show the model has good predictive effect in the prediction of the rock mechanical parameters, with good generalization ability. The model demonstrates a good prediction effect and generalization ability in predicting rock mechanical parameters;
The relationship model between drilling engineering parameters and rock mechanical parameters established based on the HPO-BP neural network optimization algorithm can accurately predict the rock mechanical parameters, which provides a new idea for the method of determining the rock mechanical parameters. However, due to the small number of model samples and rock samples, it is still necessary to carry out the drilling test of all kinds of rock samples to expand the data samples, and further optimize the accuracy of the model prediction.
Footnotes
Funding
The authors disclosed receipt of the following financial support for the research, authorship, and/or publication of this article: This work was supported by the Scientific Research Project of Hunan Provincial Department of Education, (grant number 23C0131); Open Fund Project of Key Laboratory of Changsha University of Science and Technology (grant number 22KF04).
Declaration of conflicting interests
The authors declared no potential conflicts of interest with respect to the research, authorship, and/or publication of this article.