
Abstract
Due to its ability to address power outages, smart grids are regarded as one of the energy solutions in the modern world. Because they integrate free energy resources into the distribution network and save a significant amount of energy. Electric buses and other electric cars can now be used as both a source of energy and a mode of transportation. In this article, we proposed an integrated decision model for energy management and vehicle routing, which enables the dispatching of electric buses in an adaptive manner to meet transportation and energy demands. This model is the first of its kind, as there is no literature that addresses transportation and energy issues simultaneously, under spatial and temporal complexities, which is the main contribution of this model. This study assumes that the electric bus has various distributed energy resources installed on it, such as a battery and a solar panel. Electric buses use electricity while they travel in order to carry people and deliver energy to other places. A mixed-integer linear programming method has been used to model and solve this problem. This study used performance metrics such as energy expenses, carbon footprints, and traffic volume. The results of the simulation demonstrate that the electric bus network offers greater flexibility when it comes to distributing energy loads among various sites at various times. Since, it can save up to $40,000 in operating costs, reduce
Keywords
Introduction
The proliferation of fossil fuel-powered vehicles in recent decades has released large amounts of CO2, a known greenhouse gas (GHS), into the atmosphere. Since transport-related emissions account for almost three quarters of total emissions International Energy Agency (IEA) (2016). In 2014, the transport sector was the second largest emitter of GHGs, contributing 23% (International Energy Agency (IEA), 2016; Xiao et al., 2019) of global CO2 emissions. Several models of fuel/emission-centric driving problem have been developed to optimize the balance of financial costs and environmental aspects of fossil fuel vehicles. Kara et al. (2007) proposed emission-based time-dependent vehicle routing problem (VRP), Bektaş and Laporte (2011) proposed the pollution routing problem, Xiao et al. (2012) proposed the fuel consumption, Yang and Sun (2015) proposed the low-carbon problem, and Xiao and Konak (2015) proposed environmentally friendly vehicle route and management.
Electric vehicles (EVs) can produce more traffic-related emissions under stricter regulation. There are significant emission limits, so switching from gasoline or diesel to electricity will reduce emissions. The introduction of battery vehicles into regional public transport is a great opportunity. A study by Chang and Chung (2018) shows that the Taiwanese government and 2050 CO2 emission targets can be achieved by promoting the use of plug-in hybrid EVs (PHEVs) and establishing a distribution system of CO2 emission permits. China is aggressively promoting the electrification of public transport buses to minimize carbon emissions (CO2) (Mao et al., 2020). Song et al. (2018) concluded that public electric buses can significantly reduce GHG emissions from public transport, especially when using clean electricity. To reduce GHG emissions and improve air quality, Taiwan plans to introduce 10,000 electric buses (EBs) over the next decade (Leou and Hung, 2017).
Since EVs have limited driving range and inconvenient charging during trips, the biggest challenge for exact optimization algorithms (such as mixed-integer programming) is figuring out how charging station visits are factored into route optimization. Conrad and Figliozzi (2011) were the first to simulate the recharging vehicle routing problem by assuming that EVs with a limited operating radius are allowed to charge at certain customer points to complete deliveries. Erdoğan and Miller-Hooks (2012) introduced the green VRP (GVRP), which requires the use of “alternative energy vehicles” in a set of vehicles that must stop at alternative gas stations. A study by Felipe et al. (2014) modeled the electric VRP (EVRP) by examining different battery charging methods, each associated with a fixed unit cost and a constant charging rate. The relationship between daily driving, conventional charging and fast charging was investigated by Neaimeh et al. (2017) using multiple regression analysis and found that fast charging has a greater effect. The long-range UltraCommuter EV developed by the University of Waikato is specifically mentioned in the Duke et al. (2009) article on EV opportunities in New Zealand.
The GVRP considers the impact on the environment and is based on the traditional VRP. Kara et al. (2007) proposed the energy minimization VRP (EMVRP) as a clever expense capability that considers both vehicle distance and burden. Their model, in any case, could not satisfactorily mirror a vehicle’s real energy use since it did not represent speed or other impacting factors. As a result, Bektaş and Laporte (2011) recommended a contamination-directing issue to consolidate the functional costs of drivers and fuel utilization to reduce GHG outflows. Demir et al. (2012) utilized their discoveries to advance vehicle speed in each circular segment of courses between succeeding hubs, bringing down fuel utilization expenses and driver compensation much further. They also utilized a versatile huge area search heuristic to handle the issue. Ehmke et al. (2016) focused on reducing CO2 outflows in metropolitan conditions with variable and time-subordinate vehicle speeds due to traffic. Given the restricted tank limit, Zhang et al. (2020) and Ren et al. (2020) reduced all fossil fuel by-products. Shi et al. (2020) made a vigorous streamlining model for a vehicle direction issue with synchronized visits and flighty situations considering ozone harming substance emanations in that review. A method for reducing CO2 emissions through supply chain management was proposed by determining depot opening decisions, vehicle allocation, and path design in such a stochastic location by Araghi et al. (2021).
The EVRP, which dissects the use of EVs in coordinated operations dissemination, is one of the latest expansions of VRPs. Conrad and Figliozzi (2011) were quick to apply exemplary VRP to EVRP, proposing the RVRP model, which places that EVs in an armada are approved to re-energize at specific client areas. A review by Schneider et al. (2014) recommended an EVRP model with time windows limits, expecting that the battery consumes at a steady rate (a straight capability of the traveled distance) and re-energizes at a consistent rate (how much charged electrical energy is corresponding to the charging time). Felipe et al. (2014) showed the EVRP with some charging innovations. In their charging mode, there are two parts to the charging time: a fixed charging time connected to the innovation picked, and a variable charging time that is straightly relative to the amount of energy to be re-energized. Different types of EVs with shifting limits, estimating and re-energizing rates were utilized by Hiermann et al. (2016) to copy the EVRP (i.e. constants). Keskin and Çatay (2016) utilized incomplete re-energize calculations to develop a versatile huge area scan calculation for the EVRPTW. Schiffer and Walther (2017) utilized a period window and a fractional re-energizing procedure to demonstrate the electric area steering issue. Moreover, EVRP models based on the battery trading have been made in various applications to be rapidly recharged (Yang and Sun, 2015). Xiao et al. (2019) utilized the energy/power utilization rate to demonstrate the EVRPTW.
Traffic is considered one of the main problems in the latest urban communities and is a predominant explanation of energy waste (Gallet et al., 2018). In addition, traffic has a negative impact on the environment because it causes tens of thousands of vehicles to stand in line and burn fuel while waiting. As a result, more pollutants (such as CO2, NO2, etc.) are released into the environment. In addition, traffic is one of the leading causes of commotion contamination, which negatively influences the well-being of networks and the nature of life (Pathak et al., 2008). Furthermore, traffic financially affects people’s lives, for example, time squander, and agreeing to Arnott and Small (1994) it is assessed that a sum of 6 billion hours are squandered yearly because of traffic in the US alone.
A review by Shirazi et al. (2015) shows the way that the EB battery can supply energy to the power framework by means of vehicle-to-grid (V2G) innovation to maintain feasible and reliable electrical energy for end clients. Through V2G, EBs are able to provide non-economic services to the grid and serve as emergency power backup units. Yang et al. (2015) proposed a blended number direct programming (mixed-integer linear programming—MILP) model to work on the productivity of energy supply to structures in a locale scale DER to reduce the all out costs. A review by Li et al. (2016) introduced a multi-objective MILP model to upgrade a DER framework in a local area with private and business places, consequently reducing by and large costs and diminishing the impact of CO2. A momentary model with a two-step approach was introduced by Gutiérrez-Alcaraz et al. (2015) to investigate and design the tasks of sustainable power assets. Sustainable energy sources have also been shown to decrease ecological pollution (Tsikalakis and Hatziargyriou, 2007). Zakariazadeh et al. (2014) presented a reasonable model for an interest reaction in the executives framework to upgrade the tasks of DER. Energy capacity assumes a huge part to guarantee that the framework works in a more steady and dependable way (Hill et al., 2012). According to Chen et al. (2011), a keen power the executives framework is acquainted with upgrade the working techniques of battery stockpiling in the microgrid. According to Ho et al. (2016), multi-scale working models are proposed to examine the exhibition of energy stockpiling procedure on various time scales, like day to day, week after week, etc.
The adoption of V2G is hampered by the stability and efficacy of power grids (PGs), energy transaction methods between vehicles, and the lack of settings to actually put the idea into practice. Improvement techniques for V2G operation (Tan et al., 2016) have been made recently to address possible impediments to module half-breed EVs (PHEVs) and the V2G concept (Sovacool and Hirsh, 2009). Furthermore, to improve the stability, efficiency and dependability of the PG (Yilmaz and Krein, 2012). Aghaei et al. (2016) contribution talked about coordinating the charging/release of enormous amounts of PHEV/EV and their capabilities.
In the previous literature, VRP or EM models were introduced to simulate and find optimal solutions for the routing problem and the power transmission problem separately. To the authors’ knowledge, there is no study that presents a joint decision model to simultaneously find optimal solutions for both VRP and EM. Therefore, this article builds a joint decision-making model for energy management and vehicle routing that enables energy sharing between different locations in the transportation and energy supply units network (TESU) network, ensuring energy security, cost efficiency, reducing traffic, and CO2 emissions. As the concept of sustainability gains support with the growing importance of visible and customer-oriented services, this study looks at energy costs, environmental sustainability, and traffic aspects in line with industrial practices as optimization objectives. This work and its most important contribution can be summarized as follows:
The decision model of the TESU, which is spatially and temporally collaborative, is designed to jointly enable a more flexible energy distribution between different locations and meet the transportation needs of the public. The aim is to minimize three practical objectives: the total cost of electricity produced by thermoelectric generators (TGs), the price of energy purchased from the network, and the price of carbon dioxide emissions. It also increases the likelihood that passengers will choose EB instead of driving their own vehicle to meet their mobility needs. Consequently, reducing passenger transport and CO2 emissions and vehicles. Transportation demand is a complex task because the number of EB passengers at each time step is stochastic and must be carefully accounted for at each time step along the EBs route. Passenger pickup and drop-off data is collected based on the number of people visiting each location. That information is then fed into a decision model to find optimal solutions that satisfy both the transport needs of passengers and the supply of excess energy to buildings in different locations. The energy exchanged between buildings (locations) and EB is studied and evaluated in different scenarios using different performance metrics, including total energy costs at different locations, CO2 emissions, and traffic levels. Numerical experiments show that an energy supply system containing only renewable energy sources, fixed in certain areas, can reduce energy costs in the distributed areas of the cluster, but on the other hand, it causes an increase in traffic and carbon dioxide emissions. In addition, diesel bus systems can meet energy and transportation needs, but at higher costs. The common form, on the other hand, ensures a sustainable energy supply, satisfying transport needs at low costs, and environmental protection.
The rest of this article is laid out as follows. We define the problem and its mathematical programming formulation in the “System architecture” section. The “Simulation results analysis” section contains the findings of the computational trials. Finally, the “Conclusion and future work” section examines the findings and potential future study.
System architecture
In the “System layout for TESU network” section, the layout of the system to model the TESU is introduced, and the mathematical model to simulate the operation of the TESU decision problem is explained in the “Methodology” section.
System layout for TESU network
In this article, we concentrate on Al-Fara’a in Abha, Saudi Arabia, which incorporates a few crucial offices like air terminal, college grounds, clinical city, hospitals, etc. Several arcs (roads) connect each of these facilities, forming a network of vertices (see Figure 1) where the length of each circular segment is believed to be 1 mile (1.6 km). Every area addresses either a structure, a parking structure, a parking area, or a bus station, and that implies that every area might have an energy interest. For reason, Figure 1 shows that there are 10 areas and four EBs. The energy administration in these areas is supposed to be done by EBs, TGs, or the PG. In addition, every EB will ship travelers between various areas to reduce energy cost and traffic. Every EB is viewed as outfitted with numerous DERs, such as breeze turbine generator (WT), photovoltaic (PV) board, and energy stockpiling. The WT and PV batteries are fitted on the top of every EB, although the energy stockpiling is the EB battery. Every choice will be made at each time stride (e.g. 60 min), and the grouping of choices is summarizing to one day (e.g. 24 h).
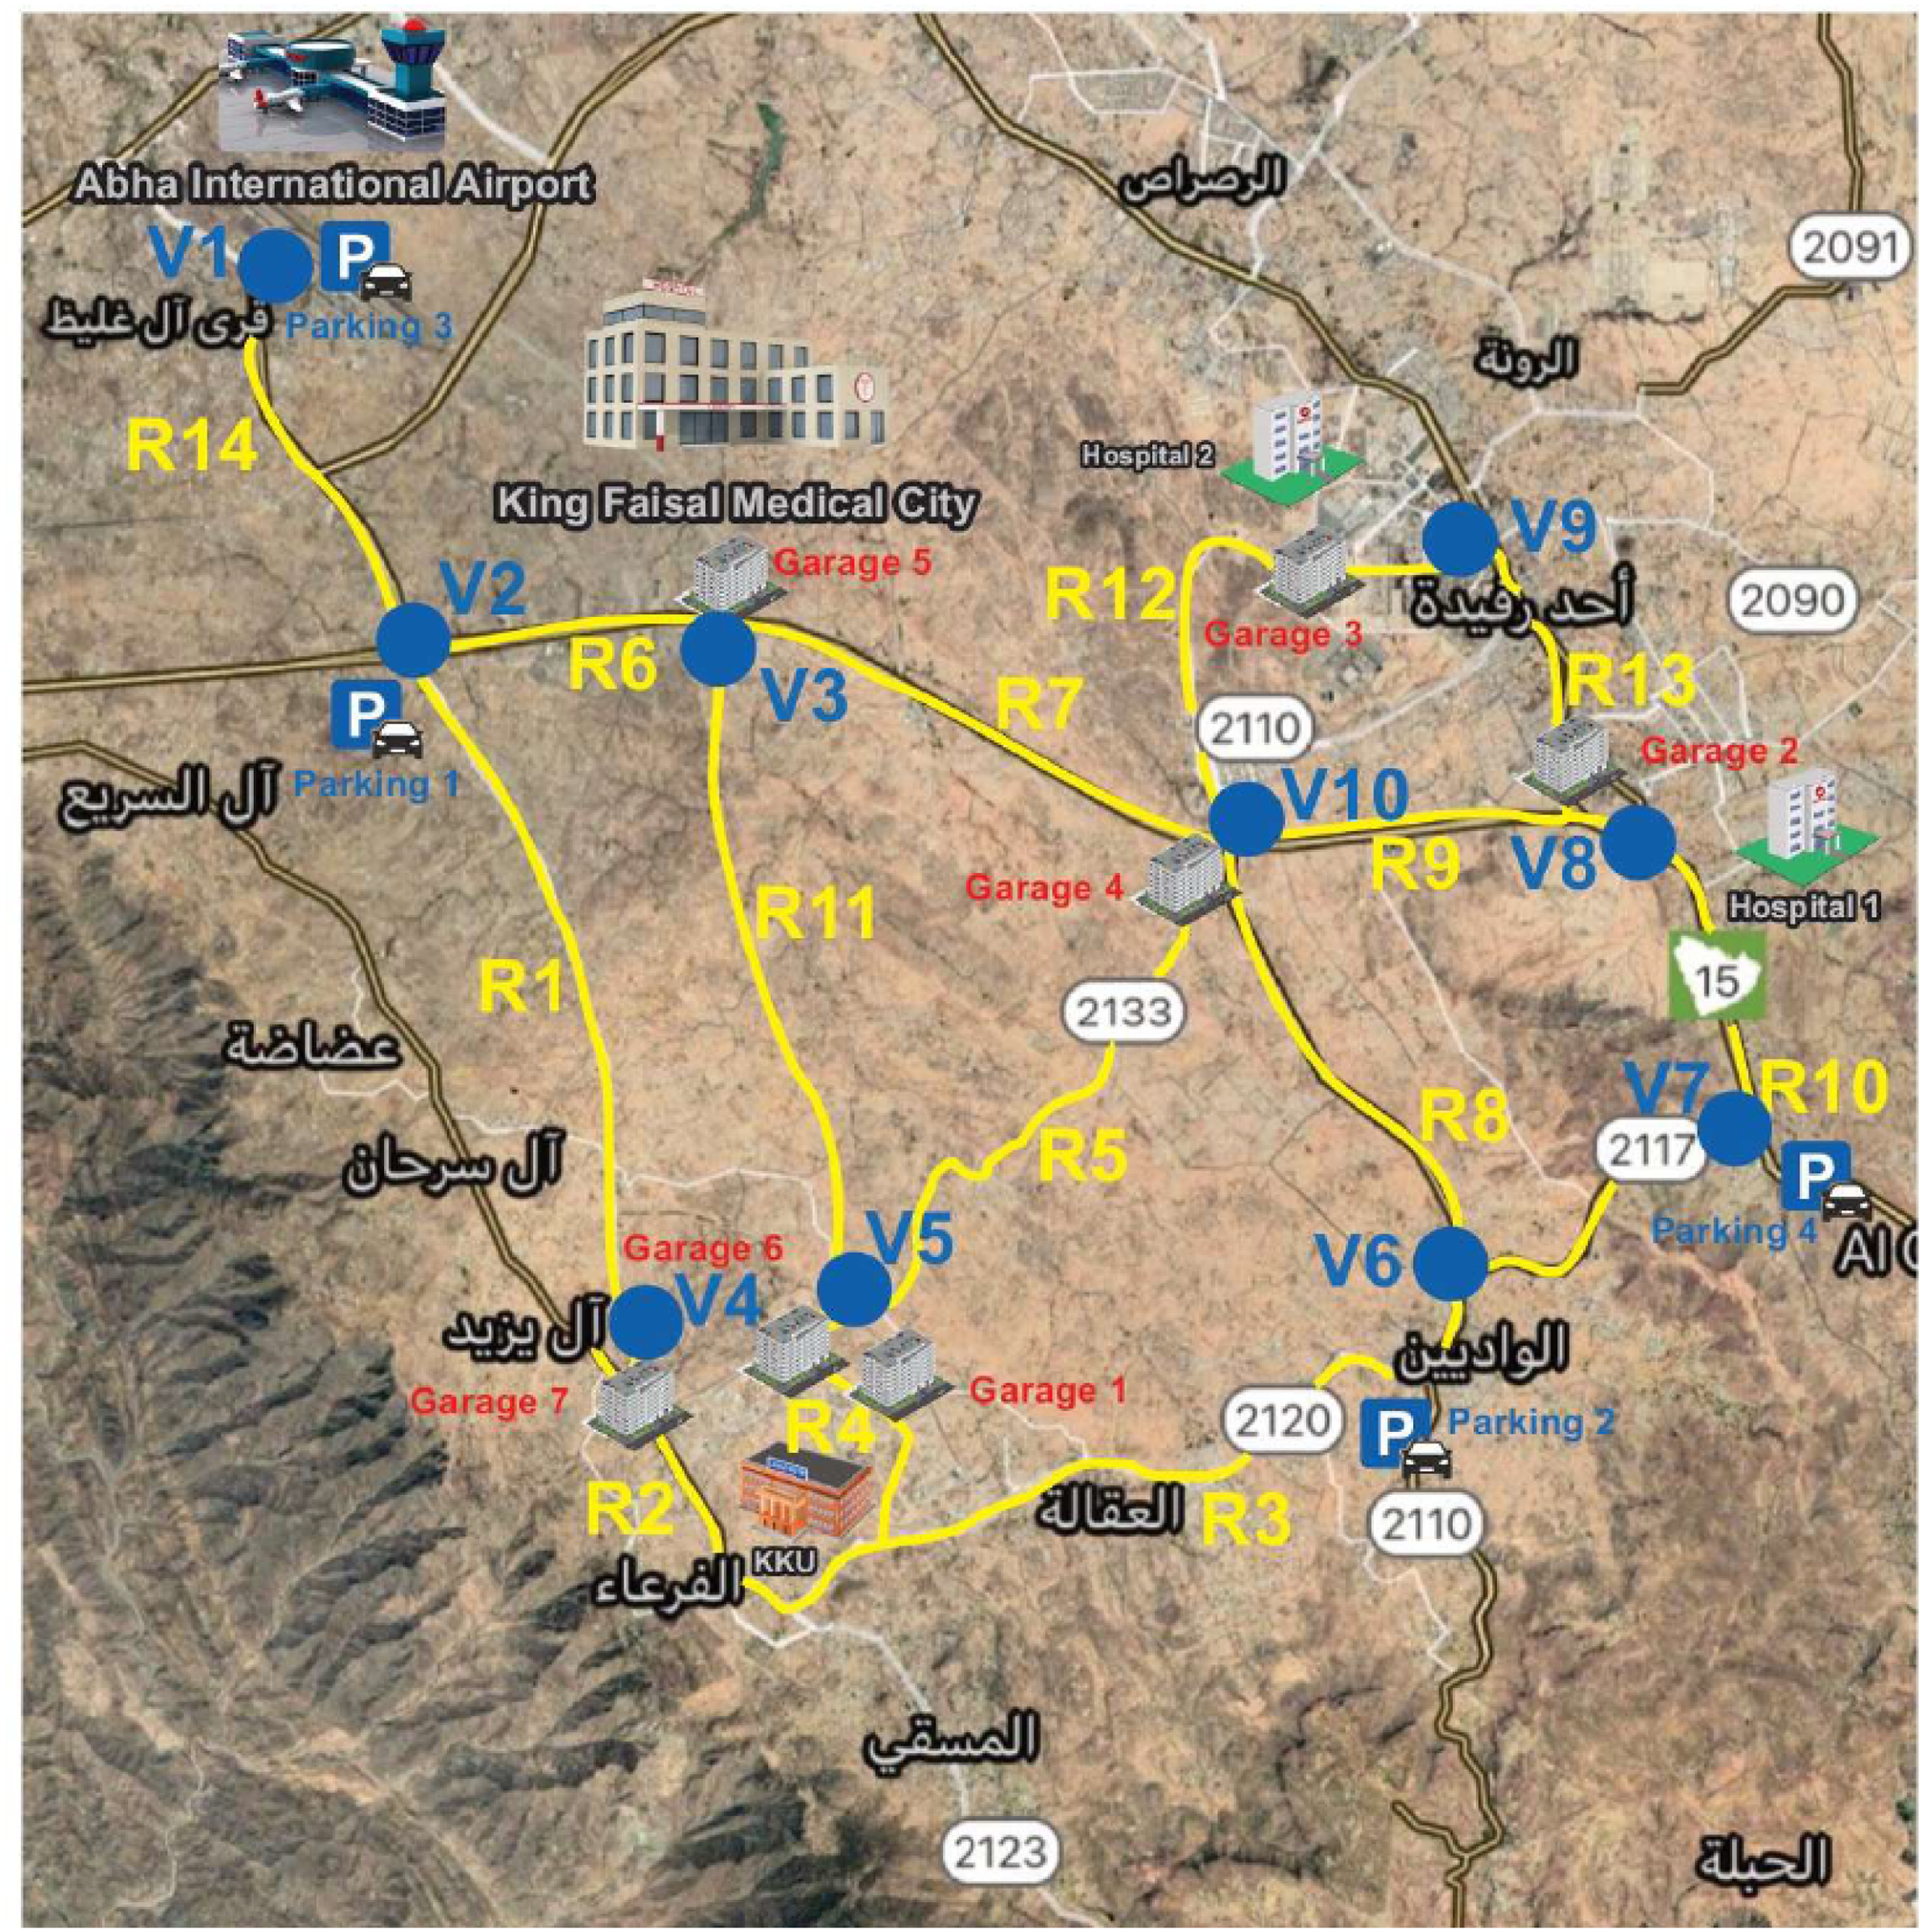
Transportation and energy supply units network (TESU) system architecture.
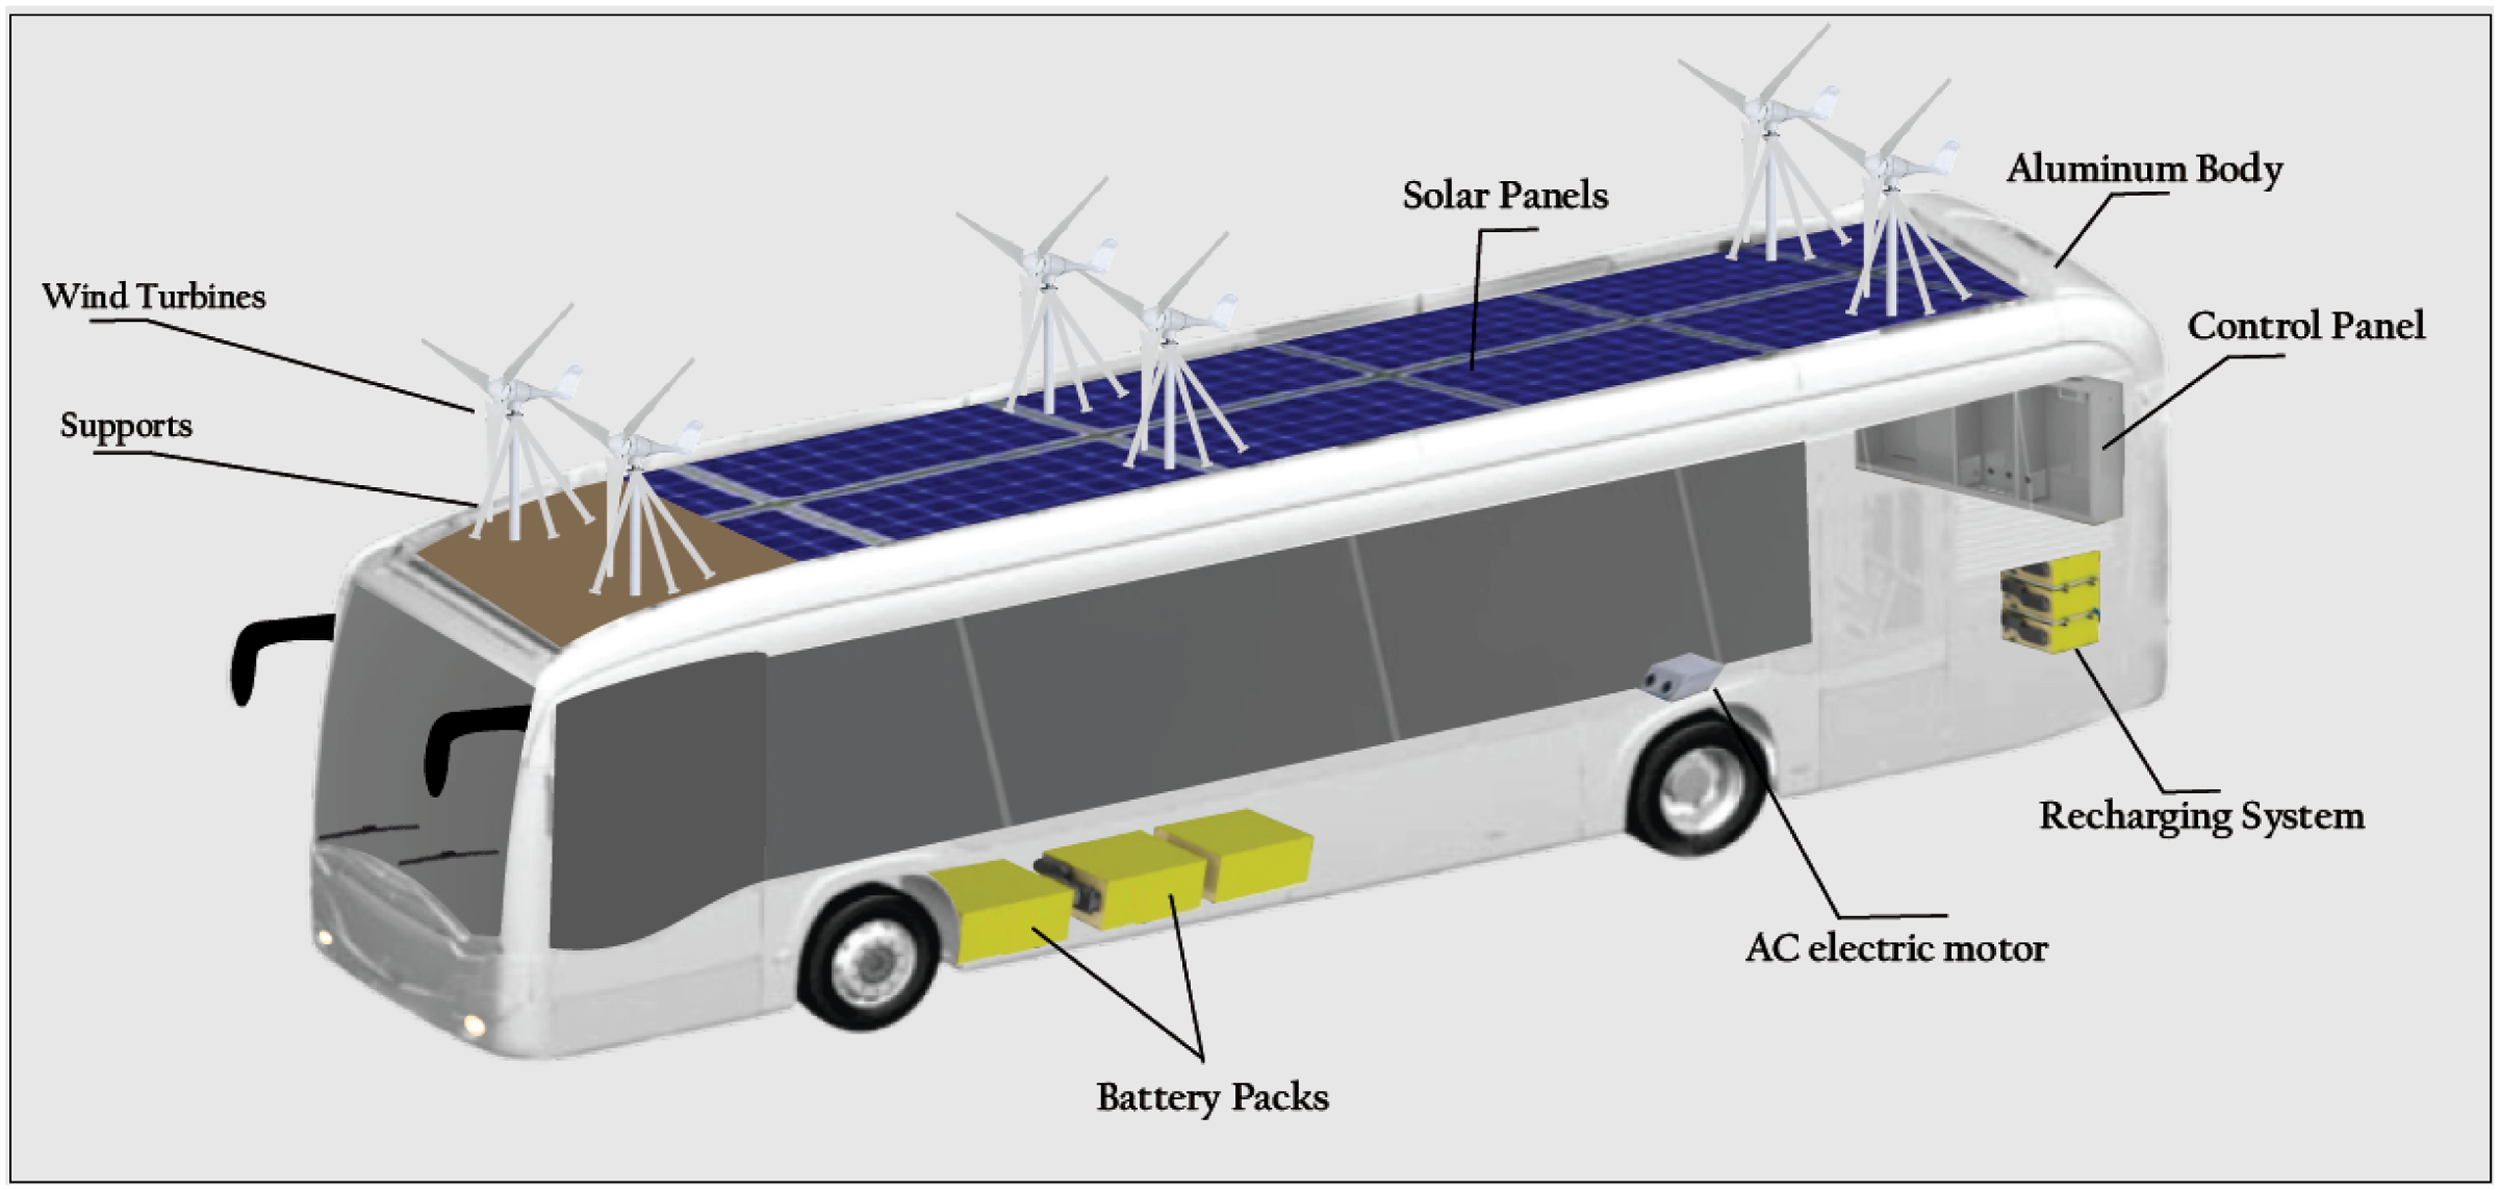
Figure 2 shows a drawing of the TESU components (EB equipped with renewable energy resources) including PV panels, WT generator, and a battery. This enables EBs to share the energy stored in their battery at any location to contribute to reducing the energy costs along with carbon emissions and traffic. However, its primary task is to transport passengers between different locations to reduce traffic.
Given the energy loads and sun-based irradiance profiles of every area, the EBs will go among various areas in a powerful manner to move travelers and to supply energy among various areas at various time spans. In this article, it is expected that every EB can pick up/drop off travelers in its ongoing area. Likewise, every EB is expected to conduct energy exchanges in its ongoing area. The energy heap of every area will be fulfilled utilizing the EB in that area. If this is not the case, the vertex or location will make use of its TG or acquire power from the PG. In addition, every EB can charge its battery by using a charging station located in every area.
Transportation and energy supply units network (TESU) system architecture.
Methodology
In this part, The methodology used to solve this problem starts by collecting the energy loads data from Alqahtani and Hu (2020). Then, the model for TESU is developed as a MILP as shown in the section. After that, the model is implemented using cplex software to find the optimal solutions for energy transactions in the network. The MILP model is tested in five different cases as follows:
Different carbon pricing, where each ton of CO2 has a different price. Different types of passenger vehicles, where each passenger has a vehicle that runs on different types of fuels. Different seasons. The solar irradiance and wind speeds are different in different seasons (fall, winter, spring, and summer). Different bus capacities, where each EB has different number of seats for passengers. Different traffic conditions. The performance of the MILP model under different traffic conditions (light, medium, and heavy traffic).
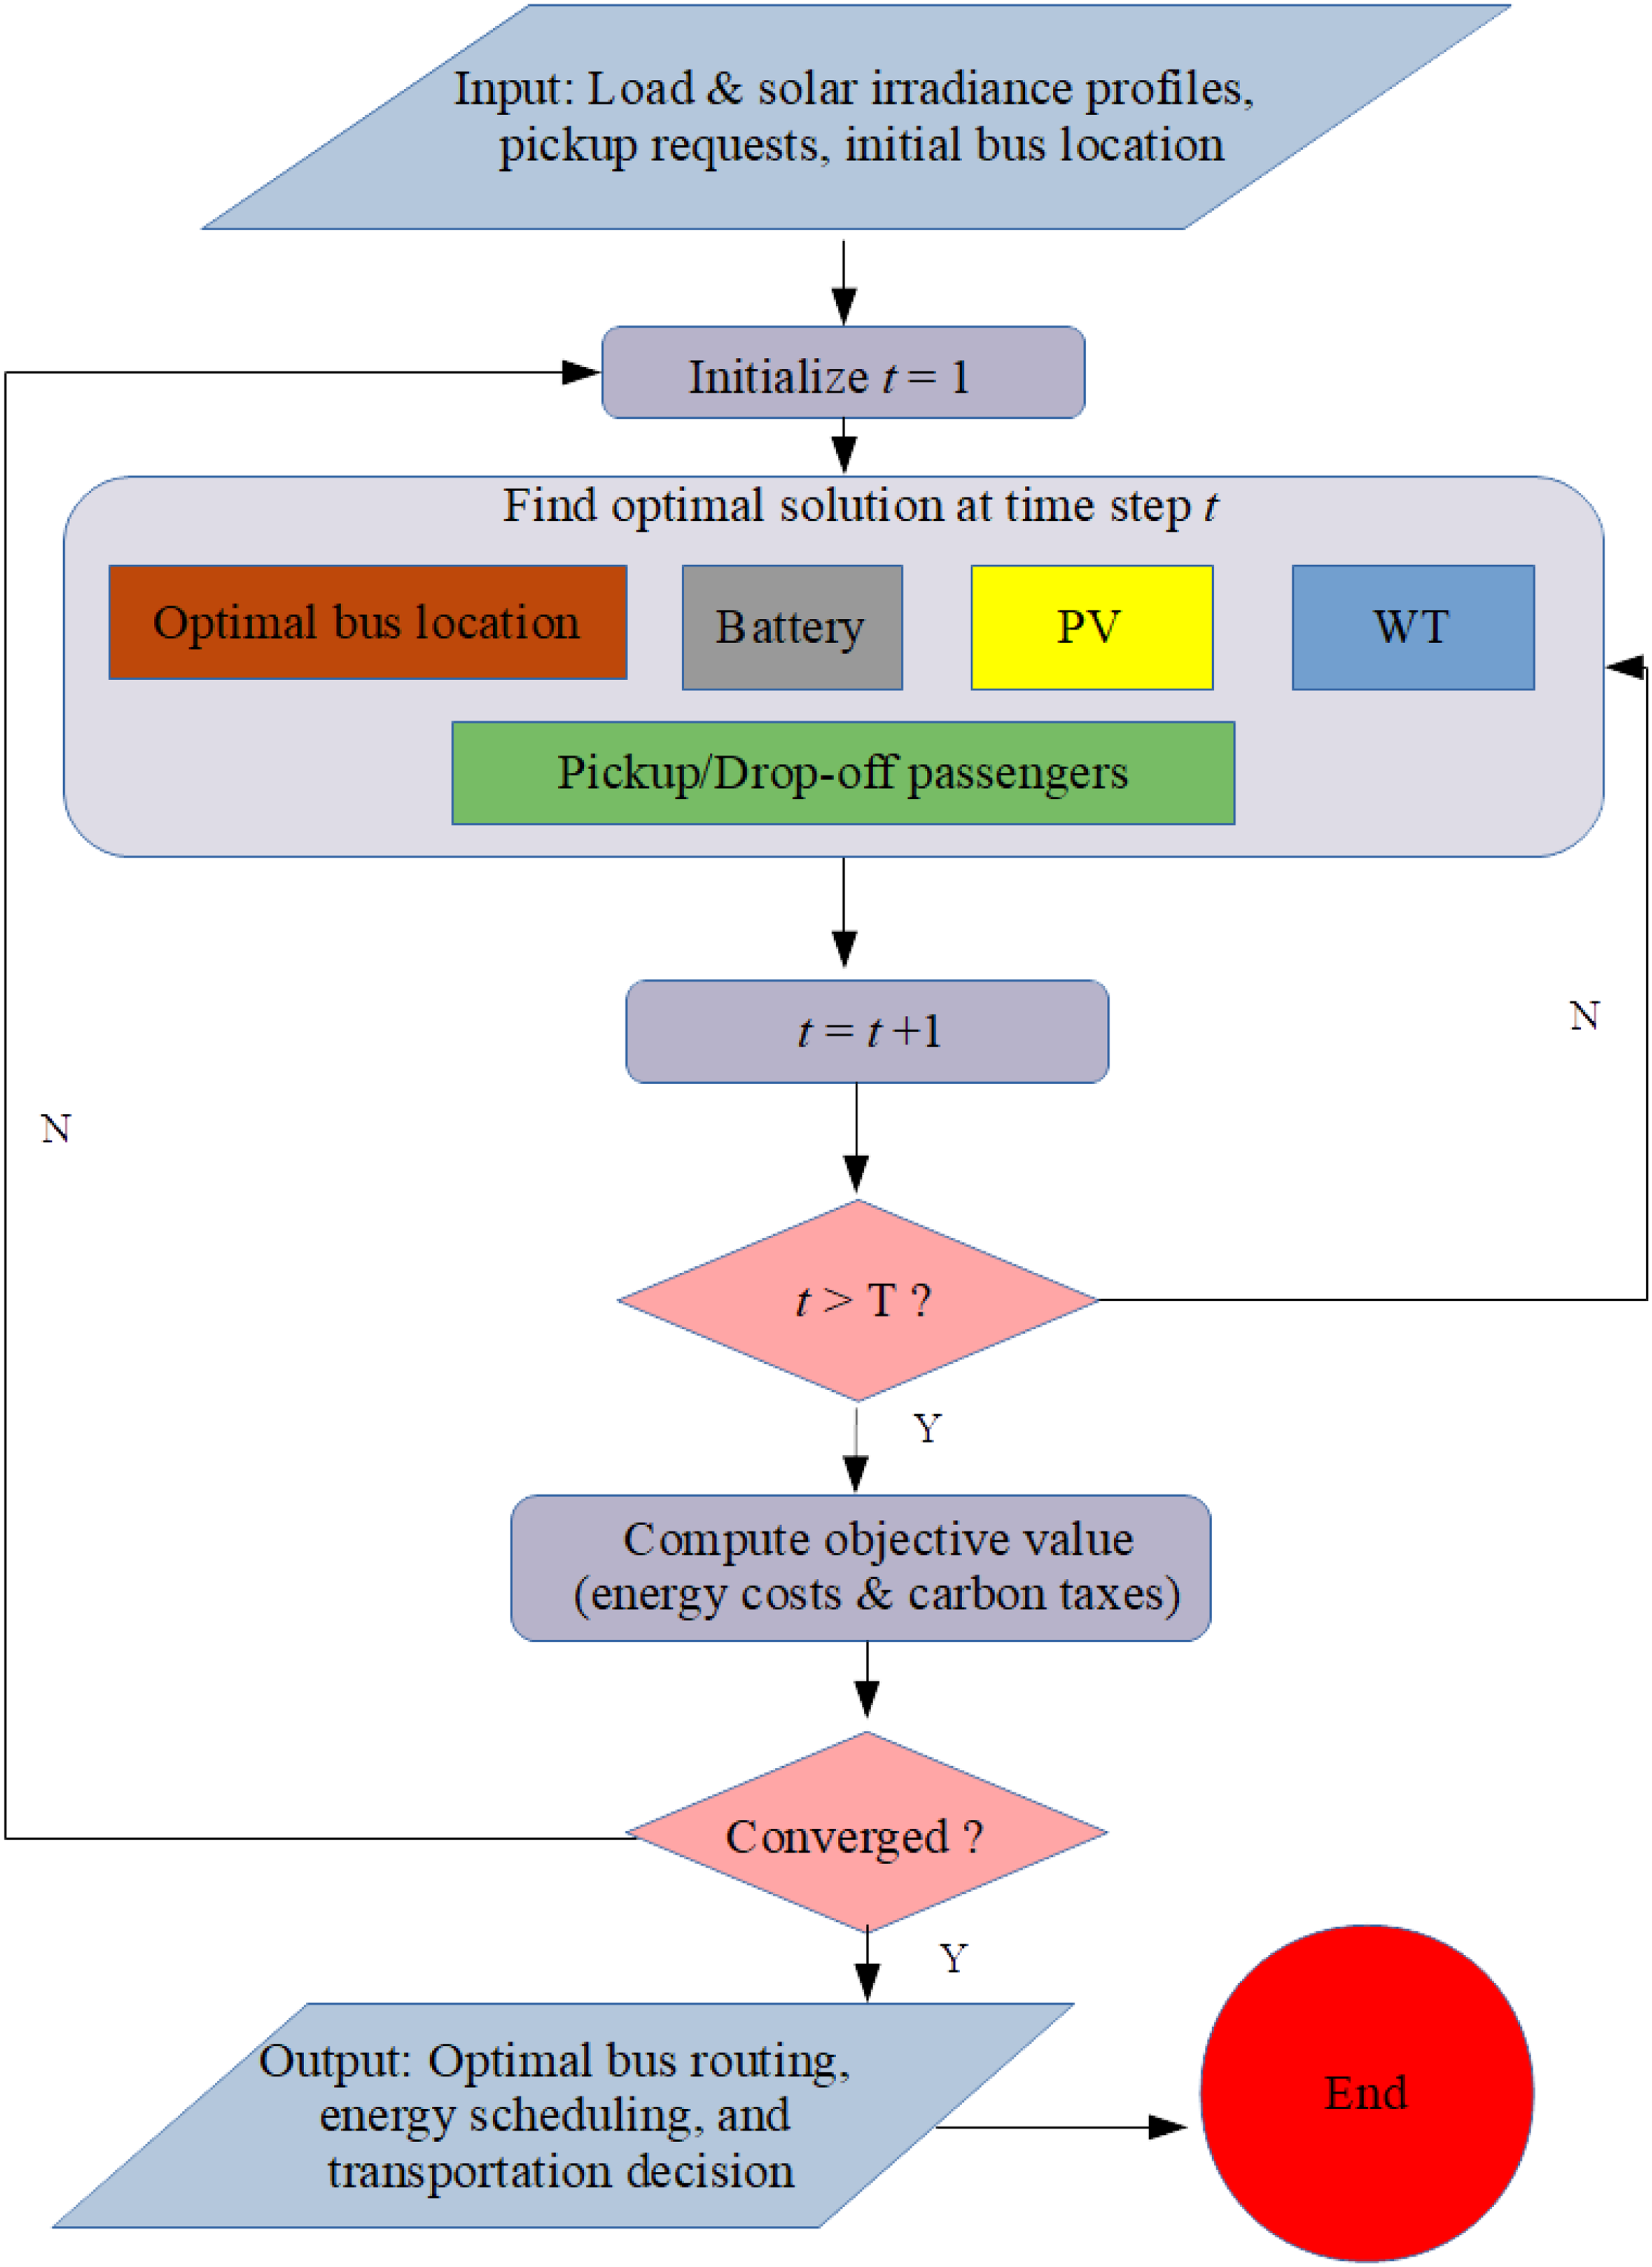
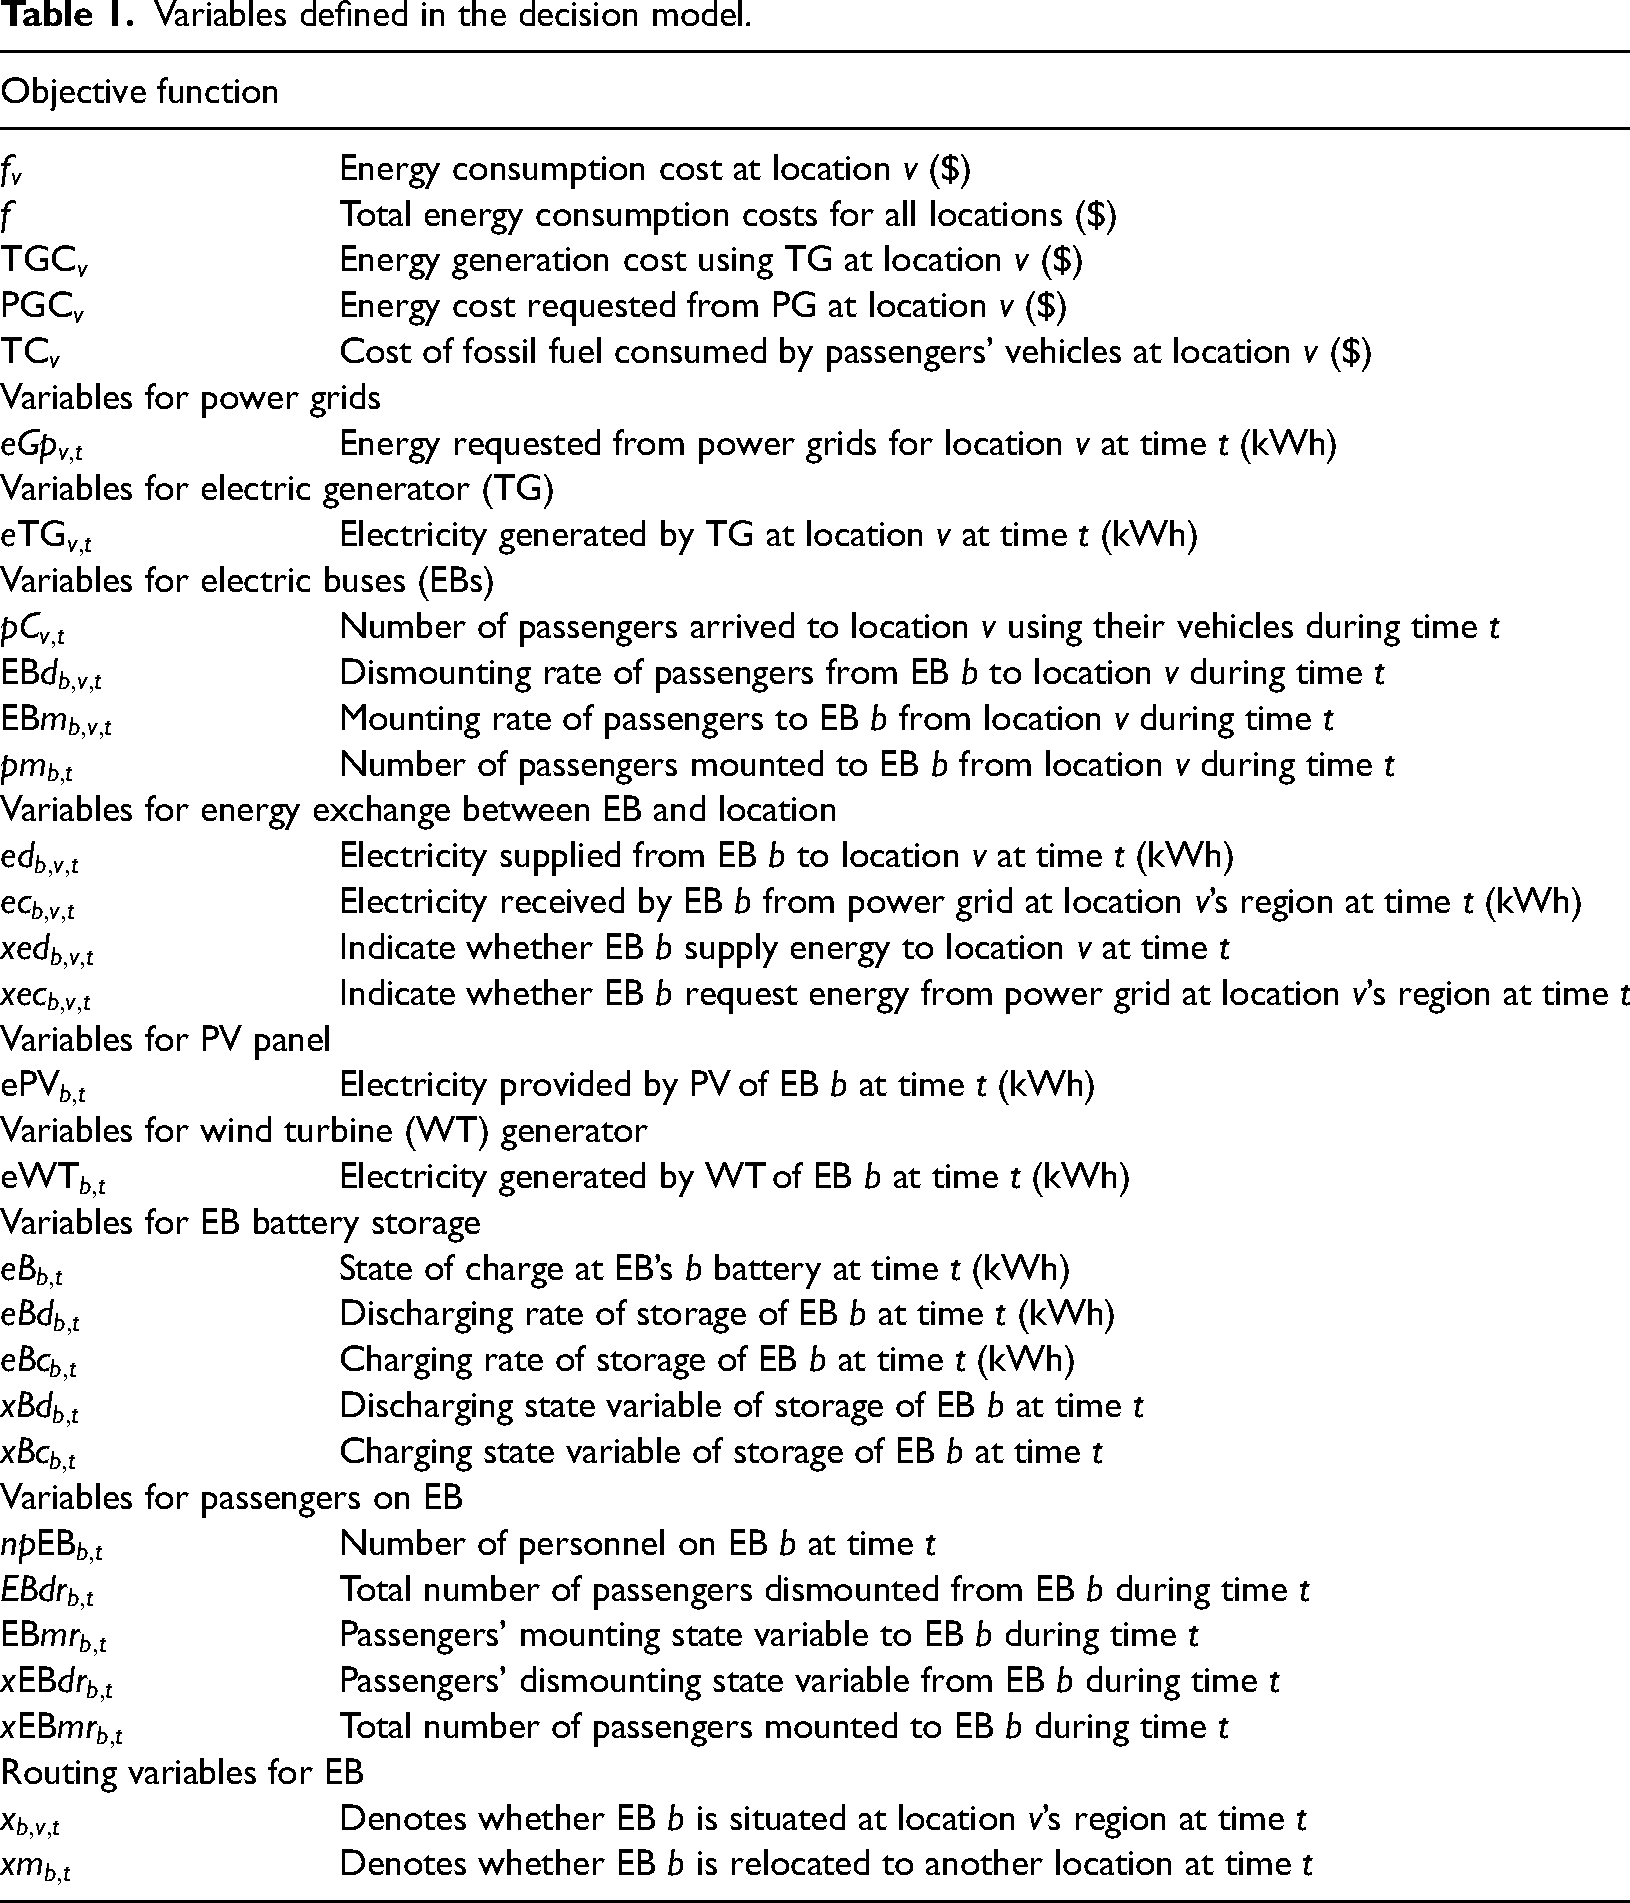
Figure 3 shows the decision-making process for integrated vehicle routing and energy management. The model works in cycles to find optimal hourly decisions for vehicle routing and energy management over a 24-hour decision time horizon. Tables 1 and 2 summarize all the decision variables and parameters defined in the proposed mathematical model, respectively.
Framework of the transportation and energy supply units network (TESU) system.
Variables defined in the decision model.
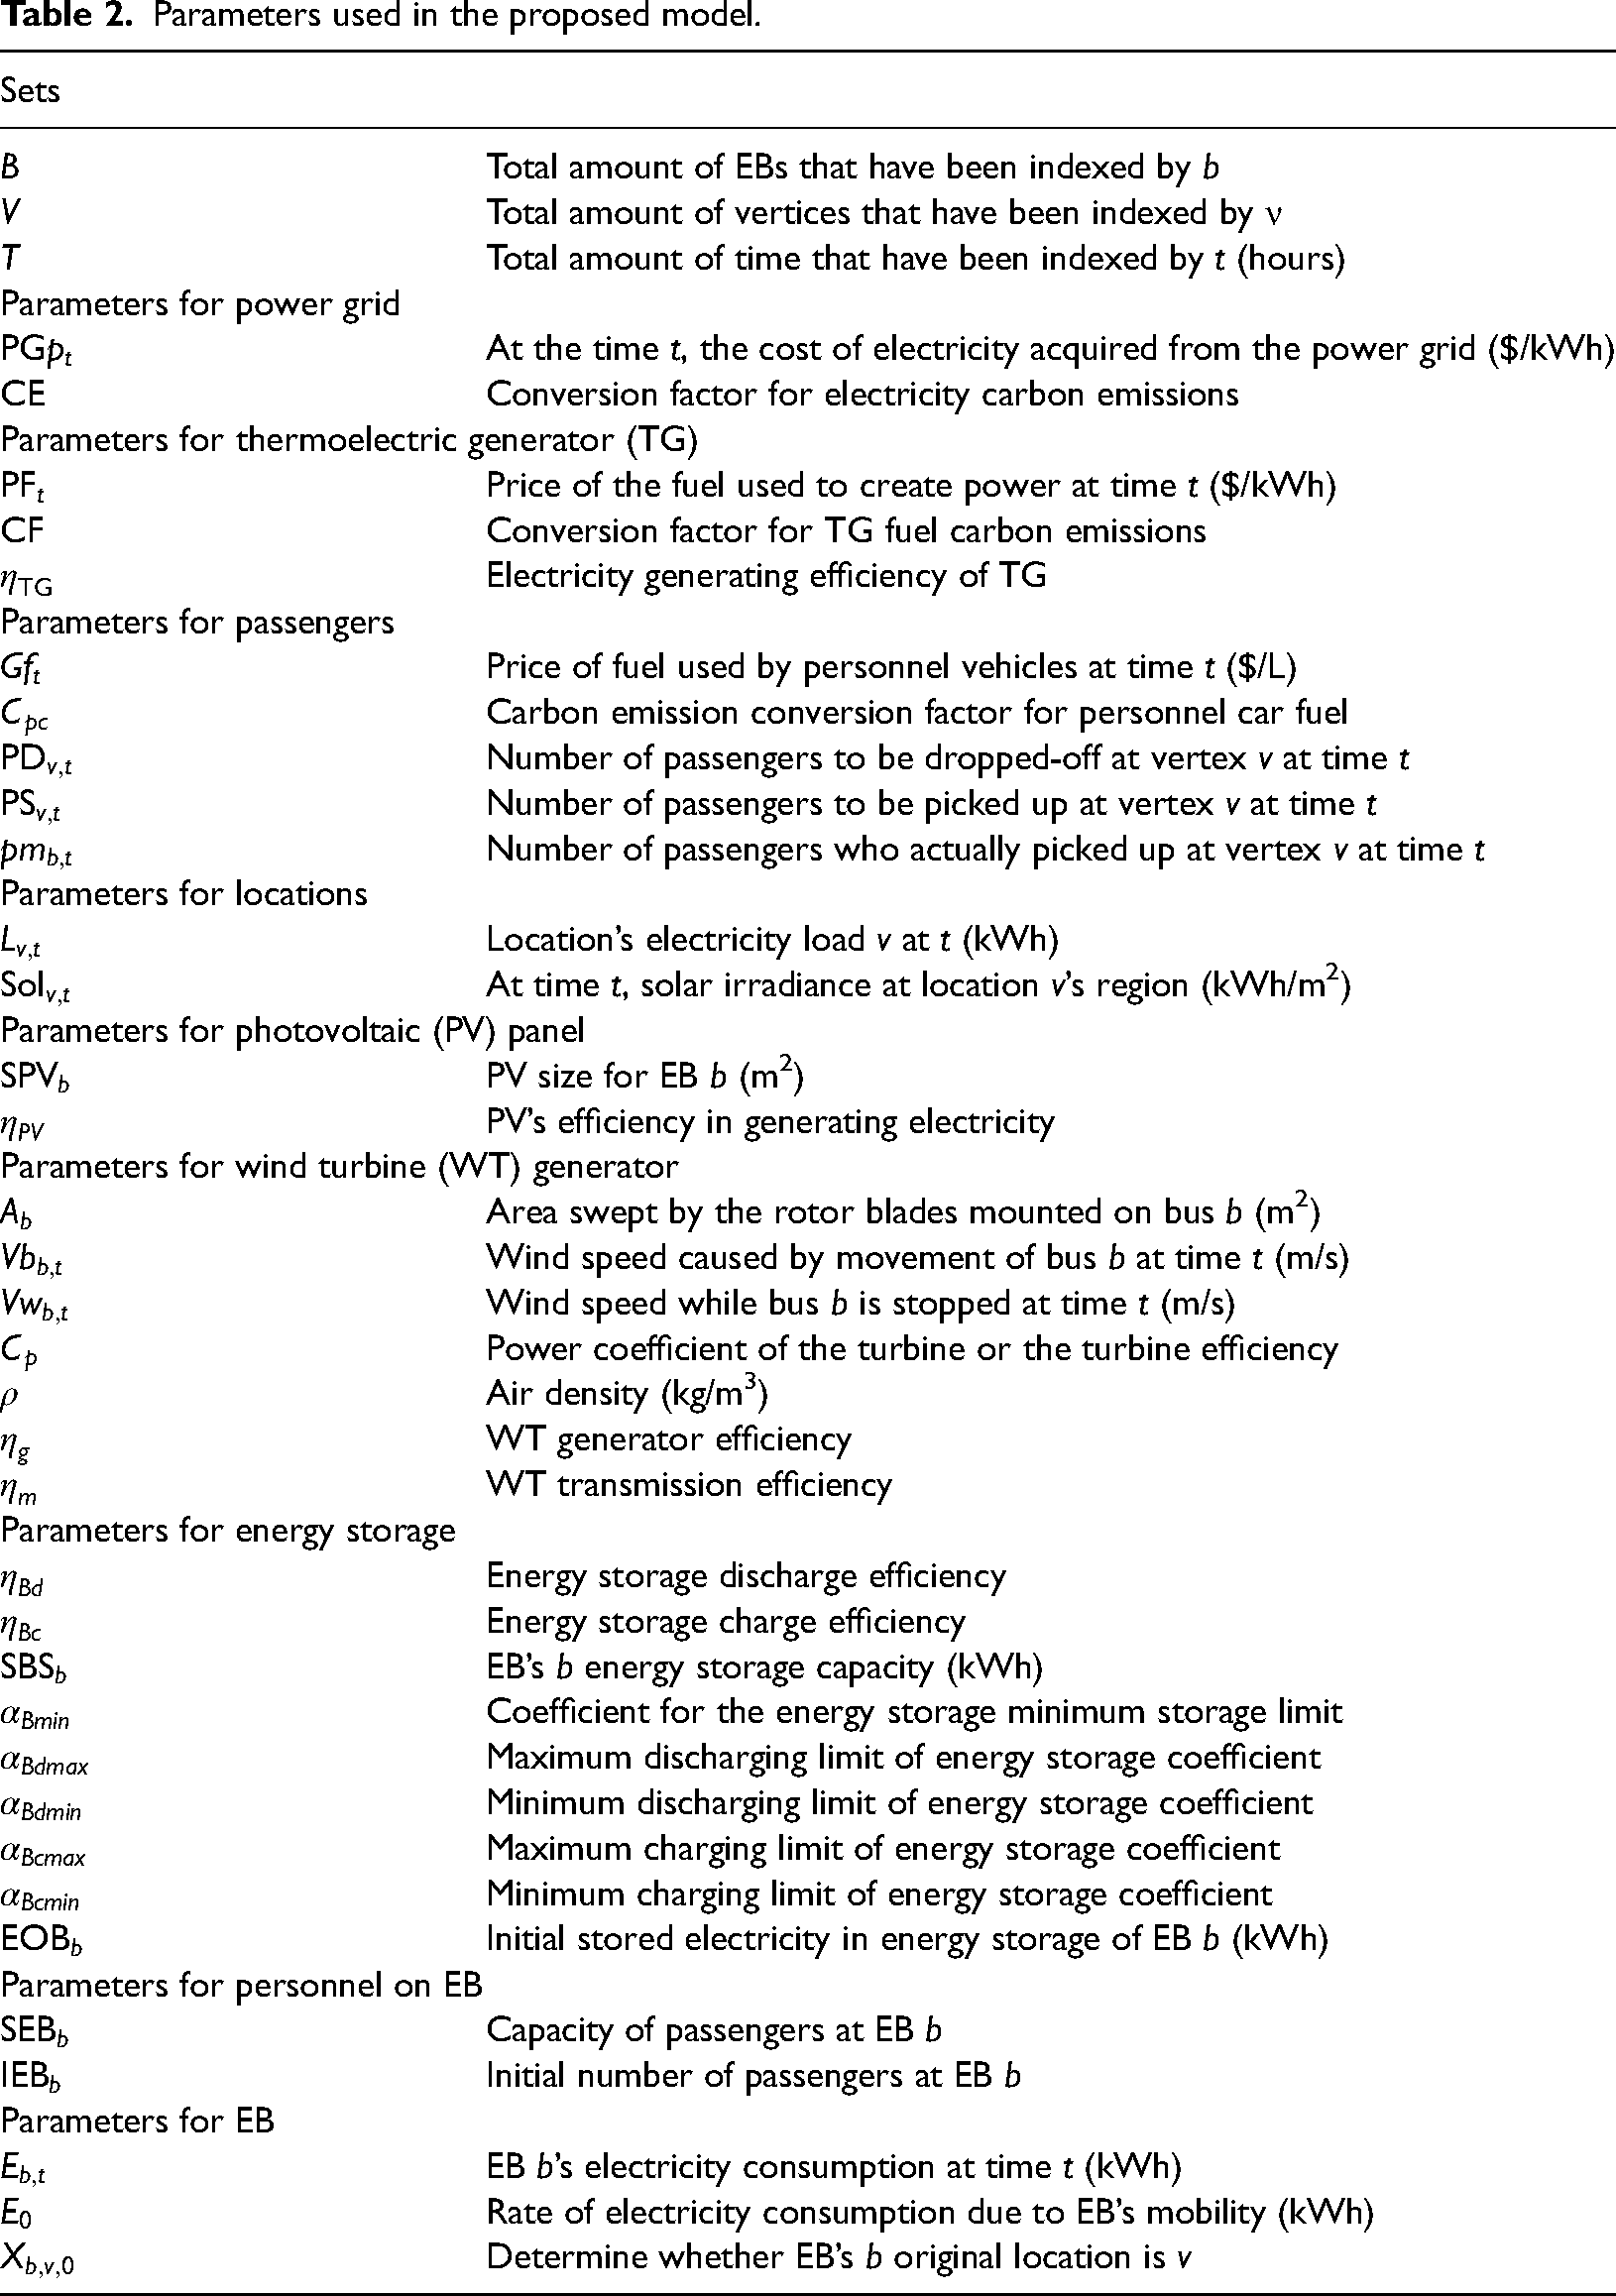
Parameters used in the proposed model.
Objective function
Plan, speculation, and setup costs are overlooked in this examination, and the accentuation is on framework tasks (i.e. EB steering and power the executives) for a specific design of the framework. The objective is to diminish absolute expenses because of energy utilization and carbon impression charges at all areas, which is determined as follows (Alqahtani and Hu, 2020):


Constraints
Energy balance constraints for locations
TG capacity constraint at each location v
Passengers balance constraints for EBs
Energy balance constraints for EBs
Constraint for passengers balance on EBs

Constraints for PV panel
Constraints for WT generator (Thapar et al., 2011)
Constraints for energy storage


Constraints for EB


Constraints for energy exchanged between EBs and locations


Mobility constraints for EBs. Two sets of choice factors are introduced to model the mobility of EB: (1) 


Simulation results analysis
In this study, a network of multiple locations with different energy demand in the Al-Fara’a region in Abha city, Saudi Arabia, is studied. According to Alqahtani and Hu (2020), data for energy demand profiles for various sites in the climatic zone of Abha are collected every 24 h. Solar irradiation for the Al-Fara’a region in 2020 was obtained from the National Solar Radiation database (National Center for Meteorology, 2021). The PG’s electricity purchasing price is based on the time of use rate from the Saudi Electricity Company (Saudi Arabia, 2021). All other parameters are set to the same values as by United States Environmental Protection Agency (2021), Weather Spark (2021), Chen and Hu (2016), and Dai et al. (2015). U.S. Department of Energy (2018) was used to calculate EB’s electricity consumption rates for mobility. In the Appendix, all of the parameter settings were provided. CPLEX solves all of the mathematical decision models in this section with a relative gap of 0.005.
To evaluate the presentation of the proposed joint model (JM), it is contrasted and the outcomes from four distinct models. The first model (FRM) assumes that renewables (PV and WT) are fixed at each location and that there are no EBs. The second model, the diesel buses model (DBM), assumes that the network is comprised solely of diesel buses and excludes renewable energy sources. The third model, disjoint model (DJM), assumes that EB operates independently, with energy management, transportation, and routing all carried out independently. The final model is a baseline model (BM) that assumes that there are no EBs and that the PG is the only source of energy for locations. The energy savings and carbon reduction data in the following tables were in comparison with the BM.
Analysis of TESU network performance under different carbon pricing
In this section, the performance of TESU network is evaluated under three different carbon prices 0, 20, and 40$ per ton of CO2 equivalent ($/tCO2e). The energy costs, carbon emissions, and traffic levels for the BM, FRM, DBM, DJM, and JM at three different carbon pricing are shown in Figure 4. The energy savings along with the reductions in carbon emissions and traffic levels are displayed in Table 3. It has been discovered that the JM outperforms the other models in all carbon prices.
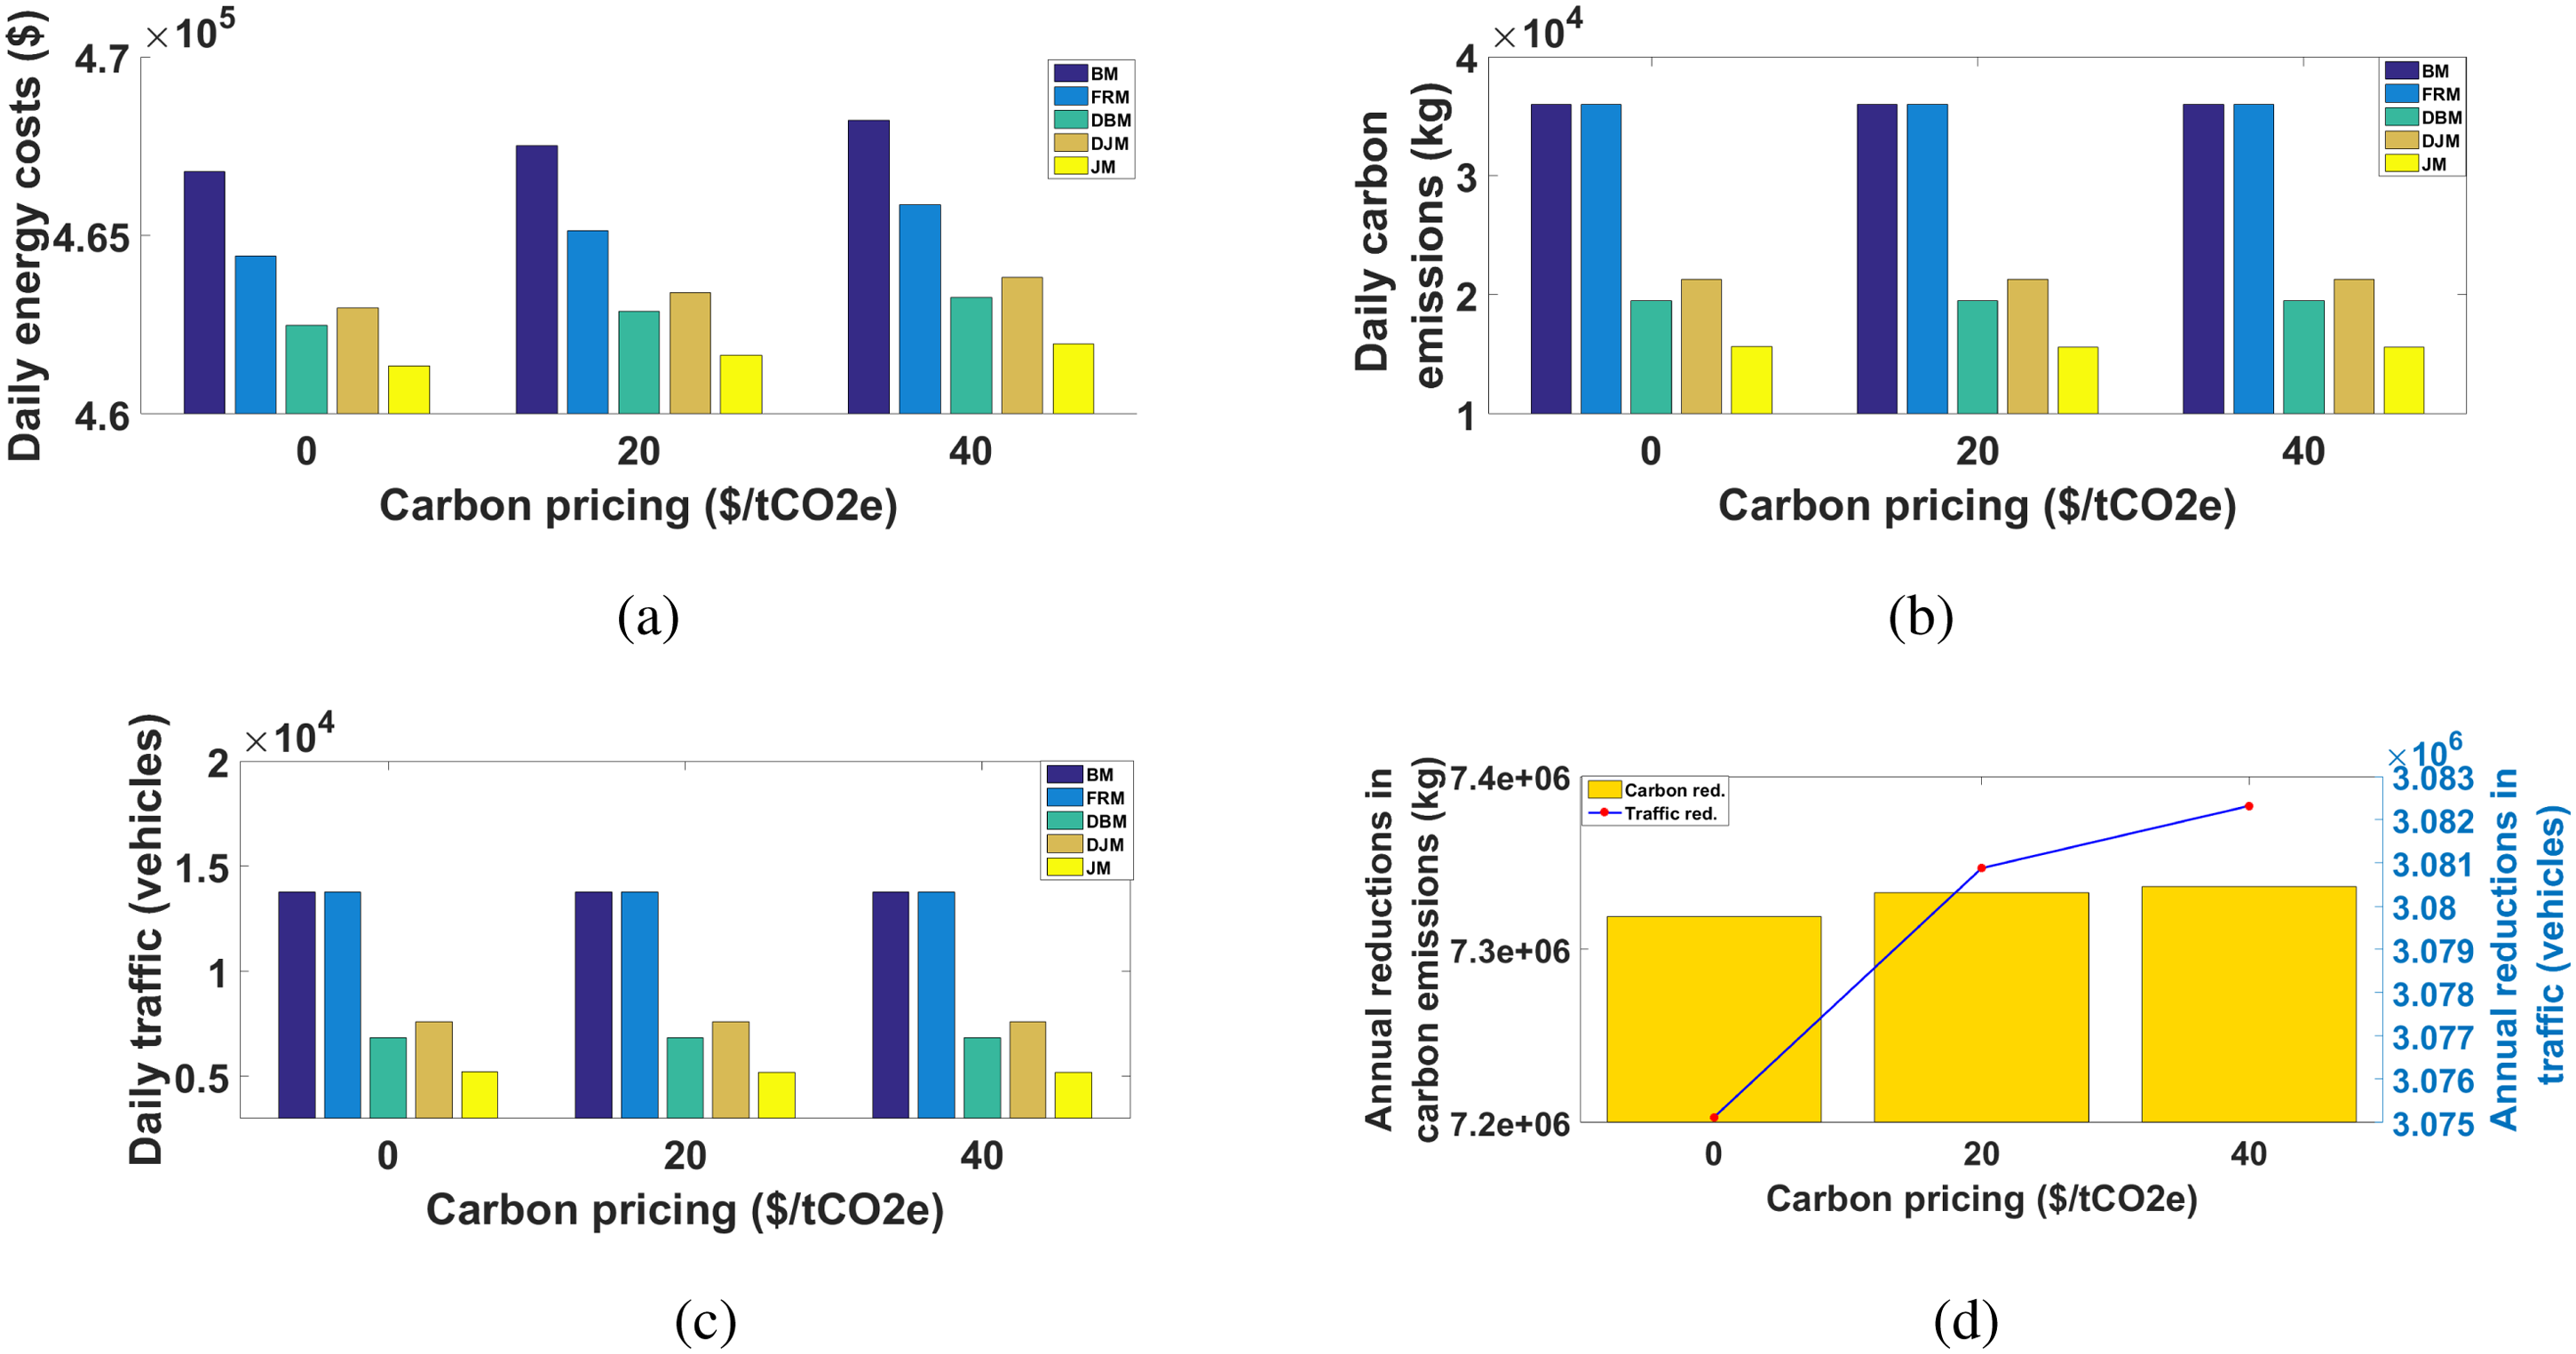
Performance of different models and annual reductions in carbon emissions and traffic for joint model (JM) under different carbon pricing: (a) daily energy costs, (b) daily carbon emissions, (c) daily traffic, and (d) annual reductions in carbon emissions.
Daily energy savings and reductions in carbon emissions and traffic level for multiple models under different carbon pricing.
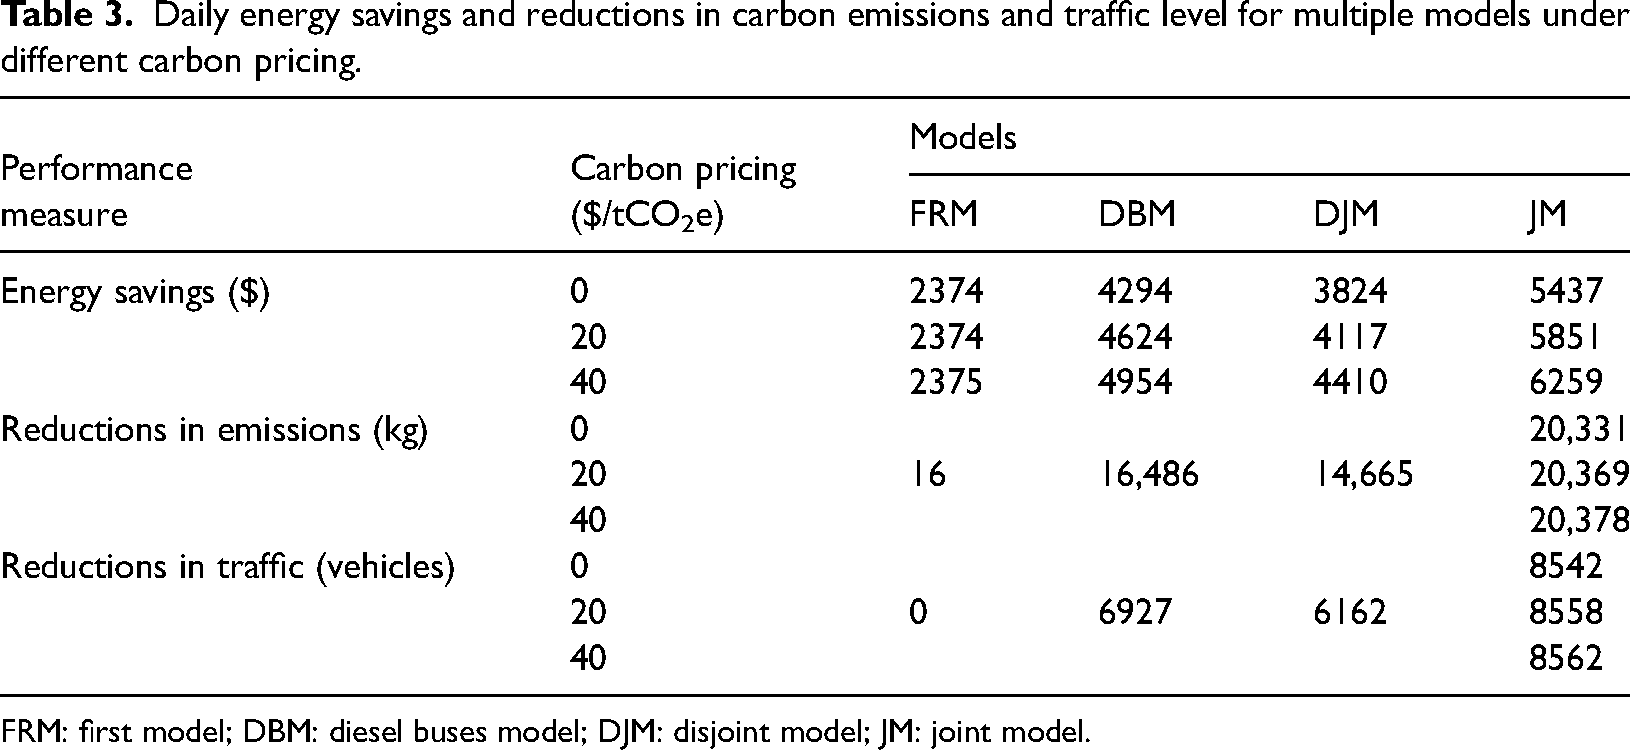
FRM: first model; DBM: diesel buses model; DJM: disjoint model; JM: joint model.
Figure 4(a) shows that as carbon pricing increases, energy costs increase for all models. It also shows that the JM incurs the lowest cost compared to the other models at all carbon prices.
Figure 4(b) and 4(c) shows that the BM and FRM keep up with fixed measures of fossil fuel by-products and traffic since travelers have no option other than to involve their own vehicles as a means of transportation. DBM, DJM, and JM, then again, demonstrate lower fossil fuel by-products and traffic as the carbon costs change, since travelers can either utilize the transports (electric or deisel) or utilize their own vehicles to ship starting with one area then onto the next relying upon which option would bring about less fossil fuel by-products. One more justification behind the distinctions in discharges and traffic levels between the initial two models (BM and FRM) and the leftover models (DBM, DJM, and JM) is that the emanations from the traffic are a lot higher than the outflows because of energy age from PG and TG.
In addition, Figure 4(d) illustrates the annual reductions in carbon emissions and traffic at different carbon prices, which shows a direct proportion to carbon prices (i.e. as the carbon prices increase emissions and traffic decrease).
Table 3 indicates that, in all carbon pricing, JM is demonstrated to be more cost-effective, environmentally friendly, and traffic congestion solver compared to the other models. The EBs are allowed to move around, transport passengers, generate energy from winds and harvest solar energy from different locations. In the JM, the routing of buses is mainly controlled by the energy demand. However, the transportation needs of passengers can be also met as a secondary routing driver.
TESU network under different types of passengers’ vehicles
In this case, passengers at different locations are expected to fulfill their transportation needs by riding in EBs or using their own vehicles. It is assumed that they will have different types of automobile due to their different financial capacities, culture, employment status, etc. In this case, we assume that there are two types of passenger vehicles: hybrid and gasoline vehicles. EVs (vehicles that run fully on electric energy) will be excluded from the comparison, as EVs and EBs will have the same performance in terms of energy costs and carbon emissions. The performance of TESU network under various types of passengers’ automobiles is studied.
The total energy costs, carbon emissions, and traffic levels for the five models (BM, FRM, DBM, DJM, and JM), and annual reductions in carbon emissions under two different passenger automobiles (hybrid and gasoline) are shown in Figure 5.
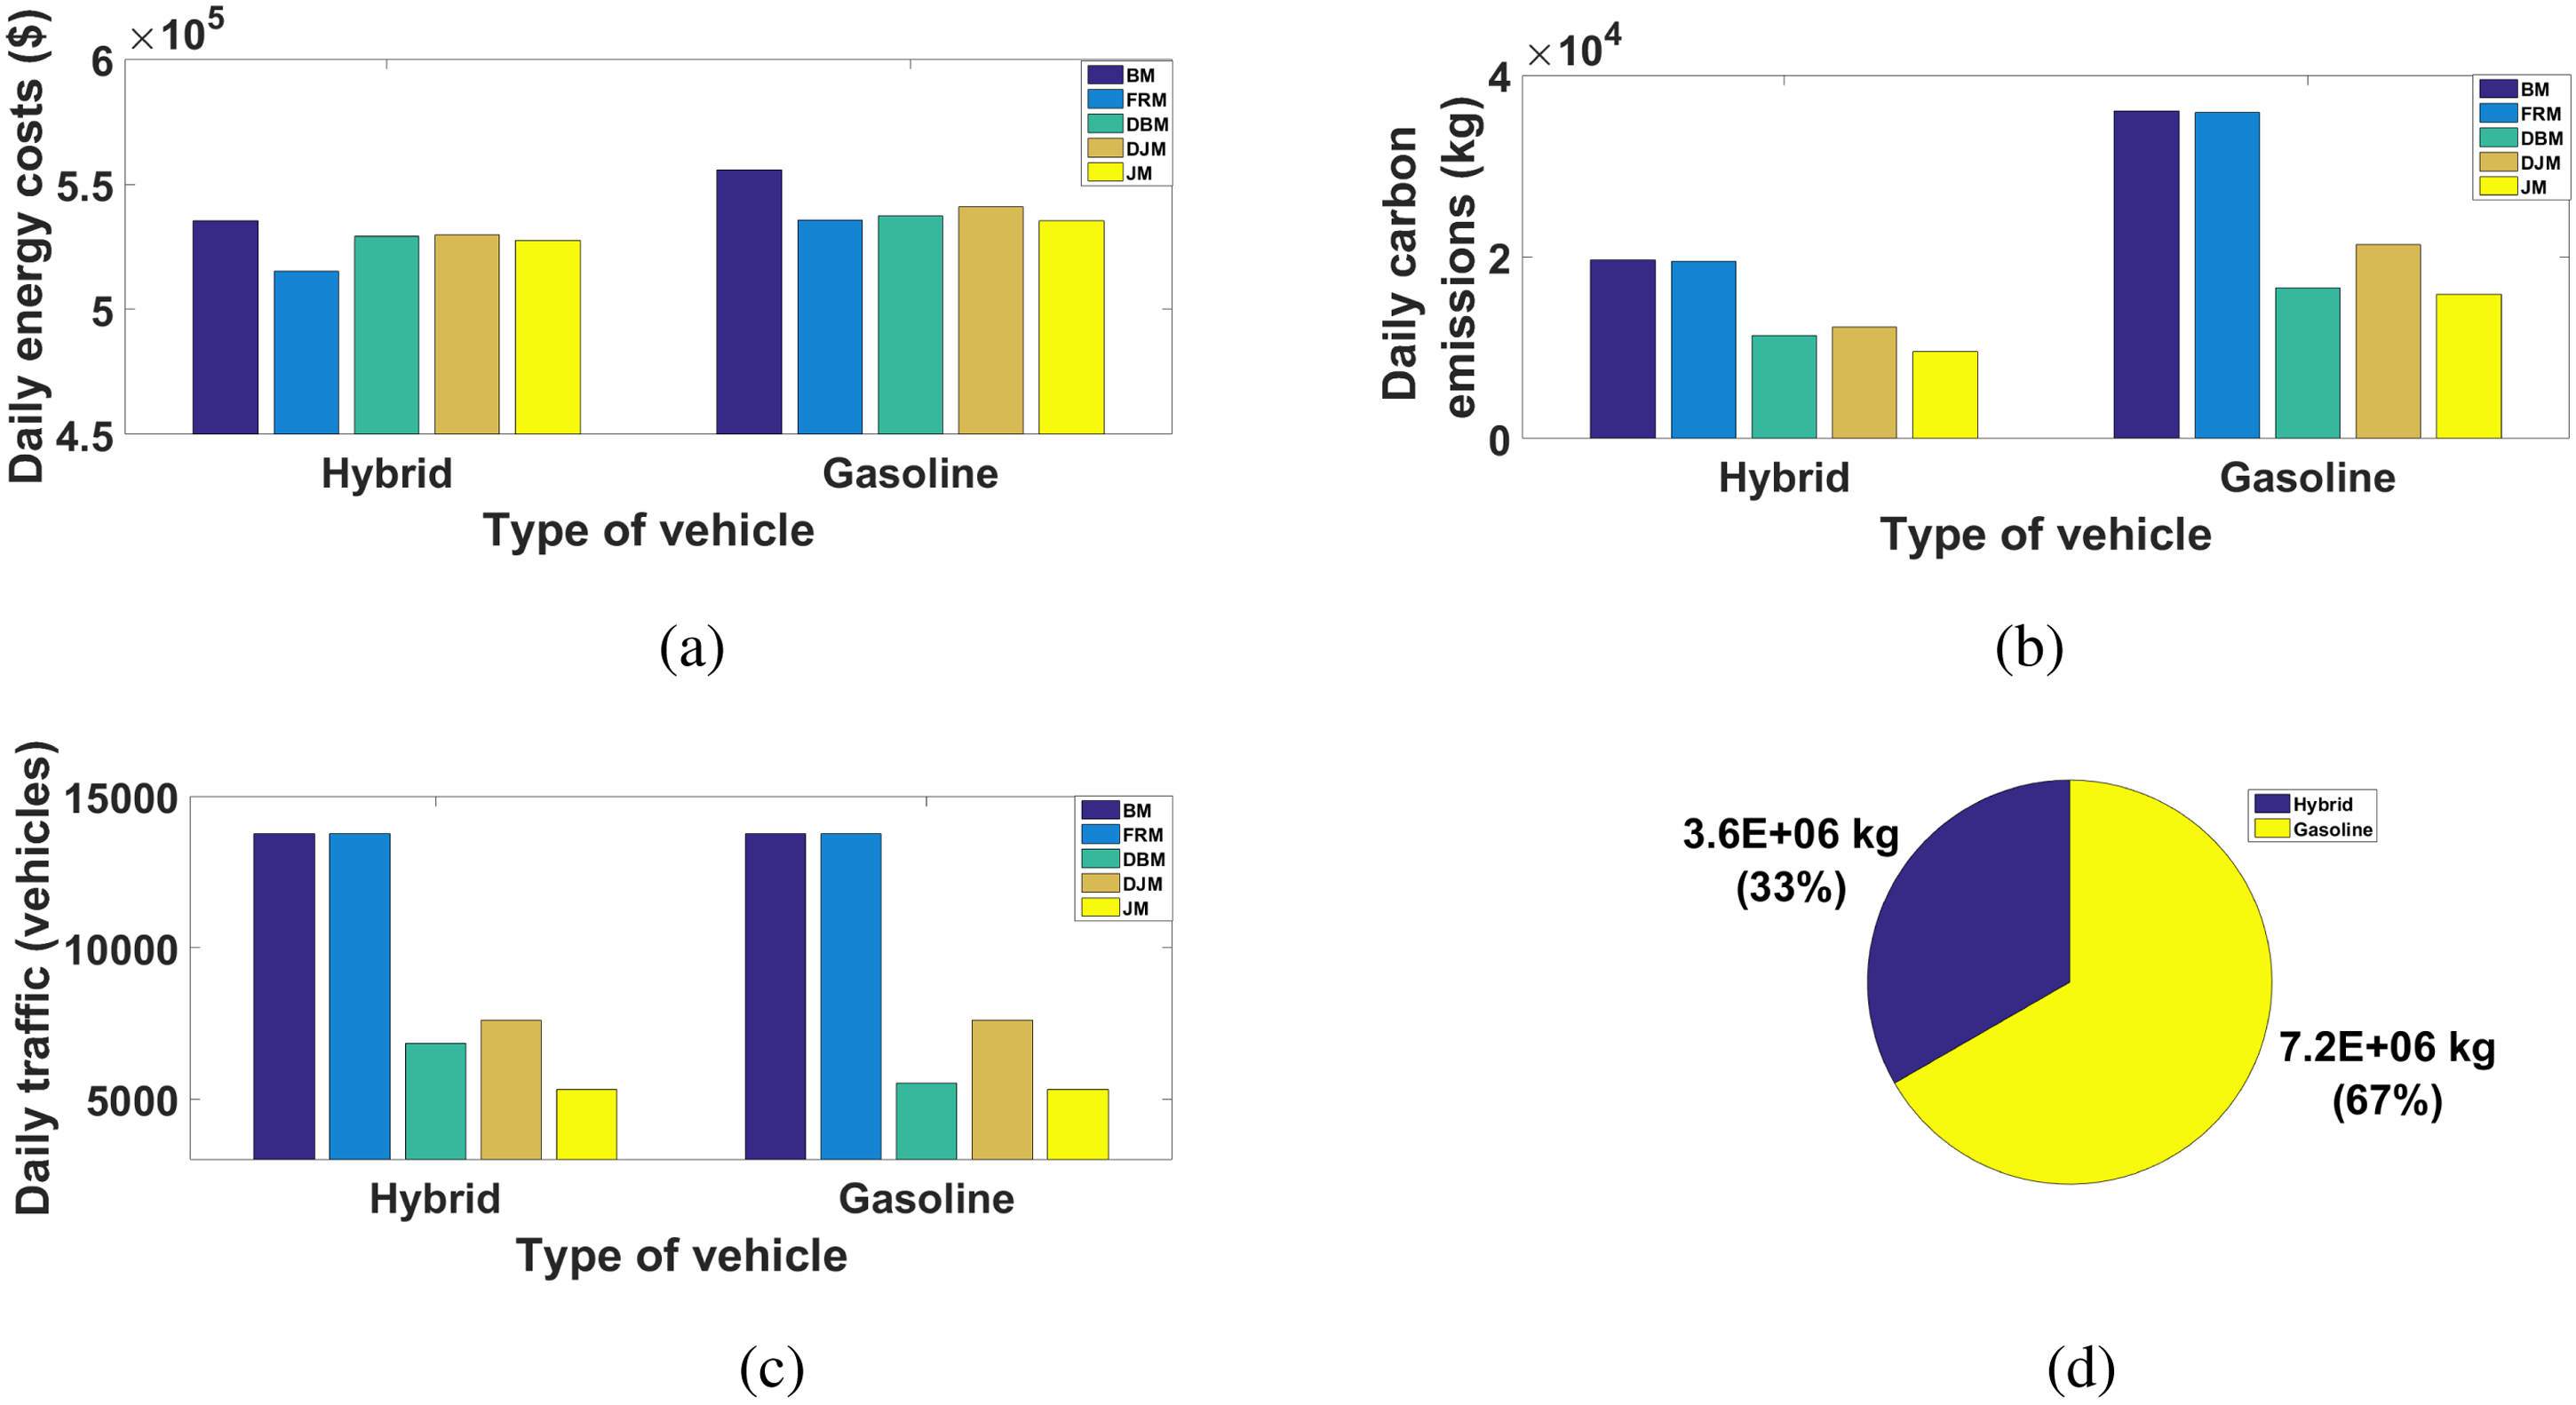
Performance of different models and annual carbon reductions for joint model (JM) under different types of passenger’s vehicles: (a) daily energy costs, (b) daily carbon emissions, (c) daily traffic, and (d) annual carbon reductions per car type.
It is noted from Figure 5(a) that if the passengers’ use hybrid vehicles, the energy costs of all models are relatively less compared to the costs of using gasoline vehicles. In addition, the figure shows that the JM is more effective than other models when under the gasoline category of passengers’ vehicles.
Figure 5(b) shows that the carbon emissions under hybrid category are significantly less for all models compared to the gasoline category, since gasoline cars produce more carbon emissions compared to hybrid vehicles (emi, 2021). Moreover, Figure 5(c) demonstrates that the traffic for the first two models (BM and FRM) is much higher compared to the remaining models (DBM, DJM, and JM) since the passengers in those models (DBM, DJM, and JM) can opt to use the buses rather than using their own vehicles. It is also observed from Figure 5(b) and 5(c) that the JM outperforms all models in both vehicle categories.
The reductions in carbon emissions for the JM under the two types of vehicles is illustrated in Figure 5(d). The figure shows that the JM can reduce more emissions when passengers’ vehicles run on gasoline, since the more passengers’ rides on the EBs, the less emissions are produced.
Table 4 illustrates daily energy savings, as well as reductions in carbon emissions and level of traffic.
Daily energy savings and reductions in carbon emissions and traffic levels for multiple models under different types of passenger’s vehicles.
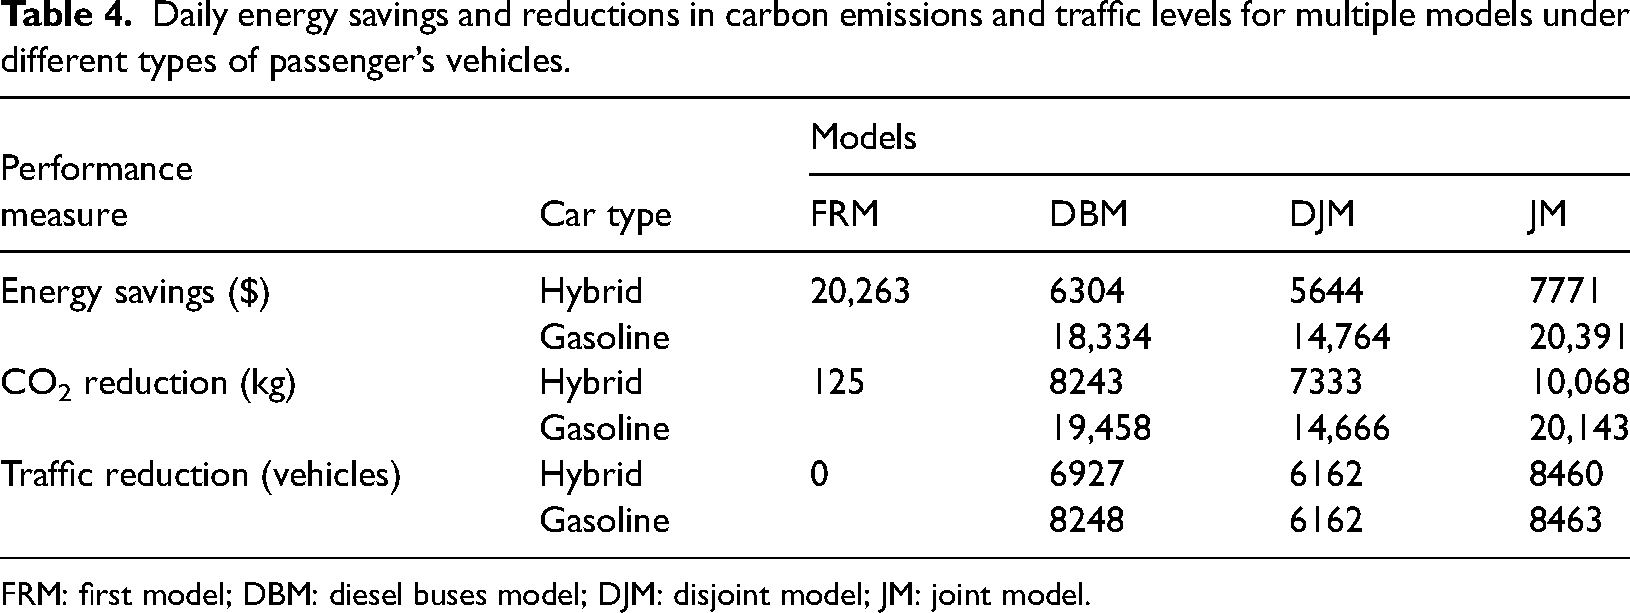
FRM: first model; DBM: diesel buses model; DJM: disjoint model; JM: joint model.
It is observed from Table 4 that the JM can save more energy and reduce more carbon emissions, and traffic levels compared to the other models since the JM allows EBs to travel to neighboring regions with the highest energy loads and transportation demands based on time periods and meet those demands for the least cost.
TESU network under different seasons
The city of Abha is perceived as one of the most visited sights in the center of the east. Thousands of travelers travel to the east of the country (Saudi Ministry of Tourism, 2021). Al-Fara’a area is one of the milestones that travelers generally visit in Abha. Furthermore, since the TESU network will assist tourists and visitors in reaching their destinations, seasonality will have an impact on its performance. Subsequently, it is basic to examine what changes between seasons mean for the exhibition of the TESU organization. Fall, winter, spring, and summer are the four seasons that will be read up for show purposes.
The total energy costs, carbon emissions, and traffic for the five models (BM, FRM, DBM, DJM, and JM) in four different seasons are shown in Figure 6. The figure also shows the daily energy savings per facility.
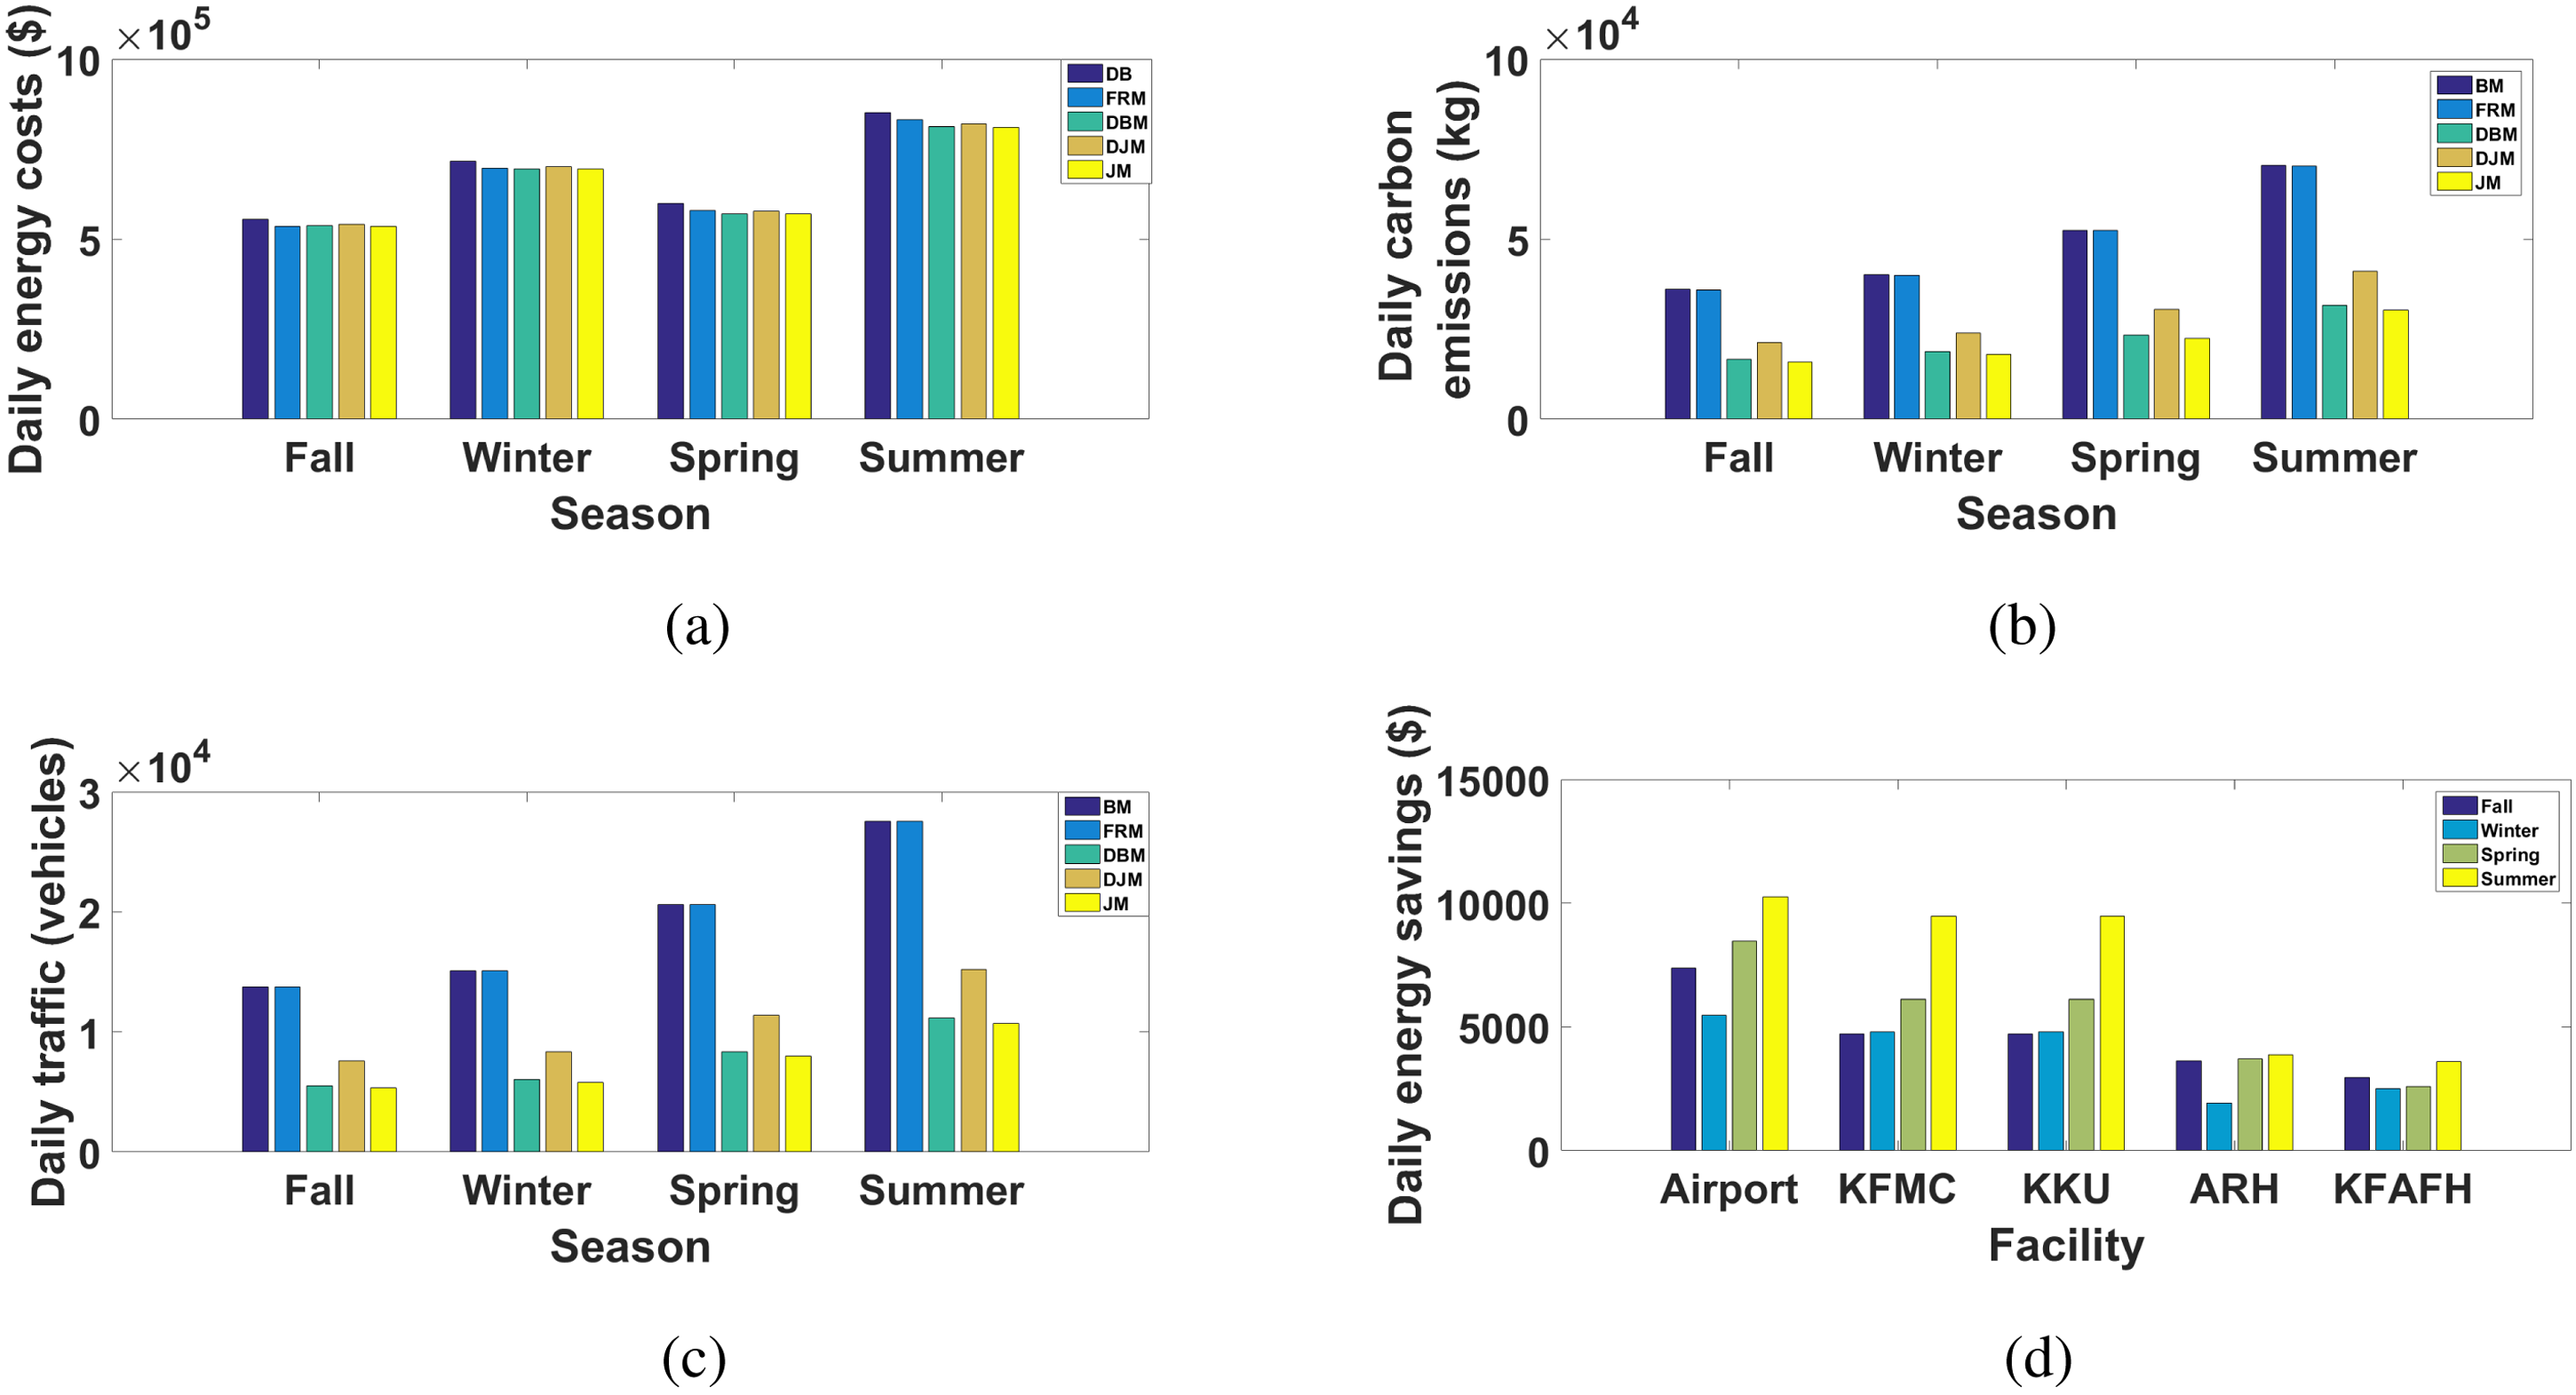
Performance of different models and daily energy savings per facility for joint model (JM) under different seasons: (a) daily energy costs, (b) daily carbon emissions, (c) daily traffic, and (d) daily energy savings per facility.
The operational cost savings and the reductions in carbon emission and traffic congestion for the four models (BM, FRM, DBM, DJM, and JM) compared to the BM are recorded in Table 5.
Daily energy savings and reductions in carbon emissions and traffic for multiple models under different seasons.
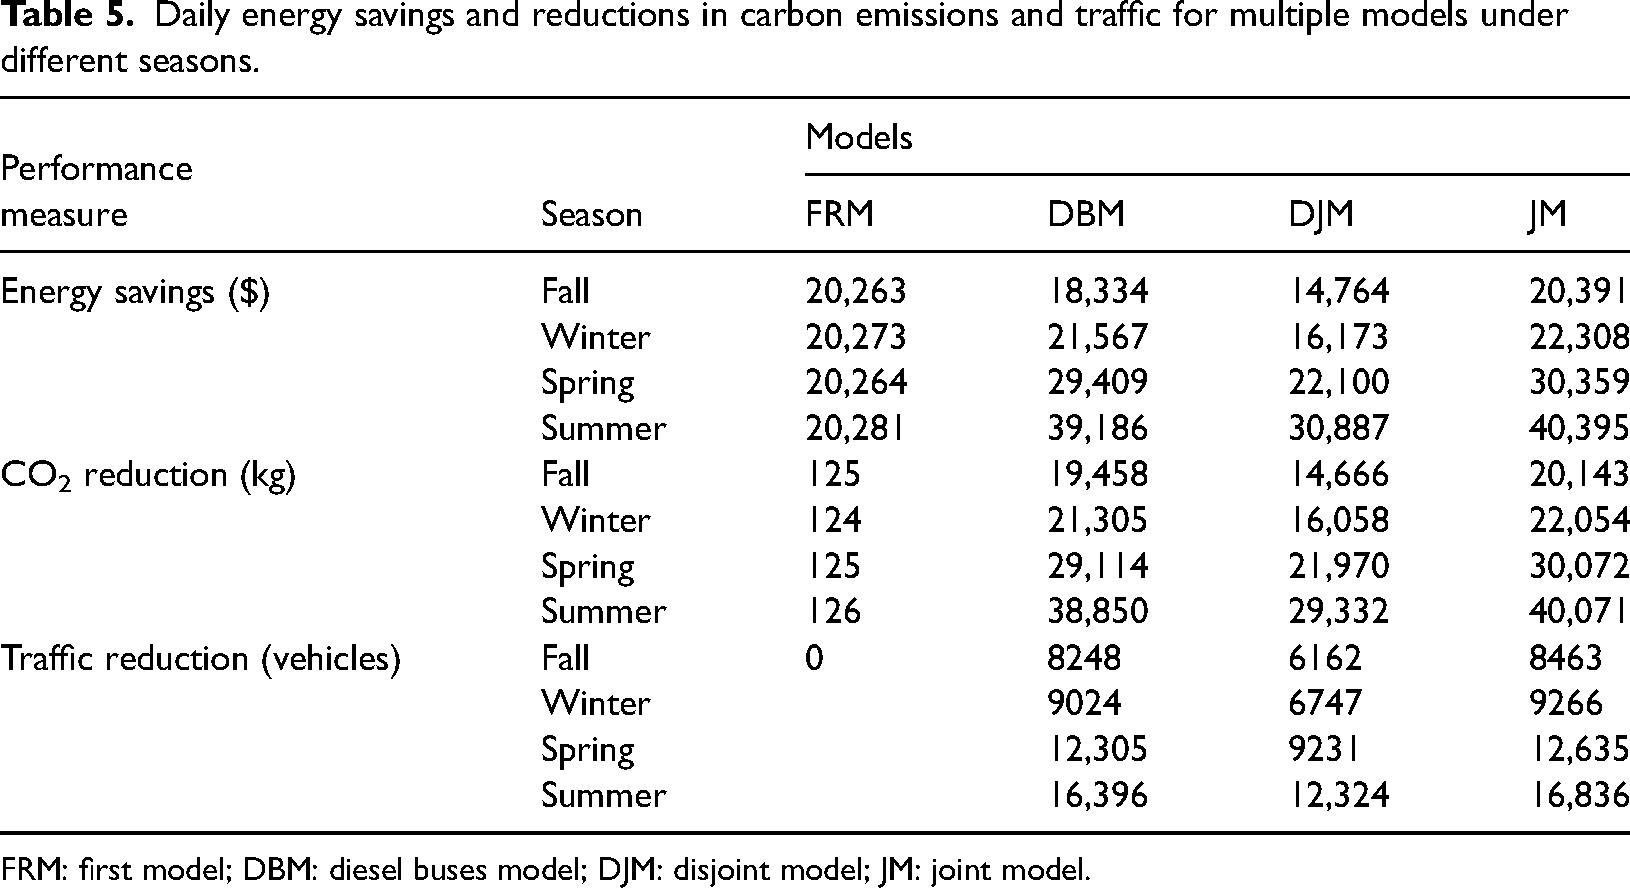
FRM: first model; DBM: diesel buses model; DJM: disjoint model; JM: joint model.
The results reveal that the arrangements of the JM are more sophisticated, less contaminating, and cause less gridlock than different models in each of the four seasons. In contrast with different seasons, each of the models accomplishes more energy reserve funds and decreases in emanations and traffic throughout the mid-year, since the interest in power, fossil fuel by-products, and traffic is higher in Abha throughout the late spring season. In addition, it is seen from Figure 6(d) that the air terminal would accomplish the highest investment funds, as it is considered the most active office due to the large number of appearances throughout the late spring season.
TESU network under different bus capacities
In this case, we will study the effects of different bus capacities on the performance of different models (BM, FRM, DBM, DJM, and JM) in terms of energy costs, carbon emissions, and traffic.
In this section, the performance of TESU is evaluated under four different sizes of EBs including 25, 65, 105, and 145 passengers.
Figure 7 displays the daily operational cost, carbon footprint, and traffic. The total energy savings, as well as the reductions in carbon emissions and traffic level for the four models (FRM, DBM, DJM, and JM) compared to the baseline model with four different EB sizes, are shown in Table 6.
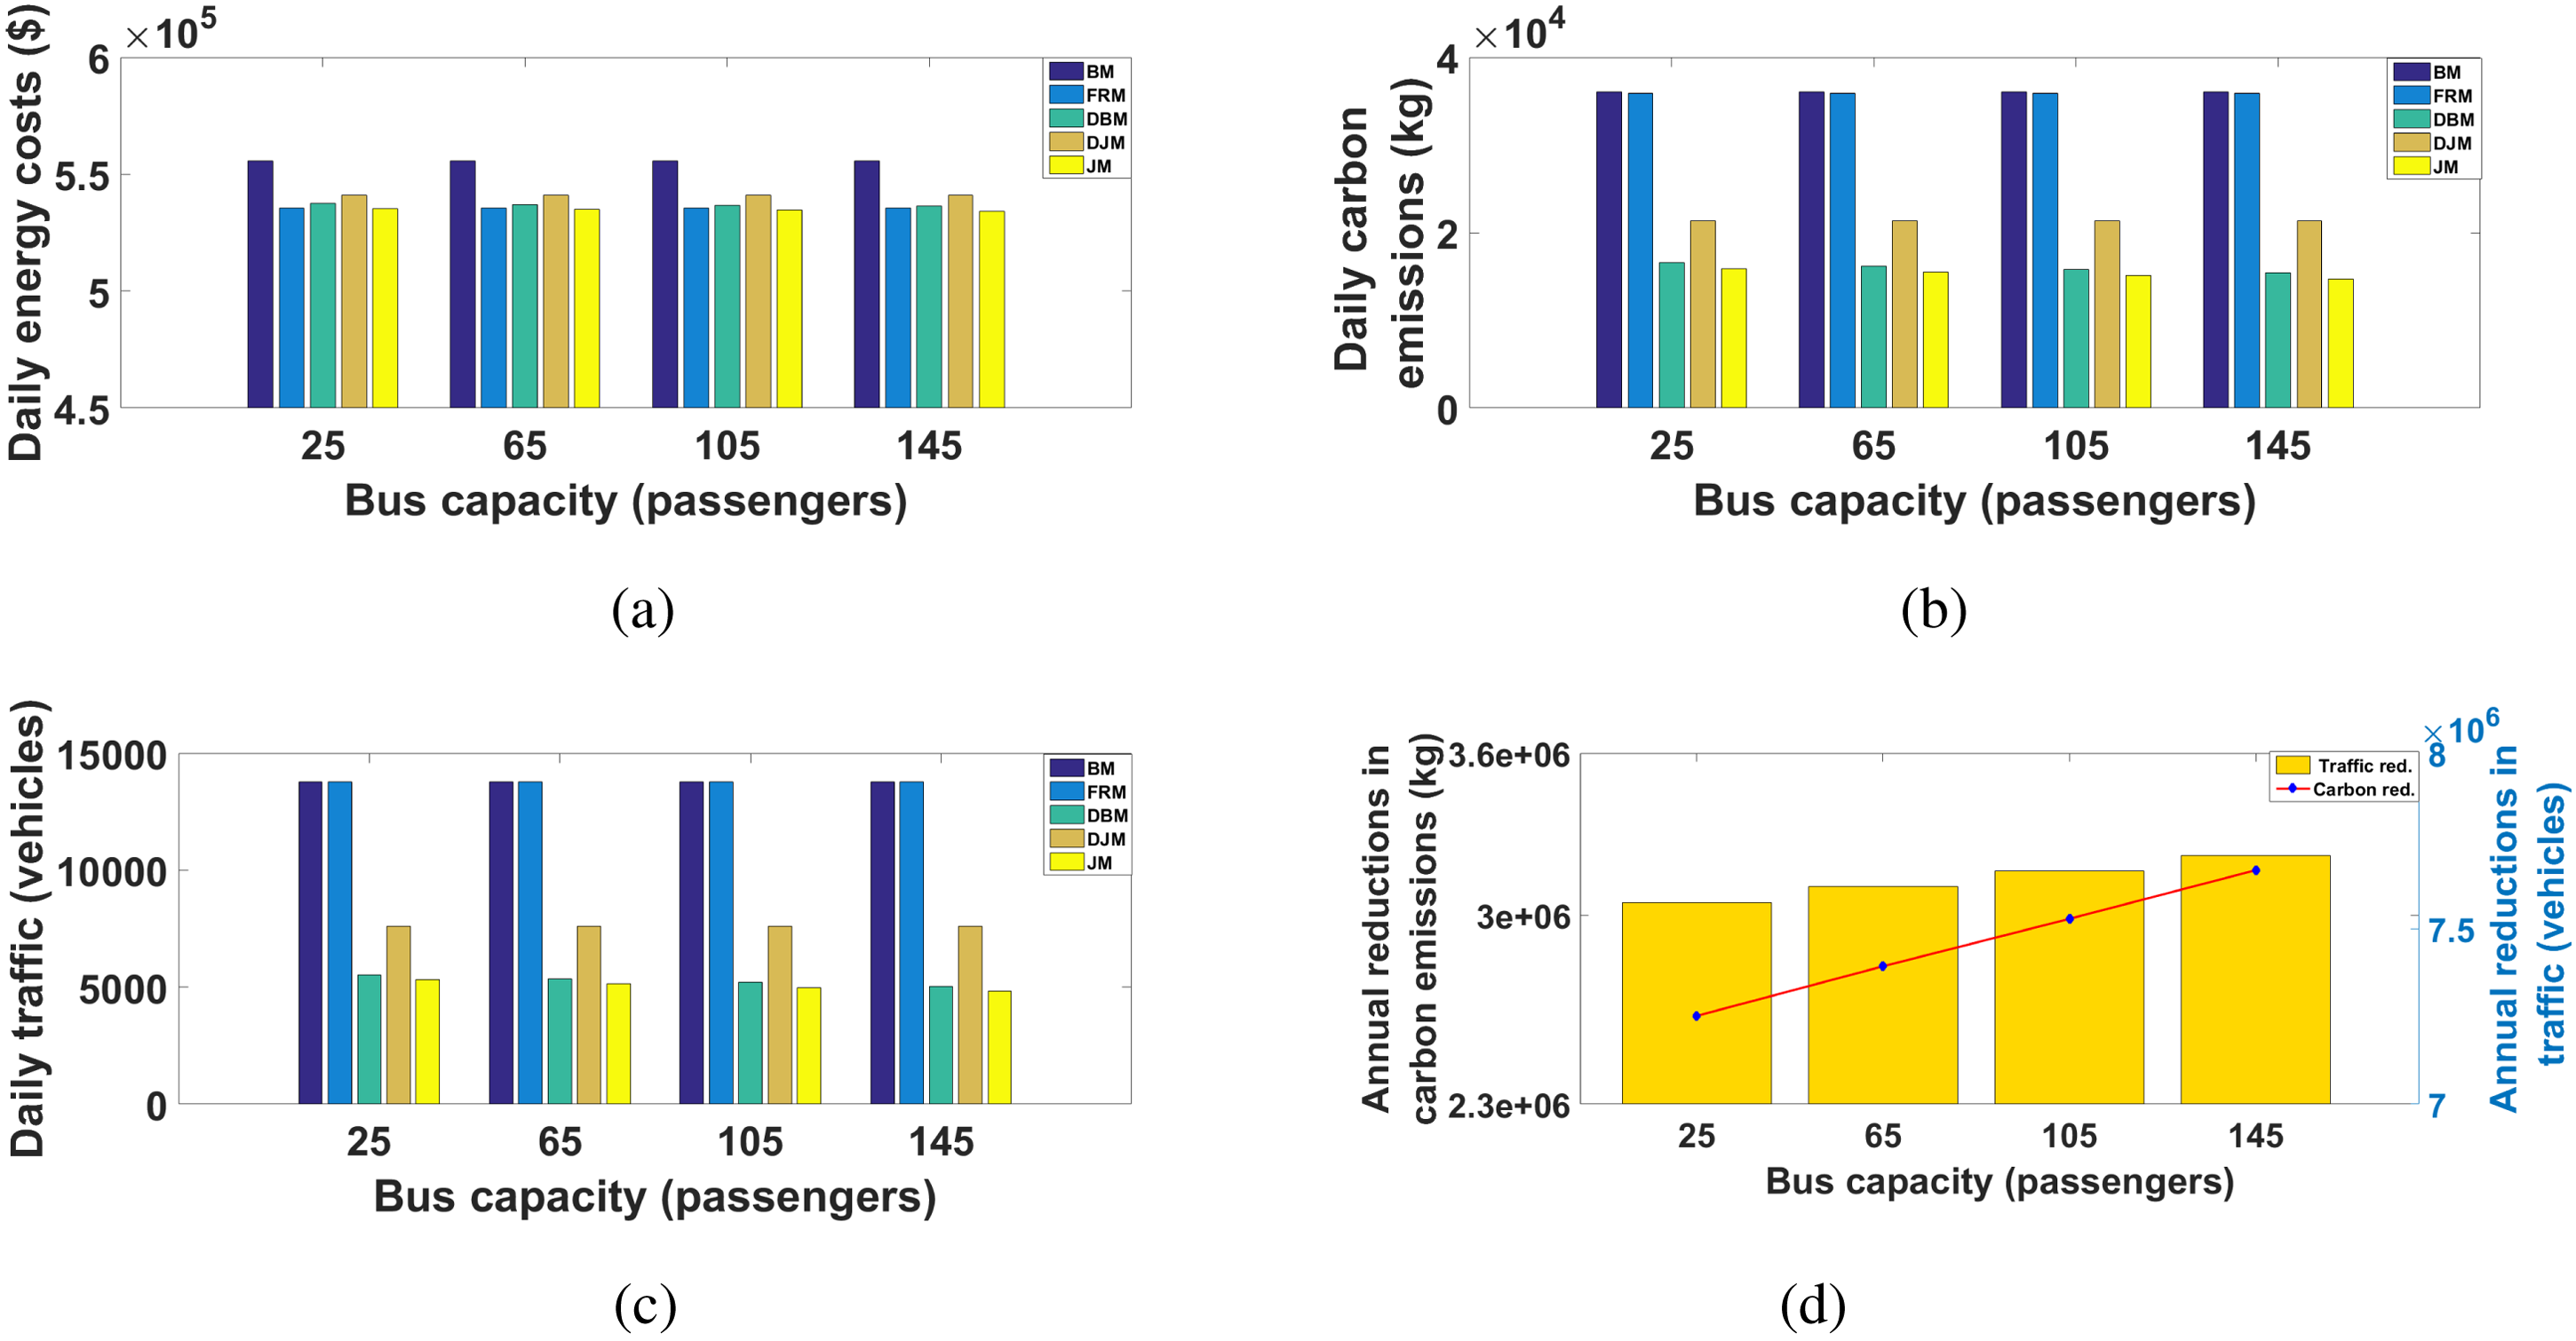
Performance of different models and annual reductions in traffic for joint model (JM) under different bus capacity: (a) daily energy costs, (b) daily carbon emissions, (c) daily traffic, and (d) annual reductions in traffic.
Daily energy savings and reductions in carbon emissions and traffic for multiple models under different capacities of buses.
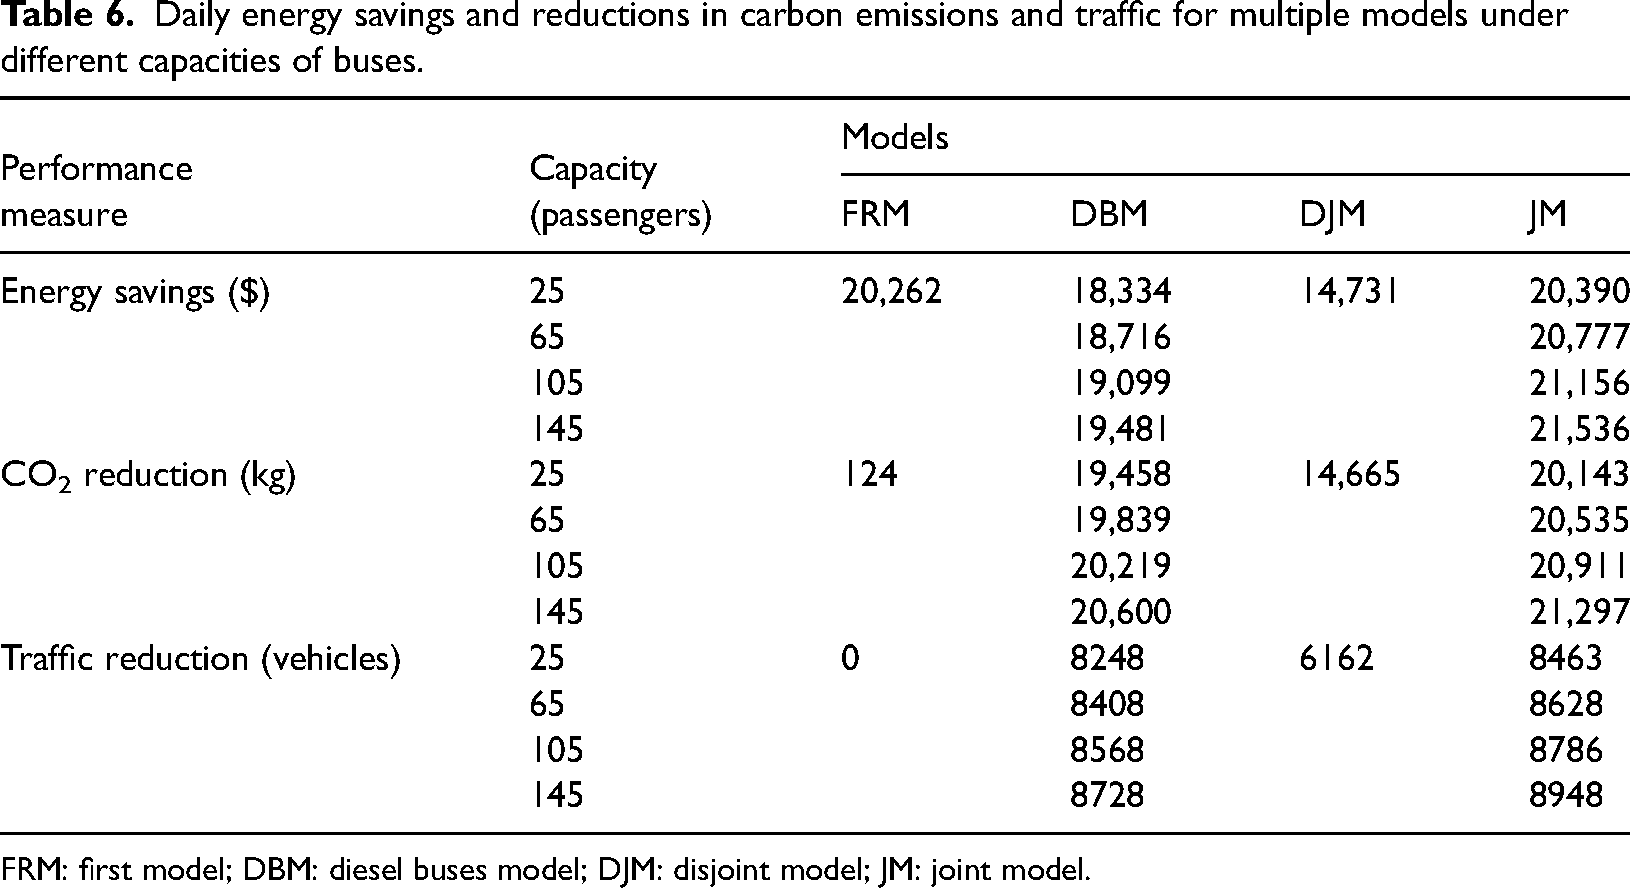
FRM: first model; DBM: diesel buses model; DJM: disjoint model; JM: joint model.
The JM is seen to show more practical, less contaminating, and less traffic arrangements compared to different models in all transport limits. Moreover, Figure 7(d) shows direct extent between the transport limit and the yearly decreases in traffic and carbon, as travelers choose to use EBs instead of using their own vehicles to satisfy their transportation needs at a lower cost.
To this end, the JM can generate solutions that are more cost-effective, environmentally friendly, and have fewer traffic levels.
TESU network under different traffic conditions
A study published by Lajunen and Lipman (2016) found that 12 m EBs use electricity as they move, at rates ranging from 0.9 to 1.6 kWh/km, depending on the model of the bus and traffic. In this segment, the TESU exhibition is evaluated under different traffic conditions. For exhibition, three different traffic levels will be thought of: low, ordinary, and weighty. The functional expenses, the fossil fuel by-product, and the traffic level for the five models (BM, FRM, DBM, DJM, and JM) are displayed in Figure 8. Table 7 shows the complete energy reserve funds, as well as the decreases in the by-products of fossil fuels and the level of traffic for the four models (FRM, DBM, DJM, and JM) in contrast to the BM at three different levels of traffic.
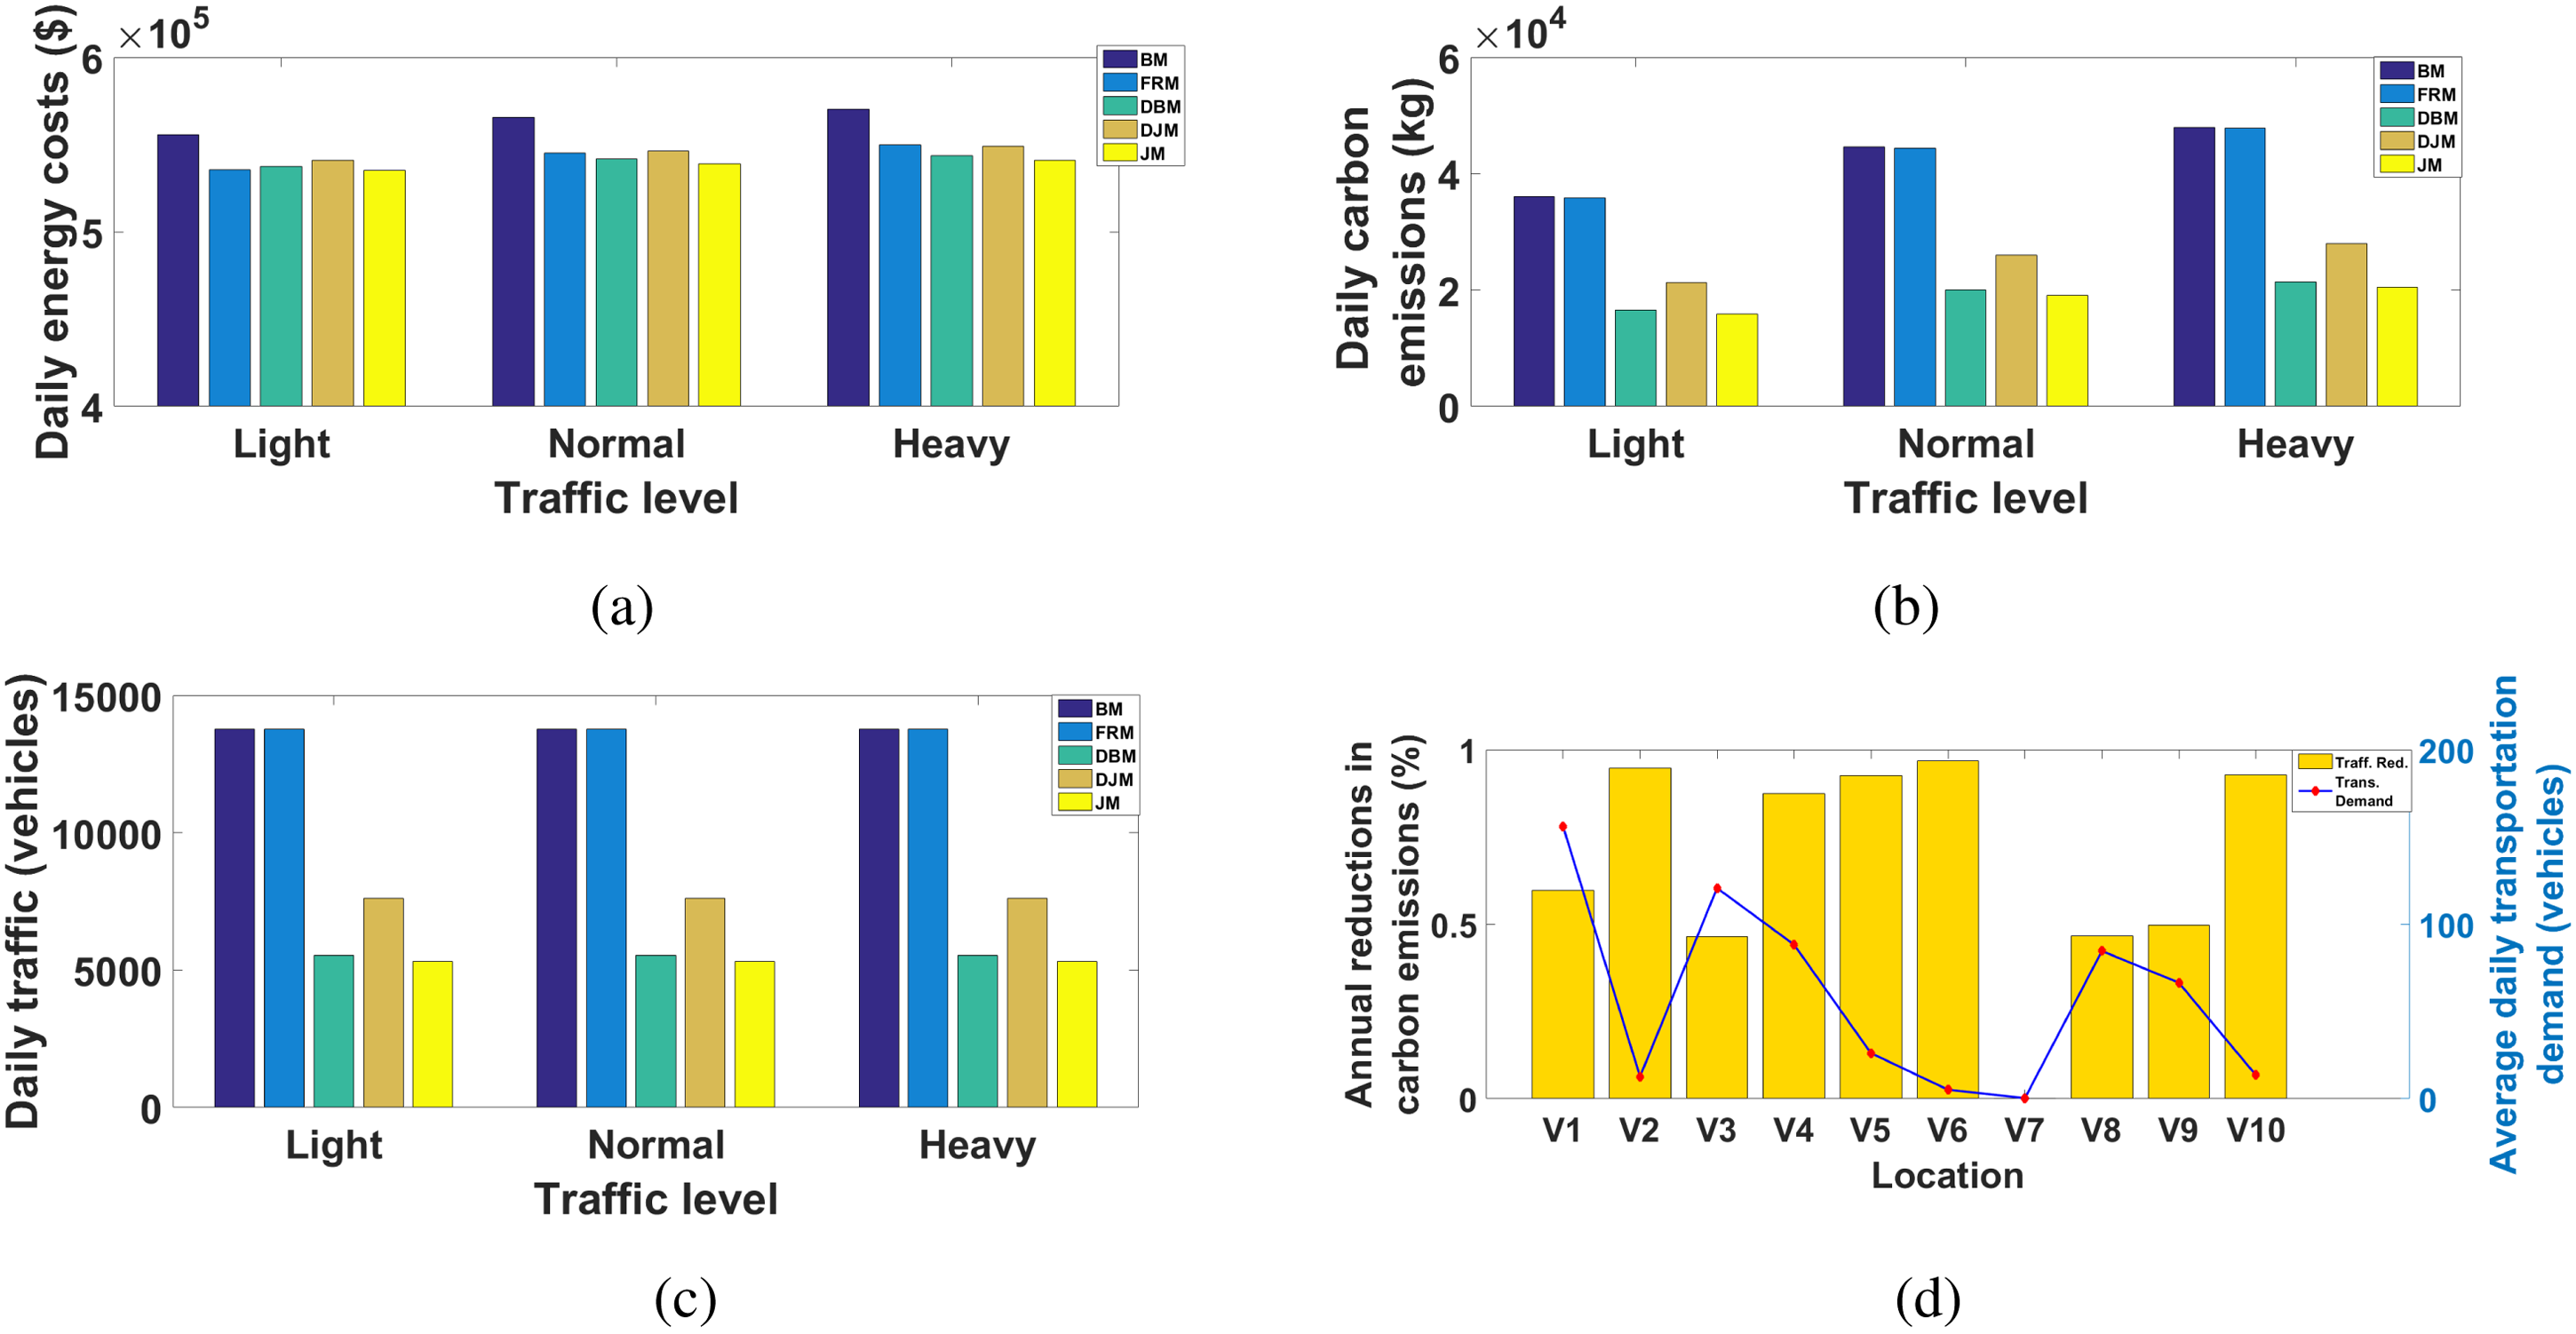
Performance of different models and average reductions in traffic per location for joint model (JM) under different traffic conditions: (a) daily energy costs, (b) daily carbon emissions, (c) daily traffic, and (d) reductions in traffic per location.
Daily energy savings and reductions in carbon emissions and traffic for multiple models under different traffic conditions.
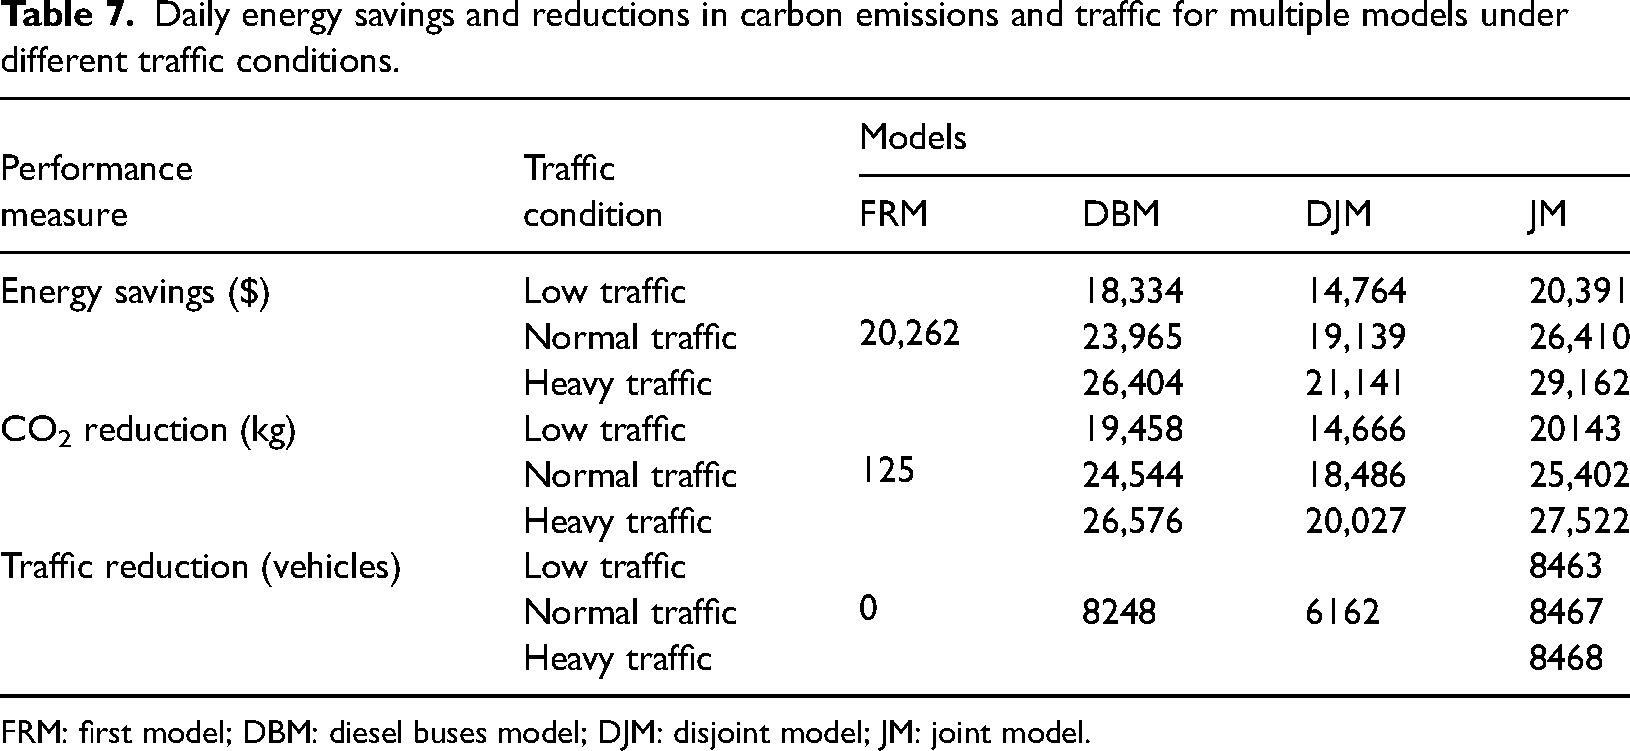
FRM: first model; DBM: diesel buses model; DJM: disjoint model; JM: joint model.
The outcomes show that in all rush hour gridlock conditions, the JM’s answers produce fewer gridlock than different models. The results also show that, under typical traffic conditions, the areas V2, V6, and V10 have the most decreases in rush hour gridlock in the organization, while V7 causes no decreases in rush hour gridlock (since it has zero daily transportation requests by and large).
Summary and policy implications
The presented model in this work demonstrates a superiority of performance over the remaining models under different scenarios in terms of economical, environmental, and transportation implications. Since it can save up to $40,000 annually as energy savings. Although it can reduce carbon emissions by 40 tons of CO2 each year as well as traffic by ∼61.12% on an annual basis, it contributes significantly to saving the time of employees, increasing productivity in their jobs and improving the quality of life for society. These implications show the significant role of this policy in different scenarios, which gives it the advantage of being implemented in any country around the world. This will have significant implications on global warming, as well as on the global economy and their dependence on fossil fuels as the mean source of energy.
Conclusion and future work
In this article, we proposed a new concept of energy distribution and transportation through an integrated decision model for energy management and vehicle routing. This model allows dispatching EBs in an adaptive manner to meet transportation and energy demands under spatial and temporal complexities. This model is highly novel, as there is no research work that addresses the transportation and energy issues simultaneously. This study uses the performance metrics such as energy expenses, carbon footprints, and traffic volume. The results of the simulation demonstrate that the EB network offers greater flexibility when it comes to distributing energy loads among various sites at various times. Since, it can save up to $40,000 in operating costs, reduce CO2 by up to 40 tons, and reduce traffic by ∼61.16% compared to the basic case.
The uncertainties in energy demand and solar irradiance will be taken into account in the future. To enable more reliable operations of the transportation and energy supply units, stochastic decision models will be constructed using Markov decision processes. In addition, more computationally efficient distributed models will be investigated to study large-scale transportation and energy supply units networks.
Footnotes
Acknowledgements
The authors extend their appreciation to the Deanship of Scientific Research at King Khalid University for funding this work through large group Research Project under grant number RGP2/392/45.
Declaration of conflicting interests
The author(s) declared no potential conflicts of interest with respect to the research, authorship, and/or publication of this article.
Funding
The author(s) disclosed receipt of the following financial support for the research, authorship, and/or publication of this article: This work is financially supported by the Deanship of Scientific Research at King Khalid University (Grant No. RGP2/392/45).