
Abstract
At least thirteen parameters relating phenanthrene and methylated phenanthrenes to the maturity of organic matter have been defined in the literature and a mass of the data have been accumulated. However, these parameters are not always effective in many basins. To explore an effective approach for using these big data, this paper re-studies the relationship of methyl- and dimethyl-phenanthrenes to the maturity of organic matter, mainly using partial least square regression (PLSR) and geochemical stabilities of these phenanthrenes. The samples for this study were taken from the shale and mudstone in the Cretaceous Qingshankou Formation in the Songliao Basin, China. It was found that integrated use of methyl- and dimethyl-phenanthrenes can overcome the limitations inherent in using them separately, and thus can enhance the accuracy of maturity calculations. The multivariate regression equation achieved from PLSR utilizes 95% of the variance information contained in the relative abundances of 1-, 2-, 3- and 9-MPs, 1,7- and 2,7-DMPs, and (methyl-phenanthrene [MP]; dimethyl-phenanthrene [DMP]). The coefficients of these phenanthrenes in this equation are consistent with their geochemical stabilities. The square of the correlation coefficient (R2 = .94) of the multivariate regression equation is much higher than those (0.69–0.89) of the univariate regression equations derived from the previously-defined phenanthrene parameters. It is suggested that the multivariate regression approach presented in this paper substitute the previously-defined parameters and the corresponding univariate regression equations when they are not effective.
Introduction
The maturity of organic matter provides important information for studying the organic carbon cycle, is a necessary criterion for recognizing effective oil and gas source rocks, and is a key element of organic geochemistry and geology research (Barenbaum, 2017; Curiale et al., 1989; Galvez et al., 2020; Olah et al., 2011; Radke et al., 1997; Raiswell and Berner, 1987; Xiao et al., 2014; Zhang et al., 2013, 2019; Zhao et al., 2017; Zhou et al., 2021; Kumar et al., 2022, 2025a; Hakimi et al., 2023). Numerous parameters and methods for thermal maturity assessments have been developed. Vitrinite reflectance (%Ro) indicates time-temperature-integrated thermal stress and the thermal maturity level of organic matter (Kumar et al., 2022; Hatem et al., 2023; Sidik et al., 2024). When source rocks cannot be sampled, vitrinite reflectance cannot be measured, but the maturity of organic matter can be estimated using parameters of molecular distributions such as distributions of steranes, hopanes and polyaromatic hydrocarbons in petroleum.
Polyaromatic hydrocarbons are ubiquitous components of recent and ancient sediments. More than thirteen maturity parameters have been defined using phenanthrene homologues in Type III (terrigenous) kerogen samples, including MPI1, MPI2, MPI3, MPR, F1, F2, DPR, DPI, PAI, PP-1, MDR, PHI, log(MPs/P) (Alexander et al., 1986; Dolzhenko and Fomin, 2022; Kvaldheim et al., 1987; Radke et al., 1982a, 1982b; Radke, 1987; Radke et al., 1991; Stojanović et al., 2007; Wang et al., 2016). These parameters are based on conversion reactions resulting in the decrease of the unstable α-type isomers and the increase of the stable β-type isomers with increasing maturity (Kvaldheim et al., 1987; Radke et al., 1982a, 1982b). These phenanthrene parameters can be used across the entire oil generation window, whereas those parameters derived from saturated biomarker stereoisomers cannot (Kruge, 2000). Several equations for calculating maturity have been established using univariate regression analyses of the phenanthrene parameters. These regression equations have generally been applied to calculate %Ro for both type III and type I-II kerogens. However, they are not always effective in determining the maturity of organic matter in rocks and oils in many sedimentary systems, not only for Type III (Boreham et al., 1988) but also for Types I‒II organic matter (Chen et al., 2020; Yang et al., 2018).
Among the existing maturity parameters, the methyl-phenanthrene index 1 (MPI1 = 1.5 × (2-MP + 3-MP)/(P + 1-MP + 9-MP); where P is phenanthrene, MP is methy-phenanthrene, 3-MP, 2-MP, 9-MP, and 1-MP stand for isomers methylated at the 3-, 2-, 9-, 1-position respectively; Radke et al., 1982a) and distribution fraction parameters (F1 = (2-MP + 3-MP)/(2-MP + 3-MP + 1-MP + 9-MP) and F2 = 2-MP/(2-MP + 3-MP + 1-MP + 9-MP); Kvaldheim et al., 1987), as well as their univariate regression equations, are most widely used in maturity determinations (Bao et al., 1992; Boreham et al., 1988; Chen et al., 2020; Luo et al., 2023; Sivan et al., 2008; Xiao et al., 2014; Yang et al., 2018; Zhang et al., 2019; Zhao et al., 2013). However, the maturities calculated using the univariate regression equations of MPI1, F1 and F2 deviate from the actual data of many basins, including eight Australian basins (Type III kerogen; Boreham et al., 1988), the Middle Upper Rhine Graben in Canada (Type III kerogen; Radke et al., 1991), Songliao Basin (Type III kerogen), Bohai Bay Basin (Type II kerogen; Yang et al., 2018), and Yingen-Ejinaqi Basin in China (Type II kerogen; Chen et al., 2020). Even MPI1 from the Duvernay Formation of the Western Canada Basin does not increase progressively with maturation (Type II kerogen; Requejo, 1994). These studies illustrate that the existing phenanthrene parameters cannot be directly applied in a specific basin. One of the reasons is probably that sedimentary and diagenetic environments may affect the conversion reactions of alkylated phenanthrenes (Hatem et al., 2023; Kumar et al., 2020; 2024a, 2024b, 2025a; Nilankar et al., 2024; Sidik et al., 2024; Singh and Kumar, 2020; Sun, 1998; Zhao et al., 2021, 2023, 2024; Zumberge et al., 2020). Therefore, the maturity parameters need re-calibration for each hydrocarbon system before using them (Dolzhenko and Fomin, 2022; Peters et al., 2005). However, in many areas, the squares of the correlation coefficients
Studies of organic matter maturity in the world have accumulated a mass of phenanthrene and alkyl-phenanthrene data. How to effectively use these big data for the maturity evaluation of organic matter is an important issue needing prompt solution. Moreover, if the issue in the application of phenanthrene and alkyl-phenanthrene data is addressed via exploration of a new approach, this approach may help to improve the use of the data of other alkylated aromatics for maturity study.
In basins, thermal maturity has different impacts on different aromatic compounds. Multivariate statistical analyses using multiple aromatic compounds may improve the reliability of the maturity calculations. Multivariate statistical methods, such as principal components analysis, nonlinear mapping, and discriminant analysis, have become important data analysis methods in petroleum geochemistry and geology (Budzinski et al., 1995; Kruge, 2000; Kvaldheim et al., 1987; Radke et al., 2000, 2001; Zhang, 1991; Zhang et al., 2014, 2019). However, partial least square regression (PLSR) analysis has not been applied to maturity calculations.
The aim of this study is first to examine the univariate relations of methyl- and dimethyl-phenanthrenes in extracts of rock samples containing Types I‒II kerogen, and then to investigate the multivariate relation of these phenanthrenes to measured maturity (%Ro) using PLSR analysis. In addition, the geochemical stabilities of these compounds, which control the conversion reactions, are integrated into the study. As a result, we suggest that when the previously-defined maturity parameters and their univariate regression equations are not effective, they be replaced by multivariate regression analyses of methyl- and dimethyl-phenanthrenes.
Samples and methods
Samples
The study area of this paper is the Songliao Basin, China. This basin developed mainly during the Early Cretaceous is a super petroliferous basin with high quality of nonmarine petroleum source rocks and considerable hydrocarbon potential. The Cretaceous Qingshankou Formation is one of the important layers of source rocks. This formation is further divided into the Qing-1, Qing-2 and Qing-3 Members from the bottom to top. The source rocks are mainly semi-deep to deep lacustrine sediments, dominated by gray-black shales with black mudstone (Zhou and Littke, 1999). They contain predominantly Type I kerogen with minor Type II1, and the total organic carbon (TOC) of 1.5wt%~2.5wt% with the maturity Ro from 0.5% to 1.7%.
To examine the effectiveness of the previously-defined parameters, the samples should be restricted in one formation in one basin, with little variation in organic matter type. In this study, thirty-seven core samples (100 g for each) were collected from the Qing-1, Qing-2 and Qing-3 Members in the Cretaceous Qingshankou Formation of eleven wells in the Songliao Basin (Table 1). These wells are vertical and were drilled with water-based mud systems. The core samples are conventional, not sidewall, and were taken from Members Qing-1, -2, and -3 in the Cretaceous Qingshankou Formation in this basin, with the depth from 1474.57 to 2419.54 m. Their specific depths, horizon and lithology are listed in Table 1.
Geological information of the samples in this study.
K1qn1: Qing-1 Member of the Cretaceous Qingshankou Formation; K1qn2: Qing-2 Member; K1qn2 + 3: Qing-2 and Qing-3 Members.
Measurements of vitrinite reflectance and phenanthrenes
Reflectance measurements (random, oil immersion) were tested under an oil immersion objective lens of 50× magnification on a Leica DM4500P microscope coupled with CRAIC QDI302 microscope spectrophotometer. The vitrinite reflectance values were calibrated with the reference materials including yttrium aluminium garnet (GBW13402, Ro = 0.90%), and sapphire (GBW13403, Ro = 0.59%). The number of measurements in each sample varies from 30 to 60 to obtain sufficient measurements (Tu et al., 2012; Xiao et al., 2008a). The standard deviations of vitrinite reflectance for individual samples are from 0.03% to 0.06% with the average of 0.05% (see details in the Results section).
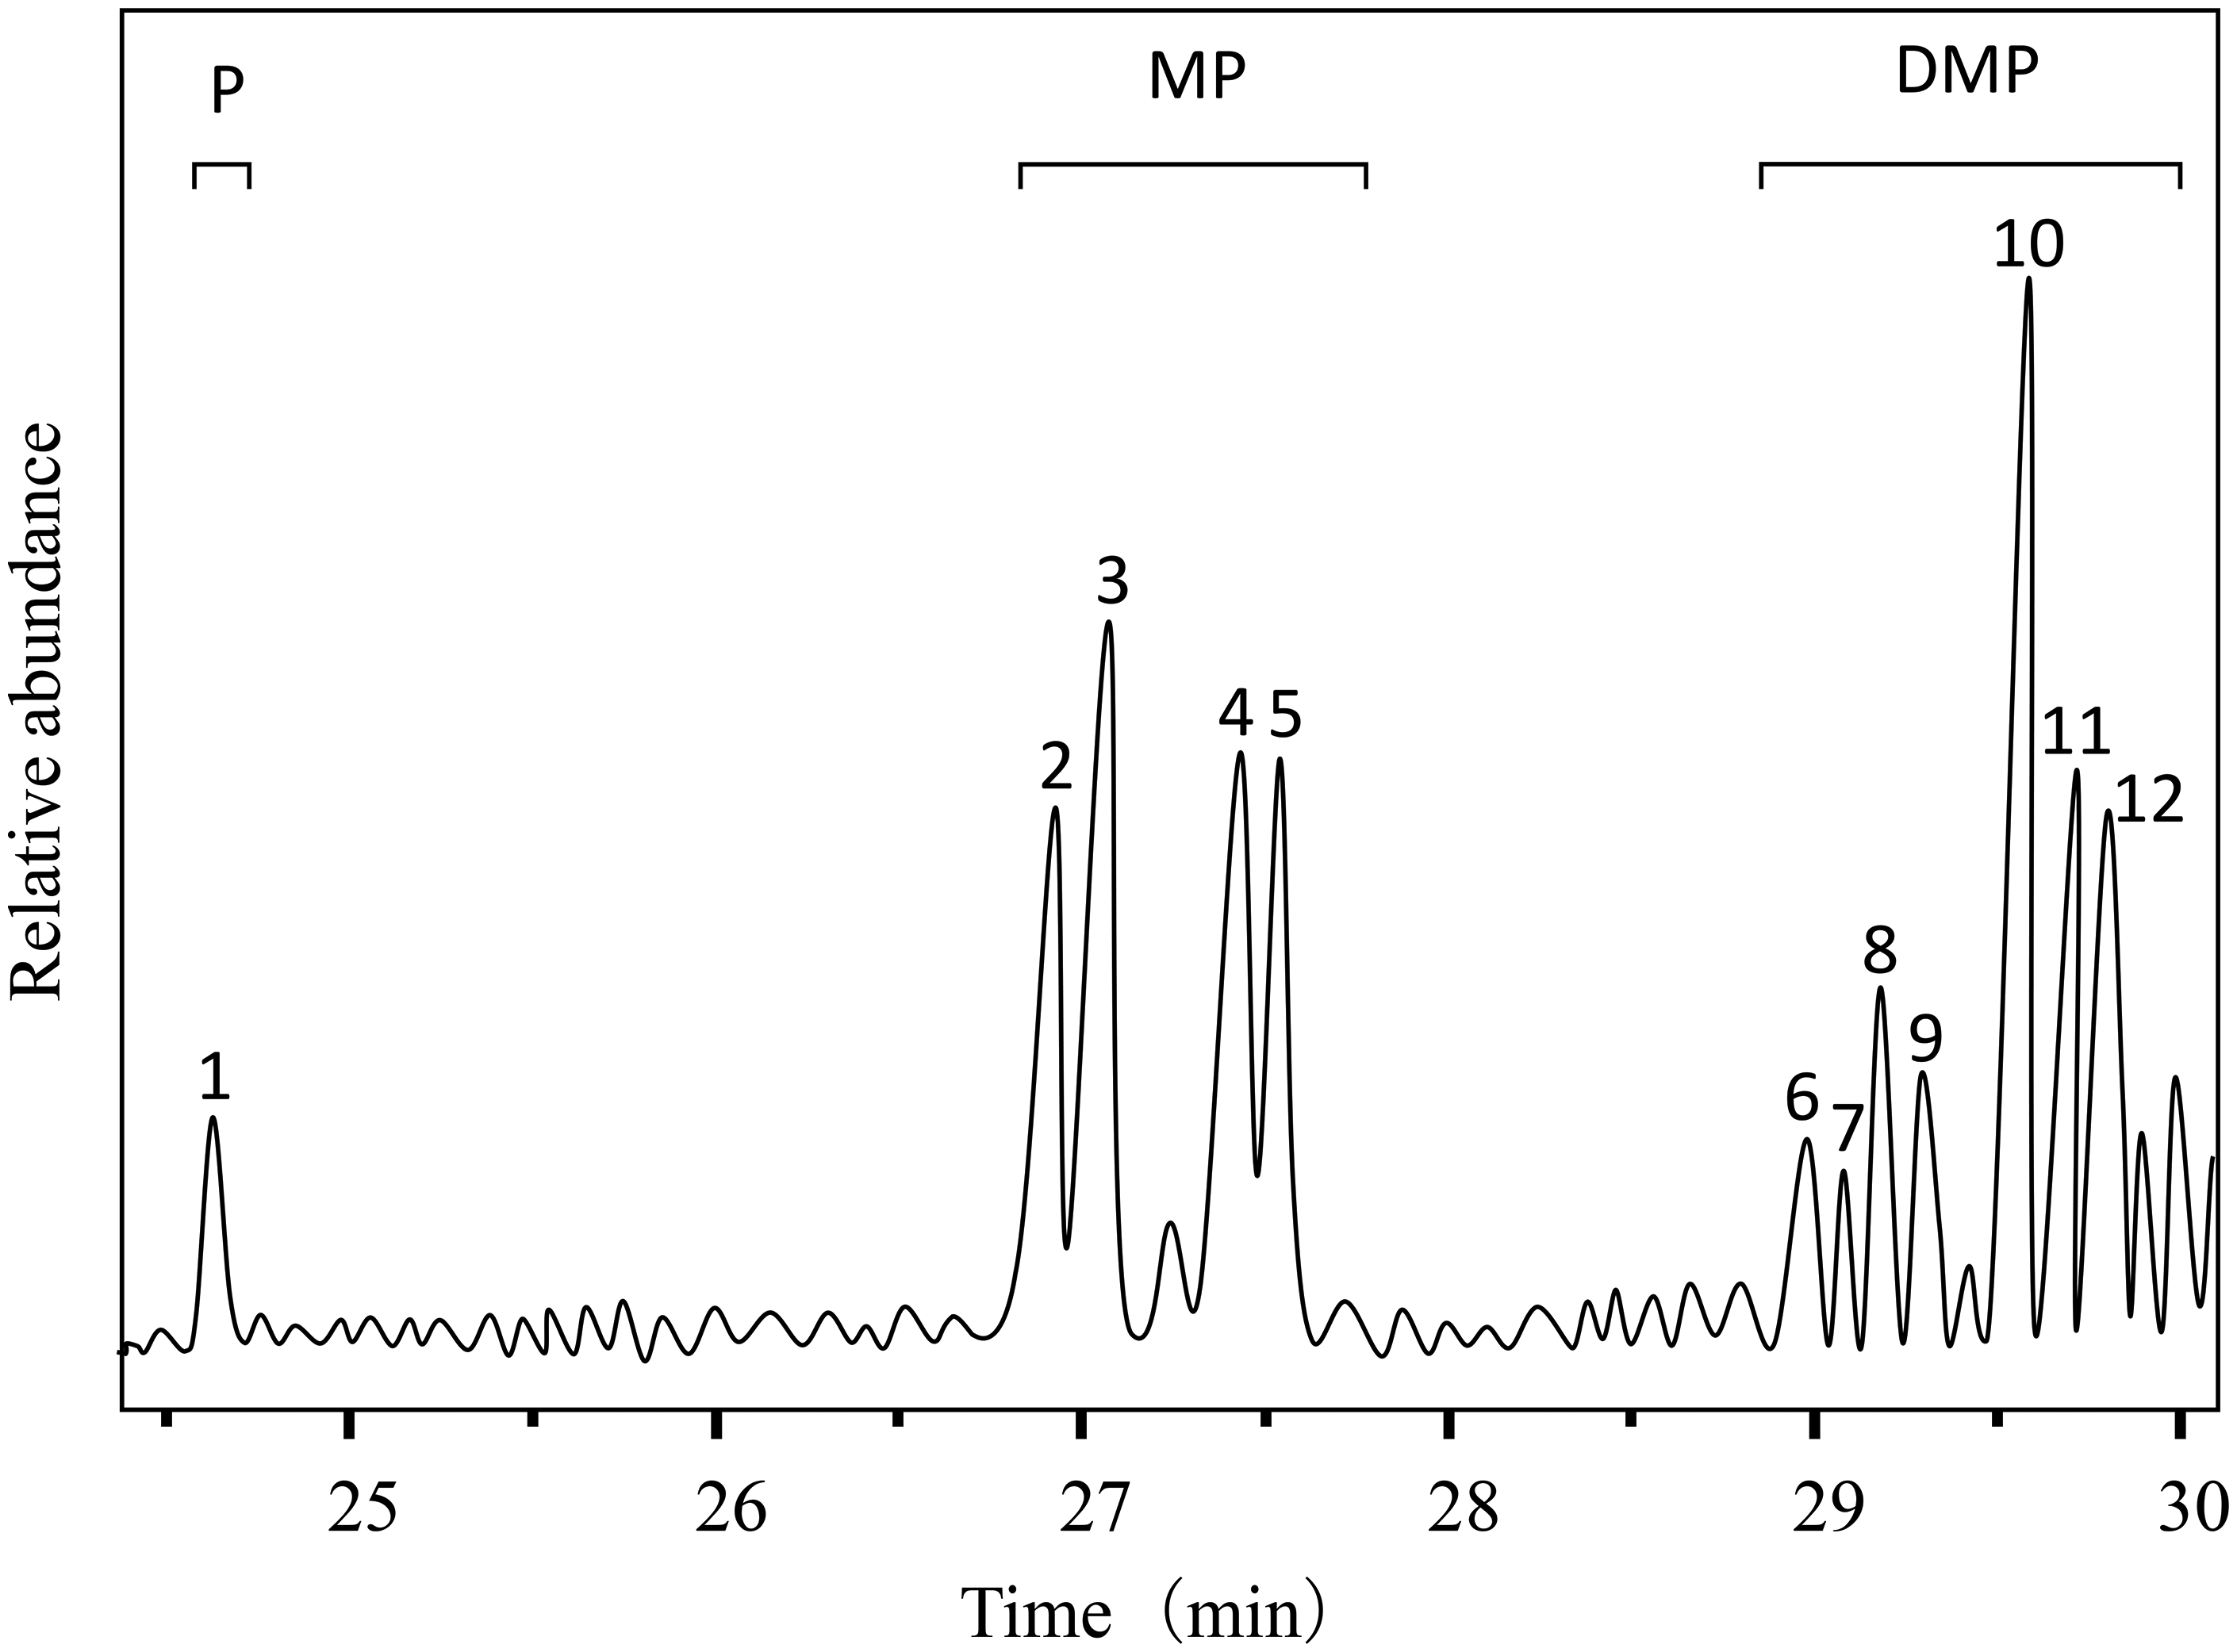
The individual core samples were crushed to 100 mesh and subsequently homogenized. The soluble organic matter in each sample was extracted using Soxhlet method (Hu et al., 2021). The aromatic fractions of the extracts were analyzed by gas chromatography (GC, Type Agilent 7890A) using an HP-5MS capillary column with helium as the carrier gas. Carrier gas flow rate is 15–25 cm/s. The vaporizer temperature is 310°C (Xiao et al., 2008b). The relative abundances of the alkylated phenanthrenes were quantified using the normalized areas of the peaks as shown in Figure 1. The analytical uncertainties of the normalized abundances are less than 1.3%.
Measured Ro, normalized abundances of six phenanthrene isomers, and maturity parameters of samples from the Cretaceous Qingshankou Formation in the Songliao Basin, China.a
The data used to calculate the maturity parameters are listed in Supplementary Table S1. SD = Standard Deviation; MPI1 = 1.5 × (2-MP + 3-MP)/(P + 1-MP + 9-MP); P is phenanthrene, MP is methyl-phenanthrene, 3-MP, 2-MP, 9-MP, and 1-MP stand for the respective methyl-phenanthrene isomers, methylated at the 3-, 2-, 9-, 1-position (Radke et al., 1982a). F1 = (2-MP + 3-MP)/(2-MP + 3-MP + 1-MP + 9-MP); F2 = 2-MP/(2-MP + 3-MP + 1-MP + 9-MP) (Kvaldheim et al., 1987).
Partial least square regression
Some methyl- and dimethyl-phenanthrenes are correlated to each other (see Results), resulting in the multicollinearity problem that influences multivariate regression analyses and must be solved (Wold et al., 1984, 2001). PLSR is superior to ordinary least square regression in solving this problem (Wang et al., 2006; Wang et al., 2024; Wold et al., 1984, 2001). Both PLSR and principal component analysis (PCA) construct components. PLSR specifically optimizes these components to maximize their correlation with the response variable (e.g., Ro), but PCA cannot. Therefore, the multivariate data analysis software of SIMCA-P (version 11.5) was employed for the PLSR analysis in this study to establish a multivariate regression equation for maturity prediction.
The data for each variable, including Ro, methyl-phenanthrenes (MPs) and dimethyl-phenanthrenes (DMPs), are standardized by subtracting the mean and dividing by the standard deviation. Using the standardized data of descriptors (MPs and DMPs), PLSR analysis establishes the components that aim to capture all available descriptor information while ensuring high correlation to the response (Ro).
After computing the components, the appropriate number of them needs to be determined mainly by using the evaluation parameter
A multivariate regression equation needs to be validated using the goodness of fit between measured Ro and calculated Ro (Rc) after establishing. Commonly, the square of the correlation coefficient (R2) between Ro and Rc is used to evaluate a regression equation. Since the samples used to calculate Ro are all involved in building the regression equation, R² mainly reflects regression accuracy but cannot effectively assess its predictive performance on new data. To evaluate the predictive ability of a multivariate regression equation, a cross-validation method in multivariate regression analysis is applied. In this method, Rc for each sample is predicted using a regression equation constructed from all the other samples, not from all the samples. The R² between the measured Ro and the predicted Rc is then calculated and represented by Rp². Rp² derived from this cross-validation method can be used to evaluate the predictive ability of a multivariate regression equation and in this way to validate the equation (Wang et al., 2006).
A multivariate regression equation can also be validated through descriptors. The cumulative proportion of the deviation (relative to the mean) squares of the entire descriptors explained by the model components, denoted as R²X(cum). It can be used to examine the extent to which the descriptor data are utilized and to help to evaluate the effectiveness of a multivariate regression equation (Eriksson et al., 2013). Generally, the higher R²X(cum) is, the better a multivariate regression equation is.
In PLSR, the variable importance in projection (VIP) of a descriptor to the response is computed from the weights of descriptors in components and correlation coefficients of components with response, and quantitatively describes the importance of a descriptor for the response (Ji et al., 2011; Wang et al., 2006). The larger the VIP value, the greater the importance of a descriptor for the response. The descriptors with VIP values larger than one show the above-average importance for predicting the response and are deemed to be relatively important descriptors (Favilla et al., 2013; Wang et al., 2006).
Results
Maturity of the samples
The test results of Ro values of our samples range from 0.68% to 1.35% with a mean value of 1.09% (Table 2), indicating that the organic matter in the samples entered the oil window (Tissot et al., 1987; Mukhopadhyay, 1994). Therefore, the maturity of the organic matter in these samples is suitable for the study of the parameters and methods for maturity calculation of organic matter.
Normalized methyl- and dimethyl-phenanthrenes
The relations between phenanthrenes and maturity were analyzed with the normalized data of relative abundances of phenanthrenes obtained from GC analyses (Kvaldheim et al., 1987; Radke et al., 1982a). In the early studies, phenanthrene was used in the normalization, such as in MPI1 and MPI2 (Radke et al., 1982a). However, the subsequent studies found that the linear correlation between Ro and normalized methylated phenanthrenes is weakened if phenanthrene is included in the normalization (Kvaldheim et al., 1987; Telnaes et al., 1987). Therefore, subsequent parameters such as F1 and F2 do not use phenanthrene (Kvaldheim et al., 1987; Telnaes et al., 1987). The normalization of methylated phenanthrenes also excludes phenanthrene in this paper. On the other hand, individual peaks containing two or more dimethyl-phenanthrene isomers (Figure 1 and Table 3) were not used either. The reason is that these peaks reflect mixtures of these isomers with different thermal stabilities (see details in Budzinsk et al., 1993). Consequently, the methyl- and dimethyl-phenanthrenes used in this work include 3-MP, 2-MP, 9-MP, 1-MP, 2,7-DMP, and 1,7-DMP. The normalized results of these six compounds are listed in Table 2.
Gc peaks of phenanthrene and its homologs identified from gas chromatogram.a
P: phenanthrene; MP: methyl-phenanthrene; DMP: dimethyl-phenanthrene. Nine dimethyl-phenanthrenes cannot be separated under the conditions of the GC analyses.
The normalized methyl- and dimethyl-phenanthrenes abundances vary significantly. 9-MP ranges from 8.06% to 32.31% with an average of 22.25%, and 1-MP from 7.21% to 25.61% with an average of 18.96%. Their means exceed those of 2- and 3-MPs (β-type) (Table 2 and Figure 2). This phenomenon was also observed in the early stage of thermal evolution (Li et al., 2022; Song et al., 2007).
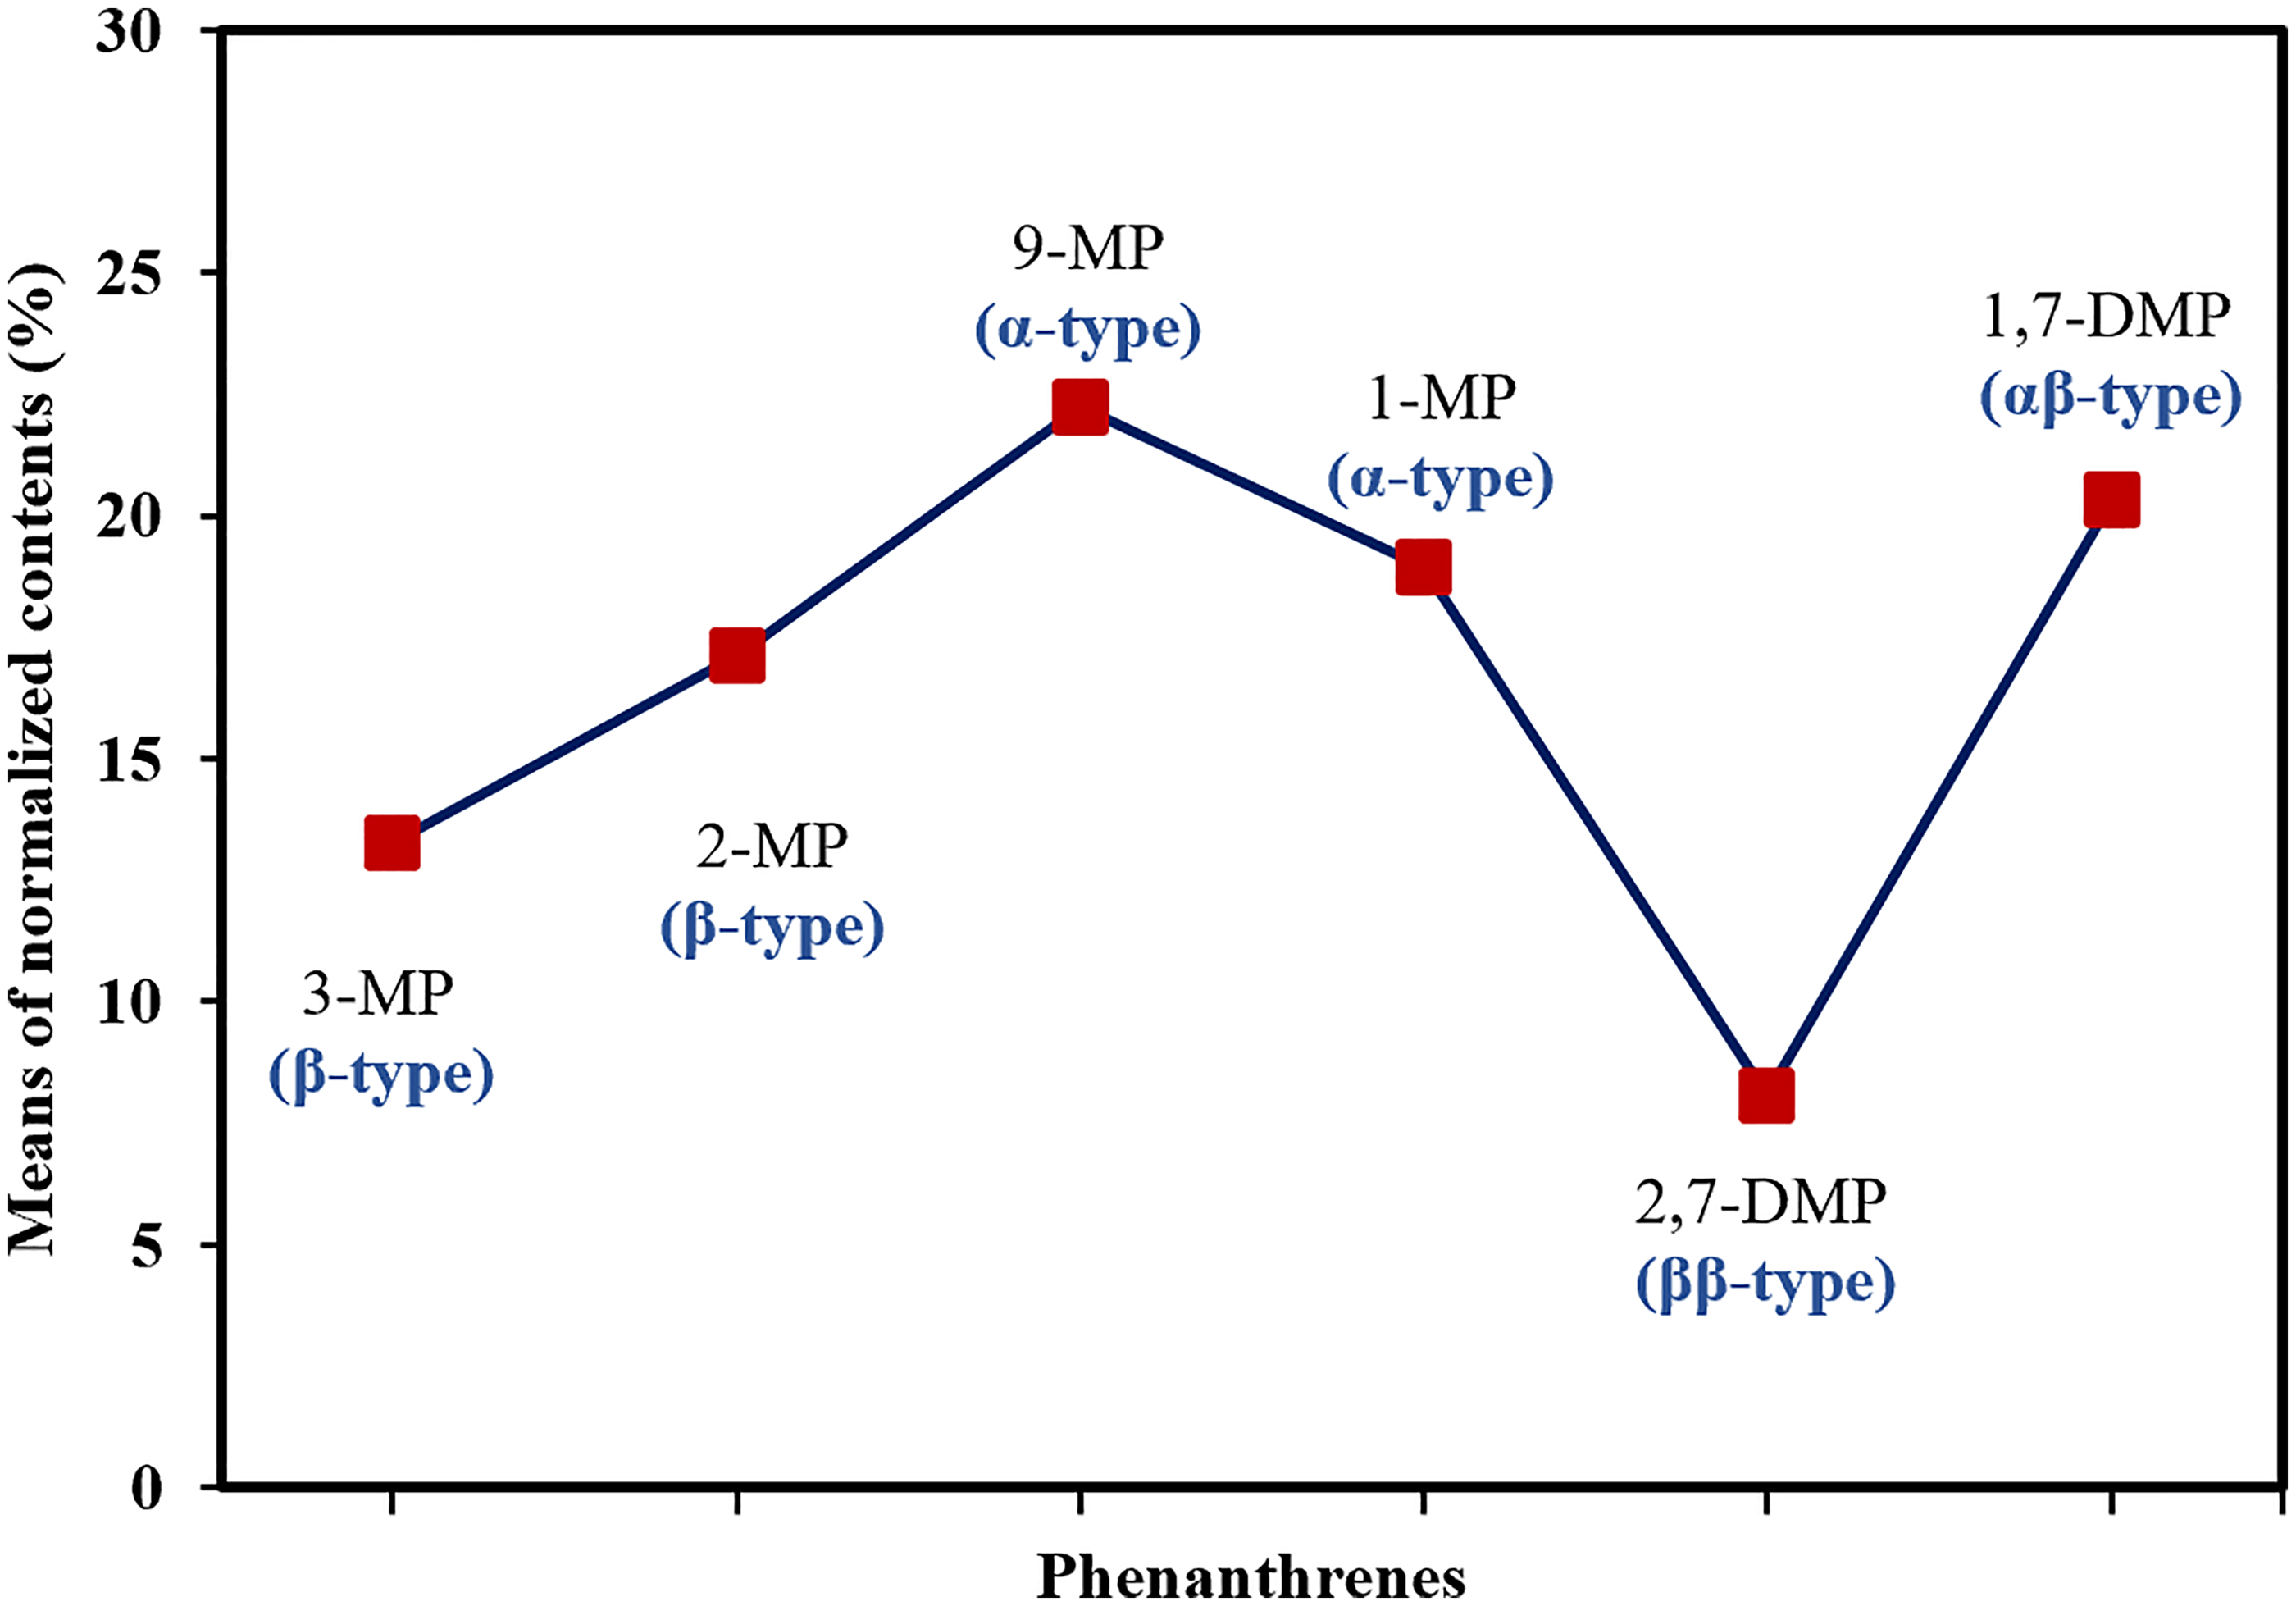
Distribution of the average values of the normalized methylated phenanthrene contents in the samples from the Cretaceous Qingshankou Formation in the Songliao Basin, China.
The normalized abundance of 1,7-DMP ranges from 8.68% to 57.77%, and that of 2,7-DMP from 2.03% to 18.02% with the average at 8.08%. The average value of 2,7-DMP (ββ-type) is lower than that of 1,7-DMP (αβ-type; Table 2 and Figure 2), which was also observed in the Mahakam Delta in Indonesia (Budzinski et al., 1993) and the Keras Basin in Indonesia (Budzinski et al.,1995).
Correlations between phenanthrenes
2- and 3-MPs belong to β-type and are correlated to each other (Figure 3(a)). 1- and 9-MPs are α-type isomers and are correlated too (Figure 3(b)). However, 1-MP (α-type) is not correlated to 2-MP (β-type), and 9-MP (α-type) not to 3-MP (β-type; Figure 3(c) and (d)). Although α- and β-types of methyl phenanthrenes can form via methylation of phenanthrene and conversion reactions among methyl phenanthrenes, more β-type methyl phenanthrenes can derive from the conversion reactions than α-type ones (Alexander et al., 1995; Behar et al., 1999; Kvaldheim et al., 1987; Nomoto et al., 2000; Radke et al., 1982a, 1982b; Smith et al., 1995; Voigtmann et al., 1994). This is probably the reason why α-type methyl phenanthrenes are not correlated to β-type methyl phenanthrenes.
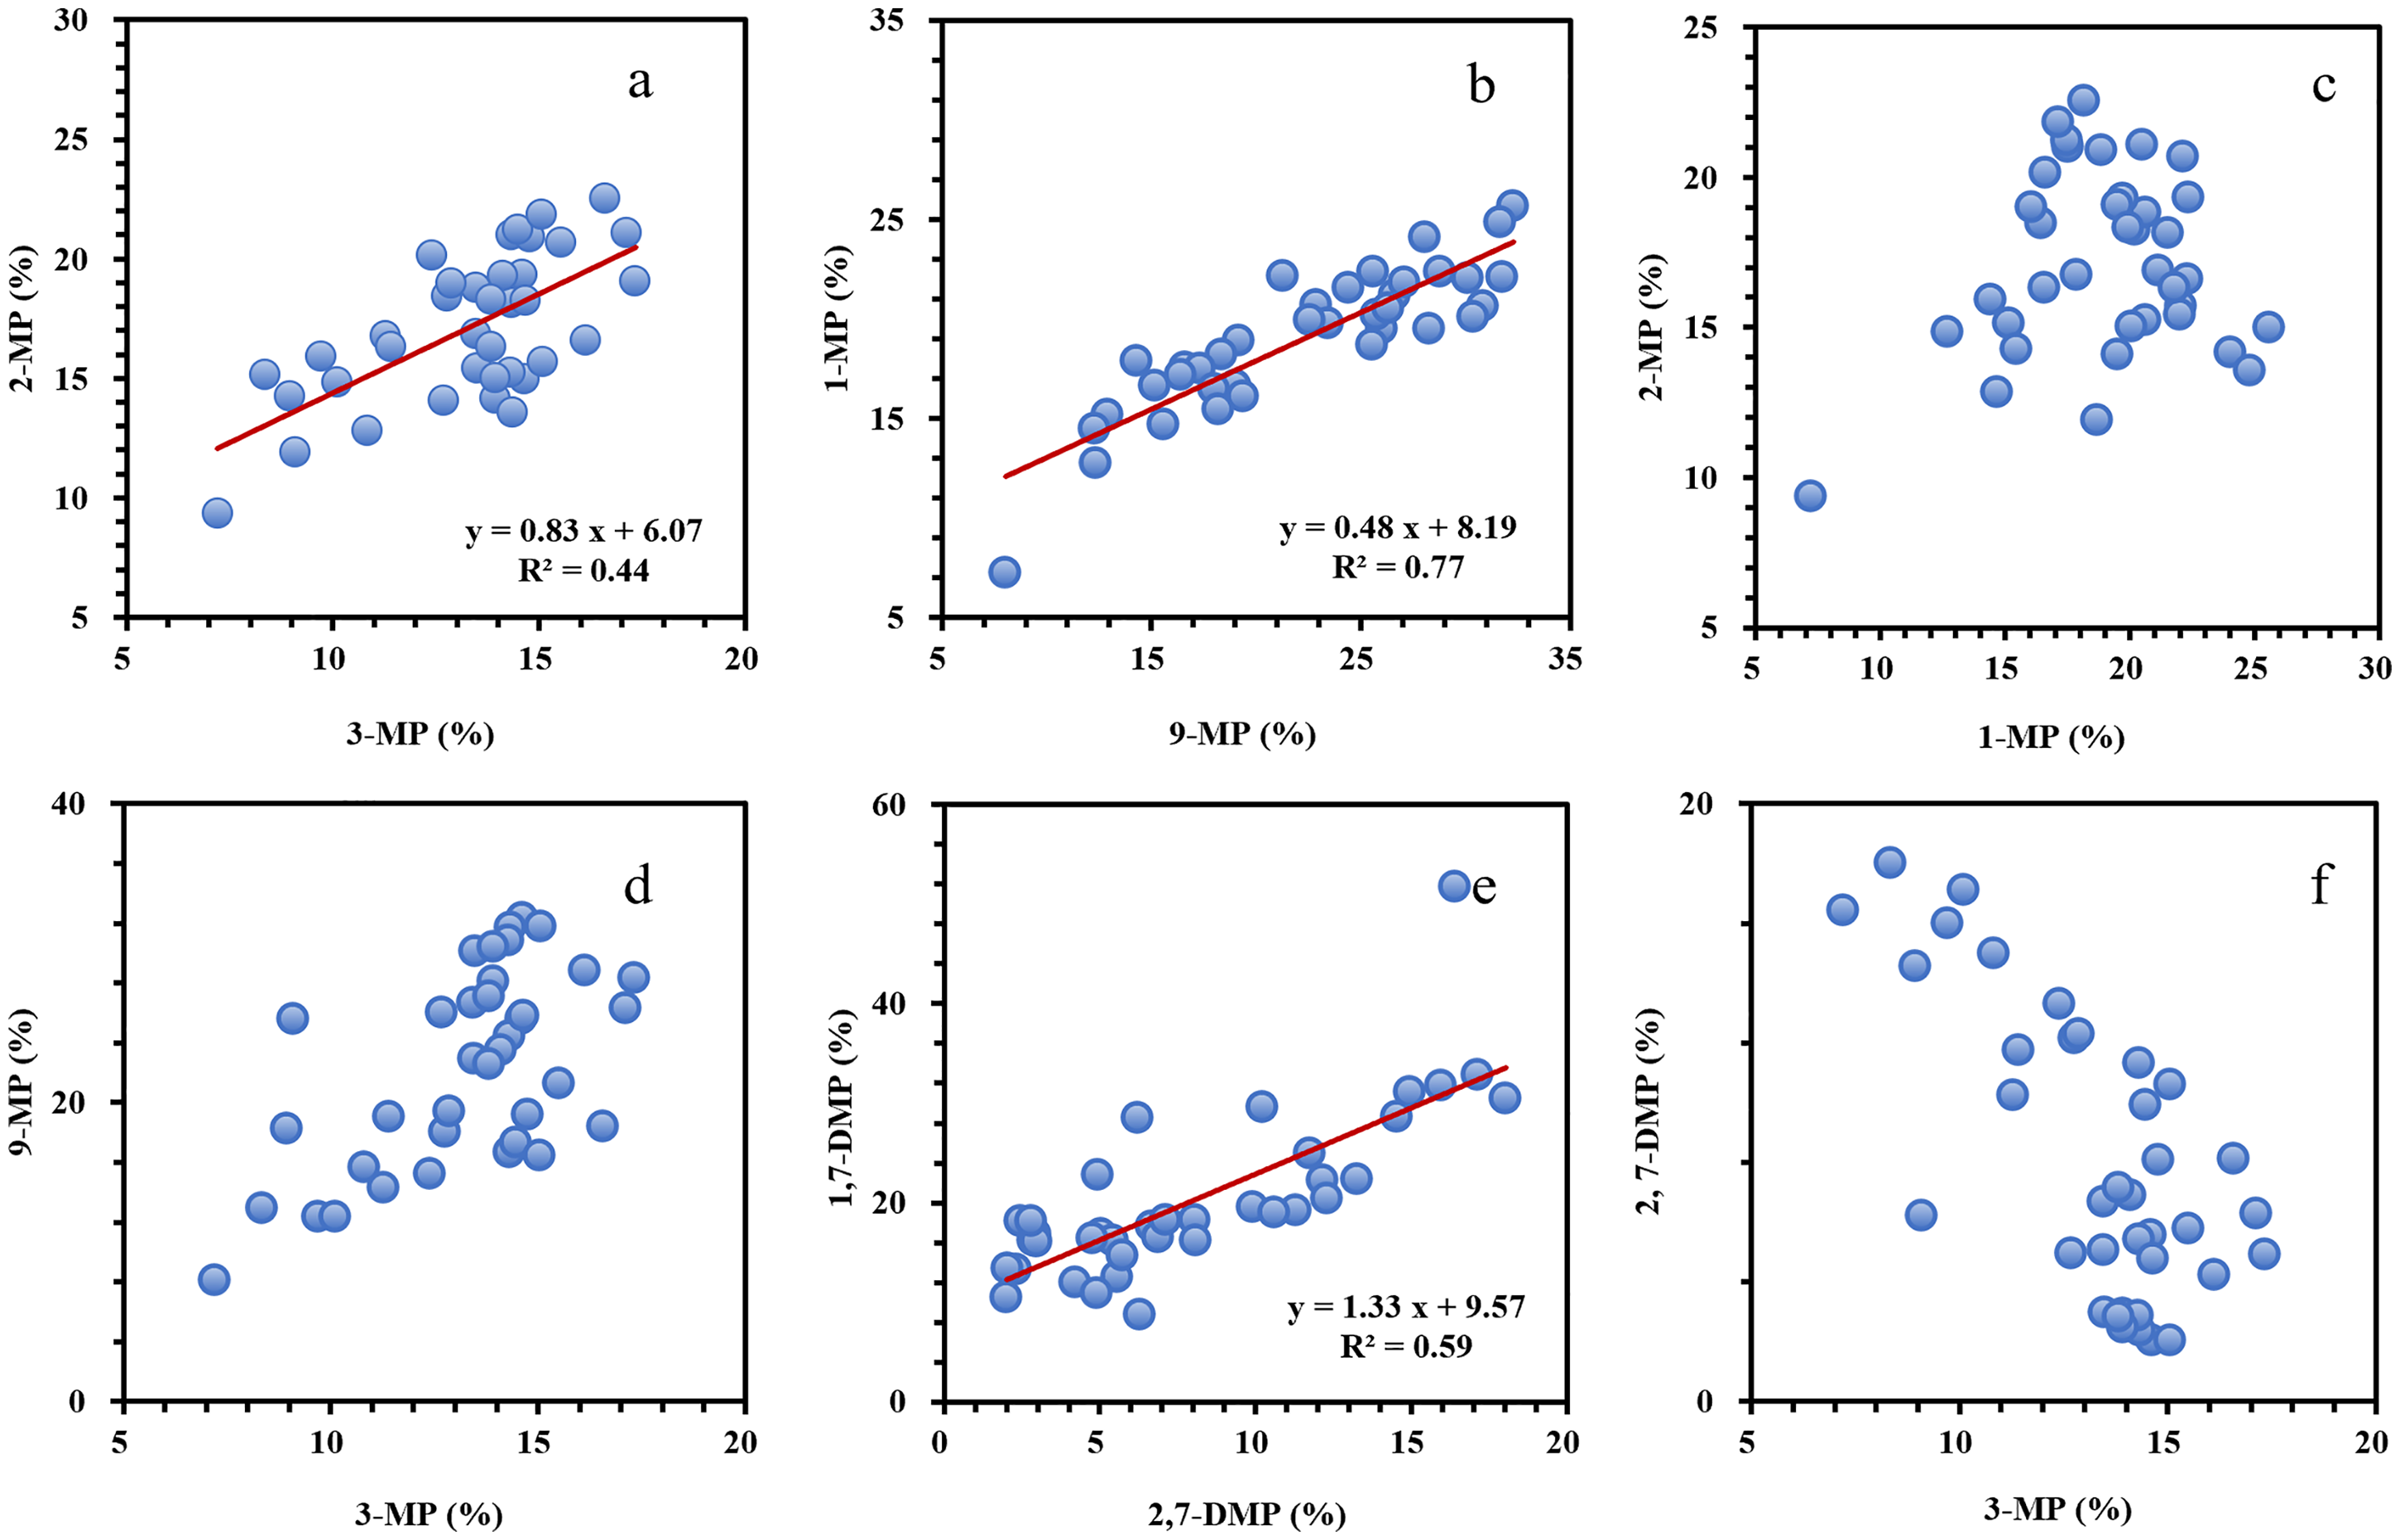
Cross plots of methyl- and di-methyl phenanthrenes in the samples from the Cretaceous Qingshankou Formation in the Songliao Basin, China.
ββ-type isomers are the most stable among all the types of DMPs. 2,7-DMP is a ββ-type isomer. Although 1,7-DMP is αβ-type, it is the most stable among αβ-type and αα-type isomers (Budzinski et al., 1993) and can be a product of the conversion reactions among methylated phenanthrenes (Behar et al., 1999). Figure 3(e) shows that 1,7- and 2,7-DMPs are roughly correlated to each other. In Figure 3(f), 3-MP (β-type) and 2,7-DMP (ββ-type) are roughly correlated possibly because they are all stable compounds.
Discussion
Univariate relations of maturity parameters to Ro
One of the widely used maturity parameters is MPI1 (MPI1 = 1.5 × (2-MP + 3-MP)/(P + 1-MP + 9-MP)), as mentioned in the Introduction. The vitrinite reflectance has been calculated using the univariate regression equation established with the measured Ro and MPI1 values of 16 samples of type III kerogen from the Western Canada Basin (Radke et al., 1982a). This equation is shown in Figure 4(a). However, it does not accurately predict the actual Ro values of the samples of Types I‒II1 kerogen from the Cretaceous Qingshankou Formation in the Songliao Basin, China (Figure 4(a)). The difference between the equation and actual data was also observed in the Bohai Bay Basin in China (Type-II kerogen; Yang et al., 2018), eight Australian basins (Type-III kerogen; Boreham et al., 1988), the Canada middle Upper Rhine Graben (Type-III kerogen; Radke et al., 1991) and Songliao Basin in China (Type III kerogen). The difference between the equation and actual data is probably due to source control on phenanthrene distributions (Radke et al., 1986). Therefore, the univariate regression equation of MPI1 (Radke et al., 1982a) is definitely not effective in any basins, and cannot be directly used before it is validated.
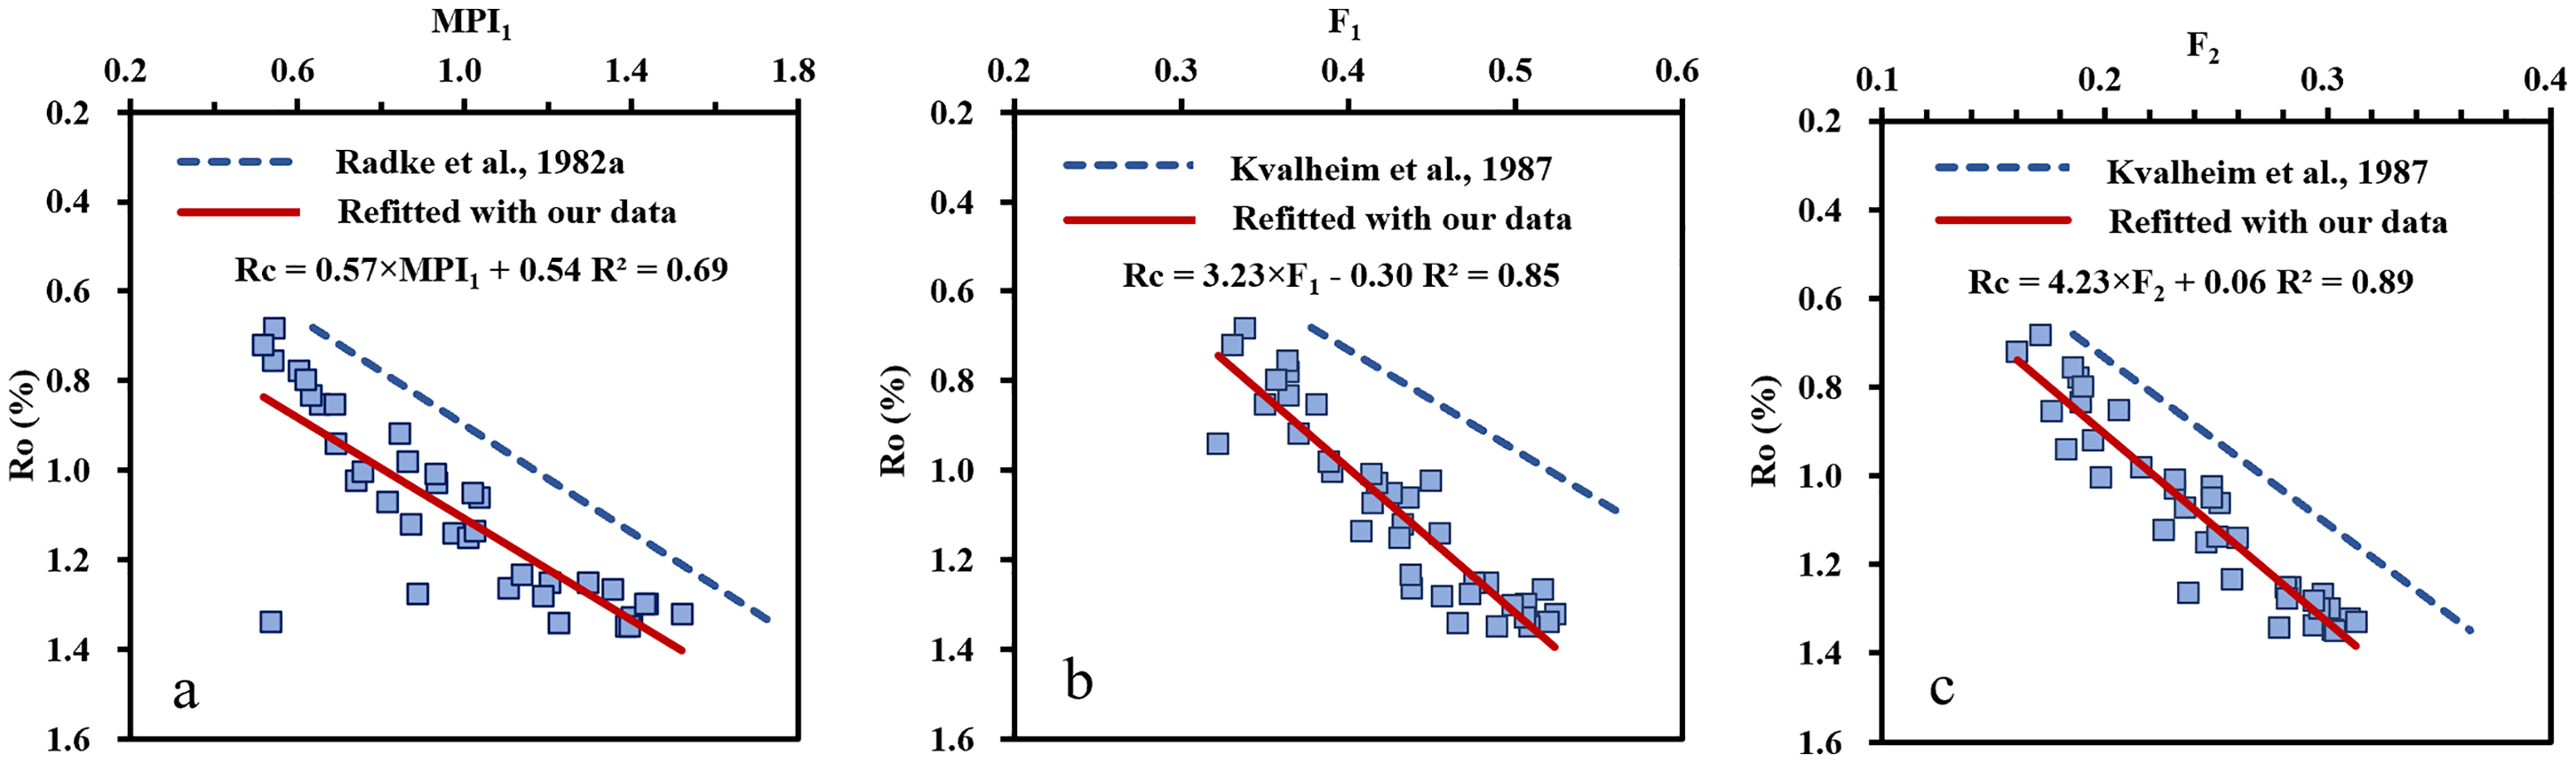
Relations of MPI1(a), F1 (b), and F2 (c) to Ro of the samples from the Cretaceous Qingshankou Formation in the Songliao Basin, China. MPI1 = 1.5 × (2-MP + 3-MP)/(P + 1-MP + 9-MP), F1 = (2-MP + 3-MP)/(2-MP + 3-MP + 1-MP + 9-MP) and F2 = 2-MP/(2-MP + 3-MP + 1-MP + 9-MP). The blue dashed lines represent the maturity regression equations in Radke et al. (1982a) and Kvaldheim et al. (1987), while the red solid lines are defined by refitting new equations to the data.
The difference between the equation and actual data may be solved by refitting the data. However, the square of the correlation coefficient obtained from refitting the data from the Cretaceous Qingshankou Formation in the Songliao Basin is only 0.69 (Figure 4(a)). The low correlations between maturity and MPI1 were also reported by studies for type III kerogen in eight Australian basins (
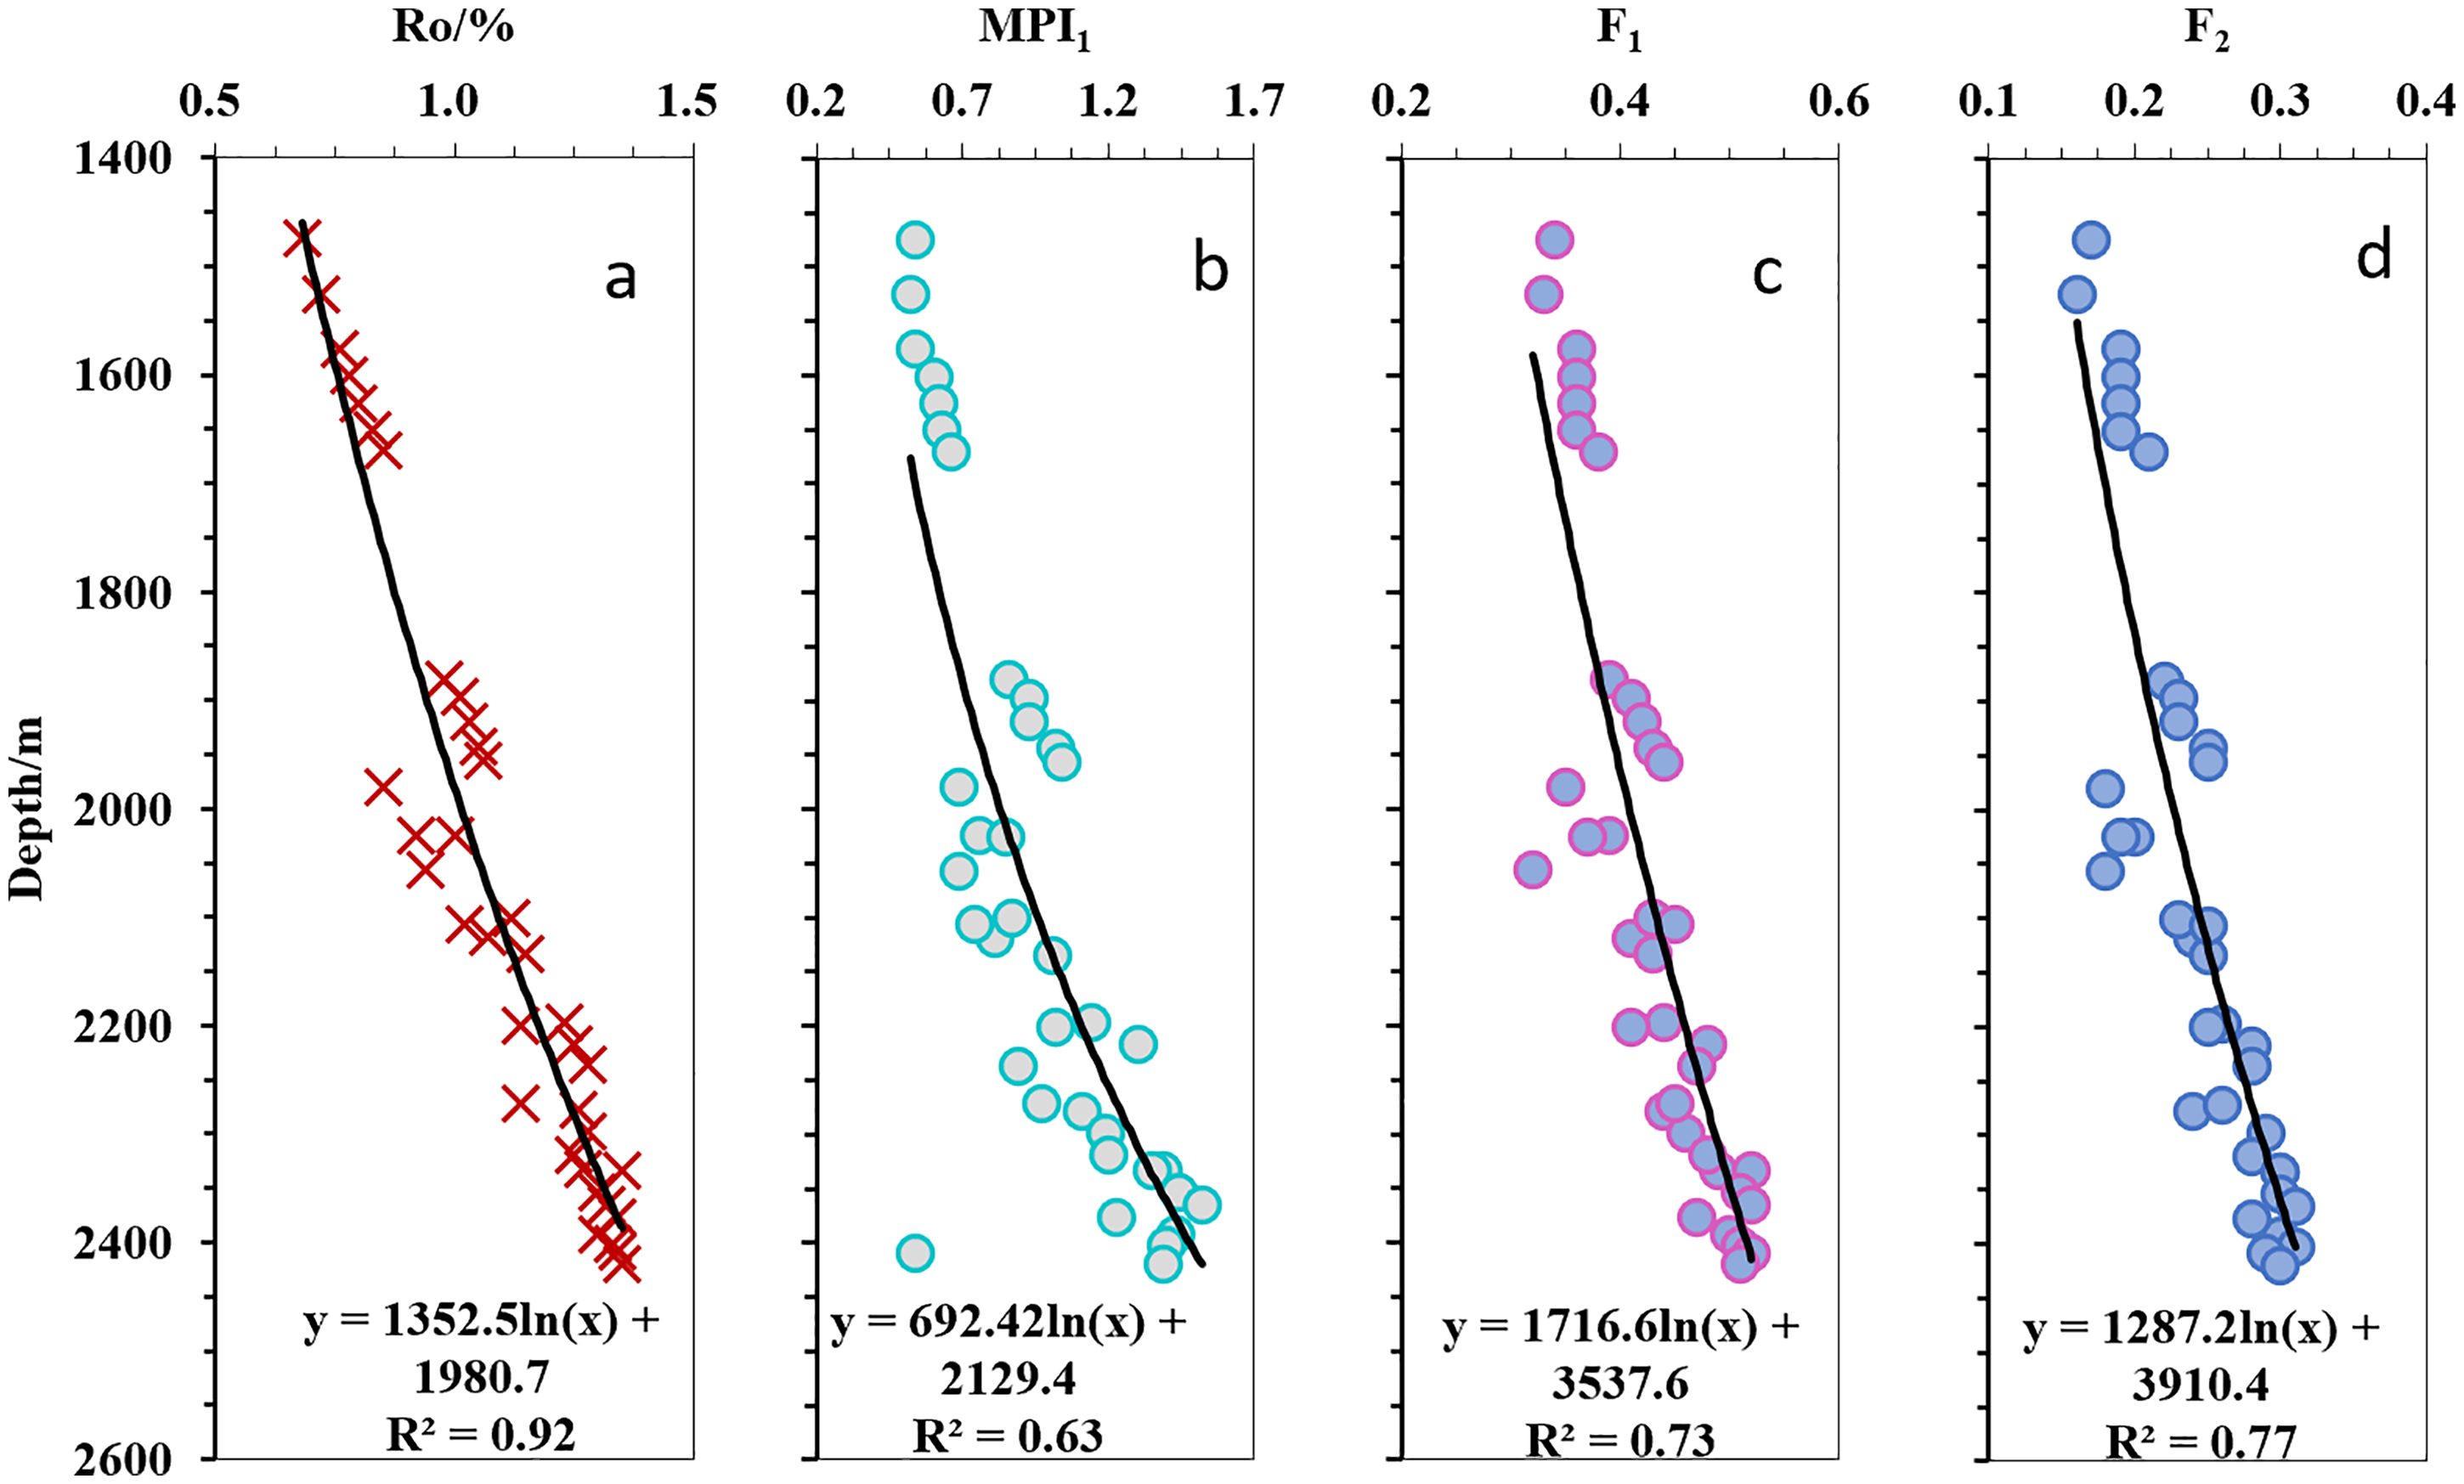
Relations of Ro(a), MPI1 (b), F1 (c), and F2 (d) to the vertical depth of the samples from the Cretaceous Qingshankou Formation in the Songliao Basin, China. The definitions of MPI1, F1 and F2 in the caption of Figure 4.
To improve the calculation of maturity (%Ro), more parameters were proposed (Alexander et al., 1986; Dolzhenko and Fomin, 2022; Kvaldheim et al., 1987; Radke, 1987; Radke et al., 1982b; Radke et al., 1991; Stojanović et al., 2007; Wang et al., 2016). In the maturity parameters of phenanthrenes proposed after MPI1, the distribution fractionation parameters F1 and F2 are representative [F1 = (2-MP + 3-MP)/(2-MP + 3-MP + 1-MP + 9-MP) and F2 = 2-MP/(2-MP + 3-MP + 1-MP + 9-MP); Kvaldheim et al., 1987; Telnaes et al., 1987]. As mentioned in the Results, phenanthrene was excluded in these two parameters. Two univariate regression equations for maturity calculation were set up with F1 and F2, respectively, using 15 samples with Type-III kerogen from England, Norway, West Africa, and other regions (Kvaldheim et al., 1987). However, these two equations still do not accurately predict the Ro values of the samples from the Cretaceous Qingshankou Formation in the Songliao Basin, China (Figure 4(b) and (c)). Similar lack of accuracy was also reported in the studies of type II kerogen from the Yingen-Ejinaqi Basin and marine carbonate rock in China (Bao et al., 1992; Chen et al., 2020). Therefore, the univariate regression equations of F1 and F2 are not effective in any basins, and also cannot be directly used before they are validated.
The data from the Cretaceous Qingshankou Formation in the Songliao Basin were refitted also with F1 and F2, Figure 4(b) and (c) indicate that by excluding phenanthrene in the normalization of phenanthrenes, the correlations of Ro with methylated phenanthrenes were improved. However, the squares of the correlation coefficients are still lower than 0.9. Poor correlations of these two parameters with Ro are also documented in the studies for both type II (
The data set of phenanthrene and methylated phenanthrenes in this study is restricted in one formation in one basin, with the same organic matter type. The reason why the existing maturity parameters cannot work well may not be due to source influence. It may lie in their definitions and methods for their application. They were mainly defined as ratios of stable compound(s) to unstable compound(s) or to the sum of unstable compounds and stable compound(s) (Alexander et al., 1986; Kvaldheim et al., 1987; Radke, 1987; Radke et al., 1982a, 1982b; Srinivasan et al., 2022; Zumberge et al., 2020). The relations between Ro and the parameters were established with univariate regression analyses. This kind of univariate methods can only use the maturity information carried by the ratios of the finite compounds (denominators and numerators). The maturity information carried by more compounds cannot be utilized synthetically. If the maturity information carried by the finite compounds cannot sufficiently reflect maturity, these ratio parameters cannot work well. This is probably the reason why the univariate regression equations cannot achieve significant correlations of maturity with the previously defined maturity parameters, in the Songliao Basin and many other basins. Consequently, it is uncertain that the existing parameters and the equations obtained from univariate regression analyses can be successfully applied to maturity calculation for all kerogen types.
Multivariate relation of phenanthrenes to Ro
Multivariate regression analysis can simultaneously exploit more information contained in the distributions of multiple phenanthrenes to characterize Ro, compared with univariate regression analysis. In the PLSR analysis of the data from the Cretaceous Qingshankou Formation in the Songliao Basin, the six phenanthrenes were used as descriptors, and the measured Ro as the response. After standardizing the data, the components were computed (see Appendix B). To determine the appropriate number of the components, their Q2 values (Table S2 in the Supplementary Data) were calculated and plotted in Figure 6(a). When the first two components are selected, Q2cum (Table S2 in the Supplemental Data) becomes maximal and reaches 0.94 (Figure 6(b)), indicating that the regression equation with two components is both reliable and robust with excellent predictive ability (see details in Appendix A, Eriksson et al. (2013)). Consequently, the number of the appropriate components was determined to be two.
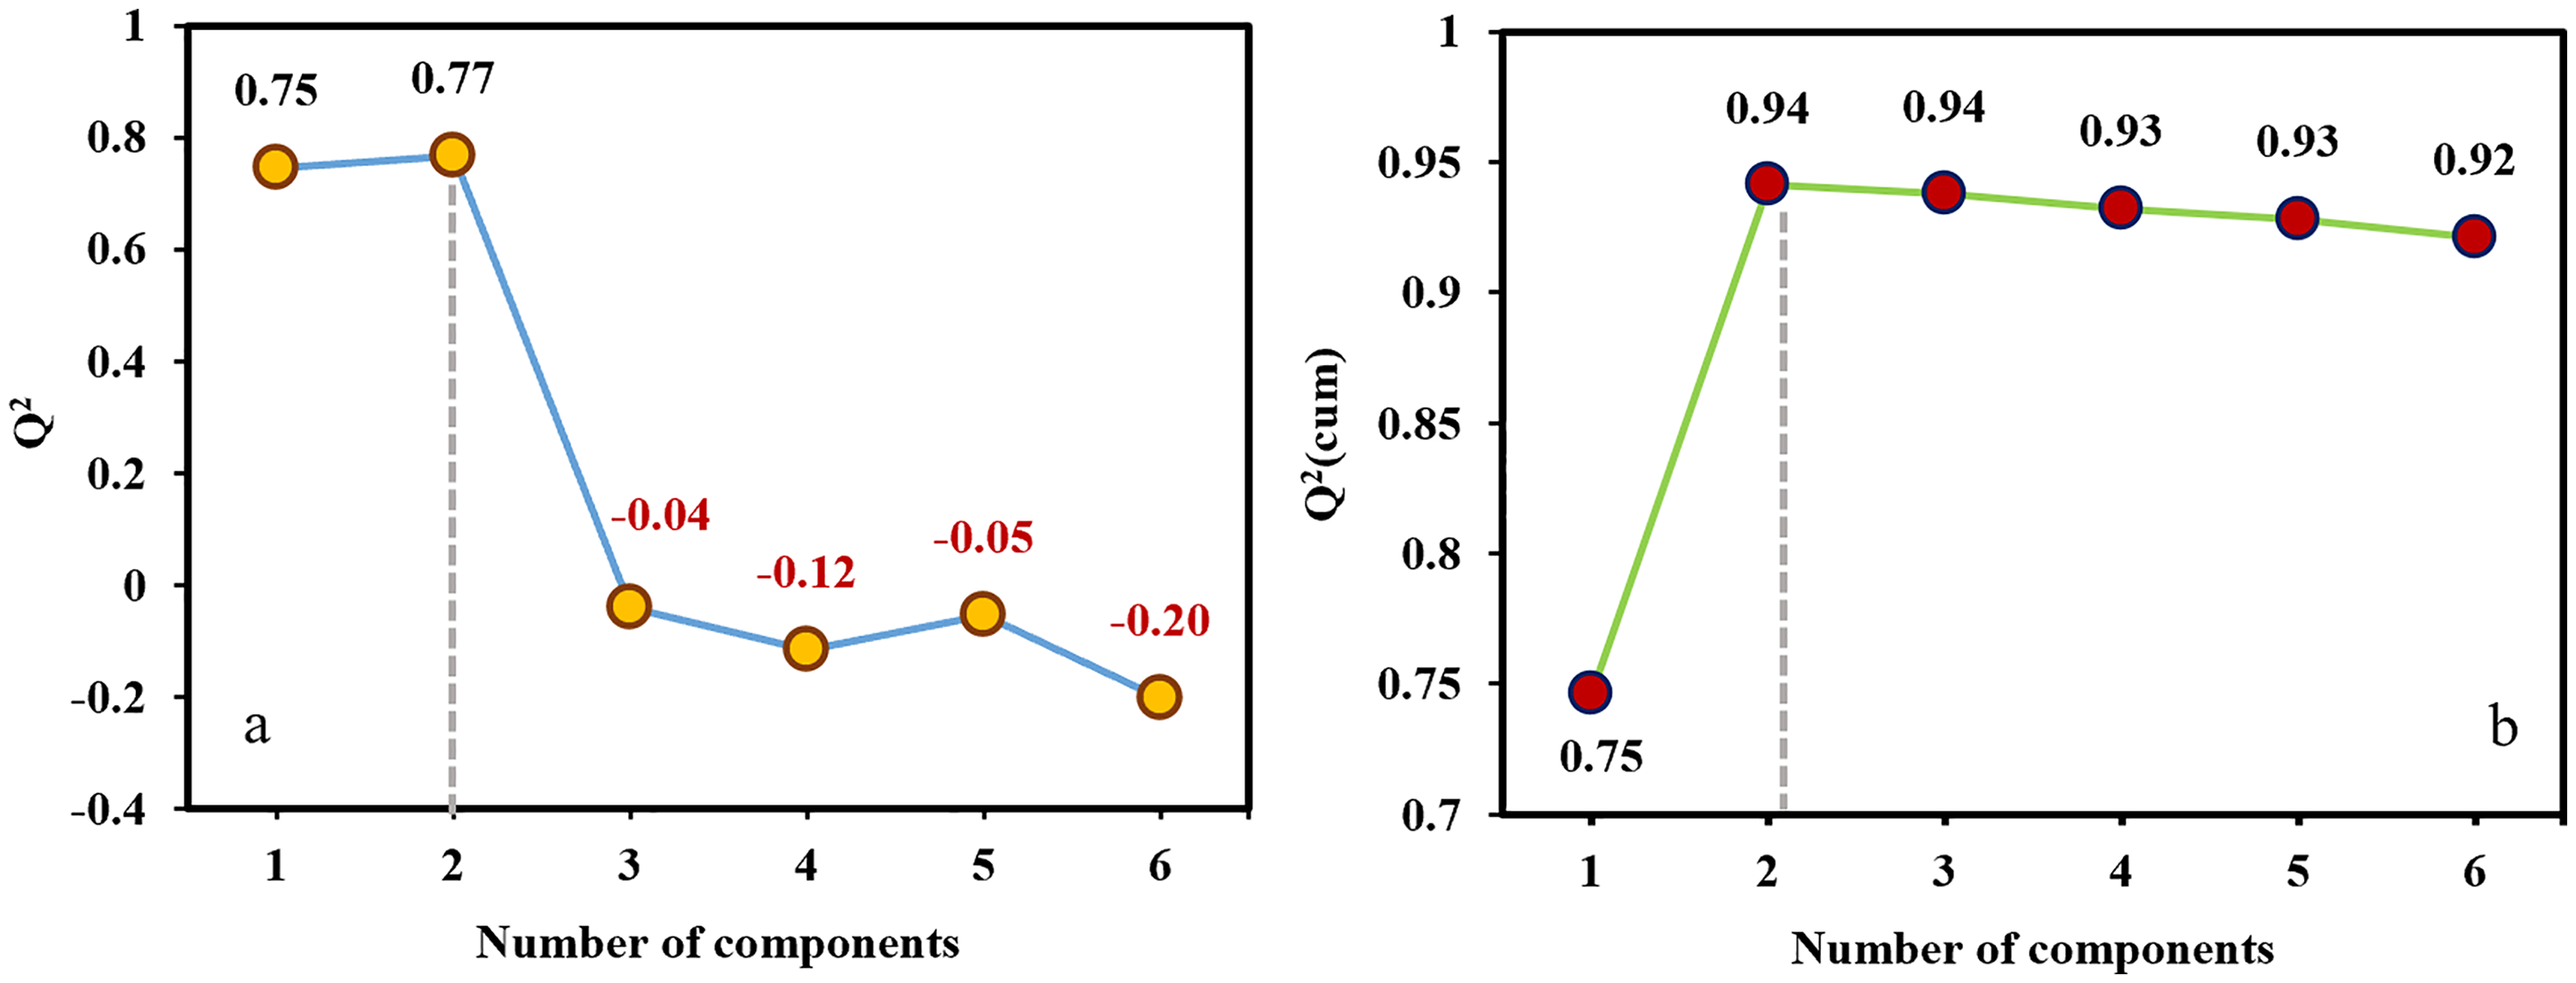
Q2 (a) and Q2(cum) (b) of components in PLSR with the measured Ro and six phenanthrenes from the Cretaceous Qingshankou Formation in the Songliao Basin, China.
The regression equation of the two components for the standardized Ro was computed (see Appendix B). From this regression equation and the equations for the first two components, the equation for calculating thermal maturity with the normalized abundances of the six phenanthrenes was obtained (see details in Appendix B):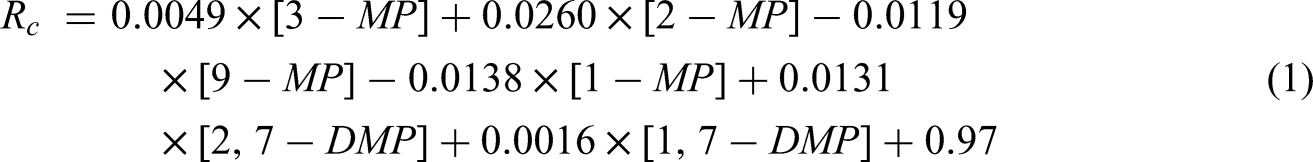
where Rc is the calculated Ro;
The multivariate regression equation (1) was validated following the procedure described in Section Partial least square regression. Firstly, Figure 7 shows a cross-plot of measured Ro values against Rc values calculated using equation (1). The R² value is 0.94, indicating that the regression equation is accurate. Secondly, a cross-validation method was applied to the 37 samples. The Rp² obtained from this cross-validation is 0.93, and suggests that the multivariate regression equation is reliable with strong predictive ability when applied to new data excluded in building the regression. Thirdly, from the perspective of variable descriptors, the R2X(cum) value of the multivariate regression equation (1) were computed. It reaches 0.95, indicating that equation (1) captures most (95%) of the variance information from the six phenanthrene parameters. All the high values of R², Rp² and R2X(cum) manifest that the multivariate regression equation (1) can effectively utilize the information contained in MPs and DMPs, toreliablly predictthermal maturity within the oil window (0.68%‒1.35% Ro).
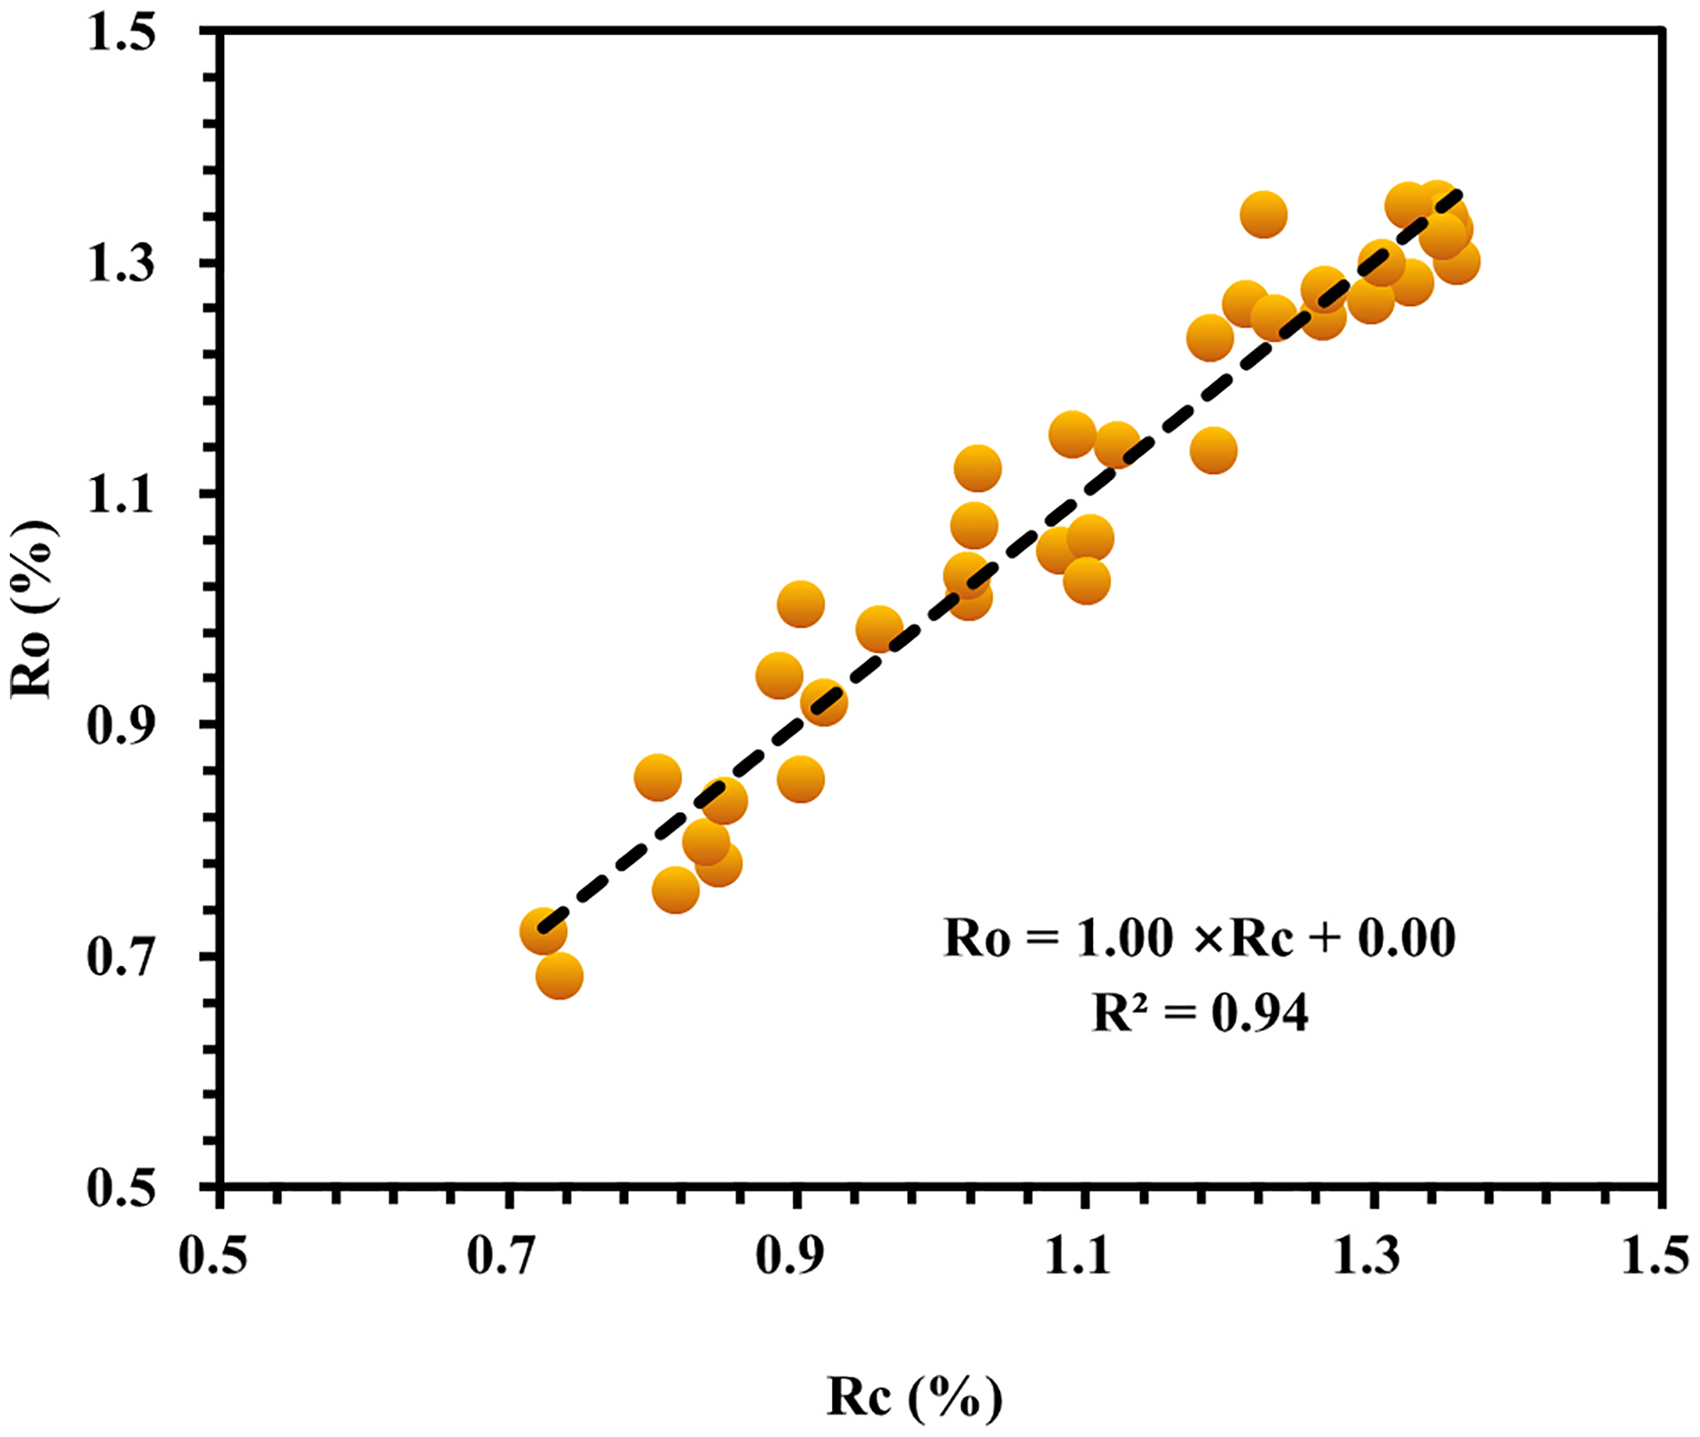
Correlation of the measured Ro with the Rc calculated with PLSR using six phenanthrenes in the samples from the Cretaceous Qingshankou Formation in the Songliao Basin, China.
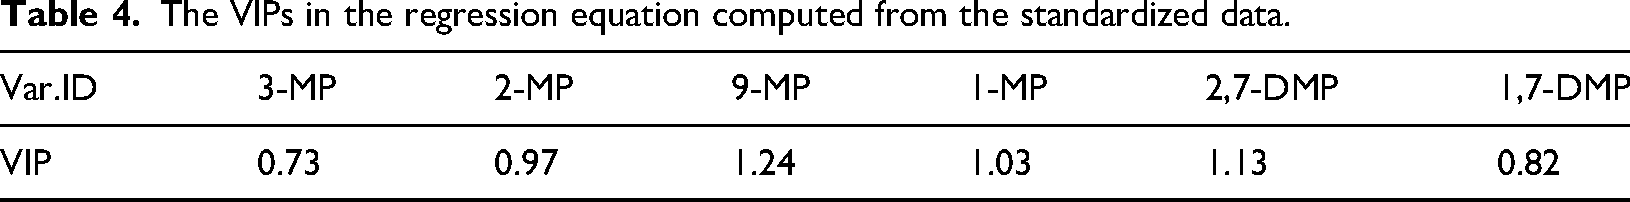
Moreover, the relative importance of the MPs and DMPs for maturity prediction and their relationships with geochemical stabilities were analyzed. In PLSR, the VIP (variable importance in the projection) index reflects the relative importance of the descriptors in the predictions (see Appendix A). The VIP values of the descriptors in the regression equation computed from the standardized data are listed in Table 4. If VIP ≥1, the corresponding descriptor is significant in predicting the response (Eriksson et al., 2013; Mahieu et al., 2023; Wang et al., 2006; Wold et al., 1993). The VIP values of 2,7-DMP, 9-MP, and 1-MP exceed one (Table 4 and Figure 8), and that of 2-MP is close to one, which indicate that these four phenanthrenes are significant variables for predicting the maturity. In contrast, the VIP values of 1,7-DMP and 3-MP are much less than one. Their contribution to the maturity prediction in the Songliao Basin is less significant. These VIP values of phenanthrenes are corresponding to their stabilities (see the next subsection), which also supports that the multivariate regression equation (1) is effective and reliable.
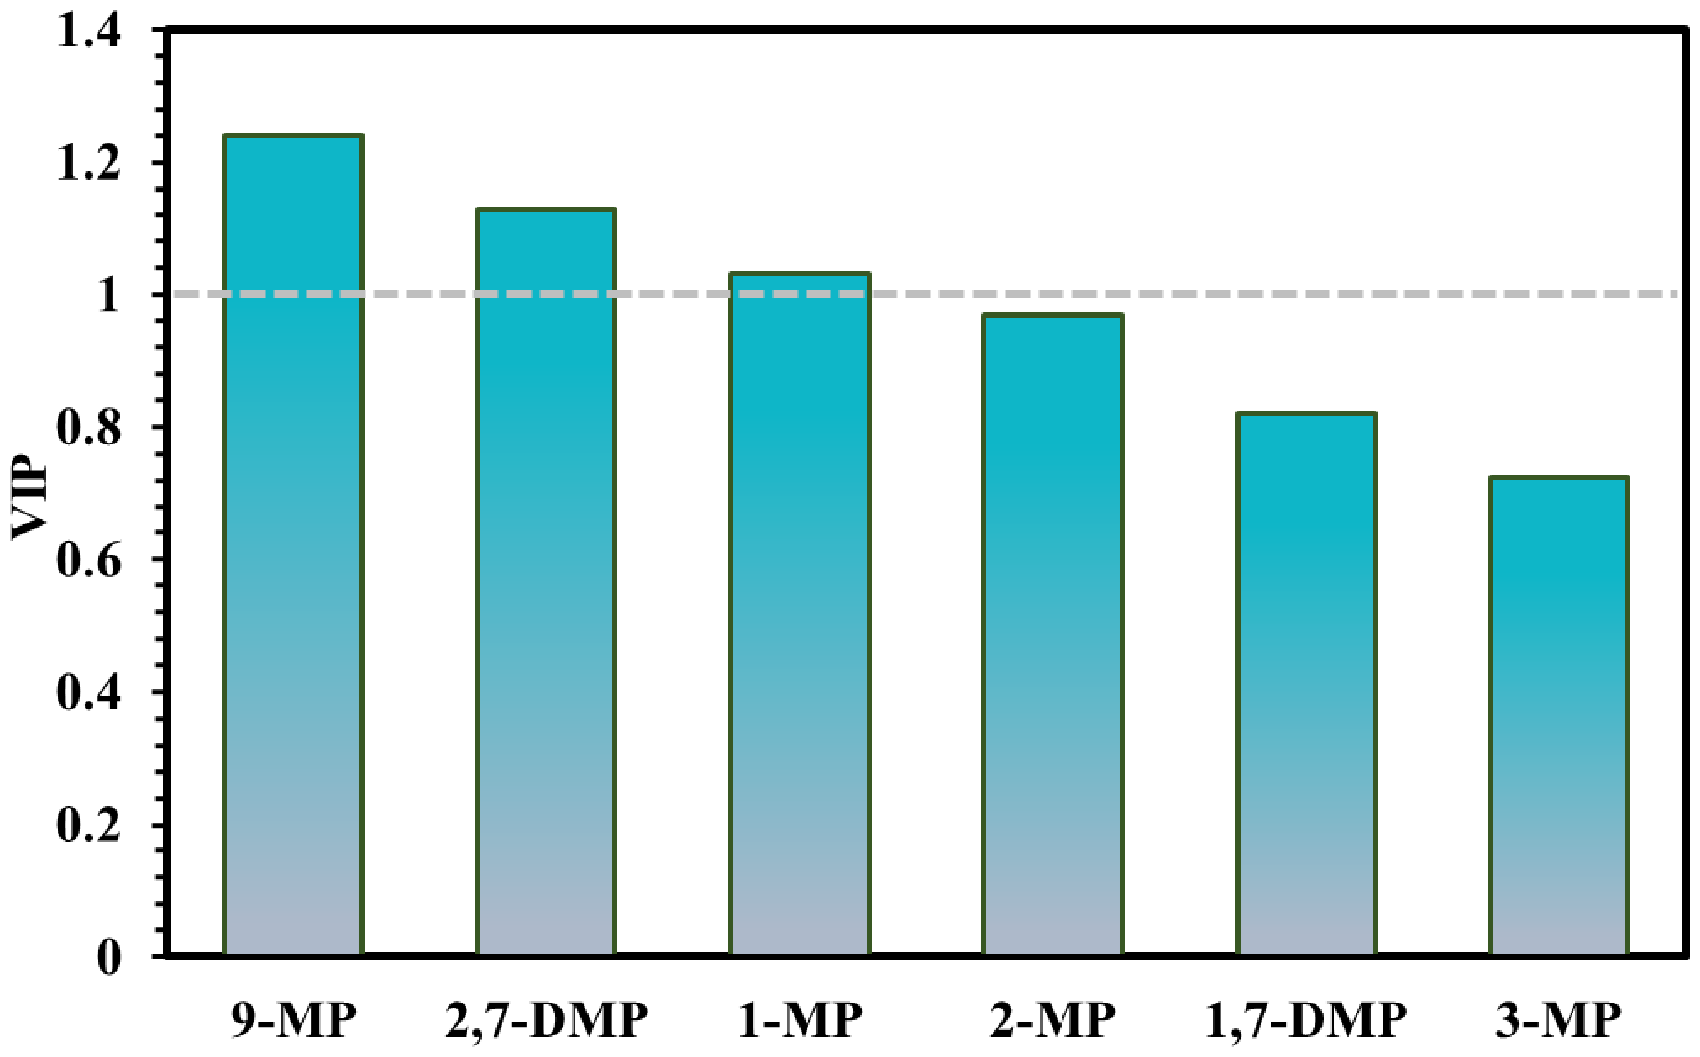
Values of the VIPs of the phenanthrenes in the multivariate equation established with the samples from the Cretaceous Qingshankou Formation in the Songliao Basin, China.
The VIPs in the regression equation computed from the standardized data.
Thermal stabilities and effects of phenanthrenes in the model
The variations in normalized abundances of alkyl-phenanthrenes with increasing maturity are mainly controlled by their thermal (thermodynamic) stabilities, characterized by increases in stable (e.g., β type) isomers and decreases in unstable (e.g., α type) isomers. This pattern likely results from rearrangement reactions of methyl groups from α-positions to β-positions to reduce steric hindrance (Budzinski et al., 1993; Garrigues et al., 1990; Radke et al., 1982b). As shown in equation (1), Rc is correlated positively to stable 2- and 3-MP (β-type) and negatively to unstable 9- and 1-MP (α-type), which corresponds to the stability trends.
For dimethyl-phenanthrenes, ββ-type isomers are the most stable. Correspondingly, 2,7-DMP (ββ-type) has both a high VIP value (Table 4) and a positive coefficient in equation (1). 1,7-DMP is the most stable isomers among the αβ- and αα-type isomers (Budzinski et al., 1993). As a result, 1,7-DMP possesses a positive coefficient. But its VIP value is lower than that of 2,7-DMP due to the higher stability of the latter. All these results coincide with the thermodynamic stabilities of both compounds.
As mentioned above, the studies of phenanthrene parameters for maturity calculation have focused primarily on methyl-phenanthrenes. Although a few of dimethyl-phenanthrene parameters (e.g., DPI and DPR; Radke et al., 1982a, b) were proposed, they have not been widely used. Notably, the VIP value of the 2,7-DMP (the most stable DMP) exceeds that of 2-MP (the most stable MP, Behar et al., 1999). This seemingly indicates that effective parameters for maturity can be established with dimethyl-phenanthrenes. But in numerous studies (Garrigues et al., 1988; Radke et al., 1986; Wang et al., 2020; Zdravkov et al., 2023), data of most dimethyl-phenanthrenes, especially αα-type isomers, have not been accumulated, as they cannot be identified and tested from gas chromatograms. The lack of sufficient data has negatively impacted the development of reliable DMP parameters for maturity calculation. However, integrated use of methyl- and dimethyl-phenanthrenes can compensate for the limitations of the methods using methyl- and dimethyl-phenanthrenes separately.
Dimethyl-phenanthrenes as potential maturity variables
As mentioned in Subsection Thermal stabilities and effects of phenanthrenes in the model, dimethyl-phenanthrenes have been underutilized in maturity assessment compared with methyl-phenanthrenes. This study demonstrates that incorporating dimethyl-phenanthrenes (1, 7- and 2,7-DMPs) into a multivariate regression equation can significantly improve maturity prediction (see Subsection Multivariate relation of phenanthrenes to Ro). DMPs have a greater number (25) of isomers than MPs. The differences in stability among the different isomers (Budzinski et al., 1993) give DMPs the potential to characterize thermal maturity.
However, the application of dimethyl-phenanthrenes has been limited due to they cannot be sufficiently separated by conventional GC analysis. Subsequantly-developed two-dimensional gas chromatography (GC × GC) may separate them sufficiently and may quantitatively analyze more dimethyl-phenanthrene isomers. Its combination with vacuum ultraviolet spectroscopy (VUV) has shown that it can effectively distinguish aromatic hydrocarbon isomers. But, this combination remains rarely applied in maturity research. With the advancement of the method for DMP analysis, big data of dimethyl-phenanthrenes can be derived. These data can more sufficiently remedy the limitations of MPs. The integrated application of MPs and DMPs with the PLSR method in this paper will become more accurate and effective at maturity assessment.
Implications of multivariate analysis for maturity evaluation
The thermal evolution of buried organic matter is an important section of the organic carbon cycle. If deeply-buried rocks with organic matter cannot be sampled, thermal evolution levels cannot be determined with rock samples. Nevertheless, maturity calculation can help to solve this issue. In the petroleum industry, the maturity calculation of discovered oils can also help to relate the oils to their source rocks. However, it is not suggested to directly use the multivariate regression equation (1) for maturity calculation in the other areas. It is suggested that this equation be validated with the actually data from the other areas and even multivariate regression equations be set up by using the PLSR approach established in this study.
Recently, many aromatic hydrocarbons can be tested by using GC-MS or GC-MS-MS analysis (GC: gas chromatography; MS: mass spectrometry). For example, alkyl aromatics with 9–19 carbons haven been tested. A series of alkyl-substituted naphthalene ratios were constructed for maturity estimation (Wang et al., 2021; Zumberge et al., 2020). In addition, a huge number of polycyclic and heterocyclic aromatic compounds measured using Fourier transform-ion cyclotron resonance-mass spectrometry (FT-ICR-MS). The corresponding maturity parameters were defined as the ratios of the lighter compounds with higher double bond equivalents (C20–50) to the heavier (C30–60) (Noah et al., 2020). All these maturity parameters are defined as the ratios of stable compound(s) to unstable compound(s) or to the sum of unstable compound(s) and stable compound(s). It has been illustrated in the first subsection of Discussion that this kind of parameters and their univariate regression equations cannot sufficiently utilize the maturity information carried by these compounds. Comparatively, PLSR can utilize the maturity information carried by these compounds more sufficiently and synthetically. Therefore, PLSR may become a practical approach for effective use of plenty of these data to evaluate organic matter maturity.
Furthermore, this multivariate approach may improve the maturity prediction across different kerogen types. This needs to be demonstrated with its application to the areas where type III kerogen is developed. But the shale and mudstone in the Qingshankou Formation mainly contains type I kerogen, with a small amount of type II1 kerogen. It is suggested that the PLSR approach be experimentally applied to the data obtained from type III organic matter.
Conclusion
The existing maturity parameters defined with phenanthrenes and their univariate regression equations can only use the maturity information carried by finite compounds. The multivariate regression equation established with PLSR can comprehensively utilize the maturity information carried by more compounds including methyl and dimethyl phenanthrenes. This multivariate equation overcomes the limitations of univariate equations of the existing maturity parameters and thus enhances maturity calculations. It utilizes 95% of the variance information of methylated phenanthrenes, and its R2 is .94.
The coefficients of the six phenanthrenes in the multivariate regression equation correspond well with their geochemical stabilities. The stable phenanthrenes have positive coefficients and unstable ones have negative coefficients. The most significant methylated phenanthrenes for maturity calculation are (in order) 9- and 1-MP (α-type), 2,7-DMP (ββ-type) and 2-MP (β-type).
The multivariate regression equation of maturity with methyl- and dimethyl-phenanthrenes outperforms univariate regression ones of the previously defined parameters. For the application in other basins, it is suggested that this multivariate regression equation be examined with the local data. If R2 < .9, a new multivariate regression equation needs to be set up. The PLSR-based approach developed in this study is demonstrated to be a powerful tool for constructing multivariate regression equations with of methyl- and dimethyl-phenanthrenes. Furthermore, if maturity for Types I and II₁ kerogens needs to be estimated with other aromatic hydrocarbons, and if maturity for the other types of kerogen needs to be estimated, this approach is recommended for establishing multivariate regression equations.
Supplemental Material
sj-docx-1-eea-10.1177_01445987251408084 - Supplemental material for Multivariate relationship of methyl- and dimethyl-phenanthrenes to the maturity of organic matter in sedimentary sequences
Supplemental material, sj-docx-1-eea-10.1177_01445987251408084 for Multivariate relationship of methyl- and dimethyl-phenanthrenes to the maturity of organic matter in sedimentary sequences by Xiaotian Huang, Liuping Zhang, Bangjun Liu, Kun Zhang and Zhaoyang Li in Energy Exploration & Exploitation
Supplemental Material
sj-docx-2-eea-10.1177_01445987251408084 - Supplemental material for Multivariate relationship of methyl- and dimethyl-phenanthrenes to the maturity of organic matter in sedimentary sequences
Supplemental material, sj-docx-2-eea-10.1177_01445987251408084 for Multivariate relationship of methyl- and dimethyl-phenanthrenes to the maturity of organic matter in sedimentary sequences by Xiaotian Huang, Liuping Zhang, Bangjun Liu, Kun Zhang and Zhaoyang Li in Energy Exploration & Exploitation
Footnotes
Acknowledgments
We are grateful to Drs. Ziyi Wang and Shanshan Zhou who kindly assisted in the data processing. This research was supported by China National Key Science and Technology Project (grant number 2025ZD1405004), and China National Petroleum Corporation-Peking University Strategic Cooperation Project of Fundamental Research (grant number 22-2-1). This research did not receive any specific grant from funding agencies in the public, commercial, or not-for-profit sectors.
Authors’ contributions
Xiaotian Huang contributed to methodology, formal analysis, visualization, and writing‒original draft. Liuping Zhang contributed to conceptualization, methodology, formal analysis, writing–original draft, and supervision. Bangjun Liu contributed to formal analysis, and writing–original draft. Kun Zhang contributed to methodology, formal analysis. Zhaoyang Li contributed to formal analysis, writing–original draft.
Funding
The authors received no financial support for the research, authorship, and/or publication of this article.
Declaration of conflicting interests
The authors declared no potential conflicts of interest with respect to the research, authorship, and/or publication of this article.
Data availability
The data that support the findings of this study are available in the Supplementary Material.
Supplemental material
Supplemental material for this article is available online.
Author biographies
Appendix
References
Supplementary Material
Please find the following supplemental material available below.
For Open Access articles published under a Creative Commons License, all supplemental material carries the same license as the article it is associated with.
For non-Open Access articles published, all supplemental material carries a non-exclusive license, and permission requests for re-use of supplemental material or any part of supplemental material shall be sent directly to the copyright owner as specified in the copyright notice associated with the article.