
Abstract
This study examines the behavioral intention to adopt new energy vehicles (NEVs) in China through an integrated framework that combines the technology acceptance model, the theory of planned behavior, and contextual policy support. Drawing on survey data from 983 respondents across 21 cities spanning Tiers 1–4, we employ structural equation modeling, multi-group regression with multiple-testing correction, and fuzzy-set qualitative comparative analysis. Measurement invariance is established across gender, age, and city tiers. Results demonstrate that policy support, perceived usefulness, and trust are the most influential determinants of NEV adoption, while environmental concern exerts a positive but context-specific effect. Multi-group analysis reveals that functional and environmental values are more salient in higher-tier cities, whereas economic incentives and infrastructure play stronger roles in lower-tier contexts. Fuzzy-set qualitative comparative analysis further identifies multiple sufficient pathways to high adoption intention (consistency = 0.86; coverage = 0.72), corroborating the robustness of parametric results. The findings contribute methodologically by advancing theory-driven benchmarking and substantively by highlighting differentiated policy levers across urban tiers in a rapidly evolving market.
Keywords
Introduction
In modern society, new energy vehicles (NEVs) have been positioned as a critical component in the national strategy for green development and technological modernization (Hu and Yuan, 2018; Ma et al., 2019). The excellent advantages of NEVs, such as energy-efficient and environmentally friendly, and so on, facilitate the rapid development of NEVs in the urban markets. In the first-tier cities (i.e. Guangzhou, Shenzhen, etc.), the NEV market accounts for ∼50% of the whole NEV registrations in China, suggesting satisfactory supportive infrastructure, policy incentive, and consumer adoption intention in the first-tier cities. However, the insufficient infrastructure development, market investment, and government support in low-tier cities hinder the development of NEVs across the urban hierarchy.
Although the Chinese government offers enormous policy support and market incentives, there are still non-negligible structural and behavioral barriers that hinder the widespread adoption of NEVs (Liang and Lu, 2022). In the first-tier cities, disadvantages such as the congestion of urban traffic, the limitation of charging infrastructure, as well as the uncertainty of maintenance lead to the decrease of satisfaction and long-term usage behavior of the consumers (Huang and Qian, 2018; Tian et al., 2024). In contrast, due to the relatively low motor vehicle ownership rates, the continuous advancement of urbanization and public awareness of environmental protection, the NEVs market in the low-tier cities is facing significant developing potential (Abbott and Singlemann, 1981). However, existing research mainly focuses on the adoption behavior in economically developed regions, lacking an in-depth understanding of the psychological, infrastructure, and policy-driven factors influencing consumer decisions in lower-tier cities.
Currently, studies on NEV adoption are primarily concentrated on first-tier cities and designated pilot zones, such as Beijing, Shanghai, and Shenzhen, where policy experimentation and infrastructure deployment are relatively advanced (Lin and Wu, 2018; Wang et al., 2018; Zhang et al., 2022). However, the impact of urban hierarchy differences on consumer decision-making processes remains unexplored. Emerging social cognitive theories, especially the technology acceptance model (TAM) and the behavioral extension models, suggest that perceived usefulness, environmental concern, institutional trust, and policy accessibility are key factors influencing the NEVs' adoption (Tian, 2020; Zhao et al., 2022; Zhu et al., 2022). However, these influencing factors are usually context-sensitive and significantly affected by local governance capacity, public awareness, and infrastructure maturity. Moreover, there are significant differences in consumer values, technological risk perception, and policy information exposure frequency in different urban hierarchies, further exacerbating the behavioral heterogeneity. Therefore, it is necessary to conduct stratified analysis along the urban hierarchy dimensions to clarify the multi-dimensional driving mechanisms of NEVs adoption in different spatial contexts.
Guangdong Province offers an ideal empirical context for studying the differential dynamics of the adoption of NEVs. As one of the most economically developed and urbanized regions in China, Guangdong encompasses a diverse range of city types, from international first-tier metropolises like Shenzhen and Guangzhou to emerging fourth-tier cities such as Shaoguan and Maoming. This intra-provincial urban heterogeneity provides a unique opportunity to explore how institutional support, infrastructure completeness, and social and cultural factors shape consumer adoption intentions across different urban tiers (Dong and Liu, 2020). Adopting a spatially stratified research perspective enables a systematic comparison of adoption mechanisms, thereby offering more context-specific policy references for promoting the popularization of NEVs in both mature and developing urban environments.
This study, based on stratified samples from 21 cities in Guangdong Province, systematically explored the key factors influencing consumers’ willingness to adopt NEVs. By integrating the core variables of the TAM and incorporating constructs such as policy support, environmental concern, and interpersonal trust, a multi-dimensional theoretical analysis framework was constructed, aligning with the expanding trends in current social psychology and behavioral economics research. The structural equation modeling (SEM) method was employed to empirically validate the model, and multiple group analysis (MGA) was conducted to examine the differences in consumer behavior patterns among different city levels.
Results in this study are expected to bring several important contributions: Firstly, the main innovation of this study is the extension of the TAM by incorporating policy support, trust, and environmental concern. This enriched framework captures institutional, psychological, and environmental drivers simultaneously, which have rarely been examined together in prior NEV adoption research. Secondly, the contribution of this study is twofold. From a methodological perspective, the study employs a multi-method design that combines SEM, MGA, regression interaction, and fuzzy-set qualitative comparative analysis (FsQCA). This integrated approach ensures both robustness and comprehensiveness in uncovering adoption mechanisms. From an empirical perspective, the study identifies tier-specific adoption drivers and provides differentiated policy implications. By clarifying these innovations and contributions, this research not only enriches the theoretical understanding of NEV adoption but also delivers actionable insights for policymakers and industry stakeholders. Notably, the findings are specific to Guangdong Province and should be interpreted with caution when generalizing to other regions in China due to potential regional heterogeneity in socio-economic conditions, policy frameworks, and infrastructure.
Theoretical foundation and research approach
Theoretical foundation
Production-side policies for NEV development in China. To stimulate early stage innovation and market formation, the Chinese government introduced a range of production-side instruments, including direct subsidies, technological incentives, and dual credit systems, as reflected in empirical studies on subsidy-driven innovation (Li et al., 2022a, 2022b) and production compliance mandates (e.g. CAFC and NEV credits) (Ehsan et al., 2024).
Demand-side policies and consumer incentives. On the consumer side, widespread NEV adoption is facilitated by complementary demand-side policies including purchase subsidies, charging infrastructure investment, and usage privileges. Empirical evidence suggests that in first-tier cities such as Shenzhen and Guangzhou, access to free license plates, charging convenience, and driving privileges contribute significantly to higher adoption rates (Lan et al., 2024; Xu et al., 2022). In lower-tier cities, however, policy effects are often weakened due to limited infrastructure, lower income levels, and a lack of awareness (Xiong and Cheng, 2023; Zeng et al., 2025). Furthermore, the perception of policy fairness and effectiveness also plays a mediating role in adoption willingness (Wang et al., 2022), where policy cognition significantly predicted the behavioral intention.
Consumer decision-making model for NEVs. The consumer decision process for NEV adoption is rooted in theories such as the TAM. This process can be divided into five stages (Han et al., 2024; Pang et al., 2018):
- Problem recognition: Triggered by environmental concerns, economic incentives, and dissatisfaction with traditional vehicle costs. - Information search: Involving evaluation of online reviews, peer experiences, social media promotion, and test-driving. - Evaluation of alternatives: Comparing vehicle performance, charging convenience, government incentives, and brand reputation. - Purchase decision: Influenced by psychological factors such as perceived usefulness (PU), subjective norms (SNs), perceived ease of use (PEU), and trust. - Post-purchase evaluation: Shaping long-term NEV diffusion through satisfaction, word-of-mouth, and repurchase intentions. Our theoretical framework also incorporates perceived environmental concern (EC) and policy support (PS) as latent constructs, highlighting the ecological identity and institutional trust as influential factors in NEV uptake.
Research approach
Social research methods
In this study, “new energy vehicles (NEVs)” are defined in accordance with Chinese government policies and mainstream academic literature as four-wheeled automobiles, including battery electric vehicles (BEVs), plug-in hybrid electric vehicles (PHEVs), and fuel-cell electric vehicles (FCEVs). Micromobility options such as e-scooters and e-bikes were excluded from both the sampling frame and the survey instrument. Therefore, all responses reflect consumer intentions toward four-wheeled passenger and light commercial NEVs.
The adoption behavior of NEVs is not only shaped by environmental awareness and technological preferences, but also by multi-level social and psychological constructs. NEV decisions are influenced by both situational factors (e.g. policy environment and urban infrastructure) and social-psychological variables (e.g. subjective norms, trust, and perceived ease of use).
This study employs a mixed-method exploration design. Open-ended, semi-structured interviews were conducted with licensed drivers aged above 18 years across 21 cities in Guangdong Province, encompassing a range of urban hierarchies. All participants were informed of the study purpose and assured that responses would remain anonymous and confidential. Participation was entirely voluntary, and informed consent was obtained electronically before the questionnaire could be submitted. The interviews aimed to explore personal experiences with NEVs, perceived advantages and barriers, interaction with public incentives, and attitudes toward environmental benefits. Sampling ensured demographic diversity in gender, age, occupation, and educational background.
Semi-structured interviews were transcribed verbatim and analyzed using thematic analysis. First-order informant codes were clustered into second-order themes, which were then mapped onto aggregate dimensions aligned with the latent constructs in our model. Two trained coders independently applied the codebook; intercoder reliability was computed at both the code and theme levels, and discrepancies were resolved through discussion and third-party adjudication. The detailed coding procedure and a theme—item mapping table are provided in Supplemental Appendix S2.
Theoretical model and hypotheses construction
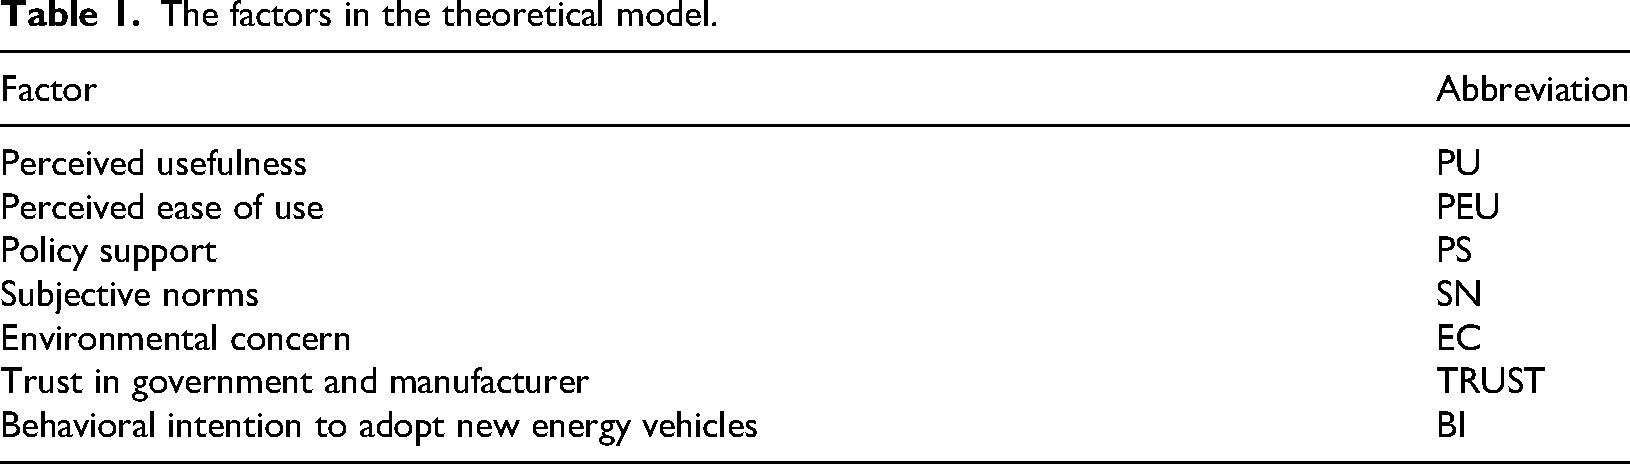
The research framework integrates the TAM and policy perception model. The factors that are taken into consideration are listed in Table 1. All latent variables were measured using established scales and adapted to the NEV context. The hypothesized model structure was validated using structural modeling techniques. The structural model was analyzed using PLS-SEM (SmartPLS 4.0). The results were consistent with CB-SEM tests, confirming the robustness of the findings.
The factors in the theoretical model.
Quantitative instrument design and data collection
Items were measured on a 5-point Likert scale ranging from 1 (strongly disagree) to 5 (strongly agree). Pretesting and revision ensured clarity and contextual validity.
The survey covered all 21 prefecture-level cities in Guangdong Province (Supplemental Appendix Table S3-A). A total of 983 valid responses were collected through stratified sampling, reflecting proportional representation across city tiers. The final instrument included seven latent variables and 28 observed items, covering psychological, social, and policy-related dimensions. The full set of 28 observed items, with item IDs, original Chinese wording, English translations, 5-point Likert anchors, source citations for adapted scales, and notes on reverse-coded items, is provided in Supplemental Appendix S1.
The overall valid response rate was about 81%. The qualitative-to-survey linkage is documented in Supplemental Appendix S2, which maps interview themes to the final item wording and their construct alignment, consistent with scale-development best practices.
The sampling frame comprised adult residents (aged ≥ 18) of all 21 prefecture-level cities in Guangdong Province, China, matching the geographic scope described earlier. We adopted a stratified design: first by city tier (Tier 1–4) and then by city within each tier. Eligibility required (i) age ≥ 18, (ii) current residence in one of the 21 cities, and (iii) informed consent to participate. The questionnaire was self-administered online via Wenjuanxing (Sojump), a widely used professional survey platform in China. Invitations were distributed between May and July 2023. Screening questions ensured eligibility prior to survey entry; duplicate entries were prevented via device ID and IP checks, and incomplete or straight-line responses were excluded according to pre-registered data quality rules, including minimum completion time thresholds and consistency checks across reverse-coded items.
We set tier-level quotas to maintain proportional representation and monitored city-level completes during fieldwork. In total, n = 983 valid completes were obtained across the 21 cities. Supplemental Appendix S2 (Supplemental Appendix Table S2-A) reports city-level Ns, tier-level quotas, and realized completes, and invitations versus completes with response-rate calculations. No post-stratification weights were applied in the main analysis. For replication, Supplemental Appendix S2 provides the definition of optional post-stratification weights by tier or city (normalized to mean 1). In the main text, Tables 2 to 6 report unweighted estimates. As a robustness check, Table 7 reports weighted estimates using the post-stratification weights defined in Supplemental Appendix S2. This report follows AAPOR Standard Definitions for outcome rates and the CHERRIES guideline for web-survey transparency.
The evaluating indices for the model fit.
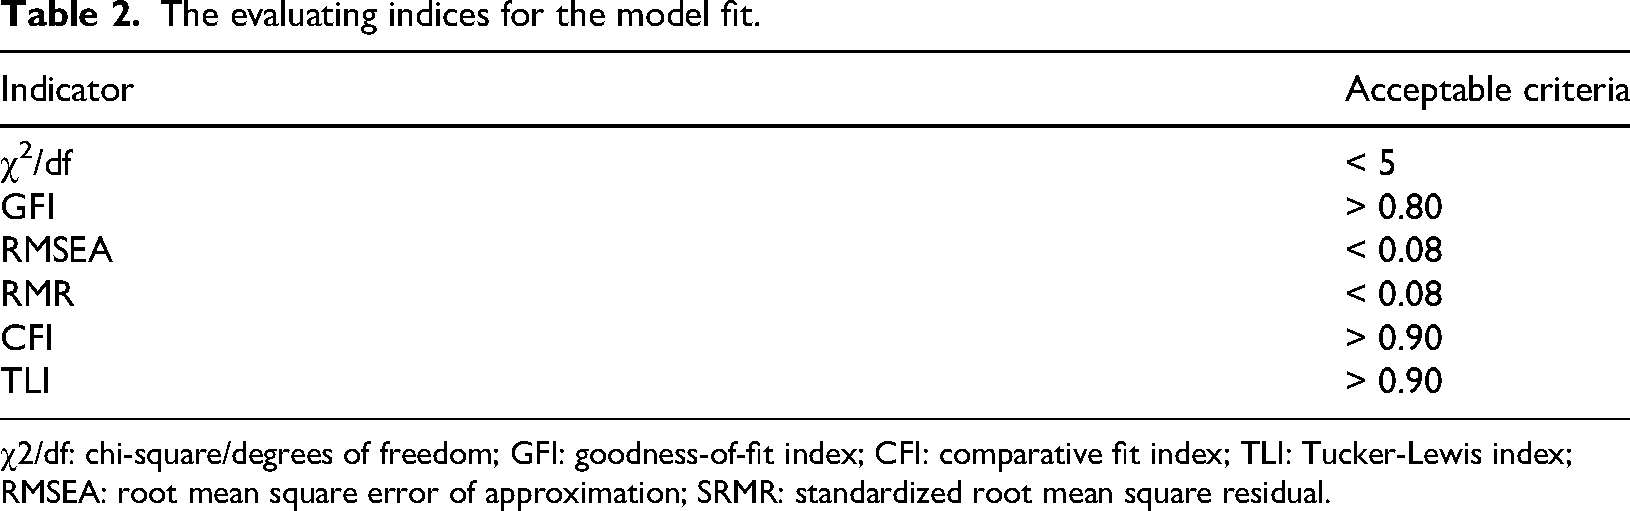
χ2/df: chi-square/degrees of freedom; GFI: goodness-of-fit index; CFI: comparative fit index; TLI: Tucker-Lewis index; RMSEA: root mean square error of approximation; SRMR: standardized root mean square residual.
Baseline regression results by city tier (unweighted OLS; predictors mean-centered and z-standardized; and HC3 SE used for inference).
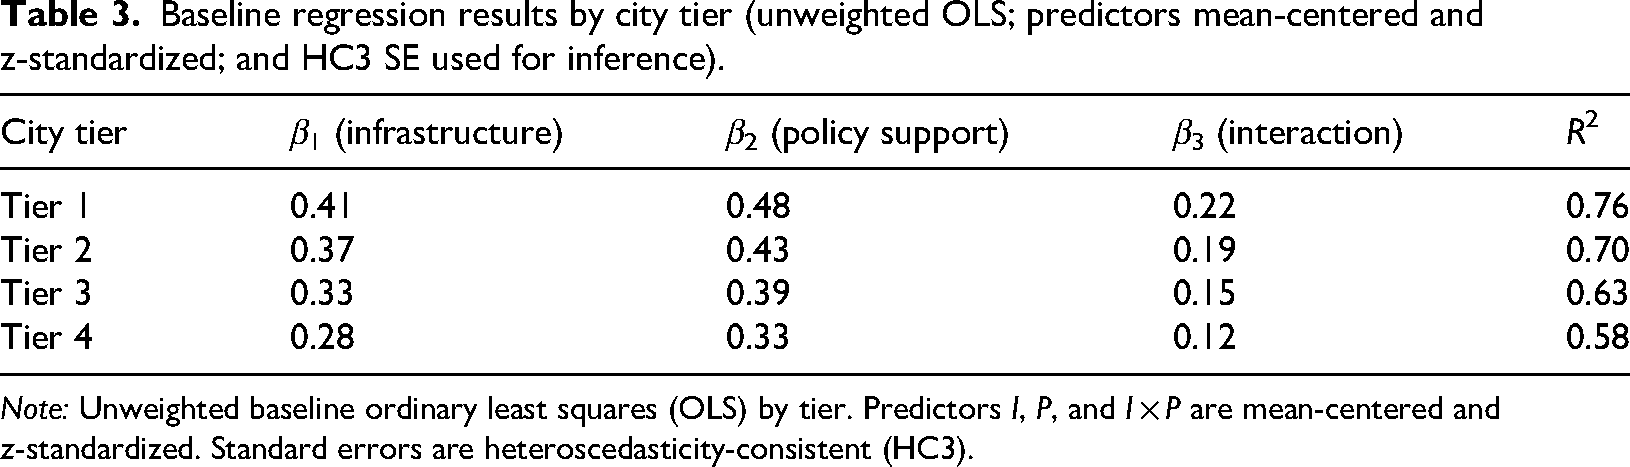
Note: Unweighted baseline ordinary least squares (OLS) by tier. Predictors I, P, and I × P are mean-centered and z-standardized. Standard errors are heteroscedasticity-consistent (HC3).
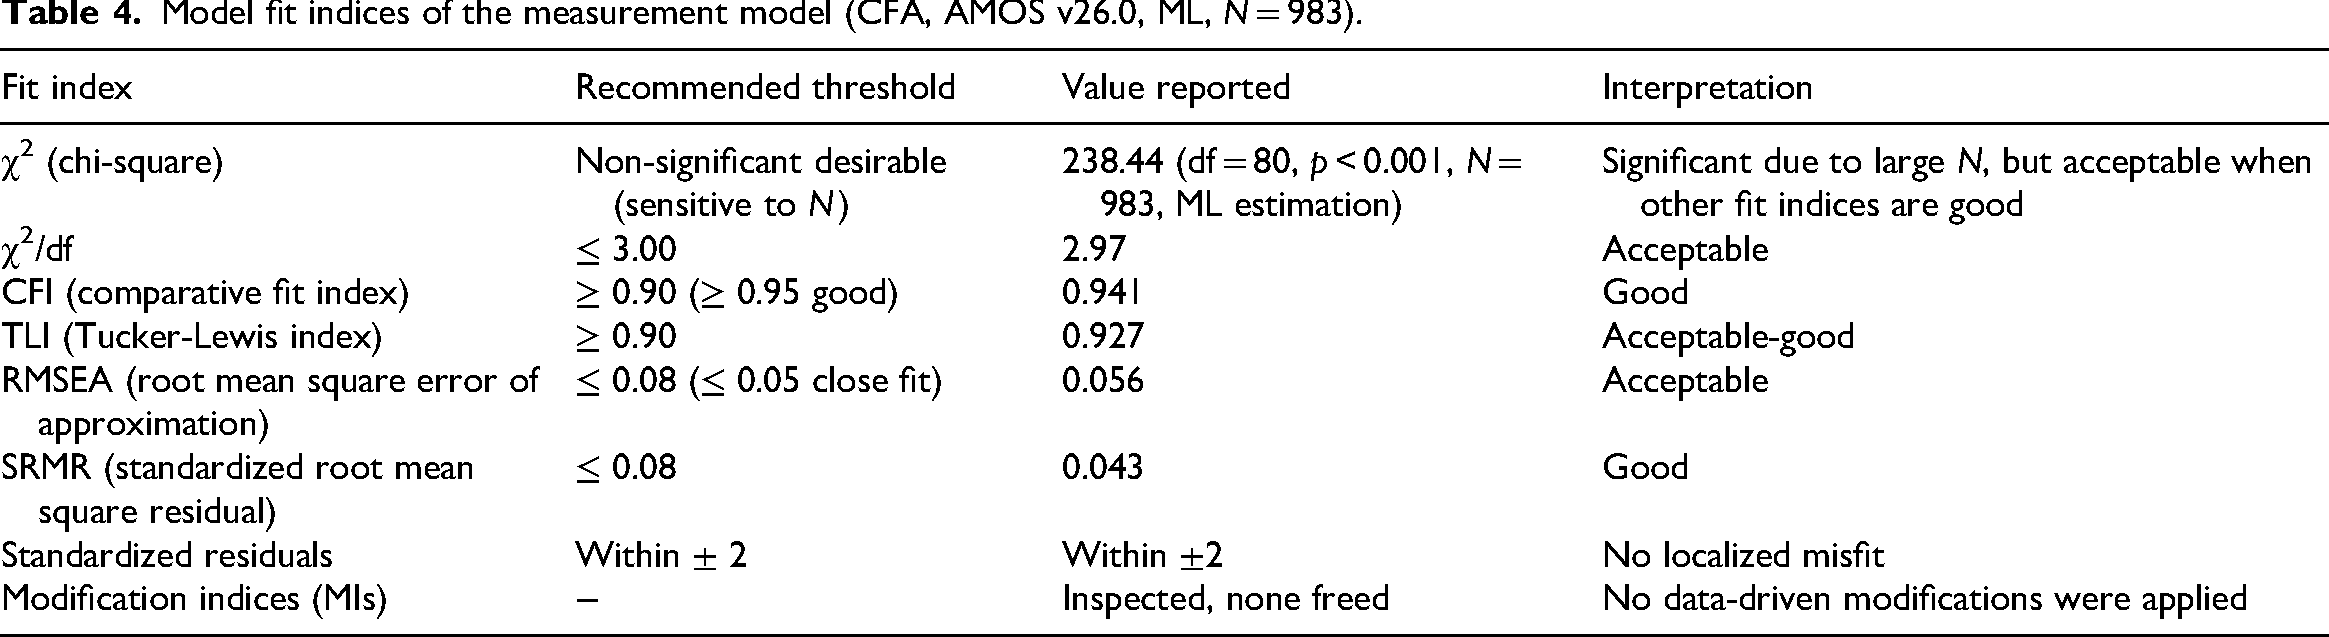
Model fit indices of the measurement model (CFA, AMOS v26.0, ML, N = 983).
Standardized path coefficients.
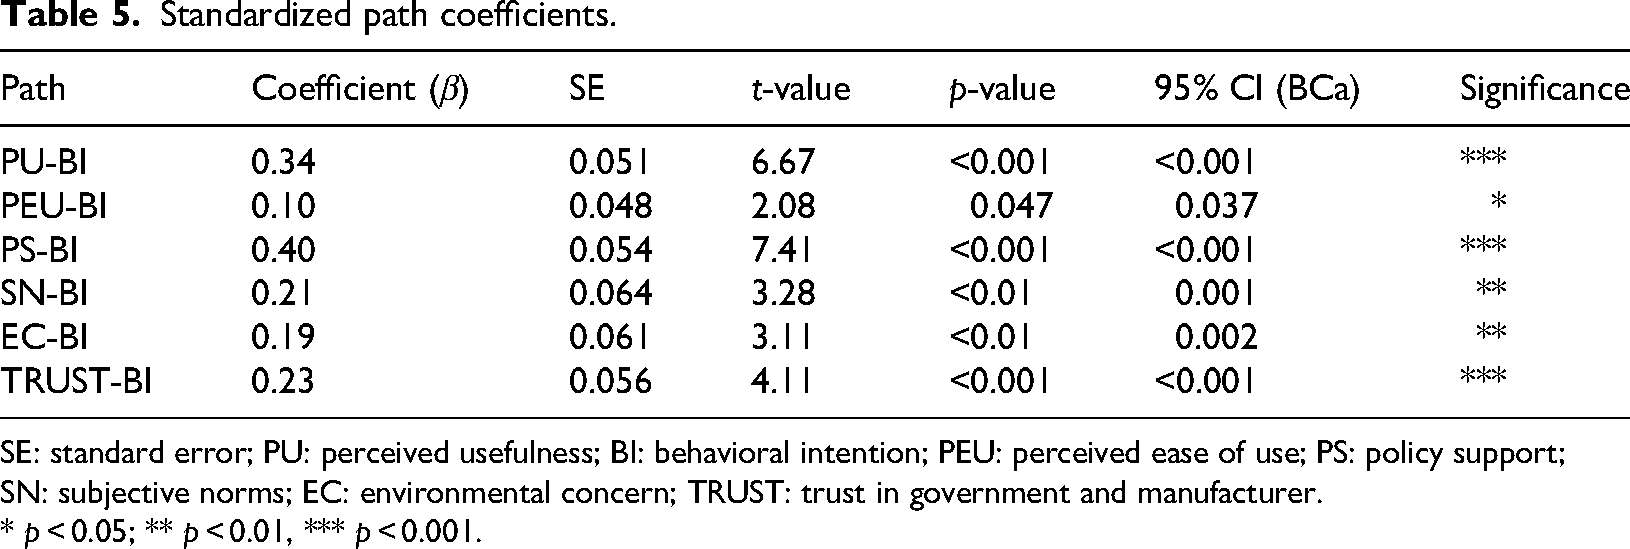
SE: standard error; PU: perceived usefulness; BI: behavioral intention; PEU: perceived ease of use; PS: policy support; SN: subjective norms; EC: environmental concern; TRUST: trust in government and manufacturer.
* p < 0.05; ** p < 0.01, *** p < 0.001.
Path coefficient differences across demographics.
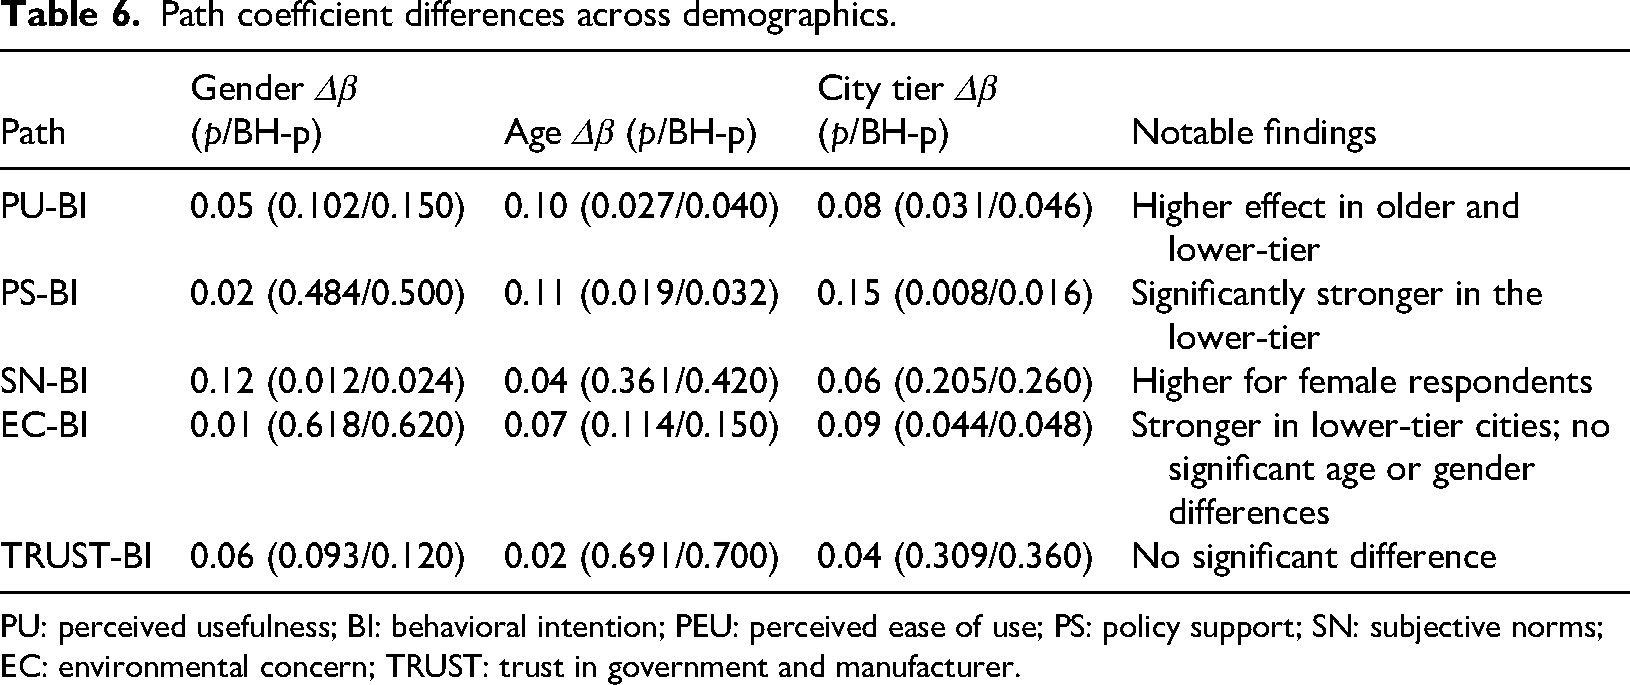
PU: perceived usefulness; BI: behavioral intention; PEU: perceived ease of use; PS: policy support; SN: subjective norms; EC: environmental concern; TRUST: trust in government and manufacturer.
Robustness check (alternative specification): weighted OLS by city tier using post-stratification weights (Supplemental Appendix S2); predictors mean-centered and z-standardized; HC3 SE.
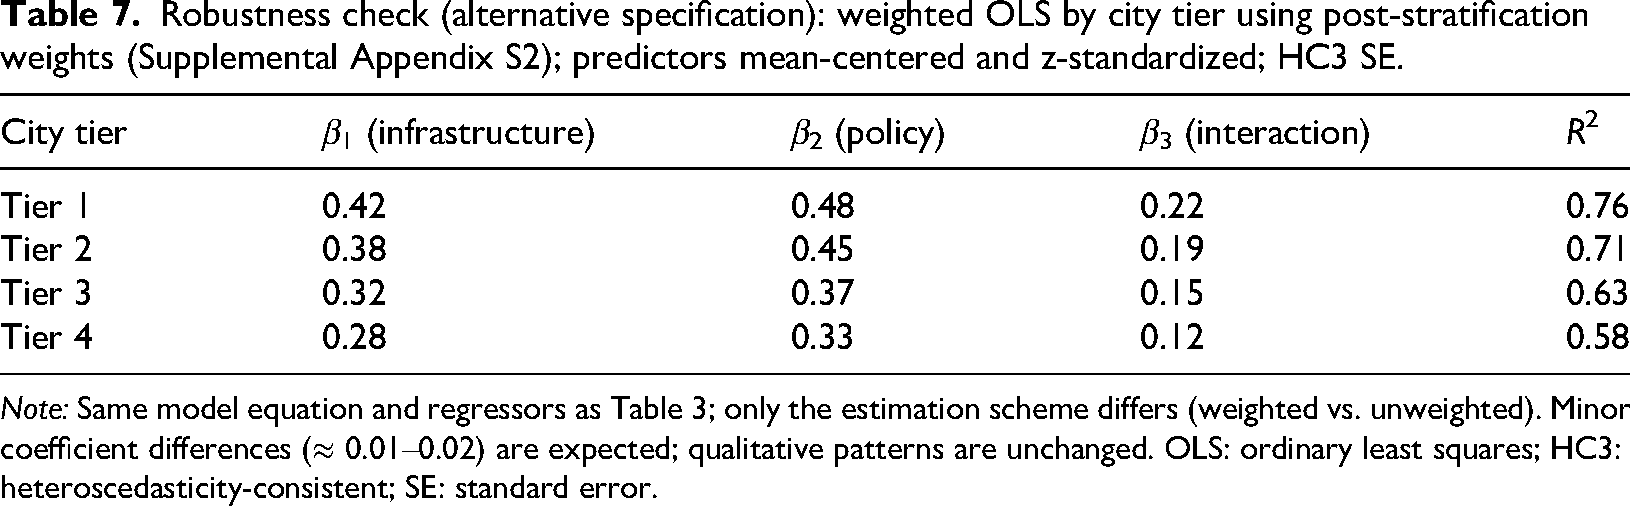
Note: Same model equation and regressors as Table 3; only the estimation scheme differs (weighted vs. unweighted). Minor coefficient differences (≈ 0.01–0.02) are expected; qualitative patterns are unchanged. OLS: ordinary least squares; HC3: heteroscedasticity-consistent; SE: standard error.
Procedural controls to mitigate common method bias. To reduce the risk of common method variance, the survey was administered anonymously with informed consent, predictor and criterion blocks were presented in separate sections, wording and translation were carefully refined during pretesting, and reverse-coded items were included (see Supplemental Appendix S1 for item IDs and coding notes).
Data analysis methods
Reliability and validity testing. Intercoder reliability was assessed using Cronbach's α to ensure consistency of qualitative coding; results are reported in Supplemental Appendix S3. To ensure internal consistency, Cronbach's α was calculated for each latent construct. Values above 0.7 were deemed acceptable; those above 0.8 indicated high reliability.
Exploratory factor analysis (EFA) was conducted to confirm factor loadings, using KMO and Bartlett's sphericity test to assess sampling adequacy (KMO > 0.7 recommended). Any item with a factor loading below 0.5 was excluded. EFA was performed on the full sample (n = 983) as a preliminary check of sampling adequacy (KMO, Bartlett's test) and to remove items with weak loadings (< 0.50). Confirmatory factor analysis (CFA) was subsequently conducted with maximum likelihood (ML) estimation, based on the theoretical model and the interview-derived constructs. We note that both EFA and CFA were conducted on the same dataset; this approach was adopted because the factor structure was strongly theory-driven, and the full sample was required to maintain power for multi-group analysis. Detailed measurement model results, including standardized loadings, SE/t, Cronbach's α, CR, AVE, cross-loadings (Supplemental Appendix Table S5), Fornell–Larcker criterion (Supplemental Appendix Table S10), and HTMT ratios (Supplemental Appendix Table S11), are reported in the Supplemental Material.
CFA. CFA was conducted using AMOS v26.0 (CB-SEM, ML). Model fit indices are reported in Table 2. Multicollinearity was assessed using the variance inflation factor (VIF), ensuring no indicator exceeded a threshold of 5.
SEM. Hypotheses H1 to H11 and RQ1 were tested as specified in Supplemental Section S1. The results confirmed the reliability and validity of all constructions. Fit indices (χ2/df, CFI, TLI, RMSEA, and SRMR) were evaluated. Structural model estimation and multi-group comparisons were performed using PLS-SEM (SmartPLS 4.0). PLS-SEM was selected to estimate interaction effects (e.g. policy support × infrastructure) and to provide robustness alongside FsQCA. Prior to conducting MGA, measurement invariance across gender, age groups, and city tiers was assessed via the MICOM procedure (see Section 2.2.4 (4) and Supplemental Appendix Table S8). We further estimate policy support × infrastructure interactions by city tier and conduct FsQCA to examine configurational sufficiency.
Path coefficients and interaction effects were estimated using PLS-SEM (SmartPLS 4.0) with 5000 bootstrap resamples. For each structural path, we report standardized coefficients (β), standard errors (SE), t-values, exact p-values, and 95% bias-corrected confidence intervals.
Measurement invariance testing. Before conducting MGA, we tested for measurement invariance across gender and city-tier groups to ensure that the latent constructs are comparable between subgroups. Three levels of invariance were assessed: configural invariance (equivalent factor structure), metric invariance (equivalent factor loadings), and scalar invariance (equivalent interceptions). This step provides a necessary statistical basis for subsequent MGA.
Step 1 (configural invariance): the same indicators, data treatment, and algorithm were used across groups. Step 2 (compositional invariance): a permutation test with 5000 replications assessed whether each composite's correlations across groups were ≥ 0.95 and non-significant. Step 3 (equality of composite means and variances): we further tested group equality of means and variances. Per-construct MICOM outcomes (for gender, age, and city-tier groupings) are reported in Supplemental Appendix Table S8.
Common method bias diagnostics. We assessed common method bias (CMB) using complementary post-hoc tests. First, Harman's single-factor test (unrotated EFA) examined whether a single factor dominated the variance. Second, a CFA common-latent-factor (CLF)/ULMC model was estimated to gauge the extent of shared method variance and its effect on trait loadings. Third, we computed PLS full collinearity VIFs for all latent variables (criterion VIF < 3.3). Across these diagnostics, we found no substantive evidence of CMB, and the structural conclusions remained unchanged. Full outputs are provided in Supplemental Appendix Table S9.
Supplementary analysis. To address potential causal complexity, an FsQCA was performed using fsQCA 3.0. This approach enables identification of equifinal configurations of antecedents (e.g. high trust and strong policy perception) that lead to high NEV adoption intention.
Extended experimental and analytical methodology
To further deepen the discussion and validate the interaction mechanisms among driving factors, an extended quantitative modeling approach was adopted in addition to the CFA and descriptive statistics. The main methods are described below:
Multivariate linear regression with interaction terms. To examine the compounded influence of infrastructure availability and policy support on behavioral intention, a multivariate linear regression model with interaction terms was constructed. The general form of the regression equation was defined as follows: where BI
i
is the behavioral intention score of respondents, Ii is the infrastructure density perception score, Pi is the policy support score, Ii × Pi captures the interaction effect, and εi is the error term. The coefficients β1, β2, and β3 were estimated separately for each city tier to detect heterogeneity in influence strength across levels of urban development. Centering and scaling: Prior to constructing the interaction term (I × P), both I (infrastructure perception) and P (policy support) were mean-centered and z-standardized. This treatment reduces non-essential multicollinearity and makes the lower-order effects interpretable at the mean of the moderator. Model fit and robustness testing. Regression fit quality was assessed using the following parameters: (i) R2, coefficient of determination, reflecting explanatory power. (ii) VIF, check for multicollinearity. VIFs were computed for I, P, and I × P in each tier-specific model after centering/standardizing. All VIFs were below 3.0; detailed values by tier are reported in Supplemental Appendix Table S10. A consolidated diagnostics table, including VIF, Breusch–Pagan/White test results, and residual skewness/kurtosis, is reported in Supplemental Appendix Table S11. Robustness check across city tiers. To confirm model robustness across urban levels, stratified regression models were estimated for first-tier to fourth-tier cities independently. The differential coefficients were presented in tabular form (Table 3 reports the baseline tier-wise regressions, including the policy × infrastructure interaction), facilitating tier-wise comparison of driving mechanisms and policy sensitivity. For comparison, the same tier-wise specification is re-estimated with post-stratification weights in Table 7 as an alternative (weighted) specification; the equation and set of regressors remain identical to the baseline. Regression diagnostics were conducted to assess assumption validity. Breusch–Pagan and White tests indicated no significant heteroscedasticity (p > 0.05). Kolmogorov–Smirnov and Shapiro–Wilk tests suggested approximate normality of residuals. To further ensure robustness, heteroscedasticity-consistent robust standard errors (HC3) were estimated, and coefficients and significance levels remained stable.

Analysis of the acceptance and influencing factors
Theoretical model of the adoption intention for NEVs
Model framework and theoretical basis
The adoption intention of NEVs is a complex behavioral outcome shaped by multiple latent psychological and contextual constructs. Building upon the TAM, this study expands the theoretical framework by incorporating additional variables identified as influential in prior literature, such as policy support, subjective norms, environmental concern, and trust. Given that 15 pairwise tests were performed across gender, age, and city-tier groups, we applied the Benjamini–Hochberg procedure to control the false discovery rate. Both raw and adjusted p-values are reported in Table 6. The proposed model includes the following latent constructions: (i) PU: degree to which users believe that NEVs improve driving or environmental performance; (ii) PEU: reflects whether consumers find NEVs simple to use and maintain; (iii) PS: consumer awareness and evaluation of subsidies, licensing, and infrastructure; (iv) SNs: social pressures perceived from friends, colleagues, or institutions to adopt NEVs; (v) EC: individual concern for environmental degradation and climate change; (vi) trust (TRUST): confidence in NEV technology safety and institutional reliability; and (vii) behavioral intention (BI): consumers’ self-reported likelihood of adopting NEVs.
Descriptive statistics of constructs
As shown in Figure 1, the following conclusions can be obtained: (i) BI averaged 4.30, indicating strong consumer intent to adopt NEVs. (ii) PU and PS showed high values (4.18 and 4.30, respectively, the complete descriptive statistics by tier are presented in Supplemental Appendix Table S8), suggesting that utility and supportive policy are major adoption enablers. (iii) TRUST and EC also received favorable scores (∼4.20), confirming trustworthiness and eco-awareness as pivotal in sustainable choices. (iv) PEU and SN were relatively moderate (∼4.00), signaling potential improvement areas for manufacturers and advocacy campaigns.
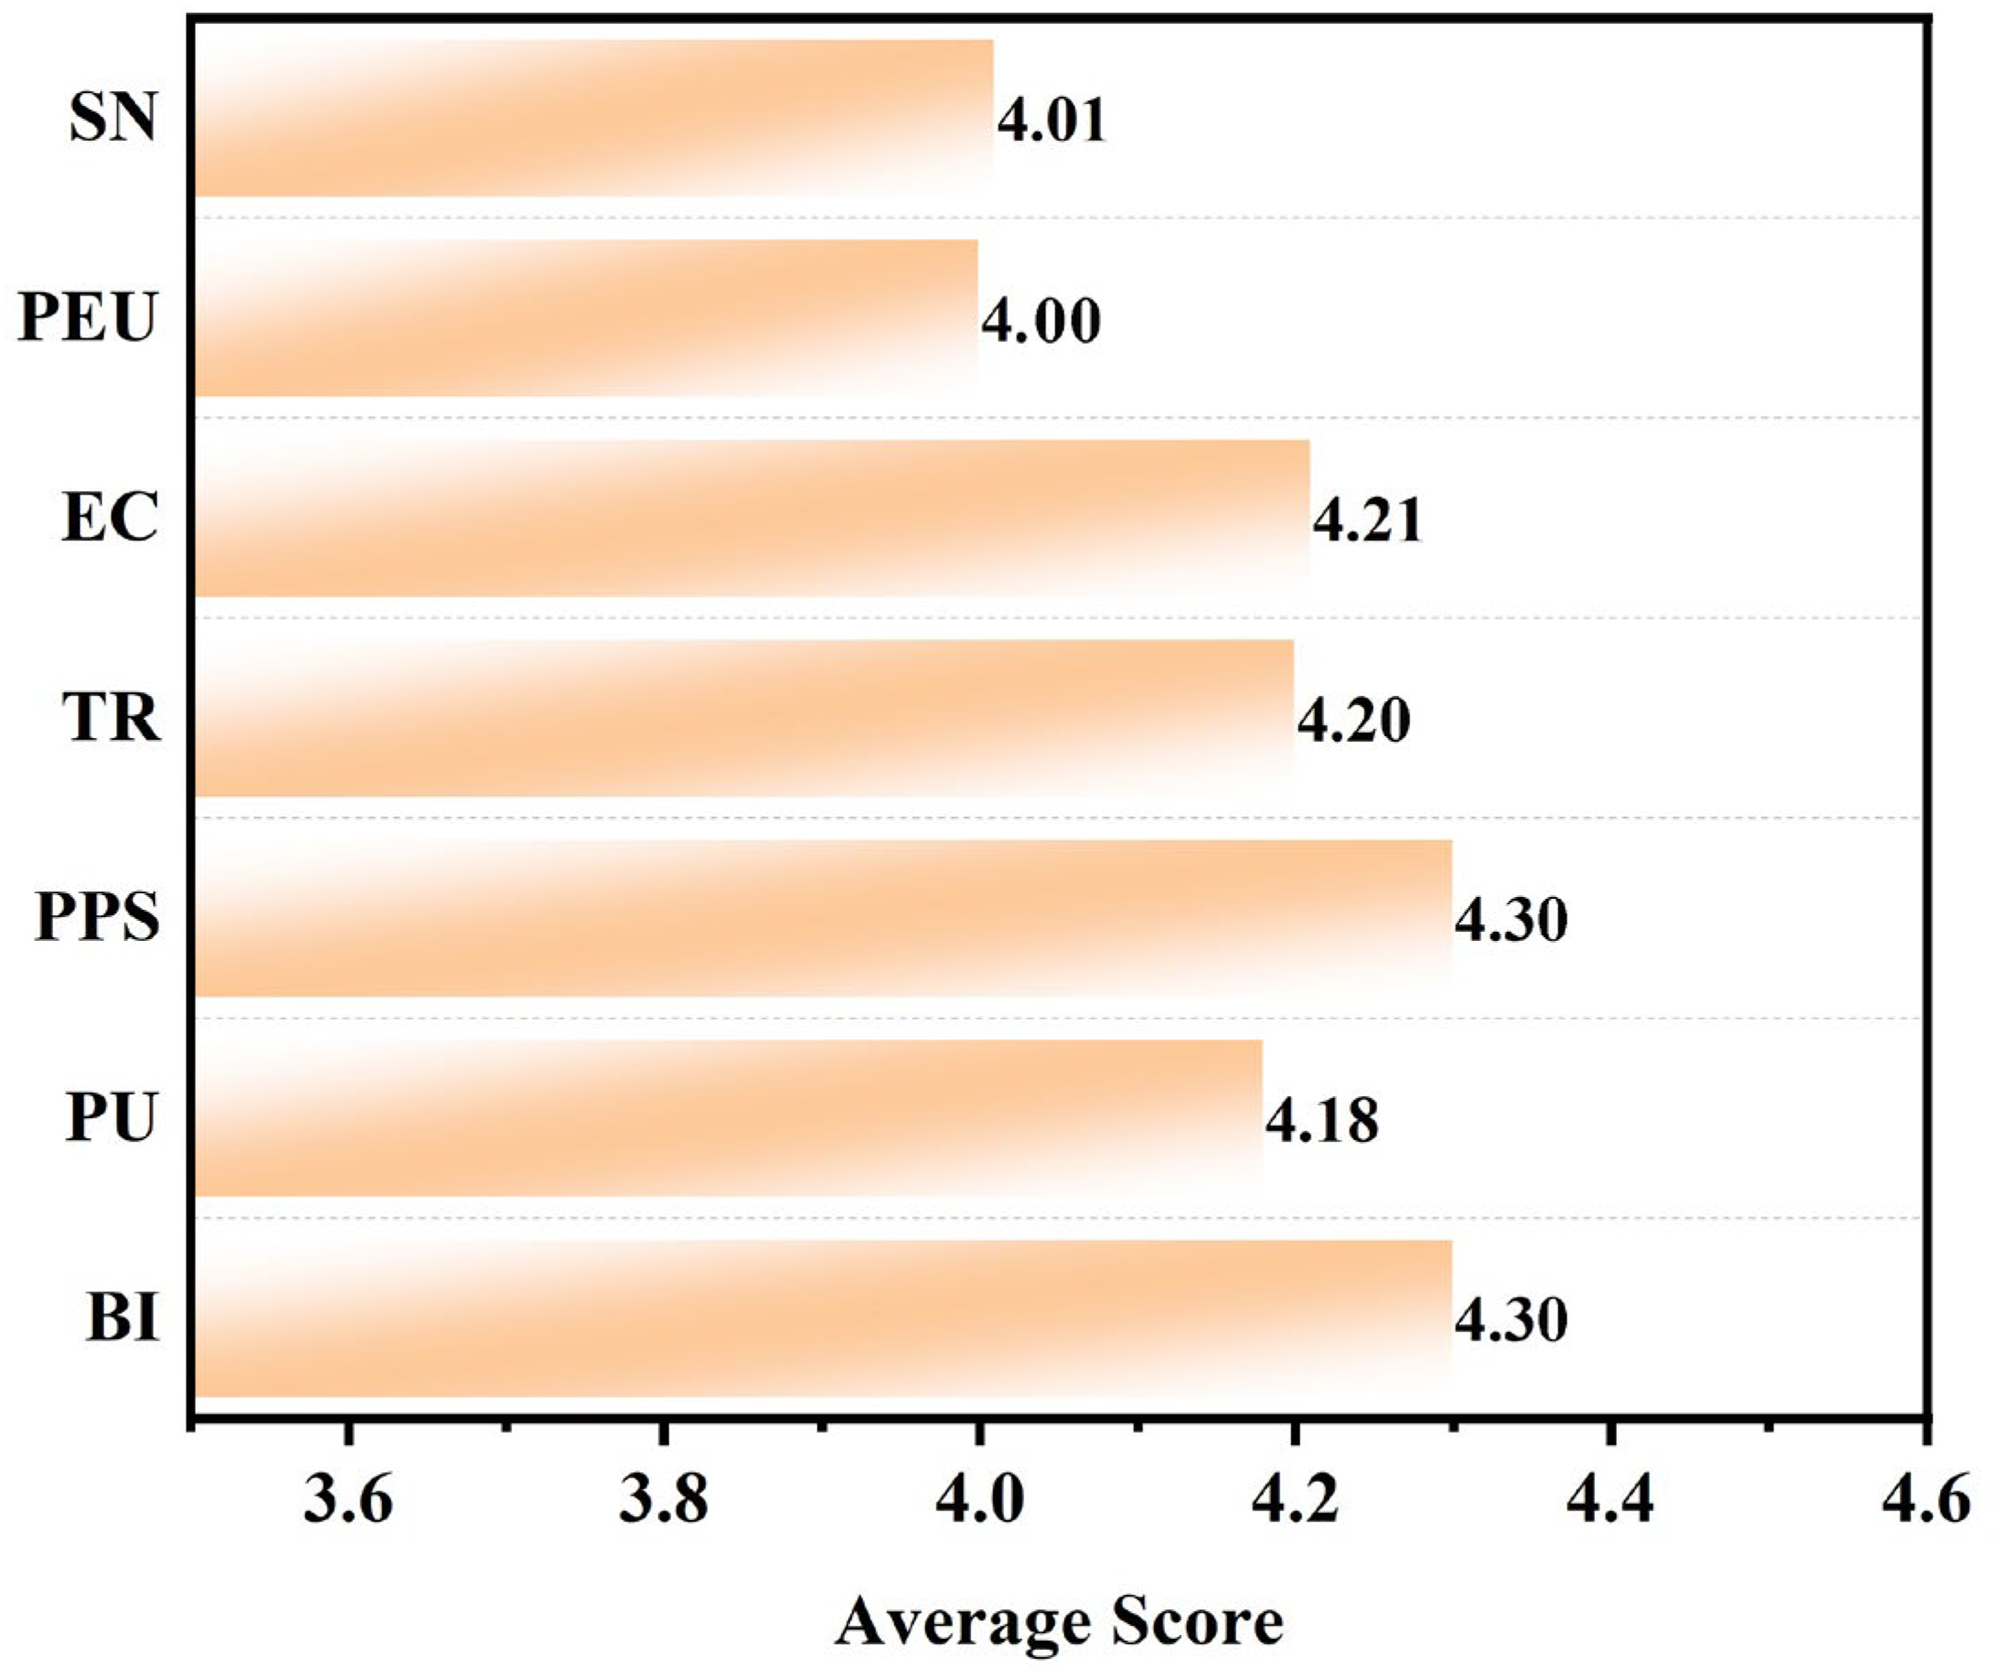
Average scores of latent constructs.
Inter-construct correlation analysis
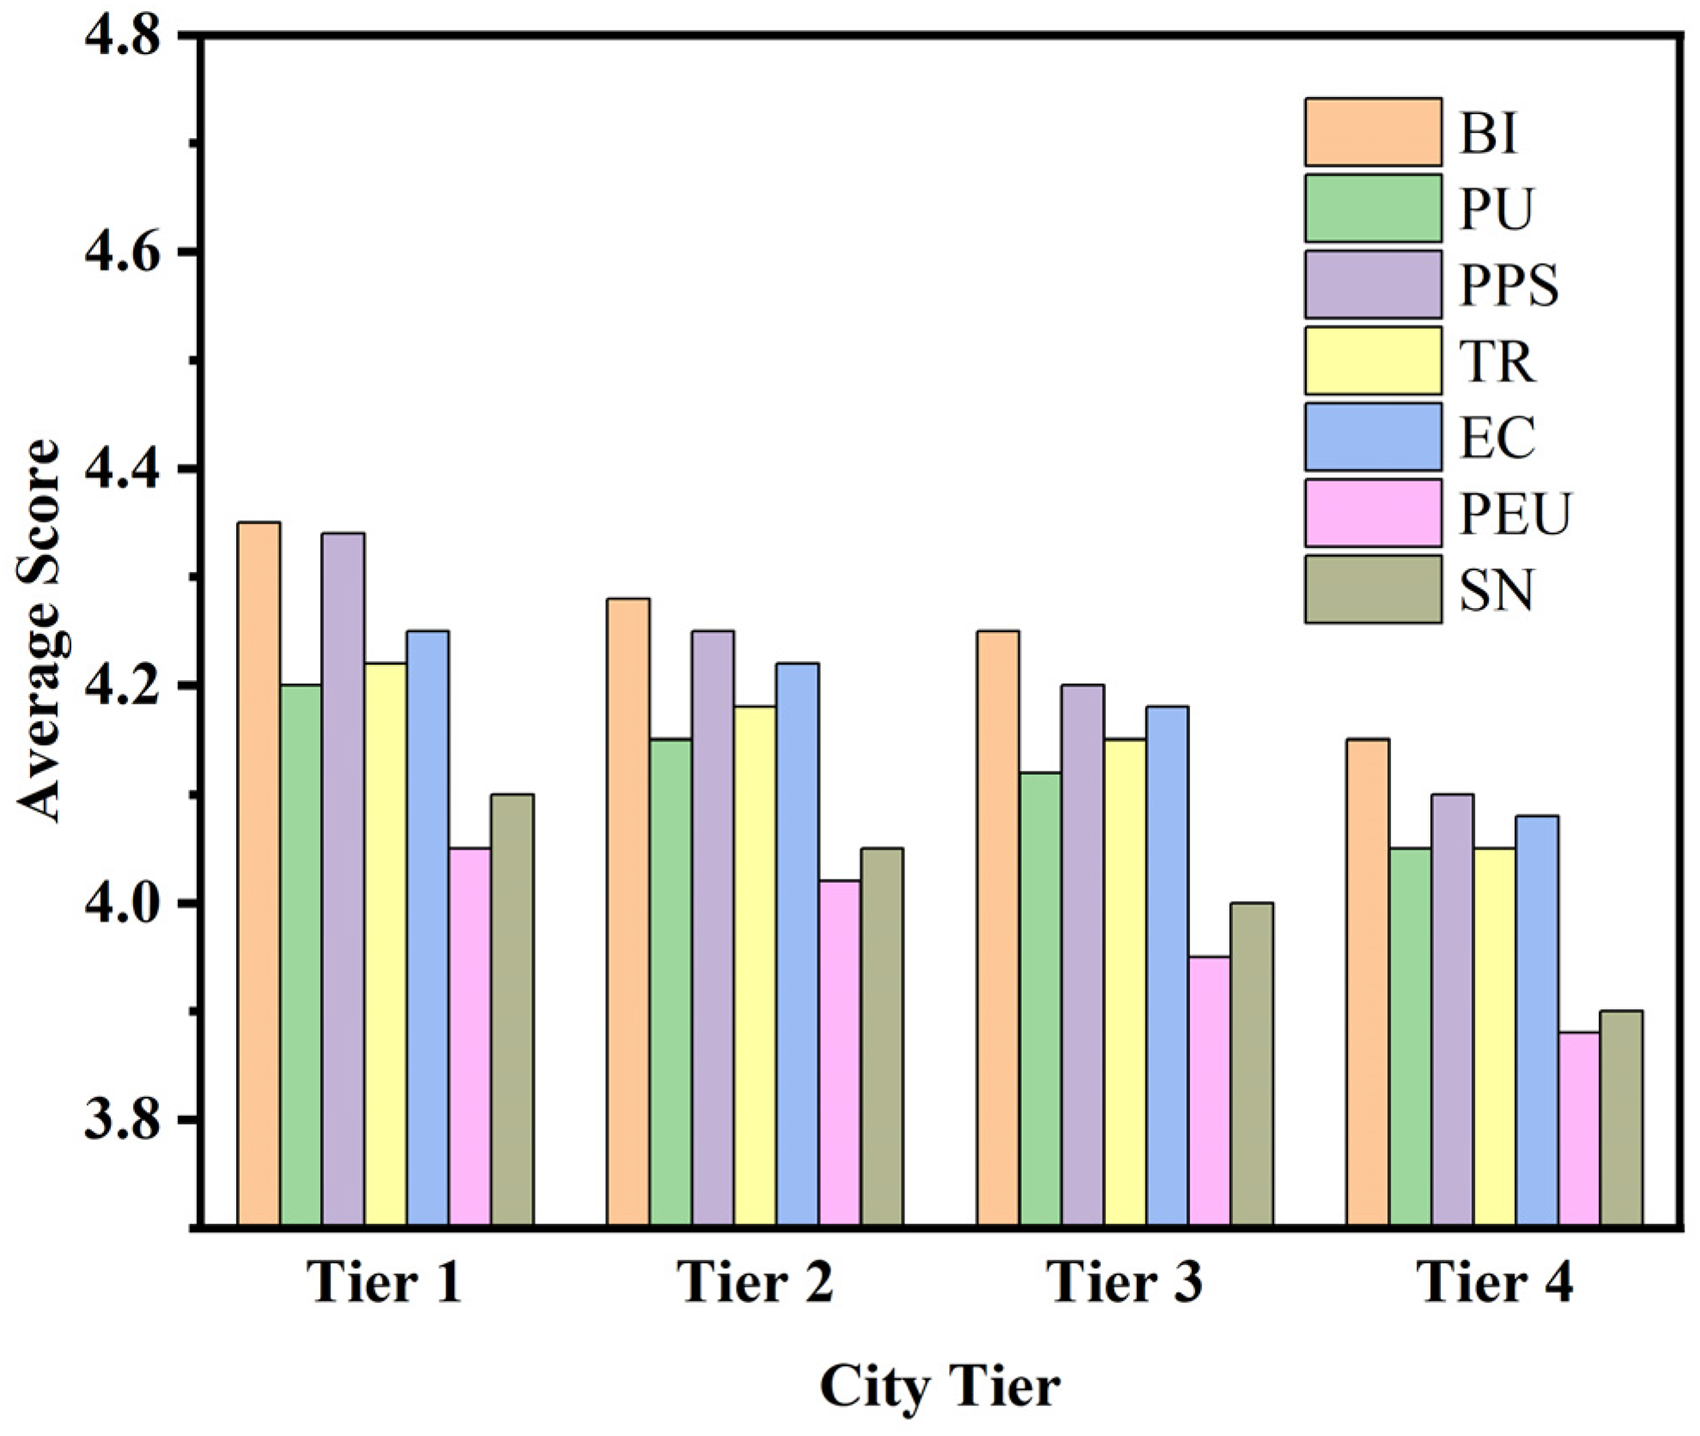
To explore the heterogeneity of influencing factors underlying NEV adoption willingness, we compared the average scores of seven latent constructs—BI, PU, PS, TRUST, EC, PEU, and SN—across four city tiers in Guangdong Province. The results are illustrated in Figure 2.
Correlation heatmap of latent constructs.
BI showed the highest values in Tier 1 cities, followed by a gradual decrease toward Tier 4 (Table S12), indicating a clear trend of declining consumer intention as urban level decreases (Wang et al., 2022). The PU and PS show a similar trend of change. PU decreased from 4.20 in first-tier cities to 4.05 in fourth-tier cities, while PS dropped from 4.34 to 4.10. This trend is consistent with the existing research results, that is, in developed regions with a relatively completely new energy vehicle system, consumers’ perception of product utility and policy incentives becomes more clear and reliable (Zhang and Dong, 2023).
TRUST and EC also showed a gradual downward trend. The scores in first-tier cities were 4.22 and 4.25, while those in fourth-tier cities dropped. This change indicates that although EC is widespread across different city levels, in less developed cities, due to contextual and infrastructure limitations, this concern is difficult to be effectively transformed into specific purchase intentions (Liu and Feng, 2022). On the other hand, PEU and SN exhibited the most notable drops, with the values of PEU and SN falling. The results indicate that technological unfamiliarity and limited normative pressure in Tiers 3 and 4 cities may significantly weaken consumer confidence and social encouragement (Li et al., 2022a, 2022b), who demonstrated that familiarity with charging facilities and social visibility are key moderating variables in rural or semi-urban NEV markets.
Taken together, these findings underscore the necessity of tailoring promotion strategies based on city tier characteristics. While higher-tier cities may benefit from reinforcing innovative attributes and environmental narratives, lower-tier cities require pragmatic enhancements such as visible policy support, infrastructure investment, and peer-group influence campaigns.
Structural equation model estimation and fit indices
SEM model construction
Based on the validated theoretical framework in Section 3.1, we constructed a structural equation model (SEM) to quantitatively analyze the causal relationships among latent variables influencing NEV adoption intention. SEM enables the estimation of both measurement and structural paths. The model includes exogenous variables (PU, PEU, PS, SN, EC, and TRUST) and endogenous variables (BI). Each latent variable was measured using multiple indicators validated via CFA.
Fit indices evaluation
The overall model fit was assessed using commonly accepted indicators. Table 4 summarizes the goodness-of-fit statistics.
Firstly, the chi-square statistic (χ² = 238.44) and its relative ratio (χ²/df = 2.97) fall within acceptable limits. Although the chi-square statistics are sensitive to sample size, the relative normed chi-square ratio being less than the widely accepted threshold of 5.0 indicates an acceptable model-data fit. The comparative fit index (CFI = 0.941) and Tucker-Lewis index (TLI = 0.927) both surpass the 0.90 benchmark, indicating a strong incremental fit when compared with a null or baseline model. Furthermore, the root mean square error of approximation (RMSEA = 0.056) is well below the 0.08 cut-off and approaches the “close fit” standard of ≤ 0.05. This suggests minimal errors in approximating the population covariance matrix. Additionally, the SRMR = 0.043 is comfortably below the 0.08 threshold, indicating a low average residual and excellent fit in terms of absolute error.
The chi-square statistic was χ² = 238.44 with df = 80 (N = 983, p < 0.001). The model was estimated in AMOS v26.0 using ML, and the reported χ² is the standard ML chi-square (not robust/scaled). Examination of standardized residuals indicated that all were within ± 2, suggesting no substantial localized misfit. Modification indices (MIs) suggested a few potential correlated error terms; however, no post-hoc modifications were added, as the theoretical model already demonstrated satisfactory fit, and we sought to maintain theoretical parsimony.
Based on the above results, the proposed theoretical model's structural validity has been strongly verified. The fit indicators of the model have reached good standards in multiple dimensions and are highly consistent with the models in existing studies on the adoption behavior of new energy vehicles. For example, Chen et al. pointed out that in the environmental behavior model, if RMSEA < 0.06 and CFI > 0.93, it can be regarded as a significant indicator of good latent structure fit (Chen et al., 2024). Therefore, the fit goodness of this study not only verifies the structural rationality of the theoretical model but also provides a solid statistical basis for subsequent hypothesis testing and path analysis. This model lays a solid foundation for further exploration of the structural relationships among latent variables that affect the adoption intention of new energy vehicles in different urban levels.
Structural path coefficients and significance
To evaluate the hypothesized relationships among the latent constructs, standardized path coefficients were estimated using SEM. As summarized in Table 5, all hypothesized paths were statistically significant (p < 0.05), affirming the robustness of the theoretical framework. The explanatory power of the model (R²) and Cohen's f² effect sizes is summarized in Supplemental Appendix Table S13. The visual representation is shown in Figure 3, with annotated β coefficients and corresponding significance levels.
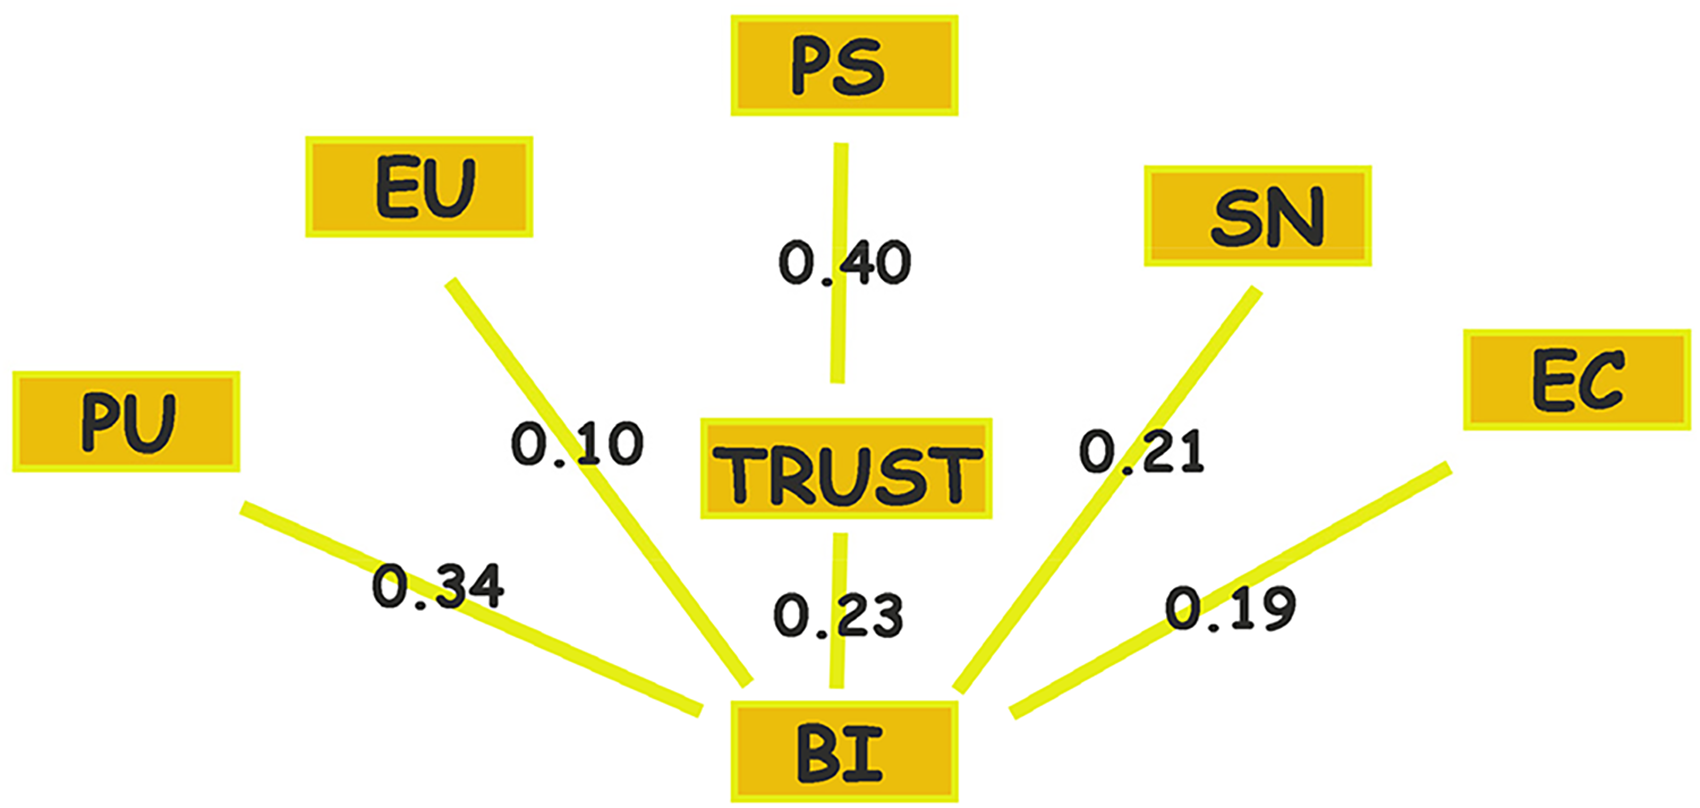
Structural equation modeling (SEM) path diagram.
The strongest predictor of BI was PS (β = 0.40, p < 0.001), indicating that consumers’ awareness and perception of government incentives, charging infrastructure development, and tax subsidies significantly boost their willingness to adopt NEVs (Wang et al., 2022). Policies such as the dual-credit system, free parking, and license plate privileges play a particularly vital role in high-tier cities, as evidenced by our regional comparisons. PU also showed a substantial effect on BI (β = 0.34, p < 0.001), aligning with the TAM (Zhang and Dong, 2023). Consumers who perceive NEVs as offering tangible benefits-such as fuel cost savings, environmental contributions, or driving comfort-are more inclined to adopt them. TRUST emerged as another strong predictor (β = 0.23, p < 0.001), affirming that the perceived reliability of NEV technology and manufacturers plays a critical role in acceptance. SN (β = 0.21, p < 0.01) and EC (β = 0.19, p < 0.01) were also found to be significant. This suggests that social influence from peers, media, and opinion leaders, as well as internalized environmental values, collectively shape behavioral intention (Li et al., 2022a, 2022b; Wang et al., 2022).
Interestingly, PEU had the lowest effect size (β = 0.10, p = 0.047), but it remained statistically significant. This suggests that while NEVs are not necessarily perceived as complex, ease of use is not as dominant as a driver compared to policy and utility. This insight corroborates earlier studies, which showed that once baseline usability expectations are met, other constructions-especially cost-benefit and normative influence-take precedence.
Collectively, these findings validate a multi-faceted motivational structure for NEV adoption, where external enablers (e.g. policy and utility) are complemented by internal drivers (e.g. values and trust). The magnitudes of standardized path coefficients are displayed in Figure 3, illustrating the relative weight of each construct in shaping behavioral intention.
Interpretation
The model suggests that PS and PU are the two strongest direct drivers of NEV adoption intention. These findings are consistent with prior studies (Wang et al., 2022). In addition, Trust and EC are also significant, confirming the socio-psychological basis of environmentally responsible choices. PEU had a marginal yet significant effect (β = 0.10, p = 0.047), which implies that ease of interaction with NEVs is not a primary concern for most respondents, potentially due to improved user familiarity in urbanized regions like Guangdong.
In addition to procedural controls, post-hoc diagnostics (Harman's single-factor, CLF/ULMC, and full collinearity VIFs) suggested no substantive common-method bias; nevertheless, we acknowledge the inherent limitations of ex-post tests and report all outputs transparently in Supplemental Appendix Table S9.
Multigroup analysis: Demographic variations in adoption intention
Methodology and grouping variables
To explore heterogeneity in NEV adoption intention, we conducted a multigroup analysis based on respondents’ demographic characteristics. We categorized the sample into subgroups based on (i) gender (male vs. female); (ii) age group (≤30 years, 31–45 years, and ≥ 46 years); and (iii) city tier (first-tier, second-tier, and third/fourth-tier cities) (Chen et al., 2024; Wang et al., 2022). Pairwise path coefficient differences were tested using permutation tests (5000 iterations, p < 0.05 considered significant).
The configural model demonstrated satisfactory model fit (CFI = 0.941 and RMSEA = 0.056). When constraining factor loadings (metric invariance), the change in CFI was within the recommended threshold (ΔCFI = 0.003), and chi-square difference tests were non-significant. Similarly, scalar invariance was supported (ΔCFI = 0.004, ns; detailed results are reported in Supplemental Appendix Table S14).
Key results and observations
Before interpreting the MGA results, we established measurement invariance via the MICOM steps; per-construct MICOM results for gender, age groups, and city tiers are summarized in Supplemental Appendix Table S8. To further examine the heterogeneity of influencing factors across demographic and regional segments, multigroup analysis was conducted to compare the structural path coefficients of key constructs across gender, age, and city tier. The results are presented in Table 6. Table 6 reports the path coefficient differences across demographic groups. For transparency, both raw p-values and Benjamini-Hochberg adjusted p-values are provided. Significant differences that remain after adjustment include PU → BI (age and city tier), PS → BI (age and city tier), SN → BI (gender), and EC → BI (city tier).
PU → BI shows statistically significant differences across age (Δβ = 0.10, p = 0.027) and city tier (Δβ = 0.08, p = 0.031). Specifically, older respondents and residents from lower-tier cities exhibit stronger responsiveness to PU. This finding aligns with the literature suggesting that older individuals, who are typically more cost-sensitive and less driven by novelty, tend to prioritize practical benefits when making adoption decisions. Similarly, in lower-tier cities where infrastructural maturity is relatively limited, tangible utility becomes a more critical enabler of adoption.
PS → BI also reveals significant differences by age (Δβ = 0.11, p = 0.019) and city tier (Δβ = 0.15, p = 0.008). The stronger effect observed in lower-tier cities suggests a heavier reliance on government-driven mechanisms, such as subsidies, charging infrastructure development, and plate incentives.
SN → BI demonstrate a notable gender difference (Δβ = 0.12, p = 0.012), with female participants showing a significantly stronger reliance on social influence. This is consistent with social psychology literature and studies on gendered adoption behavior, where women are generally more susceptible to social cues, community expectations, and family recommendations in green technology contexts. In contrast, no significant age or city-tier differences were observed for SN.
EC → BI exhibits a significant effect across the city tier (Δβ = 0.09, p = 0.044). Interestingly, residents in lower-tier cities report stronger environmental motivation. This may be attributed to rising awareness campaigns and growing environmental degradation in emerging urban areas. Although traditionally high-tier cities are assumed to be more eco-conscious, the data reveals that well-targeted local initiatives may have bridged or even reversed this perception gap. No significant age- or gender-based differences are detected for EC → BI (see Table 6).
Trust → BI, while significant in the overall SEM, shows no statistically significant differences across gender, age, or city tier. This uniformity underscores the foundational role of trust as a universal prerequisite for NEV adoption across demographic strata.
Integrated discussion and quantitative summary
The results indicate significant demographic heterogeneity in how NEV adoption intention is shaped. The following conclusions can be obtained: (i) PS exhibits the strongest variation across city tiers. Residents in third/fourth-tier cities are more responsive to financial incentives and infrastructure improvement, where regional policy disparities influence NEV uptake. (ii) PU plays a more prominent role among older and lower-tier city residents, suggesting that practical utility perceptions may outweigh trend-driven motives in less urbanized contexts. (iii) SN are significantly more influential for females, consistent with prior literature highlighting gender-based susceptibility to social influence (Li et al., 2024). (iv) EC shows a significant difference across city tiers (Δβ = 0.09, p = 0.044; BH-adjusted p = 0.048), with a stronger EC → BI effect in lower-tier cities. By contrast, age (Δβ = 0.07, p = 0.114; BH-adjusted p = 0.150) and gender (Δβ = 0.01, p = 0.618; BH-adjusted p = 0.620) differences are not significant.
To further consolidate our empirical findings and elevate the interpretation of the adoption dynamics, this section integrates multivariable regression results and interaction modeling, incorporating deeper insights derived from structural coefficient analysis across city tiers.
Table 7 reports robustness check results under a weighted specification (post-stratification weights per Supplemental Appendix S3). Because the model equation and regressors are identical to Table 3, coefficients are very close (typical |Δβ| ≈ 0.01–0.02) yet not identical, reflecting estimation-scheme differences rather than data discrepancies. The qualitative conclusions remain unchanged. As shown in Table 7, the regression coefficients (β-values) across four city tiers reveal consistent patterns: infrastructure density (β1) and policy support (β2) are the strongest positive drivers of NEV adoption intention. However, their magnitude systematically declines from Tier 1 to Tier 4 cities. For instance, β2 drops from 0.48 in Tier 1 to 0.33 in Tier 4, reflecting the diminishing perceived policy effectiveness in less developed areas. The R2 values, decreasing from 0.76 to 0.58, indicate lower model explanatory power in lower-tier cities, possibly due to unmodeled variables such as informal social influence or local economic constraints.
To quantitatively capture interaction effects, an interaction term (β3) is further incorporated in the model:
The contour plot in Figure 4 illustrates the combined effect of infrastructure and policy variables on adoption intention. It confirms that NEV adoption grows exponentially when both dimensions are optimized, particularly when infrastructure density exceeds 7.5 and policy support surpasses 8.0. This validates the dual-lever strategy proposed in multi-agent policy diffusion models (Ehsan et al., 2024).
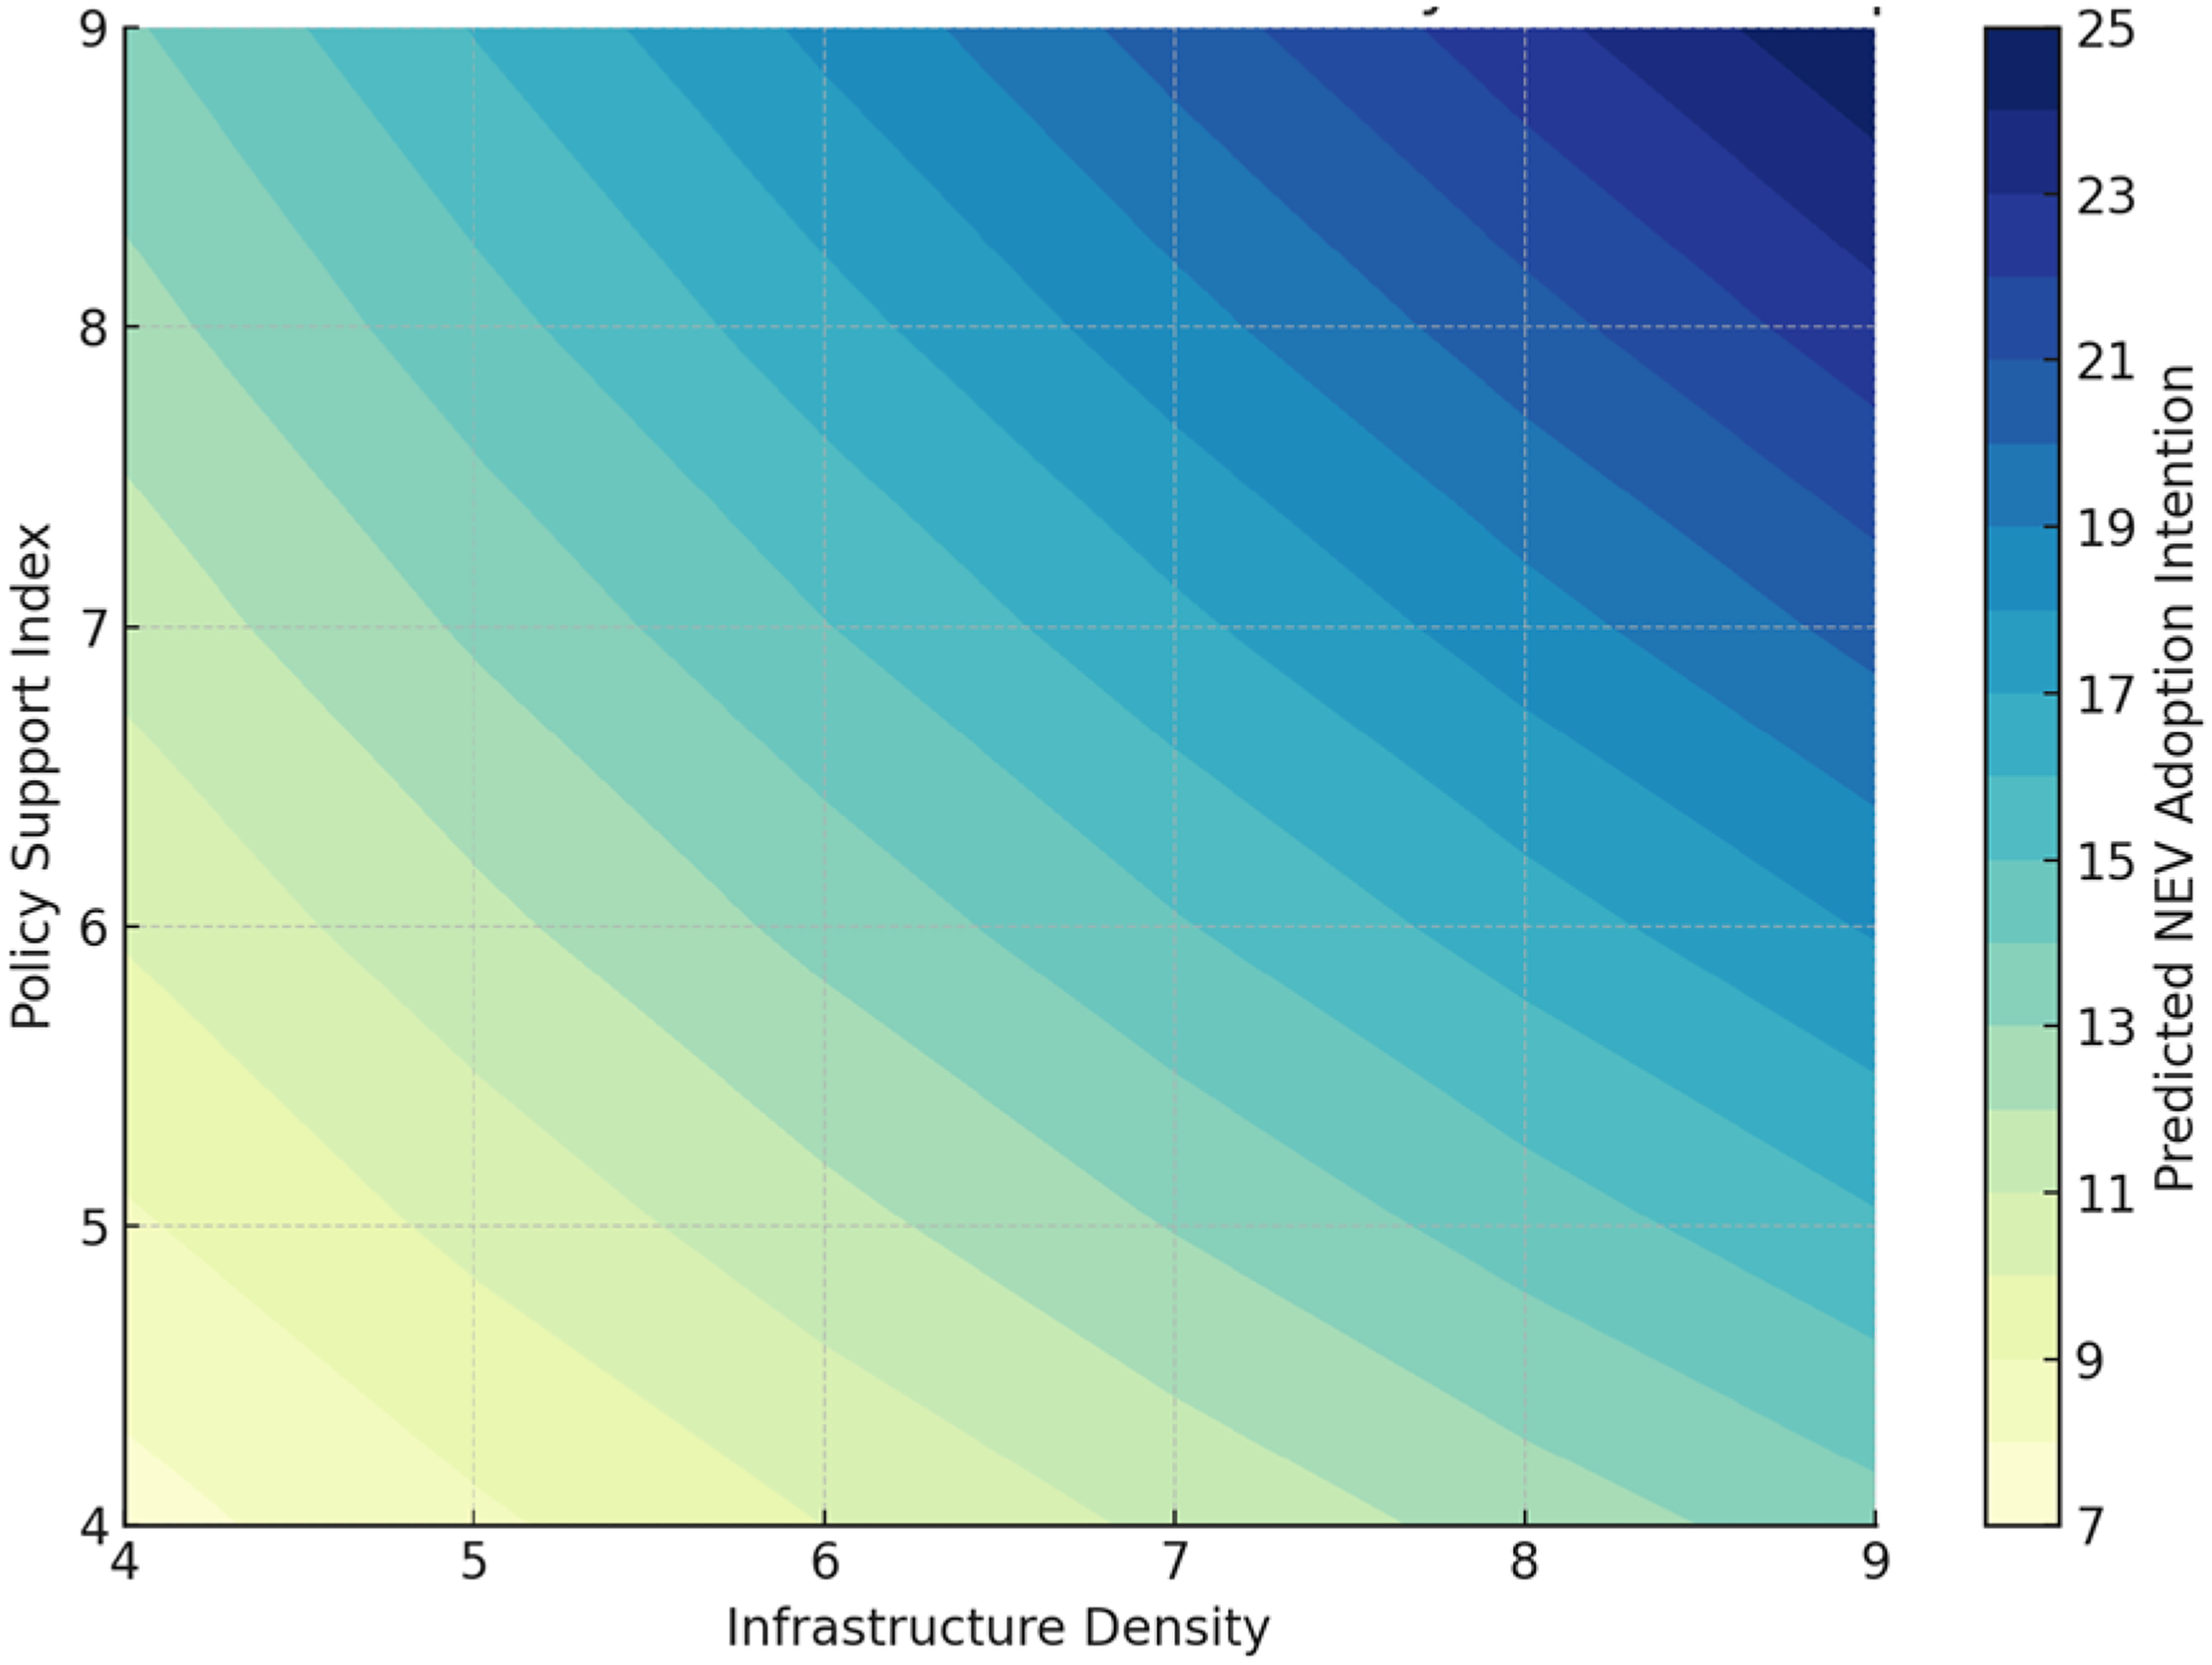
Interaction effect plot.
This result aligns with behavioral research that emphasizes the role of perceived convenience and institutional trust in shaping pro-environmental behavior (Vrain et al., 2022). It also reinforces the TAM model extension that the external environment (policy/infrastructure) indirectly enhances behavioral intention by boosting perceived usefulness and ease-of-use (Fleib et al., 2024; Wang et al., 2022). Simple slopes and J–N regions. Supplemental Appendix Figure S1 depicts simple slopes at ± 1 SD and Johnson–Neyman regions for the I × P interaction by tier. The slopes of I → BI increase with higher P and vice versa; regions of significance are consistent with the positive and significant β₃ reported in Tables 3 and 7.
Thus, to maximize NEV diffusion, particularly in Tier 3 and 4 cities, policies should prioritize infrastructure scaling and create local-level incentive bundling, rather than relying solely on monetary subsidies. Complementary strategies such as charging station standardization and decentralized service networks could effectively elevate the compound benefit zone, as shown in the interaction model. While Guangdong is one of the most advanced and dynamic NEV markets in China, regional heterogeneity is well-documented at the provincial level. Differences in industrial structure, income, infrastructure, and policy intensity may lead to province-specific adoption mechanisms. Hence, our conclusions should be interpreted as Guangdong-specific and not directly generalized to the whole of China without additional evidence.
To benchmark our model against established theories, we draw on the comparative framework. TAM–UTAUT model accounted for 67% of the variance in behavioral intention, which is higher than the explanatory power reported for TAM (57.6%), comparable to UTAUT (69.6%), and close to TPB (70.9%). These comparisons indicate that our model performs on par with classical acceptance theories, while extending their scope by explicitly incorporating institutional (policy support), environmental (concern), and relational (trust) dimensions. This strengthens the theoretical rigor and highlights the incremental contribution of the present research.
FsQCA results
To complement SEM and regression analyses, FsQCA was performed. In addition to the truth table (Supplemental Appendix Table S15), the solution table (parsimonious and intermediate solutions) is provided in Supplemental Appendix Table S15b. Three main causal recipes emerged:
PS * TRUST → BI: strong policy support and trust are jointly sufficient. PU * EC → BI: usefulness combined with environmental concern. PEU * SN * TRUST → BI: ease of use combined with social influence and trust.
These results underscore the configurational logic of adoption, where different combinations of institutional, psychological, and social factors can equivalently drive high intention. Supplemental Appendix Table S15 reports the truth table and the FsQCA solutions (with calibration anchors, frequency and consistency thresholds, and definitions of raw/unique coverage), and documents that the eight main configurations jointly cover ∼72% of high-intention cases (overall solution coverage = 0.72; consistency = 0.86).
Conclusion and policy implications
Conclusion
This study systematically examined the key factors influencing consumers’ willingness to adopt NEVs in different urban levels in Guangdong Province. By integrating the TAM, the policy perception perspective, and environmental psychological variables, a robust SEM was constructed and empirically verified. The research findings indicate that PS and PU are the core variables influencing consumers’ adoption intentions, with their standardized path coefficients being 0.40 and 0.34, respectively. This discovery confirms the crucial role of institutional support and product functional perception in consumers’ decision-making and is highly consistent with the research results that emphasize the importance of government-oriented intervention measures in emerging markets in recent years.
Additionally, Trust and EC exhibited strong positive effects (β = 0.23 and 0.19), demonstrating the significance of credibility and eco-awareness in fostering sustainable mobility transitions. SN and PEU showed relatively lower influence, suggesting that social persuasion and interface simplicity are important but secondary considerations.
Heterogeneity analysis further revealed that consumers in lower-tier cities rely more heavily on policy incentives and perceived utility, while female respondents are more influenced by social norms. These differentiated behavioral patterns highlight the importance of demographically and geographically tailored policy design, an insight consistent with the adaptive governance approach advocated in emerging technology management literature.
From a methodological perspective, the research employed both exploratory and confirmatory factor analyses, robust SEM validation, and cross-group comparison, ensuring model reliability and fit (CFI = 0.941 and RMSEA = 0.056). The latent construct scores and grouped analyses provided further granularity, offering valuable diagnostic insights into regional and psychosocial determinants.
Policy implications
Refined tier-based policy strategy
The policy recommendations below are grounded primarily in the structural and regression analyses. Findings from FsQCA provide complementary configurational perspectives. Because the FsQCA solution demonstrated high consistency (0.86) and substantial coverage (0.72), the resulting patterns should be interpreted as supportive evidence that multiple alternative combinations of psychological and contextual factors can drive adoption. In high-tier cities, where NEV infrastructure is relatively mature, policies should focus on service optimization, such as smart grid integration, advanced charging services, and second-hand NEV regulation. Conversely, lower-tier cities require intensified subsidy schemes, basic charging infrastructure development, and awareness campaigns to stimulate early-stage market activation.
Incentive innovation: (1) City-tier heterogeneity within a single province. Existing NEV research in China either models macro/provincial pathways (e.g. generalized bass or energy-efficiency impacts) or estimates intention models without within-province tier segmentation. By covering all 21 prefecture-level cities of Guangdong and conducting MGA after establishing measurement invariance, we provide a province-wide, city-tier view of consumer mechanisms that have been rarely examined. Prior macro/scenario studies offer national or provincial trajectories but not consumer heterogeneity at the city-tier level. (2) Policy–infrastructure complementarity identified via interaction by tier. We explicitly model a policy support × infrastructure interaction and estimate it separately by city tier. The results reveal a systematic gradient, quantifying how institutional support and service availability jointly shape intention across development levels—an interaction structure not modeled in prior intention studies. (3) Triangulated methods capturing both net and configurational effects. We combine SEM/MGA (net effects and heterogeneity), interaction regressions (complementarity), and FsQCA (configurations and equifinality). This integration moves beyond single-method studies by uncovering multiple sufficient pathways to high intention consistent with causal complexity. Collectively, these advances provide tier-specific managerial and policy implications for Guangdong and a methodological template for other provinces.
Social influence mechanism strengthening
Given the observed gender sensitivity to subjective norms, community-led demonstration projects, female-oriented communication strategies, and social media engagement should be integrated into NEV promotion programs to leverage peer effects more effectively.
Trust and safety regulation transparency
To solidify trust, especially in lower-tier regions, transparent disclosure of battery safety data, performance testing standards, and after-sales service protocols is essential. This aligns with literature emphasizing perceived risk mitigation as a prerequisite for emerging technology acceptance.
Environmentally framed communication
Given that the EC → BI link is stronger in lower-tier cities, education initiatives linking NEVs to carbon neutrality, air-quality gains, and climate mitigation should be prioritized in lower-tier urban populations.
Overall, this study offers a multi-dimensional understanding of NEV adoption behaviors and provides a data-driven foundation for precision policymaking. The differentiated strategies outlined here can contribute to bridging the regional and demographic adoption gaps, ultimately supporting China's broader goals of carbon neutrality and green transportation transformation.
Limitations and generalizability
This study has several limitations that should be acknowledged. First, although the survey covered 983 respondents across 21 cities representing different development tiers (Tier 1: 245; Tier 2: 240; Tier 3: 250; and Tier 4: 248), participation was voluntary. As a result, potential convenience sampling and non-response bias cannot be ruled out. The final valid response rate was ∼81%. Second, the structural model did not include several factors that may influence adoption intentions, such as household income, access to private charging infrastructure, prior vehicle ownership history, or range-anxiety perceptions. Their omission may confound some of the estimated relationships. Third, the data were collected between May and July 2023, during a period of rapid transformation in China's NEV market. The findings, therefore, reflect the market context of that time window and should be interpreted with caution when extrapolated to subsequent periods.
Because our dataset is restricted to Guangdong Province, the results provide province-specific insights. Caution is warranted when generalizing these conclusions to other provinces in China. Future research should include multi-province or national-level samples to validate the robustness and generalizability of our findings. Another methodological limitation is that EFA and CFA were both conducted on the same dataset. Although this approach is justifiable for theory-driven models and widely used in TAM-related behavioral research (Rejali et al., 2023), it may yield somewhat optimistic estimates of model fit. Future studies could implement random split-sample validation or k-fold cross-validation to provide stronger evidence of generalizability. A methodological limitation is that equality of composite means/variances was only partially supported for some constructs; therefore, between-group path differences related to those constructs should be interpreted cautiously, consistent with MICOM guidance. A further limitation concerns the operational scope of NEVs in this study. Since our survey focused exclusively on four-wheeled BEVs, PHEVs, and FCEVs, the findings should not be generalized to other forms of electric micromobility (e.g. scooters and e-bikes). Future research may expand to include these categories to provide a broader view of sustainable mobility adoption.
Supplemental Material
sj-docx-1-eea-10.1177_01445987251393553 - Supplemental material for Modeling consumer acceptance of new energy vehicles in Guangdong Province, China: An empirical study
Supplemental material, sj-docx-1-eea-10.1177_01445987251393553 for Modeling consumer acceptance of new energy vehicles in Guangdong Province, China: An empirical study by Shun Lv in Energy Exploration & Exploitation
Footnotes
Acknowledgements
The author thanks the project of “A Study on Institutional Path Building to Enhance the Resilience of Social Governance in Guangdong Province,” which is funded by The Plan of Philosophy and Social Science of Guangdong Province 2023 Annual Discipline Co-Constructive Project (No. GD23XGL121). And the project of “Research on the Path of Promoting the Social Governance Effectiveness in Foshan City by Social Capital Enhancement-Based on Cluster Analysis and Structural Equation Modeling,” which is funded by the 2023 Young Innovative Talent Category of Colleges and Universities in Guangdong Province (No. 2023WQNCX255).
Ethical considerations
This study was conducted in accordance with the ethical standards of Shunde Polytic. Ethics approval was obtained from the Institutional Review Board.
Consent to participate
All respondents provided informed consent prior to participation.
Funding
The author disclosed receipt of the following financial support for the research, authorship, and/or publication of this article: This work was supported by the 2023 Young Innovative Talent Category of Colleges and Universities in Guangdong Province, The Plan of Philosophy and Social Science of Guangdong Province 2023 Annual Discipline Co-Constructive Project (grant number 2023WQNCX255, GD23XGL121).
Declaration of conflicting interests
The author declared no potential conflicts of interest with respect to the research, authorship, and/or publication of this article.
Supplemental material
Supplemental material for this article is available online.
References
Supplementary Material
Please find the following supplemental material available below.
For Open Access articles published under a Creative Commons License, all supplemental material carries the same license as the article it is associated with.
For non-Open Access articles published, all supplemental material carries a non-exclusive license, and permission requests for re-use of supplemental material or any part of supplemental material shall be sent directly to the copyright owner as specified in the copyright notice associated with the article.