
Abstract
Accurately capturing how consumer energy-related priorities evolve is pivotal for guiding the low-carbon transition of road transport. Drawing on more than 47,000 online reviews from China's AutoHome forum, we build a user-generated content-driven, two-stage framework that first fuses BERTopic modeling with aspect-level bidirectional encoder representations from transformers sentiment analysis to extract energy-salient attributes—battery durability, charging convenience, efficiency—and classify them via an extended Kano model that incorporates Mann–Kendall trend testing to reveal whether once-“indifferent” attributes are becoming value-added or obsolete. We then forecast the future trajectories of user satisfaction and attention for each attribute by decomposing the multi-frequency demand signals with ensemble empirical mode decomposition and learning bidirectional temporal dependencies with an attention-enhanced bidirectional gated recurrent unit network, achieving mean-absolute-error improvements of 12–21% over transformer- and BiLSTM-based baselines while retaining near-real-time runtimes (∼10 s per forecast). Empirical results highlight a rapid uplift in sentiment toward high-density battery packs and ultrafast charging—signaling emerging energy “value levers”—while declining satisfaction with cabin space warns of design bottlenecks. The proposed EEMD–Attention–BiGRU pipeline thus converts noisy social feedback into fine-grained, forward-looking intelligence that can steer automakers, grid planners, and policy makers toward more resilient battery strategies, targeted charging-infrastructure roll-outs and agile product road-mapping in the sustainable-energy era.
Introduction
New energy vehicles (NEVs), due to their independence from traditional fossil fuels, have demonstrated significant advantages in reducing energy consumption and pollutant emissions (Su et al., 2021). The promotion of NEVs in China, a major global automobile manufacturer and consumer, has contributed not only to easing ecological and energy security challenges but also to driving technological innovation and the high-end transformation of the automotive industry. Therefore, accelerating the development of NEVs is of great practical significance to China's current sustainable development strategy. In 2023, NEV sales in China increased by 37.9% year-on-year, with a global market share exceeding 60%, further consolidating its leading position in terms of production capacity and market scale (Li et al., 2023). To maintain product competitiveness, ongoing technological innovation and iterative product upgrades have been required for relevant manufacturing enterprises.
Consumer demands have been undergoing rapid and diversified changes, driven by ongoing technological progress and rising living standards. The ability of NEV enterprises to promptly detect and respond to evolving market demands has become a key factor influencing their product success in the marketplace (Zhang et al., 2022). To enhance competitiveness, increasing attention has been paid by enterprises to consumer purchase intentions, aiming to improve market value and operational efficiency through precise demand alignment. Customer preferences play a pivotal role in corporate strategic planning, serving not only as a reference for product optimization and development but also as a fundamental support in product positioning, market segmentation, and advertising strategies (Zhang et al., 2024b). In highly volatile market environments, traditional user preference and demand modeling methods have typically relied on one-time survey data to construct predictive models. However, such approaches have struggled to dynamically capture the temporal evolution of user needs, thereby affecting the timeliness and accuracy of prediction results. The widespread adoption of Internet has significantly transformed consumer shopping behaviors, leading to the rapid development of online retail models such as e-commerce platforms and community group buying. Meanwhile, social media has increasingly emerged as a critical factor influencing consumer purchasing decisions (Abbas et al., 2024). By posting online reviews about their product usage experiences, consumers collectively shape a product's online reputation, which has increasingly become a key reference for potential users in evaluating product value. Online reviews, as a novel form of word-of-mouth communication, provide comprehensive reflections of consumer experiences and evaluations, thereby enabling firms to gain deeper insights into customer preferences. Moreover, the low acquisition cost and high update frequency of online reviews have endowed them with significant value in assisting manufacturers to dynamically track shifts in user preferences. In the automotive sector, an increasing number of potential car buyers tend to consult user-generated evaluations on vertical automotive platforms as an important reference for their purchasing decisions (Zhang et al., 2021). Consumers tend to exhibit greater caution in making purchasing decisions regarding emerging product categories such as NEVs, and place increased reliance on authentic user reviews (Wang et al., 2022). However, the large volume of data hosted on social media platforms is typically unstructured and highly complex, reflecting diverse and latent user preferences. Accordingly, the efficient and accurate classification of user demand information and prediction of dynamic user preferences from review texts on social media and e-commerce platforms has emerged as a critical research topic in the field of user behavior modeling (Du et al., 2022).
This study combines BERT-based Topic modeling (BERTopic) modeling and sentiment analysis to extract and classify user demands from online reviews. By incorporating a Kano model and Mann–Kendall trend analysis, we identify how “indifferent” attributes may evolve over time (Ji et al., 2024; Jin et al., 2022). These attributes are categorized as value-added, obsolete, or stable based on satisfaction and attention trends, offering deeper insight into shifting user needs and enhancing the dynamic application of a Kano model for strategic decision-making (Shiri et al., 2023). To forecast user preference trends, we propose a hybrid model integrating ensemble empirical mode decomposition (EEMD) with an attention-enhanced bidirectional gated recurrent unit (BiGRU) network. EEMD decomposes the original time series into multi-scale components, while BiGRU captures bidirectional temporal patterns. An attention mechanism highlights key time steps, improving both prediction accuracy and interpretability. This model outperforms traditional methods in handling non-linear, volatile data and enables more precise demand trend forecasting.
Building upon previous research, this study proposes a method for analyzing the evolution and forecasting trends of NEV demand based on user-generated content (UGC). This method integrates natural language processing and deep learning models to extract and model features from unstructured text, uncovering user preference dynamics and generating actionable trend insights. The objective is to assist NEV enterprises in gaining deeper insights into target user groups, addressing the limitations of traditional models in capturing indifferent demands, and uncovering their latent value to support product optimization and better respond to evolving customer needs. The main contributions of this study are summarized as follows:
A hybrid topic sentiment–Kano framework is proposed to mine multi-dimensional user demand structures from online reviews. Unlike conventional demand extraction approaches, our framework combines BERTopic modeling, deep sentiment classification, and Kano perception modeling to simultaneously capture explicit topics and emotional valence, enabling interpretable and structured demand profiling. A novel trend recognition method for “indifferent” attributes is introduced. By incorporating a Mann–Kendall non-parametric trend test with satisfaction time series, the proposed method dynamically reclassifies Kano attributes into value-added, obsolete, or stable categories. This addresses a key gap in traditional Kano analysis, which lacks dynamic tracking capabilities. We develop an EEMD-enhanced Attention-BiGRU model to improve user demand trend forecasting. The model integrates EEMD for multi-scale feature extraction and an attention-enhanced BiGRU network to capture bidirectional temporal dependencies with dynamic weighting. Compared to traditional long short-term memory (LSTM)-based methods, our model offers superior accuracy, interpretability, and efficiency in non-linear time-series prediction.
Related work
User demand extraction and preference analysis based on online reviews
With the advancement of emerging information technologies, consumers have become increasingly proactive in product development and have gradually evolved into key participants in enterprise value co-creation (Guzel et al., 2020). Online reviews, as a critical channel for enterprise–consumer interaction, have received growing attention and are widely utilized to support product improvement and new product development. Research on user demand extraction and preference analysis based on online reviews has primarily focused on three core aspects: namely, the acquisition and preprocessing of review data, the identification and structured representation of product attributes, and the modeling and analysis of user preference features (Li et al., 2020).
In UGC analysis, data acquisition is typically accomplished using web crawler technology. Web crawlers are a type of automated program designed to simulate user access behavior, systematically send batch requests, and extract webpage content. By applying predefined parsing rules, crawler programs can extract analytically valuable information from noisy web data (Kunekar et al., 2024). For enterprises, this technology offers significant advantages in collecting product-related online data, particularly in obtaining key information such as product pricing and user reviews that reflect market dynamics and consumer demand, and has become a critical tool for supporting market analysis and product strategy formulation.
In the identification and structured representation of product attributes, numerous studies have attempted to extract valuable information from online reviews. Common approaches include feature induction based on clustering analysis and keyword extraction using topic modeling techniques. These methods effectively support the identification of product features and associated user needs, providing a structured foundation for subsequent modeling and analysis. Abbas et al. applied the term frequency-inverse document frequency (TF-IDF) method to vectorize product descriptions and user review texts, extracting representative keywords. The method assigns weights to each term in the corpus by calculating its frequency and inverse document frequency, thus identifying terms with high informational value in specific contexts (Abbas et al., 2023). Cai et al. proposed a product- and user-oriented demand analysis approach that integrated machine learning-based feature extraction, hierarchical clustering, and sentiment-attention weighted ranking to automatically identify and classify user demands from online reviews and analyze user attribute differences. The effectiveness of the method was validated using NEV review data (Cai et al., 2021). Zhang et al. (2024c) proposed a user demand identification method that combined quadrant modeling with Bayesian networks based on online reviews and operational data to mine user demands and their influencing factors, and validated the approach using heavy-duty truck data. Ray et al. developed a hotel recommendation system based on sentiment analysis and aspect classification, which employed an ensemble model combining bidirectional encoder representations from transformers (BERT) and random forests for sentiment classification and used fuzzy logic and cosine similarity for aspect segmentation of the reviews (Ray et al., 2021). Traditional topic modeling methods, such as latent Dirichlet allocation (LDA) and probabilistic latent semantic analysis, rely on word co-occurrence patterns when processing textual corpora. However, these methods are limited in their ability to capture deep semantic relationships between words, particularly in short or noisy texts, where topic identification performance tends to deteriorate. In contrast, BERTopic enhances semantic vectorization by incorporating Sentence-BERT and combines it with advanced clustering algorithms to significantly improve topic extraction accuracy, allowing for more sensitive detection of fine-grained topic variations in text. Yi et al. (2025) applied the BERTopic model to extract topics from customer reviews and categorized the identified topics into key service quality dimensions based on the SERVQUAL framework, thereby enabling systematic classification and analysis of user concerns. However, topic mining can identify product attributes of user interest but falls short in reflecting user satisfaction. To gain deeper insights into user preferences, an increasing number of studies have integrated topic modeling with sentiment analysis to jointly explore users’ specific product demands and emotional attitudes. Wang and Pan (2025) combined LDA with the Kano model to analyze Interpretable multivariate time series user reviews, aiming to identify key issues influencing consumer behavior. Compared to the SERVQUAL theory, which emphasizes service quality assessment, a Kano model focuses more on classifying user needs and analyzing their sensitivity, and is considered more suitable for dynamic demand contexts, making it a frequently adopted core method in user satisfaction analysis.
A Kano model is a user-oriented approach that has proven particularly effective in evaluating the impact of product attributes on user satisfaction (Xu et al., 2009), and facilitates decision-making in product optimization. It categorizes user needs into Must-be, One-dimensional, Attractive, and Indifferent types, each assigned a distinct priority level, thereby offering a clear framework for modeling and analyzing user preference characteristics. indifferent needs refer to attributes with limited influence on user satisfaction and are often overlooked in enterprise resource allocation. However, in rapidly evolving industries such as NEVs, these needs are shaped by shifting user perceptions and market conditions, and may transform into value-added features or become obsolete, thus holding latent strategic value. This study employs BERTopic and sentiment analysis to extract and preliminarily classify topics from UGC, and subsequently constructs time-series data on attention and satisfaction levels for indifferent attributes by introducing a Mann–Kendall test to evaluate their temporal evolution trends. Accordingly, indifferent needs are further subdivided into value-added, obsolete, and stable attributes to support dynamic modeling of user preference characteristics and inform product optimization decisions, thereby extending the applicability of a Kano model in dynamic contexts.
User preference trend prediction based on deep learning
Although forecasting user preference trends is critical for understanding market dynamics and guiding product innovation, systematic research in this area remains relatively limited. In the existing literature, various approaches have been adopted to capture the evolution of user demand, including traditional statistical methods such as time-series analysis and clustering-based prediction. With the rapid development of artificial intelligence and big data technologies, the scale and dimensionality of user behavior data have continued to expand, thereby providing richer semantic features and temporal dependency cues for demand trend modeling. Against this backdrop, forecasting methods have gradually shifted from static modeling to dynamic paradigms based on neural networks and deep learning, with an emphasis on uncovering and understanding non-linear evolution patterns and multi-scale features.
Zohdi et al. proposed a customer information-based machine learning approach for demand forecasting, in which an extreme learning machine (ELM) was employed for intermittent demand prediction for the first time and compared against multiple alternative algorithms. Results showed that neural network models generally outperformed other approaches, with ELM demonstrating notable advantages in both prediction accuracy and computational efficiency (Zohdi et al., 2022). Javanmard et al. introduced a multi-sector energy demand forecasting method that integrates six machine learning algorithms with optimization models, covering seven major energy consumption sectors in Iran. The model ensemble incorporated predictive outputs from artificial neural network, autoregressive, autoregressive integrated moving average, seasonal autoregressive integrated moving average, seasonal autoregressive integrated moving average with eXogenous variables, and LSTM, and enhanced forecasting accuracy through particle swarm optimization and gray wolf optimization. The results demonstrated that the ensemble model consistently outperformed individual algorithms, showing high accuracy and adaptability across all sectors (Javanmard and Ghaderi, 2023). Liu et al. proposed an adaptive framework to address missing values and class imbalance in consumer preference prediction by optimizing the combination of missing data mechanisms, imputation methods, class balancing strategies, and classification algorithms. Empirical results on UCI datasets indicated that random forests consistently achieved the best performance across various combinations, whereas a logit model was found to be most sensitive to class imbalance (Liu et al., 2024). Alsayat developed a hybrid model based on supervised learning, text mining, and clustering techniques to analyze customer decision-making behaviors from large-scale social media reviews related to Mecca hotels. The study incorporated support vector regression (sequential minimal optimization), LDA, and K-means clustering to model and segment TripAdvisor reviews, effectively revealing satisfaction characteristics across different customer groups and validating the method's practicality for UGC analysis in tourism contexts (Alsayat, 2023). Ko et al. proposed a deep learning-based prediction framework to predict consumer preference ratings for flavor and appearance based on ultrasonic characteristics of pork. This method was the first to apply a deep neural network ensemble model to pork carcass data collected using the AutoFom III system, and its predictive performance was validated through long-term consumer survey data (Ko et al., 2023). Duan et al. proposed a sequential recommendation model, MhSa-GRU, that combines multi-head self-attention with gated recurrent units (GRUs) to jointly model dynamic user preferences and item-to-item relationships. The model incorporates multi-dimensional features such as price, behavior, and category, and improves robustness through attention masking and threshold mechanisms. Experiments on three real-world datasets demonstrated that MhSa-GRU outperformed existing methods in terms of hit rate and mean reciprocal rank metrics (Duan et al., 2023). Yin et al. (2022) introduced a sequential recommendation model that integrates user preferences with spatiotemporal information. It employs spatiotemporal GRUs to capture long-term preferences and leverages attention mechanisms to model short-term behaviors while integrating user profile information to predict subsequent interaction locations. Experimental results on the Foursquare and Brightkite datasets confirmed that the model outperformed baseline methods in HR@K, normalized discounted cumulative gain@K, and mean average precision@K, improving recommendation accuracy in long-sequence scenarios. Fang and Meng (2022) proposed a next point-of-interest recommendation model, user relative performance index-GRU, that incorporates user relationships and preference information. The method constructs a user relationship graph and categorizes preferences into current, periodic, and long-term types based on check-in times. Short-term and long-term preference scores are modeled using GRU and K-nearest neighbors, respectively, and are subsequently fused to generate recommendations. Experimental results on two real-world datasets demonstrated that the model significantly outperformed existing approaches in recommendation accuracy. GRU, as a structurally optimized recurrent neural network, has demonstrated strong temporal modeling capabilities and computational efficiency in capturing user preference dynamics. Its gating mechanism enhances stability and generalization in long-sequence learning, enabling the model to capture both short-term fluctuations and long-term dependencies in user behavior. This makes GRU particularly suitable for modeling non-stationary and dynamically changing behavioral data. Compared to the more complex LSTM, GRU achieves comparable representational capacity with fewer parameters, making it better suited for deploying efficient predictive models on large-scale behavioral datasets.
Building upon these advantages, this study introduces an enhanced architecture to improve the model's ability to perceive multi-scale features and selectively focus on critical information. Specifically, a fusion framework combining EEMD, attention mechanism, and BiGRU is proposed. EEMD is applied to perform frequency-domain decomposition of the original sequence, extracting both local fluctuations and global trend signals to enhance the model's representational capacity for non-stationary demand data. The BiGRU enables simultaneous modeling of user behavioral dependencies in both forward and backward temporal directions. The attention mechanism further guides the model to focus on temporally and modally significant components with predictive value, thereby enhancing information weighting and improving both prediction accuracy and interpretability. This integrated framework aims to facilitate fine-grained modeling of the user demand evolution process and to improve trend forecasting performance under dynamic and uncertain conditions.
Methodology
Model and technical architecture
To deeply explore user demands and accurately forecast their development trends, this study proposes a technical framework that integrates a Kano model with an attention-enhanced BiGRU, based on UGC. The proposed method comprises two core stages: user demand analysis and demand trend forecasting. A Kano model is employed to identify and classify user demand features, while the forecasting stage utilizes a BiGRU model enhanced with an attention mechanism to enhance the model's ability to capture key local information within sequential data. In response to the limitations of the traditional Kano model in handling indifferent-type demands, a time-series of satisfaction levels for such demand types is constructed and analyzed using a Mann–Kendall non-parametric trend test to reveal their potential evolutionary direction. Based on the test results, indifferent-type demands can be further refined, enabling a deeper understanding of the dynamic evolution of user preferences. The detailed architecture of the proposed model is illustrated in Figure 1.
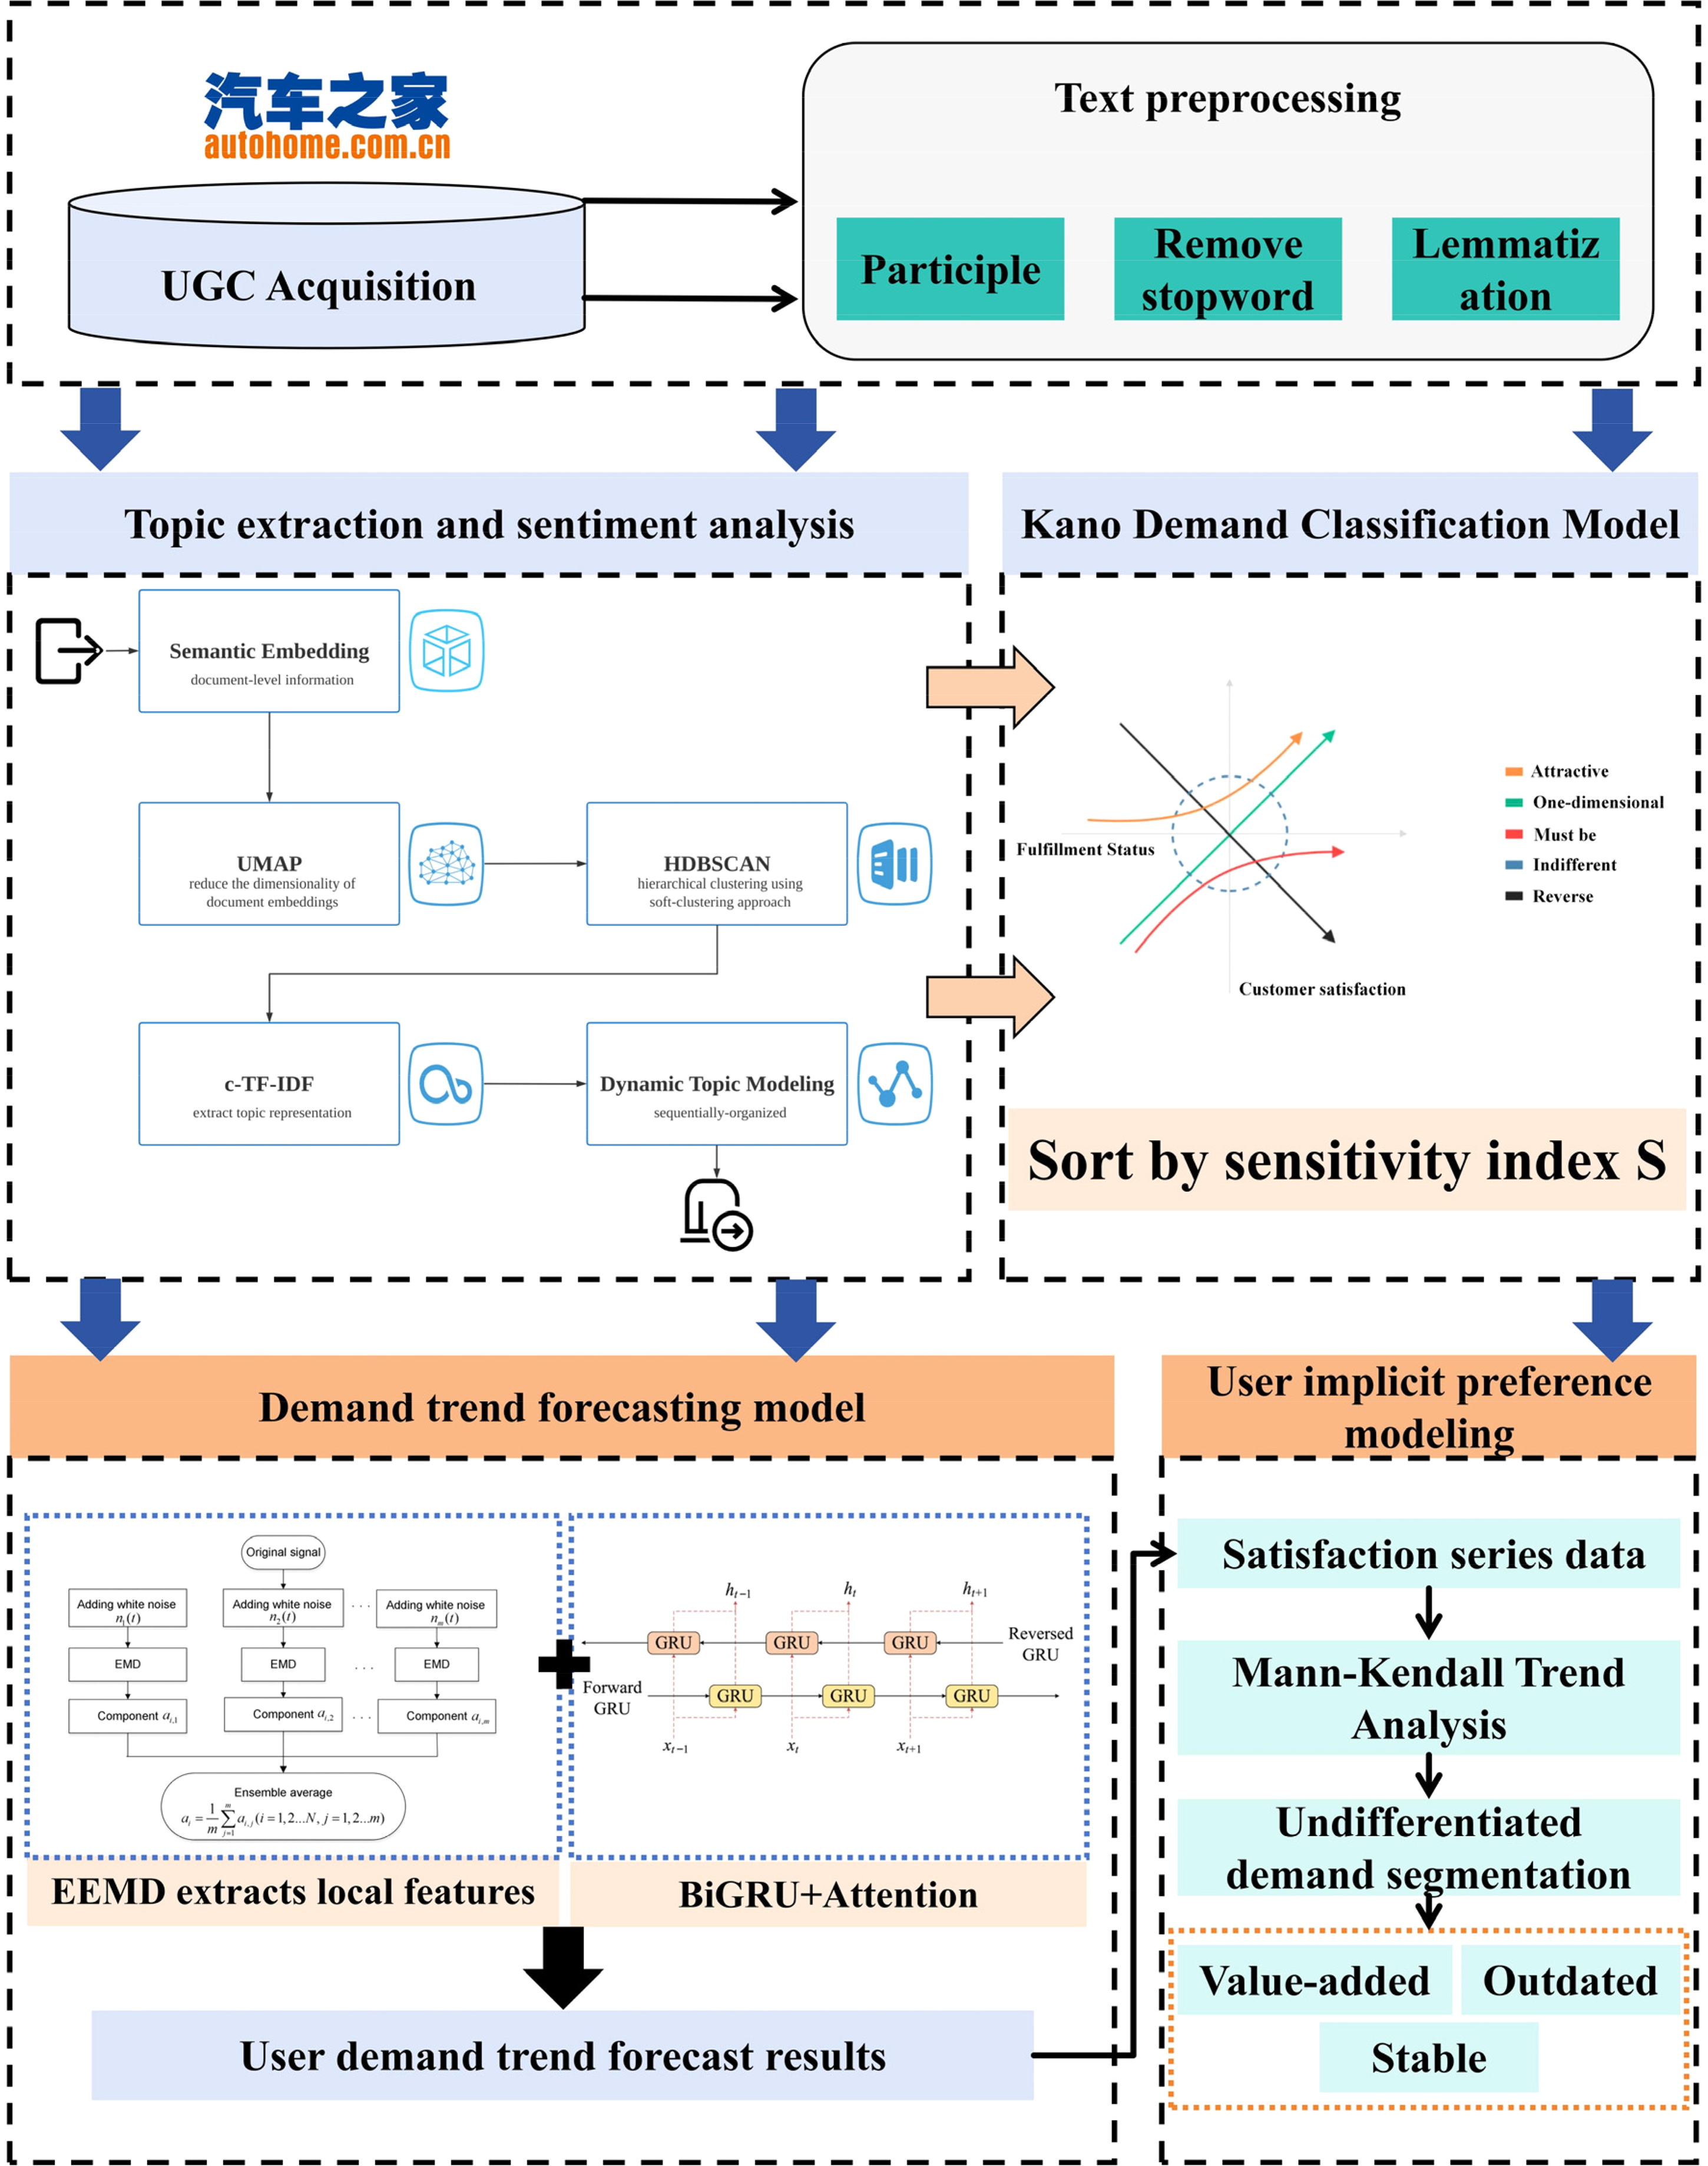
User-generated content-driven new energy vehicle demand evolution and trend forecasting method framework.
As illustrated in Figure 1, the proposed framework consists of three main components: user demand identification, demand classification, and trend forecasting. UGC texts are first collected from automobile forums and preprocessed, including tokenization, stop-word removal, and lemmatization. BERTopic is then used to extract topic keywords, while sentiment scores are calculated using the BERT model to identify user preferences. Next, a Kano model is employed to classify user demands, and a sensitivity metric (S) is introduced to prioritize demand attributes. Finally, local trend features extracted via EEMD are combined with other relevant input variables and fed into an attention-enhanced BiGRU model. This model adaptively captures key features, thereby effectively improving the forecasting performance of demand evolution paths.
Figure 1 presents the overall architecture of our integrated user demand mining and forecasting framework, which systematically combines topic extraction, sentiment analysis, demand classification, trend detection, and predictive modeling. The process begins with the collection of user review data from online platforms, which are then subjected to BERTopic modeling to identify major product attributes discussed by users. Each topic-aligned review segment is analyzed using fine-grained sentiment classification to assess users’ emotional responses toward specific attributes. Based on the distribution of positive, neutral, and negative sentiments, we apply the Kano model to categorize attributes into four perceptual types—attractive, must-be, one-dimensional, and indifferent—reflecting different impacts on user satisfaction. Special attention is given to indifferent attributes, for which we construct time-series satisfaction scores and use the Mann–Kendall non-parametric test to evaluate their evolutionary trends. These attributes are subsequently reclassified as value-added, obsolete, or stable, based on their trend trajectories. To forecast future changes in user preferences, we propose a hybrid model that integrates EEMD for denoising and extracting multi-scale temporal features, and an attention-enhanced BiGRU network to capture bidirectional dependencies and focus on salient time steps. This end-to-end framework enables the dynamic identification, evaluation, and prediction of user needs with improved interpretability and precision.
NEV user preference identification based on BERTopic
To accurately identify the preferences and attention topics expressed by NEV users in online reviews, this study adopts the BERTopic model to construct a user semantic feature recognition module, overcoming the limitations of traditional bag-of-words and shallow semantic models (e.g. LDA) in handling short texts, high technical term density, and semantic diversity (Guo et al., 2022). BERTopic is a topic modeling approach that integrates pretrained language models with density-based clustering, offering strong semantic representation capabilities and adaptability to diverse topic structures (Grootendorst, 2022). As shown in Figure 2, the preprocessed NEV review corpus is first encoded using a Sentence-BERT model optimized for Chinese applications, converting each review into a dense semantic vector representation to capture contextual semantic associations and synonymous expressions. Next, the uniform manifold approximation and projection (UMAP) algorithm is applied to perform non-linear dimensionality reduction on the high-dimensional embedding space, preserving local structure while maintaining global topology, thus providing a stable vector basis for subsequent clustering. Subsequently, the hierarchical density-based spatial clustering of applications with noise (HDBSCAN) algorithm is used to perform density-based clustering on the reduced embeddings, automatically identifying topic clusters in an unsupervised manner. Without requiring a predefined number of clusters, HDBSCAN effectively handles irregular cluster shapes and detects semantic outliers, thereby enhancing topic purity and robustness. Each resulting cluster is treated as a potential user attention topic, and high-distinctiveness keywords within each cluster are calculated using a class-based TF-IDF (c-TF-IDF) method, thereby improving the compactness and interpretability of topic descriptions.
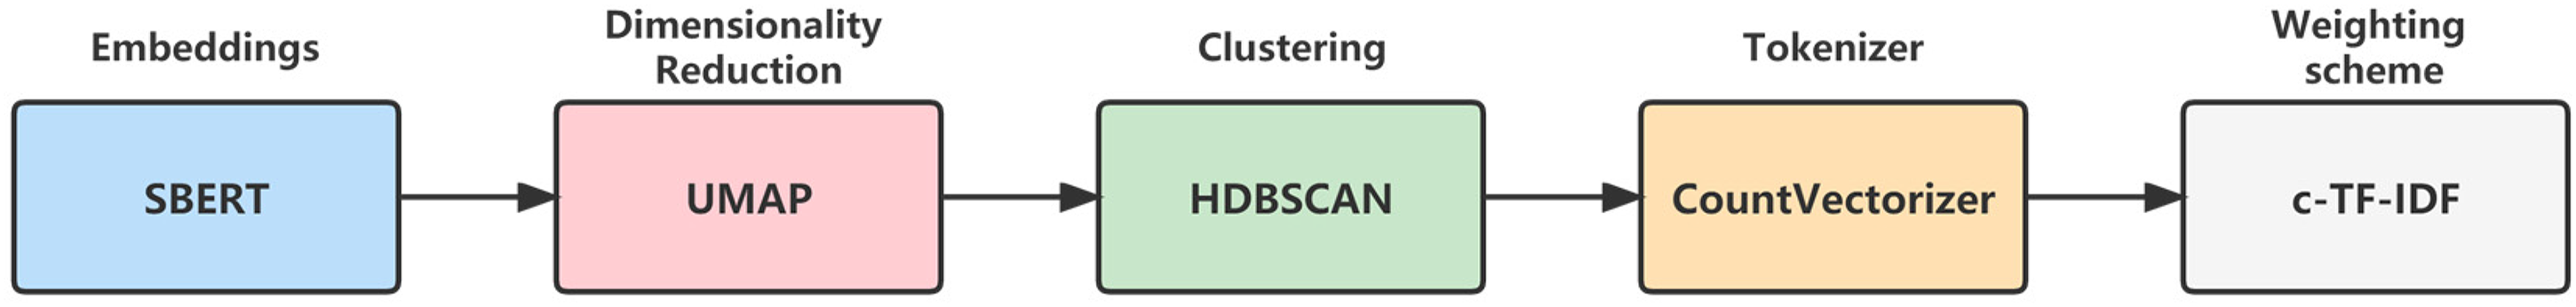
BERTopic model framework.
To further capture user attitudes toward different demand topics and enhance the precision of preference profiling, a BERT-based sentiment analysis module is incorporated following semantic topic recognition. BERT is a bidirectional pretrained language model based on the transformer architecture. It offers powerful contextual modeling capabilities and is particularly well-suited for UGC contexts where emotional expressions are implicit or mixed, and semantic dependencies are strong (Koroteev, 2021). Sentiment classification is formulated as a three-class problem (positive, neutral, negative). The pretrained BERT model is fine-tuned on sentiment-labeled datasets in a Chinese context, and its performance is cross-validated to ensure generalization and discriminative accuracy on NEV review corpora. After training, the model outputs a probability distribution across the three sentiment classes for any given input, thereby quantifying both polarity and intensity. The sentiment analysis results are then integrated with the semantic topics identified by BERTopic to achieve a dual-layer-coupled modeling of user concerns and emotional attitudes.
User needs classification based on sensitivity index–Kano model
To characterize the satisfaction structure of NEV users with respect to different product elements and infer their hierarchical preferences for functional and service-related features, the classic Kano model is introduced and adapted (as illustrated in Figure 3) to suit large-scale online review data. Given that traditional Kano classification relies on structured questionnaires, while UGC is unstructured, highly heterogeneous, and often contains implicit emotional expression, this study draws on existing research that combines sentiment orientation and attention scores (ASs) to infer Kano attribute categories from UGC (Zhao et al., 2025).
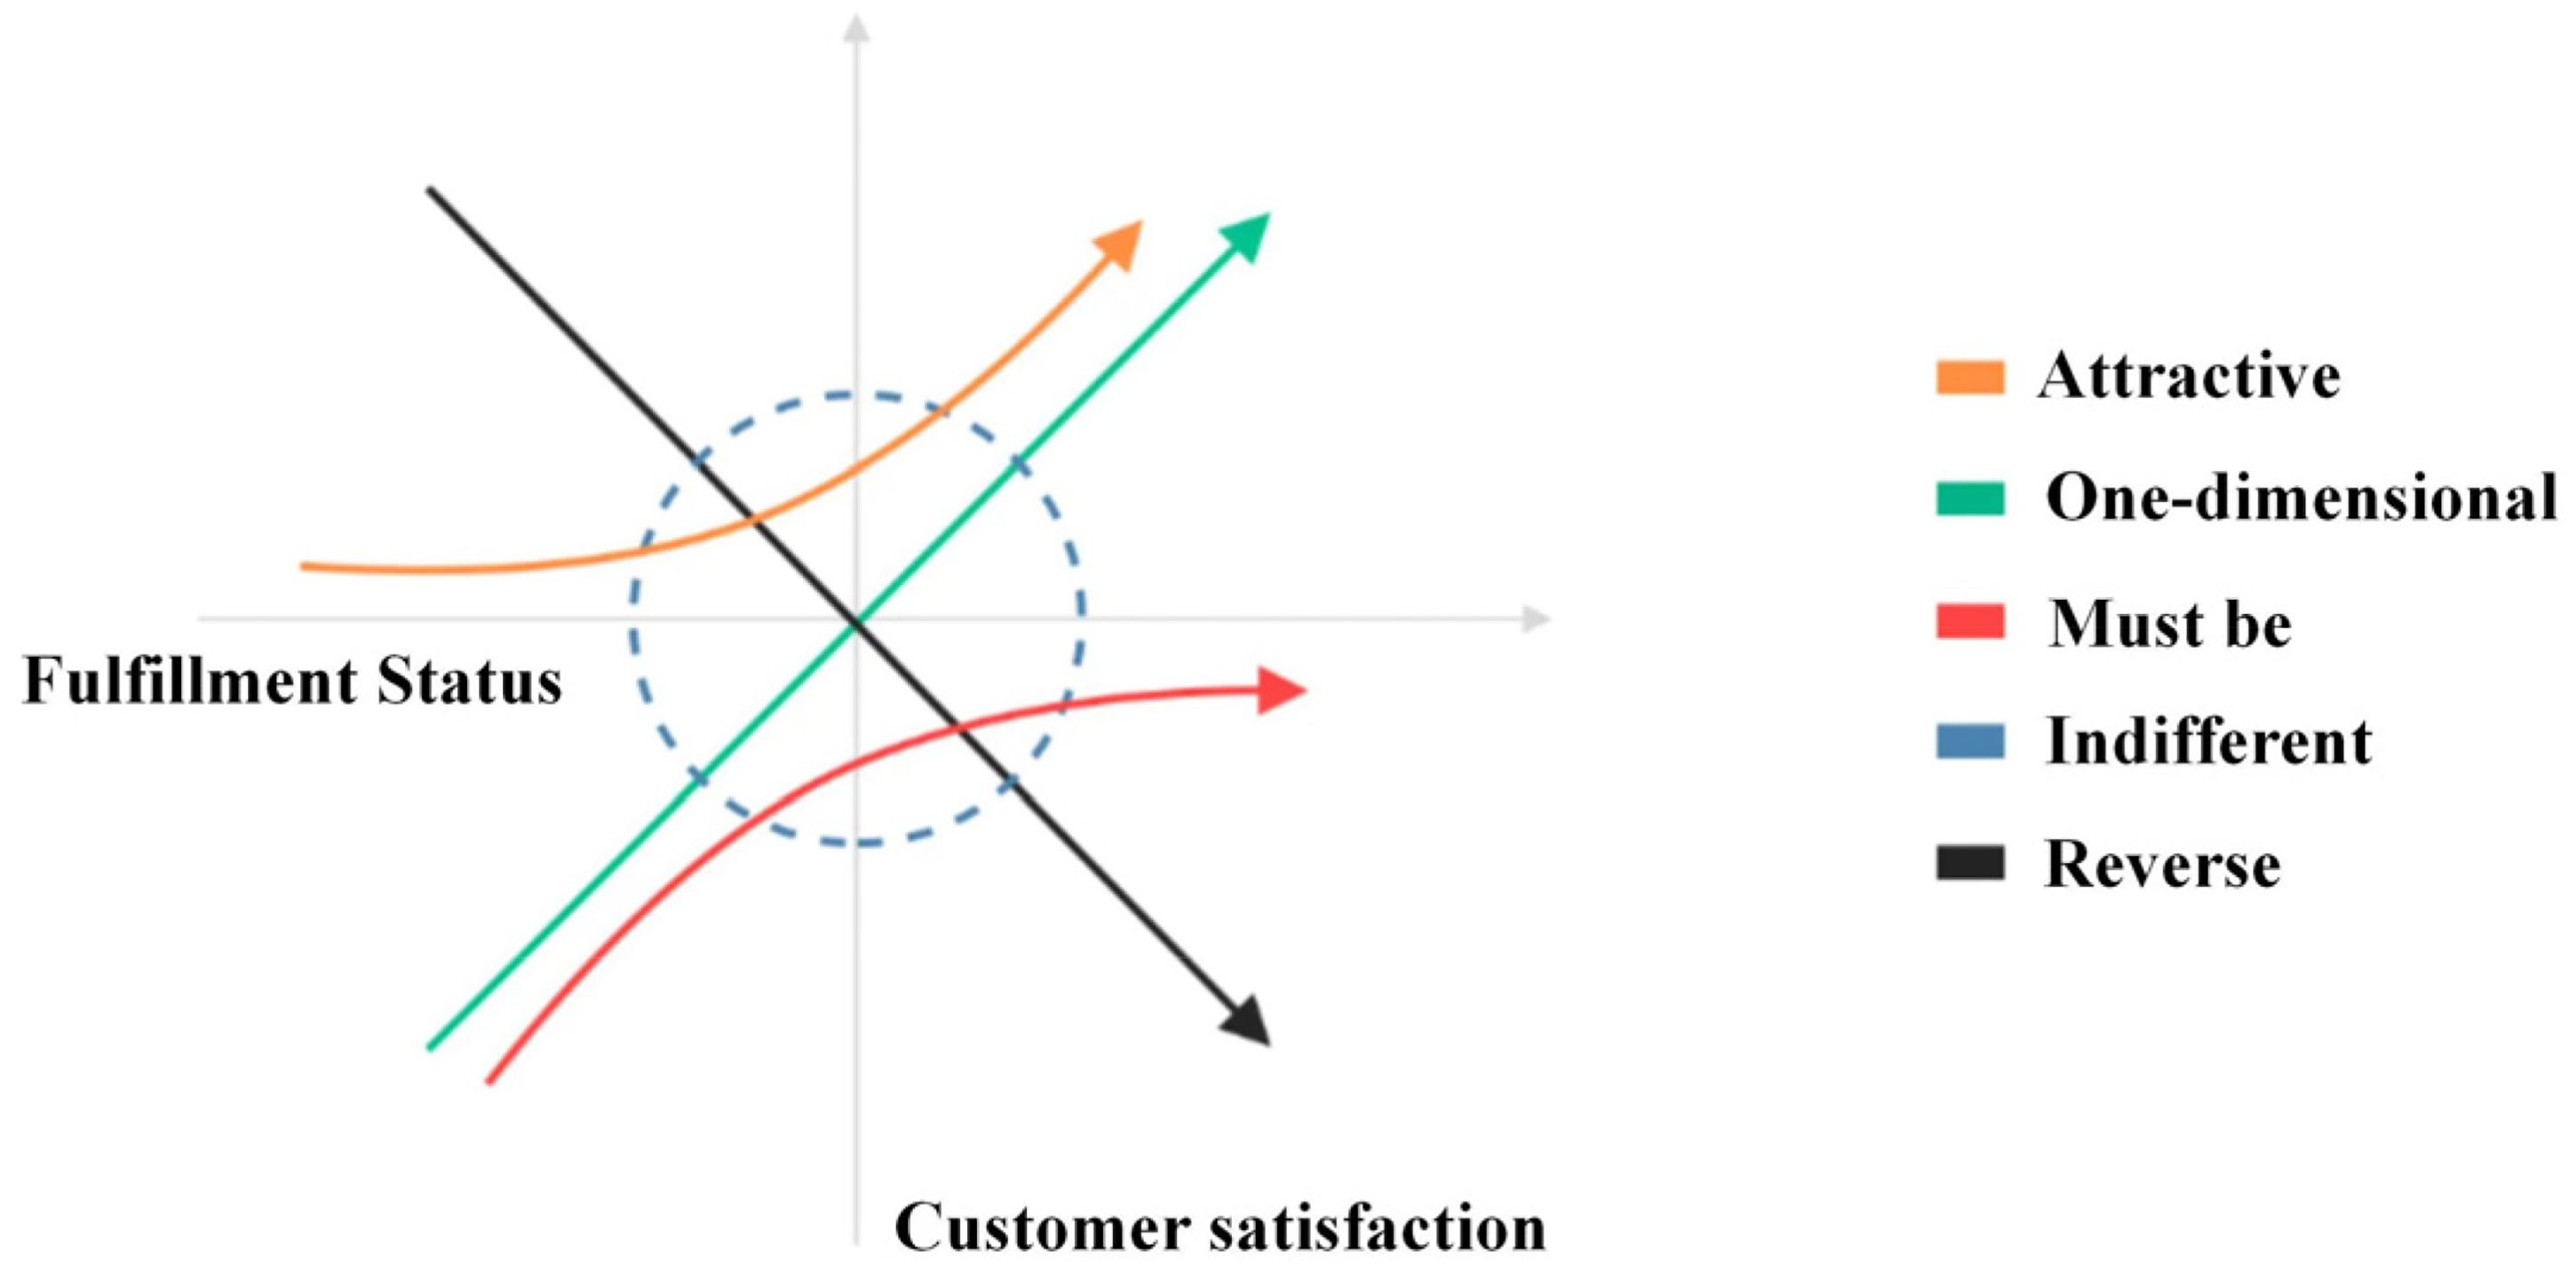
Kano model architecture diagram.
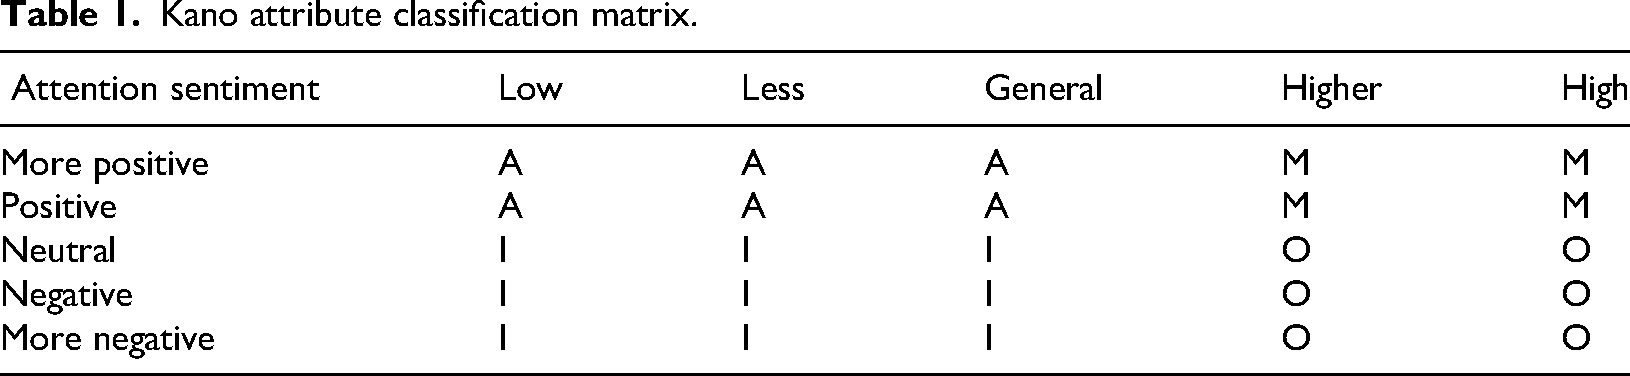
As shown in Table 1, the Kano attribute categories are inferred based on a set of rules constructed from the two-dimensional combination of sentiment polarity and AS. When an element exhibits a predominantly positive sentiment but a low AS, it is classified as an “attractive” attribute (A). If the sentiment is not clearly positive but the AS is high, the element is considered an “one-dimensional” attribute (O), indicating clear user expectations and emotional reactions. If both sentiment polarity and AS are high, the element is identified as a “must-be” attribute (M). Elements with non-positive sentiment and low AS are categorized as “indifferent” attributes (I). The AS is constructed by computing the normalized frequency of mentions across user reviews, reflecting the salience and relative weight of each element in user discussions.
Kano attribute classification matrix.
Based on the above attribute analysis results, the satisfaction index (SIj) and dissatisfaction index (DSIj) are calculated for each product element j. The corresponding formulas are presented below (Andreasen, 1977):

To further refine the importance ranking of individual product elements, a sensitivity index Sj is introduced after the Kano classification process (as defined in equation (3)) to quantify the influence of each element on overall user satisfaction. This index serves as a supplementary criterion for prioritization within each Kano category and facilitates the identification of key functional and service modules that should be addressed with higher priority in actual product design and optimization:
User preference prediction model combining EEMD and Attention-BiGRU
To accurately predict the future trends of NEV user preference indicators (i.e. SI and AS), a hybrid time-series prediction model integrating EEMD and Attention-BiGRU is proposed. To address the non-linear and non-stationary characteristics of NEV user preference sequences, signal preprocessing of the original time series was first performed using EEMD. EEMD mitigates the mode mixing problem inherent in traditional empirical mode decomposition (EMD) by repeatedly adding different white noise and performing ensemble averaging, thereby adaptively decomposing the original sequence into a set of intrinsic mode functions (IMFs) with different frequency characteristics and a residual component representing the trend. These IMFs and residual components capture local fluctuations and long-term trends of the original data across different time scales, and can therefore be individually used as input features for subsequent prediction models. The decomposition steps are as follows:
Step 1: Based on the original environmental feature sequence, Gaussian white noise following a normal distribution is introduced to construct a new feature signal sequence. Equation (4) reflects the key principle of EEMD, which mitigates mode mixing by introducing Gaussian white noise into the original signal. Specifically, for each iteration iii, a new signal 
Step 2: After superimposing Gaussian white noise onto the original environmental feature sequence, a multi-level EMD method is applied to decompose the signal and extract different levels of modal components along with the corresponding residual signals. Equation (5) presents the final averaged IMF obtained across M independent EEMD iterations. For each component j, the ensemble mean is computed as: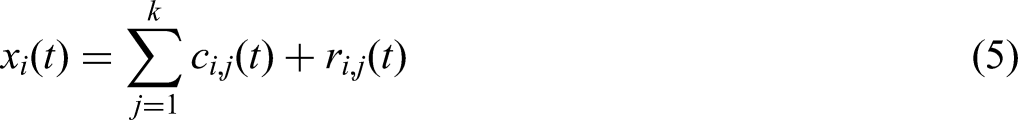
where
Step 3: Steps 1 and 2 are repeated M times, and the modal components obtained from each decomposition are averaged numerically to derive the final mean decomposition results for each modal layer: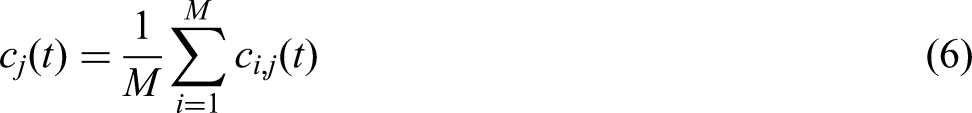
Based on the feature decomposition, the Attention-BiGRU model performs independent predictions on each component sequence output by EEMD. As illustrated in Figure 4, BiGRU consists of a forward GRU and a backward GRU. The forward GRU captures sequence features from past to future, while the backward GRU captures features in reverse order (Lin et al., 2020). The BiGRU model combines the lightweight and efficient sequence feature extraction capability of GRU with the contextual learning advantages of a bidirectional structure, enabling effective handling of bidirectional dependencies in time-series data. BiGRU encodes time series using a BiGRU architecture, where the hidden state is represented as the concatenation of the forward and backward state vectors:
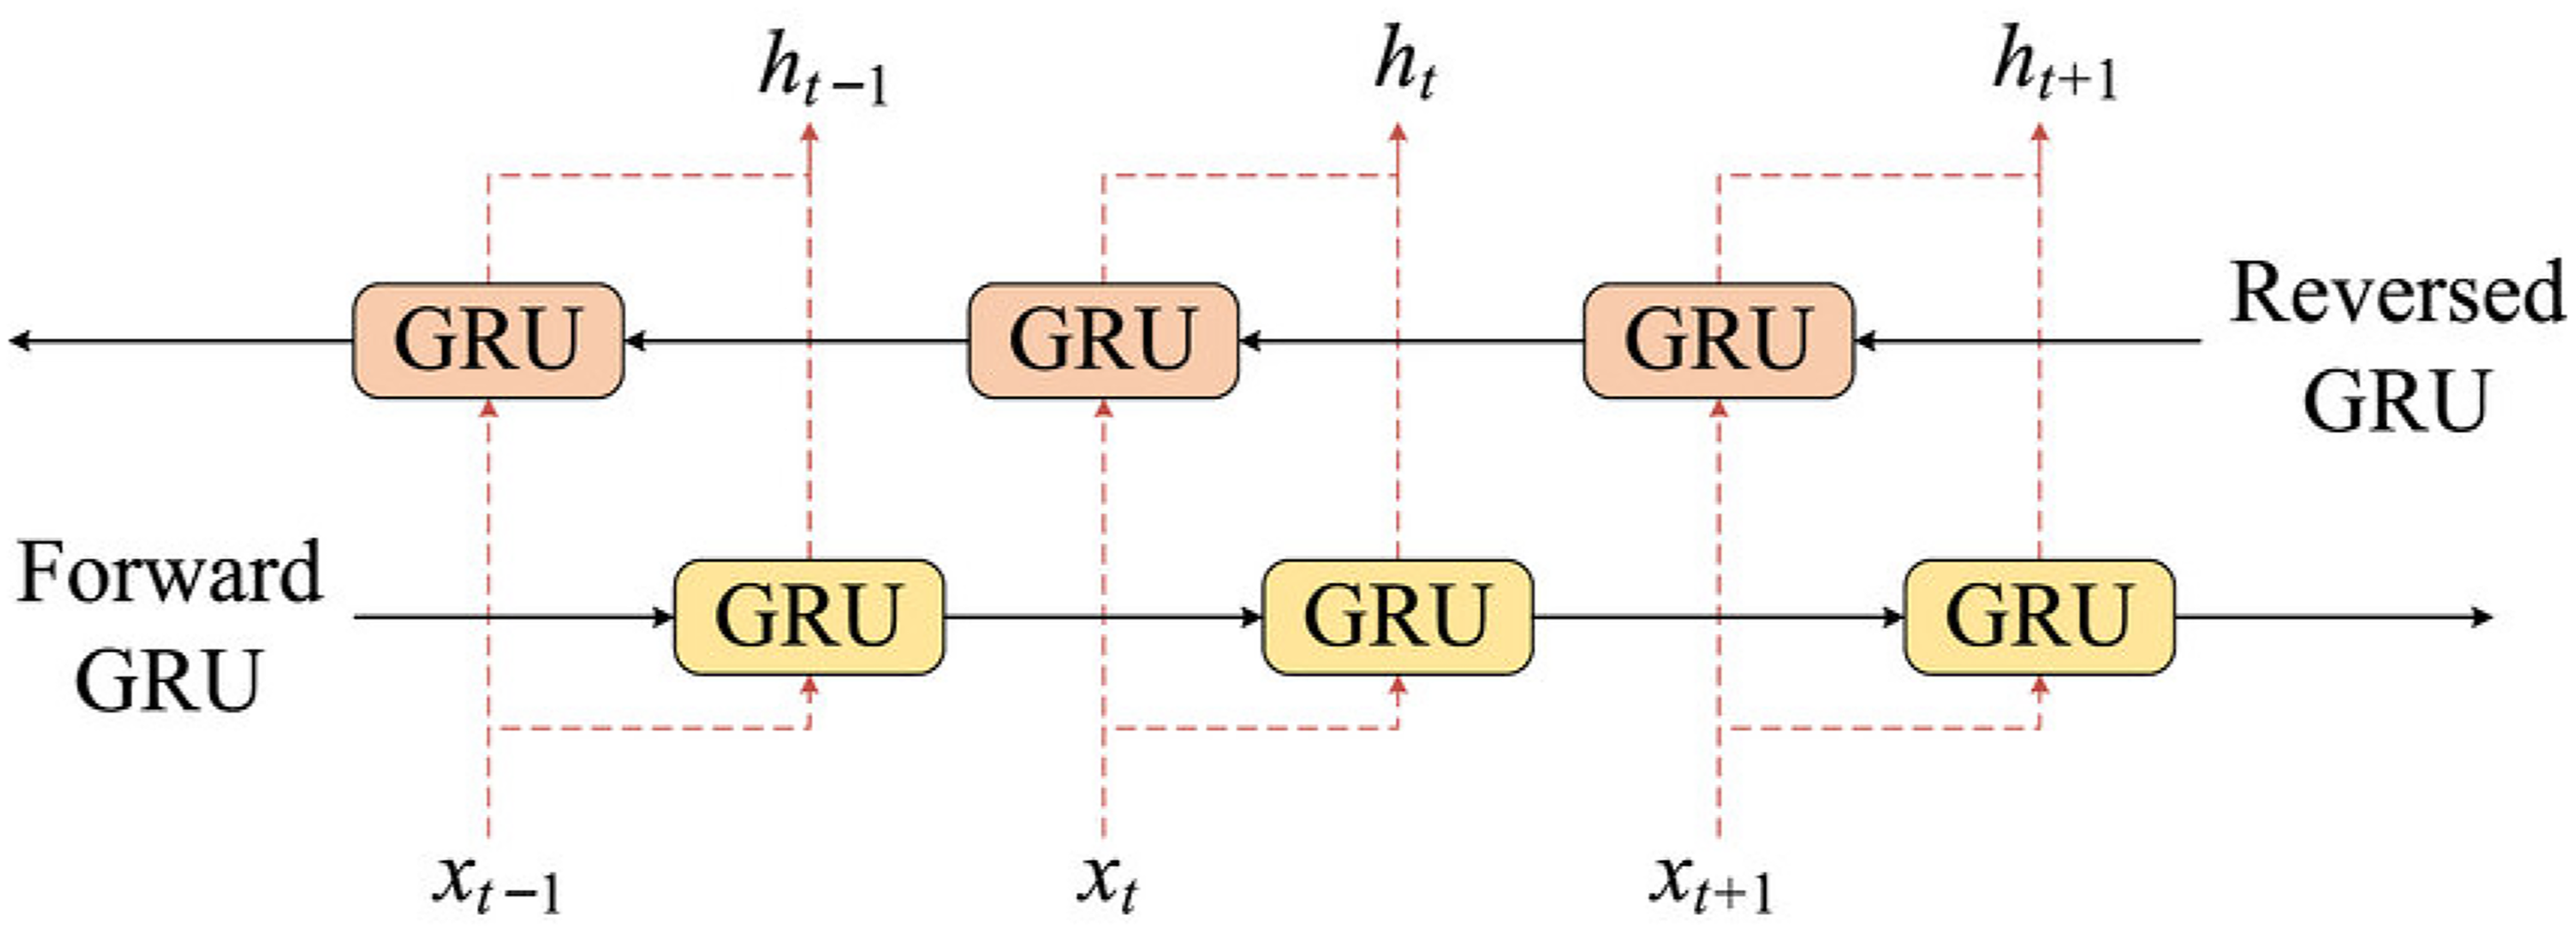
BiGRU model architecture. BiGRU: bidirectional gated recurrent unit.
Re-mining indifferent demands based on Mann–Kendall test
In the traditional Kano model, indifferent attributes (I) are regarded as non-critical factors that exert minimal influence on user satisfaction and are typically assigned a lower priority during requirement analysis. However, with the dynamic evolution of user demand structures, some product elements initially categorized as indifferent attributes may gradually exhibit enhanced perceived value due to technological advancements, shifts in user cognition, or market education, eventually transforming into expected or even attractive attributes. Therefore, identifying such “potential value-added indifferent demands” is of great significance for iterative product design and refined management.
To this end, this study introduces a non-parametric trend analysis method—the Mann–Kendall test—to detect potential trends in the temporal evolution of satisfaction indices associated with indifferent attributes, thereby identifying target attributes with potential for transformation. The core advantage of the Mann–Kendall test lies in its distribution-free nature, enabling robust trend analysis of time-series data without requiring normality or linearity assumptions. It is particularly well-suited for handling the discrete and non-linear characteristics commonly found in social behavior and user feedback data (Hamed and Rao, 1998). The test statistic of S of the Mann–Kendall test is defined as follows: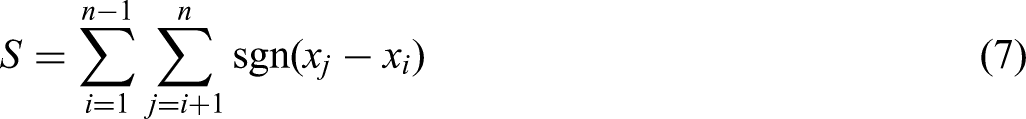

Equation (9) presents the standardized Z-value for the Mann–Kendall trend test, a non-parametric method commonly used to detect monotonic trends in time-series data without assuming any particular distribution. The test statistic SSS is computed based on the rank differences between all pairs in the time series, and its variance 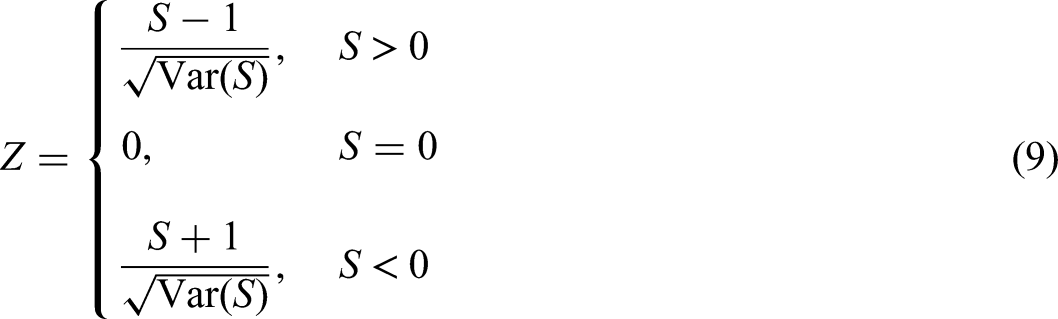
The statistic Z (see Appendix) follows a standard normal distribution. If the p-value (see Appendix) is less than the significance level (α = 0.05) a significant trend is indicated. If Z is negative, the attribute is classified as a value-added attribute, indicating potential to evolve into a “performance” or “attractive” attribute. It is therefore recommended that enterprises prioritize such attributes and allocate optimization resources accordingly. If Z is positive, the attribute is considered outdated, suggesting it may have been gradually marginalized due to factors such as experience fatigue or diminished user value perception. It is advised that such attributes receive less attention. If the p-value exceeds the significance level, the attribute is regarded as stable, indicating that it remained consistent throughout the study period and that the current design level is appropriate.
Experiments and results
Data collection and preprocessing
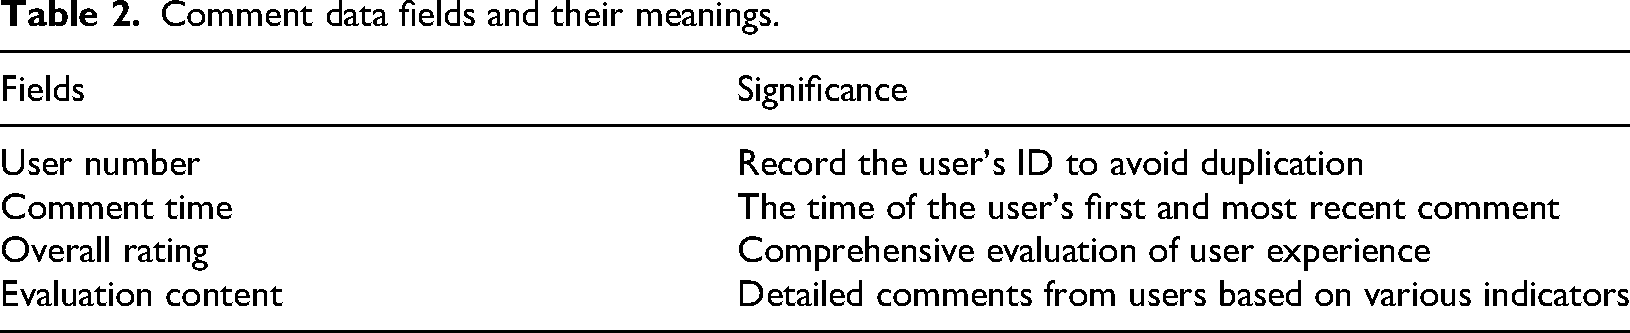
This study focuses on user evaluations of Chinese NEVs collected from the “AutoHome” review forum. User comments posted between May 2021 and April 2025 were collected using the Octoparse web scraping tool. A total of 47,724 single-paragraph reviews were obtained from 9735 users, covering multiple aspects such as exterior design, interior style, cabin space, feature configuration, and power performance. The content includes both positive and negative feedback, along with users’ stated reasons for their evaluations. The dataset includes user IDs, timestamps of comments, and corresponding overall ratings. Details and definitions of the data fields are provided in Table 2.
Comment data fields and their meanings.
Product attribute theme extraction and analysis
To systematically uncover the core design and service aspects that users emphasize in online reviews of NEVs, and to analyze their sentiment orientations in depth, this study integrates BERTopic for topic modeling and BERT-based aspect-level sentiment analysis. The raw review texts were first preprocessed through standard cleaning procedures, including the removal of punctuation, numbers, special characters, and high-frequency stop words specific to the NEV domain, to reduce semantic noise and enhance overall text quality. Next, the pretrained Sentence-BERT model was used to transform the cleaned reviews into deep semantic embedding vectors, which were then reduced in dimensionality using the UMAP algorithm to preserve semantic structure. The dimensionally reduced embeddings were clustered using the HDBSCAN algorithm, with the minimum cluster size set to 10 to ensure that each topic contained a sufficient number of documents and maintained semantic consistency. On this basis, the c-TF-IDF algorithm was applied to extract high-weight keywords from each cluster, thus identifying fine-grained user concerns such as “battery and range,” “interior design,” and “cabin space.”
To enhance semantic interpretability and systematically organize the extracted topics (as shown in Figure 5), this study consolidated semantically or functionally similar topics into eight core categories of NEV attributes. These categories include appearance, interior, space, configuration, powertrain, handling, energy consumption, and comfort. As illustrated in the topic visualization (Figure 6), the BERTopic clusters exhibit well-separated inter-topic boundaries and highly cohesive intra-topic structures within the semantic space. This demonstrates strong topic discriminability and model robustness.
User topic extraction based on BERTopic model.
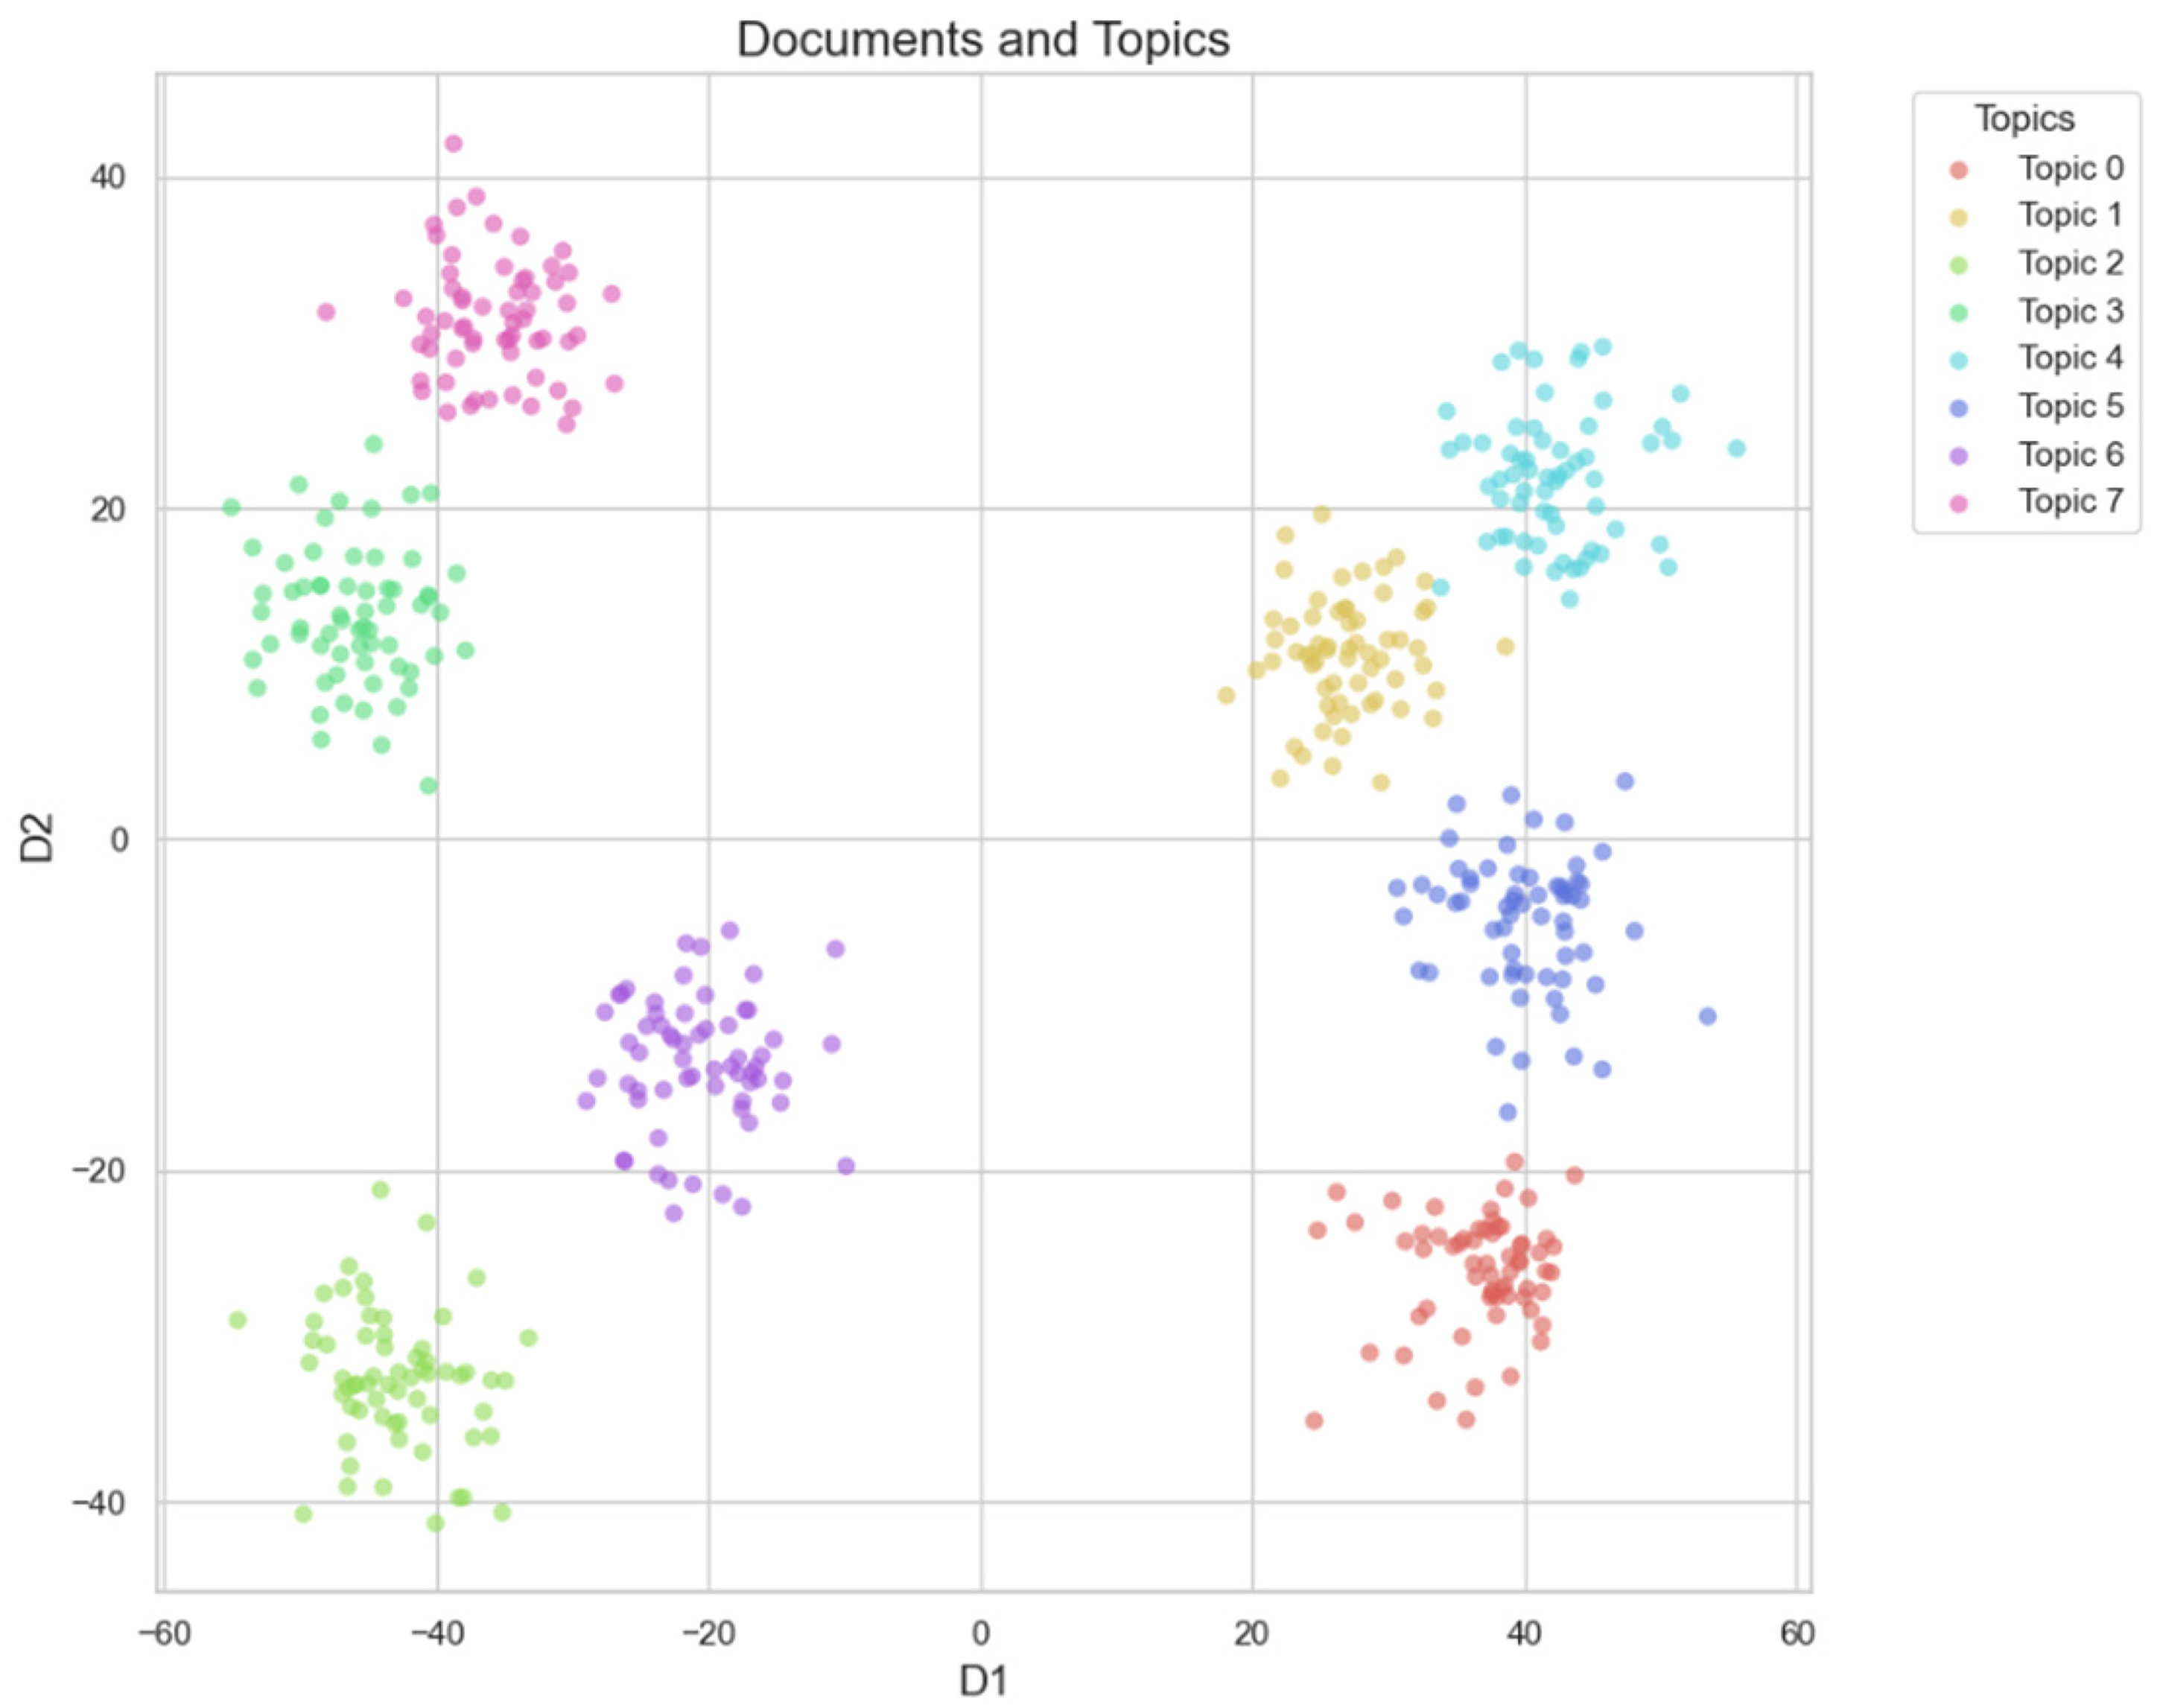
Document topic clustering diagram.
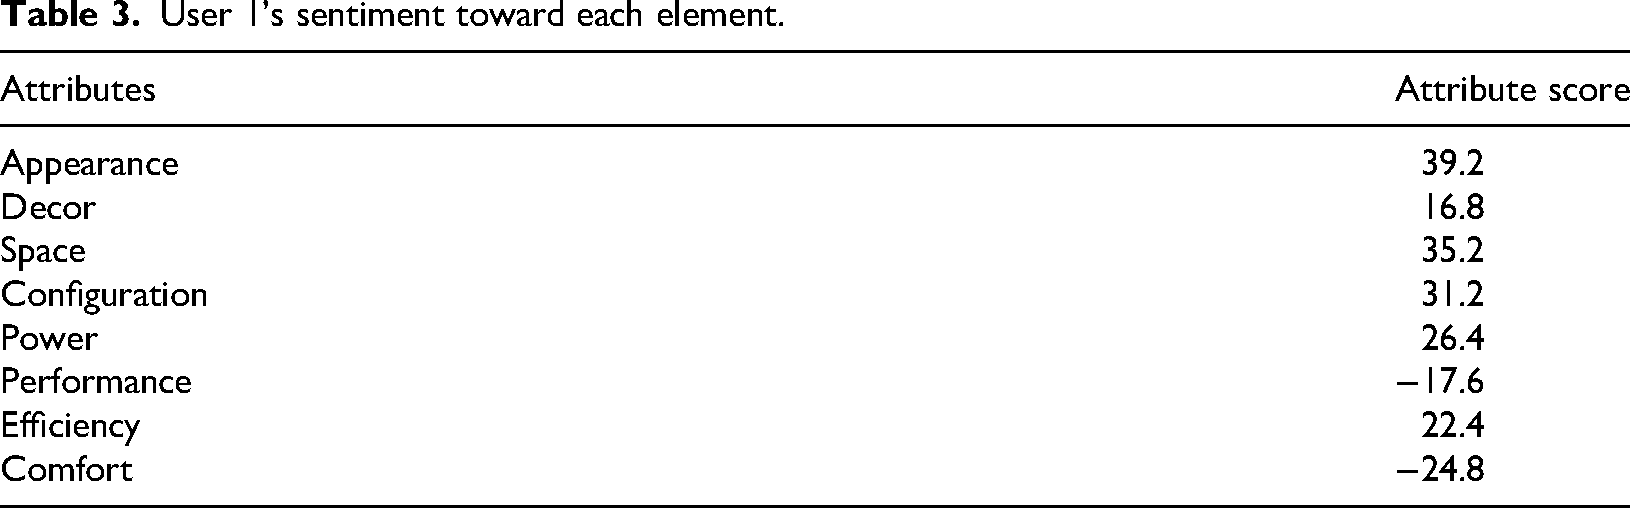
Building on the identified topics, this study further analyzes user sentiment toward each core attribute by applying a BERT-based sentiment lexicon to classify and score the emotional polarity of each core dimension mentioned in the comments. Taking user 1 as an example, the analysis results are presented in Table 3. User 1 exhibits stronger negative emotions toward aspects such as handling and comfort, while demonstrating more positive sentiment toward interactive-related attributes like appearance, space, and powertrain.
User 1's sentiment toward each element.
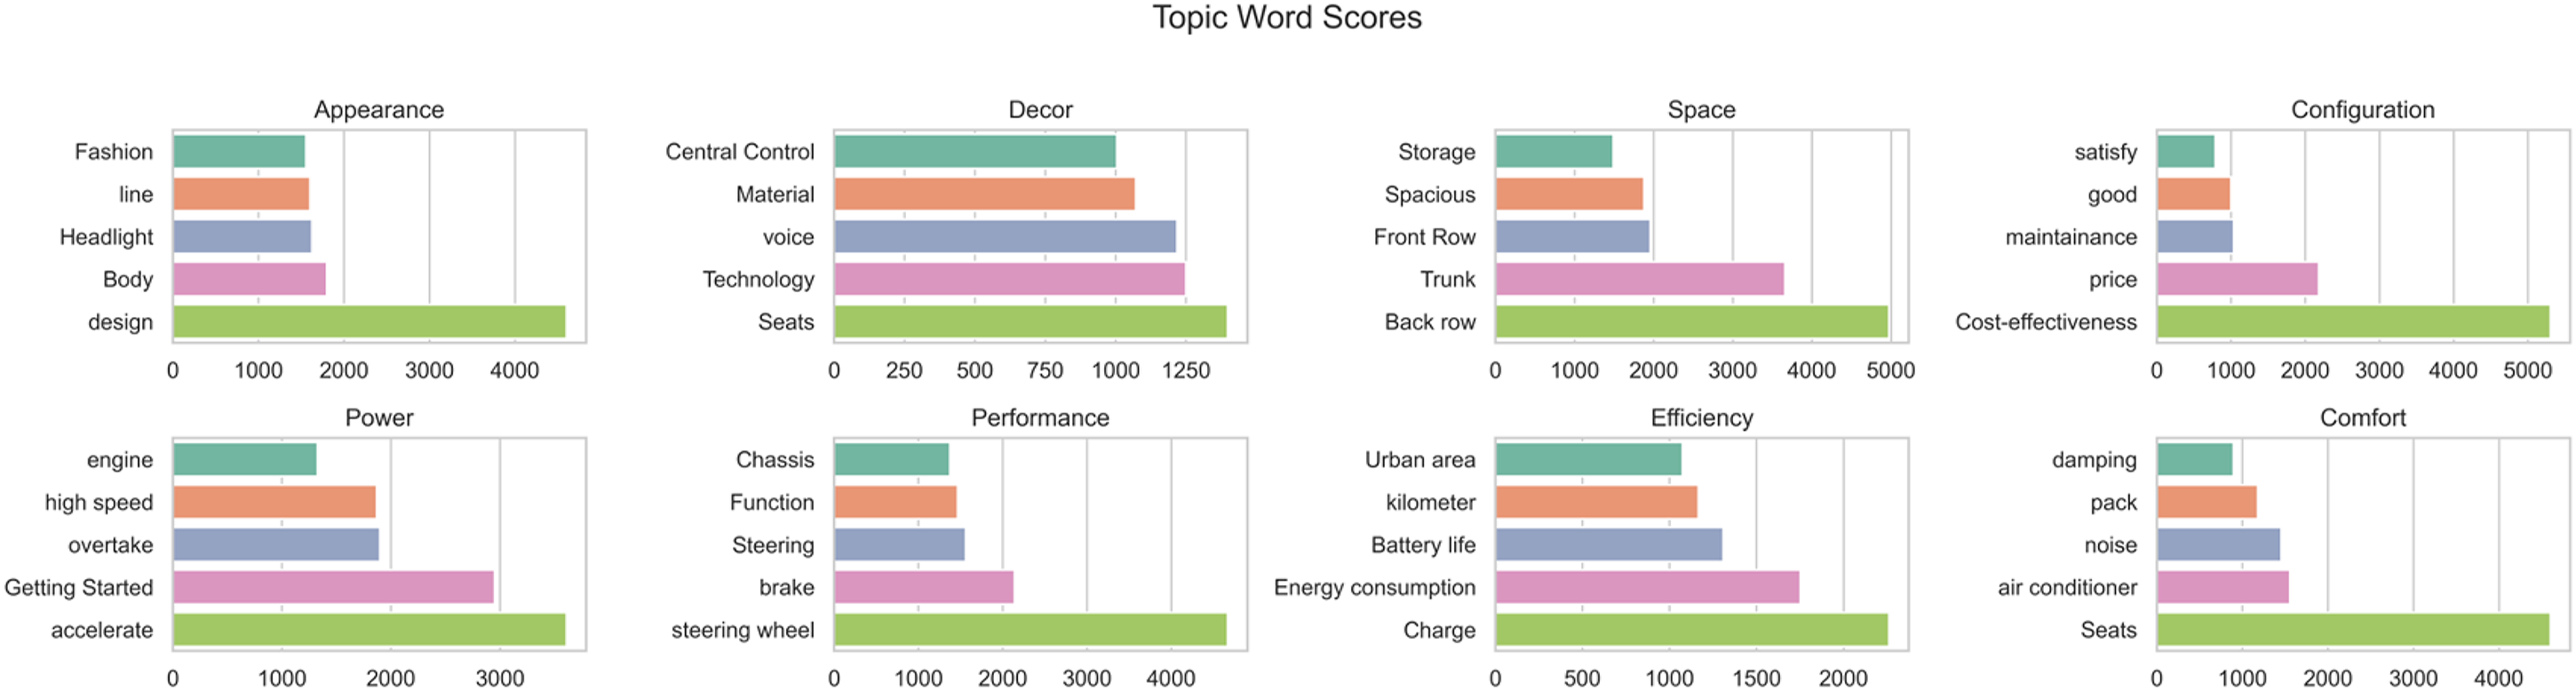
Based on the previously established emotion–attention analysis framework, this study quantitatively calculates the satisfaction index (SI, see Appendix) and dissatisfaction index (DSI, see Appendix) for representative keywords within each topic extracted by the BERTopic model. The proportion of positive and negative sentiments is comprehensively considered to reflect users’ subjective attitudes toward specific product attributes. Subsequently, by examining the relative relationship between SI and DSI values in conjunction with the AS of each topic, the Kano model was employed to categorize product requirements into attractive, one-dimensional, must-be, or indifferent attributes. Furthermore, to assess the potential impact of different attribute types on user satisfaction, all demand-related keywords were prioritized based on the sensitivity factor (S, see Appendix). This metric comprehensively accounts for the intensity of influence that positive and negative emotional drivers exert on user attitudes; higher values indicate stronger user reactions to the corresponding element. Figure 7 illustrates the Kano attribute categories and corresponding priority rankings of the top 16 representative topic keywords extracted by BERTopic. These results help uncover users’ true preferences and their relative importance across multiple dimensions such as functionality, performance, and service, thereby providing data-driven insights and theoretical support for future product iterations and strategic planning.
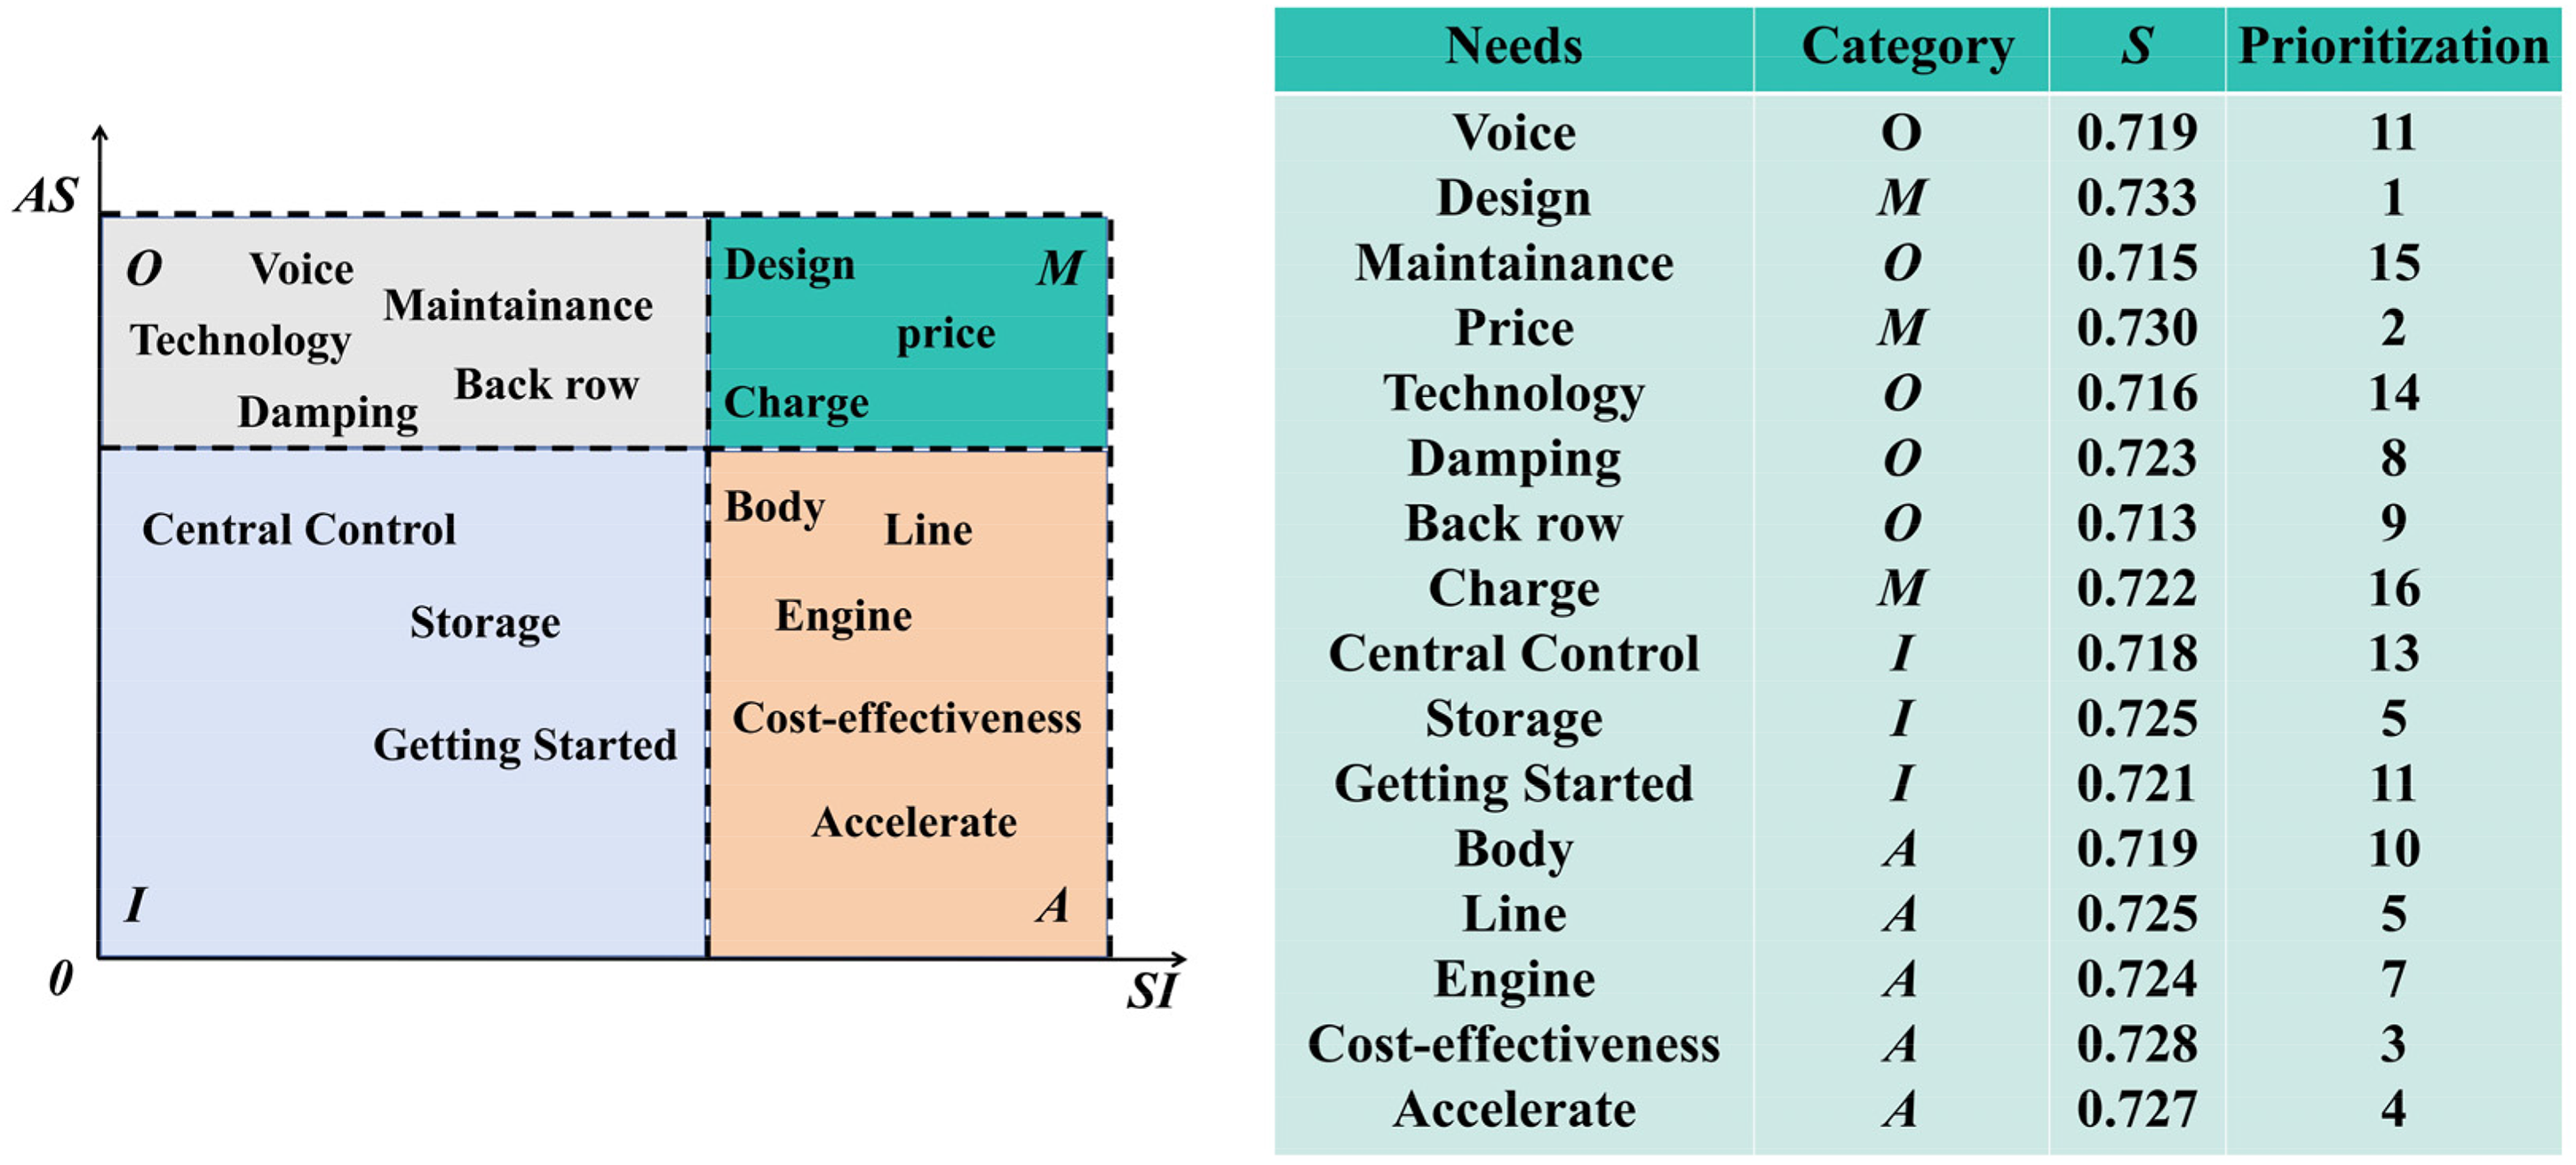
Kano attributes and ranking of topic keywords.
As shown in Figure 7, keywords such as “Design,” “Price,” and “Charge” exhibit high levels of positive sentiment and widespread user attention, aligning with the criteria for must-be attributes (M), whose absence would significantly reduce user satisfaction and which are therefore considered essential components in product design. In contrast, keywords such as “Body,” “Engine,” “Line,” and “Cost-effectiveness” demonstrate high satisfaction levels yet moderate ASs, indicating characteristics of attractive attributes (A), which are not explicitly expected by users but can greatly enhance satisfaction when performed well. These attributes often represent points of differentiation and are key to enhancing perceived product value. Keywords such as “Voice,” “Technology,” and “Maintenance” show negative sentiment feedback alongside high ASs, indicating that users have clear functional expectations toward these features. These are classified as one-dimensional attributes (O), where satisfaction is positively correlated with performance. Additionally, keywords such as “Central Control,” “Storage,” and “Getting Started” are categorized as indifferent attributes (I) due to their low satisfaction and ASs, suggesting limited impact on user satisfaction at this stage. However, potential future evolution should be monitored in accordance with shifting user preferences.
Regarding priority rankings, “Design” (S = 0.733), “Price” (S = 0.730), and “Cost-effectiveness” (S = 0.728) rank the highest, reflecting strong user sensitivity and attention toward aesthetics, affordability, and performance–value ratio. Some indifferent attributes, such as “Storage” (S = 0.725) and “Getting Started” (S = 0.721), also elicited notable emotional responses, indicating a potential transition toward one-dimensional attributes. Overall, the Kano attribute distribution and sensitivity-based priority rankings reveal the preference structure of NEV users across dimensions such as functionality, performance, and user experience, offering a quantitative basis and theoretical guidance for requirement prioritization, design resource allocation, and user-centered innovation.
Decomposition and prediction of user product attribute preference trends
Based on the identification of key user concerns and Kano attribute classification, further modeling and forecasting of the temporal trends of the SI and AS were conducted for selected high-sensitivity attributes. This aimed to gain a deeper understanding of their evolutionary characteristics and support the development of forward-looking product optimization strategies. Considering the non-linear and non-stationary nature of user preference data, the EEMD method was applied to decompose the satisfaction time series and extract local fluctuation patterns across multiple temporal scales. Taking the “Design” attribute under the “Appearance” category as an example, it was classified as a must-be (M) attribute in the Kano model and ranked highest in sensitivity, indicating exceptionally strong emotional responses from users. Therefore, an in-depth analysis of its satisfaction trend over time is warranted. As shown in Figure 8, the SI time series of the “Design” attribute was decomposed using EEMD, yielding 10 IMFs, each capturing distinct fluctuation characteristics at various frequency levels. The decomposition results reveal that the emotional response series for “Design” exhibits a multi-layered and highly complex dynamic structure that cannot be accurately modeled using a single-scale approach. This suggests that user perception is simultaneously influenced by short-term marketing efforts, mid-term product upgrades, and long-term brand impressions.
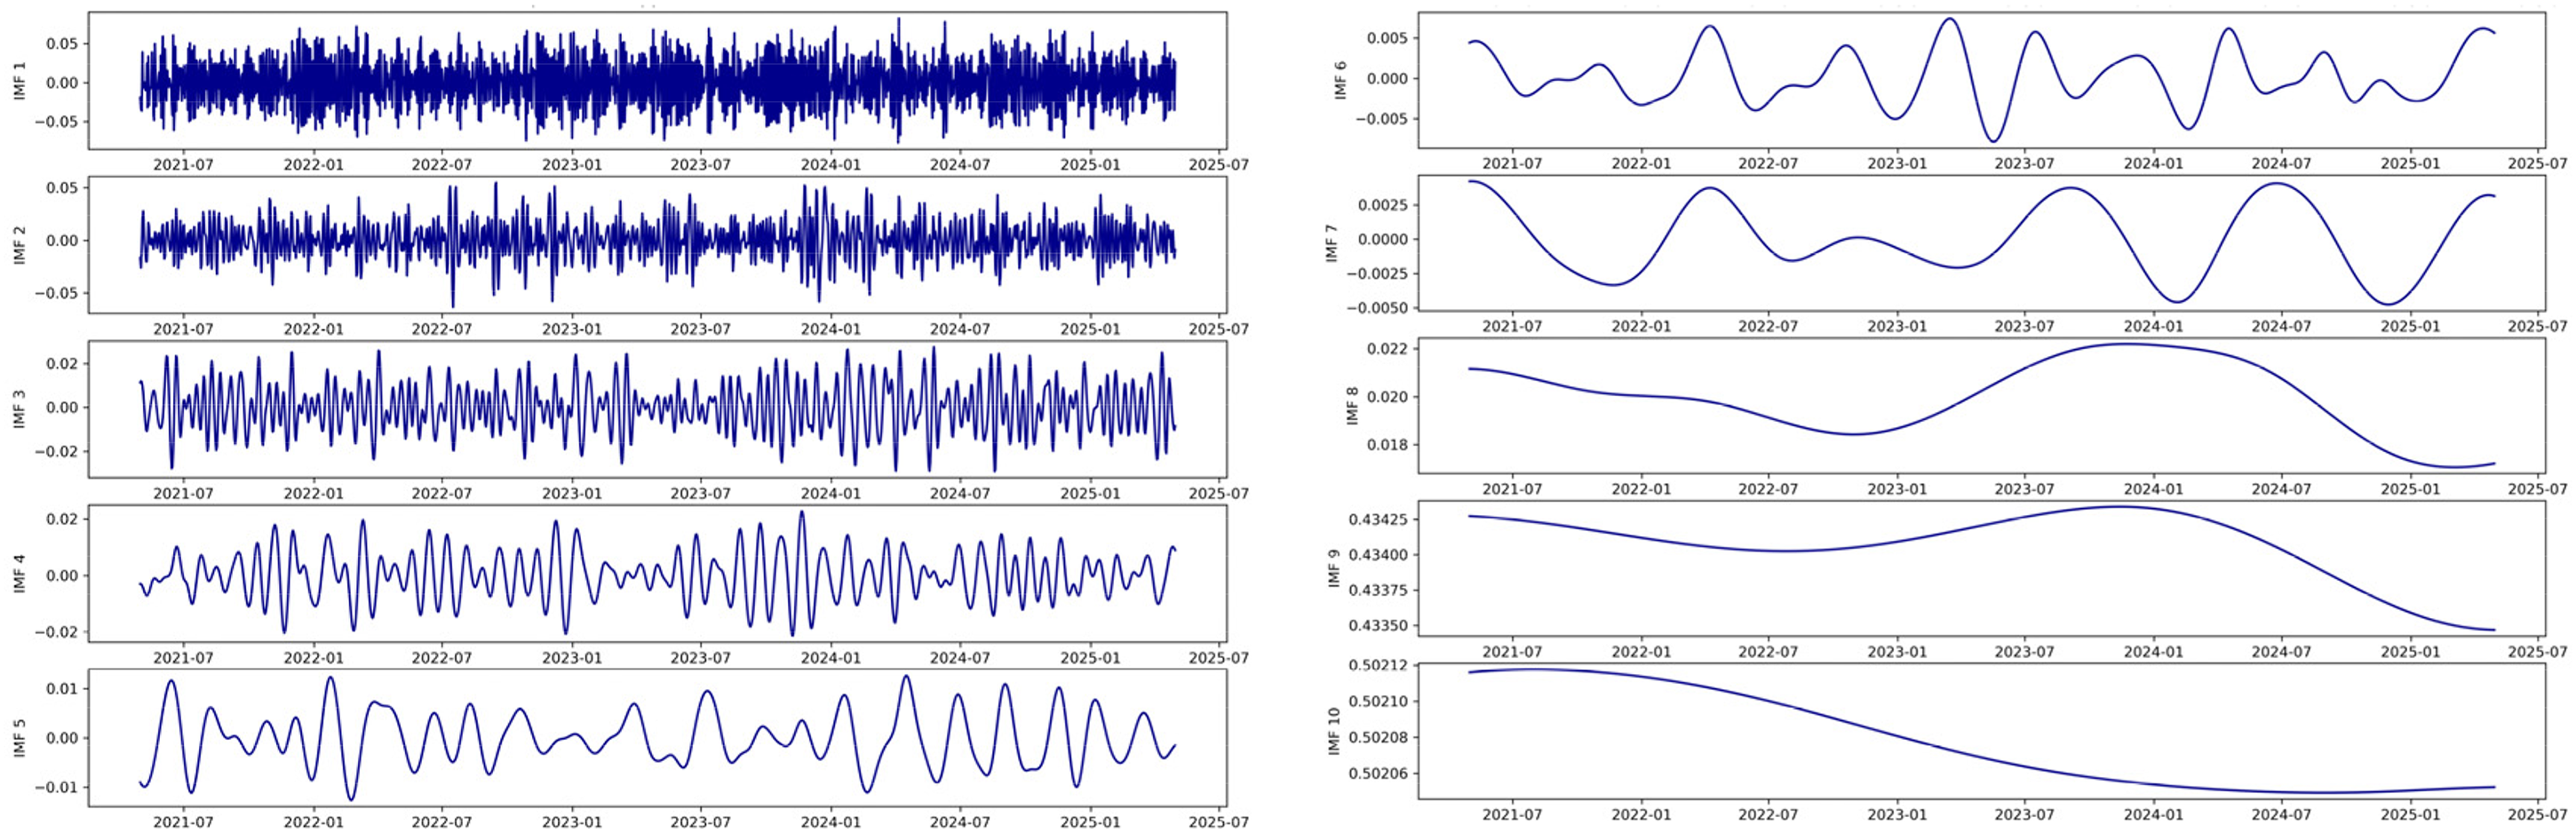
EEMD results of SI value of “Design” attribute. EEMD: ensemble empirical mode decomposition; SI: satisfaction index.
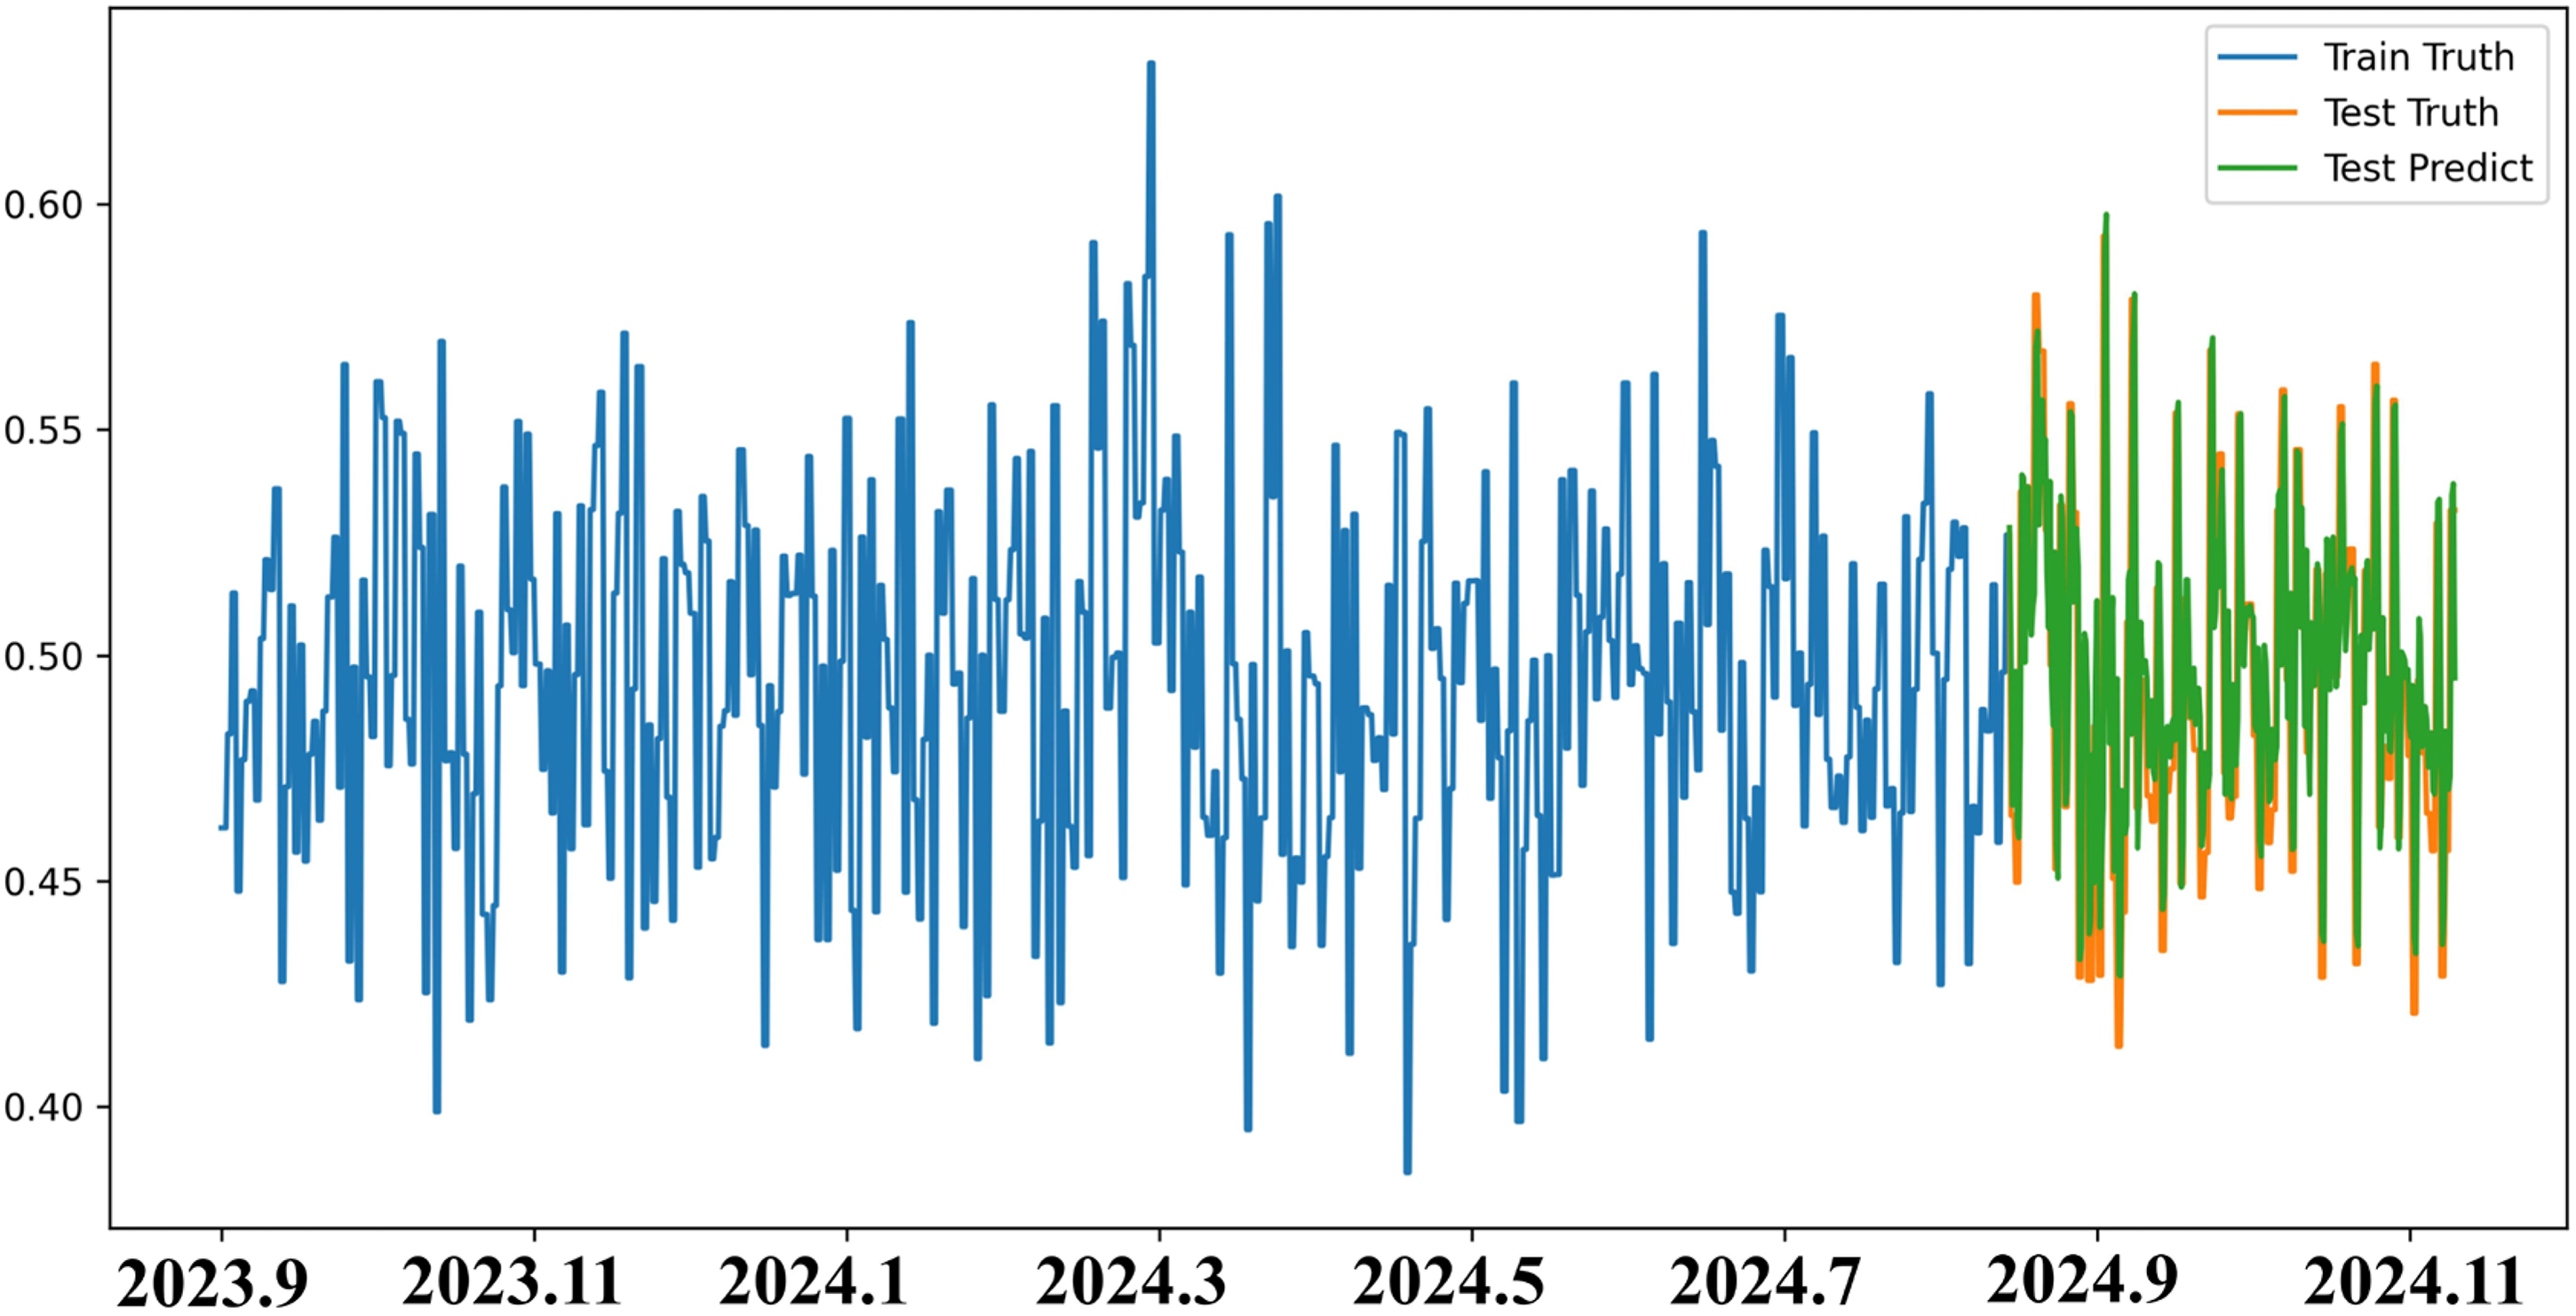
In this study, a combined approach of EEMD and Attention-BiGRU was adopted to model and predict satisfaction and attention indices. Initially, structured semantic features were obtained through text preprocessing, tokenization, and semantic embedding via the BERT model. These features were then combined with sentiment scores generated by a sentiment analysis model to construct unified temporal input vectors. As the BiGRU model is sensitive to input scale, all features were normalized using min–max scaling. Padding was also applied to sequences of varying lengths to ensure consistent tensor dimensions. The processed input features were subsequently converted into PyTorch tensor format and used as input for BiGRU model training. To enhance the model's ability to learn multi-scale temporal patterns, EEMD was employed to decompose satisfaction and attention time series of key attributes. The resulting IMFs and residuals were used as multi-channel inputs to capture differences between short-term fluctuations and long-term trends. The final Attention-BiGRU model demonstrated improved fitting accuracy while effectively capturing key historical information. Regarding model parameter tuning, random search was utilized for hyperparameter optimization. Compared to grid search, it offered higher computational efficiency and exploration capability in large parameter spaces. The final model configuration included a 64-dimensional hidden feature size, two layers of BiGRU units, 50 training epochs, the Adam optimizer, and a single-node output layer. The data spanned from May 2021 to December 2024, with an 80:20 train–test split. Figure 9 illustrates the changes and predictions of the satisfaction AS for the “Appearance” attribute from September 2023 to January 2025. As shown in the figure, the training phase (blue curve) exhibited significant fluctuations, indicating that users’ emotional responses to this attribute were highly dispersed and dynamic. During the testing phase, the predicted values (green curve) closely aligned with the actual observations (orange curve), indicating high fitting accuracy. Notably, after July 2024, the emotional fluctuations gradually stabilized, and an upward trend became increasingly evident. According to the previous Kano classification, this attribute was identified as a must-be requirement with the highest sensitivity score, reflecting not only clear user expectations but also strong emotional expression regarding “Appearance Design.” Therefore, the upward trend in satisfaction over time may suggest a shift from “expected” to “recognized” importance, potentially indicating the emergence of attractive attribute characteristics.
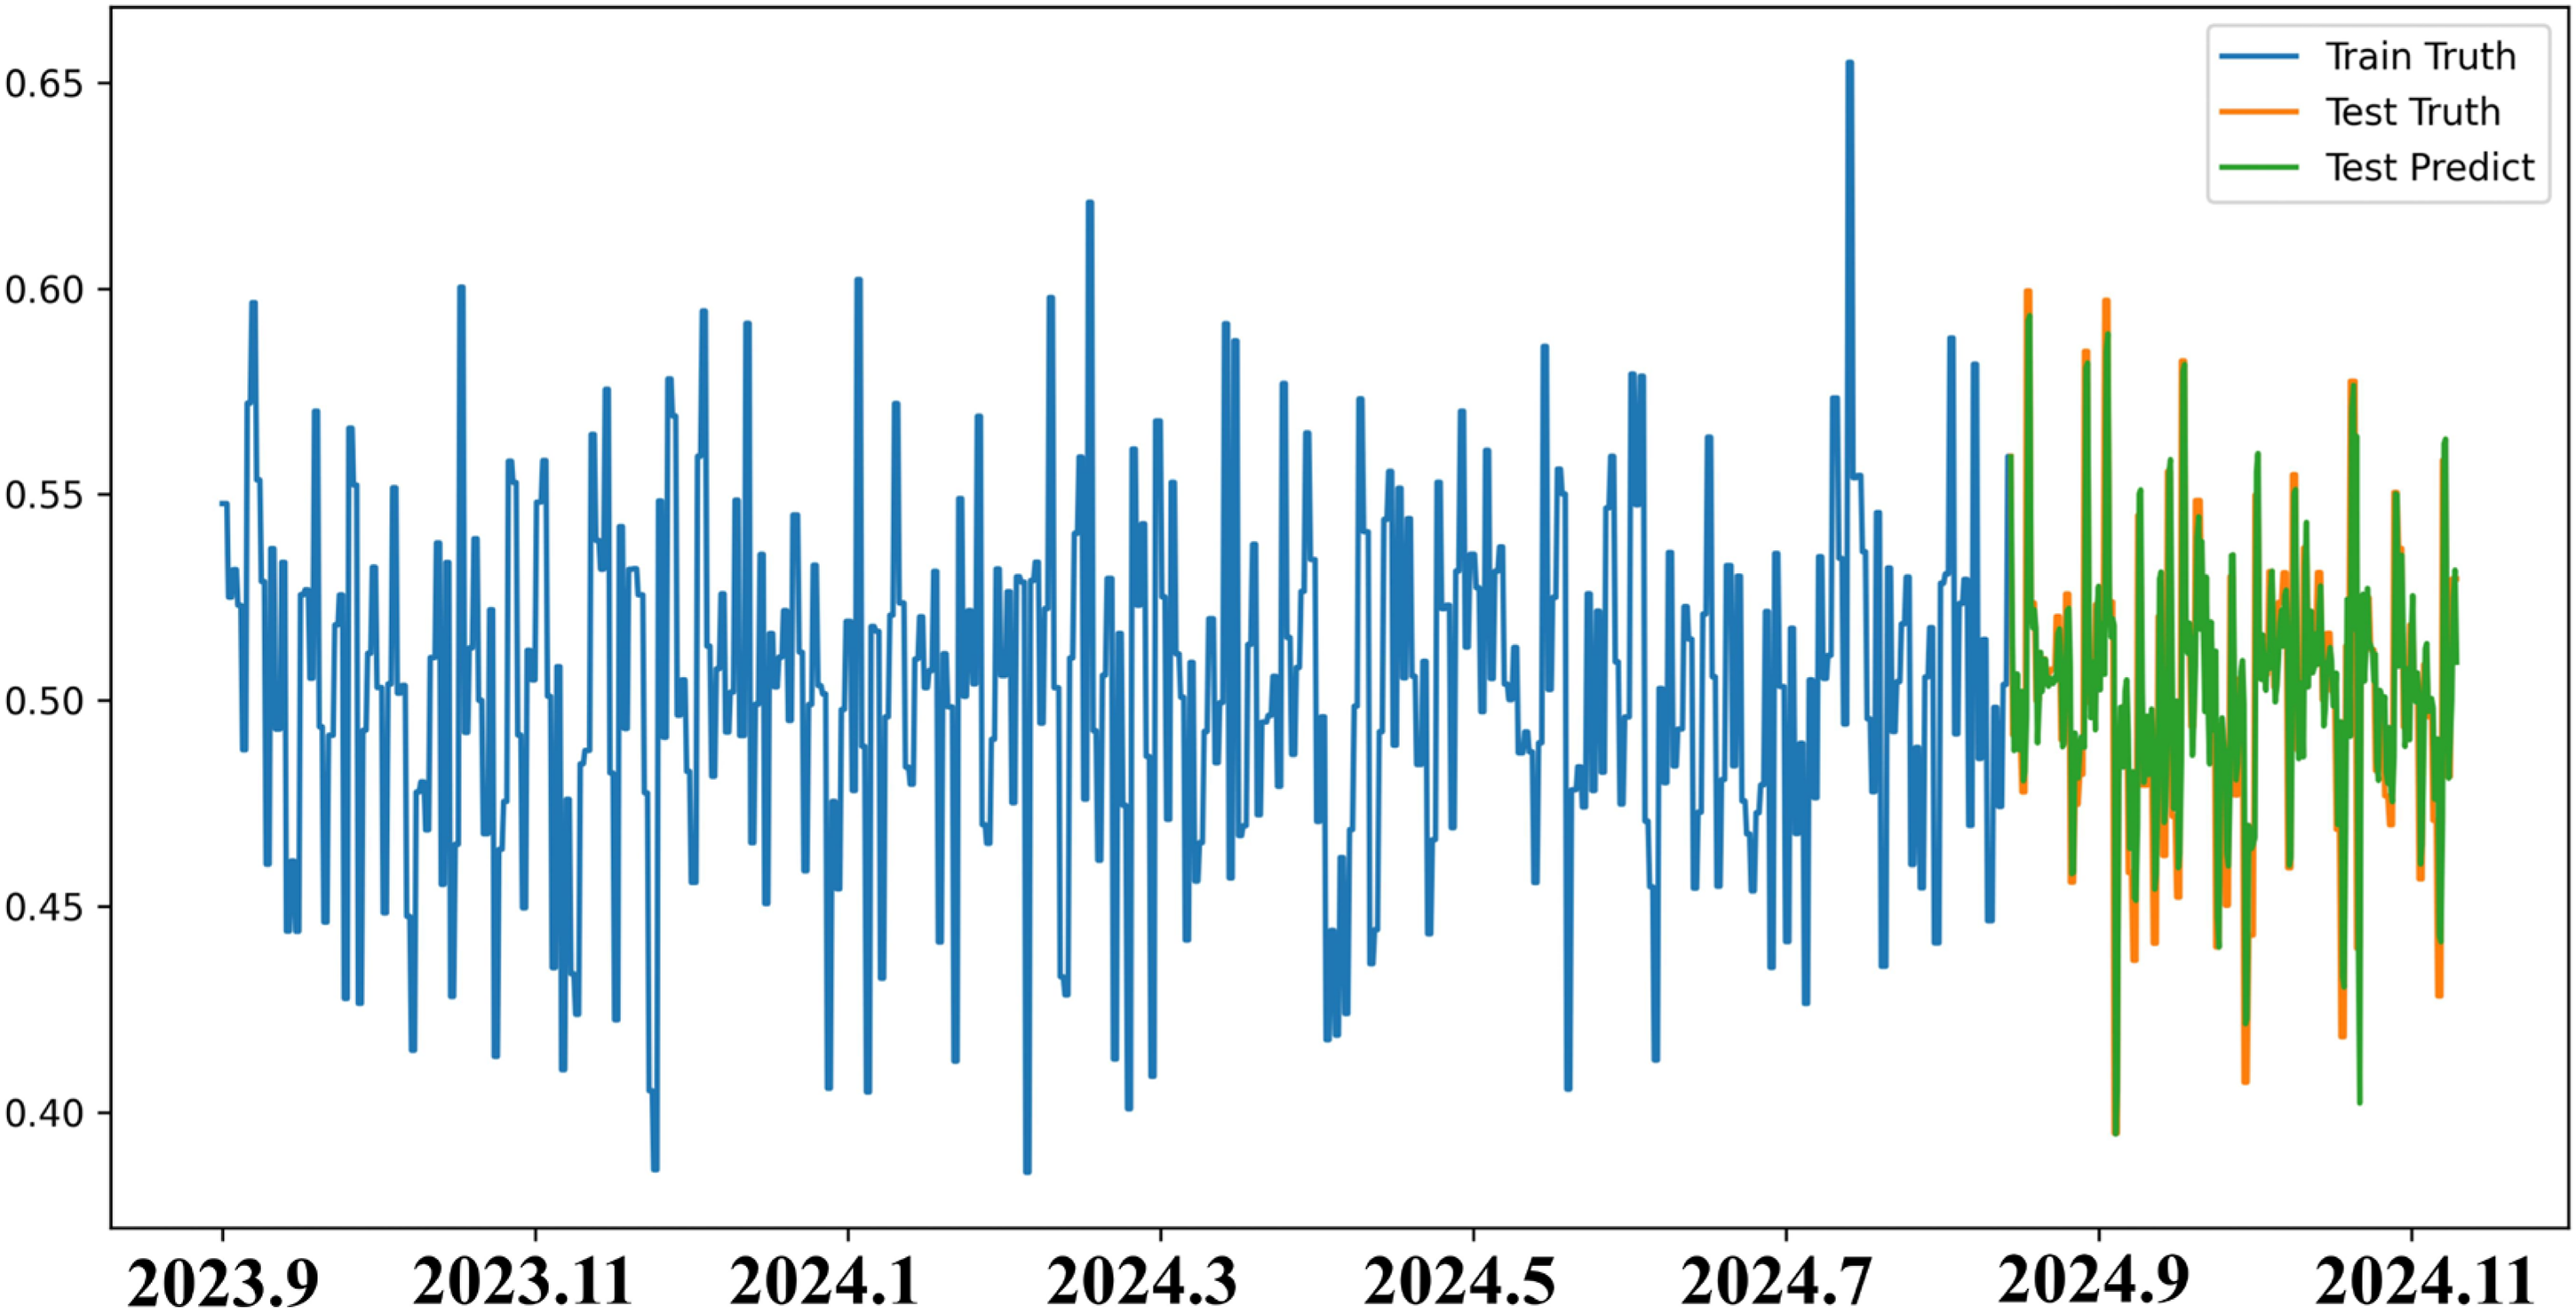
Prediction results of the satisfaction attention score of the “appearance” attribute.
Meanwhile, Figure 10 presents the predicted results of the AS for the “Appearance” attribute during the same period. As shown in the figure, despite the presence of some noise-induced fluctuations, the overall prediction trend closely approximates the actual data trajectory. Between November 2023 and February 2024, increased local volatility was observed due to a decline in the number of comment samples. Nevertheless, the Attention-BiGRU model effectively reconstructed the temporal structure of attention, successfully capturing cyclical variations and shifts in user interest density. From an overall perspective, the “Appearance” attribute consistently maintained a high level of attention, with a stable upward trend emerging after Q3 2024. This phenomenon indicates that although users have already developed a basic understanding of “Appearance,” such attributes continue to attract discussion and evaluation, reflecting their sustained relevance in product perception, experiential feedback, and public discourse.
Prediction results of the attention value of the “appearance” attribute.
Table 4 summarizes the fluctuation patterns in satisfaction sentiment trends across different Kano attribute categories. By integrating EEMD decomposition with the Attention-BiGRU model, dynamic variations in user evaluations of product features were identified. The analysis reveals that “Appearance,” as a high-sensitivity attribute, exhibited a steadily increasing trend in satisfaction sentiment over the past 2 years. Its classification as a must-be (M) attribute under the Kano model suggests that it has become a fundamental criterion in users’ product selection. Accordingly, future product design efforts should focus on refining visual identity and aesthetic styling, while maintaining consistency in design language to strengthen brand recognition and user loyalty. The “Configuration” attribute, categorized as an attractive (A) feature, showed a continued upward trend in satisfaction sentiment in the recent period. This indicates that, while not commonly anticipated, it exceeds user expectations in practice and can substantially enhance satisfaction. For such potential value-added attributes, product strategies should aim to enhance users’ sense of surprise by further refining experiential details—such as intelligent control, interaction convenience, and personalization—while consolidating existing strengths.
Fluctuation patterns of satisfaction sentiment across kano attribute categories.
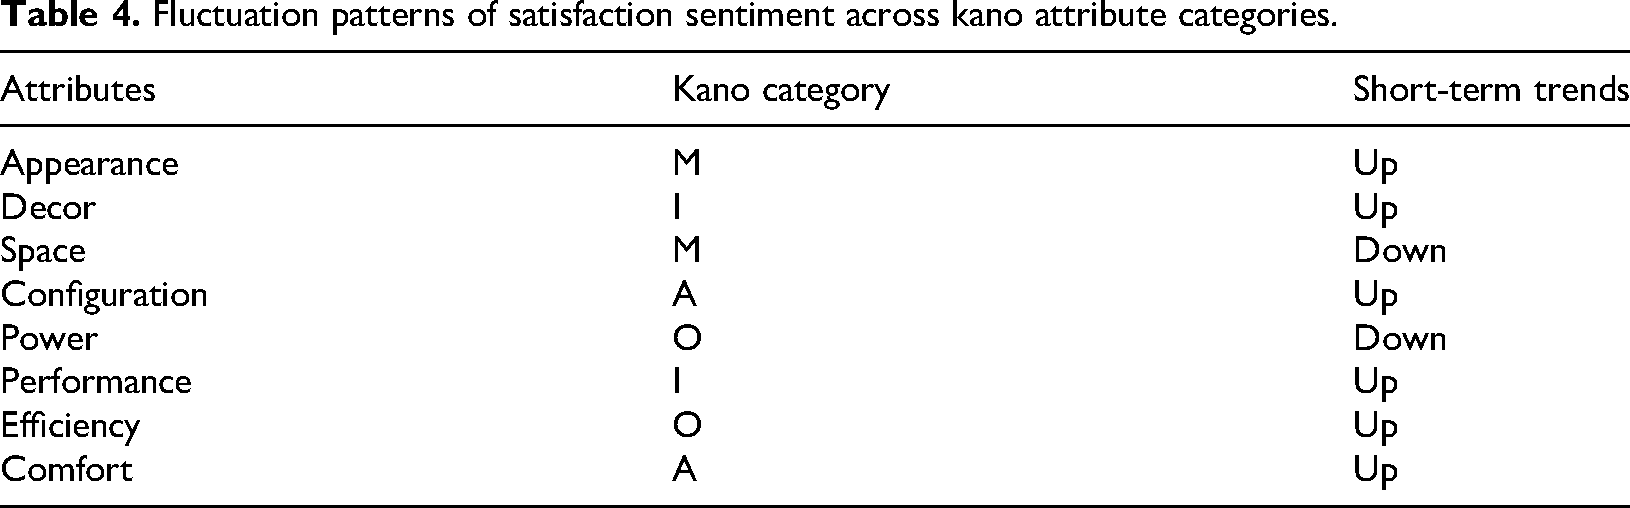
Notably, although the “Performance” attribute also shows an upward trend in AS, it is currently classified as an indifferent (I) attribute, indicating that it has not yet been widely recognized or elicited strong emotional responses from users. Therefore, functional recognition of this attribute may be enhanced through scenario-based content marketing and user education, facilitating its transition toward a one-dimensional or even attractive attribute and establishing a differentiated value proposition. In contrast, “Space,” as a typical must-be (M) attribute, has shown increasing negative sentiment fluctuations, indicating a declining trend in user satisfaction. Given its foundational role, latent user dissatisfaction with spatial experience should be addressed through optimization efforts—particularly in cabin layout, rear legroom, and storage flexibility—to prevent critical performance gaps from undermining overall satisfaction. Additionally, the “Comfort” attribute has demonstrated a relatively stable upward trajectory in satisfaction and has been classified as an attractive (A) attribute, reflecting users’ sustained pursuit of high-quality driving experiences. Continuous investment in this dimension is recommended, with refined seat support, advanced noise insulation, and suspension tuning positioned as critical technical levers for attracting mid- to high-end users.
Analysis of user non-differentiated attribute demand
Table 5 presents the results of sentiment trend analysis for indifferent attributes based on the Mann–Kendall trend test. This non-parametric test is employed to detect whether attributes with weak apparent emotional responses and low user attention exhibit statistically significant trends over time, thereby identifying their potential to evolve into other Kano attribute categories. The analysis indicates that for the attributes “Decor,” “Performance,” “Central Control,” and “Storage,” all Z-values were negative and their corresponding p-values were significantly below 0.05. This suggests that these attributes—originally classified as indifferent—exhibited a clear upward trend in user sentiment (i.e. decreasing negative emotions and increasing satisfaction). Accordingly, these four attributes can be reclassified as value-added attributes. Notably, the attributes “Central Control” and “Performance” demonstrated strengthened sentiment trends in user evaluations. This indicates that, with ongoing technological refinement and increased usage frequency, user recognition of these functions is gradually intensifying. It is therefore recommended that enterprises incorporate these elements into mid-term product value reconstruction strategies and enhance brand recognition through improved interaction design and intelligent control capabilities.
Results of trend test for indifferent attributes.
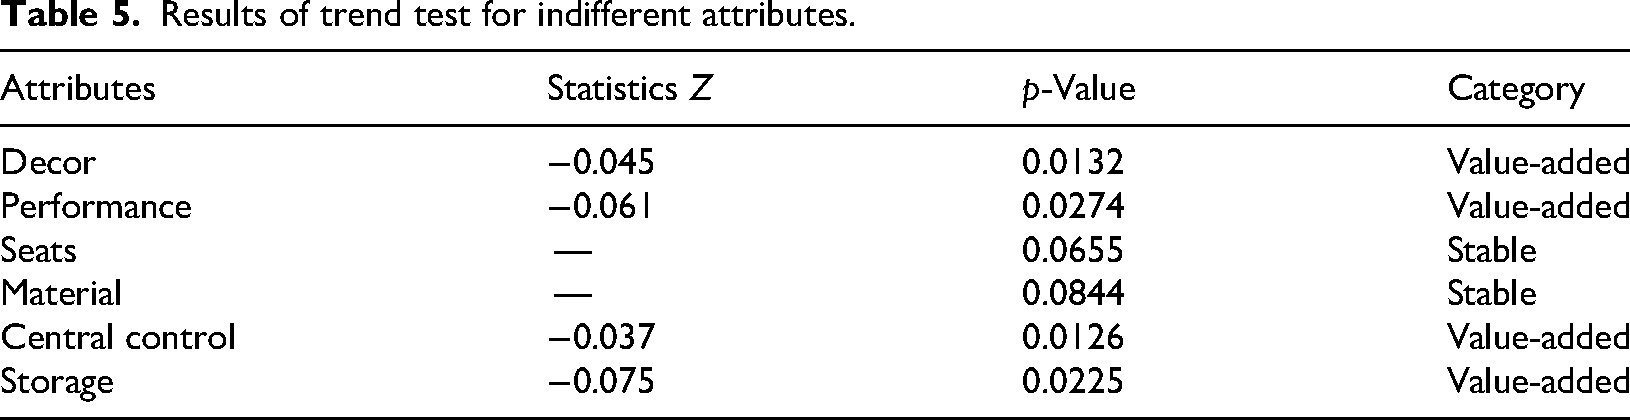
In contrast, the attributes “Seats” and “Material” did not exhibit statistically significant trend statistics, with p-values of 0.0655 and 0.0844, respectively. This indicates that no significant changes in user satisfaction occurred during the observed time period, and these attributes should continue to be identified as stable attributes. Although these attributes currently exert limited influence on user satisfaction, they serve essential functional roles in practical usage scenarios. It is therefore recommended that enterprises maintain basic quality standards without allocating excessive short-term optimization resources.
The Mann–Kendall test provides a temporal dimension supplement to the traditional Kano classification, effectively identifying significant demand shifts that were previously under-recognized. For the reclassified value-added indifferent attributes, enterprises are encouraged to facilitate attribute re-recognition through strategic marketing and product experience enhancement, promoting a shift from user neglect to recognition and thereby expanding differentiated competitive advantages.
Ablation experiment and model comparison test verification
To further validate the effectiveness of the proposed EEMD–Attention–BiGRU (EAB) model in predicting user AS and attention trends, two types of performance evaluation experiments were designed. The first is an ablation study conducted to evaluate the specific contribution of each model component to prediction performance. The second is a comparative experiment in which the proposed model is compared with several traditional time-series modeling methods to verify its advantages in terms of fitting accuracy and trend recognition.
In this study, three simplified versions of the model were constructed by individually removing the EEMD decomposition module, the attention mechanism, and the BiGRU structure—resulting in Attention-BiGRU, EEMD-BiGRU, and EEMD-GRU, respectively. Their performance on the user satisfaction sentiment prediction task was evaluated using two error metrics: root mean squared error (RMSE) and mean absolute error (MAE). The experimental results are presented in Table 6.
Model ablation experiment results.
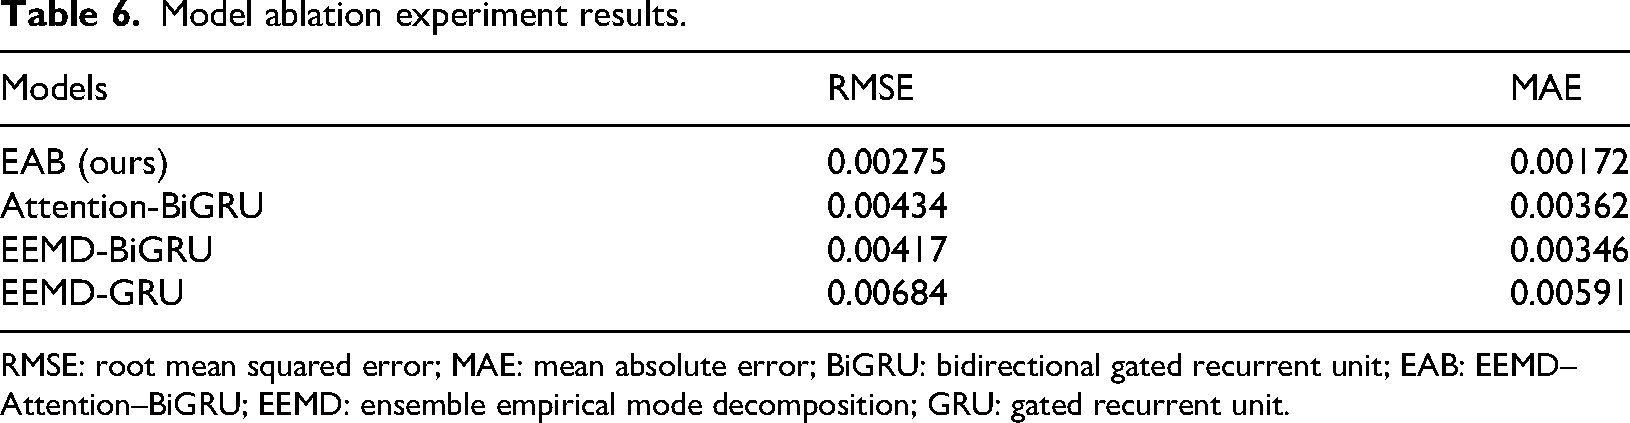
RMSE: root mean squared error; MAE: mean absolute error; BiGRU: bidirectional gated recurrent unit; EAB: EEMD–Attention–BiGRU; EEMD: ensemble empirical mode decomposition; GRU: gated recurrent unit.
As shown in the results, the complete EAB model achieved the best performance across both evaluation metrics, with an RMSE of 0.00275 and an MAE of 0.00172. This significantly outperformed the three ablated models, indicating superior accuracy and stability. In comparison, removing the EEMD module (Attention-BiGRU) resulted in an RMSE increase to 0.00434 and an MAE increase to 0.00362, indicating a noticeable decline in prediction accuracy. This suggests that without signal decomposition, the model struggles to effectively capture multi-frequency features in non-stationary time series, thereby increasing prediction error. Furthermore, when the attention mechanism was removed (EEMD-BiGRU), the model retained EEMD-based feature extraction but lost the ability to assign attention to key time steps. As a result, the RMSE and MAE increased to 0.00417 and 0.00346, respectively, still exhibiting a considerable performance gap compared to the full model. Additionally, the model performed the worst when both the attention mechanism and the bidirectional structure were removed (EEMD-GRU), with the RMSE rising to 0.00684 and the MAE reaching 0.00591. This indicates a substantial degradation in the model's ability to capture historical dependencies after structural simplification. These results validate the crucial role of the EEMD module in preprocessing temporal signals, as well as the importance of the attention mechanism in modeling dynamic sentiment weighting. The synergy among components in the full model significantly enhanced its ability to model complex user preference data, particularly in capturing both short-term fluctuations and long-term trends. This provides a reliable foundation for future trend forecasting and personalized service recommendation.
A series of comparative experiments were conducted using several mainstream time-series modeling methods to evaluate their performance in terms of prediction accuracy and computational efficiency. The upper part of Figure 11 displays the RMSE distribution of different models on the test set, while the lower part compares the average runtime of each model under the same task conditions.
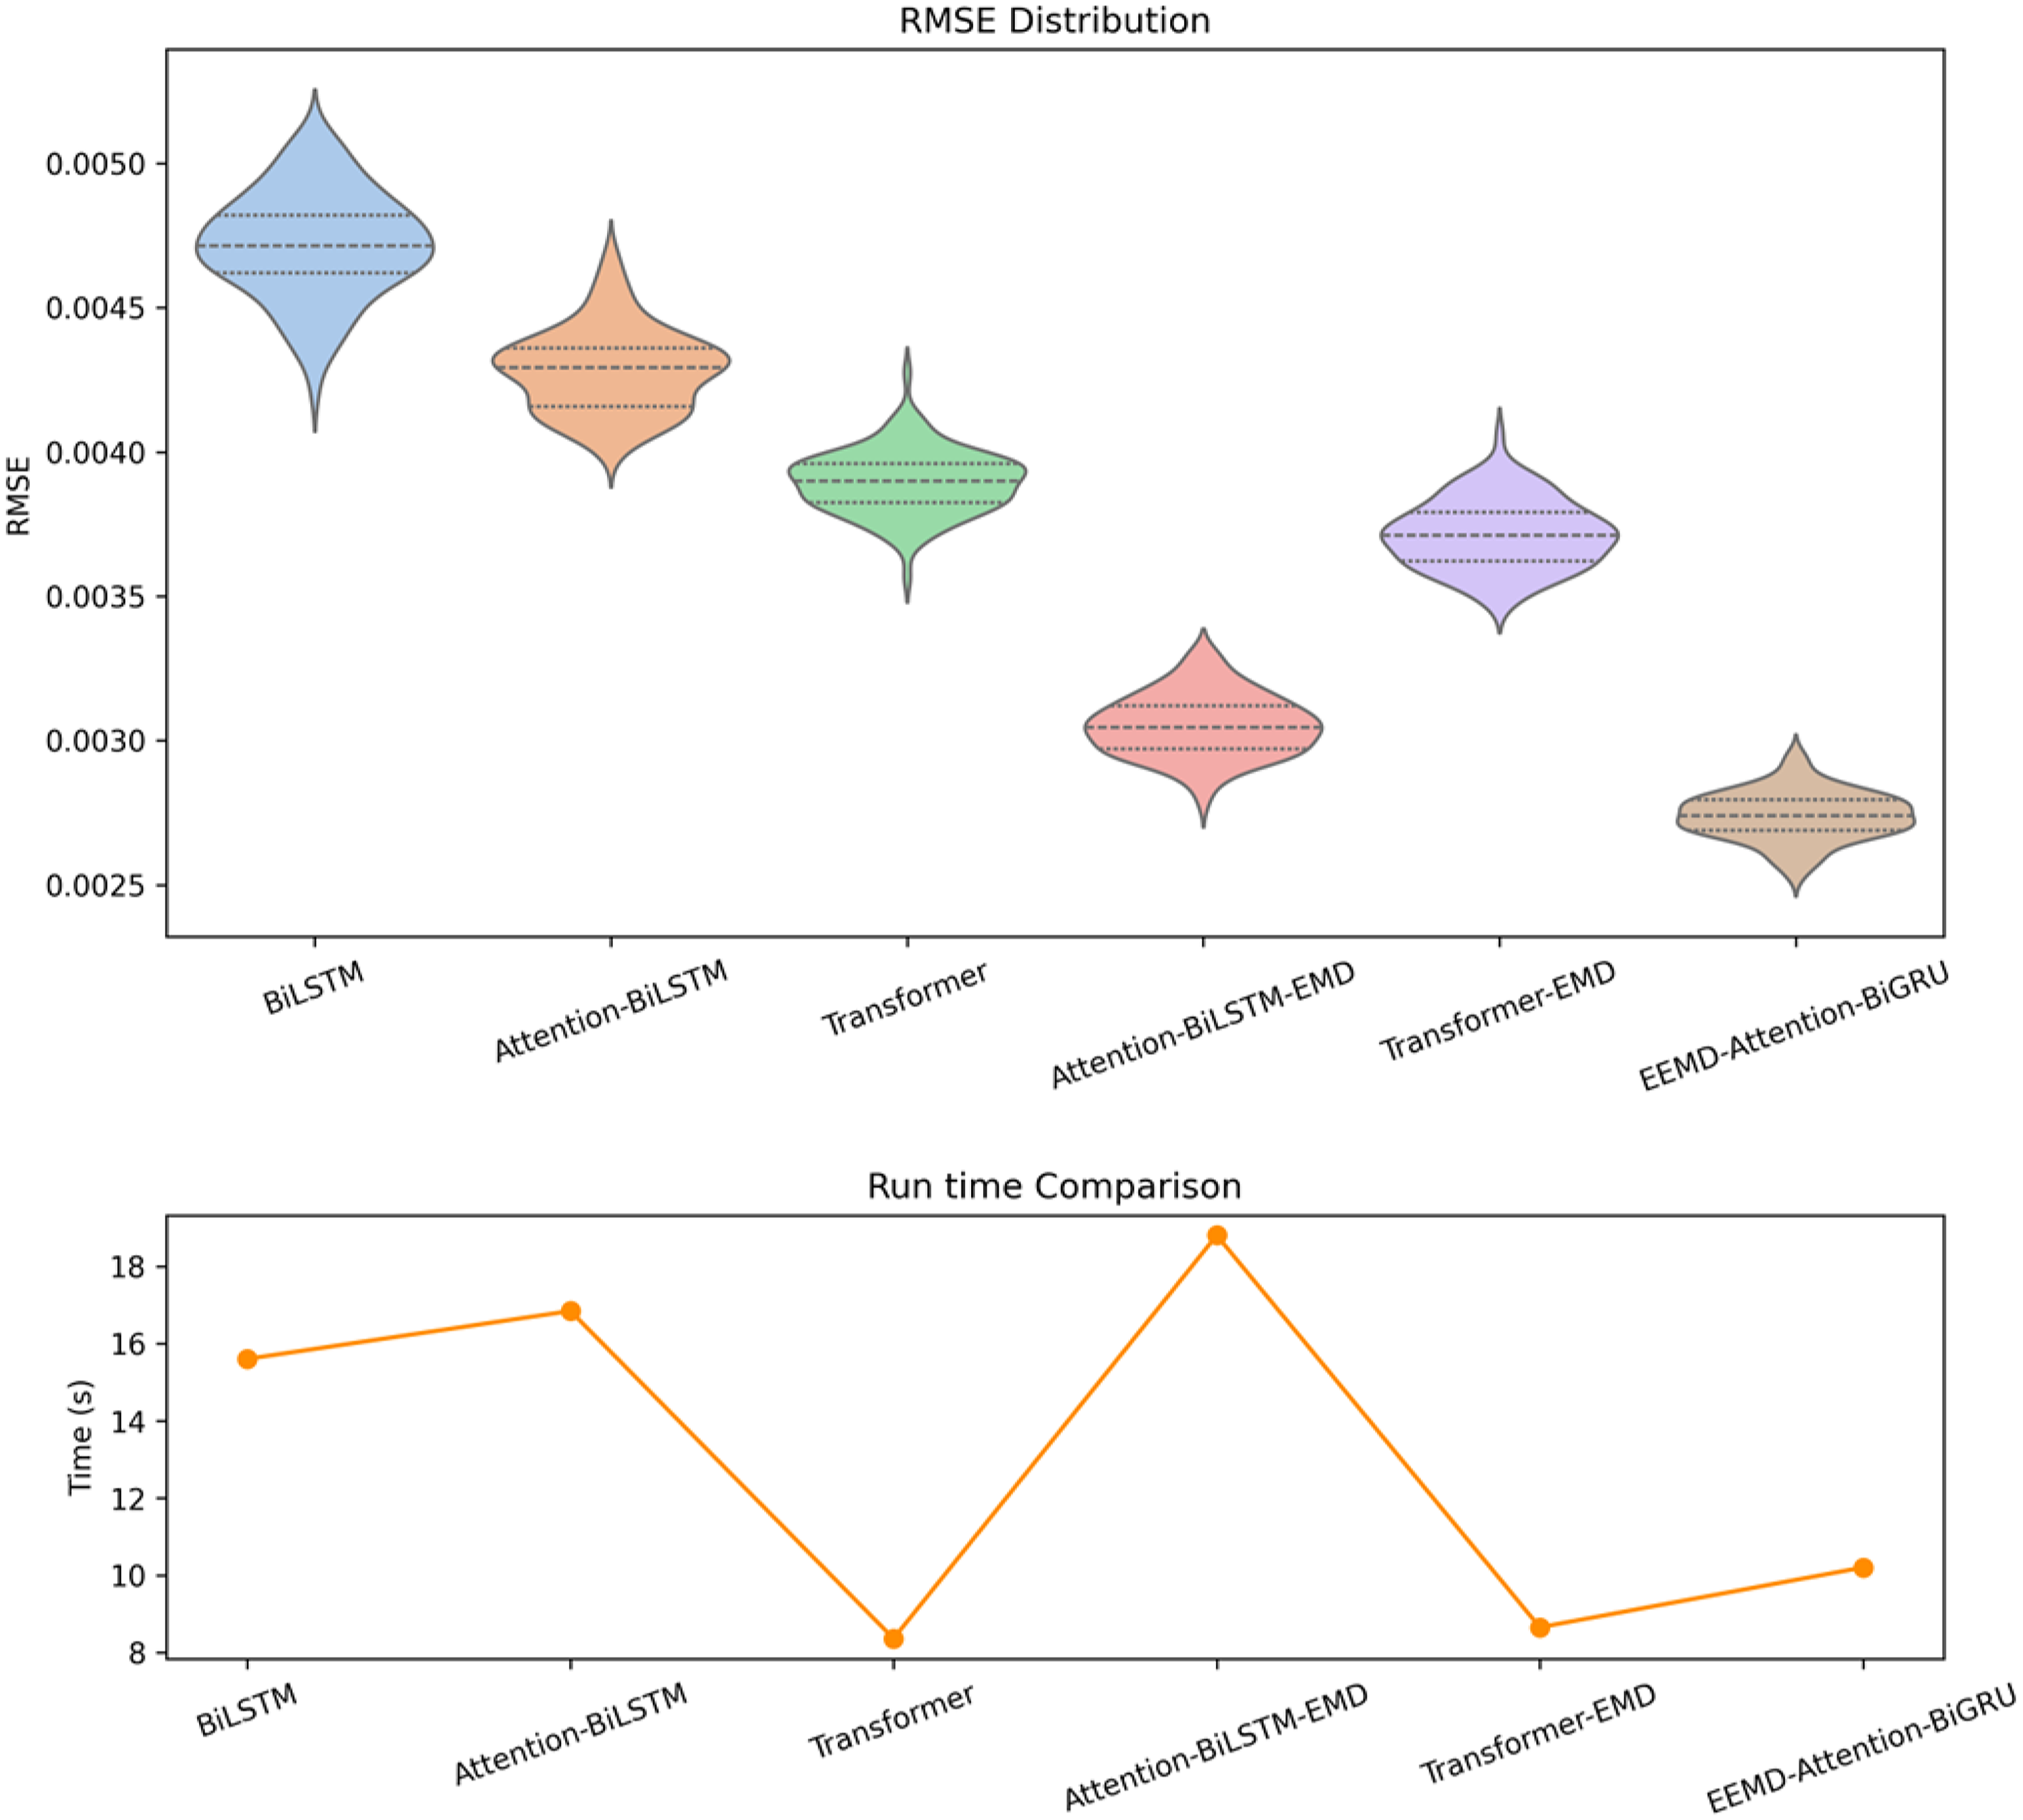
Multi-model comparison results.
From the RMSE distribution plot, it can be observed that the proposed EAB model achieved the best performance among all models, with significantly lower mean RMSE values and narrower distribution ranges compared to the baseline models, indicating its superior accuracy and stability in capturing trends in user satisfaction. In contrast, the error distributions of the BiLSTM and Attention-BiLSTM models were substantially higher, and although the transformer exhibited stable performance on some samples, its overall error remained higher than that of models integrating EEMD and bidirectional architectures. Moreover, models incorporating EMD (or EEMD) for signal preprocessing, whether combined with BiLSTM or transformer structures, demonstrated improved predictive performance, yet still underperformed compared to the Attention-BiGRU architecture when fitting the features derived from EEMD decomposition. These results indicate that the weighted mechanism of the attention module at key time steps, in conjunction with the BiGRU's capability to model temporal dependencies, can more effectively exploit multi-frequency input features, thereby enhancing the prediction of complex emotional trends.
According to the runtime comparison plot below, the transformer model exhibited the shortest execution time (approximately 8 s), demonstrating a clear advantage in efficiency, although its predictive accuracy was not competitive. In contrast, although the EAB model required slightly more time than the transformer-EEMD model (approximately 10 s), it ran significantly faster than the Attention-BiLSTM-EMD (approximately 18 s) and BiLSTM (approximately 15 s) models, achieving favorable computational efficiency while maintaining low prediction error. Considering both model accuracy and computational complexity, the EAB achieved an excellent balance between accuracy and usability.
Overall, the proposed model consistently demonstrated robust performance across various levels of complexity and structural configurations, validating its adaptability and practical utility in modeling non-stationary time-series data, particularly in multi-scale user emotional behavior tasks.
Verification of model generality
To evaluate the generalization capability and transferability of the proposed EAB model on cross-domain user preference data, an external test was conducted using data obtained from an alternative information source. Specifically, a total of 2368 user review entries related to the external configurations of NEVs were collected from a third-party automotive e-commerce platform (Yiche.com), and the same preprocessing procedures used in the main experiment—including tokenization, BERT embedding, sentiment polarity calculation, and feature normalization—were applied. In contrast to the 0–1 normalized output used in the main experiment, the current test adopted a continuous sentiment score ranging from 0 to 5, simulating a product life-cycle satisfaction evaluation framework.
In terms of experimental setup, the first 90% of the review data (a total of 2131 entries) was used as the training set, and the remaining 10% (237 entries) was used as the test set, maintaining the same training ratio as in the main experiment. Without modifying the model architecture or parameters, the original model configuration was directly applied for the transfer test, in order to evaluate its stability and robustness under a heterogeneous data scenario. Figure 12 illustrates the comparison between the actual and predicted values on the test set, revealing that the model was able to fit the evaluation trends effectively across different intervals of user emotional fluctuation. It is evident that the complete EAB model demonstrated highly consistent responses with the original score fluctuations in both peak and trough regions, highlighting its strong responsiveness in identifying extreme points. These findings suggest that the use of EEMD to decompose multi-scale components in emotional time series, combined with enhanced contextual modeling via Attention-BiGRU, enables the model to maintain high predictive accuracy and generalization capability across user behavior data from different platforms and categories.
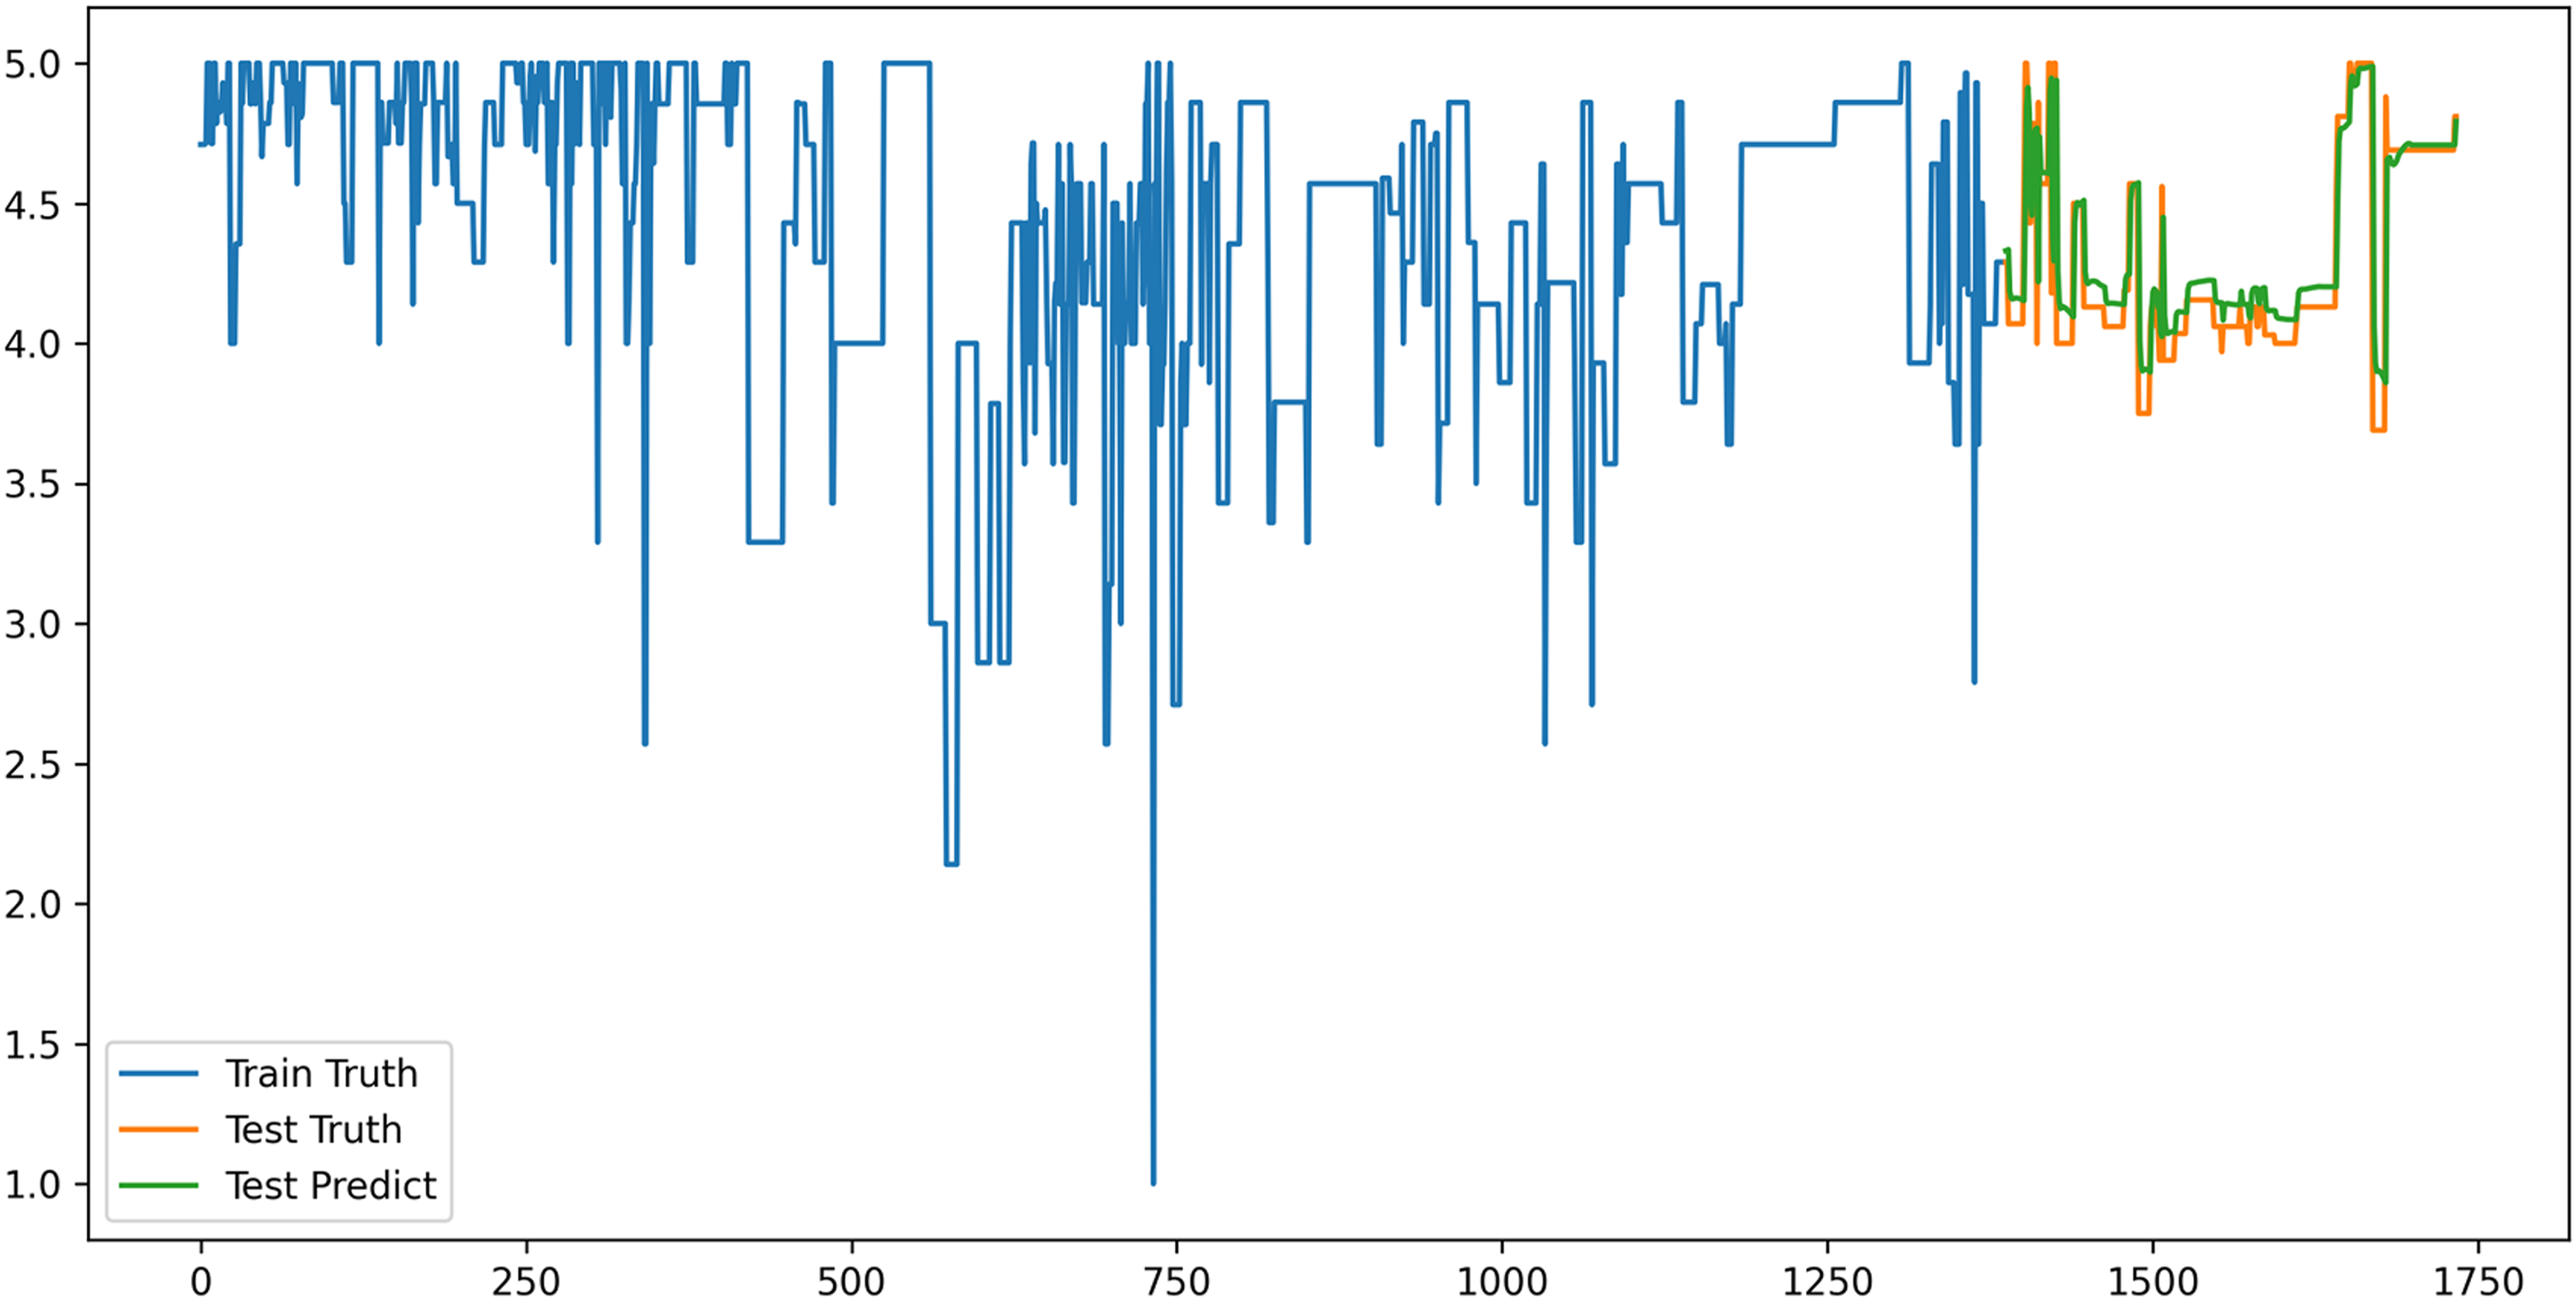
Model generalizability verification results.
Discussion
This study conducted a systematic mining of large-scale online reviews from NEV users, integrating advanced topic modeling, sentiment analysis, and time-series prediction techniques to comprehensively reveal user emotional attitudes toward key product attributes and their dynamic evolution.
The results confirmed that user satisfaction with different product attributes exhibited distinct categorical differences and dynamic patterns. First, essential attributes such as “appearance” played a central role in user satisfaction and elicited strong emotional responses, indicating that visual aesthetics and brand recognizability remain key drivers in vehicle purchasing decisions. Manufacturers are encouraged to continuously invest in design innovation to maintain a contemporary and distinctive appearance, thereby fostering brand identity, enhancing customer loyalty, and improving market competitiveness (Zikienė et al., 2024). Second, attractive attributes such as vehicle configurations exhibited a marked upward trend in emotional responses, suggesting that innovative features and intelligent user experiences are gradually becoming effective levers for enhancing user satisfaction. Manufacturers should prioritize the research and iteration of emerging features such as intelligent cockpits, multimedia connectivity, and personalized customization, treating them as strategic entry points for product differentiation and user experience enhancement (Xu et al., 2024). Additionally, proactive marketing and user education can strengthen awareness and engagement with such value-added attributes, helping guide users toward higher expectation standards and expanding market potential.
On the other hand, the evolving trends of expected and indifferent attributes provide strategic guidance for dynamic product adjustments. In particular, value-added indifferent attributes identified through the Mann–Kendall test revealed that previously overlooked factors are gradually becoming new focal points of user attention, indicating the need for enterprises to explore their potential for value redefinition and differentiated development. Some indifferent attributes (e.g. central control systems and performance) exhibited an upward trend in satisfaction, representing potential “blue ocean” opportunities. Manufacturers are advised to proactively capture these signals and strategically plan for technological upgrades and functional optimizations to gain a competitive edge through differentiated innovation (Sirotkin et al., 2012). In contrast, an increase in negative sentiment toward fundamental attributes such as space serves as a warning that user demands for cabin comfort and spatial flexibility must not be neglected. Notably, the rising negative sentiment toward fundamental attributes such as “space” reflects latent dissatisfaction regarding cabin comfort and internal spatial arrangement. Enterprises should pay close attention to specific pain points in the user experience, such as rear legroom, storage design, and seat comfort, in order to prevent potential performance bottlenecks from adversely affecting overall satisfaction and to safeguard fundamental competitiveness (Bollenbach et al., 2024).
The EEMD- and Attention-BiGRU-based time-series prediction model offers manufacturers a scientifically grounded and effective tool for dynamic monitoring of user preferences, enabling not only accurate detection of fluctuations in satisfaction and attention, but also forward-looking forecasting of future trends. This model can be leveraged by enterprises to dynamically adjust R&D priorities and marketing strategies, enabling optimized resource allocation and personalized customer service, thereby enhancing market responsiveness and user satisfaction.
Overall, this study highlights the importance of establishing a user feedback-driven closed-loop innovation system, through which manufacturers can dynamically manage the life-cycle value of various product attributes. For essential attributes, quality stability should be ensured; for attractive attributes, continuous innovation is required; and for value-added indifferent attributes, active cultivation and promotion are necessary (Wang et al., 2024). By precisely tracking the evolution of user demands, enterprises can develop more effective product design strategies and marketing plans, thereby promoting the intelligent and personalized development of NEVs, and ultimately enhancing overall market competitiveness and user loyalty (Yang et al., 2024).
Despite the significant findings, this study has certain limitations. The data were sourced from a single platform, and sparsity during certain time periods may have affected the continuity and representativeness of trend analyses. Future research could explore multi-platform and multi-modal data integration (Abouelregal et al., 2023; Hobiny et al., 2022; Zeeshan et al., 2023), incorporating driving behavior, after-sales feedback, and regional cultural differences to enhance the comprehensiveness and accuracy of preference identification (Özdemir et al., 2022; Özdemir and Dörterler, 2022). Enhancing the model's capabilities in personalization and real-time dynamic adaptation will further support the intelligent transformation of the NEV industry and the advancement of user experience.
Conclusion
This study constructed a comprehensive analytical framework based on large-scale online reviews from NEV users, integrating BERTopic-based topic modeling, BERT-based sentiment analysis, and EEMD with Attention-BiGRU for deep time-series prediction. This framework enabled systematic identification of key product attributes, quantification of emotional attitudes, and accurate modeling and forecasting of dynamic trends, thereby comprehensively revealing the multi-dimensional evolution of user preferences. Through Kano model-based attribute classification and sensitivity ranking, the study clarified the relative importance and potential evolution of different attributes in shaping user satisfaction, providing a scientific basis for prioritizing product design and marketing strategies. Experimental results indicated that essential attributes such as “appearance design” consistently maintained high levels of attention and satisfaction, while attractive attributes such as “configuration” demonstrated substantial potential for emotional uplift. Trend analysis of indifferent attributes further uncovered the dynamic evolution of user demands, offering theoretical support for identifying potential areas of market growth. In addition, the EEMD and Attention-BiGRU-based time-series prediction model effectively captured the non-linear and multi-scale characteristics in emotional data, enabling high-precision forecasting of satisfaction and attention trends, and enhancing both the scientific rigor and practical applicability of user preference modeling.
Footnotes
Funding
The authors disclosed receipt of the following financial support for the research, authorship, and/or publication of this article: Major Humanities and Social Sciences Research Projects in Zhejiang Higher Education Institutions (Grant Number: 2024QN139), Key Project of Education Science Planning in Zhejiang Province (Grant Number: 2025SB133), and Special Funding Support from China Pearl University (Grant Numbers: JYZZ202509, JYZY202502).
Declaration of conflicting interest
The authors declared no potential conflicts of interest with respect to the research, authorship, and/or publication of this article.
Data availability
All the data in this paper are collected by ourselves and have passed the ethical approval. The data link is: 10.57760/sciencedb.26360.
Statement on AI use
During the preparation of this manuscript, ChatGPT (OpenAI) was used solely for minor grammatical and stylistic polishing. No substantive scientific content, data analysis, or conceptual development was delegated to the model. All intellectual contributions including study design, methodology, data interpretation, and scientific writing were conceived and executed independently by the human authors.