
Abstract
The mismatch between the midday peak of solar energy production and the late-afternoon residential electricity demand presents a significant challenge for maximizing the efficiency of photovoltaic (PV) systems in Jordan. Storage solutions, while effective, are costly and not widely feasible for residential use. A 5 kWp PV system size was selected for this study to explore the potential of optimizing PV panel orientations to better align energy production with demand, reducing reliance on storage and enhancing cost-efficiency. Using PVsyst simulations, the performance of five orientations—South, East, West, Southeast, and Southwest—was analyzed to assess their energy production patterns, performance ratios, and alignment with peak demand periods for representative days across the year. The results show that while South-facing panels produce the highest total energy, West and Southwest orientations better align with late-afternoon and evening on-peak demand, contributing 9% and 6%, respectively, compared to 3% for South-facing panels. Southeast and Southwest orientations also deliver near-optimal total energy output, approximately 96% of the South-facing configuration. A mixed-orientation system is recommended to balance total production and interval-specific demand, ensuring optimal grid integration and cost efficiency.
Introduction
Globally, energy is the primary contributor to climate change, causing greenhouse gas emissions that are largely driven by the burning of fossil fuels. Despite global efforts to reduce these emissions, CO2 levels remain significantly above the thresholds required to avoid the most severe impacts of climate change. Many countries are addressing this issue by implementing national energy and climate plans, focusing on transitioning electricity generation—a significant source of CO2 emissions—from fossil fuels to renewable energy (IEA, 2019). Among the contributors to greenhouse gas emissions, the residential sector stands out as a key driver, accounting for approximately 60% of total sector emissions (Santamouris and Vasilakopoulou, 2021).
In this context, Jordan is a compelling case study for understanding the dynamics of greenhouse gas emissions and their sources, especially in the energy sector. A detailed analysis of CO2 emissions in Jordan reveals important trends and sources of emission. CO2 emissions from fuel consumption in the energy sector in Jordan totaled 21.35 Mt CO2 in 2022 (IEA, 2021). This represents a 40% increase from 2000 to 2022. Notably, these figures reflect CO2 emissions from fuel combustion in the energy sector and do not account for other significant sources of energy-related greenhouse gas emissions, such as methane leaks from oil and gas operations, which are more challenging to quantify. A closer examination of the primary sources of CO2 emissions in Jordan in 2022 reveals that electricity and heat production are the largest contributors, accounting for 40% of total energy-related CO2 emissions. The residential sector follows, contributing 8.2% of the total emissions.
Jordan is an oil-importing country with limited conventional energy resources, such as natural gas. According to the Ministry of Energy and Mineral Resources, the country currently imports approximately 93% of its energy, representing around 8% of its GDP. This heavy reliance on imported fossil fuels exacerbates energy security concerns and contributes to a high level of greenhouse gas (GHG) emissions per capita (IEA, 2021). The energy sector is, therefore, critical in ensuring energy security for a country constrained by resource scarcity and regional instability.
Electricity consumption in Jordan has steadily risen, with annual increases of 3.7% in 2021 and 5.7% in 2022. This growing demand amplifies the environmental impact of energy dependency, underlying the urgency for policy reforms to diversify energy sources and reduce imports. The National Energy Sector Strategy (2020–2030) aims to increase self-sufficiency by utilizing domestic natural and renewable resources, improving energy efficiency, and reducing carbon dioxide emissions by 10% by 2030. This plan seeks to reduce Jordan's dependence on costly fuel imports, alleviating the national economy's energy burden while advancing a low-carbon strategy. To meet these goals, Jordan is pursuing more economical, reliable, and environmentally friendly energy sources, with solar energy being a key focus.
The energy consumption profile in Jordan highlights key areas for intervention. The transportation sector accounts for the largest share (49%), followed by the residential sector (23%), with industrial and commercial sectors contributing 14% (Jaber, 2002). Given its significant share, the residential sector presents substantial opportunities for cost-effective reductions in energy-related GHG emissions. Measures such as improving building insulation, installing solar panels, and adopting solar water heating systems can play a pivotal role in reducing emissions and alleviating the pressures of energy demand.
Jordan, located in the subtropical zone at latitude 30°35′N and longitude 36°14′E (BaniMustafa and Al-Omari, 2022) (see Figure 1), spans 89,342 km², with approximately 75% of its land being arid or semi-arid. The country has a population of around 11.2 million, and its climate ranges from the Mediterranean in the north to the arid desert in the south. The capital, Amman, has an average temperature of 17.2°C (Burdon, 1959). Situated in the global sunbelt, Jordan receives substantial solar radiation, with an average of 316 sunny days annually. During the summer, the sun's elevation angle can reach up to 83 degrees, leading to direct solar radiation intensities of 5–7 kWh/m². The annual total irradiance ranges between 1800 and 2700 kWh/m², with the highest irradiance recorded in June at 7.75 kWh/m²/day (Weather Online Ltd, 2020). Jordan's abundant solar resources position it as a prime candidate for renewable energy generation. Its location within the sunbelt ensures high solar irradiance, and the vast desert areas, combined with minimal cloud cover and rain, make solar energy harvesting particularly feasible. Jordan's ambitious renewable energy targets further enhance this potential. Jordan could meet 100% of its electricity demand from renewable sources, saving the national treasury up to $12 billion annually.
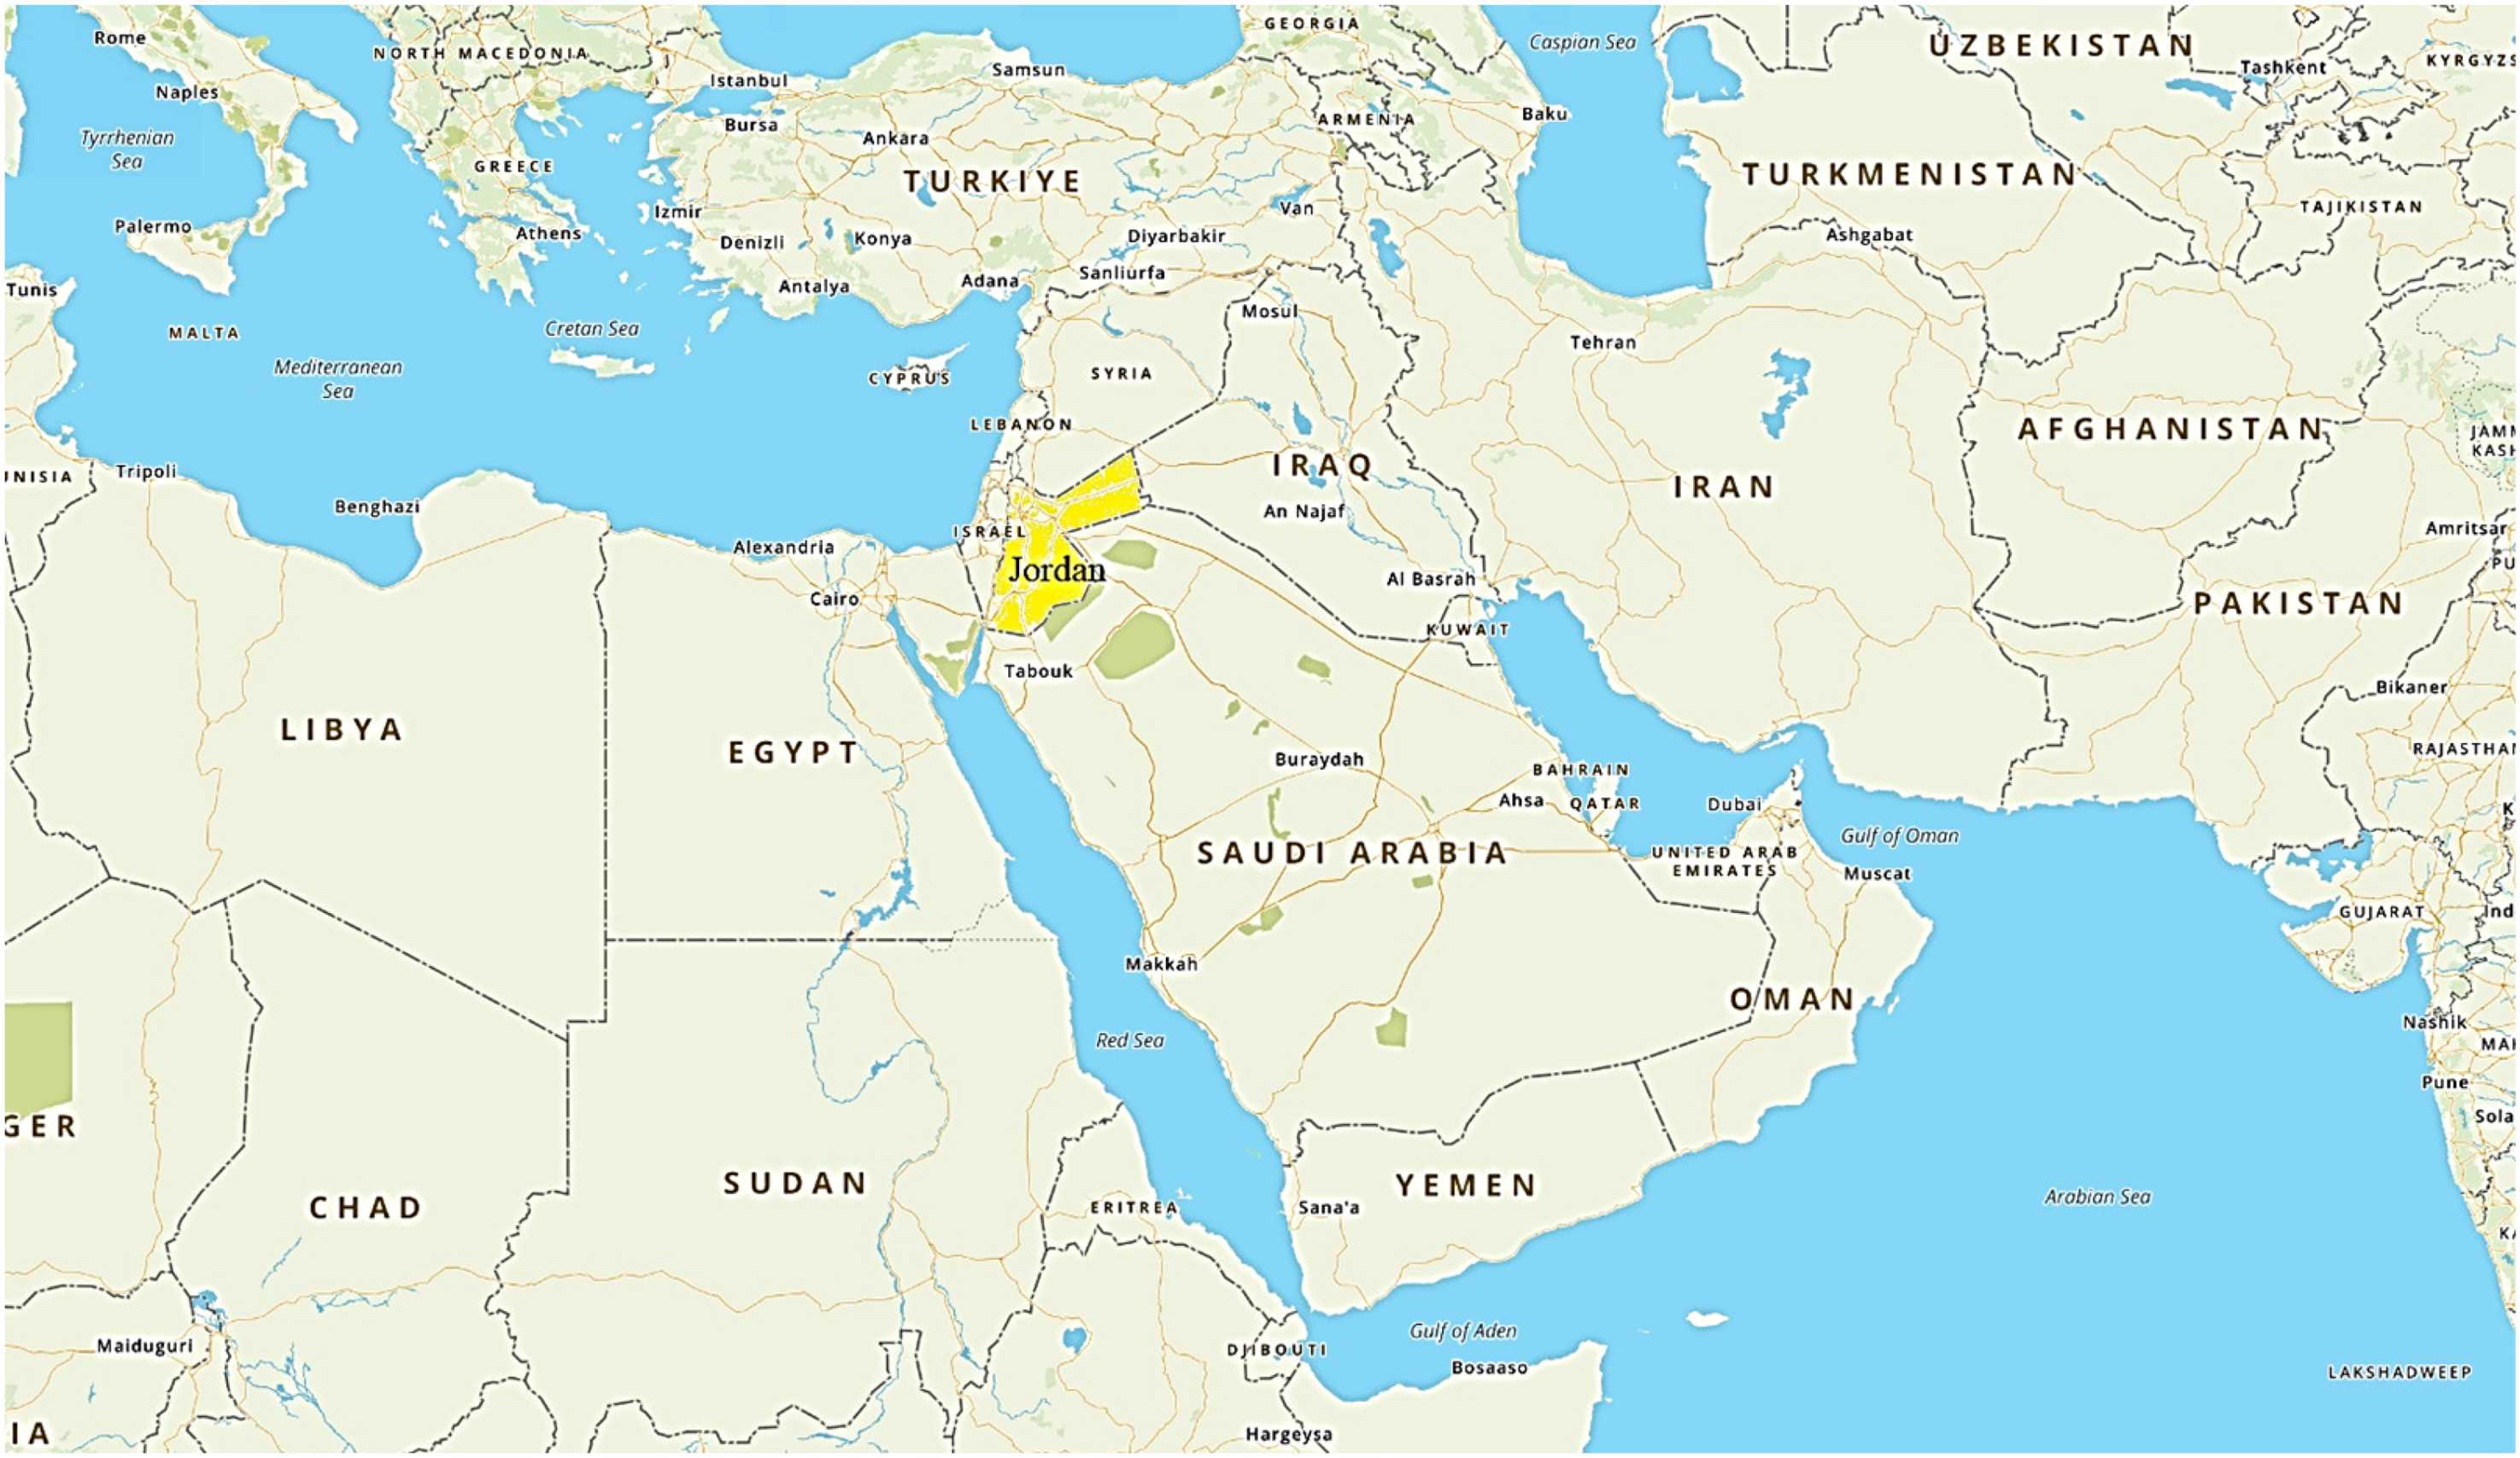
Jordan location (google maps).
Solar energy has rapidly become one of the fastest-growing and most cost-effective renewable energy technologies globally. In 2019, nearly 75 GWp of utility-scale photovoltaic (PV) systems were installed worldwide, along with 40 GWp of distributed PV systems (Alrwashdeh, 2022). Distributed PV systems, typically installed on residential or industrial rooftops, are often fixed tilt, as tracking systems are not cost-efficient in regions like Europe due to higher installation and maintenance costs (MEMR, 2020).
The global installation of PV systems continues to rise, driven by their high efficiency and long-term economic benefits. The orientation and tilt angle of PV panels are crucial to maximizing solar energy absorption. Energy capture is optimized by orienting the panels to ensure the sun's rays strike the surface perpendicularly. In the northern hemisphere, this is generally achieved by orienting panels toward the south, with specific adjustments made for azimuth and tilt angles based on seasonal variations, geographical location, and energy demand patterns. This alignment can be particularly effective when it coincides with local demand peaks, such as during hot summer afternoons in Jordan.
In Jordan, the adoption of solar power has grown rapidly, particularly in residential and medium-sized commercial sectors. The number of PV systems connected to the national grid rose from 9603 in 2018 to 24,157 by the end of 2020, with 9018 systems added in 2020 alone (Alrwashdeh, 2022). This rapid increase reflects the growing contribution of solar energy to the country's overall energy production and its increasing role in meeting the nation's electricity needs.
However, despite the significant growth in PV installations, the country faces a critical challenge. Solar panels generate their maximum power around noon, while Jordan's peak electricity demand occurs in the late afternoon and evening hours. This discrepancy means the peak demand issue persists even with more PV systems installed. Residential and commercial consumers continue to draw heavily on the grid during the evening hours, creating strain on the energy system. In the next section, we discuss the key issues facing PV systems in Jordan and explore potential solutions.
One of the primary issues with PV systems is the mismatch between the time producing solar energy from PV and the time energy is needed by residents (Rahman et al., 2021). In Jordan, the residential sector, one of the largest energy consumption ratios (Monna et al., 2022), experiences peak electricity demand in the late afternoon and evening hours. This peak pressures the national electrical grid, requires high costs to import energy resources, and threatens grid stability and reliability.
Solar panels, however, generate maximum power during the midday hours, which does not align with the evening peak demand. While the traditional orientation of PV panels in the northern hemisphere is towards the south to maximize annual energy yield, this setup exacerbates the mismatch. As a result, solar energy produced during the day is not available to meet the high demand in the evening, causing inefficiencies. The mismatch between production and demand is one of Jordan's largest obstacles to PV adoption. Ensuring grid stability and reliability while managing peak demand is essential for energy security (Alasmar et al., 2023). The high costs of meeting peak demand further highlight the need for more efficient solutions.
However, solutions to this problem, such as hydro storage, compressed air energy storage, electrochemical batteries, flow batteries, and hydrogen fuel cells—technologies often used for peak shaving—present significant challenges for implementation in Jordan. These technologies are capital-intensive and require substantial operational and maintenance costs. For instance, while effective in some regions, hydro storage is infeasible in Jordan due to its arid climate and limited water resources. Similarly, compressed air energy storage demands specific geological conditions that are not widely available in the country. Though promising for short-term energy storage, electrochemical and flow batteries remain expensive and have limited lifespans, further increasing the economic burden. Hydrogen fuel cells, while a sustainable option, face high costs related to production, storage, and infrastructure development, making them unsuitable for widespread deployment in Jordan's current energy landscape (Rahman et al., 2021).
Given these limitations, alternative approaches have garnered attention. Recent trends suggest that changing the orientation of PV panels could shift the peak production hours, thereby aligning solar energy generation with residential demand, offering a potential solution to this issue, particularly in Jordan's context, where the grid struggles to accommodate the energy produced during off-peak hours.
Recently, significant research has explored the impact of different tilt angles and orientations on the performance of PV systems. One emerging trend is orienting PV panels in directions other than the traditional south-facing setup, such as east and West. Studies have claimed that this approach could improve system performance in specific scenarios, particularly when accounting for time-of-use tariffs. For instance, (Hussein et al., 2004) evaluated the theoretical performance of mono-Si PV modules at various tilt angles and orientations in Cairo's climatic conditions. Their results demonstrated that adjusting the tilt and orientation could enhance energy yield under specific meteorological conditions.
Further investigation into the impact of PV panel orientations on system performance was conducted (Lahnaoui et al., 2017), who focused on the effect of tilt and orientation on the techno-economic performance of a PV battery system installed in Germany. Their study found that east-west-oriented rooftops helped balance energy production between midday and evening hours, thus optimizing self-consumption. In a subsequent study, Lahnaoui expanded their research to consider various PV system configurations and orientations, highlighting that non-south-facing orientations, like east and West, can enhance local energy consumption, particularly during peak demand, supporting grid stability and reducing external energy reliance (Lahnaoui et al., 2018).
Velik proposed an innovative approach by studying east-south-west orientations of PV systems. His research emphasized the potential of such configurations to increase local energy consumption, decrease energy imports (Velik, 2014), and improve energy security in residential buildings. Meanwhile, Azaioud evaluated different PV orientations for individual residential consumers in the northern hemisphere. Their findings emphasized the shift from traditional south-facing panels to east-west orientations due to the introduction of time-of-use tariffs. These tariffs not only focus on total energy consumption but also on the timing of energy consumption, which aligns better with east-west orientations that match demand patterns more closely. Key findings from Azaioud include the self-sufficiency index (SSI), which increased by nearly 0.94 percentage points for east/west-oriented PV installations. self-consumption index (SCI): Increased by 6.46 percentage points, indicating improved alignment with load demand patterns. Peak Reduction: A marginal reduction in peak shaving, suggesting a limited impact on peak load reduction. Battery Utilization: A 6% reduction in discharge cycles, indicating potential for longer battery life and reduced maintenance (Azaioud et al., 2020).
Although east/west-oriented PV systems produce less total energy than south-oriented ones, they offer important advantages, such as improved self-consumption and reduced grid dependency. This aligns with findings from several other studies, indicating that optimizing the orientation of PV systems can enhance efficiency and economics by shifting peak production to better match demand, reducing the need for costly energy storage solutions.
For residential consumers, east-west orientations can enhance the SCI and SSI, reducing electricity bills and dependence on the grid under time-of-use tariffs. Optimized PV orientations in commercial settings like those studied in Poland contribute to national grid stability while providing economic benefits. This body of research demonstrates that different PV orientations present a viable solution for aligning energy production with peak demand and improving grid stability.
However, a gap exists in the literature evaluating different PV orientations, specifically in Jordan. To date, no study has analyzed the performance of various orientations monthly or hourly in Jordan, particularly in the context of the new time-of-use tariff system. This research aims to fill this gap by investigating the optimal orientation of PV panels to meet peak demand hours in Jordan, focusing on reducing grid reliance and improving the efficiency of residential PV systems. The next section will discuss the research objectives and methodology for this study.
The optimal PV panel orientations for peak demand management vary by region: in the California Independent System Operator (CAISO) market, panels should be oriented towards southwestern azimuths, while in Germany, slightly southeastern azimuths are preferred. In Finland, curtailment strategies do not influence revenues due to the absence of negative electricity prices during sunlight hours. The study highlights that these orientations are strategically adjusted to enhance revenue generation during peak demand rather than being strictly based on latitude and longitude. Another study indicates that the optimal PV panel orientations for peak demand management in Pakistan vary by season: a tilt angle of 12° is recommended for summer to enhance power generation, while a tilt angle of 48° is suitable for winter. These angles are designed to maximize electricity output during extreme weather conditions, addressing the increased demand for power. The study emphasizes that fixed tilt angles, typically aligned with latitude, result in lower efficiency, highlighting the need for region-specific adjustments (Khasawneh et al., 2015), (Riaz and Repo, 2024) . Similarly, research suggests that west-facing panels can better align with residential demand. The optimal orientation varies depending on community-level objectives and demand profiles, which can be analyzed through the developed simulation testbed, allowing for tailored solutions based on specific local conditions rather than a one-size-fits-all approach (Khan et al., 2024).
The optimal PV panel orientations for peak demand management vary by location, as determined by the study's optimization model. It suggests that while the general rule of thumb is to face panels south with a tilt equal to latitude, other orientations may yield higher power generation depending on specific climatic conditions. The model's results indicate that azimuth angles can be adjusted, such as a maximum westward azimuth angle of 50 degrees with a tilt of 20 degrees for certain regions (Pigott et al., 2023).
The primary objective of this research is to investigate the optimization of PV panel orientations in Amman, Jordan, to align energy production with peak demand periods. This can potentially reduce the need for costly energy storage solutions and enhance the efficiency of residential PV systems. The study will evaluate the performance of different PV orientations—south, east, West, and east-west—through simulation using the PVsyst software. The objective is to determine which orientations maximize energy production during peak demand times, particularly during the afternoon peak hours, and assess their potential to reduce electricity costs and grid dependency under a time-of-use tariff system. By optimizing PV orientations, this research aims to improve the sustainability and efficiency of the energy sector in Jordan.
Methodology
The research problem addresses the mismatch between energy production and demand in residential PV systems in Jordan, particularly under the constraints of the new time-of-use tariff system. While most PV systems in Jordan are south-oriented to maximize annual energy yield, this orientation does not align with peak electricity demand in the afternoon and evening. Consequently, excess energy is injected into the grid midday, while reliance on the grid remains high during peak hours, leading to inefficiencies and higher costs. This study explores whether optimizing PV panel orientations, such as east, west, or east-west configurations, can better align energy production with peak demand periods. By conducting detailed simulations using PVsyst 8.0.4, the research evaluates the energy production, performance ratios, and hourly trends for different orientations to determine the most effective solution for improving energy efficiency and reducing grid dependency in residential settings.
PVsyst software was the optimum choice for the study. PVsyst software is powerful and versatile PC software designed for the simulation, sizing, and detailed analysis of PV systems. Architects, engineers, and researchers widely use it for its comprehensive capabilities in studying grid-connected, stand-alone, pumping, and DC-grid PV systems. The software includes extensive meteorological and PV component databases and advanced solar energy tools, making it highly suitable for both professional and educational purposes.
PVSYST plays a crucial role in optimizing the performance of PV systems by providing comprehensive tools for design, simulation, and performance analysis. It allows for the precise definition of geographical locations, electrical load demands, and component selection, which are essential for designing efficient on-grid PV systems, as demonstrated in a study focused on a Babil City, Iraq school. This study highlighted the economic and environmental benefits of using PVSYST, such as a significant reduction in carbon emissions and a favorable economic return within a decade (Naraghi and Atefi, 2022). Additionally, PVSYST is instrumental in addressing shading issues, a major challenge in PV system performance. By integrating with 3D modeling software like SketchUp, PVSYST can simulate and evaluate system efficiency under various conditions, optimizing module layout and enhancing overall system performance (Al Sarhan, 2024).
Furthermore, PVsyst simulation capabilities are complemented by advanced techniques like the incremental conductance algorithm for maximum power point tracking (MPPT), which improves power generation efficiency under fluctuating sunlight conditions (Yu et al., 2024). The software also supports analyzing different system configurations, such as series-parallel and total cross-tied, to optimize power output during mismatch conditions (Yahaya et al., 2024). Overall, PVsyst is a vital tool in designing and optimizing PV systems, offering detailed insights into energy generation, conversion efficiency, and the economic viability of solar energy projects (Tamalouzt et al., 2023).
Recent advancements in PV system design have increasingly emphasized optimizing panel orientation—both azimuth and tilt—as a critical factor influencing energy output, economic viability, and system-grid compatibility. Multi-objective optimization frameworks, such as those proposed by Kurdi et al. [29], integrate orientation into urban energy planning by balancing technical and economic goals, including self-consumption, self-sufficiency, and payback period. These frameworks often allocate PV panels across various orientations (e.g., south-west or east-west) rather than defaulting to a uniform south-facing configuration, which helps align production with late-afternoon demand peaks and enhances performance under time-of-use (TOU) tariffs (Kurdi et al., 2022), (Baqir and Channi, 2022).
Economic and regulatory contexts significantly influence optimal orientation strategies. Studies have shown that in TOU markets, westward-facing panels yield higher returns by matching peak electricity prices in the late afternoon, while in self-consumption-only models, more diverse orientations with battery storage become optimal. Furthermore, comparative analyses have revealed that while orientation shifts alone offer marginal improvements in some regions, a strategic mix of panel directions can deliver tangible performance and financial gains. At the community scale, east-west layouts have demonstrated superior energy-sharing and load-matching performance under net metering schemes despite slightly lower annual yields compared to south-facing systems (Kurdi et al., 2023).
Figure 2. outlines the step-by-step methodology used in the study to evaluate the performance of various PV panel orientations in Amman, Jordan. It includes stages from site selection and system definition to simulation, performance analysis, comparative assessment, and final recommendations, ensuring a structured and comprehensive analytical flow.
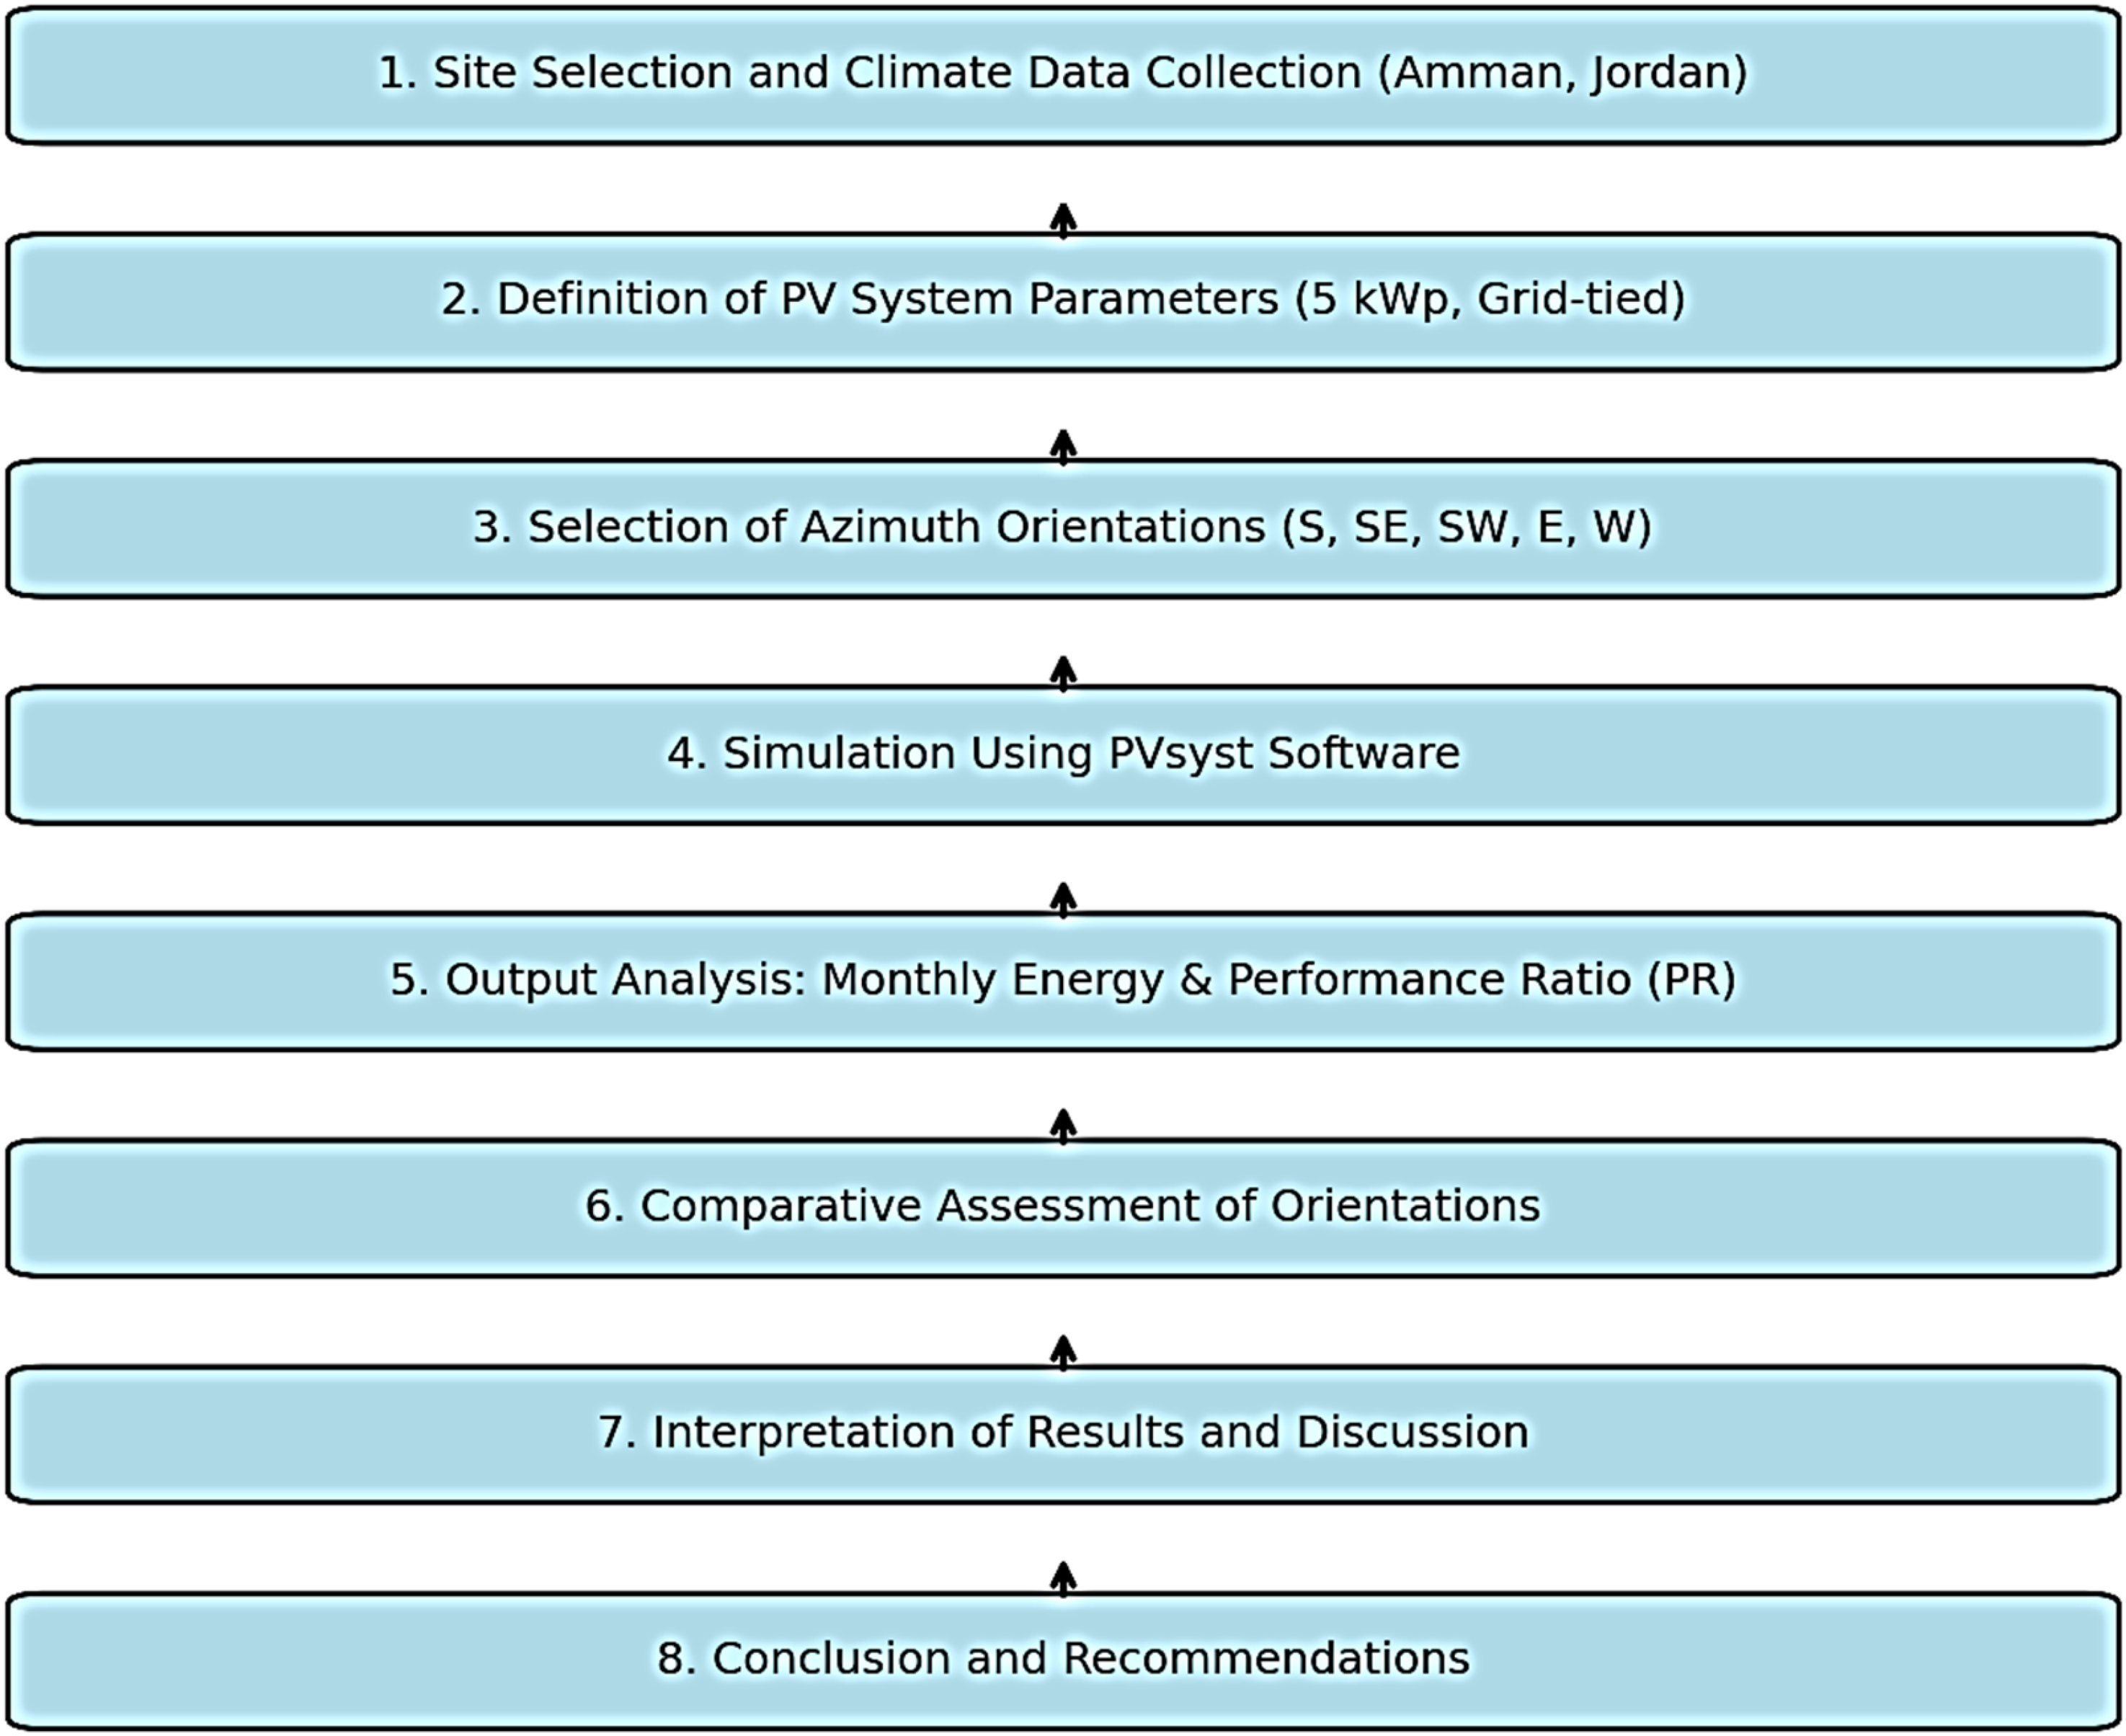
Methodological workflow diagram for PV orientation study.
In lower latitudes, the impact of azimuth on annual energy yield is less pronounced due to consistent solar angles. However, orientation still affects production timing and its ability to match demand (Boesten and Ivens, 2019). Additionally, while tilt angle optimization contributes marginal gains—usually under 10%—it remains relevant for fixed and seasonal systems, with optimal angles closely matching local latitudes. Innovative utility-scale approaches, such as dual-tilt row configurations or shallow east-west rooftop systems, further illustrate how orientation can enhance land-use efficiency and system output, especially in land-constrained or grid-sensitive projects (Christoforidis et al., 2013). Overall, orientation optimization emerges as a highly context-dependent decision, influenced by geographic, economic, and regulatory variables and supported by simulation-driven methodologies (Sankar and Kalathil, 2014).
Key features of PVsyst include preliminary design capabilities for estimations, detailed hourly simulations for project-specific analysis, and a variety of utilities for performance evaluation. The software allows users to define parameters such as tilt angle, orientation, and system components. Additionally, PVsyst generates detailed reports and visualizations, including monthly, daily, and hourly performance metrics, enabling users to optimize PV system designs effectively.
The site for this study was selected as the German Jordanian University (GJU) Jabal Amman Campus (31.95276° N, 35.93003° E). This location was chosen because Jabal Amman is one of Amman's most densely populated areas, reflecting high residential energy demand. According to studies on urban residential density in Jordan, areas like Jabal Amman represent urban households’ energy consumption challenges.
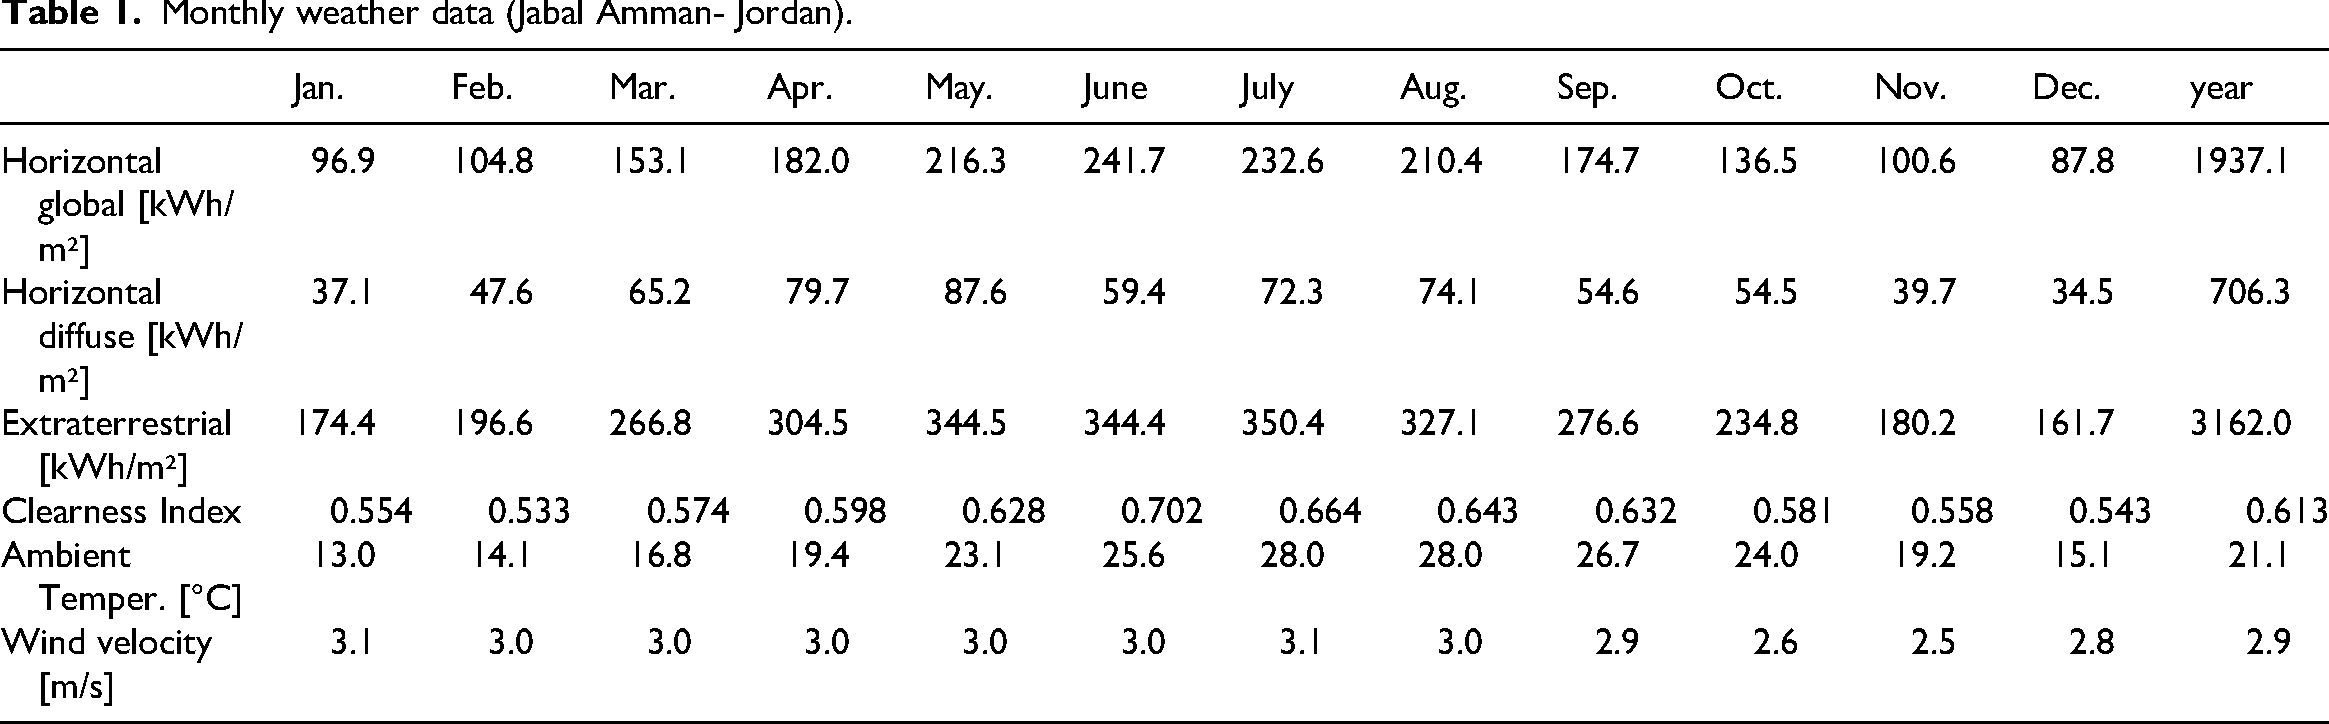
The location was set in PVsyst using its built-in meteorological database, which includes detailed sun path (Figure 3) and monthly weather, as shown in Table 1. These inputs ensure the simulations reflect the actual solar irradiance and temperature conditions at the site.
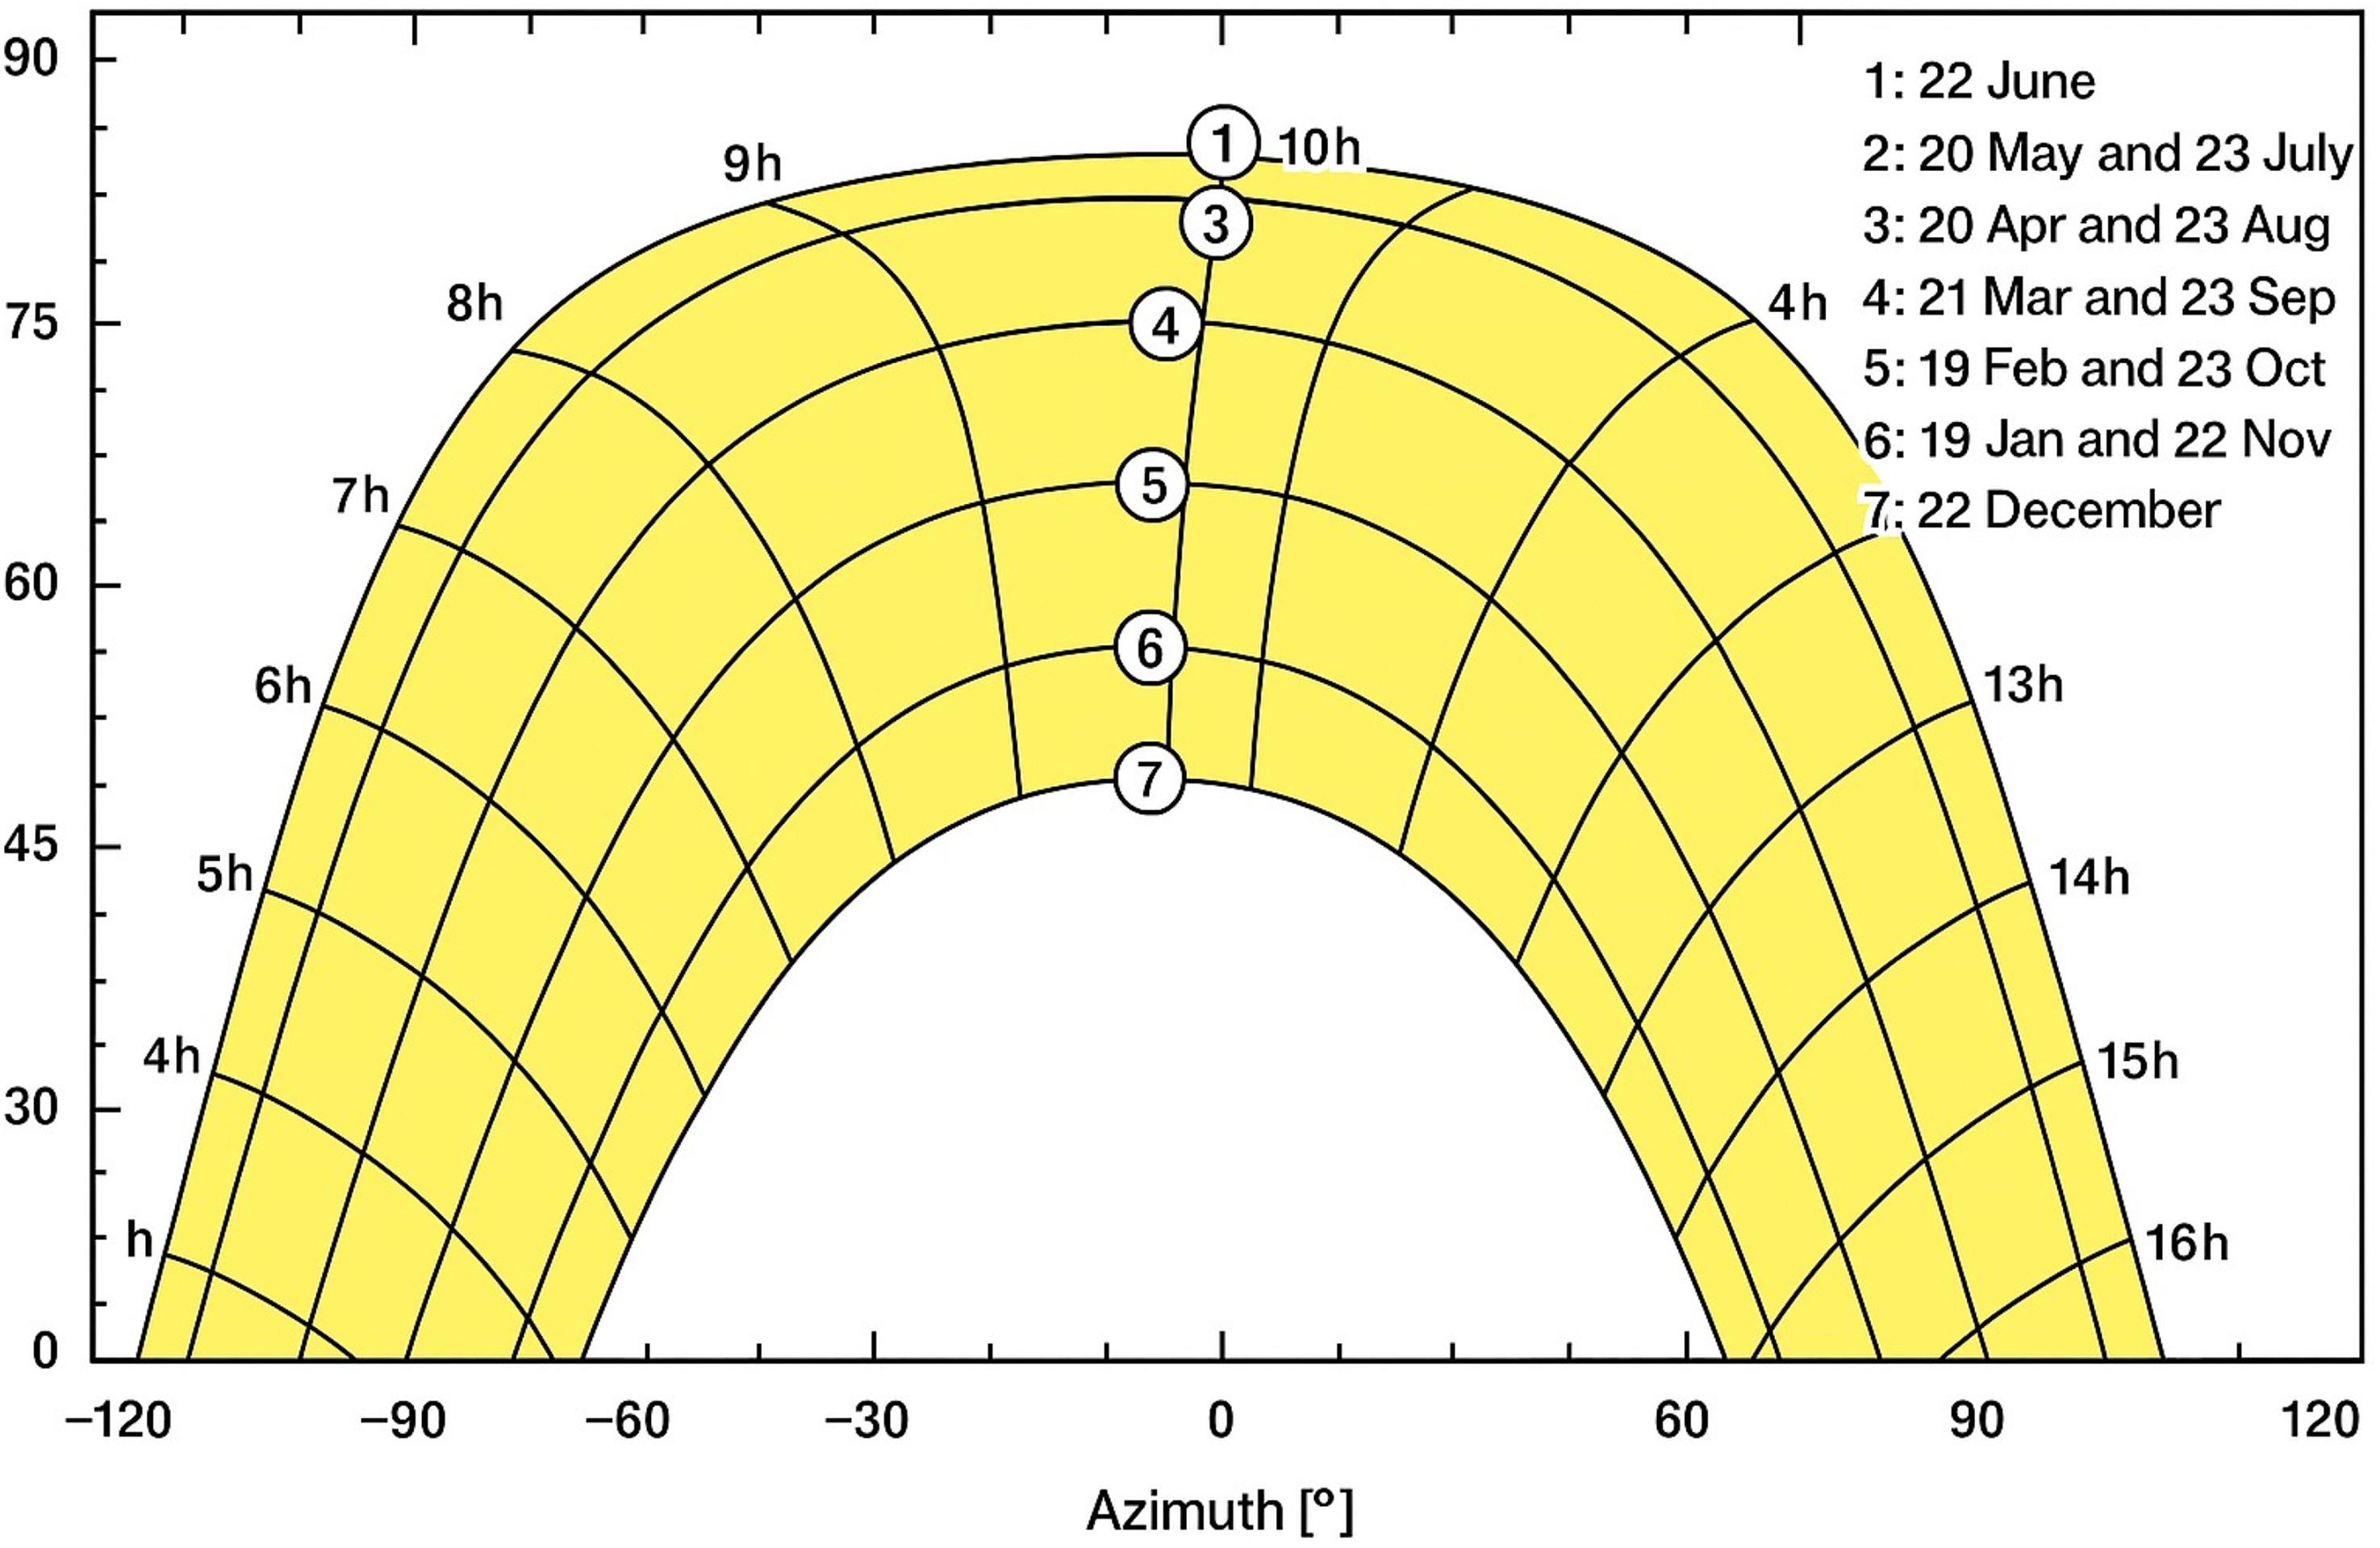
Solar path at Jabal Amman- Jordan.
Monthly weather data (Jabal Amman- Jordan).
A tilt angle of 30° was selected as the optimal angle for maximizing annual solar energy production in Jordan. This is supported by several studies, which identified 30° as the ideal tilt angle for solar applications in Jordan, accounting for the region's latitude and solar declination variations. Further validated 30° as the optimal angle for Jordanian cities, ensuring a balance between diffuse and direct solar radiation. The fixed tilt angle simplifies the system design while providing reliable year-round performance (Elsharif et al., 2023), (Hamzeh et al., 2017), (Yadav et al., 2021).
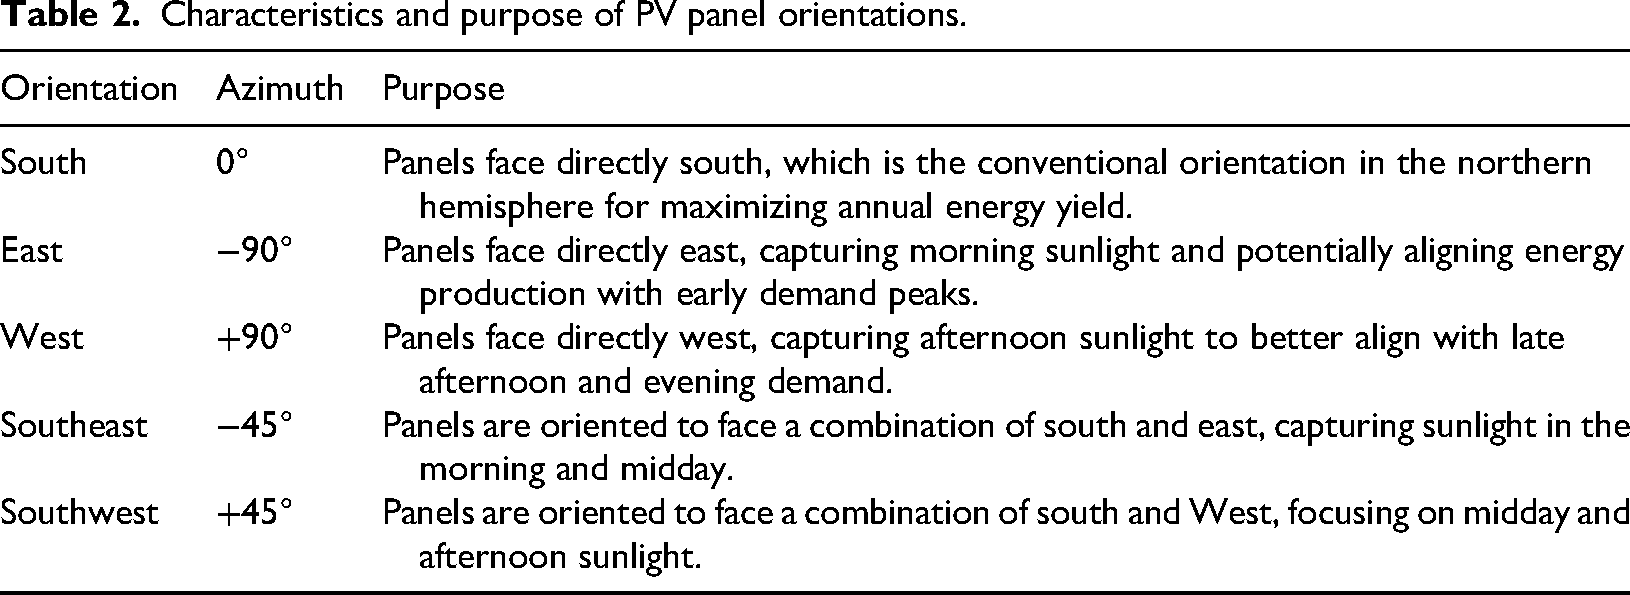
A 5 kWp PV system size was selected for this study, as it represents the most commonly used size for residential applications in Jordan. Several factors support this choice. First, energy consumption patterns indicate that the average electricity consumption in Jordan is approximately 1730 kWh per capita annually (2022) (Al-Habaibeh et al., 2023) . A 5 kWp system is well-suited to meet the electricity needs of a typical household while reducing reliance on the national grid. Second, housing characteristics in Jordan reveal that apartments constitute approximately 70% of the housing market. Given the limited roof space for apartment PV installations, a 5 kWp system offers a practical and efficient solution. Lastly, this system size is highly scalable for urban residential buildings. It aligns with Jordan's current renewable energy policies, making it an ideal choice for promoting sustainable energy solutions in the residential sector. For this study, multiple PV panel orientations were evaluated to assess their performance under different azimuth angles. The orientations and their corresponding azimuth angles are in Table 2.
Characteristics and purpose of PV panel orientations.
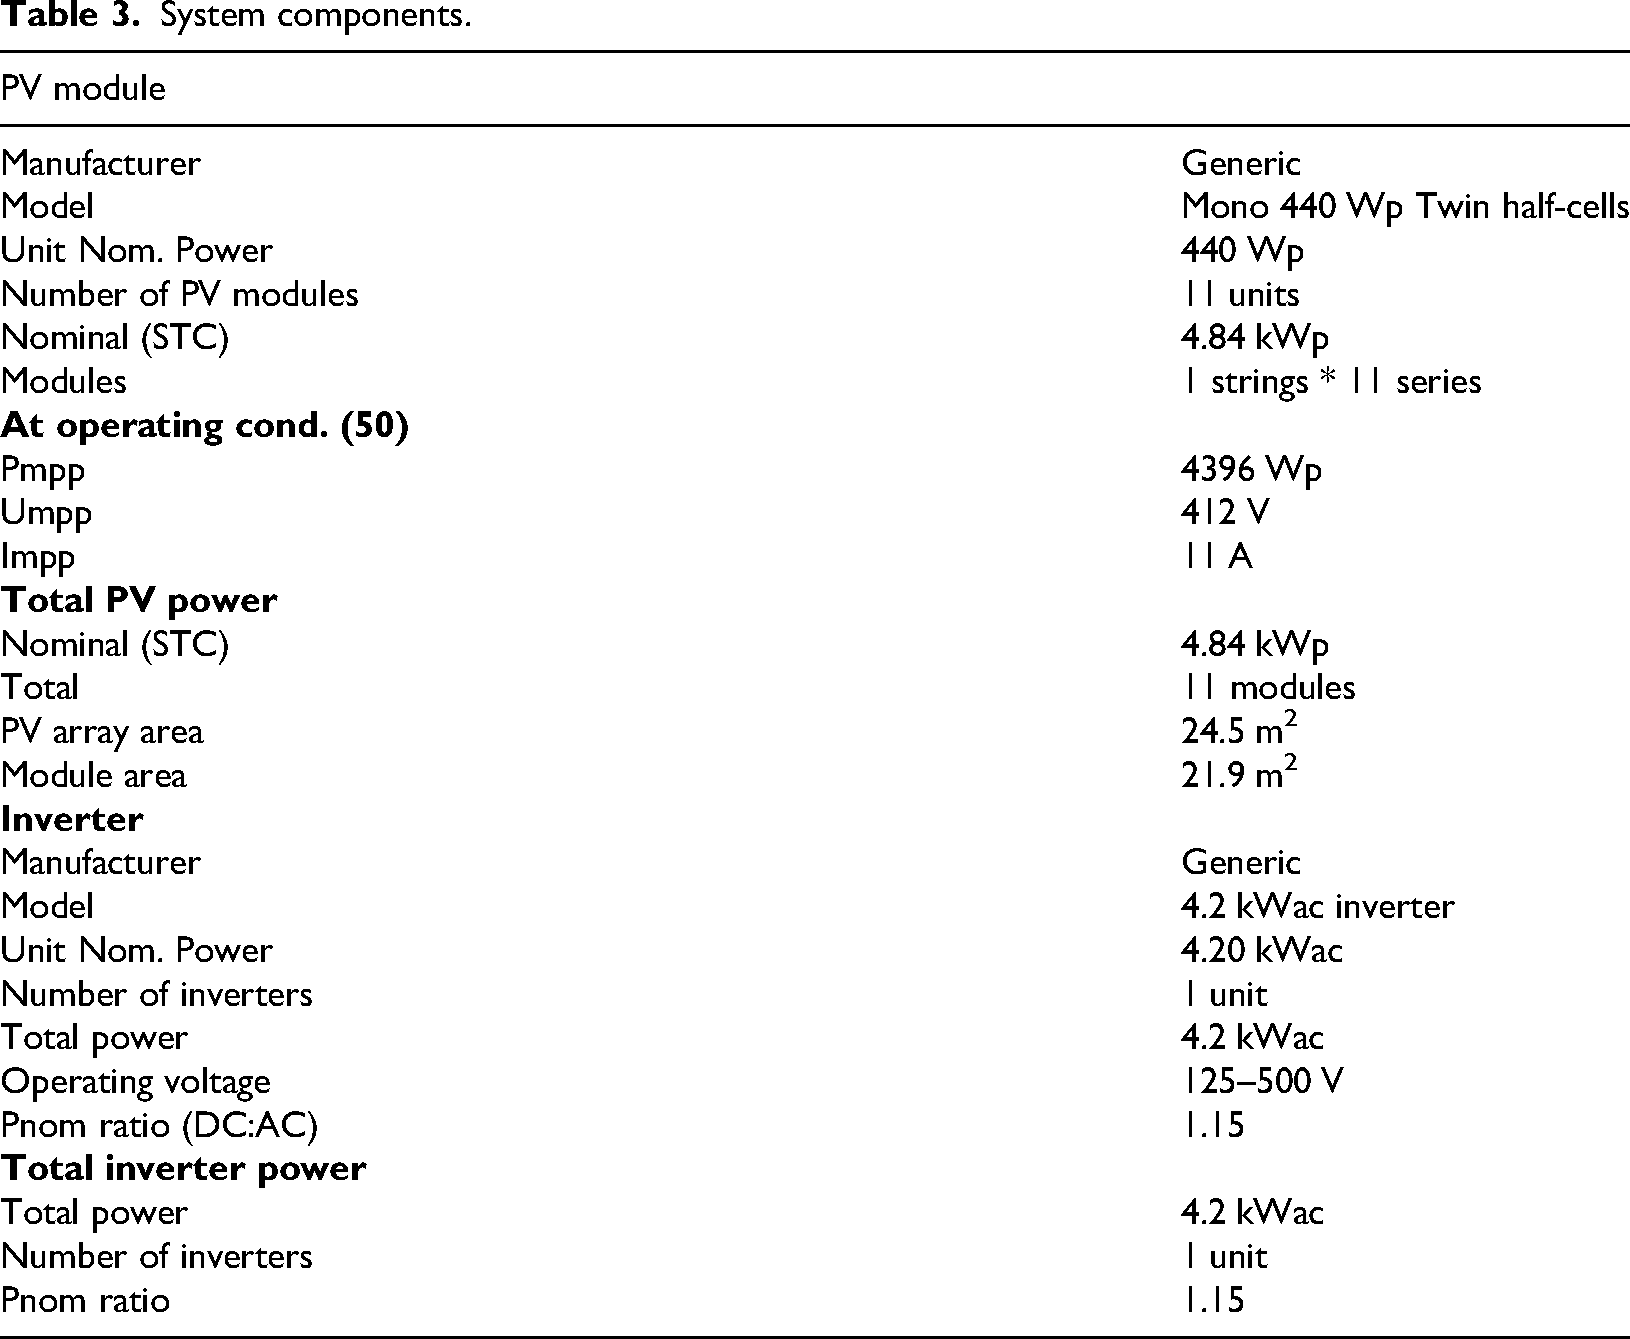
By simulating these orientations, the study aims to determine how varying azimuth angles influence energy production patterns, performance ratios, and their alignment with peak electricity demand in Jordan. This analysis is crucial for identifying the most efficient configuration under the country's new time-of-use tariff system. The PV system was configured using standard parameters for consistency across all simulations. These parameters are outlined in Table 3.
System components.
Detailed simulations were conducted to evaluate the performance of six different PV panel orientations. Key parameters and data were consistently collected and analyzed for each variant, ensuring an objective comparison of energy production, efficiency, and alignment with demand.
Data collected for each variant
Total energy produced: The total annual energy yield for each orientation, measured in kilowatt-hours (kWh/year). Purpose: To compare the overall energy production across all orientations and evaluate their efficiency in terms of total yield.
Performance ratio (PR): The ratio of the actual energy output to the theoretical maximum energy output under ideal conditions. Purpose: To assess the operational efficiency of each system configuration under real-world conditions monthly and annually.
Global horizontal irradiation (GHI): The total solar radiation incident on a horizontal surface. Purpose: To evaluate the solar energy potential and its variation under different weather conditions monthly and annually.
Energy injected into the grid: The energy exported to the grid after meeting local demand. Purpose: To analyze energy distribution throughout the day and assess how well each orientation aligns with peak demand patterns, monthly and annually.
Monthly average hourly energy injection into the grid (kW). Purpose: To gain critical insights into how well each orientation supports energy distribution during peak demand hours.
Hourly graphs for representative days. Purpose: To provide detailed insights into diurnal energy production and its alignment with daily demand cycles.
Data Plotted: Global Horizontal Irradiation (GHI) under actual weather conditions and clear-sky mode.
Energy is injected into the grid over 24 h.
Representative days for each month were chosen using established methodologies for calculating monthly mean solar radiation (See Table 4). These days reflect seasonal variations in solar declination angle (δ), day length (N), and daily extraterrestrial solar radiation. Rationale for Selection: While mid-month days (e.g., day 15) are typically used as representative of monthly means, this study defined representative days based on the variation of solar parameters. Adjustment: Results in some months showed a 1–2-day difference from mid-month estimates, as Klein validated.
Representative days for monthly calculations.

Results and discussions
South orientation
For the south orientation, the total produced energy was 8616.2 kWh/year. Figure 4 presents the energy injected into the grid and the south-facing configuration's performance ratio (PR). The results show that energy injected into the grid is highest during summer months, peaking at 841.3 kWh in June, while the lowest energy output occurs in December at 566.5 kWh. The performance ratio shows seasonal variation, with the highest value recorded in January (0.877) and the lowest in July and August (0.798).
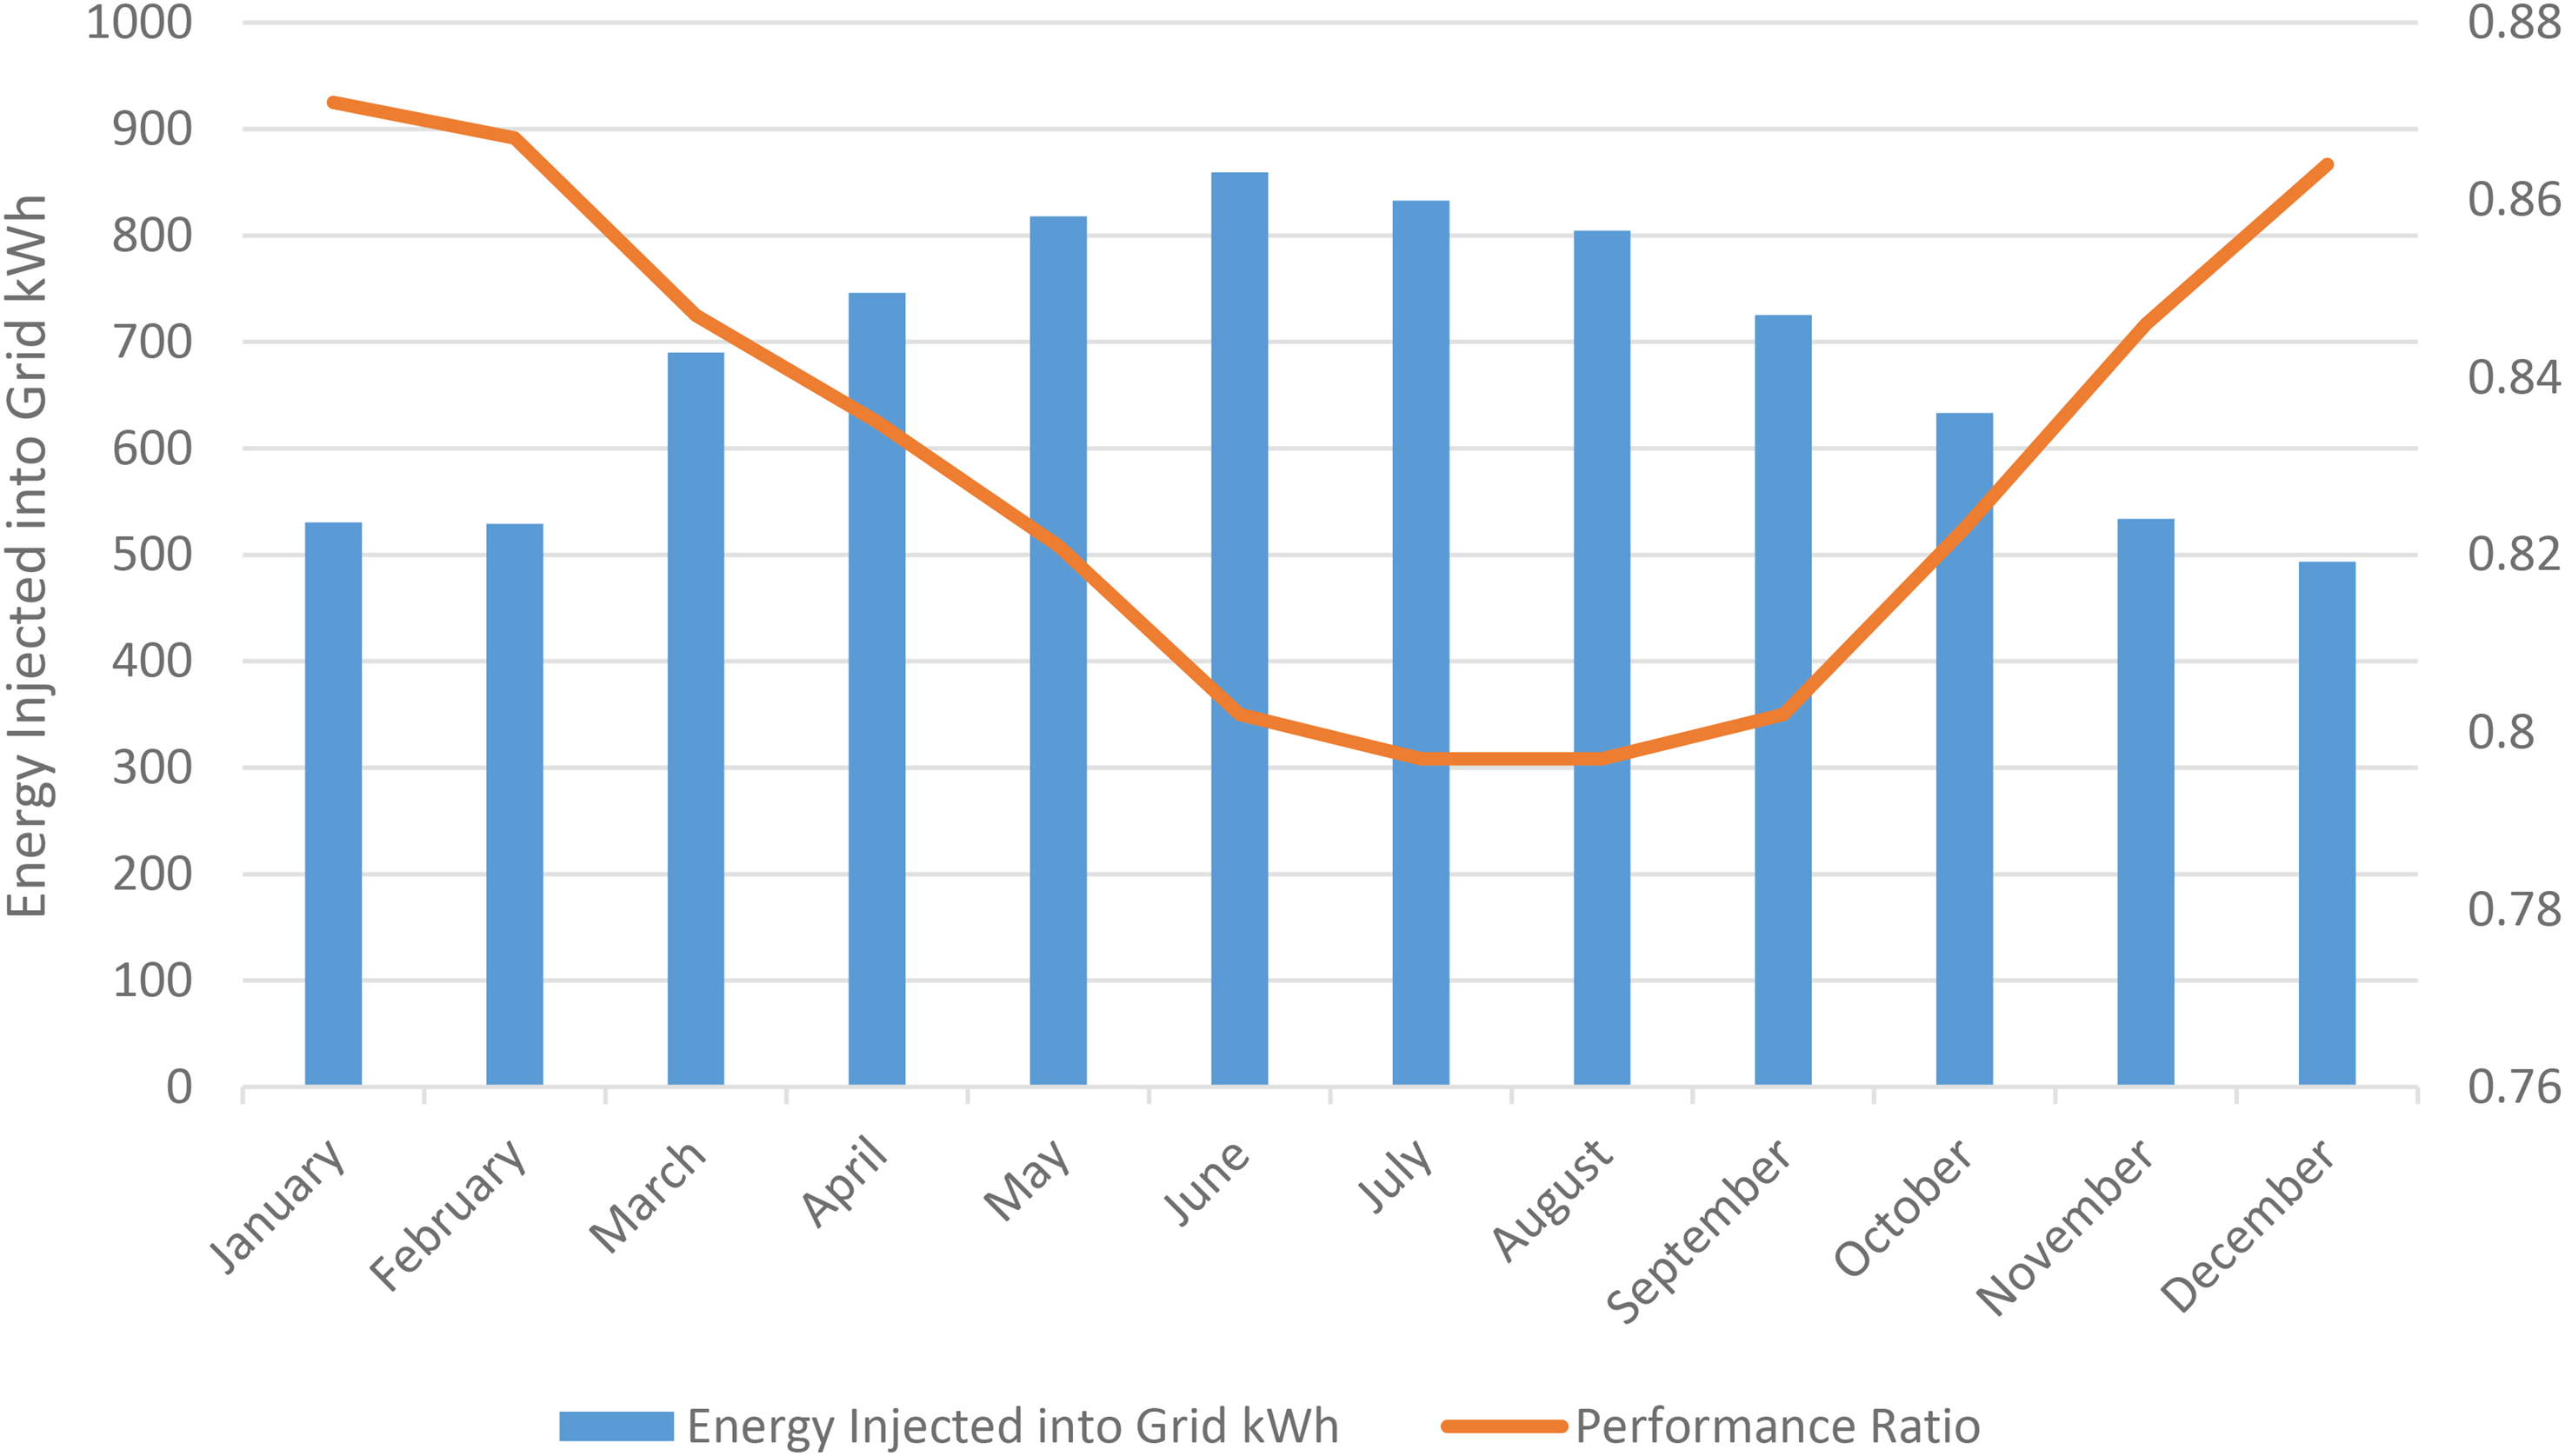
Monthly data (E_Grid - PR) - south orientation.
To further analyze system performance, hourly energy averages were recorded monthly. The hourly distribution of energy injected into the grid. Energy production typically begins around 6H and peaks between 11H and 14H, with maximum solar irradiation levels. The highest hourly energy output occurs in June, reaching 0.85 kW at 12H. To better understand the daily performance of the south-facing system, representative hourly graphs for each month were analyzed. These graphs illustrate the relationship between the global horizontal irradiation (GHI) under clear sky conditions, the normal measured irradiation, and the energy injected into the grid throughout the day. Representative hourly graphs for each month further illustrate the energy production trends for the east-facing system. These graphs show how GHI and energy injected into the grid vary throughout a typical day each month.
East orientation
For the east orientation, the total annual energy production was 7333.0 kWh. Figure 5 presents the monthly energy injected into the grid and the east-facing configuration performance ratio (PR). The results indicate that energy injection peaks in June at 880.2 kWh, while the lowest energy output occurs in December at 352.2 kWh. The performance ratio exhibits seasonal variation, with the highest value recorded in January (0.873) and the lowest in July (0.805). The monthly hourly averages of energy injected into the grid. Energy production typically begins around 6:00 AM, peaking between 9:00 AM and 12:00 PM, aligning with morning sunlight's influence on the east-facing panels.
Monthly data (E_Grid - PR) - east orientation.
West orientation
For the west orientation, the total annual energy production was 7215.4 kWh. Figure 6 presents this configuration of monthly energy injected into the grid and the performance ratio (PR). The energy injected into the grid peaks in June at 867.8 kWh, while the lowest energy output occurs in December at 344.2 kWh. The performance ratio varies throughout the year, with the highest value recorded in January (0.866) and the lowest in July (0.796). The monthly hourly averages of energy injected into the grid. Energy production begins around 10:00 AM, peaks between 2:00 PM and 5:00 PM, and tapers off by sunset, reflecting the afternoon sunlight's impact on the west-facing system.

Monthly data (E_Grid - PR) - west orientation.
Southeast orientation
For the southeast orientation, the total annual energy production was 8278.0 kWh. Figure 7 presents the monthly energy injected into the grid and this configuration's performance ratio (PR). The energy injected into the grid peaks in June at 865.5 kWh, while the lowest energy output occurs in December at 501.4 kWh. The performance ratio demonstrates seasonal variation, with the highest value recorded in January (0.875) and the lowest in July (0.803). The monthly hourly averages of energy injected into the grid. Energy production begins early in the morning, peaking between 9:00 AM and 12:00 PM, and tapers off in the afternoon, reflecting the influence of morning sunlight on the southeast-facing system.

Monthly data (E_Grid - PR) - southeast orientation.
Southwest orientation
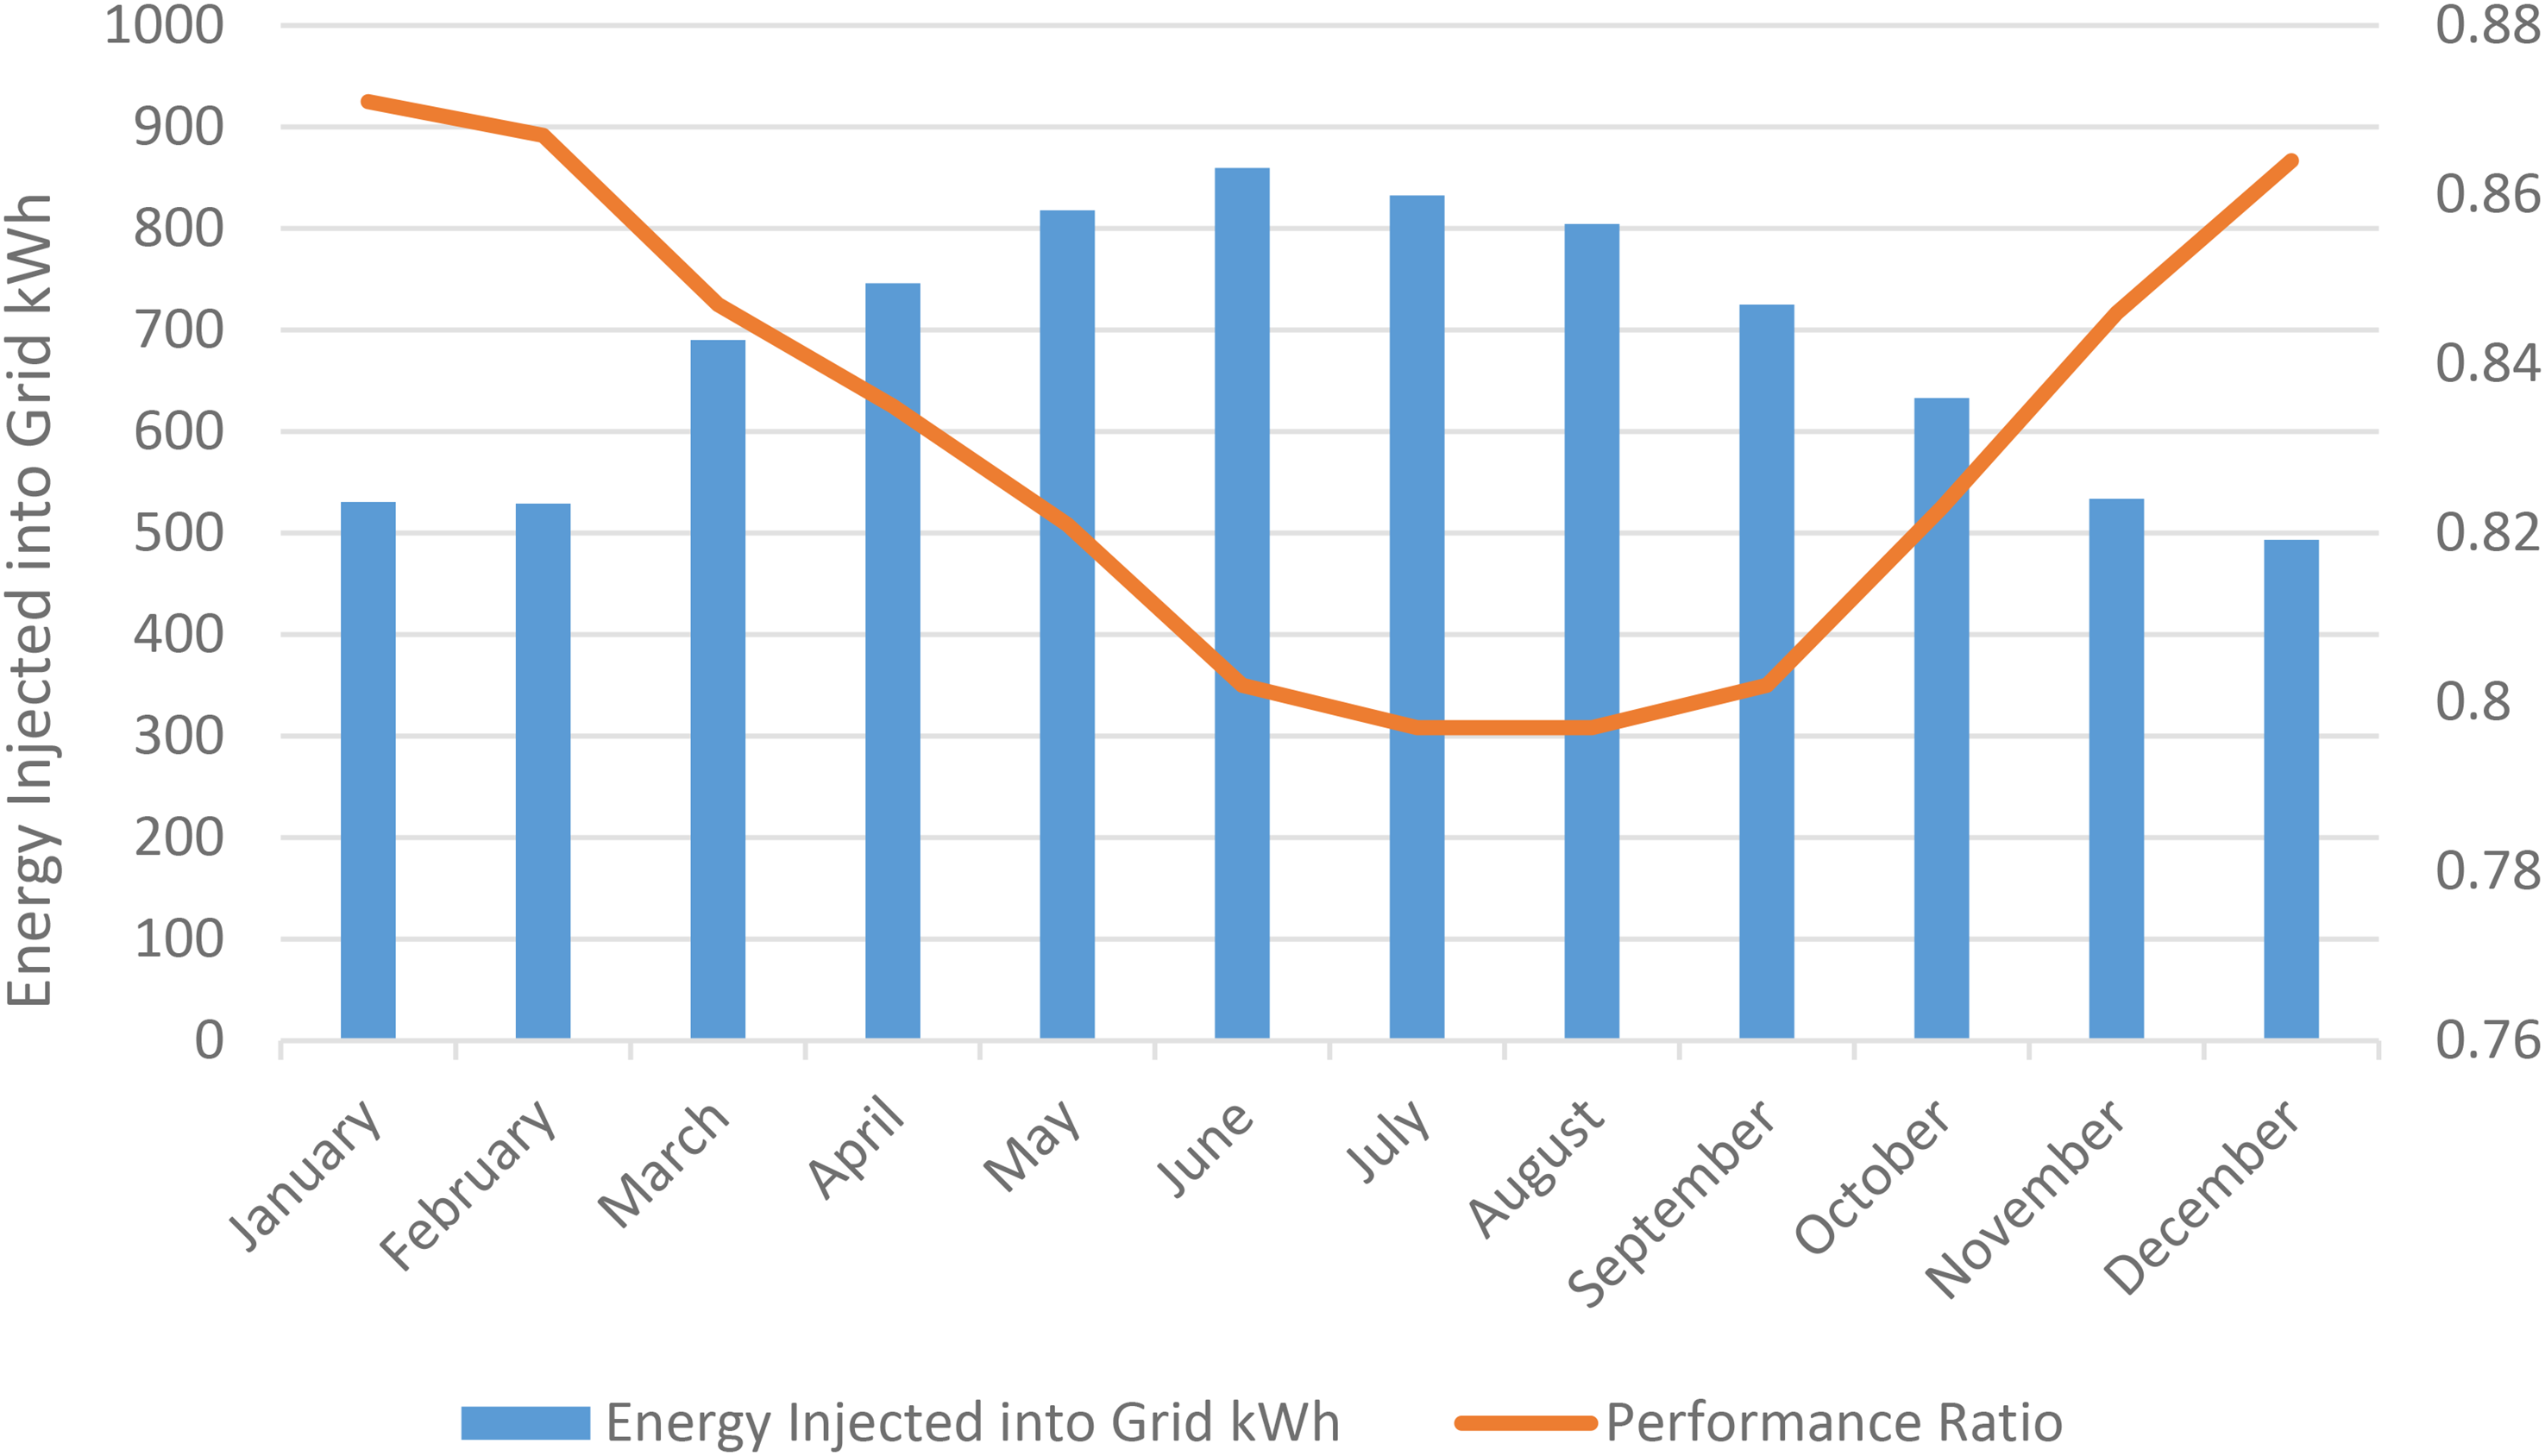
For the southwest orientation, the total annual energy production was 8196.2 kWh. Figure 8 presents the monthly energy injected into the grid and this configuration's performance ratio (PR). The energy injected into the grid peaks in June at 859.5 kWh, while the lowest energy output occurs in December at 493.4 kWh. The performance ratio also varies throughout the year, with the highest value recorded in January (0.871) and the lowest in July (0.797). The monthly hourly averages of energy injected into the grid. Energy production begins late in the morning, peaking between 2:00 PM and 5:00 PM, and tapers off by sunset, reflecting the afternoon sunlight's impact on the southwest-facing system.

Monthly data (E_Grid - PR) – southwest.
The analysis of different solar panel orientations (South, East, West, Southeast, and Southwest) provides valuable insights into the impact of orientation on energy production patterns and alignment with residential electricity demand in Jordan. By examining annual and hourly production data and performance ratios, the study identifies distinct strengths and trade-offs associated with each orientation. These findings highlight the role of orientation in maximizing total energy production and shaping hourly generation profiles that could better align with residential load patterns and facilitate peak demand management.
This study is motivated by the Ministry of Energy and Mineral Resources’ recent implementation of a new ToU tariff system across multiple sectors and its proposal to expand ToU tariffs to the residential sector. Additionally, the Ministry's new regulatory framework, announced on 2nd September 2024, aims to facilitate the integration of renewable energy sources into the national grid. This regulatory development is another key aspect of this investigation. The study highlights the potential of orientation-specific designs in addressing Jordan's energy challenges, particularly in the context of the ToU tariff system's implementation in residential areas and integration of renewable energy into the grid.
The evaluation of solar panel orientations (South, East, West, Southeast, and Southwest) reveals distinct differences in energy production and performance ratios, as illustrated in the figures. These differences highlight orientation's critical role in aligning PV systems with energy needs. As shown in the “Produced Energy Comparison by Orientation” bar chart in Figure 9, each orientation's total annual energy production varies. This comparison highlights the dominance of the South orientation in overall energy production, followed closely by the Southeast and Southwest orientations. East and West orientations produce significantly less energy, making them less favorable regarding total energy output. Since the South orientation generates the highest energy, it is the baseline for comparison. The other orientations produce the following percentages relative to the South orientation: East: 85.1%; West: 83.7%; Southeast: 96.1%; Southwest: 95.1%.
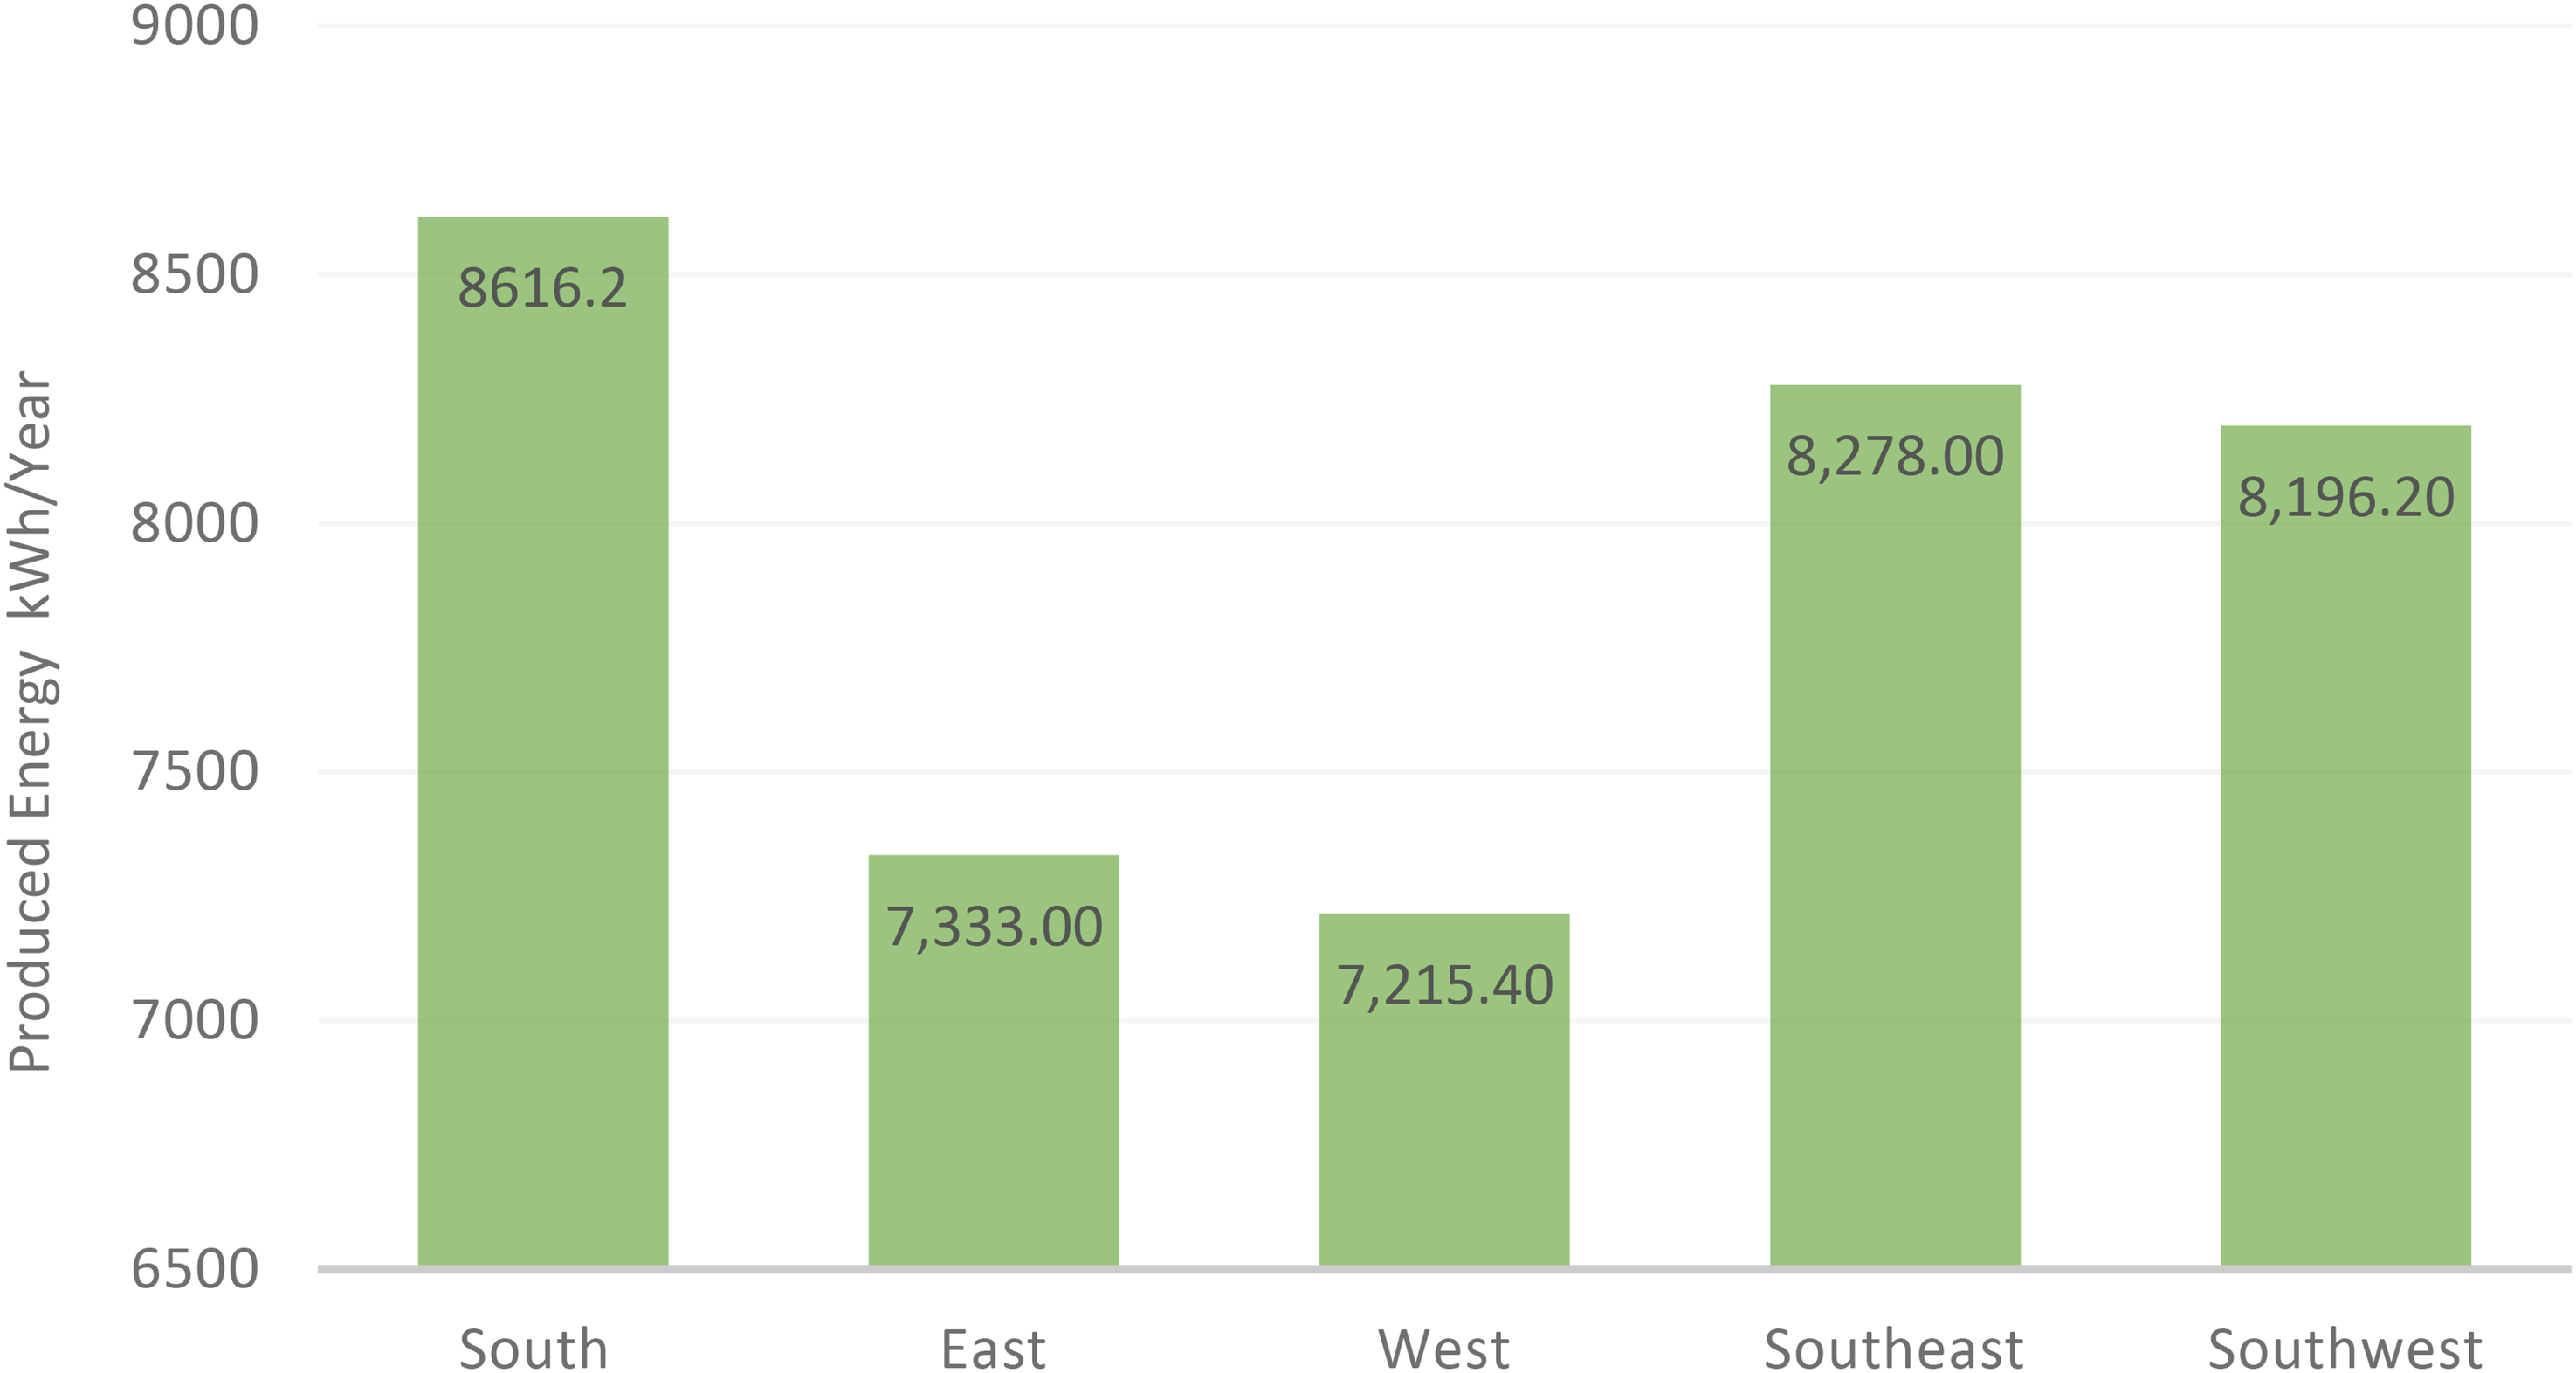
Produced energy across orientation.
Performance ratios (PR), as displayed in the “Performance Ratio” Figure 10, provide insights into the efficiency of each orientation. Despite the South orientation producing the most energy, the East orientation exhibits the highest PR (83.18%), followed closely by the Southeast (83.12%) and Southwest (82.58%). The South orientation has a PR of 82.91%, while the West has the lowest PR (82.4%).
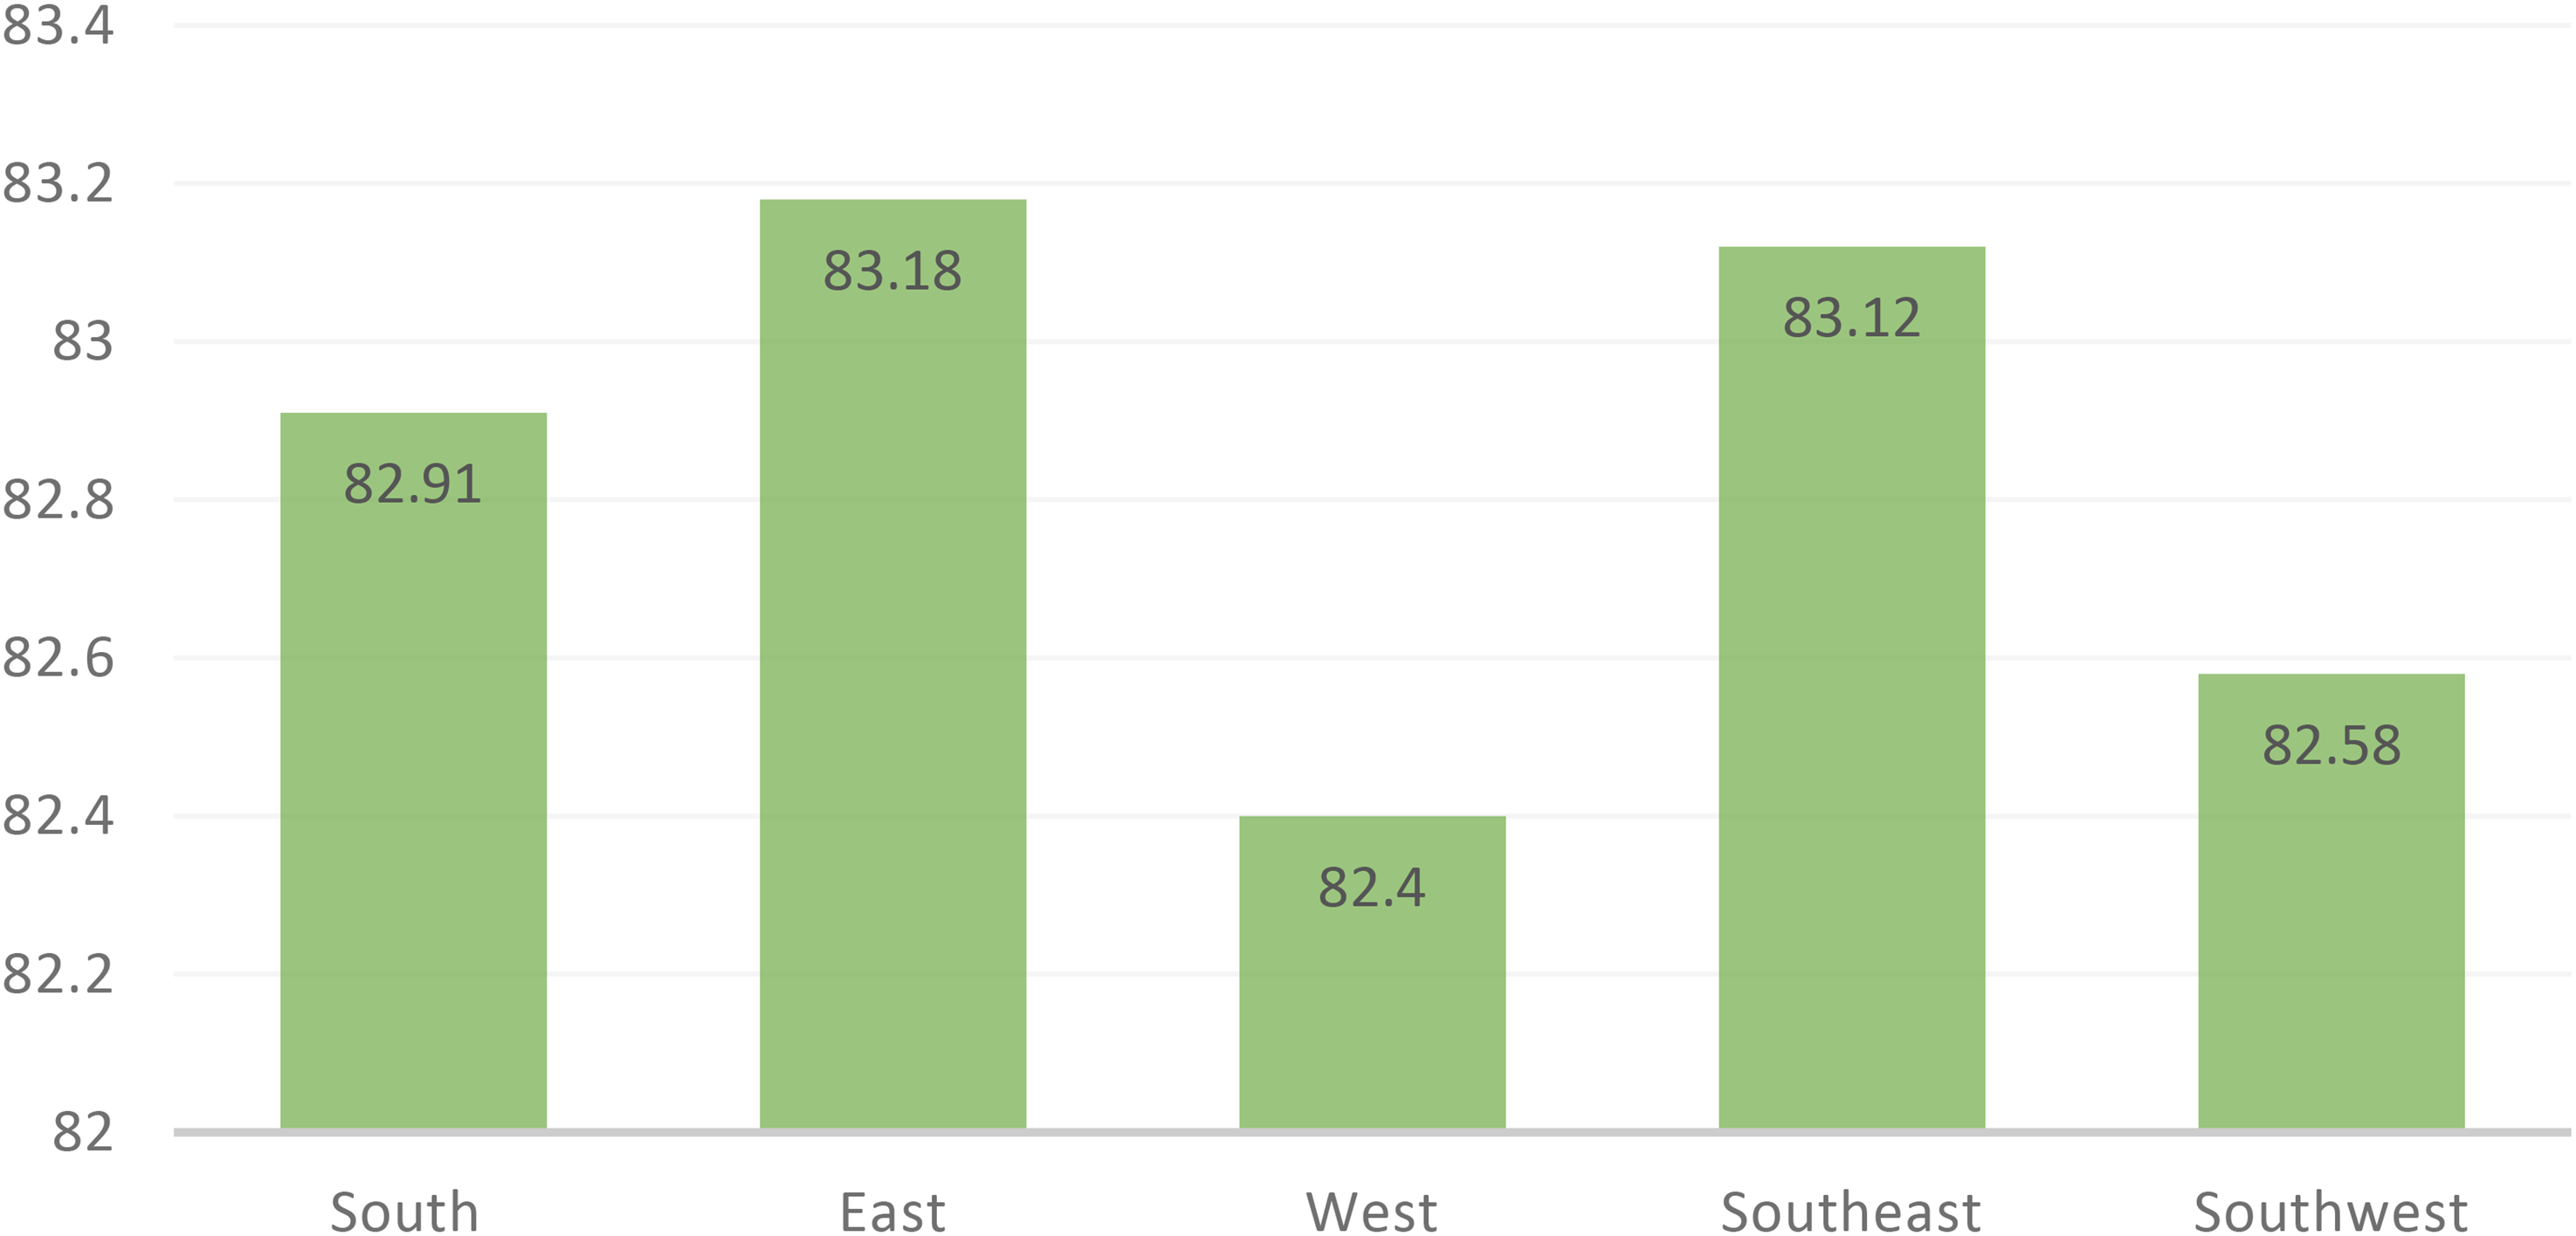
Performance ratio across orientations.
The “Monthly Hourly Average for Energy Injected into the Grid” line (see Figure 11) provides insights into the hourly performance trends for various orientations. The chart shows energy production patterns across the day and highlights the specific advantages of each orientation.
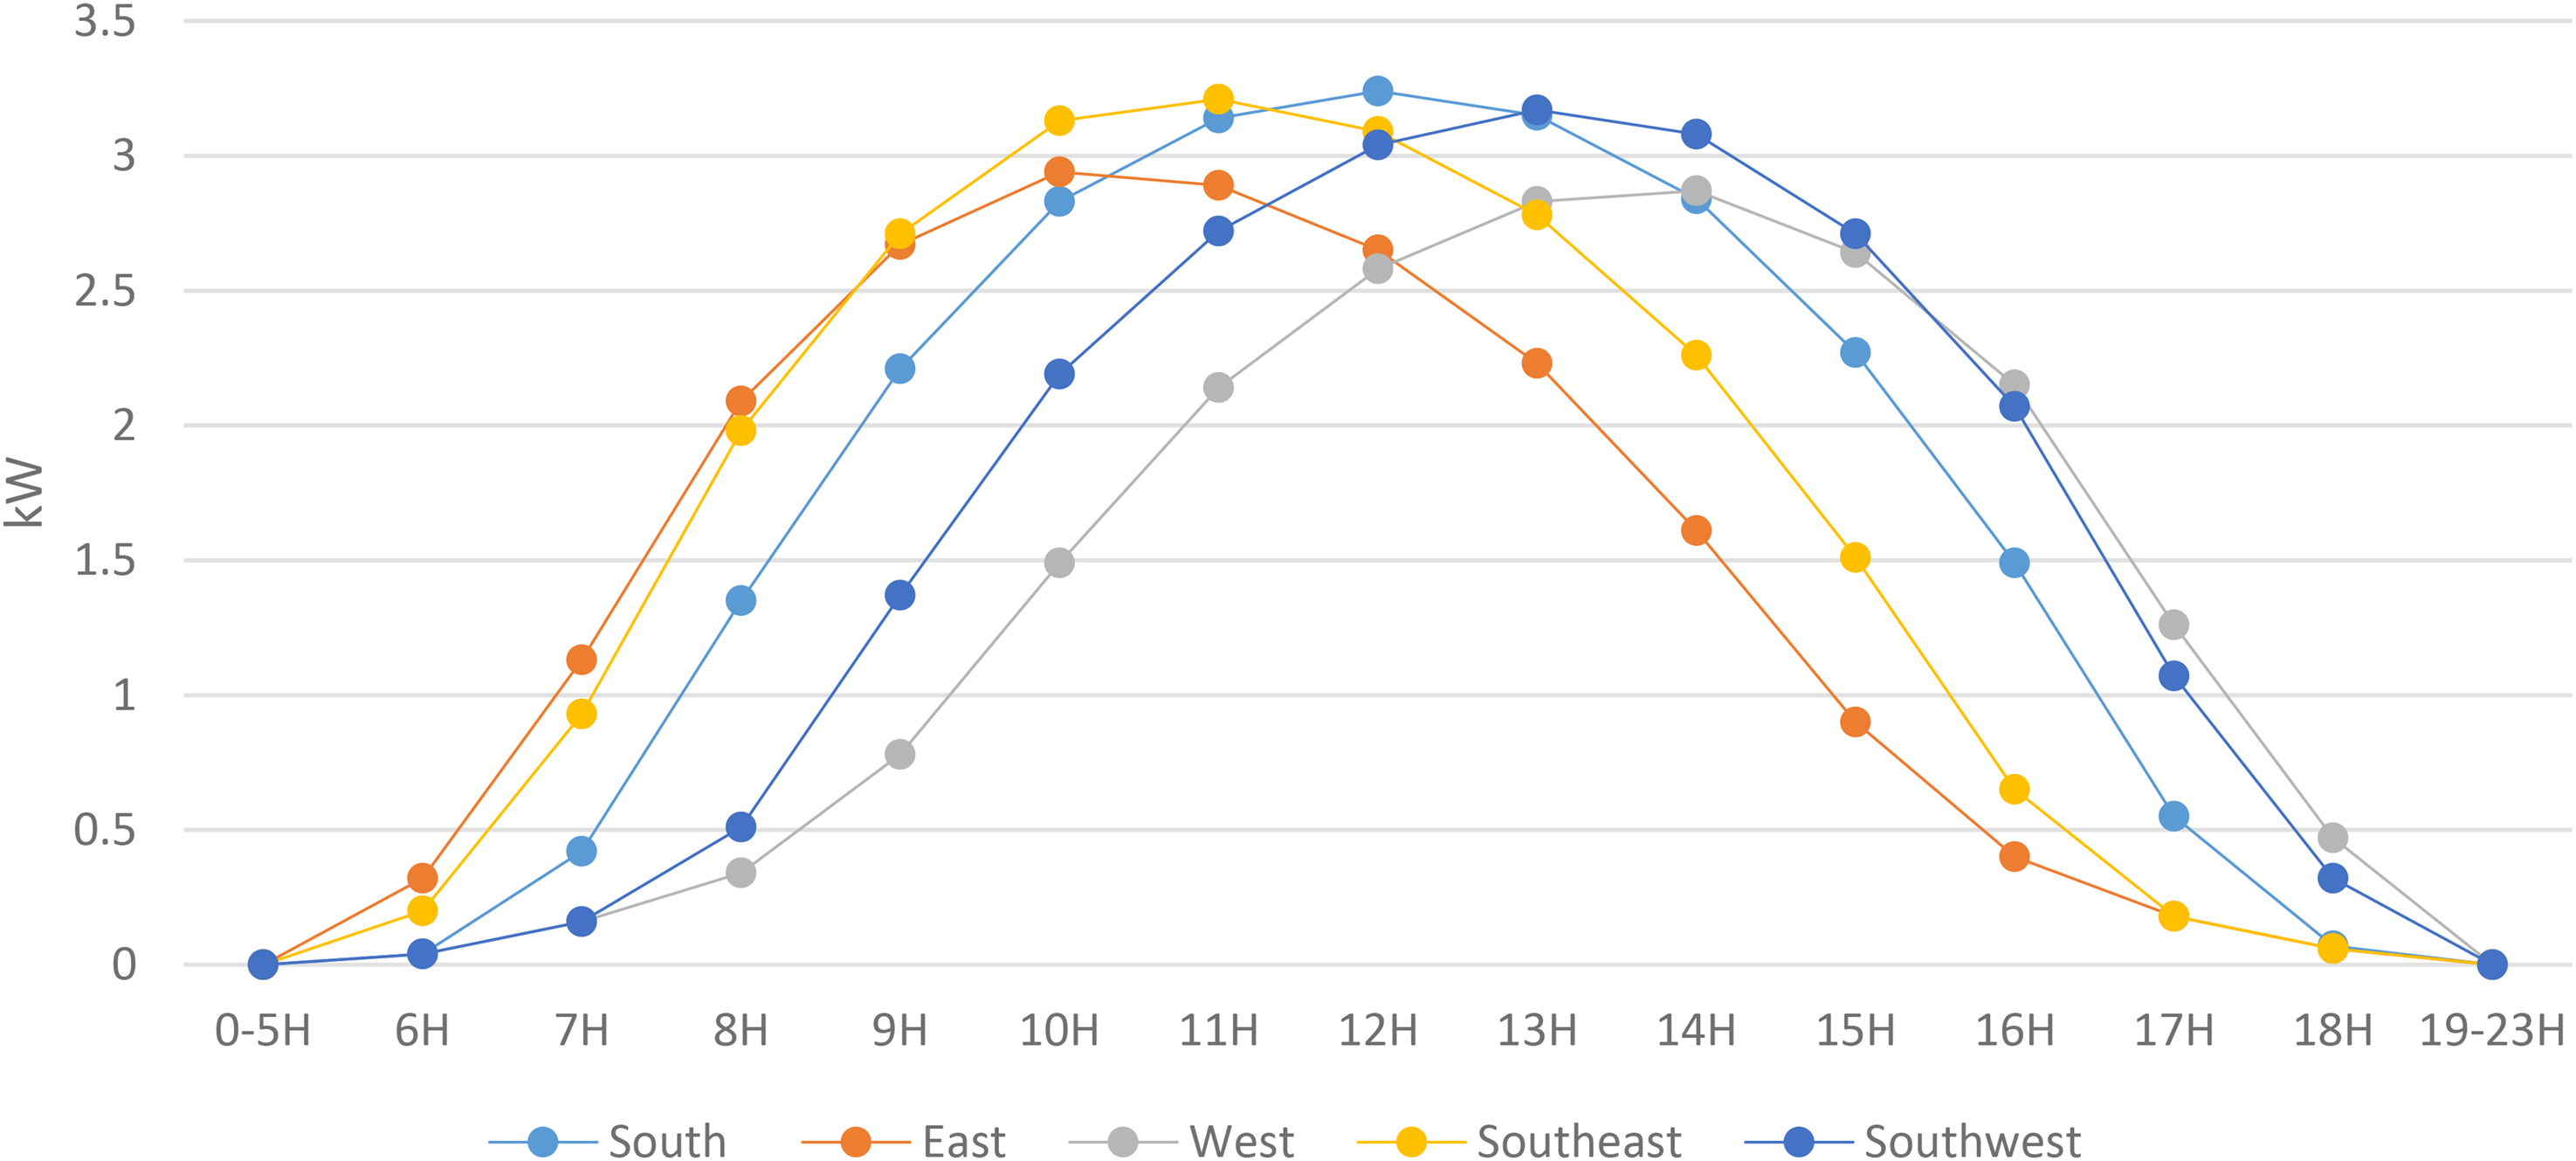
Monthly hour energy injected into the grid across different orientations.
The analysis of hourly energy production across different orientations reveals distinct performance patterns, which are essential for optimizing energy generation and aligning it with demand profiles:
Morning Energy Production: The East orientation demonstrates its strength during the early morning hours (6:00 AM to 10:00 AM). This makes it particularly effective for meeting energy needs at the start of the day, such as residential or commercial morning loads. However, its contribution declines as the day progresses, limiting its role during midday or evening periods. Midday Performance: Both South and Southeast orientations excel during the mid-morning to early afternoon period (9:00 AM to 1:00 PM). Their alignment with peak solar irradiation enables consistent and substantial energy production during this crucial part of the day. The South orientation is especially notable for its balanced production curve, maximizing output and reliability. Afternoon Energy Contribution: During the afternoon hours (1:00 PM to 5:00 PM), Southwest and West orientations take the lead, maintaining robust energy production as the sun moves westward. This late-day performance makes them particularly valuable for sustaining energy supply during afternoon and evening peak demand periods.
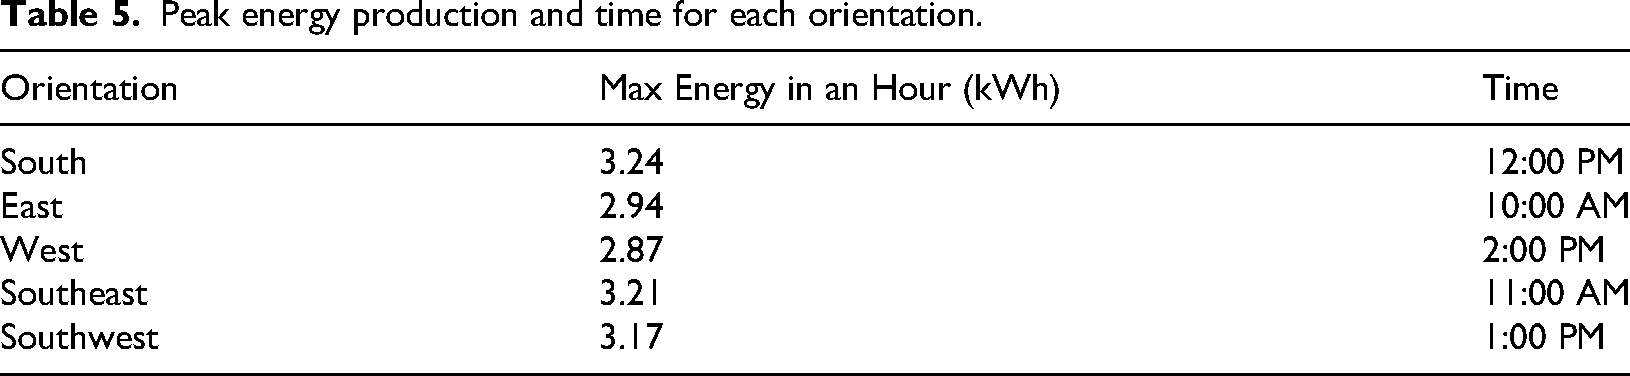
Table 5 summarizes the peak hourly energy production and its corresponding time for each orientation:
Peak energy production and time for each orientation.
Jordan's Ministry of Energy and Mineral Resources has begun implementing ToU tariffs in specific sectors, including mid-sized industries and electric vehicle (EV) charging stations. By 2025, this tariff system will be expanded to include other sectors, such as hotels, hospitals, and the residential sector. This discussion evaluates whether altering the traditional south-facing PV orientation can better align energy production with ToU intervals, thus promoting economic and operational efficiency through peak shifting. Adopting ToU tariffs is a cornerstone of Jordan's energy modernization strategy, supported by the ongoing transition to a smart grid. These tariffs reduce reliance on inefficient power plants by encouraging load shifting away from peak hours. As the residential sector is the next target for ToU implementation, this study is particularly relevant for assessing how alternative PV orientations can support peak shifting and enhance grid stability. ToU tariffs address challenges in peak energy demand and cost optimization by differentiating electricity prices across three distinct intervals:
Off-Peak (5:00–14:00): Period of low demand with the lowest tariffs Partial-Peak (14:00–17:00 and 23:00–5:00): Transition periods with intermediate tariffs. On-Peak (17:00–23:00): Period of high demand with the highest tariffs, dominated by fossil fuel-based generation. South Orientation: Dominates during midday hours (Off-Peak: 69%) with minimal contribution during On-Peak (3%). This limits its ability to support evening demand. East Orientation: Peaks earlier in the day (off-peak: 90%), making it ideal for early morning usage but ineffective during evening peaks. West Orientation: Provides a balanced output during partial-peak (32%) and on-peak (9%), making it suitable for addressing late afternoon and evening energy needs. Southeast Orientation: Like the south, it heavily favors off-peak (84%) but with slightly improved contributions to Partial-Peak periods. Southwest Orientation: Balances production across intervals, with 30% during Partial-Peak and 6% during on-peak, offering a practical solution for evening peak demands.
Aligning PV energy production with these intervals can minimize reliance on inefficient generation units during peak demand while enhancing the integration of renewable energy sources into the grid. As Jordan transitions to the ToU tariff system, this research evaluates whether non-traditional PV orientations can provide better support for peak shifting compared to the standard south-facing orientation. The energy output from each alternative orientation is analyzed and compared as a percentage of the total energy generated by the south-facing orientation. This approach offers valuable insights into optimizing renewable energy production under a time-sensitive tariff structure, contributing to the broader goals of sustainability and economic efficiency. The hourly energy production profiles for each PV orientation, illustrated in Figure 12, reveal distinct patterns that influence their alignment with ToU tariff intervals:
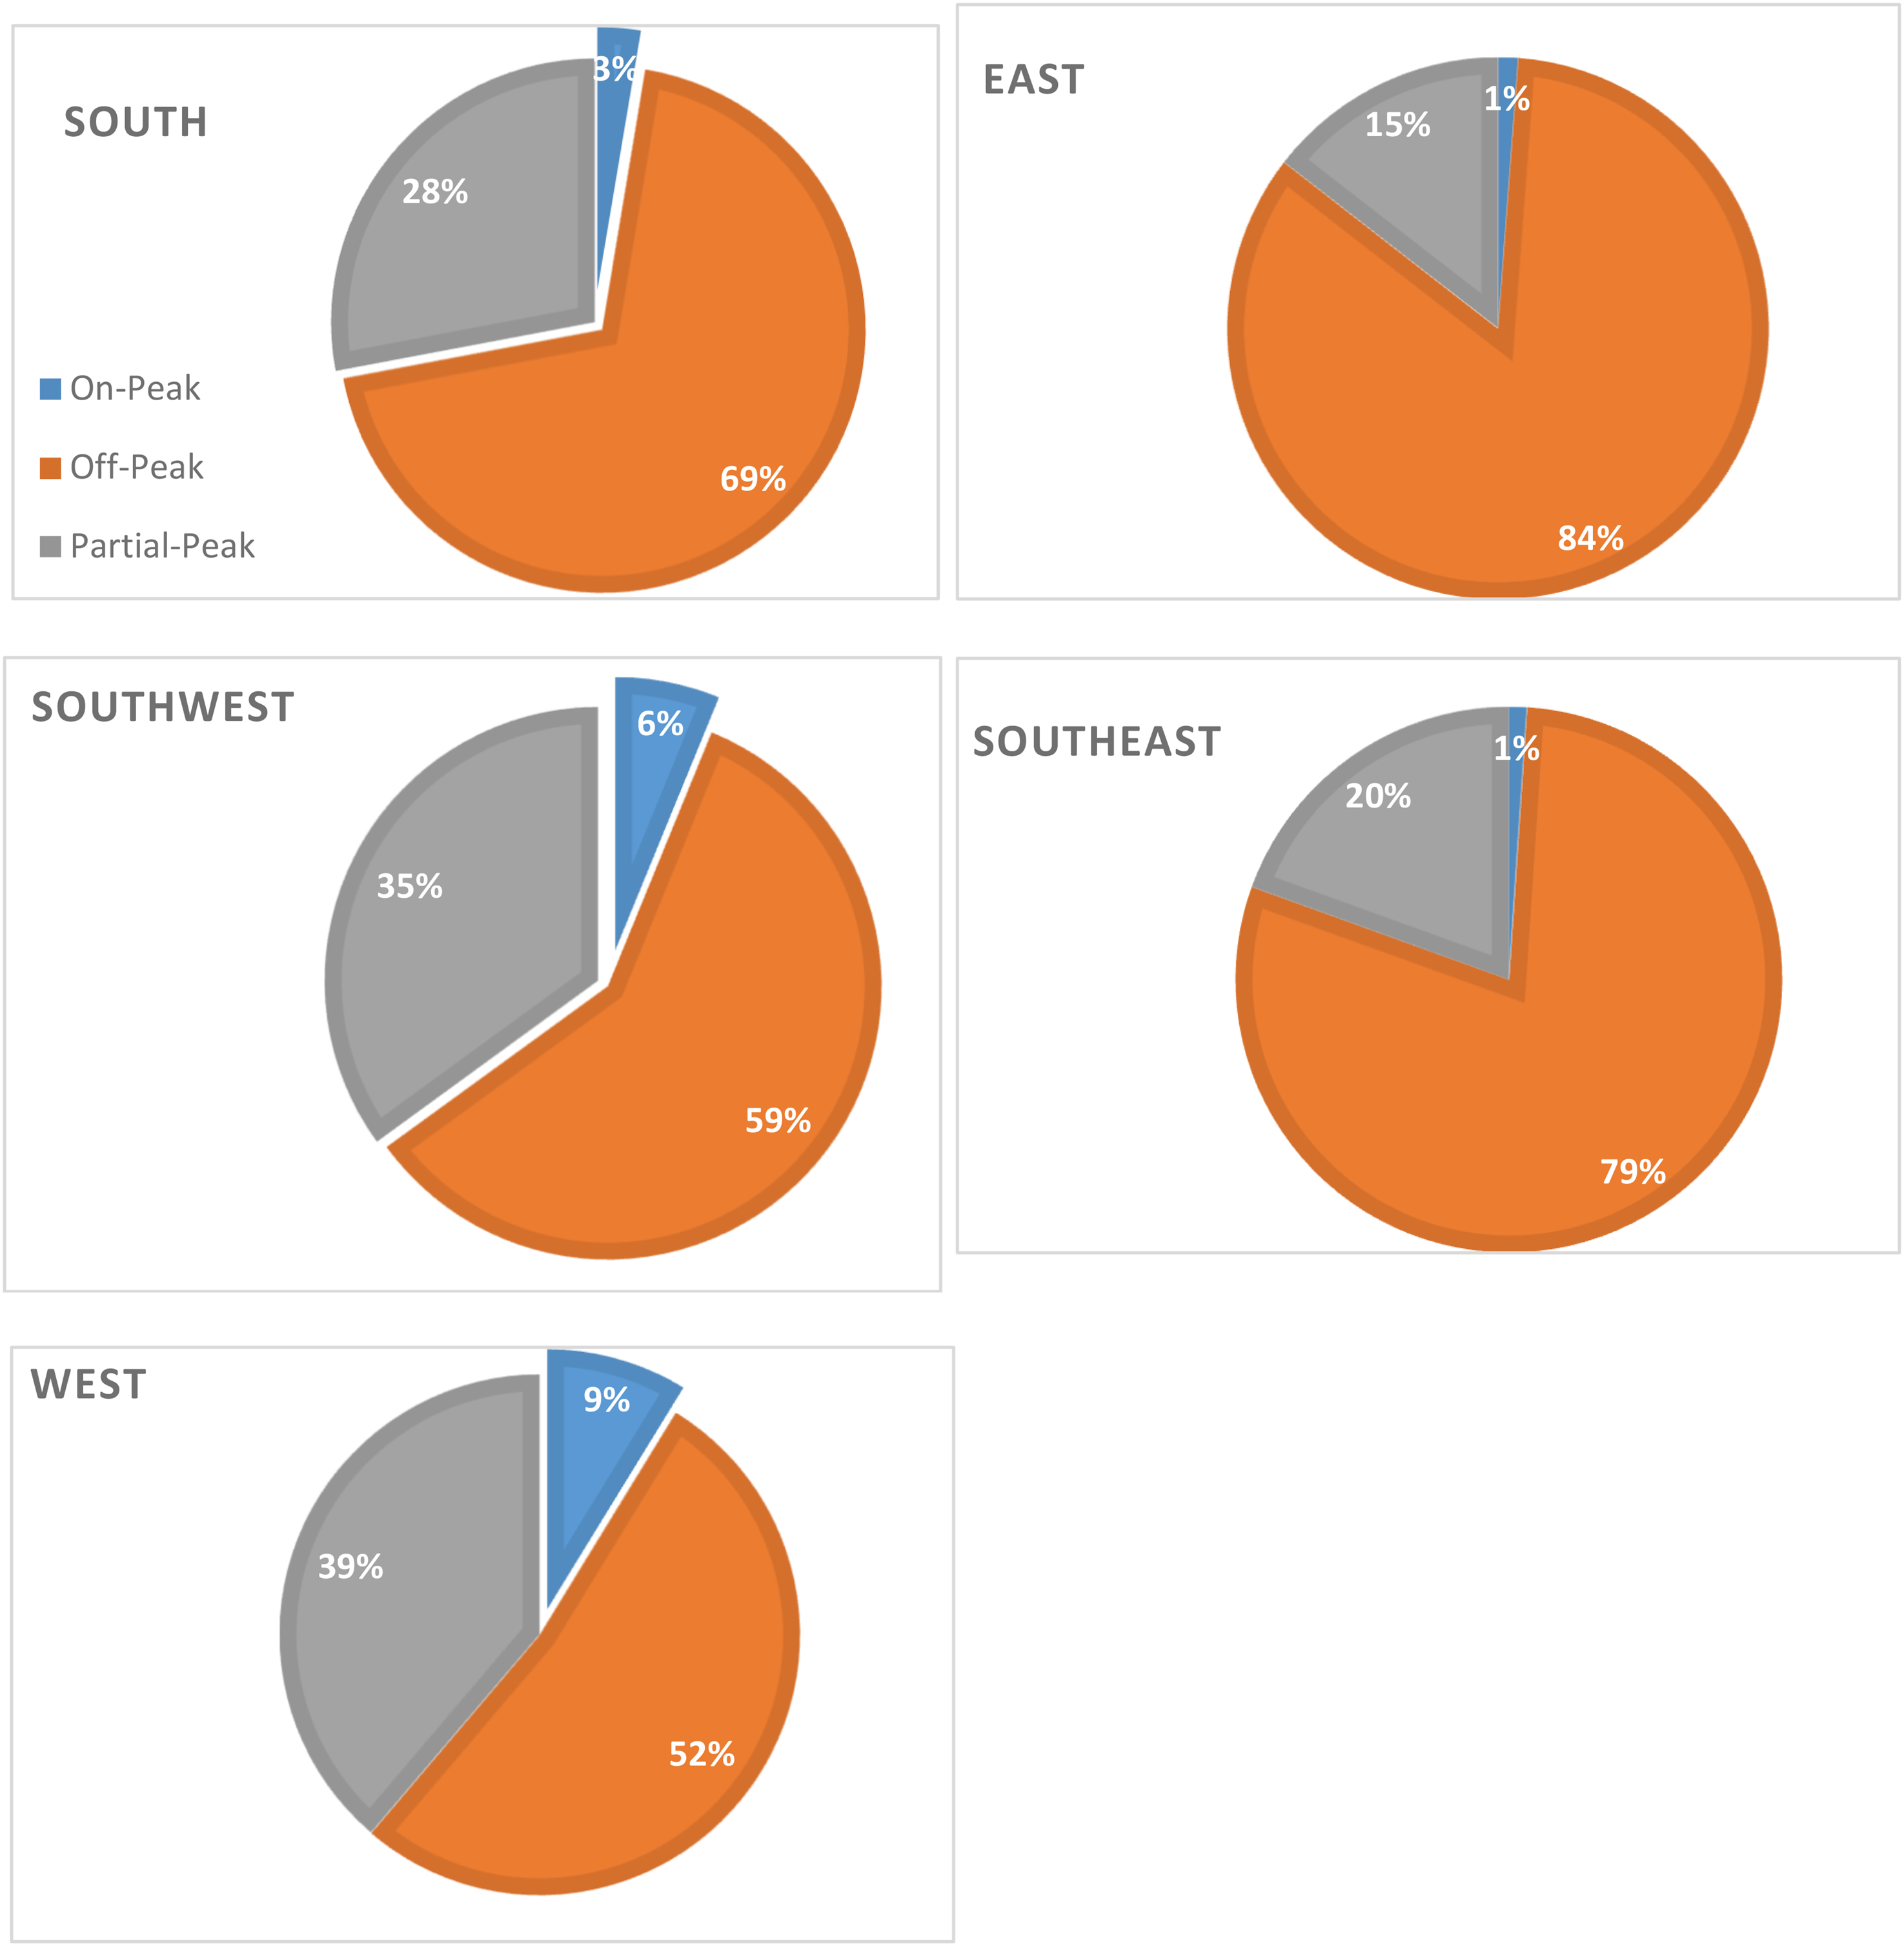
Energy distribution by ToU – for the different orientations.
Although aligning PV generation with on-peak demand remains challenging for all orientations, the west and southwest orientations emerge as the most effective for addressing energy needs during peak hours. In terms of on-peak contributions, the southwest's orientation, while producing slightly more total energy than the west, achieves a 6% alignment with on-peak demand compared to the West's 9%. This significantly outperforms the South orientation's 3%, demonstrating the effectiveness of these alternative orientations for evening peak-shifting. Furthermore, their balanced contribution across intervals ensures a better fit with the ToU tariff system, optimizing both economic returns and grid stability.
This study highlights the critical role of PV panel orientations in optimizing energy production and supporting renewable energy adoption under ToU tariffs for buildings where the traditional south-facing orientation is not feasible due to structural constraints or shading, alternative orientations such as southeast or southwest offer practical solutions. The findings demonstrate that southeast and southwest orientations produce approximately 96.07% and 95.13% of the energy output of a south-facing baseline, respectively, equivalent to around 5% less energy production. This illustrates that these alternatives can deliver near-optimal performance, making them viable options in constrained scenarios. Moreover, the study provides insights into how orientation-specific PV installations can contribute to grid stability and cost savings by better-aligning production with demand patterns.
Limitations and recommendations for future work
While PVsyst provides a reliable and widely validated platform for simulating PV system performance under varying orientation scenarios, it does not fully capture certain real-world variables that can significantly influence energy output. In particular, environmental factors such as soiling losses due to dust accumulation, topographical shading, and localized microclimatic conditions (e.g., wind patterns, temperature gradients, and humidity variations) can result in deviations between simulated and actual system performance.
Future studies should aim to incorporate empirical datasets and site-specific correction factors to bridge this gap. This could include the integration of measured soiling rates in arid and semi-arid zones such as Jordan, using monthly or seasonal loss profiles to reflect dust accumulation patterns. Additionally, horizon profiles derived from on-site surveys or geographic information systems (GIS) should be used to model far shading due to terrain or surrounding structures. Finally, developing or importing customized weather files that reflect localized temperature and irradiance conditions would enable more accurate modeling of PV module behavior in distinct microclimates. Incorporating these refinements will not only improve the accuracy of energy yield predictions. However, it will also enhance the reliability of orientation-based performance comparisons, thereby supporting more informed system design and investment decisions across varying residential and geographic contexts.
The study faces limitations due to the absence of a defined ToU tariff structure for the residential sector in Jordanian dinars. This lack of financial data restricts the ability to perform a comprehensive economic analysis. While alternative orientations align better with partial-peak and on-peak intervals, the financial implications of these alignments remain unclear. Without a detailed monetary framework, evaluating whether the benefits of reduced energy costs during peak pricing periods outweigh the slightly lower total energy output of non-south orientations is challenging.
Future research could focus on integrating multiple orientations within a single PV system to optimize energy production across various time intervals under ToU tariffs. For example, a hybrid layout combining southeast and southwest orientations could enhance alignment with partial-peak and on-peak periods while maintaining high overall efficiency. Furthermore, studies could develop adaptive PV system designs that dynamically respond to changes in tariff structures or energy demand patterns. Another promising direction is integrating energy storage systems to store excess energy during off-peak intervals and deploy it during on-peak periods, maximizing both economic and operational benefits. Such advancements would enable a more flexible and efficient renewable energy framework tailored to diverse and evolving conditions.
Conclusions
This study demonstrates the critical role of PV system orientation in optimizing energy production and aligning with residential load profiles, especially under a ToU tariff framework. While south-facing PV systems (in the northern hemisphere) maximize total energy production, alternative orientations like West and Southwest provide superior alignment with on-peak and partial-peak demand periods, supporting grid stability and reducing reliance on expensive generation during high-cost intervals.
The results indicate that west-facing panels achieve the highest on-peak alignment at 9%, followed by southwest at 6%, significantly outperforming the south orientation at 3%. Additionally, the southwest orientation produces slightly more total energy than West-facing systems, making it a strong candidate for balanced energy generation and peak shifting. These findings suggest that reorienting PV systems to prioritize peak demand periods can significantly enhance their economic and operational performance.
A mixed-orientation system combining south, southeast, and southwest configurations is recommended to balance total energy output and demand alignment. Such designs can further optimize energy distribution across time intervals, enhancing coverage for morning, afternoon, and evening demand. For even greater efficiency, integrating east and west orientations could ensure a broader temporal spread of energy production. Future research should incorporate actual ToU tariff rates to provide a more comprehensive economic analysis of different orientations. Additionally, exploring hybrid designs that combine multiple orientations or include energy storage solutions could further enhance the ability of PV systems to meet peak demand while reducing grid dependency.
Finally, this study provides valuable insights into the optimal design of PV systems in Jordan, offering a pathway to greater cost efficiency and renewable energy utilization. By strategically aligning PV production with demand intervals, policymakers and stakeholders can advance renewable energy goals while ensuring operational and economic benefits.
Footnotes
Ethical considerations
This research does not involve human participants, animals, or any ethical concerns requiring approval from an ethics committee. Therefore, no ethics statement is necessary.
Consent statement
Since this study does not include human subjects, personal data, or any form of survey or interviews requiring consent, no consent statement is applicable.
Funding
The authors received no financial support for the research, authorship, and/or publication of this article.
Declaration of conflicting interests
The authors declared no potential conflicts of interest with respect to the research, authorship, and/or publication of this article.