
Abstract
Renewable energy systems have emerged as a viable option to mitigate the environmental impacts of traditional fossil fuels. However, the intermittent nature of these renewables, such as solar and wind, makes it challenging to ensure a stable energy supply using only one type. Therefore, combining more than a single technology offers significant advantages in addressing the limitations associated with each individual system. Nevertheless, developing these systems requires substantial financial investments, making it crucial to identify the most suitable locations prior to installing them. In this article, the prime objective was to propose a preliminary evaluation of land suitability for constructing solar and wind hybrid facilities (PV–wind, PV–CSP, and CS–wind) in Tataouine, southern Tunisia. To this end, a GIS-based MCDA methodology was developed based on an extensive literature review and experts’ feedback while considering climate, topography, accessibility, and environmental factors. The results obtained revealed that the optimal area for a CSP–PV hybrid system is about 793 km2, indicating that this combination has the highest potential in terms of available resources and compatibility. On the other hand, well-suited locations for hosting CSP–wind and PV–wind systems covered areas of 412 and 333 km2, respectively. Such specific locations are capable of generating an annual technical potential of 316.169, 91.252, and 62.970 TWh for CSP–PV, CSP–wind, and PV–wind, respectively. Interestingly, comprising almost all of the most appropriate sites, Remada and Dhiba stand as the ideal locations for accommodating such hybrid systems. Considering this outcome, Tataouine can position itself as a model for renewable energy adoption in Tunisia. Therefore, it is imperative for policymakers, investors, and local communities to collaborate and embrace these hybrid systems to capitalize on this immense potential and pave the way for a greener and more prosperous future.
Introduction
In recent years, significant changes in the energy sector have resulted in a reevaluation of our energy needs and production and consumption methods. This has led to the establishment of a new energy system. The dominance of fossil fuels such as natural gas is gradually being questioned due to issues like pollution, dependence on producer states and cartels, rising prices, resource depletion, and reserve exhaustion (Capellán-Pérez et al., 2014; Day and Day, 2017; Höök and Tang, 2013). As a result, it has become essential to control consumption while promoting new alternatives like renewable energy sources (RESs), which are free from carbon emissions (Esposito and Romagnoli, 2023; Kung et al., 2019). This transition toward cleaner sources of energy is shaping a new energy landscape characterized by the relocation of energy systems and the emergence of new players and sources of energy. Driven by the need to promote accessible and cost-effective energy while also prioritizing environmental conservation, RESs have been gaining momentum over the years (Gudlaugsson et al., 2023; Güney, 2021; Kuleli Pak et al., 2017; Majeed et al., 2023). With a focus on regional development strategies, efficient consumption practices, and ensuring a reliable supply, many countries are currently undergoing an energy transition process. However, one prominent drawback of these RESs is their reliance on variable weather and climatic conditions. The intermittent nature of renewable power from sources such as wind and solar makes it challenging to ensure a stable energy supply using only one type of RES (Sovacool, 2009; Zhou et al., 2018). In this context, the combination of solar and wind technologies within hybrid systems offers significant advantages in addressing the limitations associated with each individual system (Liu et al., 2022; Muchiri et al., 2023; Spiru, 2023). By integrating these complementary sources, hybrid systems have the potential to provide a more consistent and stable power supply, taking advantage of varying climatic conditions throughout different times of the day or year (Monforti et al., 2014; Slusarewicz and Cohan, 2018). This leads to enhanced overall system efficiency through optimized resource utilization. For example, during periods when there is high sunlight but low winds (or vice versa), surplus electricity from one source can compensate for deficits from another through intelligent grid management or energy storage solutions such as batteries (Ju et al., 2017). Additionally, the implementation of hybrid renewable energy systems contributes to grid stability and resilience, providing added reliability in power supply (Mishra et al., 2023; Saidi, 2020).
Tunisia, as a net importer of energy, is grappling with a multitude of challenges in its energy system. The country faces a persistent deficit due to high demand and limited local reserves. Currently, the energy mix heavily relies on natural gas (97%), while renewable sources contribute less than 3%, which includes solar, wind, and hydropower (STEG, 2022). In terms of installed capacity, Tunisia currently has 5944 MW, predominantly operated by the national state company known as STEG, with a smaller portion managed by the private Carthage Power Company. STEG's monopoly, dependence on imported energy, particularly natural gas, and heavy subsidies have all contributed to the deterioration of the power sector in Tunisia (Döring et al., 2018; Sghari and Hammami, 2016).
Despite these challenges, Tunisia enjoys significant solar potential, especially in southern regions where direct normal irradiance (DNI) and global horizontal irradiance (GHI) could reach as high as 2800 and 2600 kWh/m2/yr, respectively (Abdelrazik et al., 2022; Attig-Bahar et al., 2021). In addition, many regions in Tunisia experience consistent wind speeds ranging from 6 to 8 m/s at an altitude of 50 m. According to several reports, it has been estimated that CSP, PV, onshore, and offshore winds have a technical potential of 400, 65, 10, and 250 GWs, respectively (Ersoy and Terrapon-Pfaf, 2021; IRENA, 2021). In an attempt to capitalize on these enormous resources, enhance energy security, diversify the mix, reduce imports, and rationalize energy subsidies, the Tunisian government has committed to installing 4.7 GW (15% wind, 15% solar PV, and 5% solar CSP) of renewable energy by 2030 (Gardumi et al., 2021).
Nonetheless, the effective implementation of such a strategy requires a careful assessment for selecting well-suited sites beforehand (Elkadeem et al., 2021; Idris et al., 2022). Merely considering the availability of solar and wind potential is insufficient due to various conflicting factors that directly influence output power and costs (Badi et al., 2021; Sward et al., 2021). For example, despite excellent solar irradiation in arid desert regions, ambient temperature can be a major limiting factor because it can degrade the efficiency of PV panels (Suuronen et al., 2017). Furthermore, locating a PV or wind facility far from grid networks or transportation links would significantly increase costs. Consequently, identifying potential sites depends heavily on understanding their geographical and topographic characteristics. Therefore, detailed knowledge regarding these factors becomes crucial when evaluating the suitability of a given location (Badi et al., 2021).
The present study examines the feasibility of deploying solar and wind hybrid facilities (PV–wind, PV–CSP, and CS–wind) in the Tataouine region, southernmost Tunisia. Through a GIS-based Analytic Hierarchy Process integrated approach, this research aims to identify the most feasible locations for these renewable energy installations. It is anticipated that the outcomes of this work will provide valuable insights and aid decision-making processes regarding site selection, ultimately contributing to unlocking the region's renewable energy potential.
Literature review
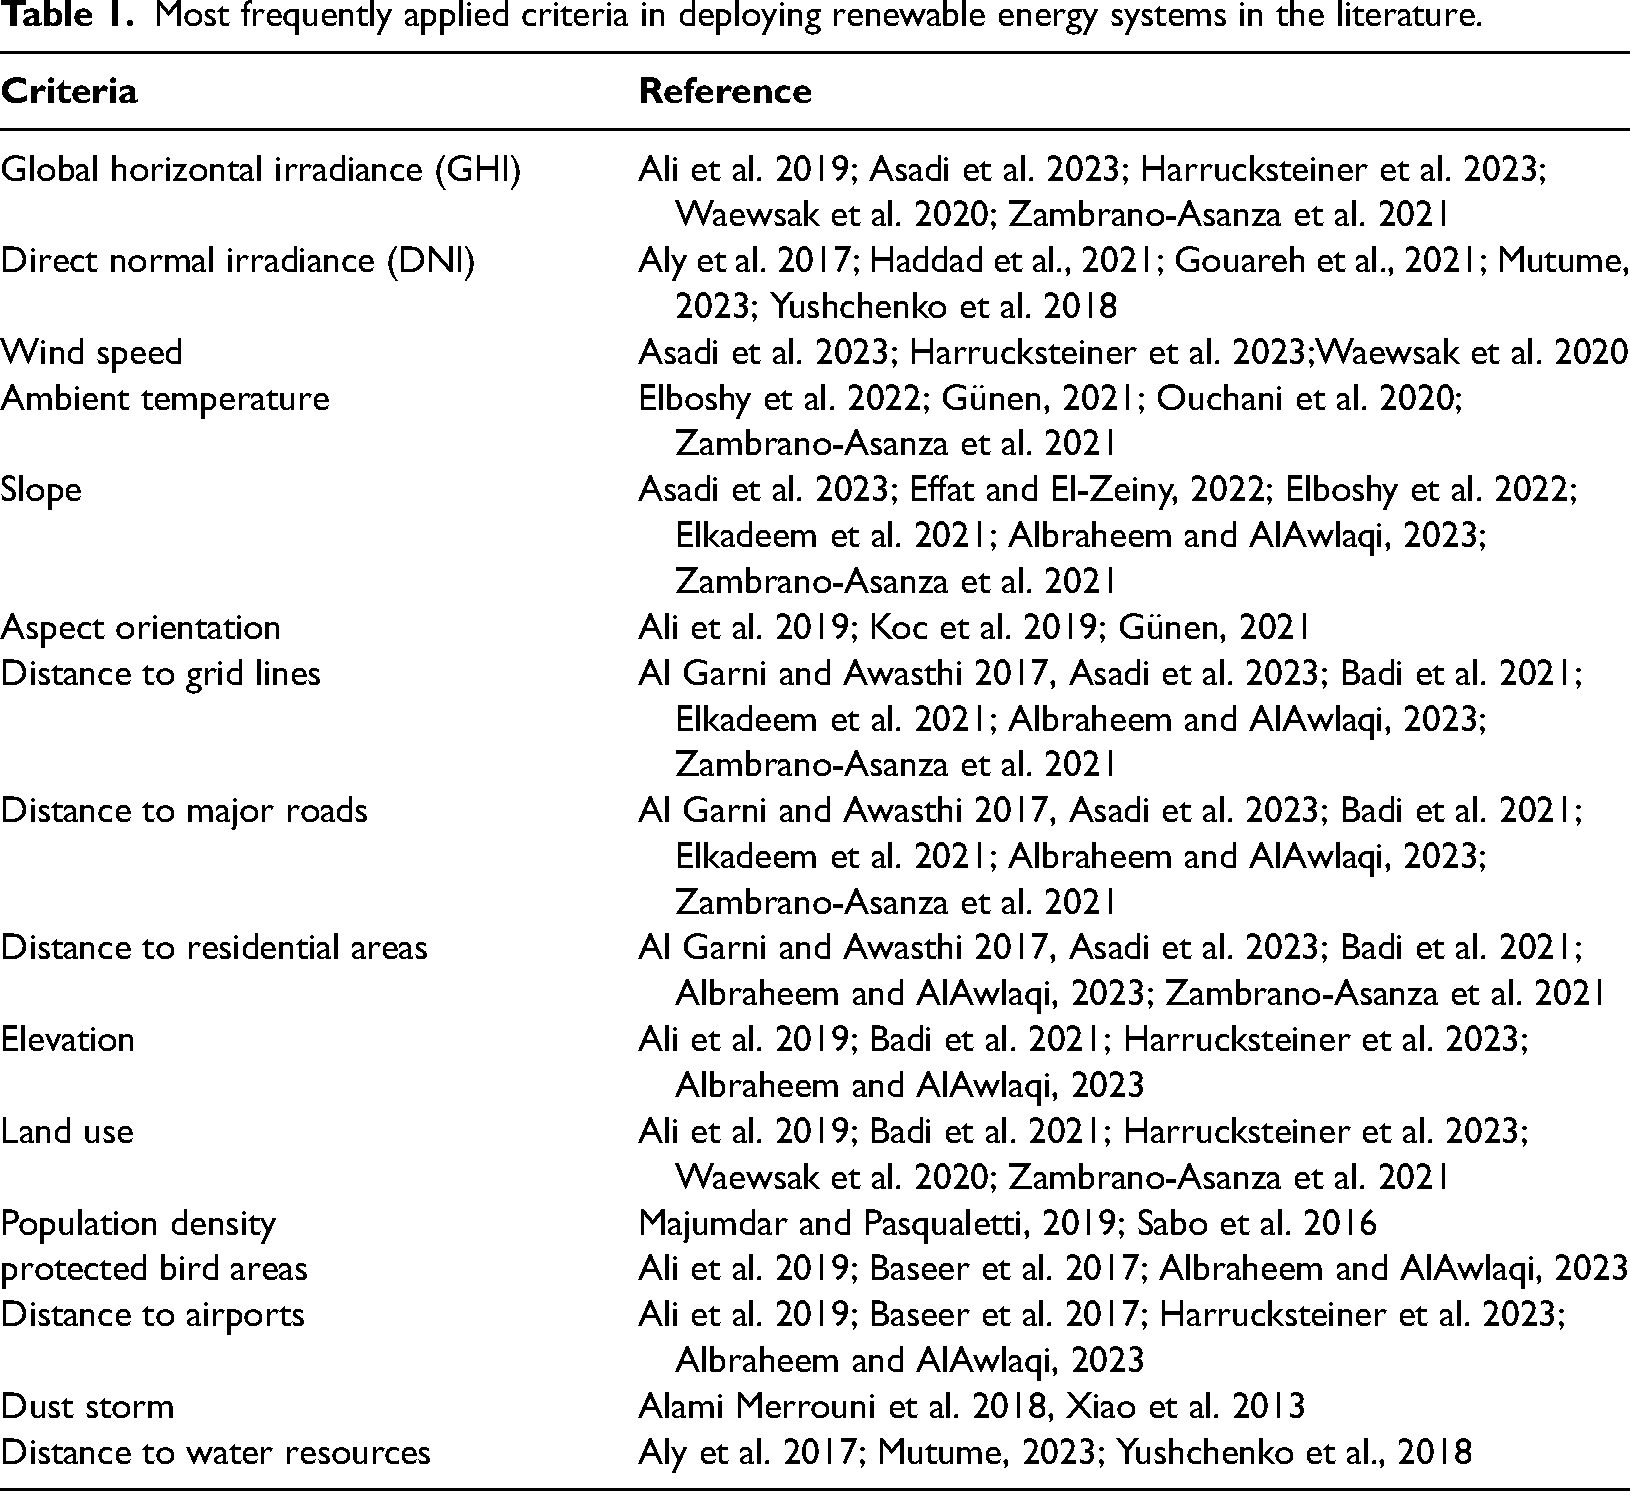
Allocating an optimal site plays a pivotal role in ensuring the viability of renewable energy projects such as solar and wind facilities. However, this process presents numerous challenges that must be carefully addressed. To fully harness the potential of renewable energy within a specific region, it is essential to consider various factors beyond the availability of solar and wind resources alone (Ali et al., 2019; Asadi et al., 2023; Elkadeem et al., 2022). Elements such as topography, infrastructure capabilities, and costs significantly affect the generated power (Al Garni and Awasthi, 2017). Furthermore, regional variations in weather patterns and seasonal fluctuations introduce additional complexities when assessing solar and wind potential. Therefore, comprehensive data collection followed by rigorous analysis becomes imperative for accurately determining the energy generation capacity at a given site (Asadi et al., 2023; Al Garni and Awasthi, 2017). Nevertheless, conducting these assessments can prove challenging due to the diverse criteria that often overlap with each other during decision-making processes as outlined in Table 1. In order to navigate these complexities and make informed decisions, researchers have increasingly turned to geographic information systems integrated with multicriteria decision-making (MCDM) approaches. These techniques have proven to be effective in identifying practical geographic locations for installing renewable energy facilities. Some of the most commonly used MCDM methods include analytic hierarchy process (AHP), fuzzy AHP (FAHP), COPRAS, DEMATEL, ELECTRE, SWARA, TOPSIS, fuzzy TOPSIS, VIKOR, WASPAS, and many other techniques.
Most frequently applied criteria in deploying renewable energy systems in the literature.
In recent years, there has been a surge in the development of comprehensive decision-making models in this field. For instance, Rezaei-Shouroki et al. (2017) proposed a comprehensive multicriteria model incorporating DEA, AHP, and FTOPSIS techniques to assess 13 different cities’ suitability as host locations for wind farms. Xu et al. (2020) employed FAHP combined with the VIKOR technique using GIS data analysis, resulting in optimized site selection for wind farms. Similarly, in another study conducted in Vietnam, Wang et al. (2021) utilized DEA, FAHP, and FWASPAS (fuzzy-weighted aggregated sum-product assessment) to identify the areas with the highest potential for wind farms. In another work, Solangi et al. (2019) successfully determined the ideal location for a solar PV power plant in Pakistan by employing F-VIKOR and AHP techniques. In Taiwan, Wang and Dang (2021) developed a two-stage approach using DEA-AHP to facilitate the construction of solar PV farms across 20 cities. Badi et al. (2021) explored the potential for solar parks in western Libya using GIS, Decision-Making Trial and Evaluation Laboratory, and SWARA techniques. In a very recent work, Wang et al. (2022) proposed an advanced hybrid model that combines DEA, Grey-AHP, and Grey-TOPSIS to effectively determine the optimal locations for solar power plants, specifically in Vietnam. Studies by Mutume (2023) and Haddad et al. (2021) applied AHP along with GIS to delineate the most promising sites for CSP power plants in Zimbabwe and Algeria, respectively. For a more reliable and continuous energy supply, numerous researchers have paid attention to hybrid systems owing to the intermittency and variability of single technologies. In this regard, Diemuodeke et al. (2019) developed the GIS-TOPSIS approach to determine the optimal location for wind–PV hybrid systems in southern Nigeria. Khanjarpanah et al. (2018) explored the feasibility of implementing hybrid wind and solar PV power plants by employing NDEA (network data envelopment analysis) within Iran's context. From a managerial standpoint, Yunna and Geng (2014) used a GIS-AHP-based model to allocate a well-suited location for installing solar-wind facilities in China. The same technique was utilized by Aly et al. (2017) and Yushchenko et al. (2018) to investigate the feasibility of developing solar PV–CSP systems in Tanzania and the ECOWAS region, western Africa. Table 2 depicts a variety of recently published studies addressing the application of GIS-MCDM in solar and wind site selection. Table 2 presents a number of recently published studies focusing on the application of GIS-MCDM in site selection.
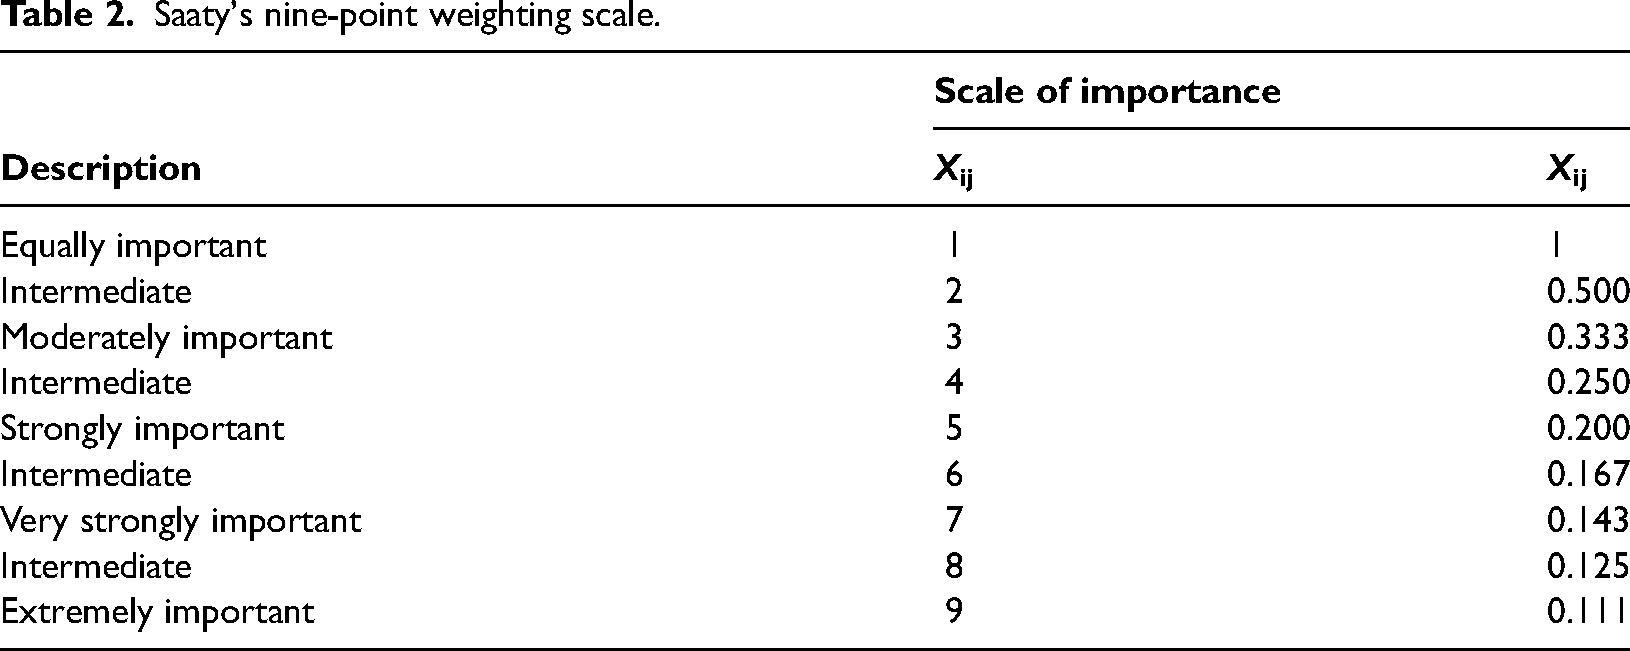
Saaty's nine-point weighting scale.
Unlike fuzzy models such as FAHP, FTOPSIS, and FDEMATEL, which are better suited to handle uncertainties associated with decision-making problems (Khashei-Siuki and Sharifan, 2020; Shojaeimehr and Rahmani, 2022), we opted for the AHP approach for several reasons. The AHP remains a widely used method, either on its own or in combination with other MCDM models (Ilbahar et al., 2019; Manirambona et al., 2022). The popularity of AHP can be attributed to several factors: it is a simple and easily implementable approach that can be integrated with other techniques such as TOPSIS, EDAS, and fuzzy sets. Furthermore, it has the capability to handle both quantitative and qualitative data (Shao et al., 2020). Moreover, AHP allows for various sensitivity analyses regarding criteria, taking into account the consistency or inconsistency of alternatives, which is the key advantage offered by this methodology (Moradi et al., 2020; Shaaban et al., 2018). In addition, when it comes to determining optimal locations for project allocation, AHP has been deemed sufficient as the results obtained do not significantly differ from those generated by more complex techniques such as FAHP, as stated by Mosadeghi et al. (2015).
There is a significant body of literature devoted to exploring opportunities for utilizing RESs in Tunisia, as evidenced by previous studies (Attig-Bahar et al., 2021; Balghouthi et al., 2016; Harrabi et al., 2023; Rekik and El Alimi, 2023; Trabelsi et al., 2016). However, there is currently a gap in research investigating the implementation of hybrid CSP–PV–wind turbine-based power generation systems, specifically in the Tataouine region, southernmost Tunisia. To address this gap, our study employs a GIS-based AHP integrated model. By systematically evaluating land suitability and providing clear findings on optimal locations for installing these systems, this article contributes to sustainable energy planning in southern Tunisia. It highlights the significance of hybrid renewable energy projects as a viable solution for meeting increasing electricity demand driven by population growth, urbanization, and industrial development. Such a comprehensive approach allows policymakers to consider multiple criteria when assessing the promising locations, ensuring that the identified sites are appropriate for hybrid energy production and adhere to principles of sustainability and social acceptance. Consequently, this study is distinctive as it provides an inclusive assessment encompassing both resources within the designated region's potential deployment analysis.
Methodology and data
The main objective of employing a MCDM analysis is to explore and evaluate various alternative options, leading to the identification of optimal solutions (Ilbahar et al., 2019; Shao et al., 2020). This approach aids in determining the best alternative that satisfies multiple conflicting criteria to the highest degree possible, while effectively managing large volumes of data and information based on expert insights (Al Garni et al., 2016; Elkadeem et al., 2021). In recent years, the application of MCDM has become increasingly prevalent in assessing the potential for resource exploitation and selecting suitable sites for renewable energy systems (Effat and El-Zeiny, 2022; Elboshy et al., 2022; Elkadeem et al., 2022). Considering the intricate nature of mapping multifaceted energy infrastructures, the integration of GIS with MCDM techniques has proven a very useful tool in facilitating informed judgments regarding the identification of potential sites for renewable energy projects (Al Garni and Awasthi, 2017; Badi et al., 2021; Elkadeem et al., 2021). However, according to Malczewski (2006), relying solely on geo-information systems may lead to imprecise results. To overcome this limitation and ensure comprehensive assessment, MCDM models have been utilized to prioritize alternative decisions while considering all the involved factors (Badi et al., 2021). As such, integrating GIS with MCDM tools has emerged as a valuable technique for enhancing the decision-making processes associated with the selection of sites for renewable energy solutions such as solar and wind power installations (Al Garni and Awasthi, 2017; Elkadeem et al., 2021, 2022). The objective of this study is to conduct an initial evaluation in order to identify suitable locations in the Tataouine region that possess the potential for accommodating large-scale solar and wind installations as well as CSP–PV–wind hybrid systems.
To accomplish this objective, a GIS-based analytical hierarchy process approach was applied. In addition, advanced satellite imagery, in conjunction with additional geospatial data, was employed to evaluate the geographical attributes and ground conditions of prospective areas in Tataouine. The utilization of satellite data greatly enhanced the precision of environmental mapping and enabled a thorough assessment of diverse factors including land feasibility, climatic patterns, and ease of access. Moreover, through an extensive examination of relevant scholarly literature and consultation with a panel of well-informed experts, an inclusive set of eleven decision criteria has been identified. These criteria have been further grouped into four categories: climatology, topography, environmental, and accessibility. The considered factors encompass global solar irradiance (GHI), DNI, average temperatures; wind speeds; slope; land aspect, land use; water resources, proximity to residential areas as well as grid and transport infrastructure accessibility. Figure 1 illustrates the methodology employed in determining optimal locations for solar and wind power plants as well as hybrid systems.
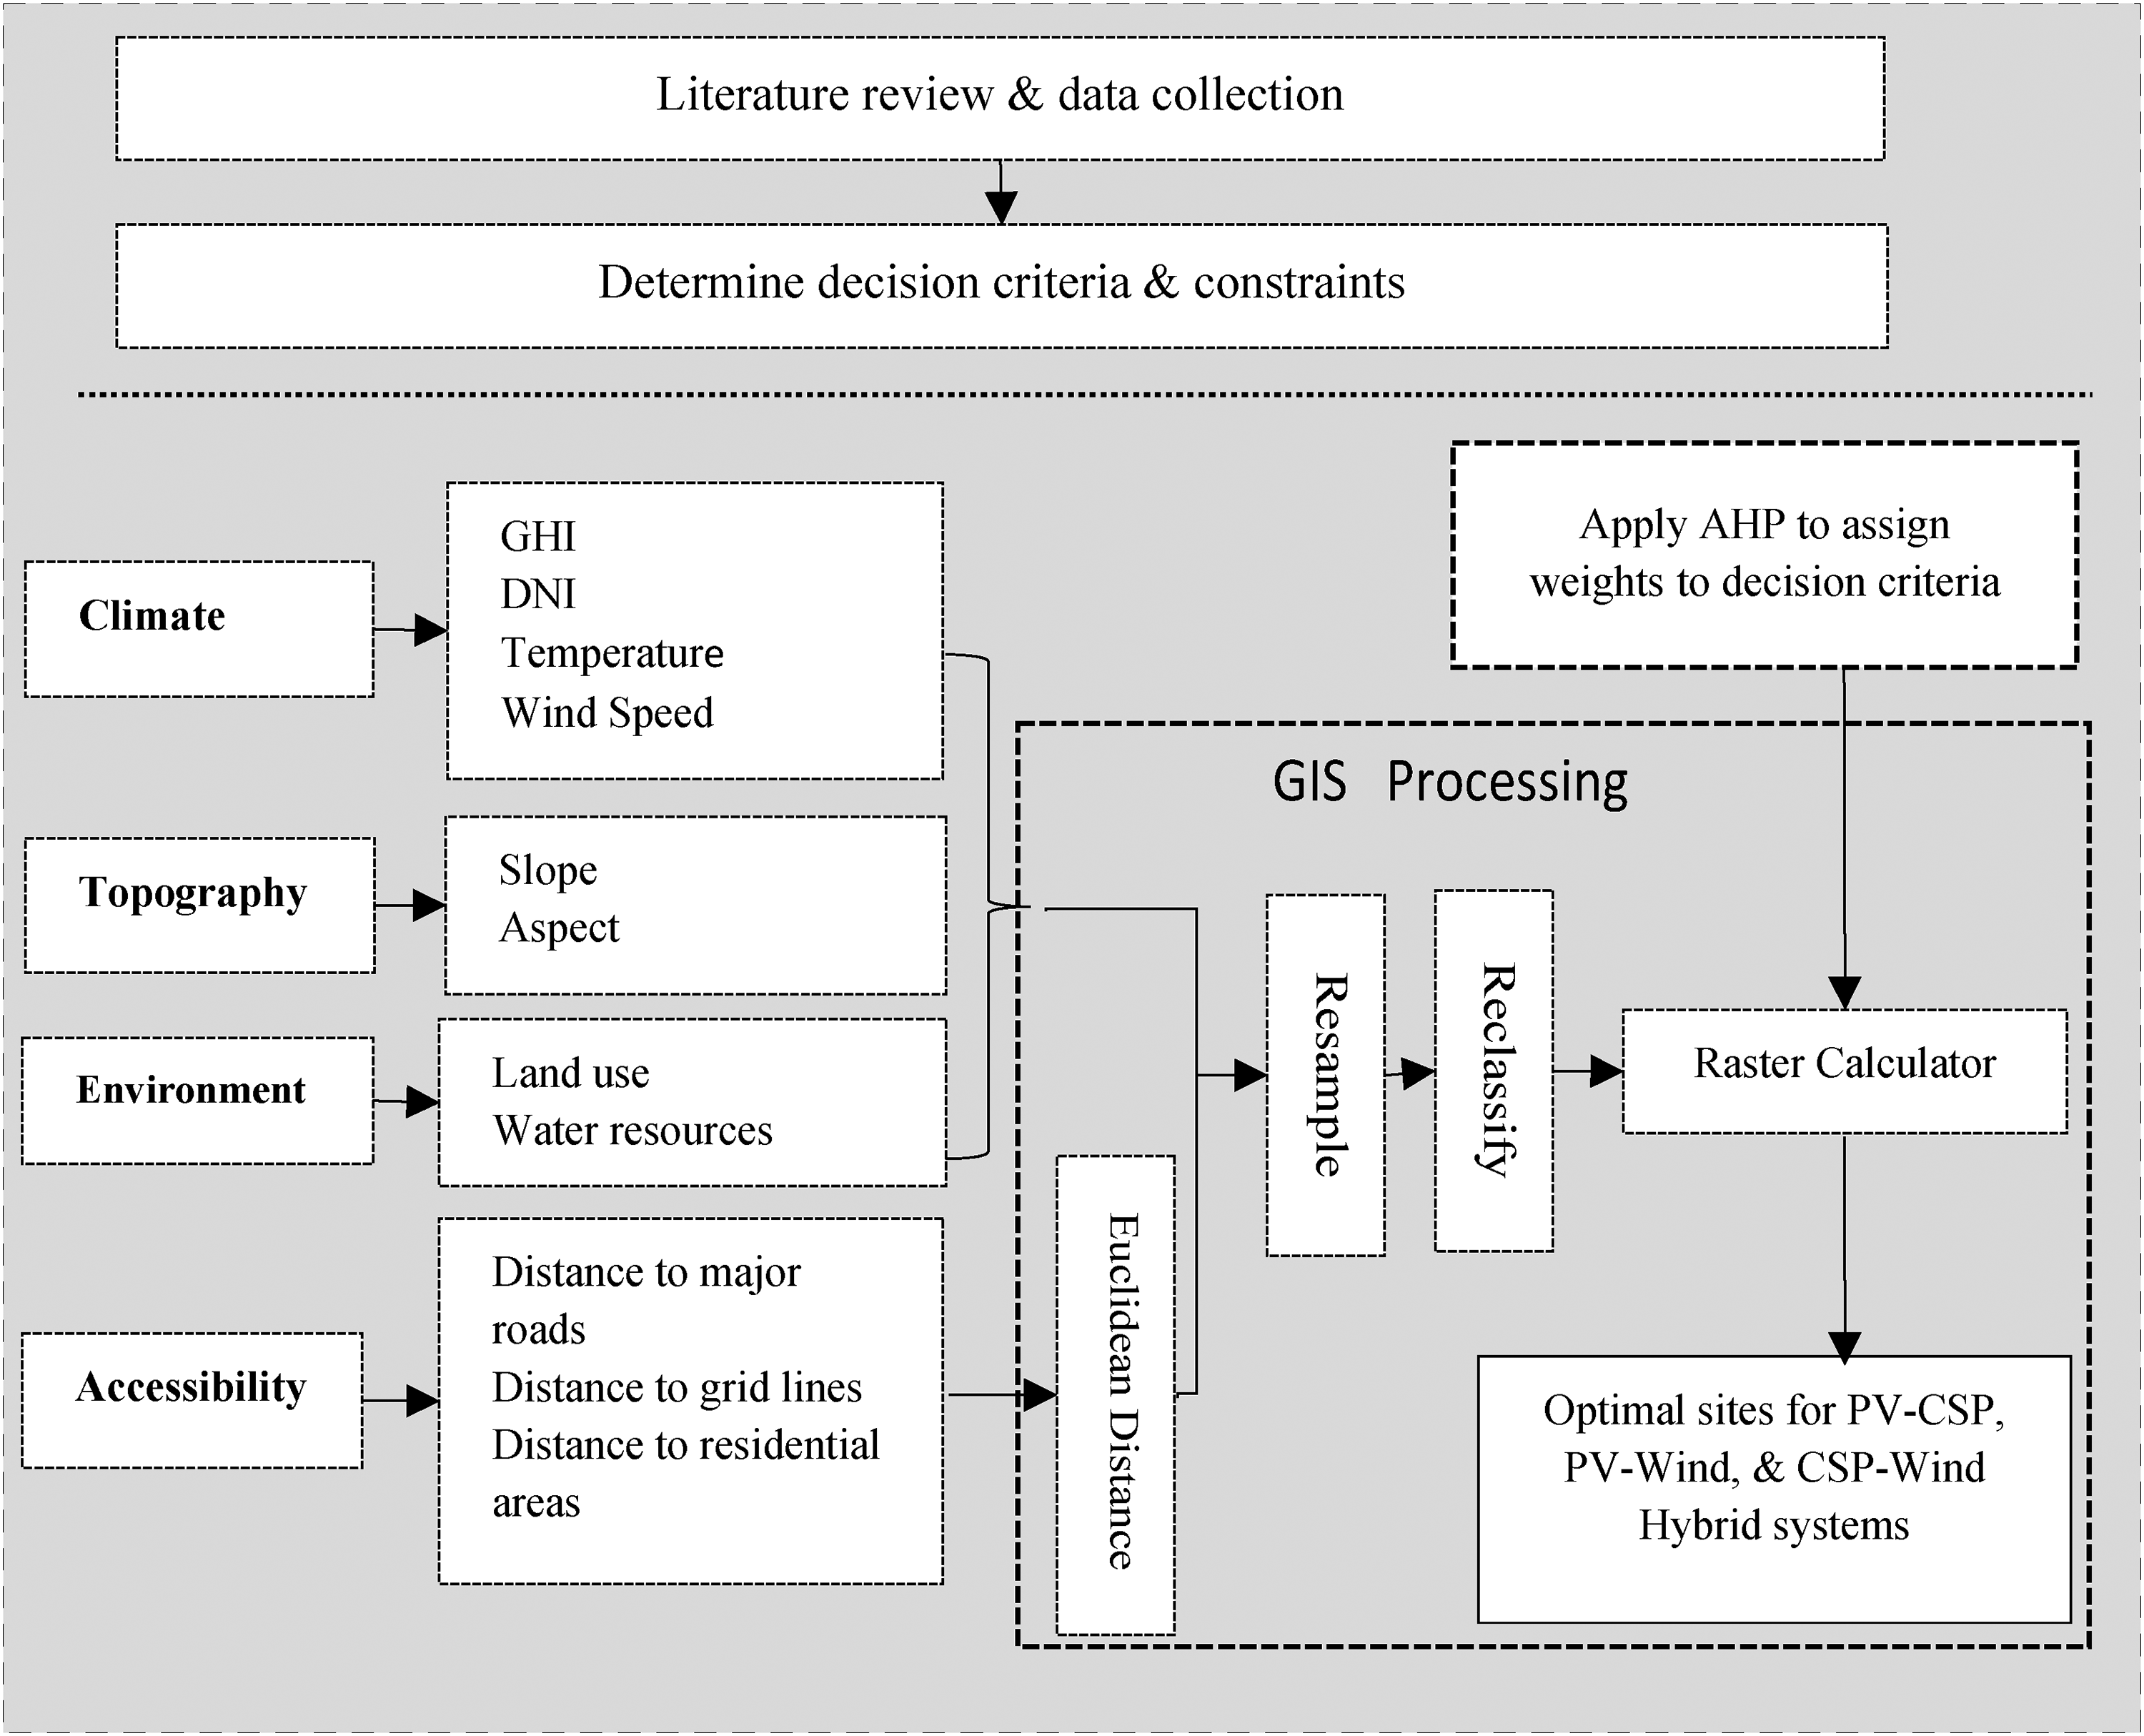
Key steps in determining optimal locations for PV–wind, PV–CSP, and CSP–wind systems.
Study area
Tataouine is the largest governorate of Tunisia, covering an area of 38,889 km² making 24% of the country (Figure 2) and it is home to approximately 152,000 residents. This region is situated between 31.98˚ North latitude and 9.96˚ East longitude in southernmost Tunisia. Tataouine is a landlocked region bordered by Algeria to the west, Libya to the east, and Kebili and Mednine to the north (Figure 2). The region is characterized by arid climatic conditions featuring long hot summers and short mild winters. Traditionally reliant on agriculture for economic sustenance, Tataouine has recently witnessed significant growth in Saharan tourism as well. However, longstanding challenges persist within the region including high unemployment rates, marginalization issues, and disparities in development initiatives compared to the more privileged coastal and northern regions.
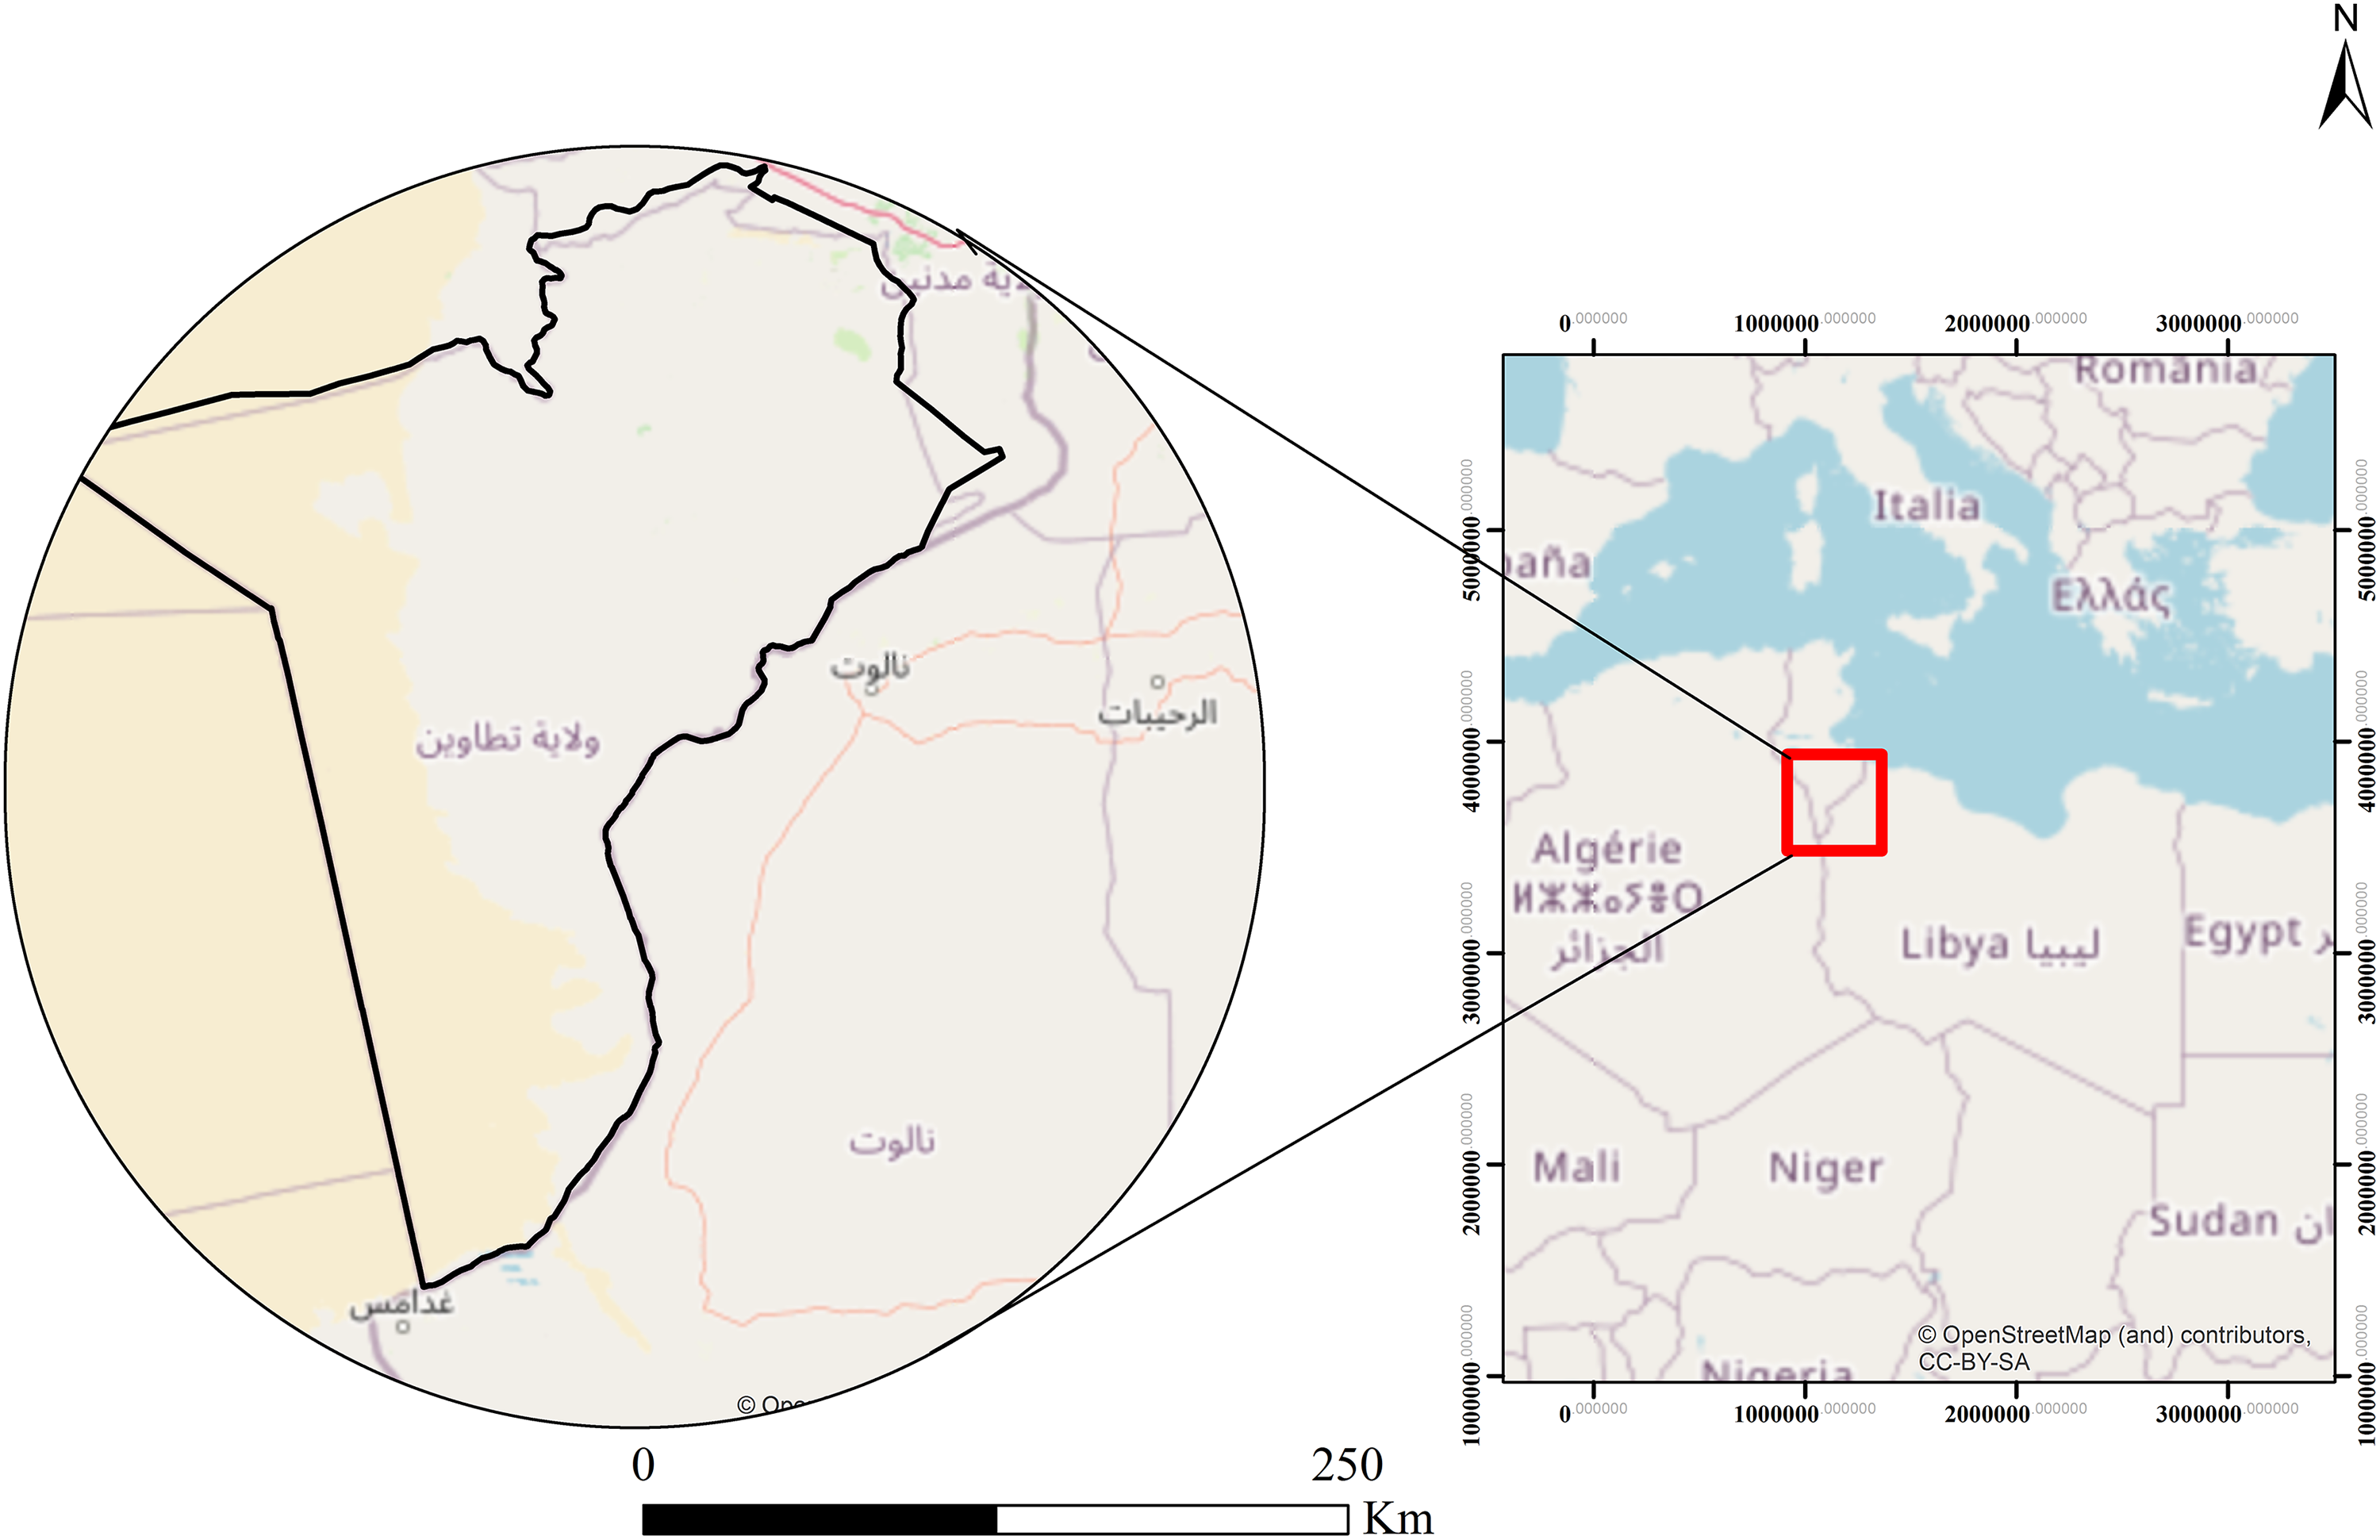
Study area.
Analytic Hierarchy Process
As deduced from the literature, AHP has been by far the most widely utilized MCDM approach in numerous applications, including renewable energy applications. First introduced by Saaty, this technique serves as a mathematical approach that can be employed as a decision analysis tool (Saaty and Vargas, 2012). It facilitates the ranking of various alternatives based on multiple factors while considering conflicting objectives, which provides an optimal compromise (Sindhu et al., 2017). A key benefit of employing the AHP is its adaptability in managing complex issues by breaking them down into more manageable components. Additionally, it accommodates both quantitative and qualitative data while ensuring consistency through validation procedures (Al Garni et al., 2016; Ouchani et al., 2020). Therefore, considering these advantages, the AHP approach has been selected for this article. The AHP's key steps are summarized as follows (Al Garni et al., 2016; Sindhu et al., 2017):
1. Construct the initial pairwise comparison matrices. The element xij of matrix Kn × n, denotes the importance of the ith criterion over the jth one, based on Saaty's scale (Saaty and Vargas, 2012), as shown in Table 2. 2. Normalize the initial matrix K 3. Calculate the Eigenvector, maximum Eigen value, and consistency index (CI) 4. Compute the consistency ratio (CR) to check the consistency of judgements provided by experts
Where 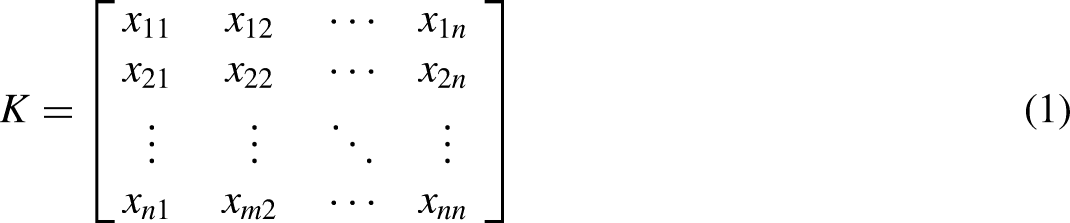
where 
where RI is the random index (Table 3).
Random index for different values of number of elements.
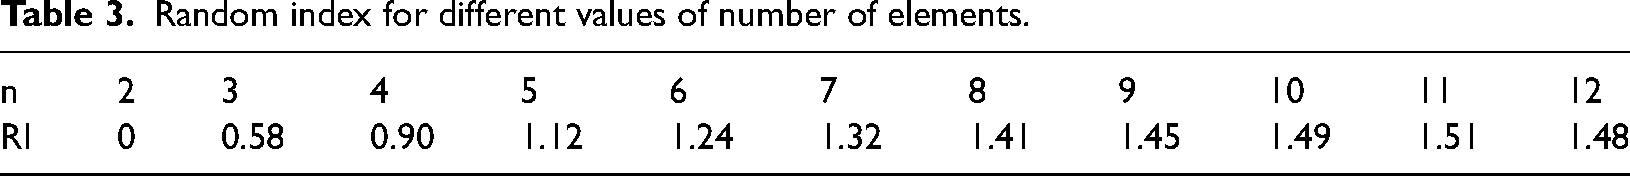
If
Decision criteria and constraints and decision criteria
Allocating optimal sites for renewable energy projects is always associated with various overlapping factors as well as constraints. Thus, the assessment of such factors should go beyond economic and technological standpoint, yet, socio-political and environmental aspects have to be incorporated as well. To ensure the accuracy of this evaluation, it is crucial to involve knowledgeable experts in employing MCDM approaches. Assigning relative scores to the considered factors plays a vital role in determining their significance compared to each other. As part of this article, five experts with over 15 years of experience in the renewable energy sector in Tunisia, were requested to conduct the pairwise comparisons and suggest the most influential factors considering the Tunisian energy context. For more details regarding these experts’ backgrounds please refer to Table A.1.
Constraints
The selection of suitable locations for deploying renewable energy technologies requires careful consideration of various limitations of economic, technical, and environmental types. In this study, restrictive factors were identified based on an extensive literature review, as outlined in Table. These restrictive limitations were aggregated into a single layer using Boolean algebra (1 and 0) within ArcGIS 10.8 (Figure 3). A value of “1” indicates that there are no restrictions present in those areas, making them suited for the development of solar and wind farms; while a value of “0” signifies the presence of limitations that render such developments unfeasible.
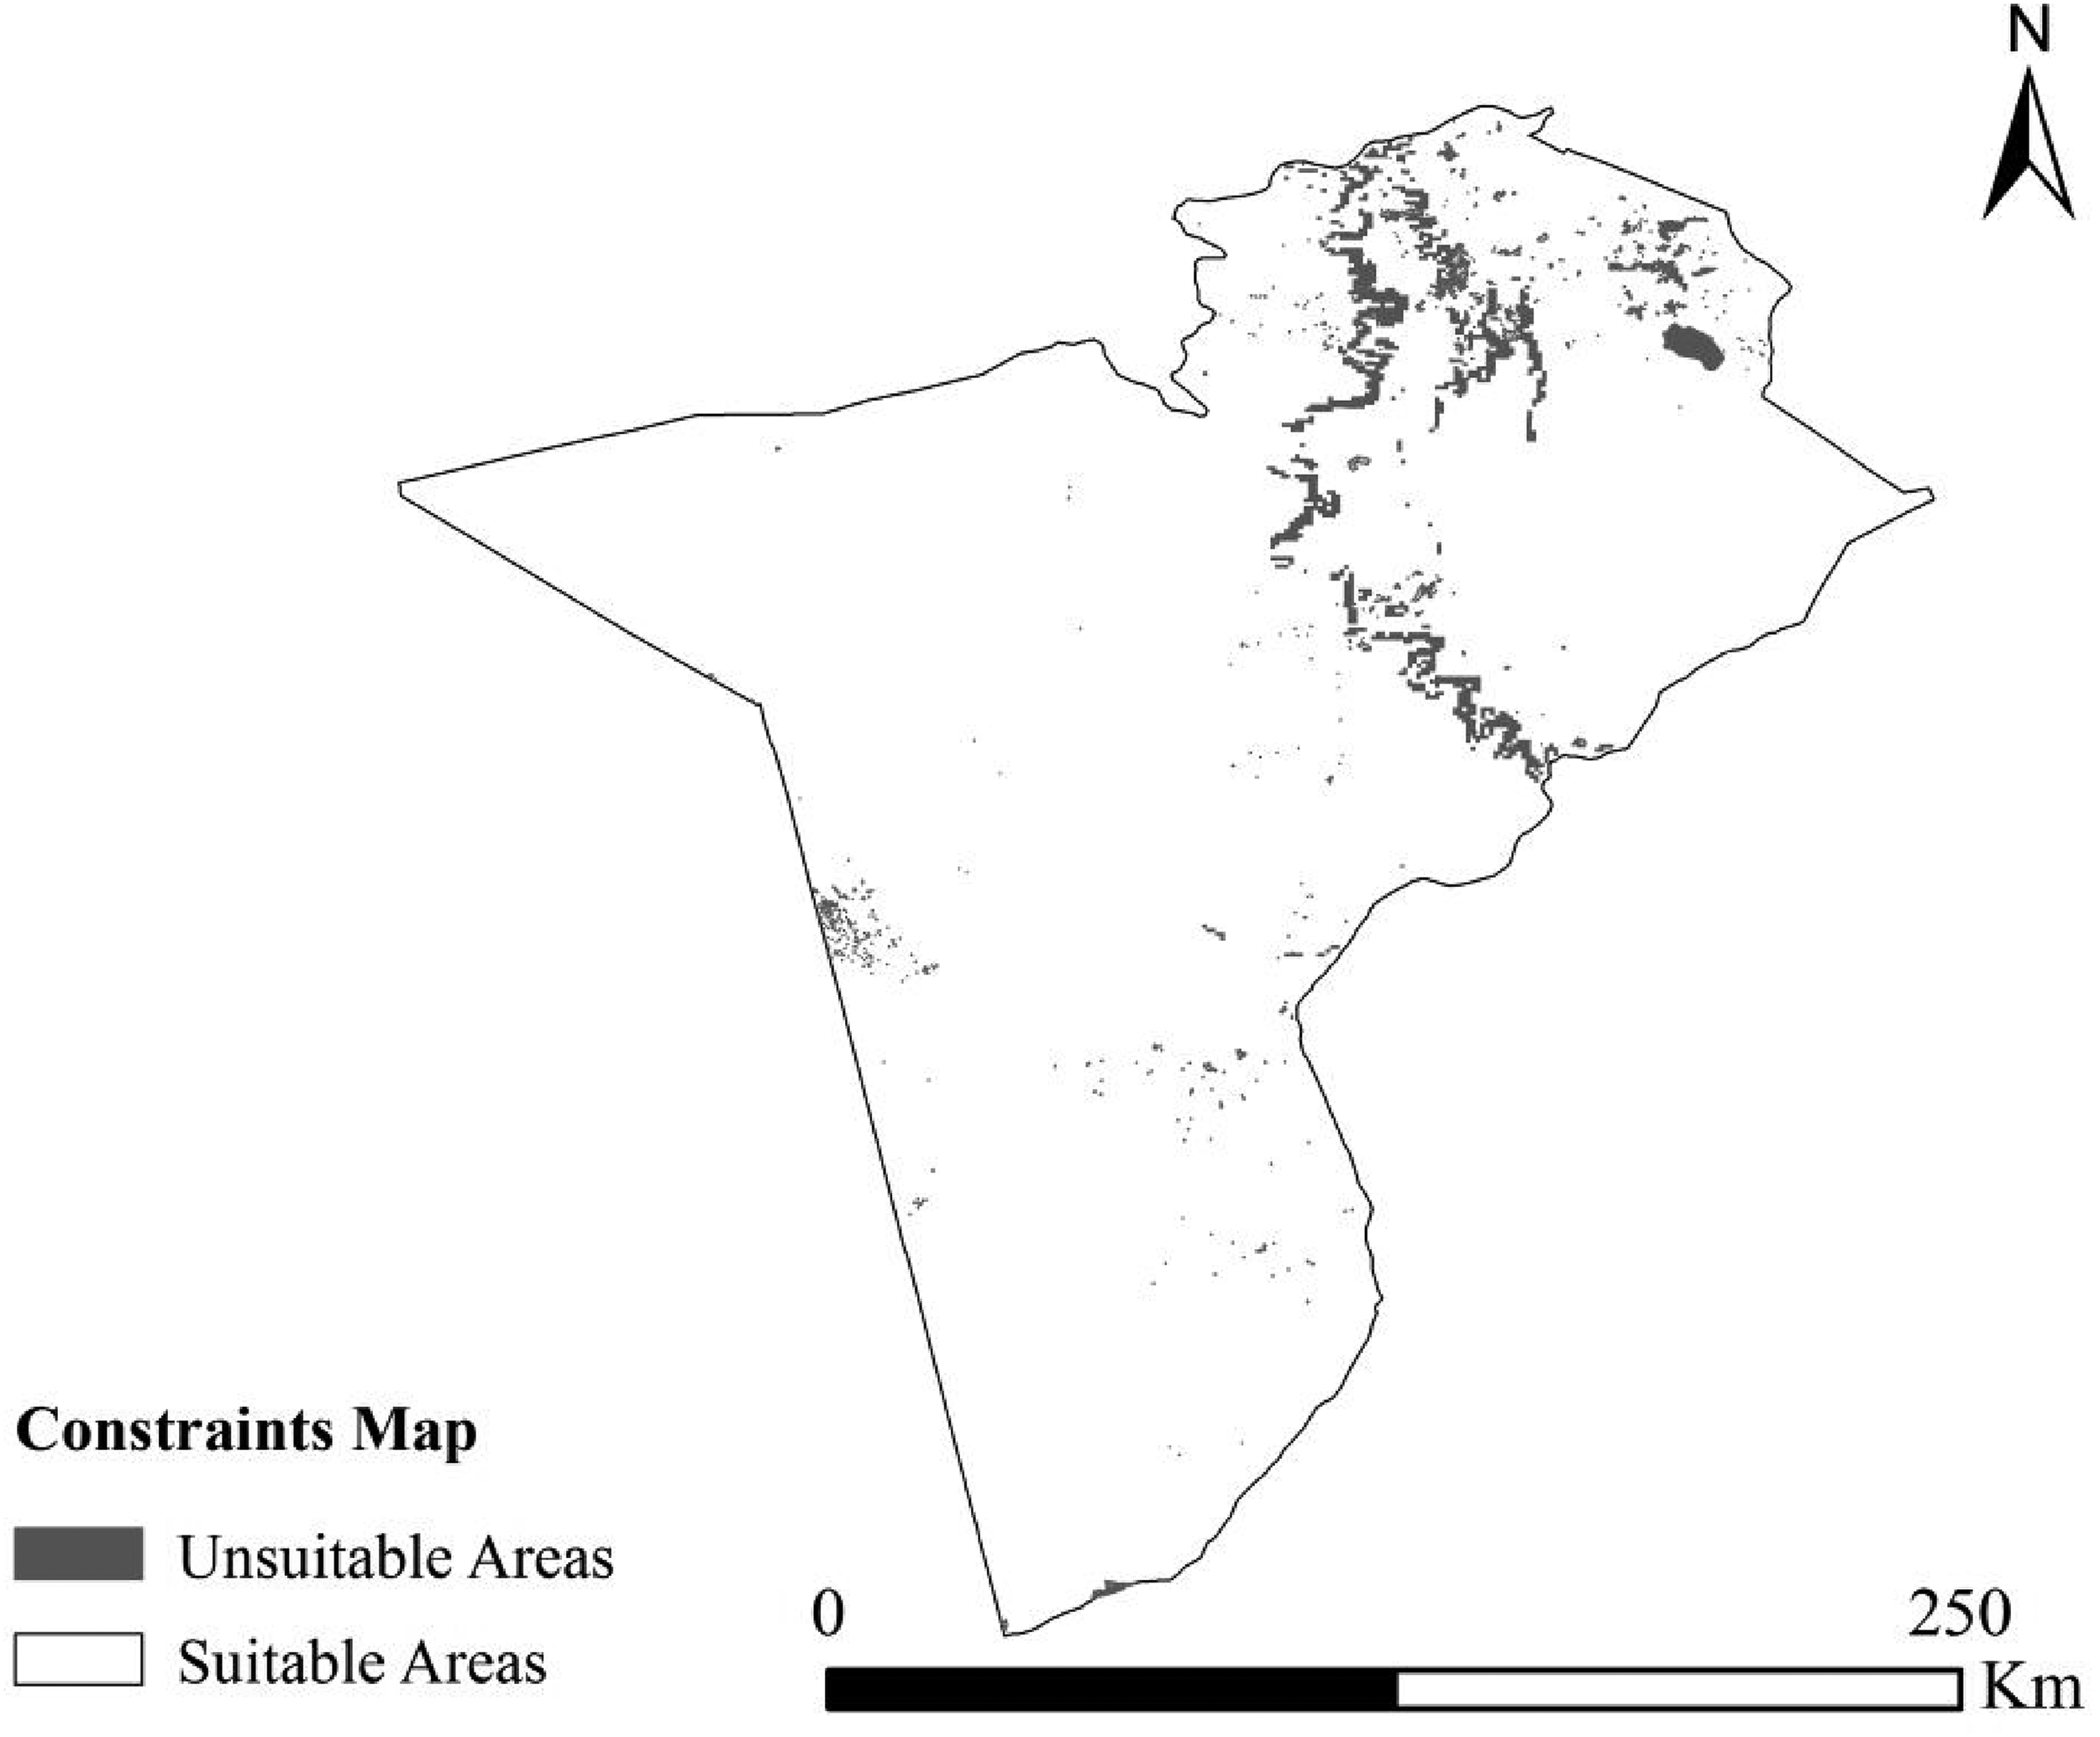
Constraints map.
Decision criteria
Climate
The selection of an appropriate location for solar PV–CSP or wind power plants depends heavily on climate factors such as solar irradiance, wind speeds, and temperatures. These parameters are crucial in determining the estimated power production capacity (Baseer et al., 2017; Effat and El-Zeiny, 2022; Ghasemi et al., 2019; Mutume, 2023). Therefore, it is essential to ensure that the selected location receives sufficient sunlight throughout the year. Previous research has shown that minimum annual GHI and DNI thresholds of 1477 kWh/m2 for and 1800kWh/m2 are necessary for achieving economic viability in typical PV and CSP systems (Aly et al., 2017; Spyridonidou and Vagiona, 2023). Likewise, when evaluating potential sites for constructing wind farms, average wind speeds play a pivotal role in the selection process. It is worth noting that PV modules’ efficiency relies on both isolation intensity and ambient temperature; higher temperatures have an adverse impact on system performance by causing energy losses of approximately 0.4%–0.5% per degree Celsius increase above 25°C (Günen, 2021). These criteria (Figure 4(a)–(d)) representing solar radiation, ambient temperatures, and wind speeds were derived from the SOLARGIS portal (www.solargis.com), the Global Wind Atlas (www.globalwindatlas.info/area/Tunisia), and the national institute of meteorology (www.meteo.tn/fr/donnees-climatiques).
Topography
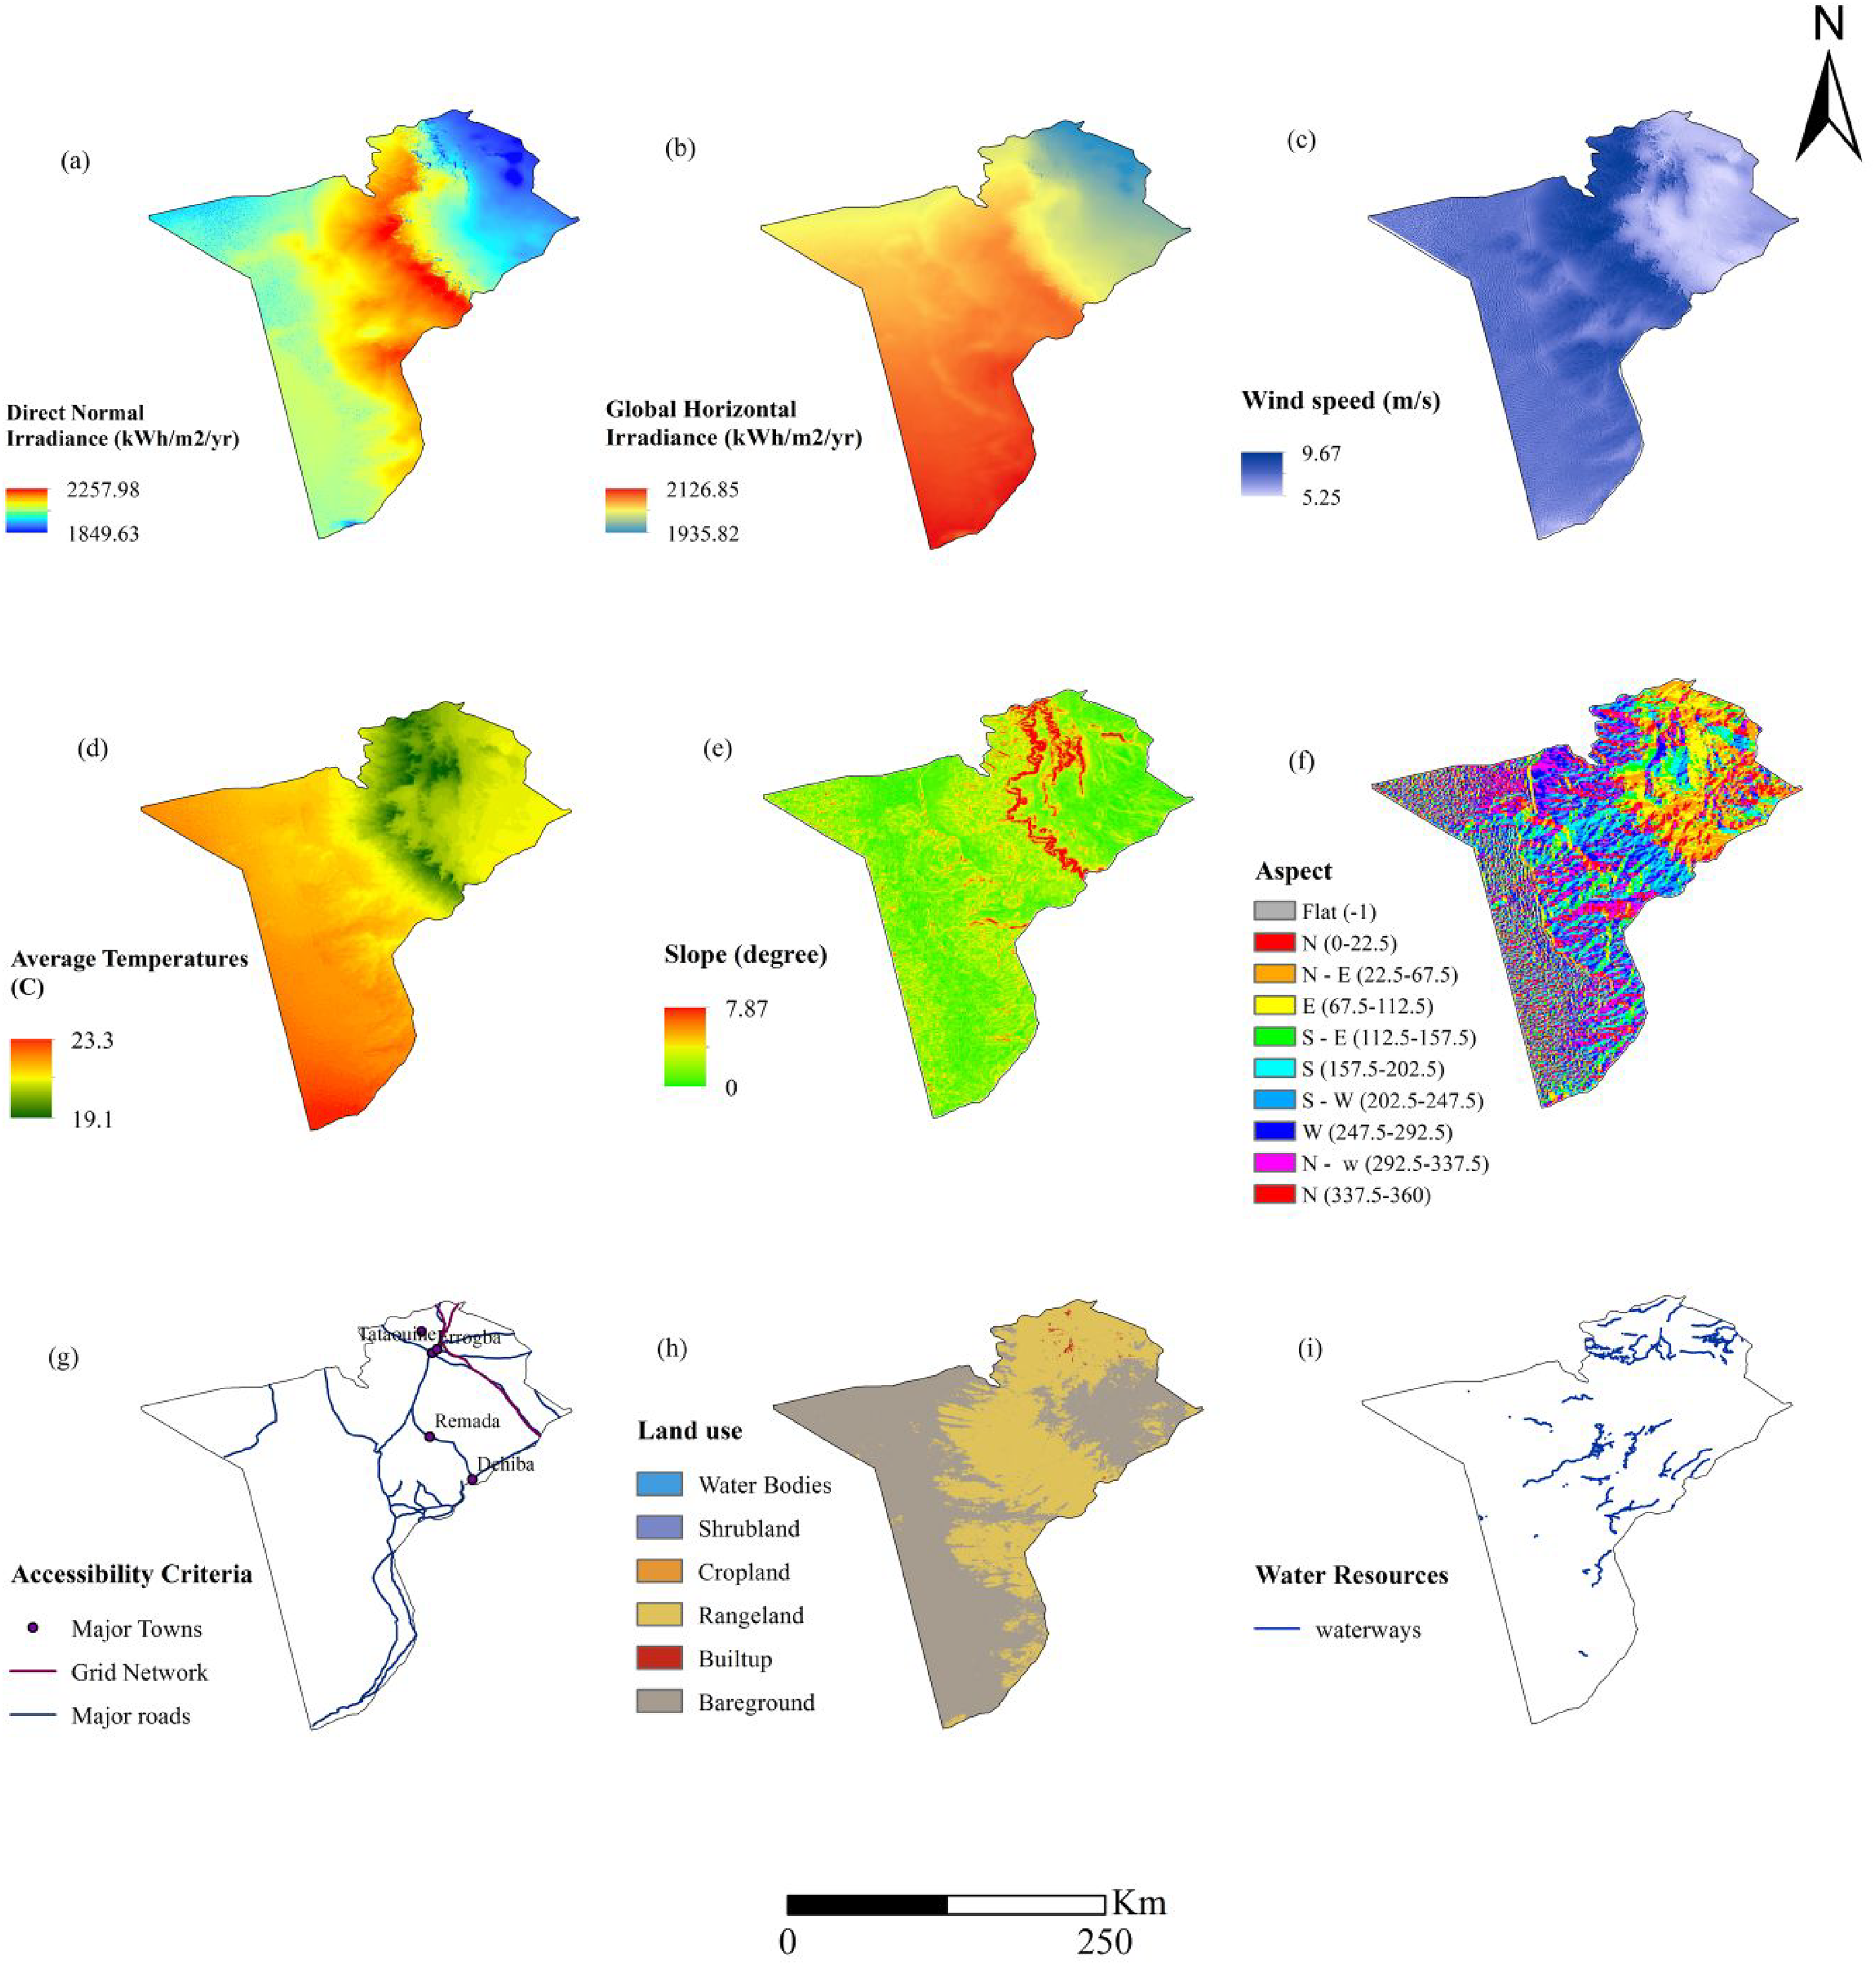
Decision criteria thematic maps: (a) DNI. (b) GHI. (c) Wind speed. (d) Ambient temperature. (e) Slope. (f) Aspect. (g) Accessibility criteria. (h) Land use. (i) Water Resources.
To ensure the economic viability of solar and wind facilities, careful consideration must be given to the topographic features of their location. It is imperative to establish these facilities on flat terrain or in areas with gentle slopes, as steeper inclinations can lead to increased construction and maintenance costs. Moreover, steep slopes may create shadows that adversely affect the performance of photovoltaic systems. Therefore, areas with lower slopes are highly favorable (Ali et al., 2019; Ghasemi et al., 2019; Günen, 2021). Typically, acceptable slope thresholds range between 3% and 5% for solar systems, whereas wind facilities may tolerate 10%–30% ranges (Effat and El-Zeiny, 2022). Moreover southeast to southwest-facing slopes are widely regarded as ideal within the Northern Hemisphere due to maximum sunlight exposure (Al Garni and Awasthi, 2017; Effat and El-Zeiny, 2022; Koc et al., 2019). A 30 m Digital Elevation Model (https://blog.arabnubia.com/2020/05/tunisia-nasadem-digital-elevation-model-1-arc-second) was used to process these criteria, as depicted in Figure 4(e)–(f).
Accessibility
Environment
Placing solar and wind systems near the grid network is crucial for ensuring their long-term viability. Power losses and distribution costs are closely tied to the distance from end-users, making it essential to minimize line spacing between the grid and these systems. Additionally, transportation infrastructure also plays a crucial role in the site selection process, as it significantly affects the overall project costs (Albraheem and AlAwlaqi, 2023; Elkadeem et al., 2021). Easy access at a potential site not only reduces construction-related costs during the building and operational phases but also contributes to enhanced efficiency (Günen, 2021; Tercan et al., 2020). Therefore, selecting sites with favorable accessibility becomes imperative. These accessibility criteria (Figure 4(i)) were obtained from the open street map project 2022 (http://download.geofabrik.de/africa/tunisia.html).
From an environmental perspective, renewable energy facilities have to be placed within areas that are free from limitations associated with land use, which significantly hinders the deployment of such facilities like sand dunes, forests, mountains, water bodies, archeological sites, military zones, etc. In the literature, typical types of land use that are considered best suited for installing renewable energy projects include bare grounds and rangelands with sparse vegetation (Al Garni and Awasthi, 2017). Moreover, the construction and operation of certain renewable technologies, such as CSP plants, require substantial amounts of water (Aly et al., 2017; Mutume, 2023; Yushchenko et al., 2018). Therefore, it is essential to have adequate water resources in CSP plants to ensure efficient operation since cooling systems and steam generation rely heavily on water. The criterion of land use (Figure 4(h)) was derived from a high-resolution map provided by ESA (https://esa-worldcover.org/en), while the water resources (Figure 4(i)) were obtained from OSM project 2022.
Results and discussion
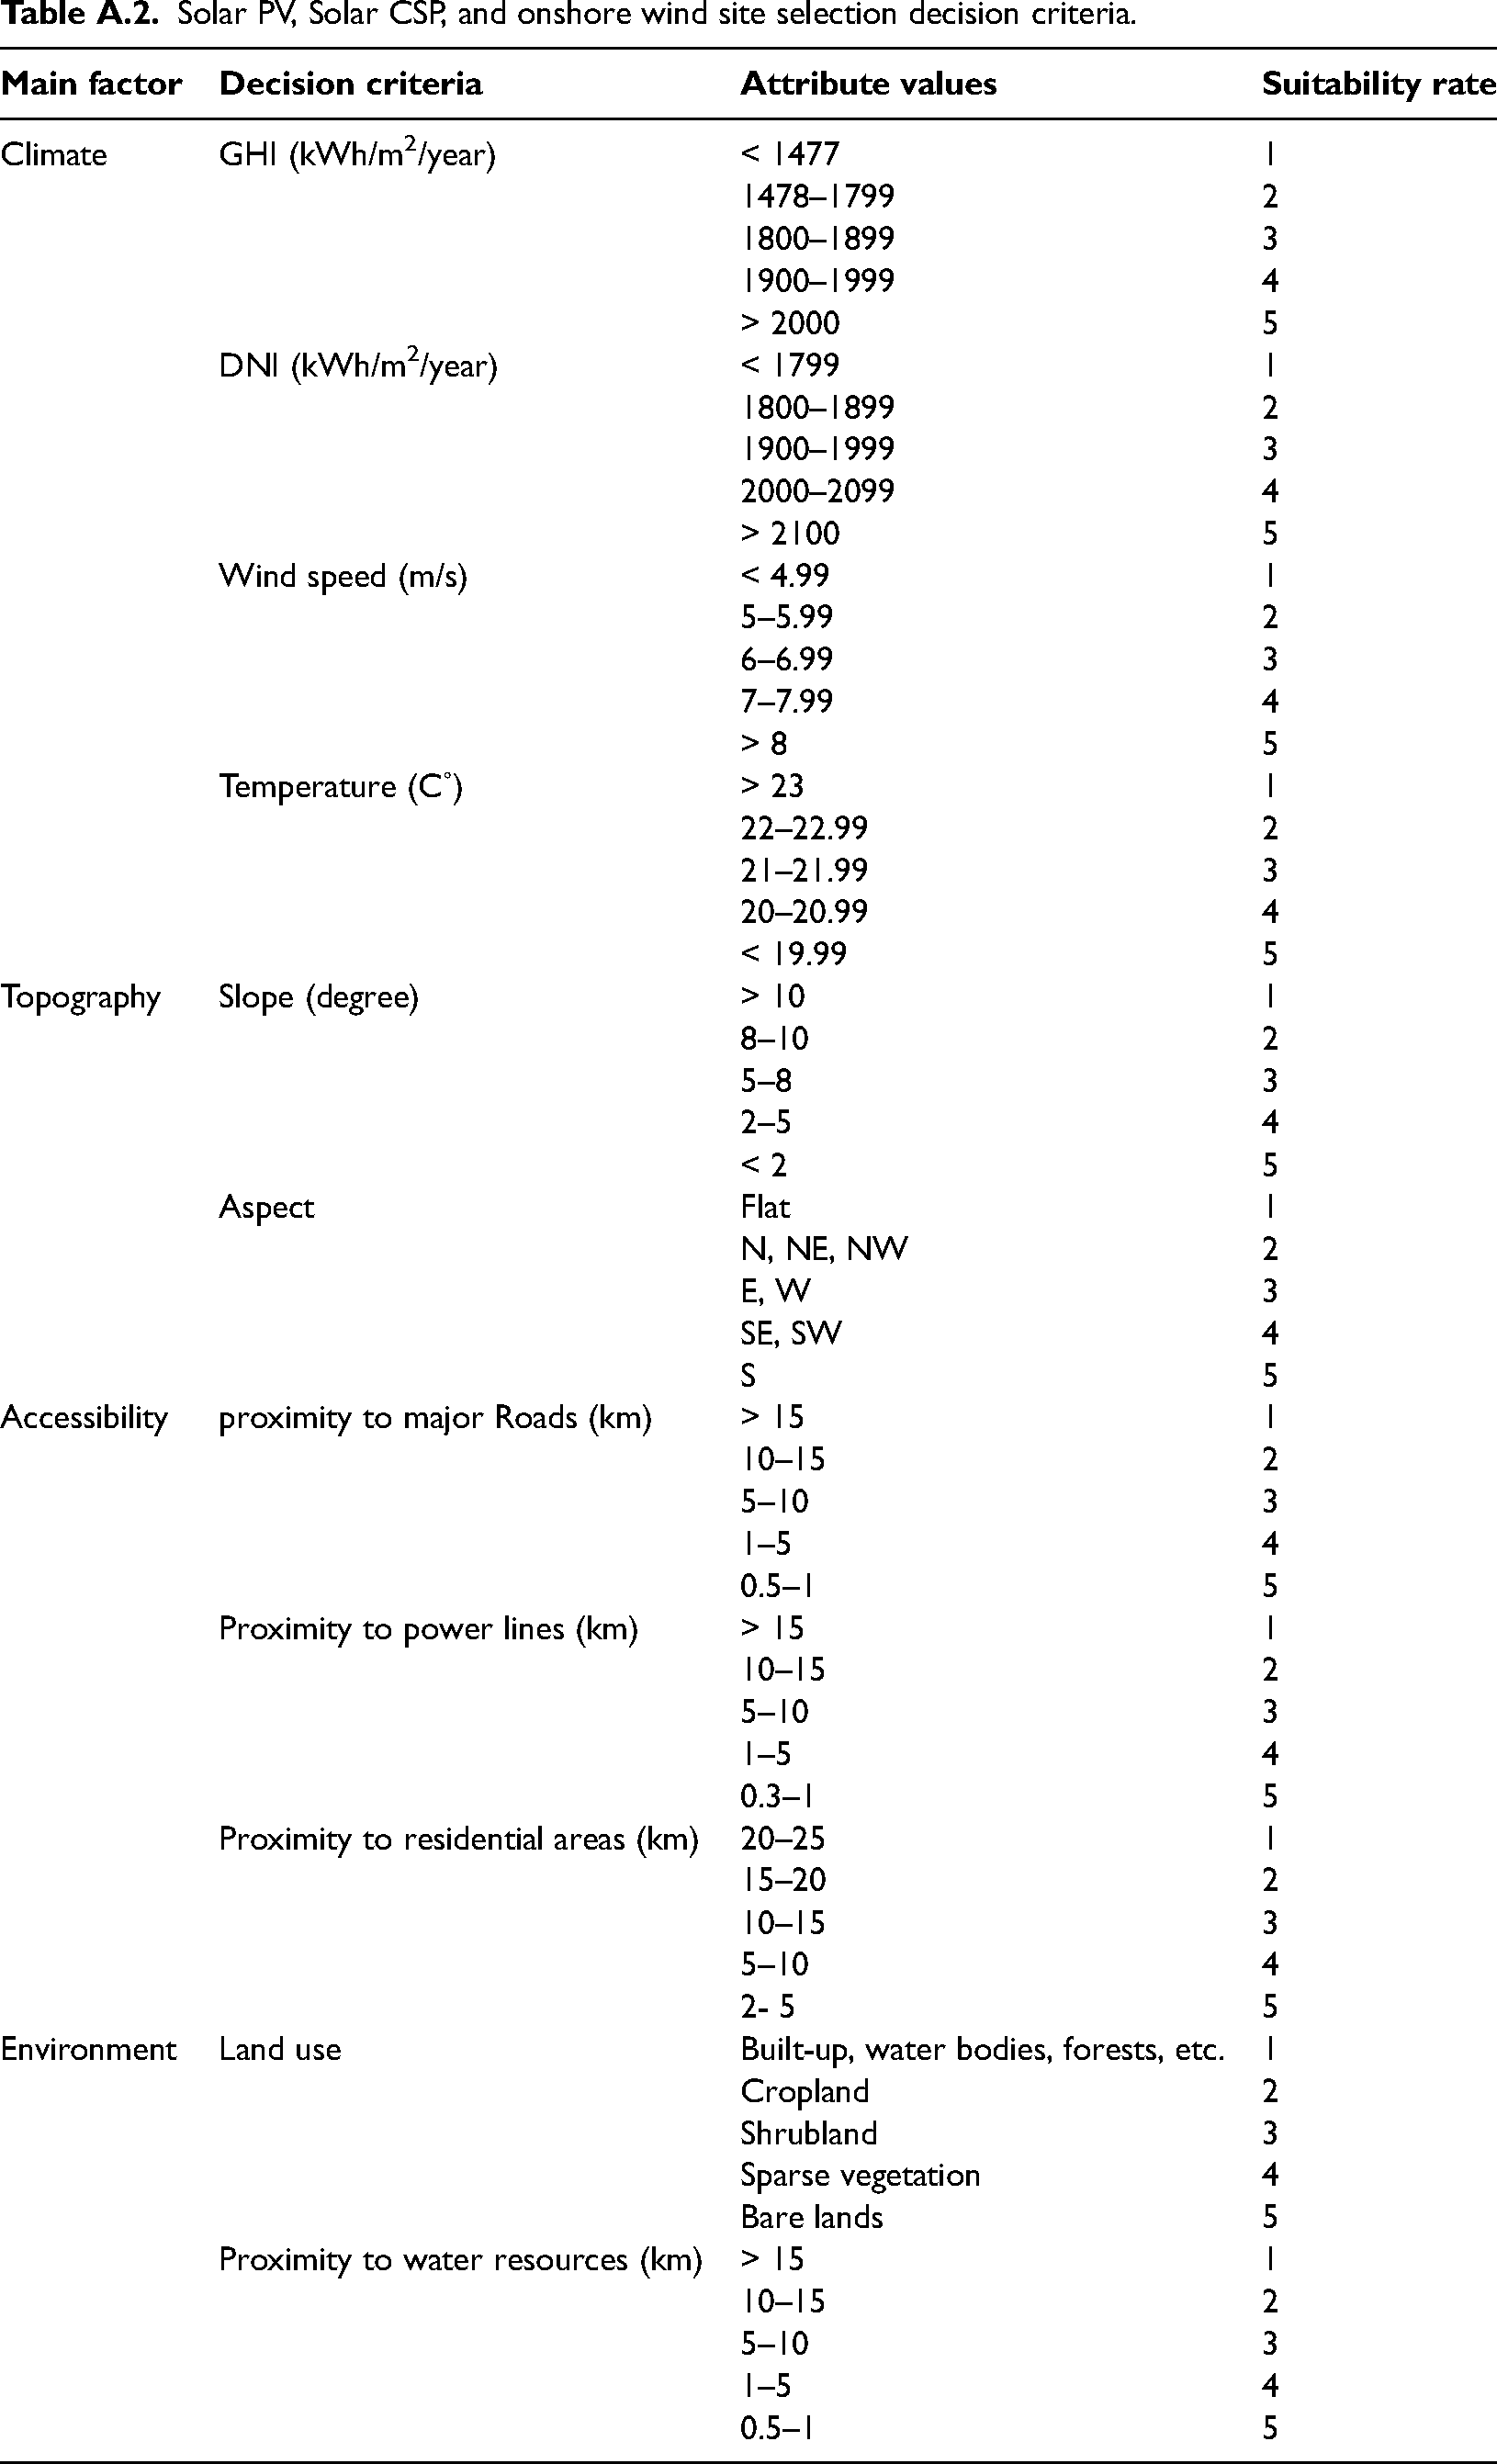
After eliminating these constraints, a spatial suitability analysis was conducted to identify optimal locations for deploying PV–wind, PV–CSP, and CSP–wind hybrid systems in the Tataouine region. To conduct this analysis, the study utilized Spatial Analyst tools within the ArcGis 10.8., which are widely recognized as effective solutions for addressing complex site selection challenges. Data from various layers were standardized onto a common scale and then reclassified accordingly (see Table A.2 in Appendix A). Each reclassified input layer was weighted based on its relative importance derived from the AHP technique. Ultimately, the raster calculator tool was used to extract final maps displaying suitability levels for each system. The integration of satellite data enabled a thorough evaluation of the climatic and topographical factors in the potential areas studied. This combined approach significantly enhanced the precision of the MCDM method, providing a more accurate representation of ground conditions. Additionally, remote sensing data revealed that our chosen sites exhibited high levels of solar irradiance and consistent wind speeds, indicating their substantial potential for solar and wind energy generation.
Pairwise comparisons
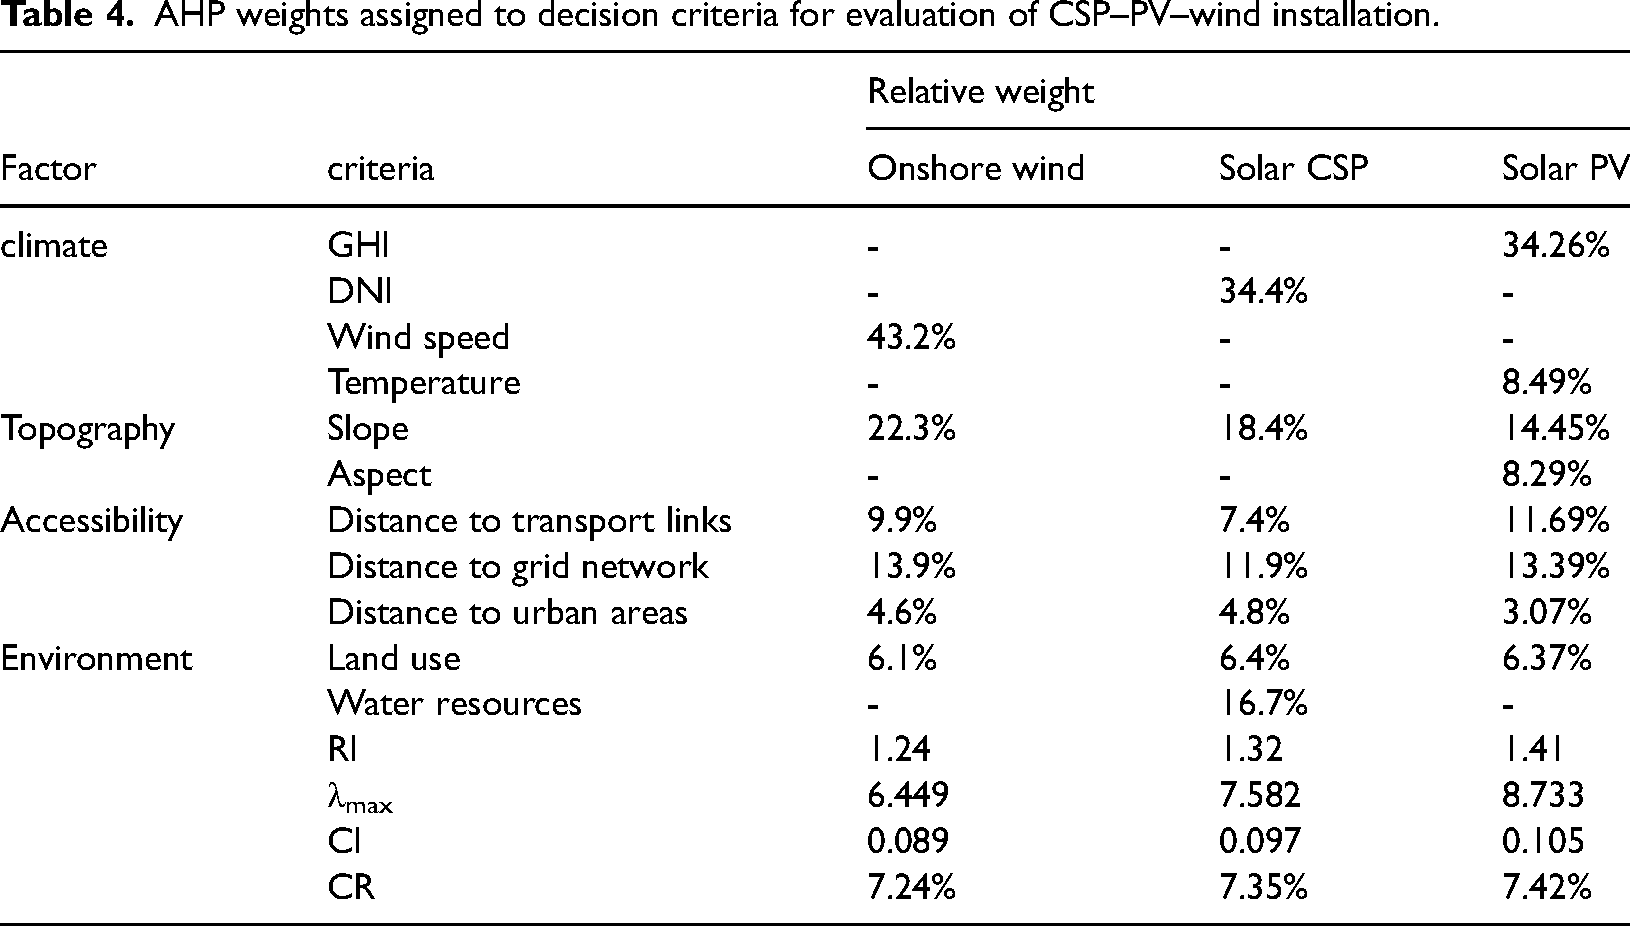
The AHP model developed in this study highlighted the influential role of resource and topography criteria, specifically wind speed, GHI, DNI, and slope, as outlined in Table 4. Climate criteria emerged as major determining factors for wind, solar CSP, and solar PV, with scores of 43.2%, 34.4%, and 34.26%, respectively. As expected, a higher availability of resources directly contributes to increased electricity generation potential. Slope ranked next in terms of influencing site selection decisions for the three technologies, securing second position on the importance scale. Therefore, it is crucial to locate these facilities on flat or gently sloping terrain while minimizing proximity to transport links or power grids in order to prevent additional expenses. Which is why the grid and transport infrastructure were assigned higher weights for all the technologies. Nevertheless, it has been deduced from the extensive literature that solar PV systems are highly sensitive to temperature and aspect factors due to their direct impact on power output while the availability of water resources assures the CSP systems’ maximum performance. As for PV technology, these factors had similar weights of nearly 8.5%, while the criterion of water resources obtained a respective score of 16.7%. Lastly, based on the experts’ feedback, land use and proximity to residential areas were perceived as the least influential factors.
AHP weights assigned to decision criteria for evaluation of CSP–PV–wind installation.
Spatial distribution
Single technologies
The perusal of the wind suitability map (Figure 5(a)) indicates that 3.44% of the total surface area, approximately 1129 km2, is highly suitable for wind energy generation. Areas falling under the “suitable,” “moderately suitable,” “least suitable,” and “least suitable” classes represented 25.65%, 34.11%, 20.91%, and 15.89%, respectively (Figure 6). Furthermore, the spatial analysis revealed that the most favorable locations for wind were densely scattered, mainly in the northernmost to the northeast and central to the southern east parts of the region. It was observed that Remada and Dhiba were by far the most promising locations for hosting wind facilities, accounting for nearly 83% of those sites.
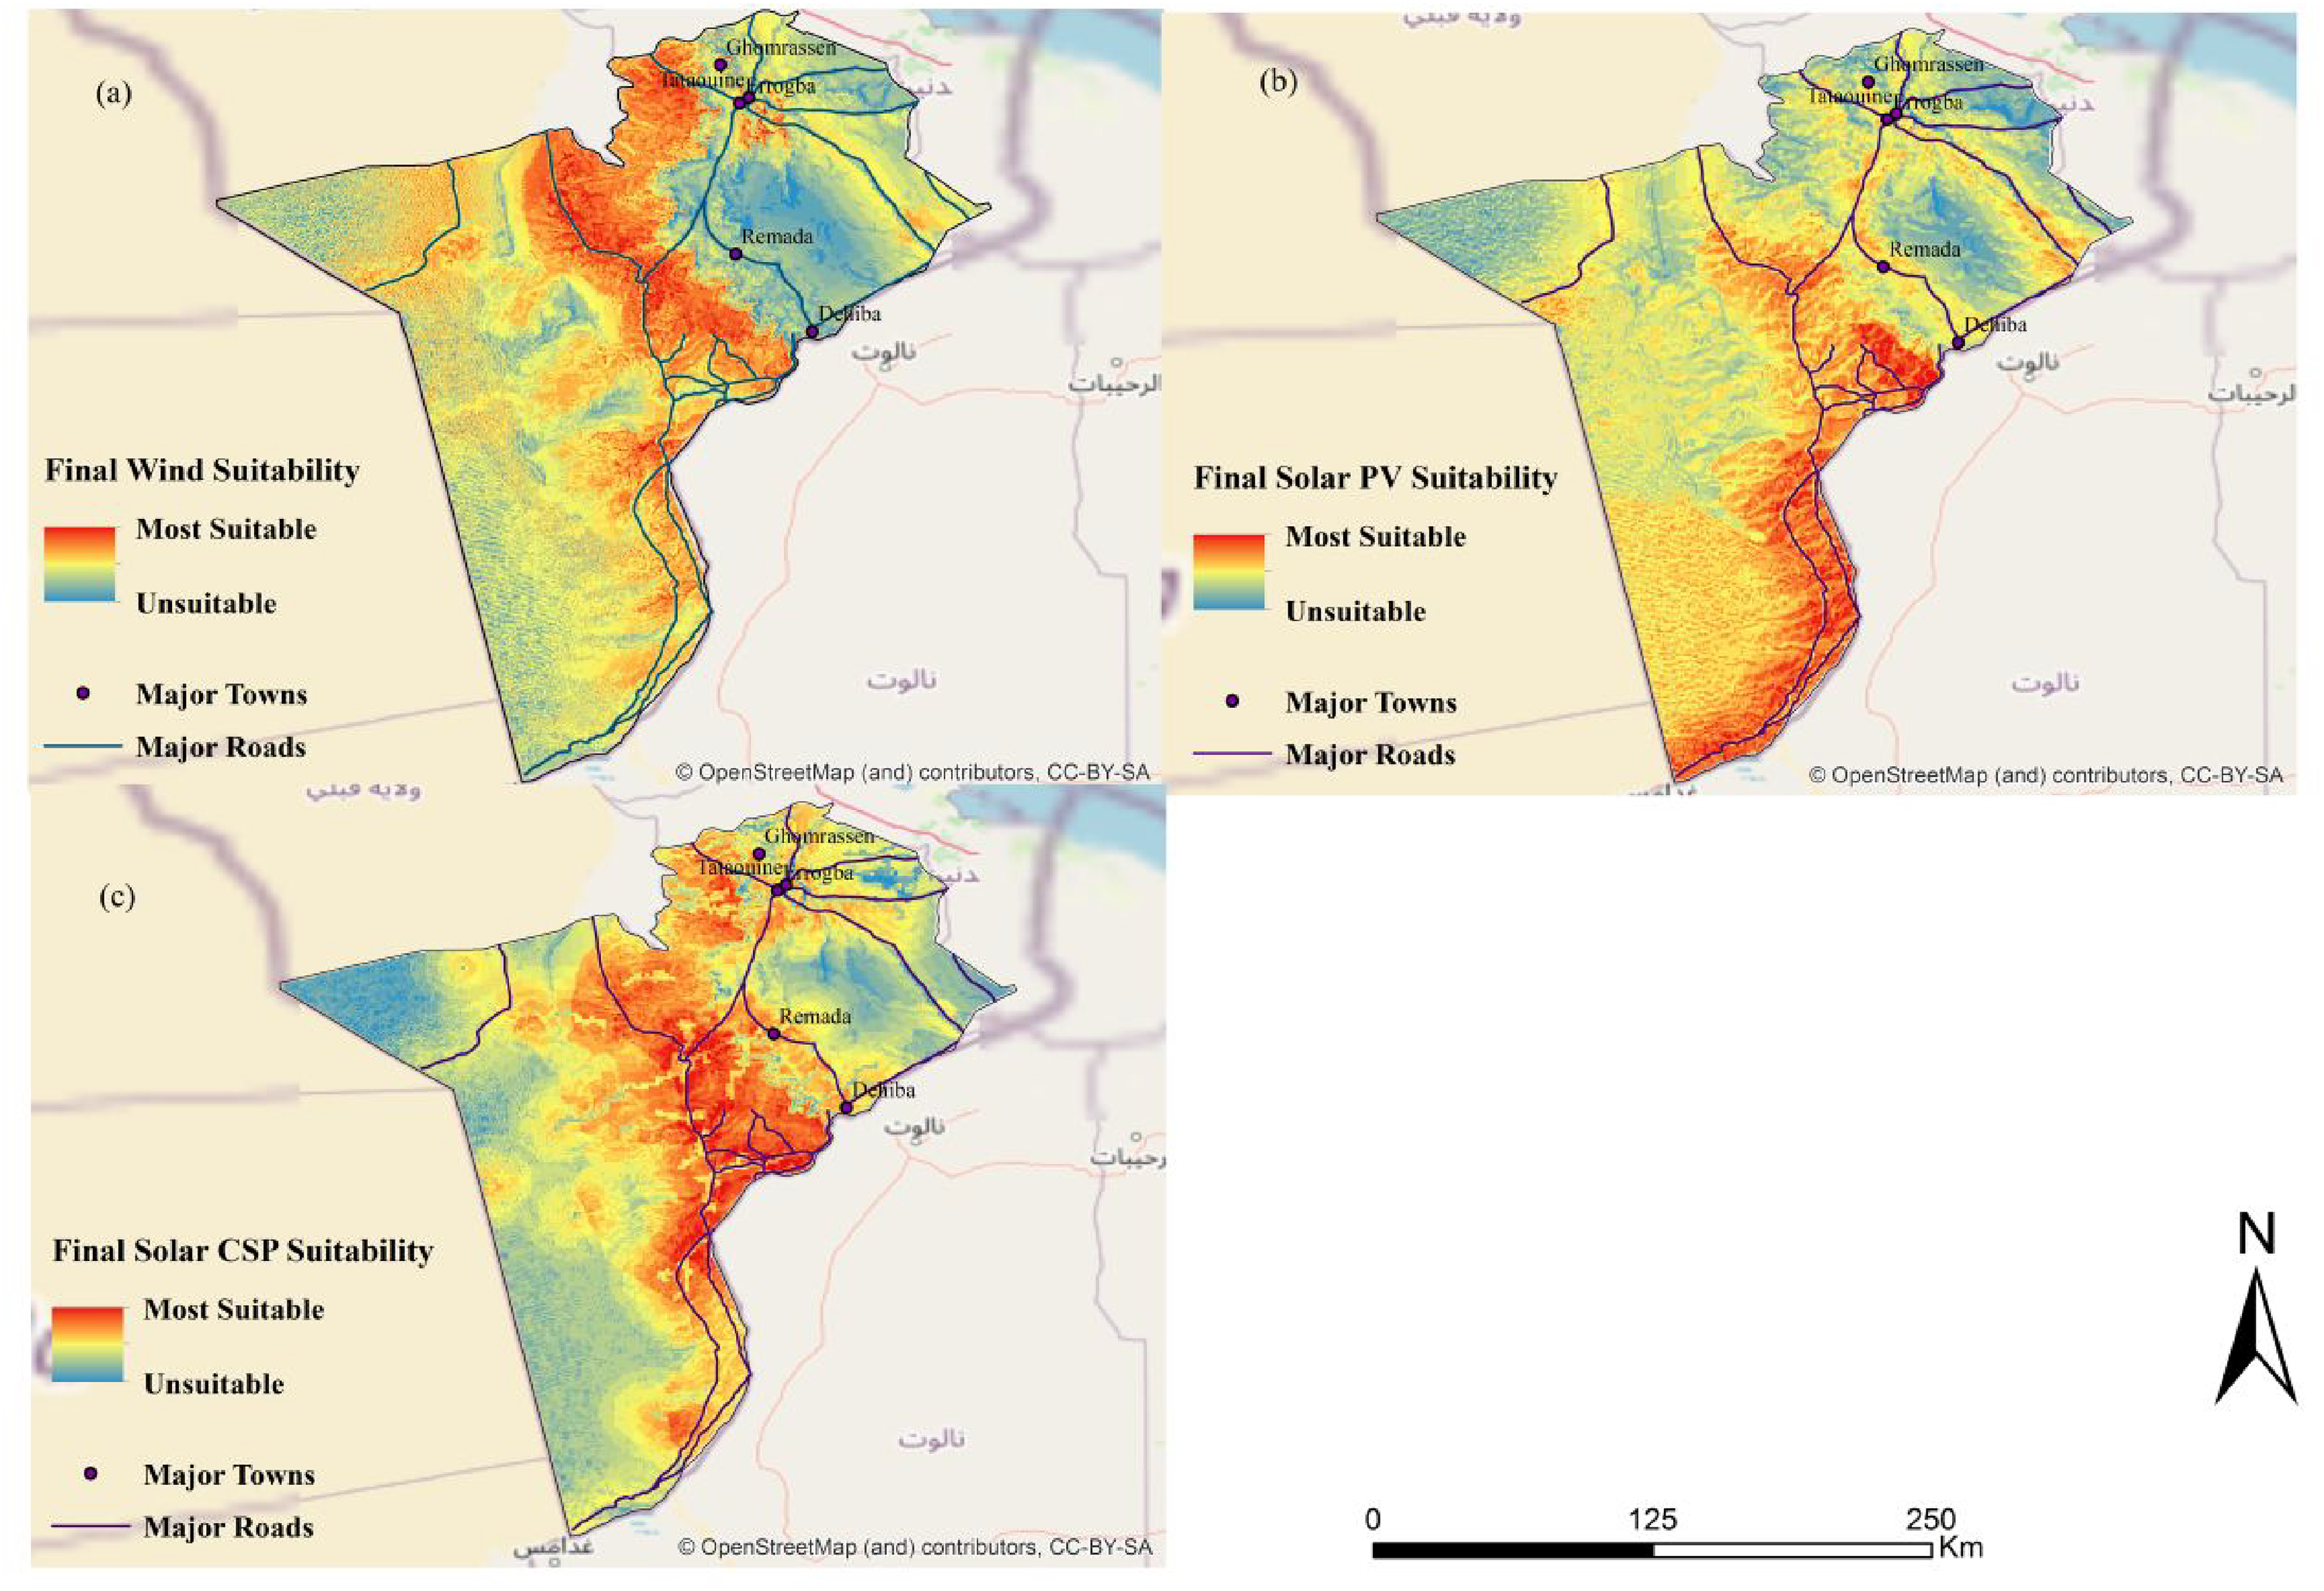
Final suitability maps. (a) Wind suitability map. (b) Solar PV suitability map. (c) Solar CSP suitability map.
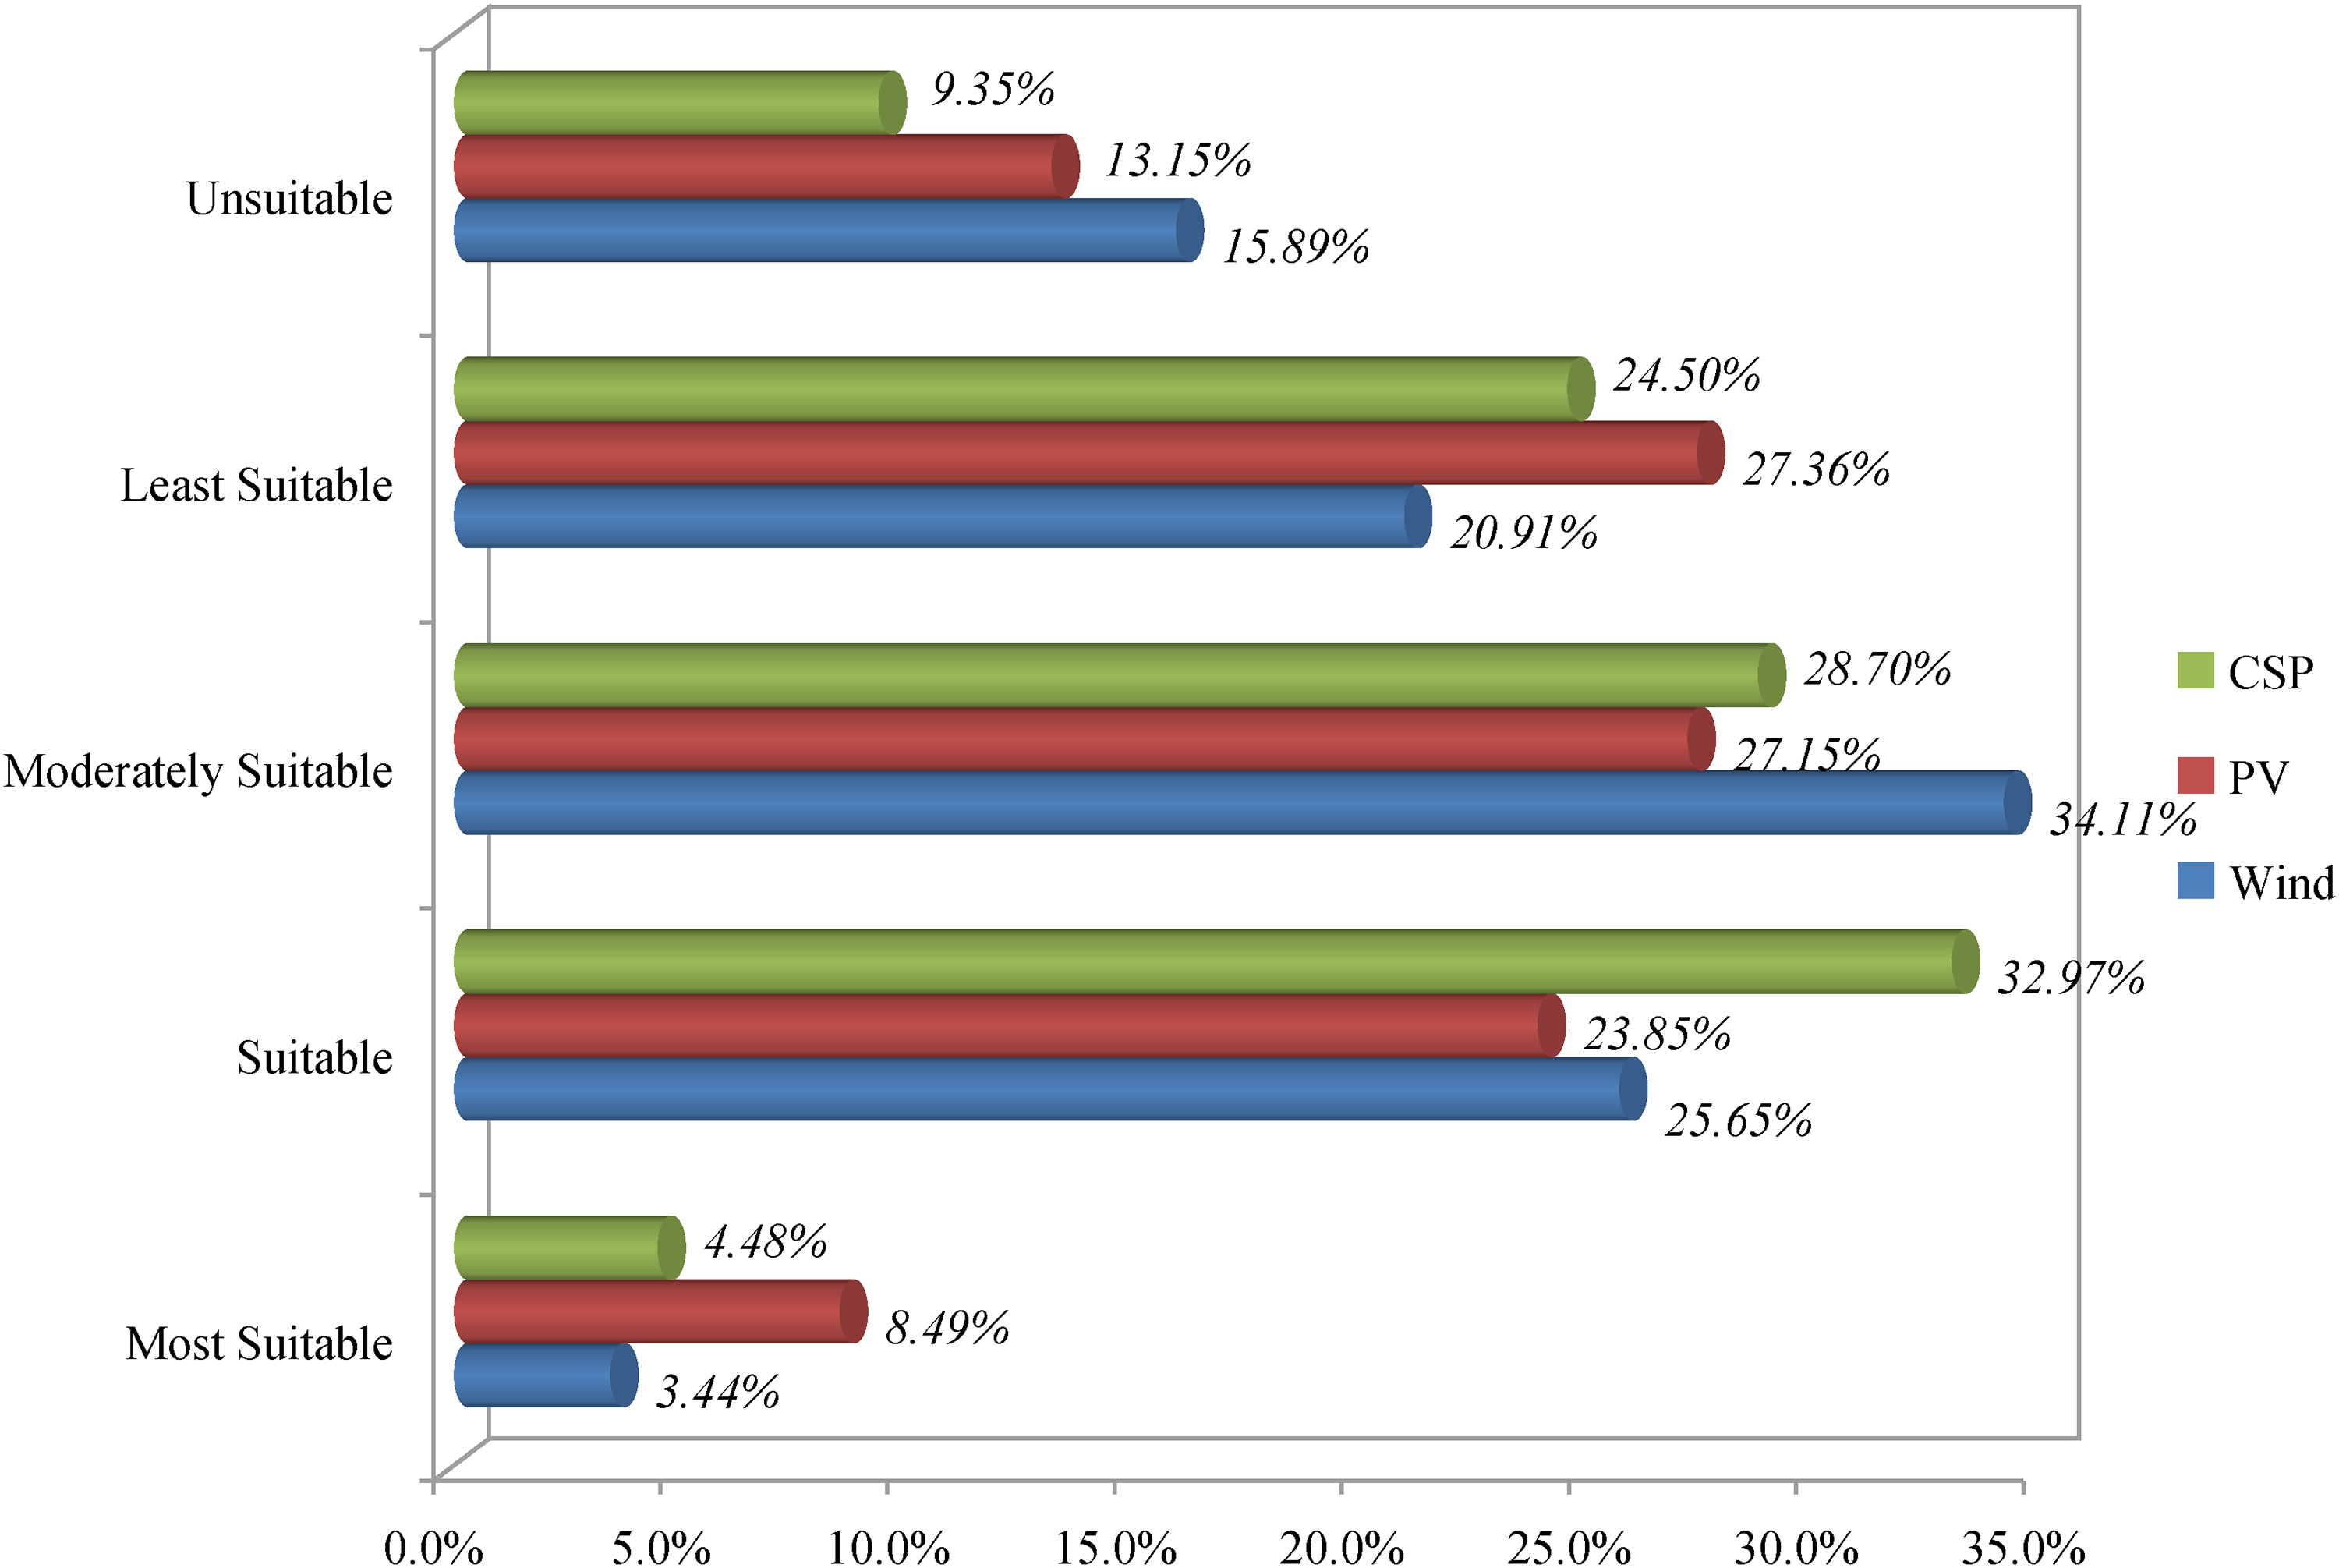
Land distribution for single technologies.
As for CSP technology (Figure 5(b)), the land suitability analysis revealed that nearly 1740 km2, representing 4.48% of the total available area, were most suitable for installing CSP power plants in Tataouine. In addition, it was observed that the geographical distribution of the highly desirable sites followed the same pattern as that of wind, where Remada and Dhiba comprised more than 95% of optimal locations.
In contrast, the spatial analysis showed that the well-suited locations for solar PV technology were almost threefold and twofold those of wind and CSP, respectively. They represented 8.5% of the total surface area and covered an area of 3435 km2. Such locations were concentrated from the southern east to the southernmost parts of Tataouine (Figure 5(c)).
Hybrid systems
The integrated approach facilitated the identification of potential locations that have the capacity to support different hybrid combinations of PV–wind (Figure 7), CSP–PV (Figure 8), and CSP–wind (Figure 9). By evaluating the geographical alignment of suitable sites, it was possible to determine 792.698 km2 of land that is highly favorable for PV–CSP hybrid systems. Conversely, potential sites for installing CSP–wind and PV–wind systems were way less than those of the first combination, covering areas of 411 km2 and 333 km2, respectively. Among such locations, Remada and Dhiba appeared to be exceptionally well-suited for such hybrid energy systems. This outcome signifies the importance of utilizing these hybrid systems in this region. Owing to their complementary nature, it is possible to ensure a balanced power generation profile and maximize resource utilization. In addition, the shared infrastructure and innovative storage solutions would further improve the reliability and grid integration of these hybrid facilities.
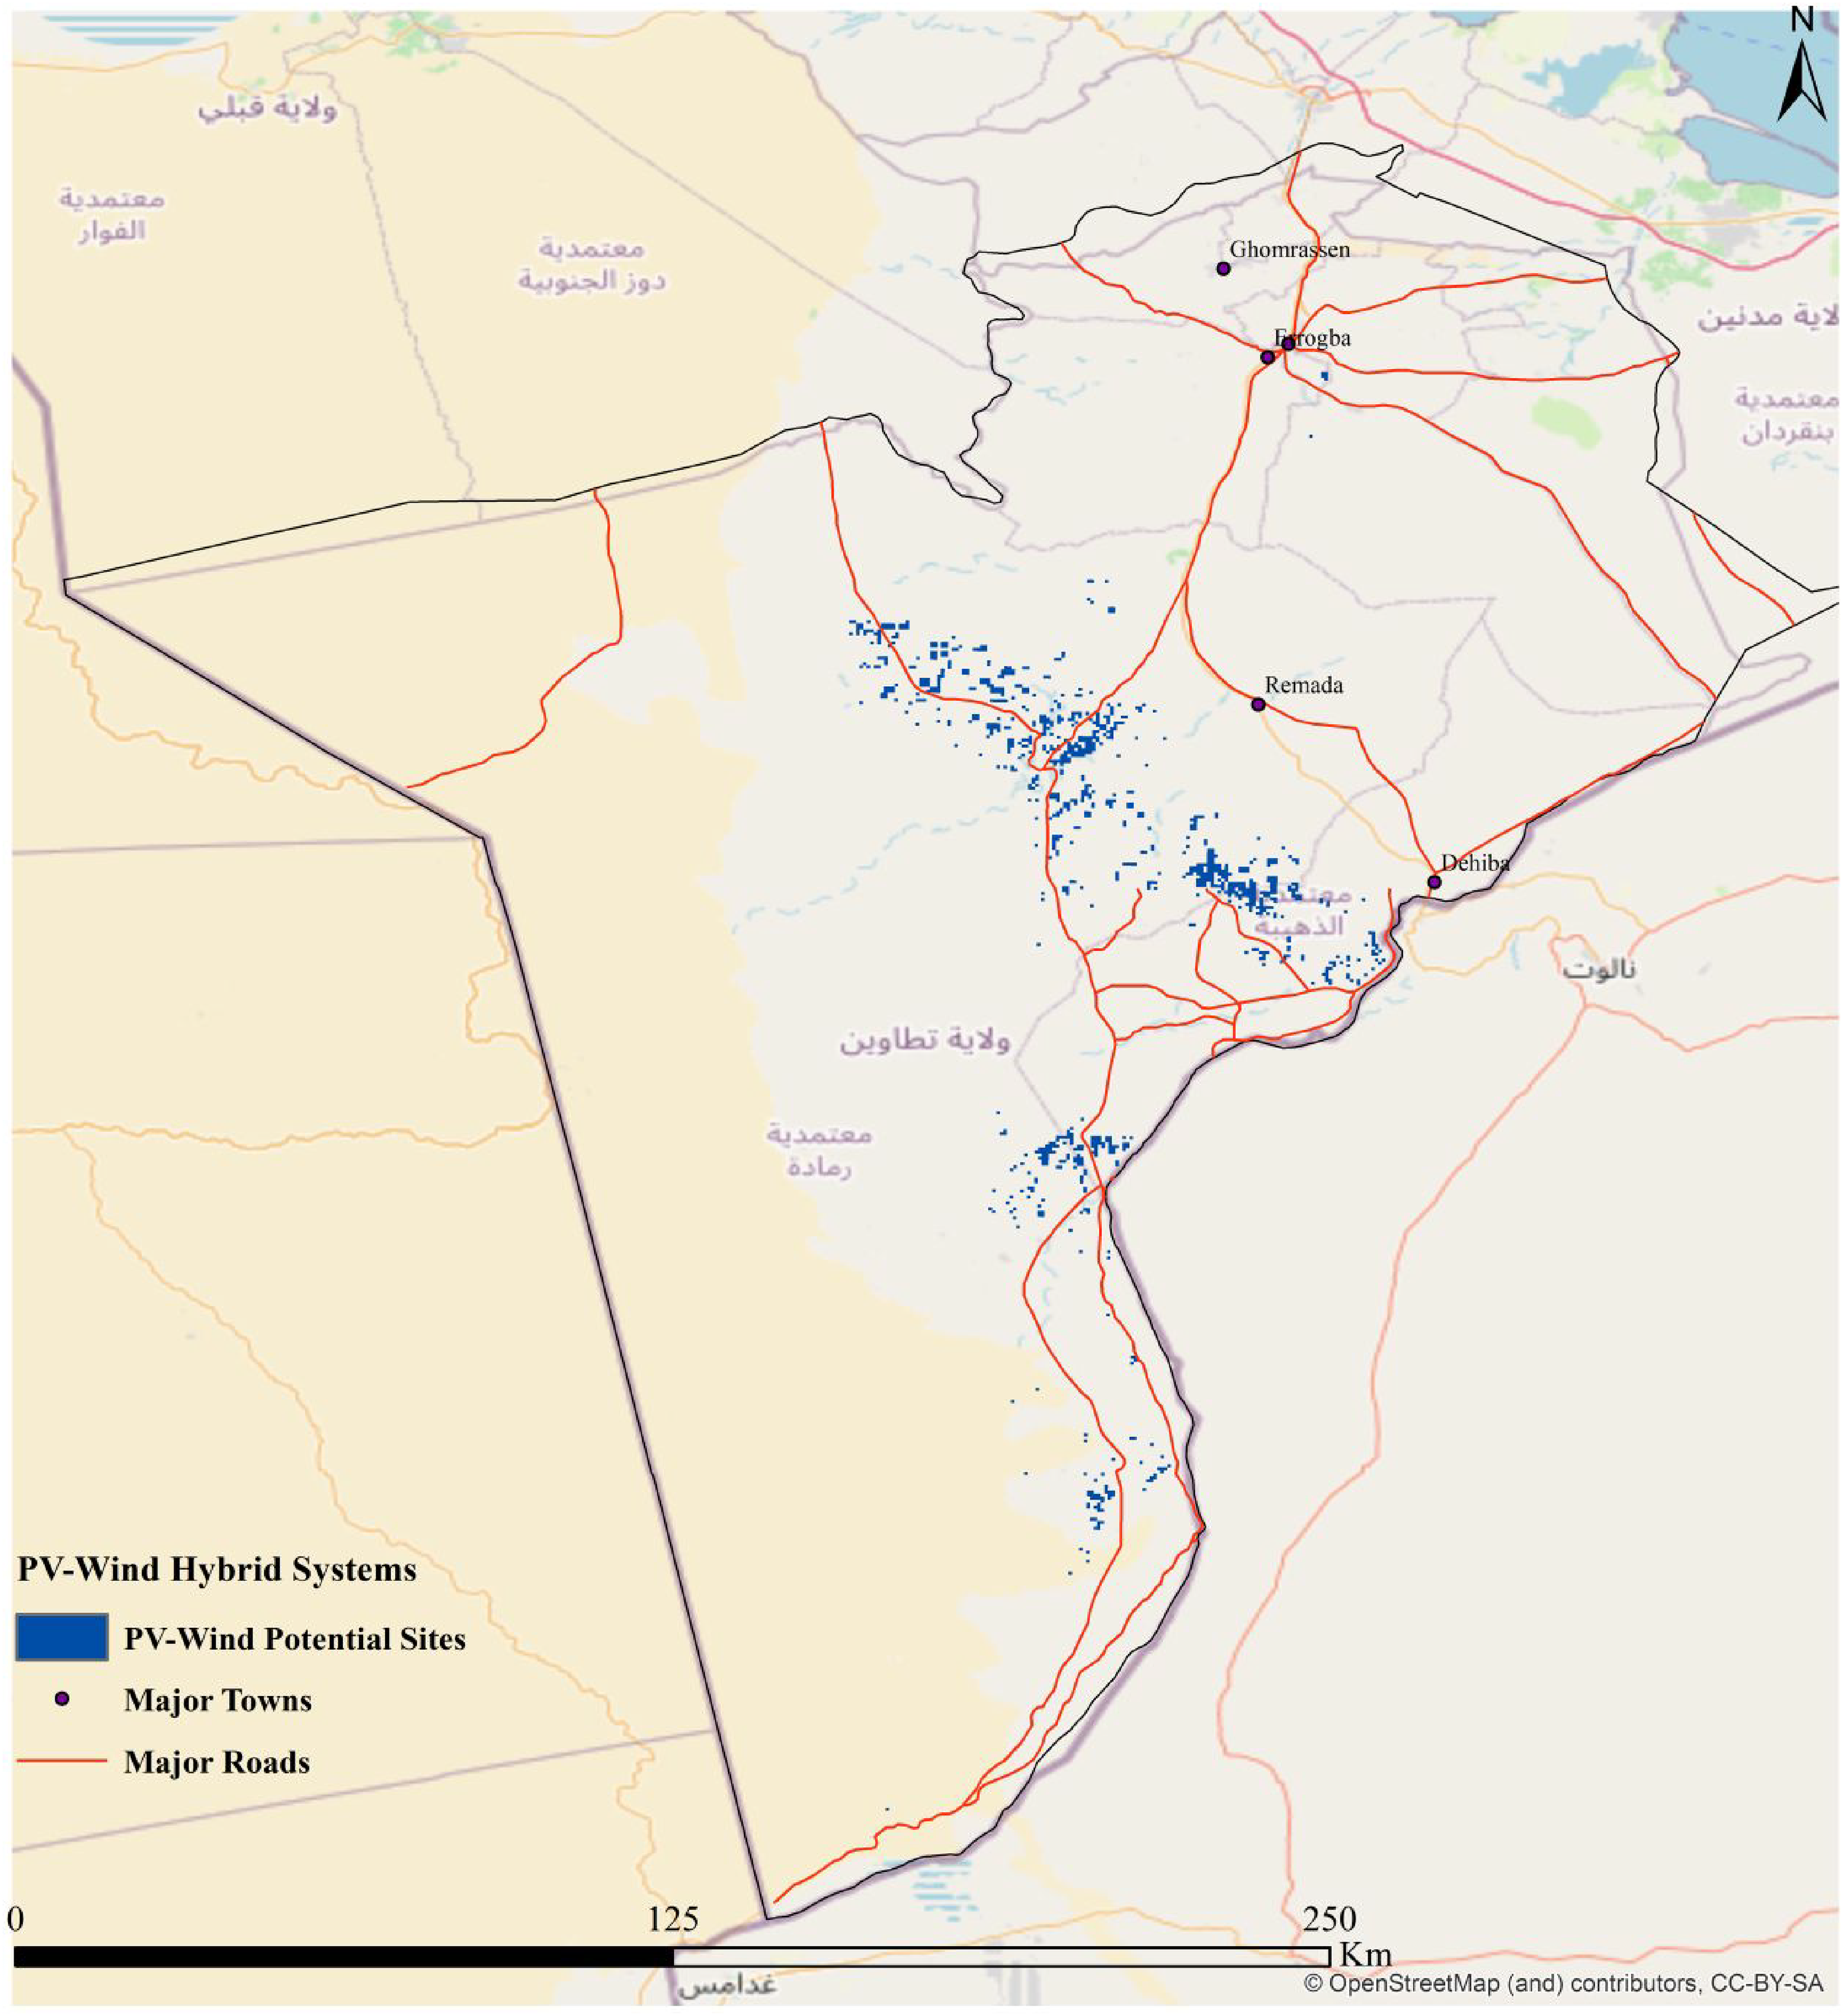
Potential PV–wind hybrid sites.
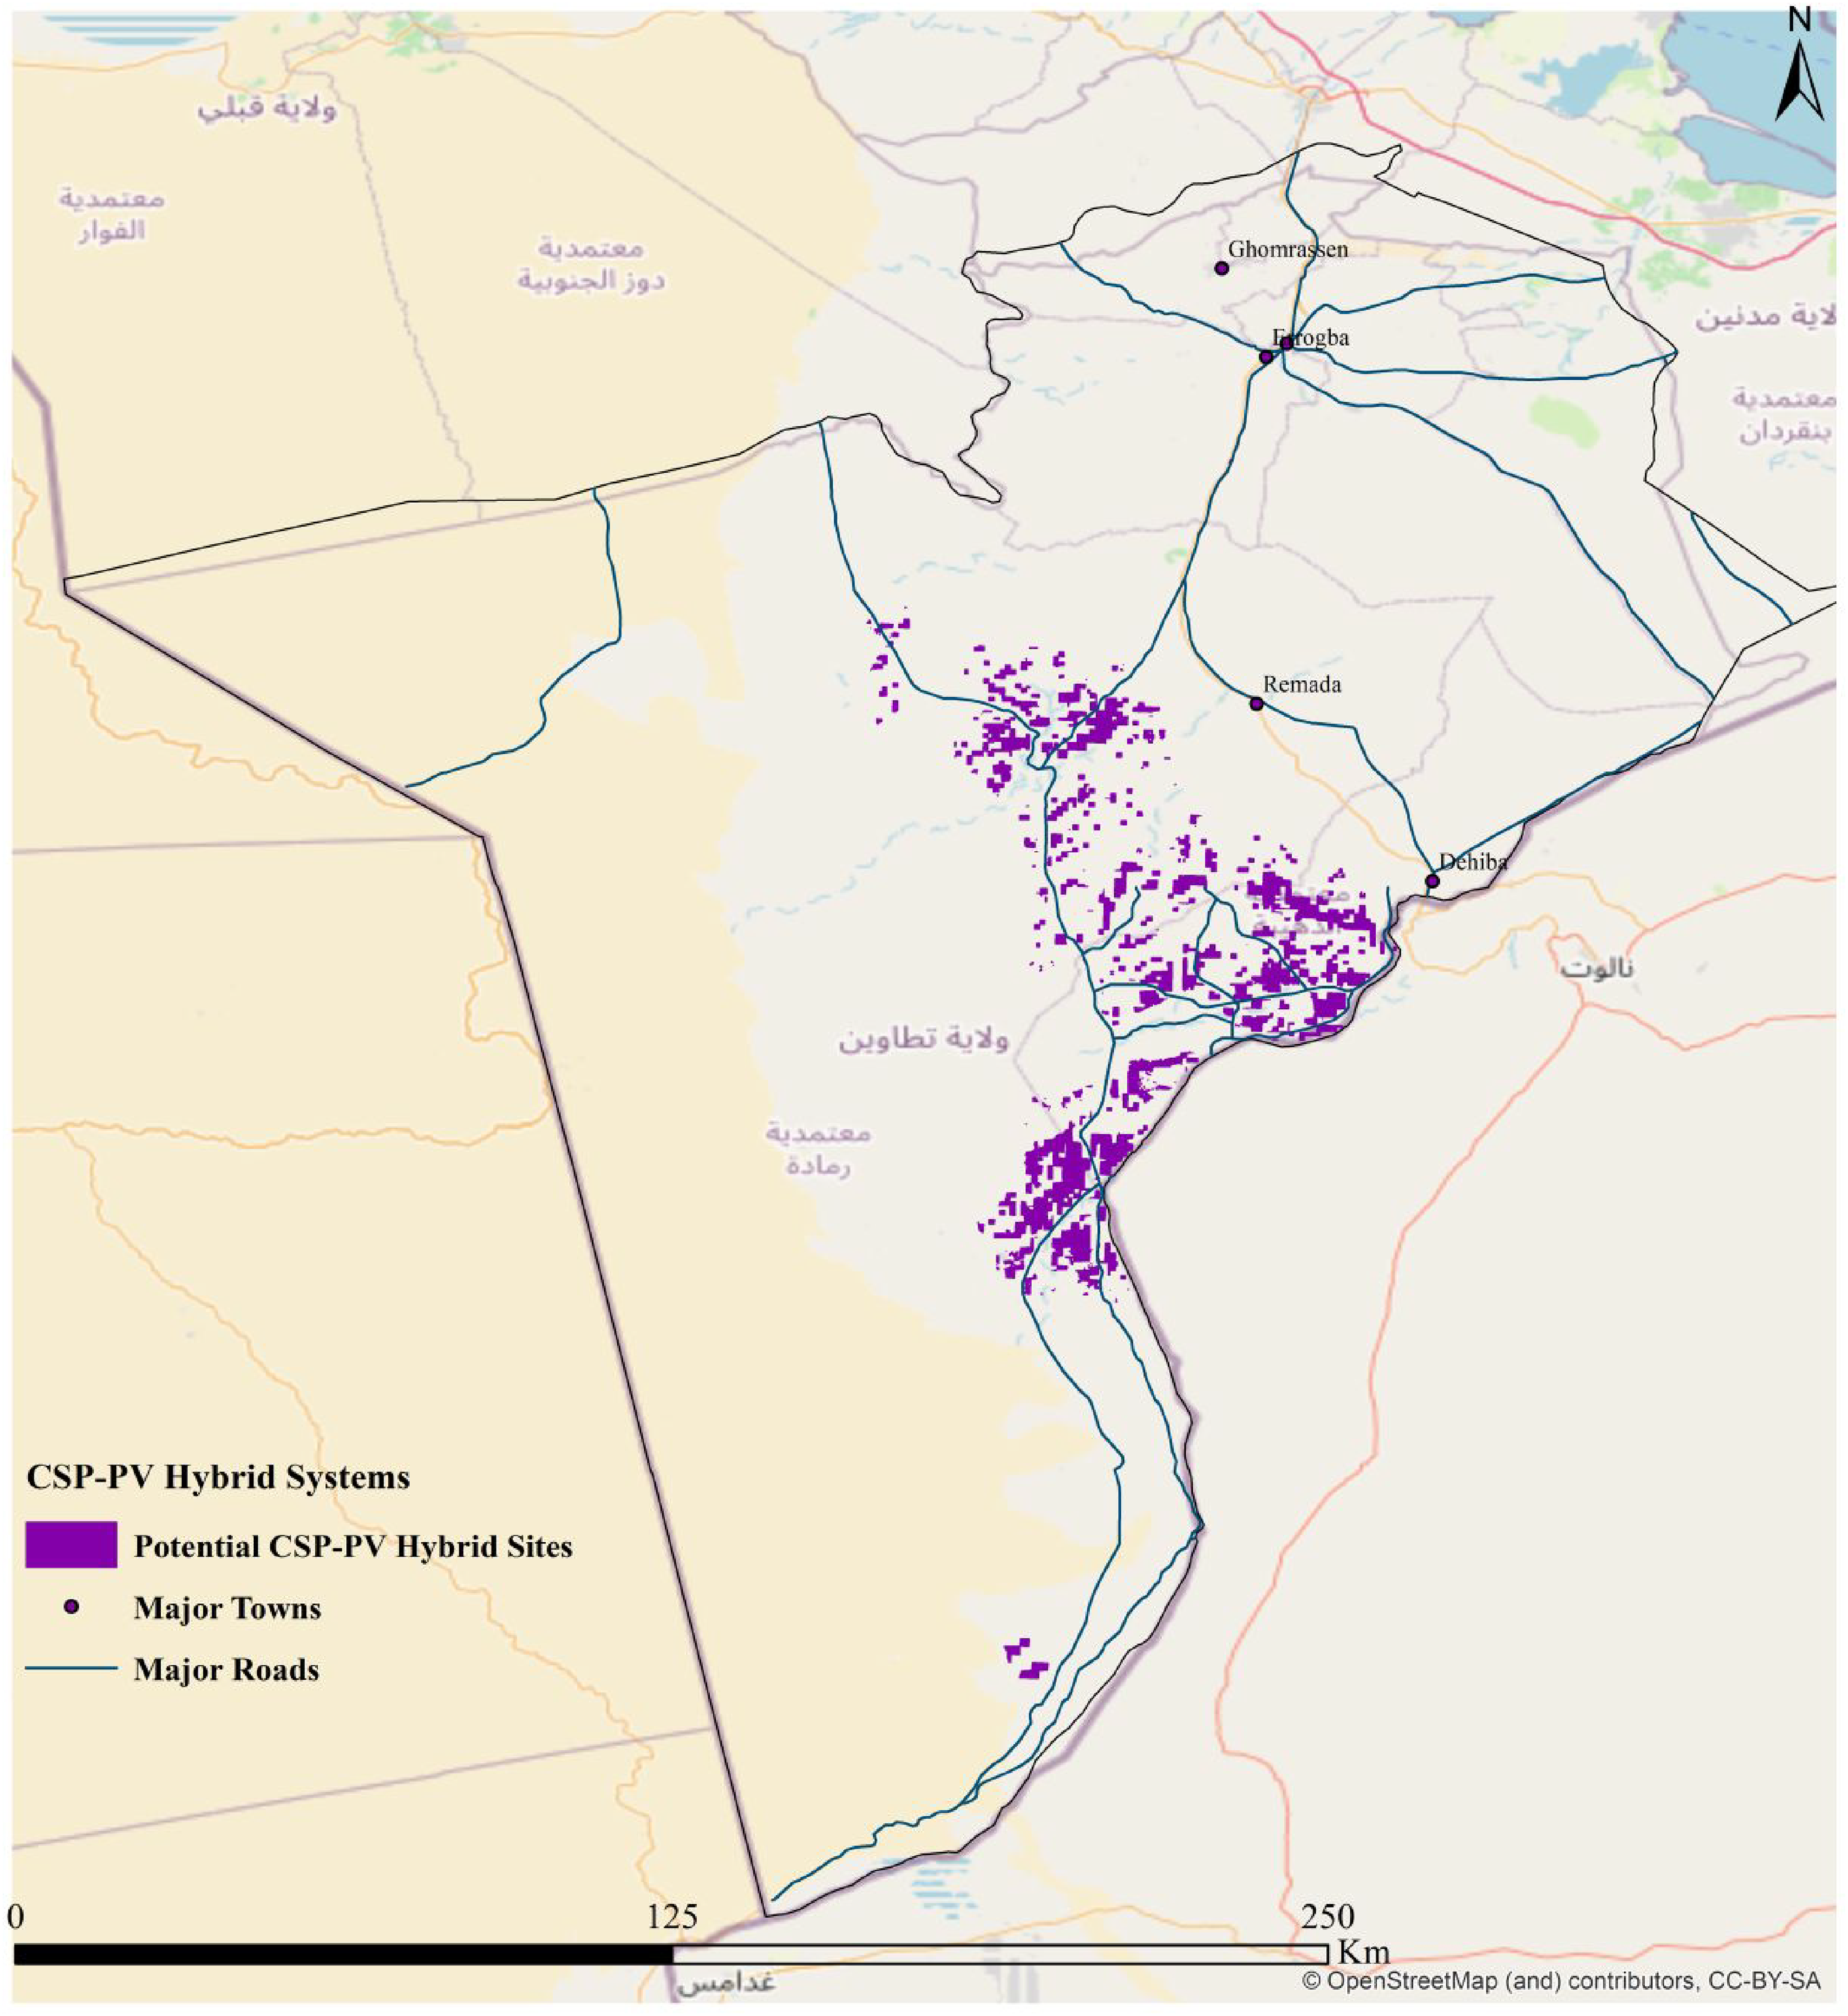
Potential CSP–PV hybrid sites.
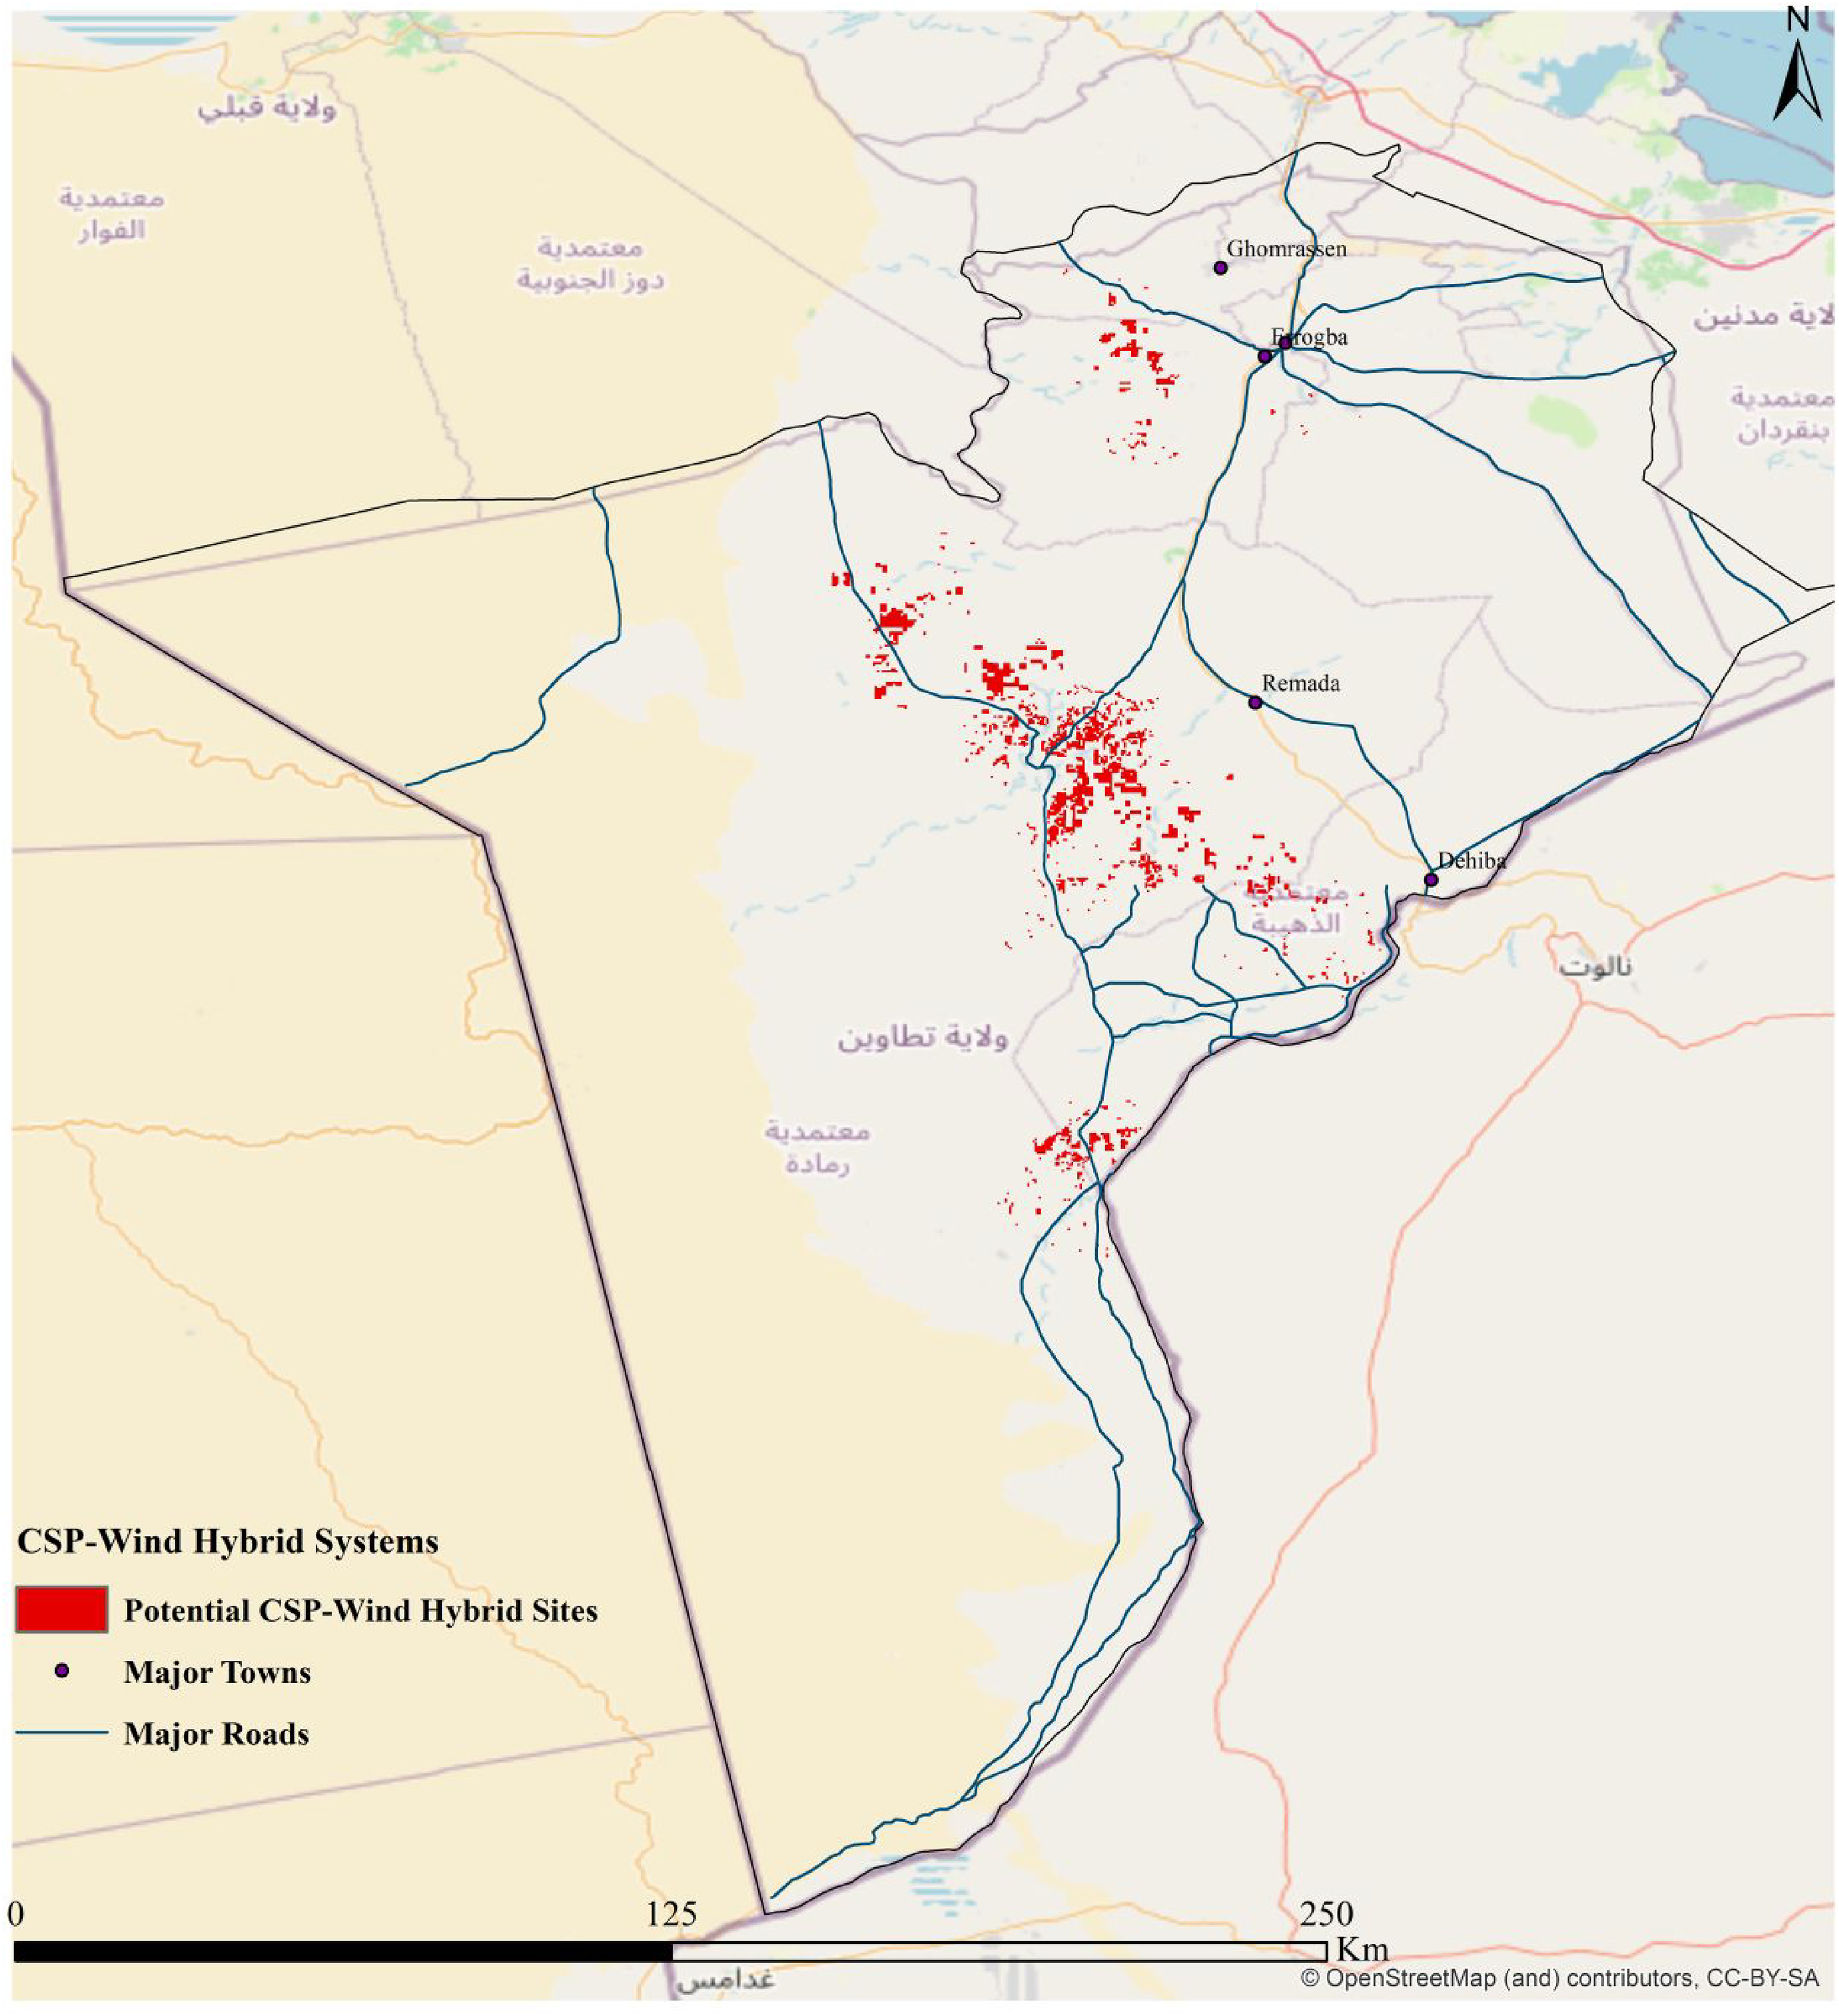
Potential CSP–wind hybrid sites.
Estimated energy
Theoretically, wind and solar power generation can be characterized as the assessment of wind and solar resources within an optimal and well-suited area for implementing wind, solar PV, or CSP power plants based on the technical specifications of commercially available technologies. It is to be noted that only highly suitable sites were considered in this analysis.
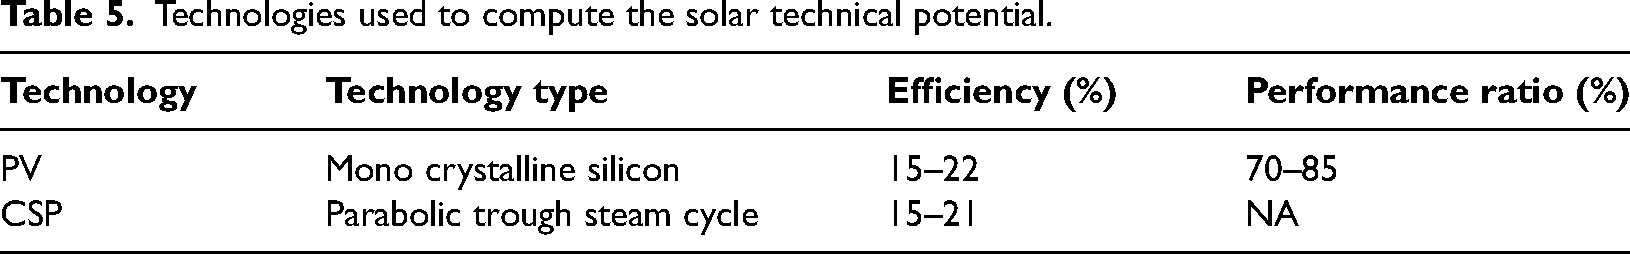
To compute the technical solar annual power (AEP), several characteristics of the PV and CSP systems have to be considered, such as the solar radiation potential, efficiency, system performance, and capacity factor (Anwarzai and Nagasaka, 2017; Ghasemi et al., 2019; Mutume, 2023), as outlined in Table 5. Hence, the annual output power (AEP) could be calculated as follows:
Technologies used to compute the solar technical potential.

Where area factor (%) denotes the fraction of the total available area that can be covered by solar panels.
Wind farms at a utilityscale benefit from the use of large turbines, which are capable of generating more energy even at lower wind speeds. The output power, operation, and installation costs are directly related to the appropriate placement of these turbines (Hartman, 2023). In most wind facilities, the spacing between turbines is approximately three to fifteen times the diameter of the turbine's rotor (Meyers and Meneveau, 2011; Stevens et al., 2016). Due to the lack of wind direction data, a 10D spacing factor was used as an equal spacing factor. In order to assess the installed capacity potential, our analysis assumed 4 MW/km2, considering a sample of commercial wind turbines (3.518–4.8 MW) currently available on the market, as shown in Table 6. Then, the annual wind energy yield (AEP) was computed as follows:
Sample of the large wind turbines available in the market (Anwarzai and Nagasaka, 2017).
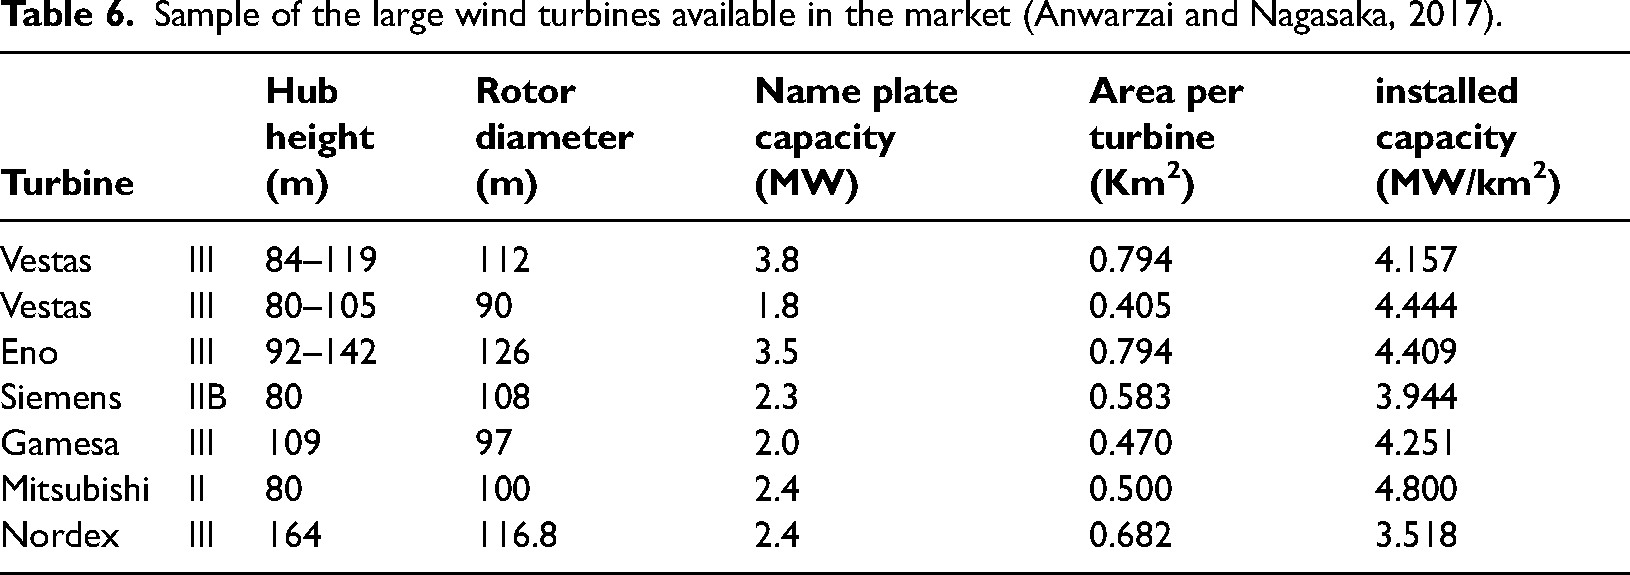
From the existing literature, it has been widely accepted that wind capacity factors range from 20% to 30%. In a study by Maatallah et al. (2012), which explored wind energy at various heights in Tunisia, it was found that the capacity factor of eight different turbines ranged from 24% to 45%. As such, a capacity of 35% was applied for this study.
When estimating the energy yield from a hybrid energy system, a power distribution ratio is often considered (Desai et al., 2019). This ratio depends on various factors such as the project's objectives, available resources, and system design considerations. In this study, an equal power distribution (50%–50%) was used, with each technology accounting for 50% of the total installed capacity.
The technical potential of hybrid systems energy generation greatly depends on factors such as selected wind turbine or solar technology type and system efficiency which have a significant impact on actual potential when compared to theoretical values. In this case study, according to numerical computations, the annual energy production was estimated at 316.169, 91.252, and 62.970 TWh for CSP–PV, CSP–wind, and PV–wind, respectively (Figure 10). These figures are equivalent to 14-fold, fourfold, and threefold the entire energy demand as of 2022 (STEG, 2022). This indicates that the Tataouine region enjoys significant renewable potential. Interestingly, CSP–PV hybrid systems exhibited higher levels compared to other combinations. Comprising nearly 100% of the well-suited areas considered, Remada and Dhiba stood out as particularly favorable locations for installing these hybrid systems. This is mainly due to the exceptional climatic conditions, gentle slope, and proper type of land use dominant in those regions.
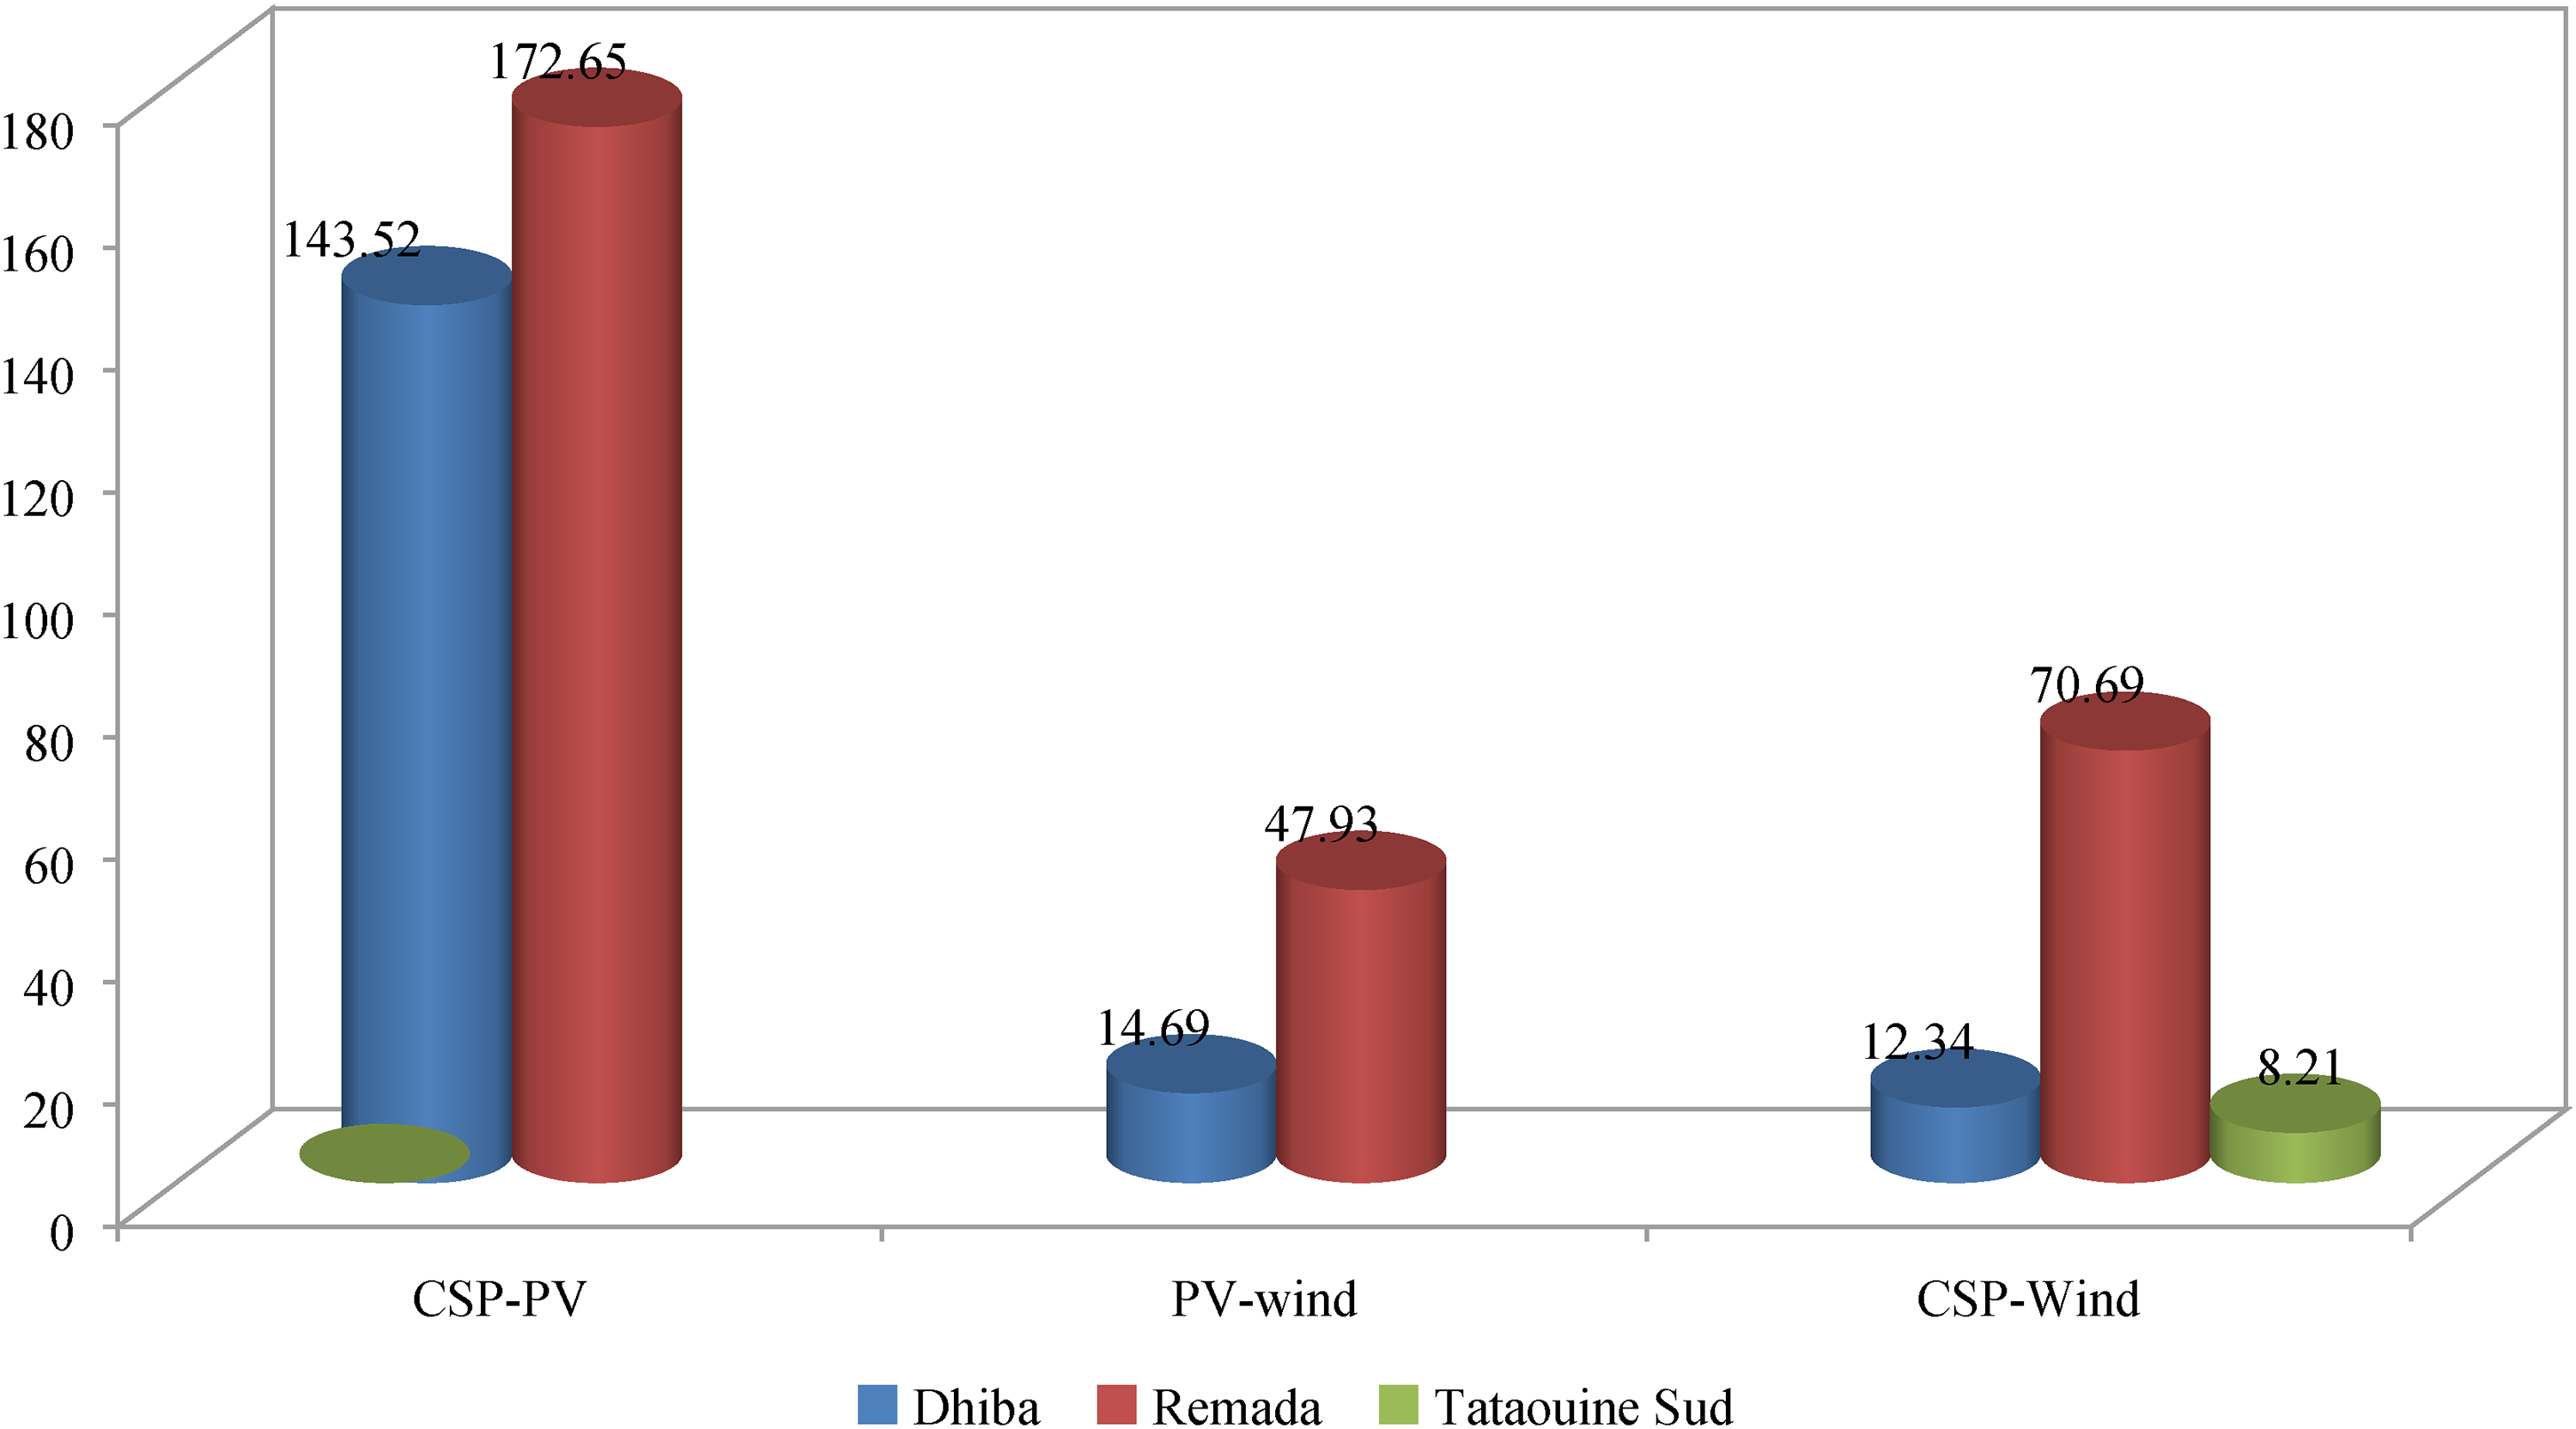
Estimated energy yield of different technologies at potential hybrid sites.
Discussion
The study's outcome offers significant potential for the adaptation of hybrid renewable energy facilities within the Tataouine region. The installation of CSP–PV, PV–wind, and CSP–wind hybrid systems proves to operate at optimum performance within the geographical and climate conditions observed.
The use of the AHP as an MCDM tool has significantly shaped the results of our current research. This methodology has allowed us to handle both quantitative and qualitative data effectively, confirming its versatility and broad applicability (Kumar et al., 2017; Messaoudi et al., 2019; Shao et al., 2020). Nonetheless, the efficacy of this method has been questioned as inconsistencies appeared in the experts’ judgments on the importance of criteria (Díaz-Cuevas et al., 2021; Mosase et al., 2017). This led to results that were not as solid or accurate as those from other methods like FAHP, FTOPSIS, and DEMATEL (Khashei-Siuki and Sharifan, 2020; Shojaeimehr and Rahmani, 2022).
In addition, the results obtained also correspond to similar research conducted in countries with comparable geographic and climate characteristics. For instance, Díaz-Cuevas et al. (2021) and Gouareh et al. (2021), using the same approach, found similar key criteria for the successful adaptation of PV–wind hybrid and CSP technologies in Algeria. Furthermore, in comparison with similar works conducted in Egypt, Morocco, and Kenya (Effat and El-Zeiny, 2022; Elkadeem et al., 2021; Jbaihi et al., 2022), our outcome was found to be significant and provide very competitive opportunities for Tataouine and the entire country as a whole. This validates our findings and emphasizes that hybrid power systems, including CSP–PV, PV–wind, and CSP–wind, could be a solution for regions sharing similar attributes. The potential contribution of hybrid renewable energy systems is enormous. However, this study did not consider several critical constraints related to political, socio-cultural, and comprehensive environmental impact assessment. Despite setting an ambitious goal to generate 30% of electricity from renewables by 2030 to achieve energy independence, diversify the energy mix, and reduce energy imports and emissions intensity, hardly any progress has been made thus far. Challenges including social and political obstacles, a lack of funding resources, and an unfavorable investment climate have all impeded the implementation of this plan. Considering the multitude of socio-economic challenges faced by Tataouine, it is crucial to implement tangible measures that foster investment in these hybrid systems (Khammassi et al., 2021; Rouine and Roche, 2022). To identify optimal locations for such projects, not only must suitable areas be identified but also improvements need to be made to grid infrastructure, transportation systems, manufacturing facilities, as well as educational and training centers (Saraswat et al., 2021). Therefore, developing such hybrid systems can spur economic growth. Moreover, these systems provide a more reliable power supply while mitigating reliance on conventional fuels and carbon footprint (Abbasi et al., 2020; Bashir et al., 2022; Liu et al., 2022).
Conclusion
In light of the growing importance placed on environmentally sustainable and economically feasible electricity generation, hybrid renewable energy systems, such as solar PV–wind, PV–CSP, and CSP–wind, have emerged as viable alternatives. With this sector experiencing rapid expansion, it is crucial to identify optimal energy production locations. Thus, this study focused on determining the appropriate locations for PV–CSP, PV–wind, and CSP–wind hybrid systems in Tataouine, southern Tunisia. For this reason, an integrated GIS-based AHP model was developed. This model considered several key criteria, such as GHI, DNI, wind speed, water resources, land use, proximity to grid and transport infrastructure, as well as residential areas. The results showed that the Tataouine region is an ideal location for deploying these hybrid technologies due to its exceptional climate and geographical conditions. The region exhibited high levels of solar irradiation along with consistent wind patterns, favorable topography, and adequate infrastructure. It has been demonstrated that Tataouine showcases significant potential for accommodating PV–CSP, CSP–wind, and PV–wind configurations, with extensive well-suited areas of approximately 793 km2, 413 km2, and 333 km2, respectively. In terms of projected electricity generation, it was anticipated that these integrated systems would yield an annual output power of 316.169 TWh for PV-CSP, 91.252 TWh for CSP-wind, and 62.970 TWh for PV–wind. By embracing such sustainable and innovative solutions, it would be possible to maximize energy production, enhance reliability, and provide a more balanced and consistent power supply. This work serves as a significant example for other regions and countries seeking to capitalize on their renewable energy potential through evidence-based site selection methodologies. However, to enhance the precision of the decision-making process, future research should entail the architecture and modeling of the CSP–PV–wind hybrid systems so that they satisfy maximum output power while minimizing costs.
Footnotes
Declaration of conflicting interests
The authors declared no potential conflicts of interest with respect to the research, authorship, and/or publication of this article.
Funding
The authors received no financial support for the research, authorship, and/or publication of this article.
Appendix A
Solar PV, Solar CSP, and onshore wind site selection decision criteria.
|
|
|
|
|
|---|---|---|---|
| Climate | GHI (kWh/m2/year) | < 1477 | 1 |
| 1478–1799 | 2 | ||
| 1800–1899 | 3 | ||
| 1900–1999 | 4 | ||
| > 2000 | 5 | ||
| DNI (kWh/m2/year) | < 1799 | 1 | |
| 1800–1899 | 2 | ||
| 1900–1999 | 3 | ||
| 2000–2099 | 4 | ||
| > 2100 | 5 | ||
| Wind speed (m/s) | < 4.99 | 1 | |
| 5–5.99 | 2 | ||
| 6–6.99 | 3 | ||
| 7–7.99 | 4 | ||
| > 8 | 5 | ||
| Temperature (C˚) | > 23 | 1 | |
| 22–22.99 | 2 | ||
| 21–21.99 | 3 | ||
| 20–20.99 | 4 | ||
| < 19.99 | 5 | ||
| Topography | Slope (degree) | > 10 | 1 |
| 8–10 | 2 | ||
| 5–8 | 3 | ||
| 2–5 | 4 | ||
| < 2 | 5 | ||
| Aspect | Flat | 1 | |
| N, NE, NW | 2 | ||
| E, W | 3 | ||
| SE, SW | 4 | ||
| S | 5 | ||
| Accessibility | proximity to major Roads (km) | > 15 | 1 |
| 10–15 | 2 | ||
| 5–10 | 3 | ||
| 1–5 | 4 | ||
| 0.5–1 | 5 | ||
| Proximity to power lines (km) | > 15 | 1 | |
| 10–15 | 2 | ||
| 5–10 | 3 | ||
| 1–5 | 4 | ||
| 0.3–1 | 5 | ||
| Proximity to residential areas (km) | 20–25 | 1 | |
| 15–20 | 2 | ||
| 10–15 | 3 | ||
| 5–10 | 4 | ||
| 2- 5 | 5 | ||
| Environment | Land use | Built-up, water bodies, forests, etc. | 1 |
| Cropland | 2 | ||
| Shrubland | 3 | ||
| Sparse vegetation | 4 | ||
| Bare lands | 5 | ||
| Proximity to water resources (km) | > 15 | 1 | |
| 10–15 | 2 | ||
| 5–10 | 3 | ||
| 1–5 | 4 | ||
| 0.5–1 | 5 |