
Abstract
The tight sandstone reservoirs in the Linxingdong area of the Ordos Basin are characterized by low porosity, high irreducible water saturation, low gas saturation, and strong heterogeneity, with conventional logging methods showing low accuracy in identifying reservoir fluid properties. This paper proposes a method based on principal component analysis (PCA) for identifying post-fracturing productivity classification in complex tight gas reservoirs. Initially, the fluid productivity classification type of the test layers was determined by integrating gas and liquid production data from the fracturing and production stages. Subsequently, logging data were utilized to select curves sensitive to reservoir fluid properties, and a calculation formula for the fluid property identification factor D was established based on PCA. The classification of reservoir fluid productivity in the study area was then identified based on the D value. The results indicate that the fluid property identification factor method based on PCA performed well in the study area, with an accuracy of 83%. Compared with other conventional methods, this approach fully exploits geophysical logging data, has strong generalizability, and provides data support for the formulation and adjustment of subsequent development plans.
Keywords
Introduction
Tight gas is an important unconventional resource in low porosity and low permeability formations, and its global reserves are twice as much as conventional natural gas (Hong et al., 2025; Meng et al., 2024). A large number of undersaturated gas reservoirs are developed in Linxingdong strata, among which the reservoir formation combination within the source has the characteristics of low porosity, high bound water saturation, and low gas saturation. With the deepening of exploration and development, the reservoir in Linxingdong area has low pre-pressure production capacity, low post-pressure water production, and a low conformity rate in determining reservoir fluid properties after pressure depletion, which brings great difficulties to the development of tight gas. The effective identification of reservoir fluid properties is a crucial aspect in oil and gas reservoir exploration and development, providing effective data for selecting fracturing intervals, formulation of development plans, etc. (Fang et al., 2020a). This article takes the Linxingdong tight gas reservoir as the research object, with the Shihezi Formation as the main research layer, and selects appropriate methods to evaluate the fluid properties of the tight gas reservoir.
Significant progress has been made in identifying fluid properties based on geophysical logging data by previous researchers. Depending on the types of logging curves utilized, fluid property identification methods can be divided into those based on conventional logging data and those based on special logging data. In terms of conventional logging data, Zhang (2010) applied the three-porosity overlap method combined with the three-porosity difference and ratio method to identify gas reservoirs. Zhao (2020) proposed the four porosity difference/ratio method by calculating the water-bearing porosity, which solved the problem of identifying low resistance gas reservoirs in Dongsheng gas field. Mao (2016) applied various classic fluid property identification methods, including logging curve overlap method, porosity-resistivity intersection plot method, and normal distribution method, to establish an effective oil and gas reservoir evaluation method for the tight sandstone reservoir of the Yingcheng Formation in the Lishu Fault Depression. Hou et al. (2017) introduced a fluid discrimination method based on correlation coefficients, which achieves quantitative discrimination of reservoir fluid properties by conducting regression analysis on density porosity and resistivity of reservoirs with different fluid properties. Wang (2023) proposed a method for identifying tight gas reservoirs based on mineral composition differences, this approach utilized the degree of separation between density and neutron logging curves to characterize different mineral combinations and established a cross-plot of resistivity and porosity based on density neutron separation. However, the resistivity logging in Linxingdong block is strongly affected by multiple factors such as pore structure, low gas saturation, and mud filtrate invasion, making it difficult to effectively differentiate gas from water layers (Du et al., 2022; Mi et al., 2021; Yan et al., 2021). Fortunately, the fluid type of tight gas reservoir has a certain correlation with porosity logging series.
For special logging data, Zeng (2016) calculated a series of rock elastic parameters reflecting the elastic properties of the formation through array acoustic logging data, and constructed a combination parameter with strong sensitivity to fluid properties to establish a cross-plot. Yang (2005) employed differential spectrum and shift spectrum nuclear magnetic resonance logging fluid identification methods to distinguish the fluid properties of tight sandstone reservoirs. Hu (2016) developed the construction of a water spectrum method based on the difference spectrum method and shift spectrum method to improve the accuracy of fluid identification in complex reservoirs. Therefore, in addition to the traditional resistivity logging, the rock physical properties reflected by array acoustic and nuclear magnetic logging curves can also effectively characterize the fluid type of tight gas reservoir.
The integration of machine learning with well-logging curves has also been applied in reservoir fluid property recognition. Tan (2020) constructed a classification committee machine comprising a backpropagation neural network, a probabilistic neural network, and a decision tree classifier to improve the overall performance of intelligent algorithms, and made final judgments through decision mechanisms. Feng (2021) combined gray system theory with multivariate statistical theory and proposed a reservoir fluid property identification method based on gray correlation weight analysis. Fan (2015) used Fisher discriminant analysis to amplify the differences in logging response of reservoirs with different fluid types, and constructed discriminant functions for different reservoir fluid types based on gas testing results and corresponding logging values. Shi (2024) enhanced the traditional stacking model to more effectively capture the complex characteristics and variation patterns of different fluid types in reservoir fluid property identification research, demonstrating high accuracy and stability in practical applications. Due to the poor physical properties and complex pore structure of tight sandstone reservoirs, the contribution of reservoir fluids to logging responses is weak, and the differences in logging responses between oil and gas reservoirs and water layers are not significant. Traditional methods exhibit lower accuracy in fluid type identification, and machine learning methods can comprehensively use the weak response signals of tight gas to improve the accuracy of fluid identification.
Therefore, the fluid property identification method based on principal component analysis (PCA) was proposed to address the urgent need for quantitative identification of reservoir gas and water production in the Linxingdong block of the Ordos Basin, where most of the pre-pressure fluids had no production capacity and produced water after pressure. This method was combined with conventional geophysical logging data and array acoustic logging data to establish a more effective evaluation framework. The method was applied to dozens of wells in the Linxingdong block and demonstrated promising results, providing a data foundation for the formulation and implementation of subsequent development plans.
Classification of reservoir productivity based on test data
The Linxingdong Block is located on the northeastern edge of the Ordos Basin, spanning two first-order tectonic units—the Jinxi Fold-Thrust Belt and the Yishaan Slope. The strata dip monoclinal from east to west (as shown in Figure 1) (Zhao, 2024).
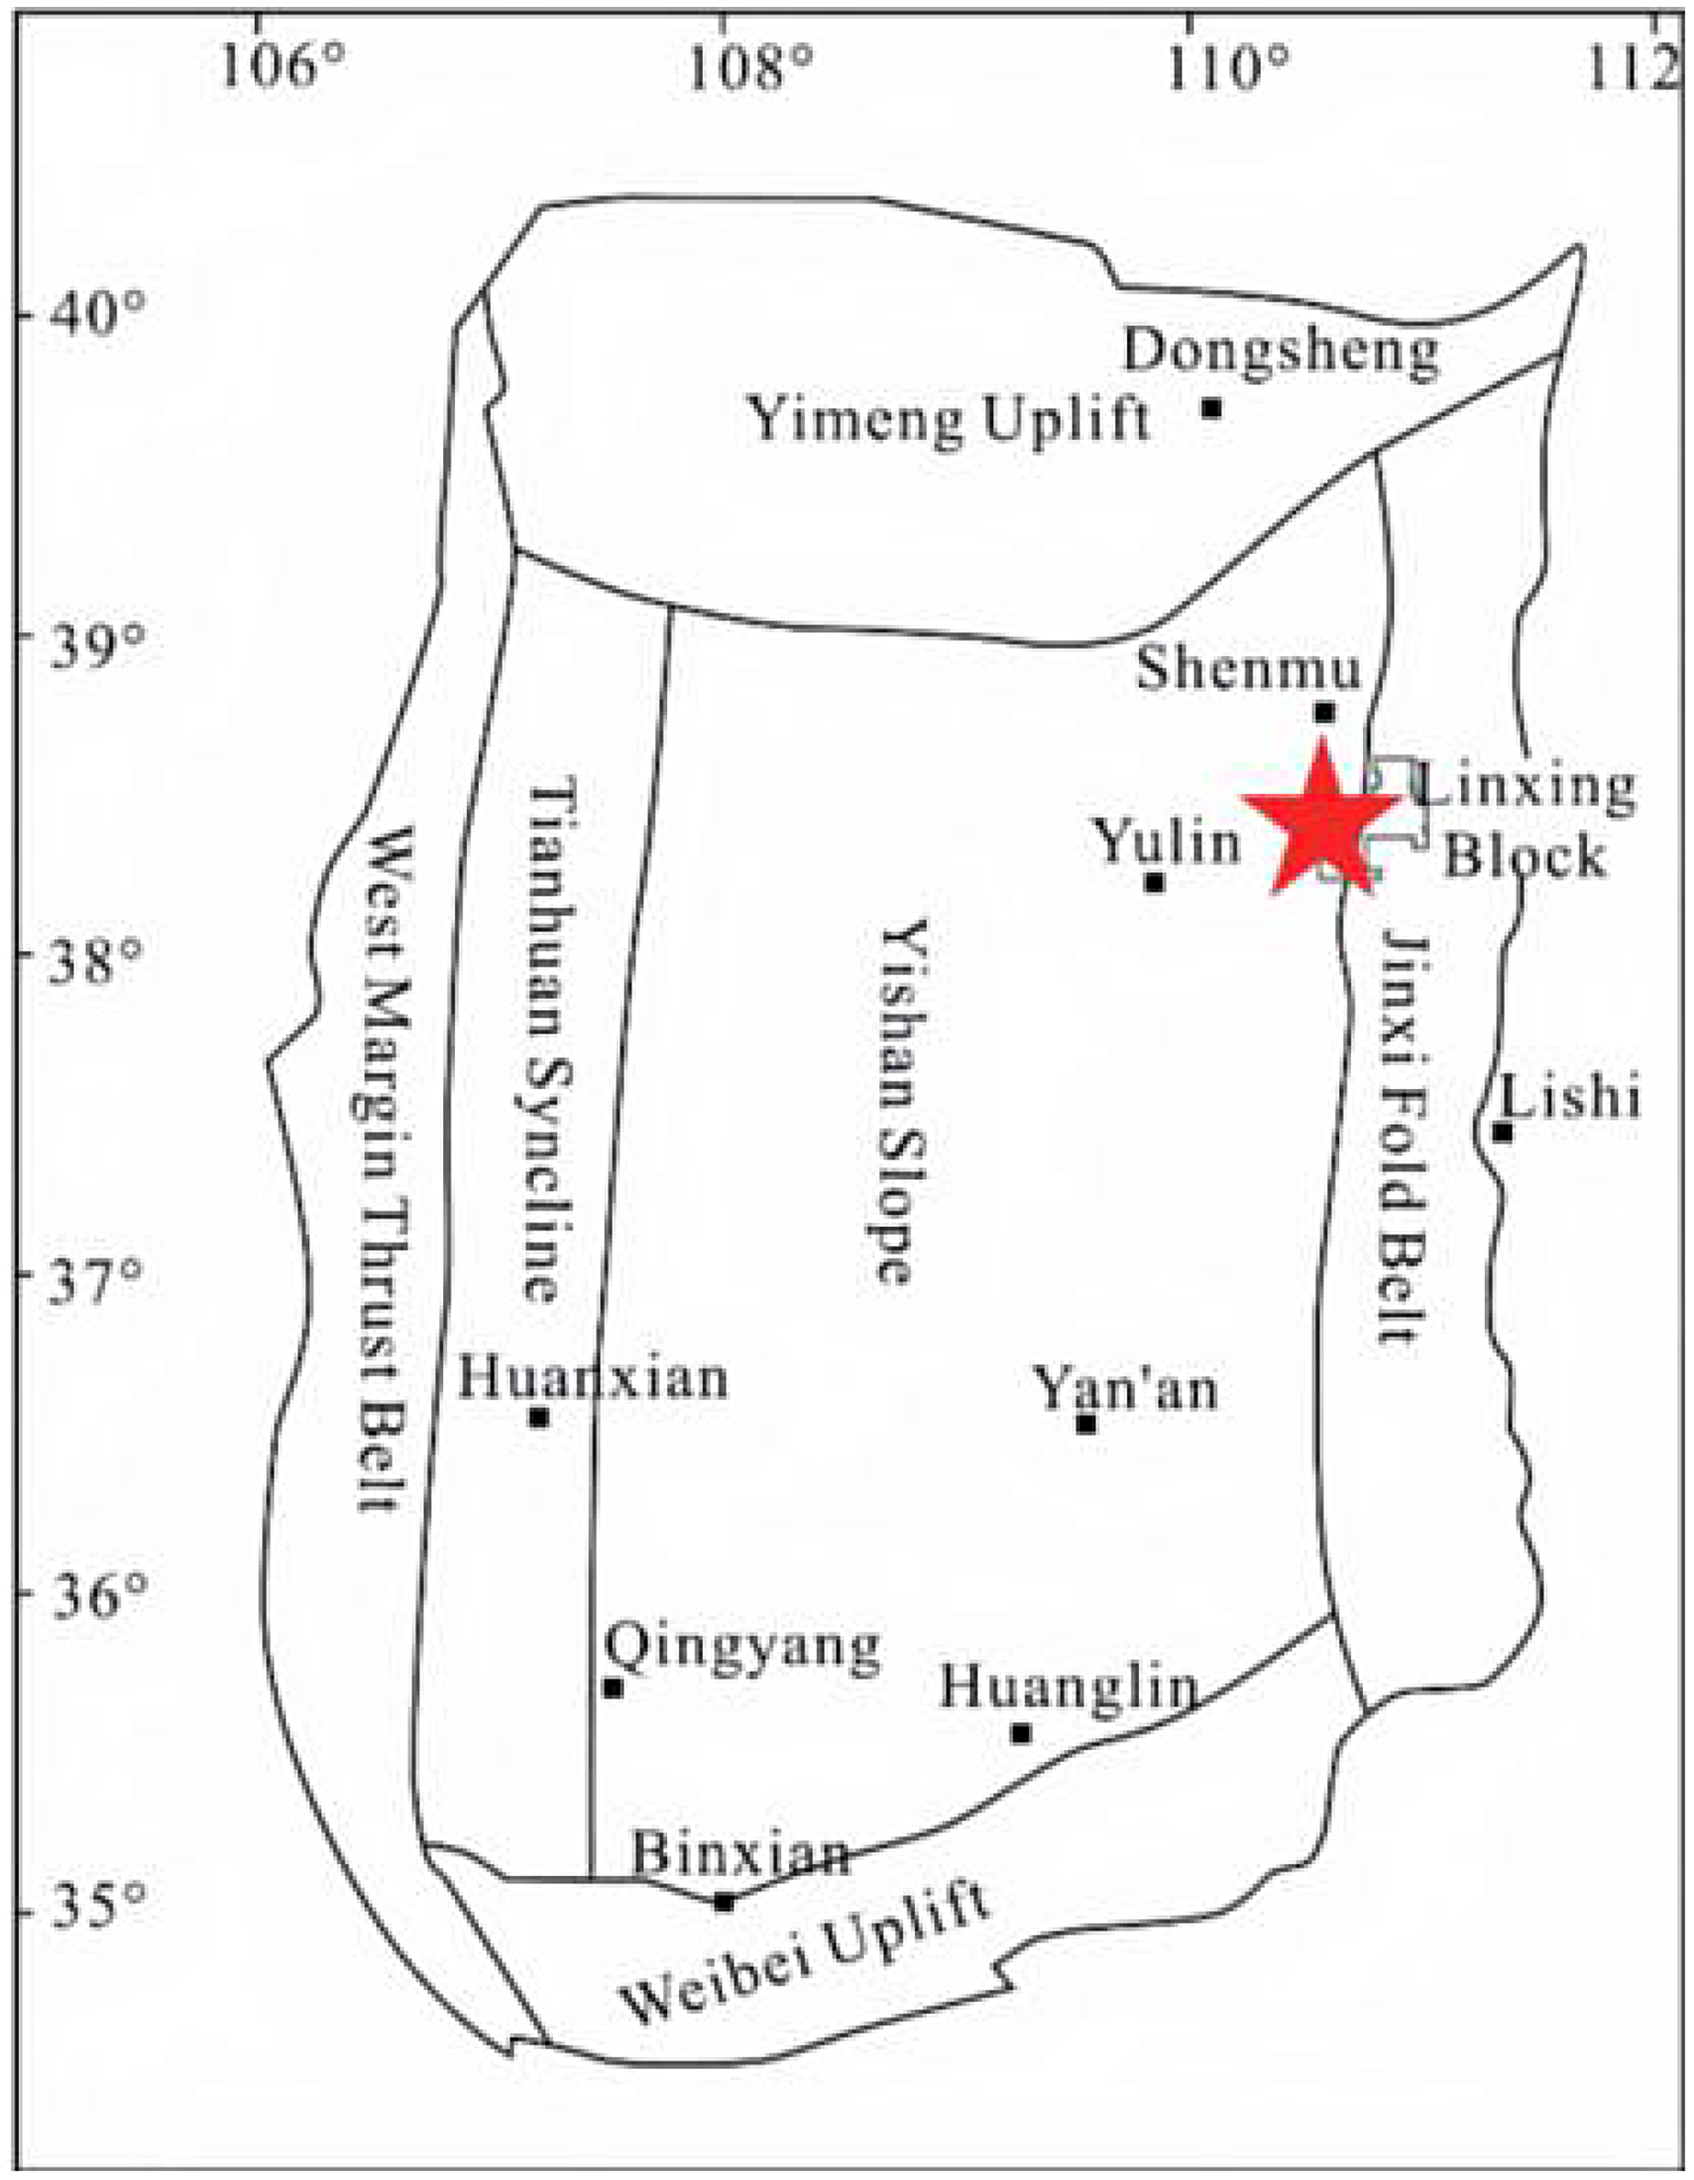
Structural sketch of ORDOS Basin.
And the Permian Shihezi Formation in this area is mainly composed of delta sediments (Mi et al., 2022), serving as the main production interval. The gas reservoir properties of the Linxingdong block are significantly different from those of other blocks in Linxing, with a large number of undersaturated gas reservoirs. These reservoirs exhibit low natural productivity and frequently produce substantial amounts of formation water after fracturing. The identification rate of fluid properties in logging data is low, and the existing logging fluid identification results lack a quantitative standard. This limitation hinders the effective development of gas reservoirs and often results in discrepancies in the properties of pressurized fluids, causing great difficulties for gas reservoir development.
To address this issue, this study proposes a reservoir productivity classification method based on test data, integrating reservoir classification with gas and water production characteristics. Accurate differentiation using this approach is expected to significantly enhance the economic viability of gas reservoir development.
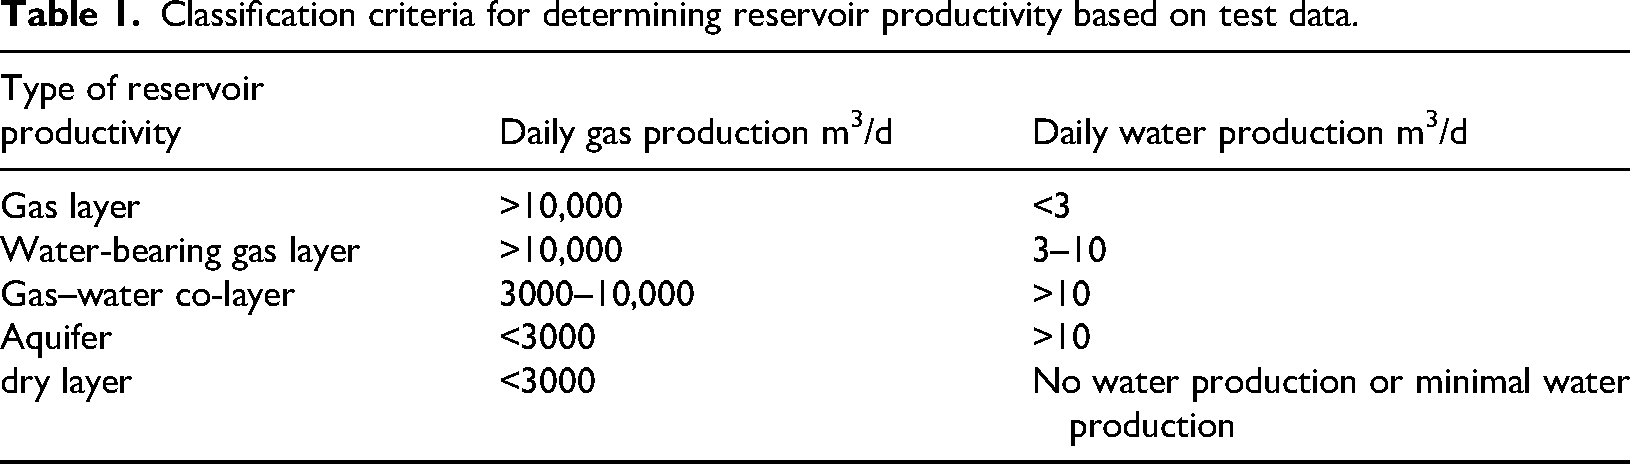
According to the development practice of Linxingdong Block, the daily gas production of the reservoir should reach 3000 m³/d when it meets the effective development conditions, and more than 10,000 m³/d when fracturing is not required. At the same time, if the daily water production is less than 3 m3/d, the gas production within 1 year can remain stable. Whereas if the daily water production is greater than 10 m3/d, the gas production after fracturing will decline rapidly. According to this production law, the reservoir productivity types are defined as gas layer, water-bearing layer, gas–water co layer, water layer, and dry layer, and these five types of reservoirs are defined by daily gas and water production (Table 1).
Classification criteria for determining reservoir productivity based on test data.
To obtain various reservoirs samples, the fluid properties and productivity of the reservoir are determined based on the actual daily gas and liquid production parameters of the perforation section. Figure 1 shows the flowback curves of reservoirs with different fluid properties and production capacities during gas testing and production.
From Figure 2(a), it is obvious that a typical gas reservoir only produces gas during the production stage, with a large and stable gas volume; from Figure 2(b), it can be illustrated that during the production stage of a typical water-bearing gas reservoir, a large amount of gas is released, resulting in high gas production and accompanied by a small amount of liquid production. The concentration of chloride ions gradually increases, indicating that the produced liquid is mixed with fracturing fluid and formation water; from Figure 2(c), the typical gas–water co-layer produces gas during the production stage, accompanied by liquid production. The chloride ion concentration of the liquid rapidly increases at a rate significantly higher than that of the water-bearing gas layer, indicating that the produced liquid contains a large amount of formation water; from Figure 2(d), it can be seen that a typical water layer produces no combustible gas during the production stage, only free water; from Figure 2(e), it is presented that a typical dry layer only produces trace amounts of gas during the production stage, and no formation water is produced.
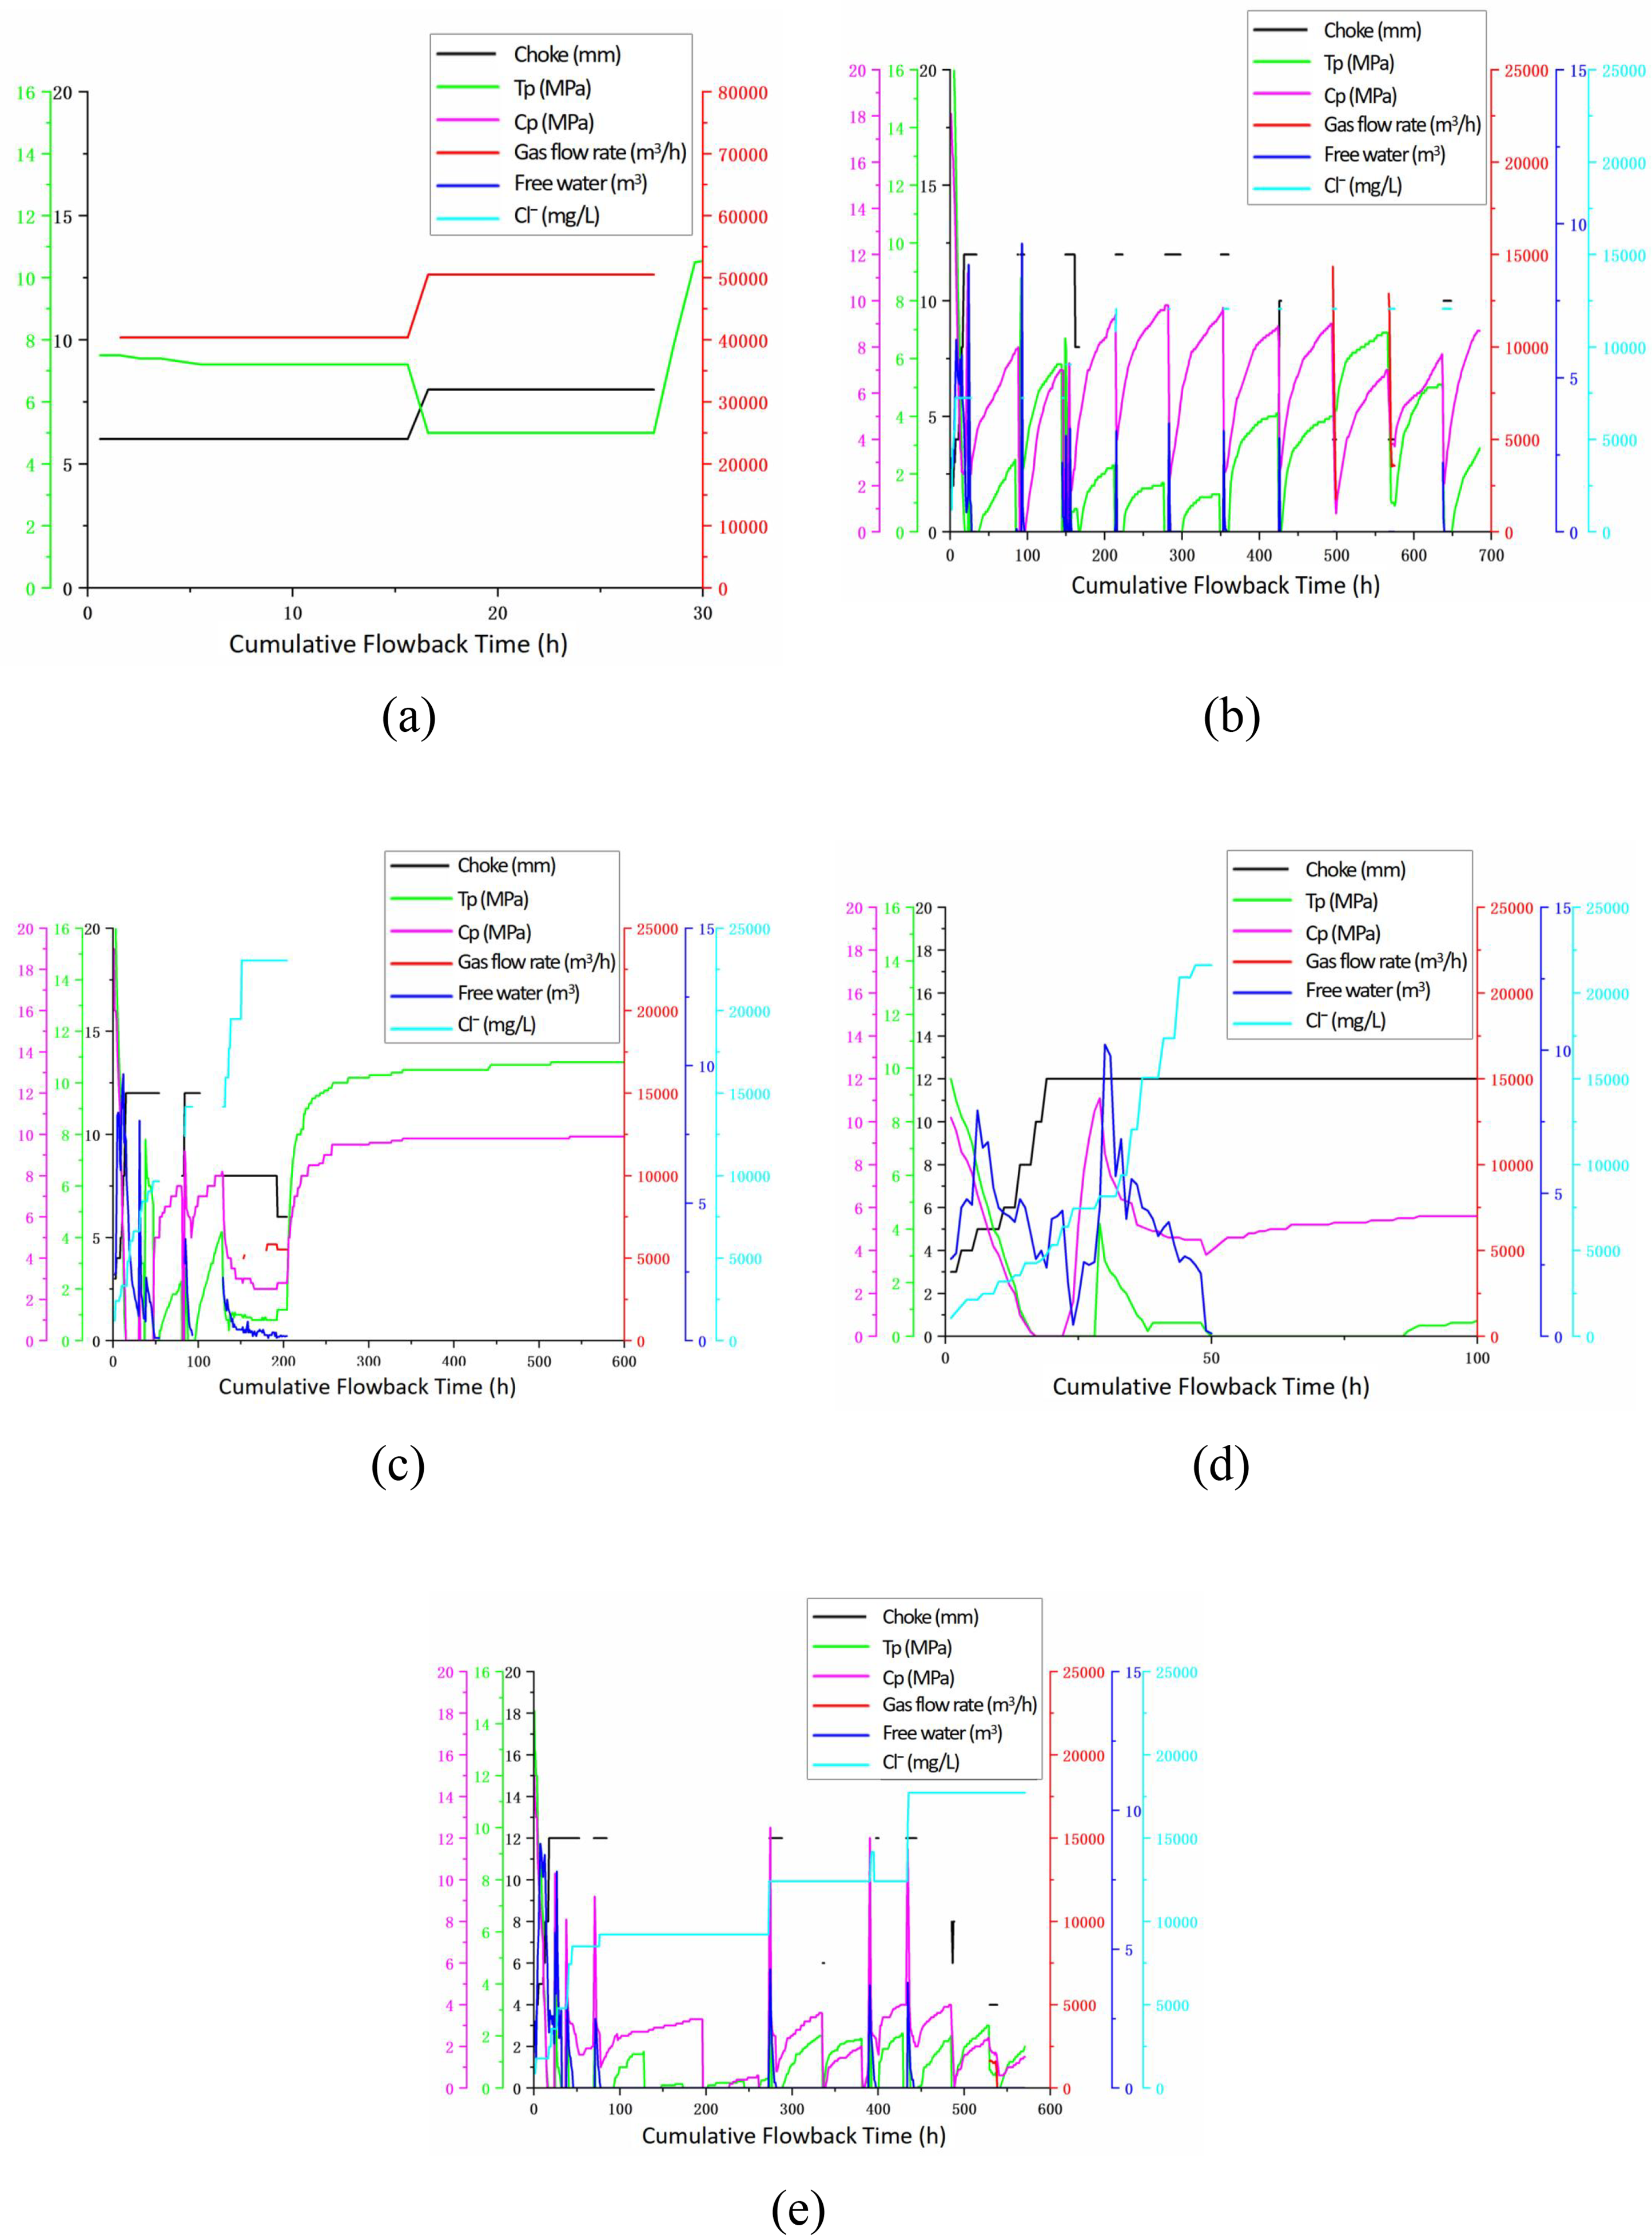
Backflow curves of reservoirs with different fluid properties during gas testing and production calculation. (a) Backflow curve of typical gas layer; (b) backflow curve of typical water-bearing gas layer; (c) backflow curve of typical gas–water co-layer; (d) backflow curve of typical water layer; (e) backflow curve of typical dry layer.
According to the backflow data of the reservoir after compression, a total of 75 different types of reservoirs were classified from Linxingdong Oilfield, including 6 gas layers, 14 water-bearing gas layers, 29 gas–water co-layers, 21 water layers, and 5 dry layers. Based on these reservoir samples, study the characteristics of reservoir productivity classification types, establish recognition models, and apply them to post-pressure productivity classification prediction in the work area.
Intersection diagram recognition
By combining conventional logging data, array acoustic logging data, and test data, and using methods such as intersection plots, the logging curves and parameters that are sensitive to reservoir fluid properties are optimized.
Porosity logging and resistivity cross-plot method
The porosity and resistivity cross-plot method is one of the commonly used techniques for distinguishing the fluid properties of reservoirs using conventional logging data. Porosity logging exhibits sensitive response characteristics in identifying gas layers and can be used to distinguish the fluid properties of reservoirs in the study area. The conventional logging method for evaluating porosity is time difference of acoustic waves, density logging, and neutron logging. Due to the presence of gas, the elastic characteristics of the formation are affected, and the time difference of acoustic waves in gas bearing sections usually increases, sometimes leading to the phenomenon of “frequency hopping.” Additionally, the density of gas is much lower than that of rock and water, and the density logging values usually decrease. Neutron logging primary measures hydrogen content, and when the reservoir contains gas, excavation effects occur, compensating for the significant decrease in neutron logging values. Moreover, the higher the gas saturation, the more significant the increase in acoustic time difference, as well as the decrease in density logging values and compensation neutron values.
Figure 3 illustrates that the discrimination effect of compensating neutron logging is relatively limited, the “mining effect” caused by gas content is not clearly obvious, while other responses are much higher than the influence of gas content on logging information. At the same time, it can be noted that resistivity logging cannot effectively identify different reservoir fluid properties, which is related to the compactness of the reservoir. The density logging and time difference of acoustic logging have relatively clear discrimination for reservoirs with different productivity, in particular, the density logging can effectively distinguish water layers. Therefore, the density logging is the optimal parameter for predicting fluid types.
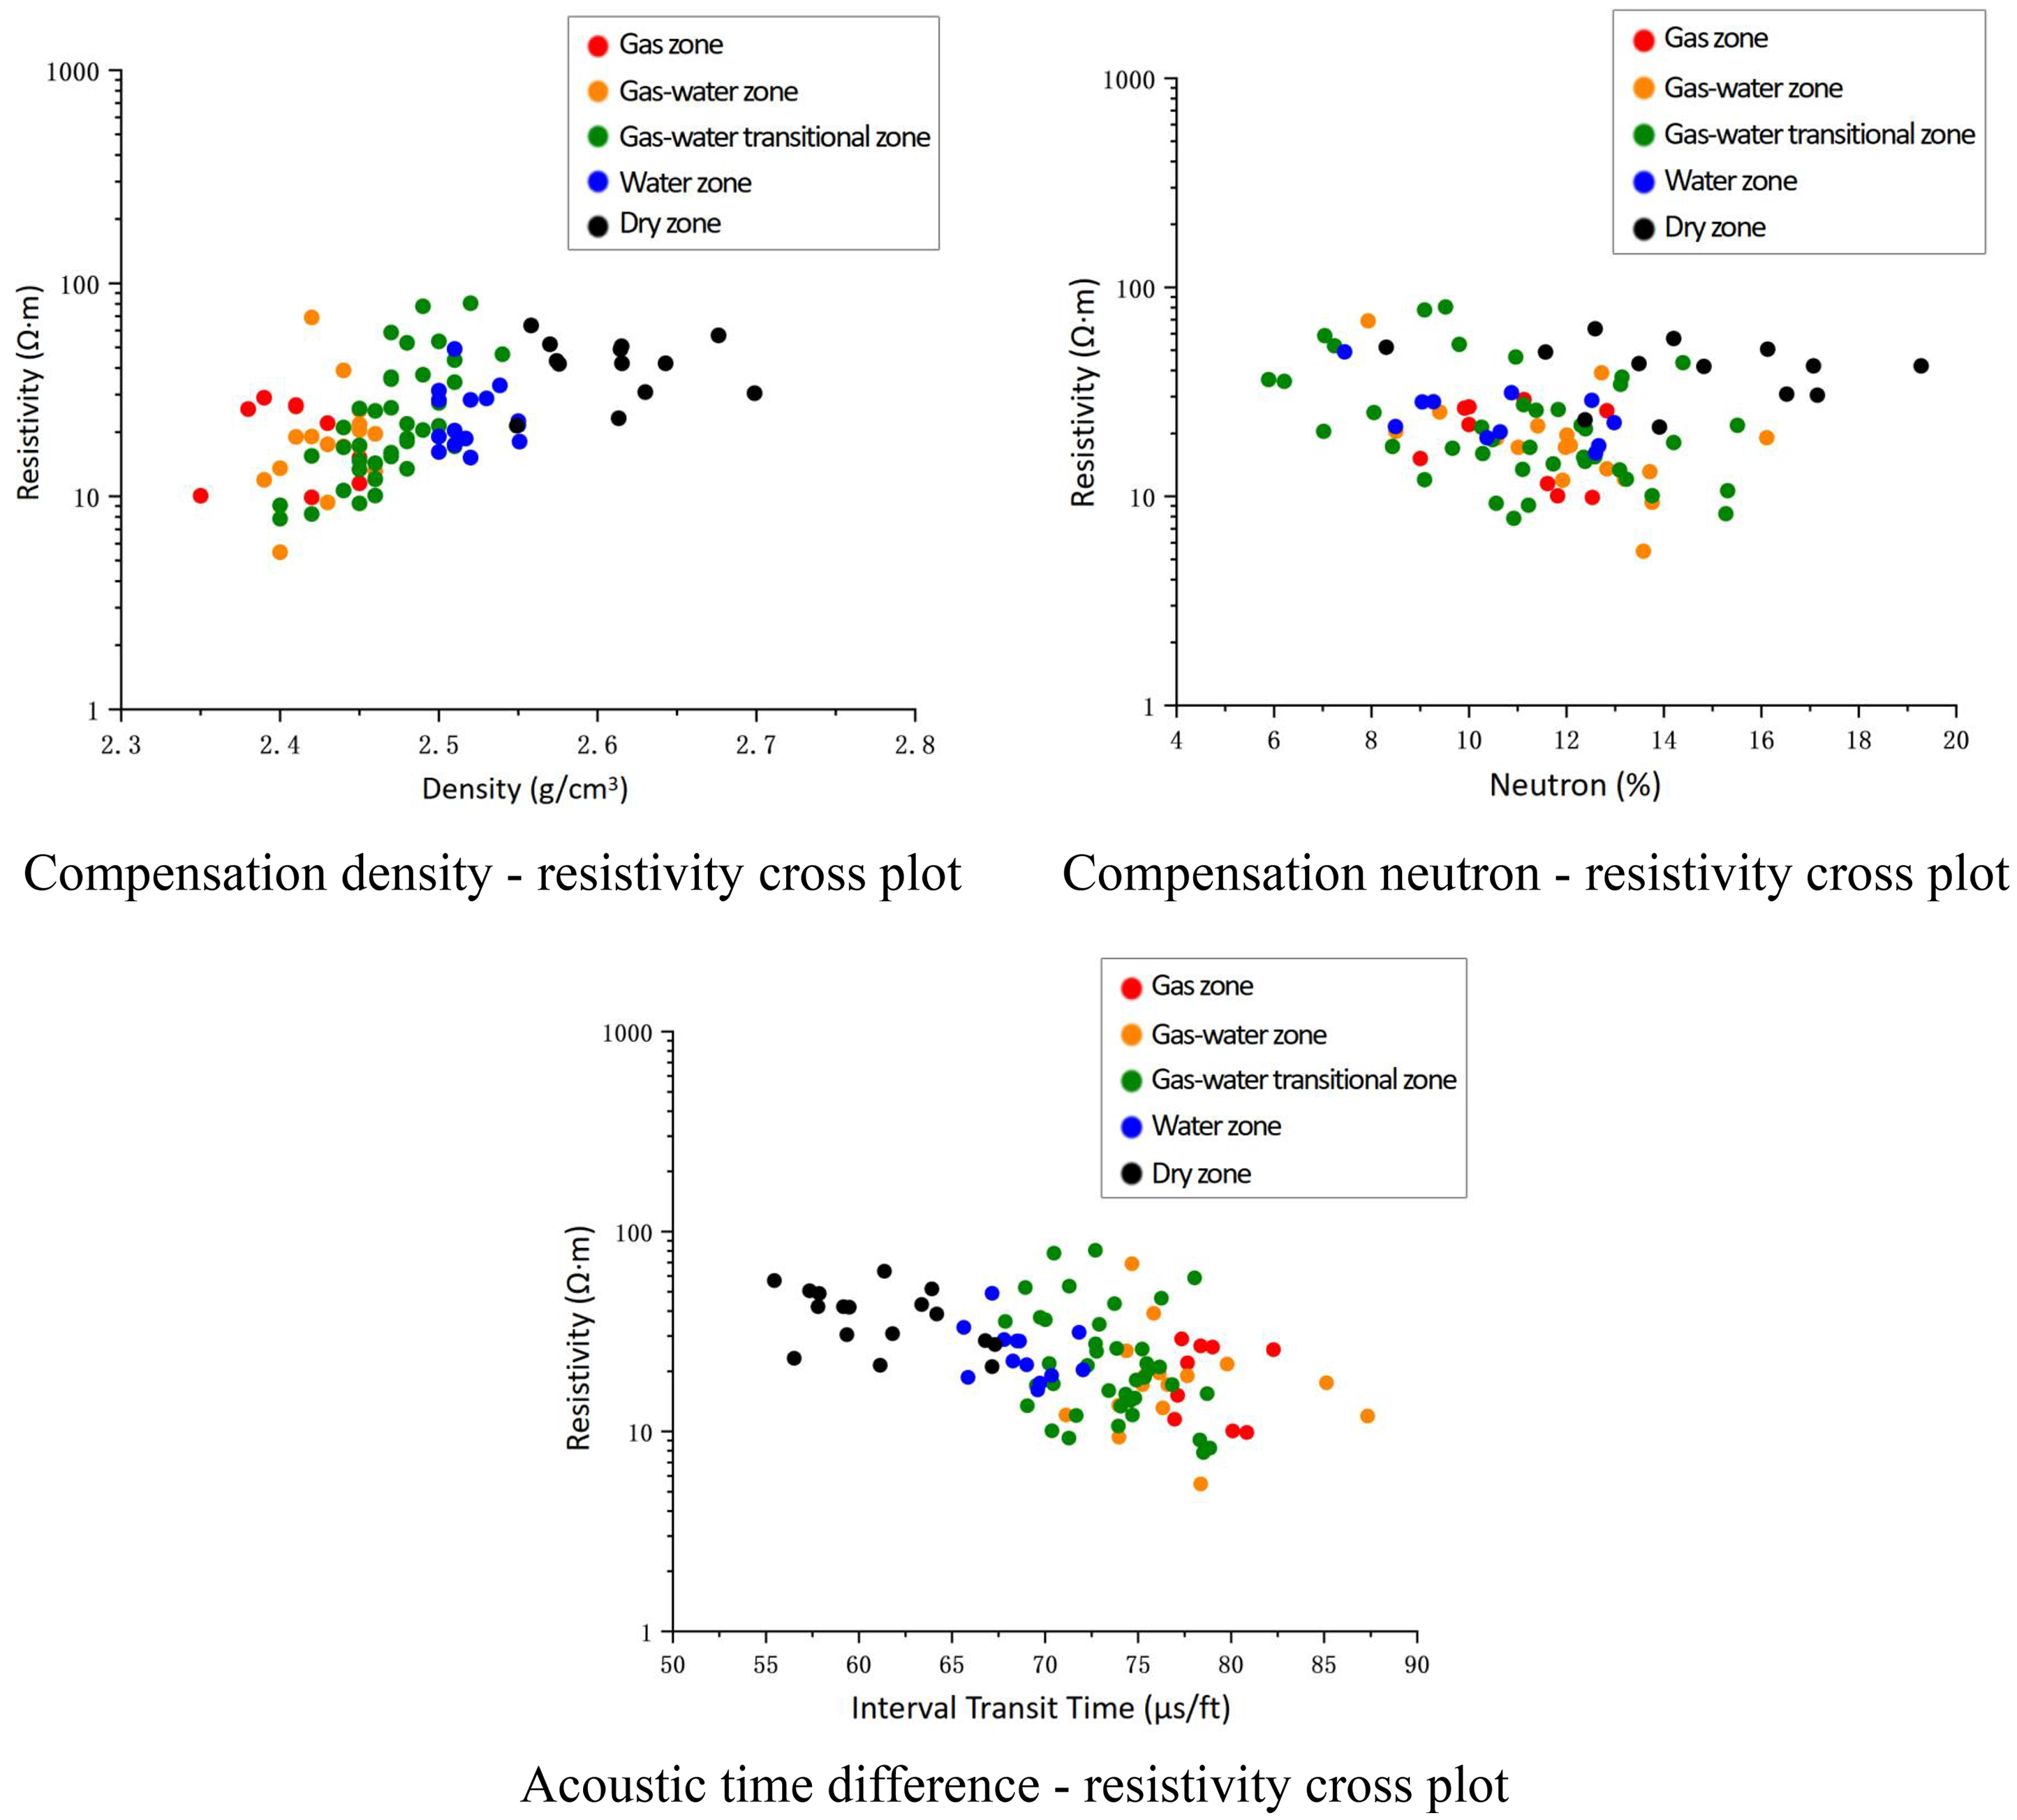
Intersection plot of three-porosity logging and resistivity.
Three hole gap difference ratio method
By utilizing three types of porosity logging curves, the apparent porosity of the formation can be calculated. By analyzing the differences and ratios of the three apparent porosities, the variations in fluid properties across different reservoirs can be amplified. The calculation formulas for the apparent density porosity 

The three hole gap difference (

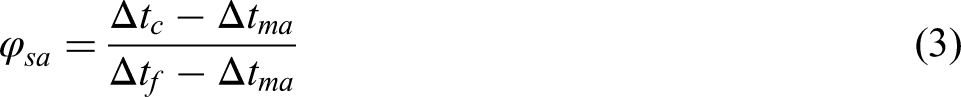
From equations (4) and (5), it can be seen that theoretically, when the formation is saturated with water, the apparent porosity of the three formations is equal, and C = 0, B = 1; When the formation contains gas, the sonic time difference logging value increases and the density logging value decreases. The apparent density porosity and apparent sonic porosity will increase, while the neutron logging value will decrease due to the “excavation effect.” At this time, C > 0, B > 1. Therefore, by establishing a cross-plot of the three-porosity differences and ratios of different fluids, it is possible to intuitively identify reservoirs with different fluid properties (Figure 4).
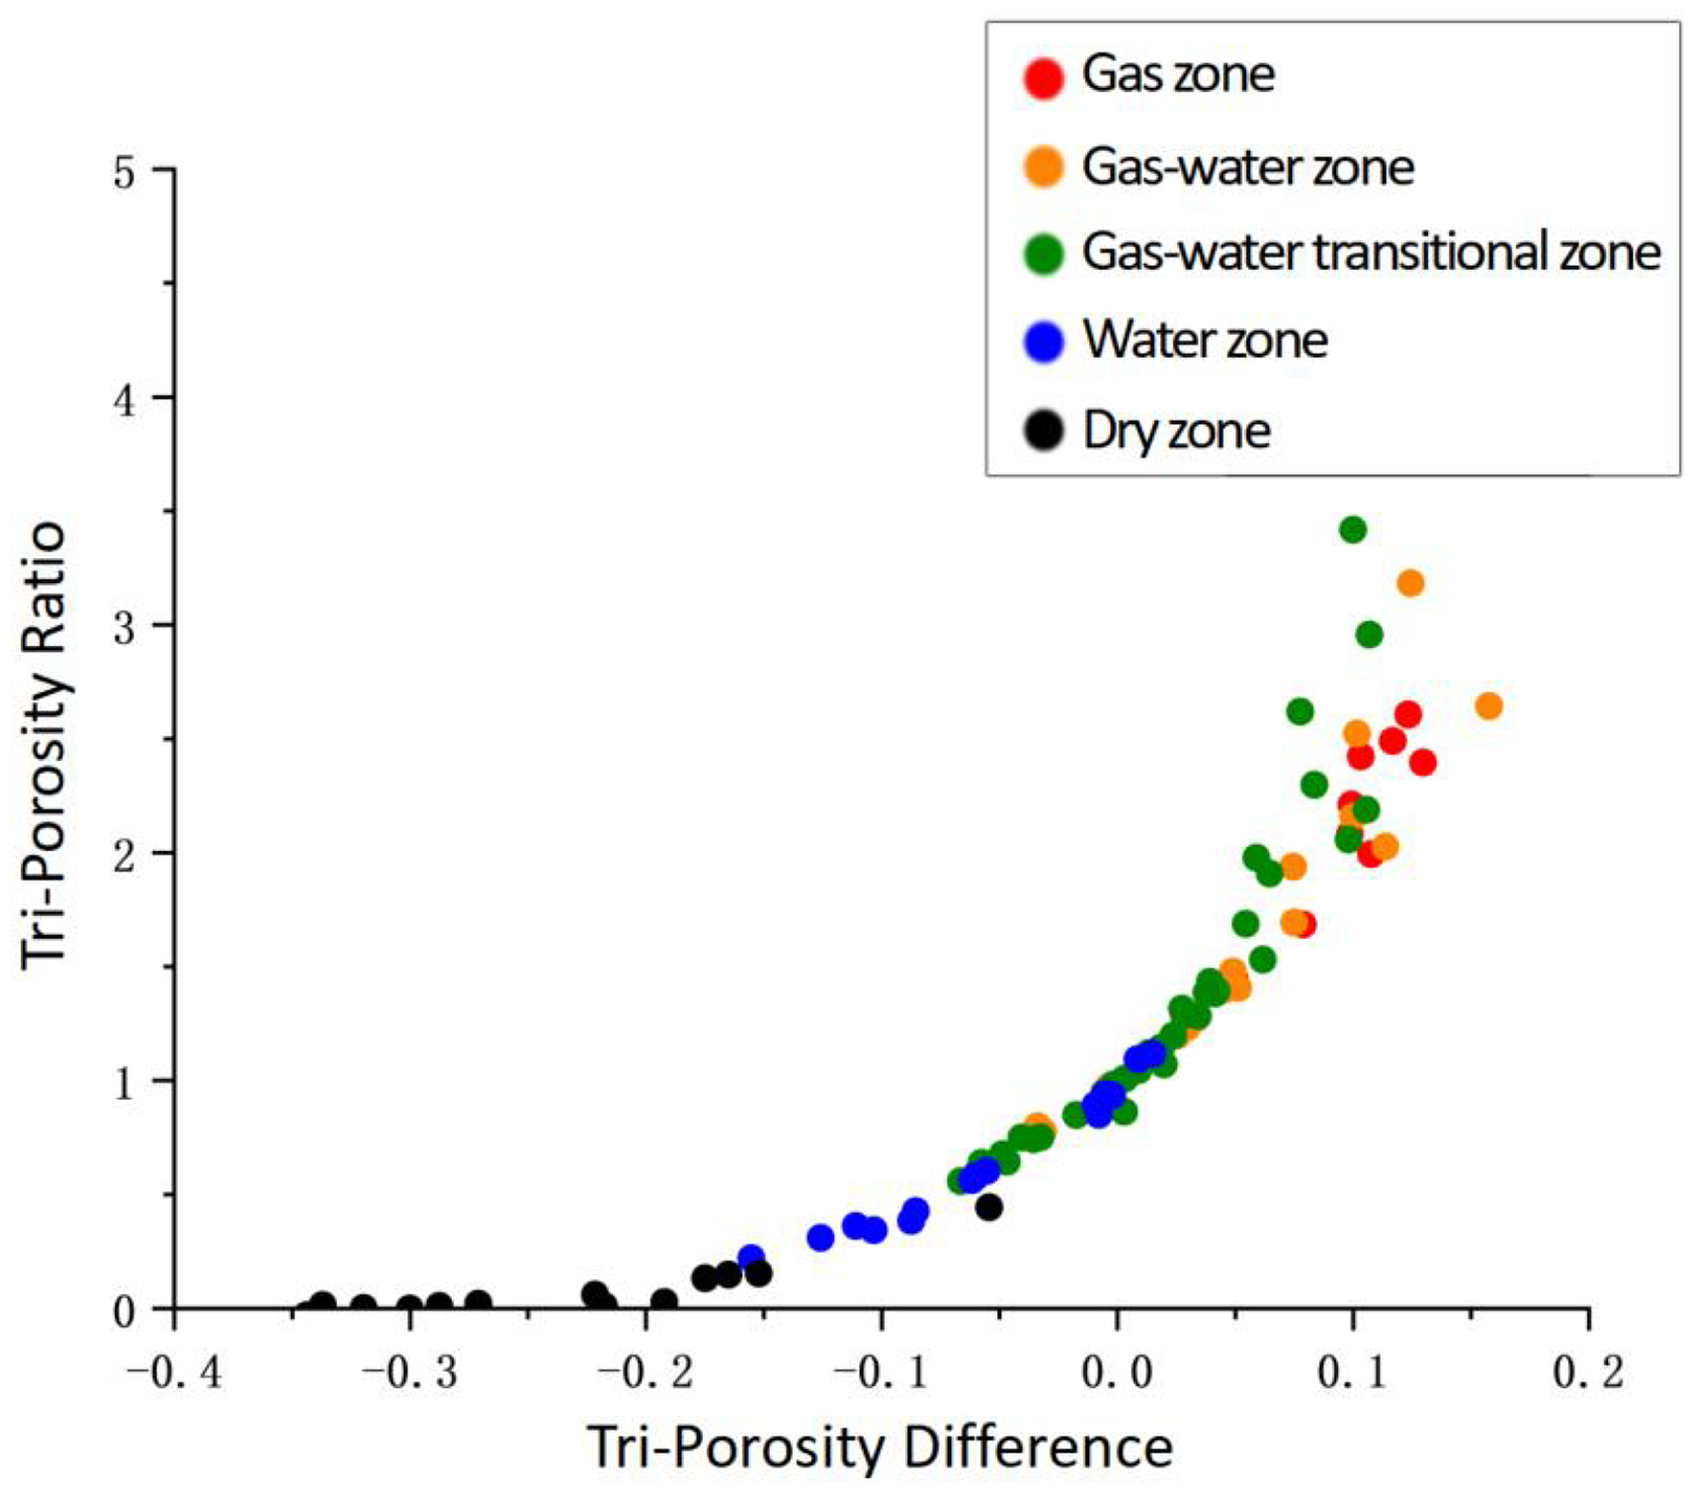
Cross-plot of three-porosity difference three-porosity ratio.
From Figure 4, it can be observed that the intersection plot of the difference in three porosity and the ratio of three porosity can to some extent distinguish different fluid types in reservoirs, but there is a limitation of large response overlap range. Additionally, the reliability of identifying reservoir fluid properties with the difference in three porosity is higher than that with the ratio of three porosity.
Optimal selection of rock elastic mechanics parameters
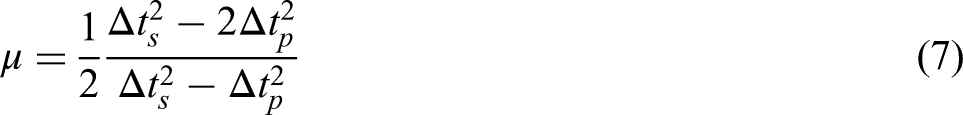
When the reservoir contains gas, the elastic mechanical properties of the rock undergo significant changes, with a significant decrease in longitudinal wave velocity and a basic change in transverse wave velocity, resulting in a decrease in the ratio of longitudinal to transverse wave velocities. By combining the longitudinal and transverse wave velocities with the density curve in conventional well-logging, various rock elastic mechanical parameters can be calculated, including Poisson's ratio, Young's modulus, shear modulus, bulk modulus, volume compression coefficient, Lame constant. These parameters can also reflect the gas content of the formation. The calculation formulas are shown in equations (6)–(12) (Fang et al., 2020b; Wang, 2013; Zhang et al., 2017):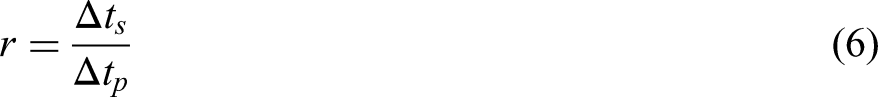
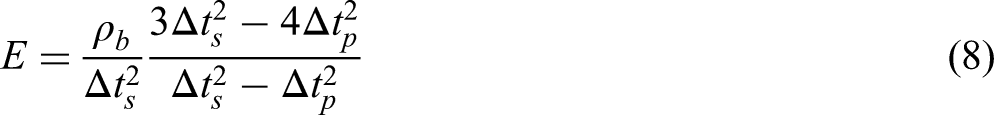


In the formula:
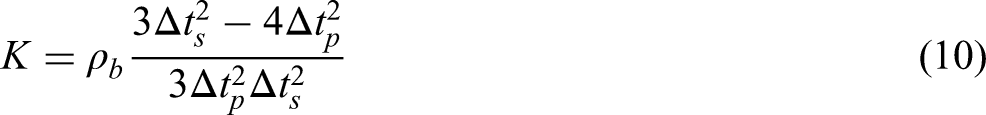
When gas is present in the formation, the Poisson's ratio, as well as modulus parameters such as bulk modulus, Young's modulus, and shear modulus, theoretically decrease as gas saturation increases. The volume compression coefficient increases with increasing gas saturation, and the Lame constant also changes. The Lame constant of the gas layer generally decreases relative to the water layer. Perform box plot analysis on the various rock elastic parameters mentioned above (Figure 5).
Box plot of rock elastic parameters response in reservoirs with different fluid properties. (a) Box plot of longitudinal and transverse wave velocity ratio response; (b) box plot of Poisson's ratio response; (c) box plot of Young's modulus response; (d) box plot of shear modulus response; (e) box plot of volume compression coefficient response; (f) box plot of Lame coefficient λ response.
From Figure 5, it can be presented that among the various elastic moduli mentioned above, the longitudinal to transverse wave velocity ratio (Figure 5(a)), Poisson's ratio (Figure 5(b)), Young's modulus (Figure 5(c)), shear modulus (Figure 5(d)), and Lame coefficient (Figure 5(f)) are not sensitive to the response characteristics of reservoir fluid properties, while the volume compression coefficient (Figure 5(e)) is most sensitive to the response characteristics of reservoir fluid properties, which can distinguish different types of reservoir fluids to the greatest extent and avoid identifying gas layers as water layers.
Establish a 3D intersection chart
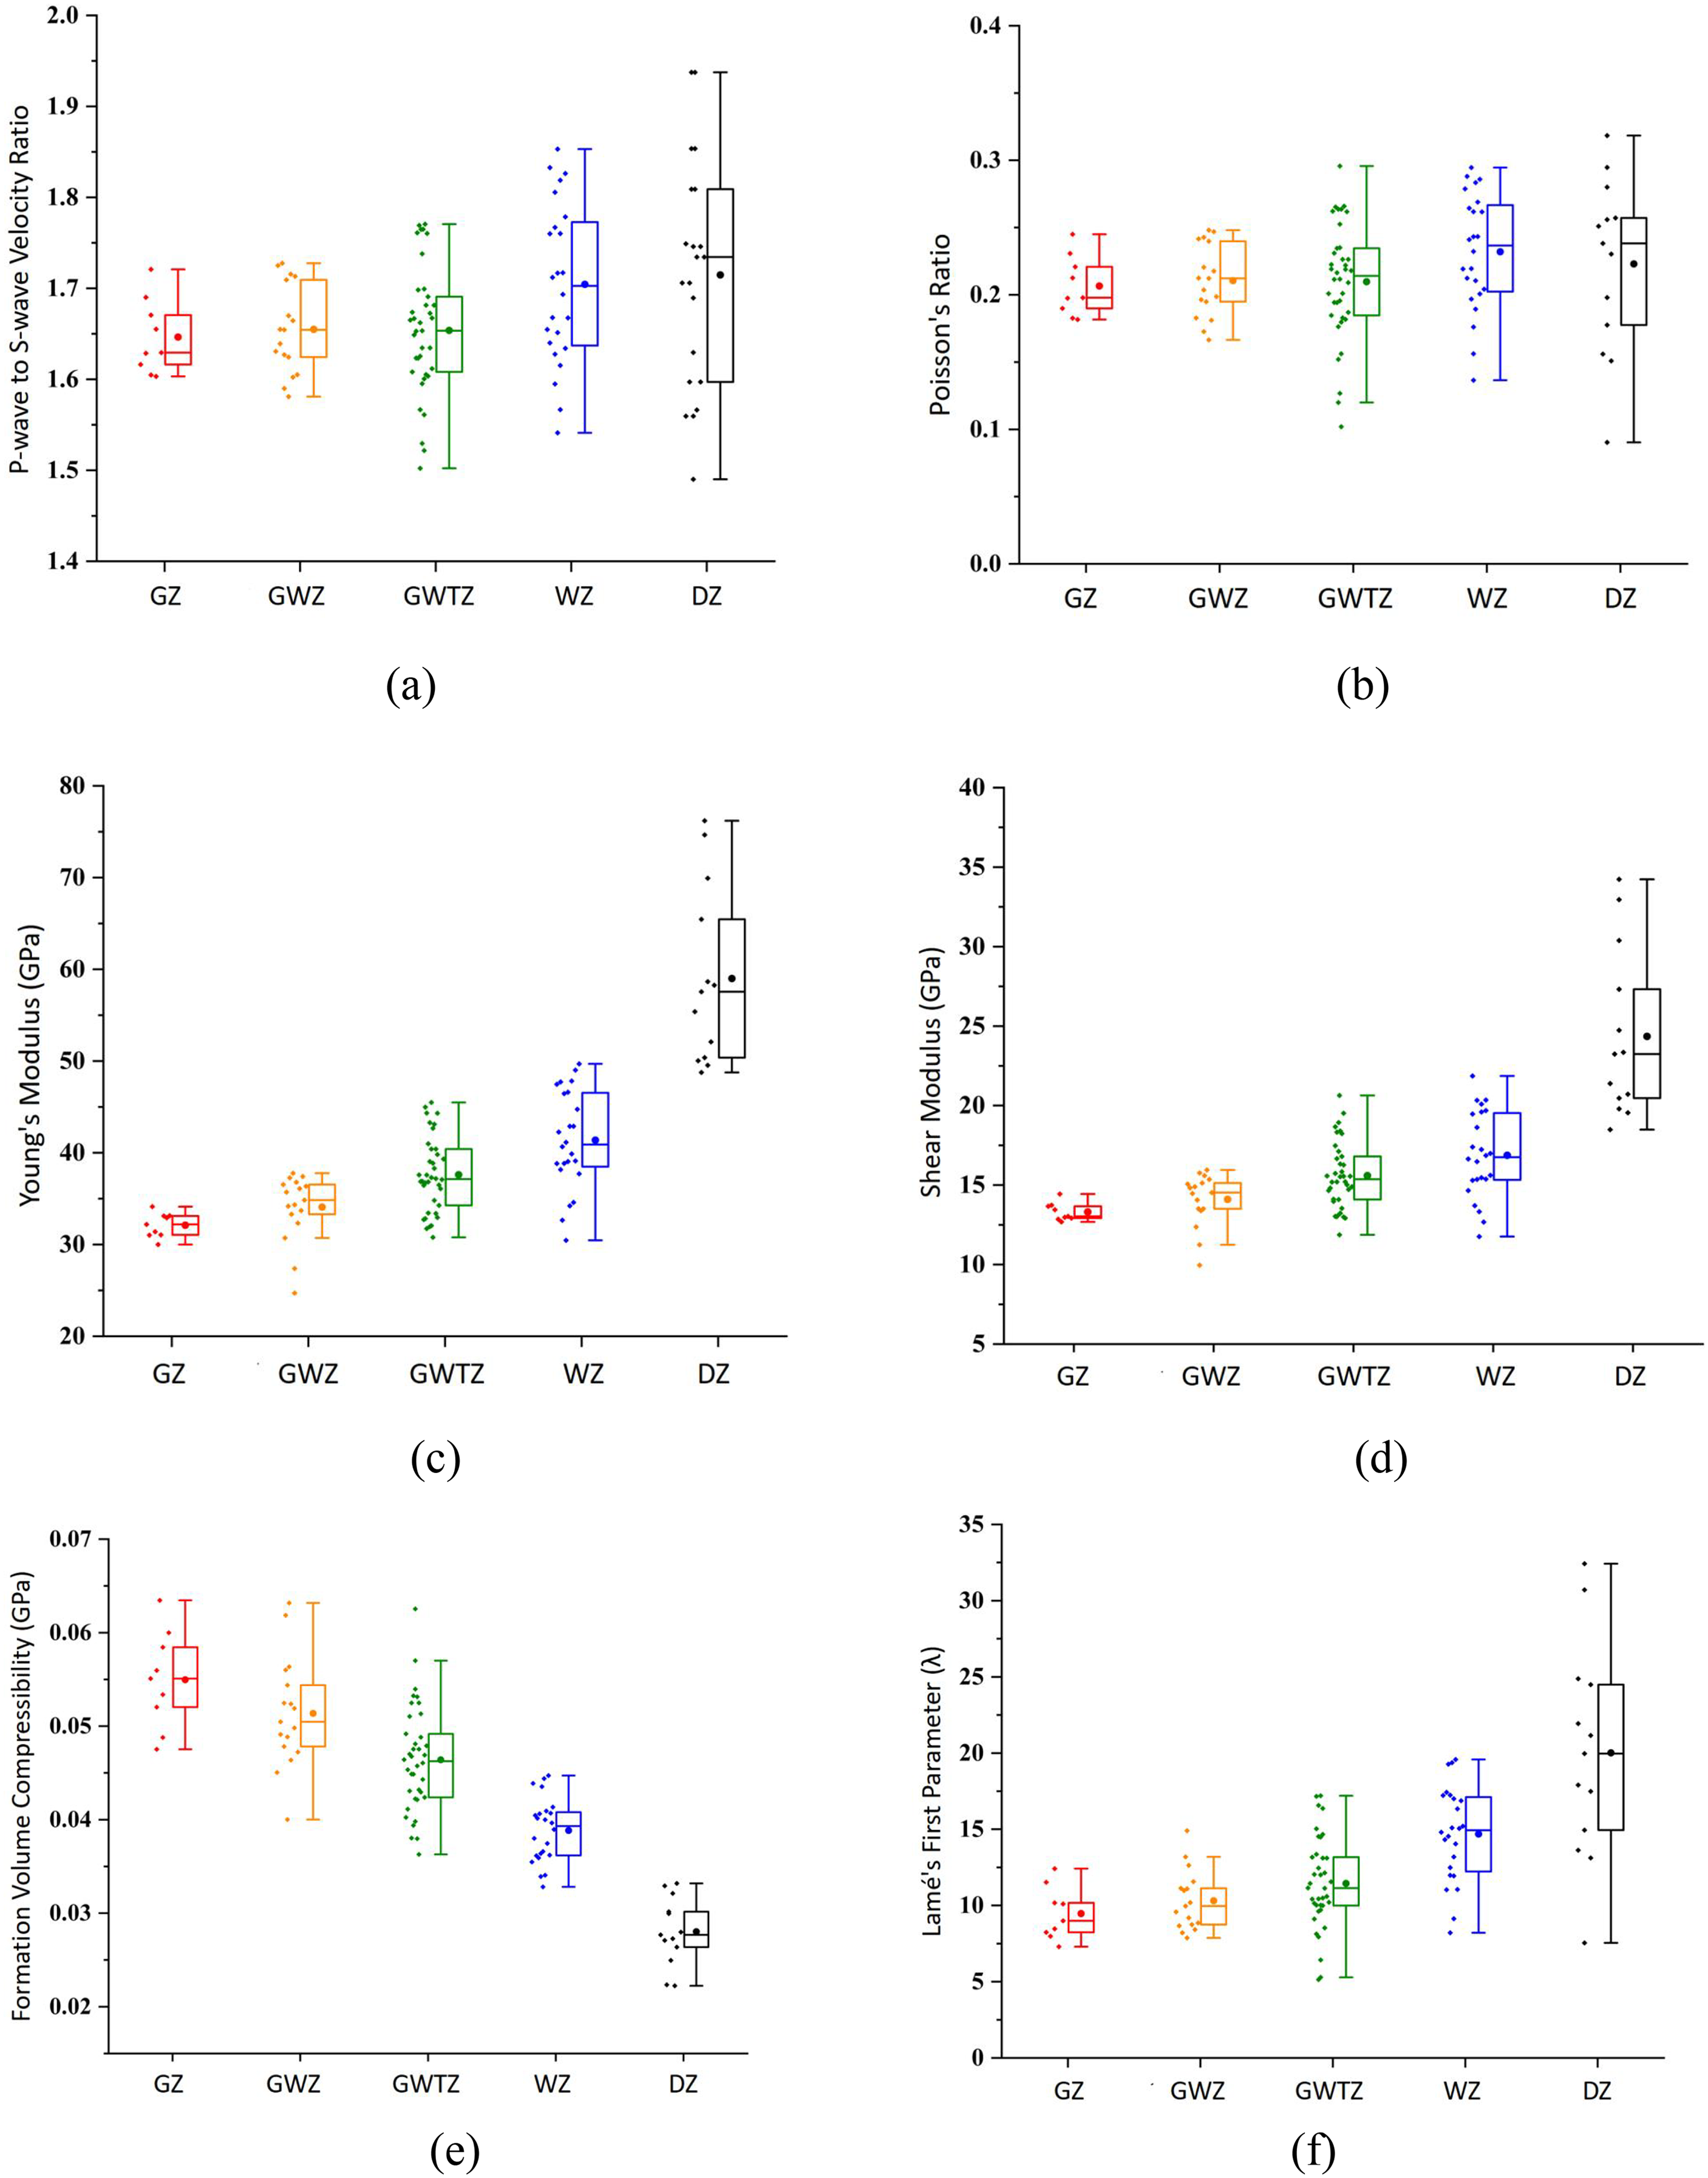
Based on the above analysis, it can be concluded that the compensation density logging curve, the three-porosity differences derived from porosity parameters, and the volume compression coefficient from rock elasticity parameters are the most sensitive to the response characteristics of reservoir fluid properties among the three types of porosity logging curves, and can effectively distinguish different types of reservoir fluids. Therefore, a three-dimensional intersection chart was constructed with the compensating density logging curve as the X-axis, the three-porosity difference as the Y-axis, and the volume compression coefficient as the Z-axis (Figure 6).
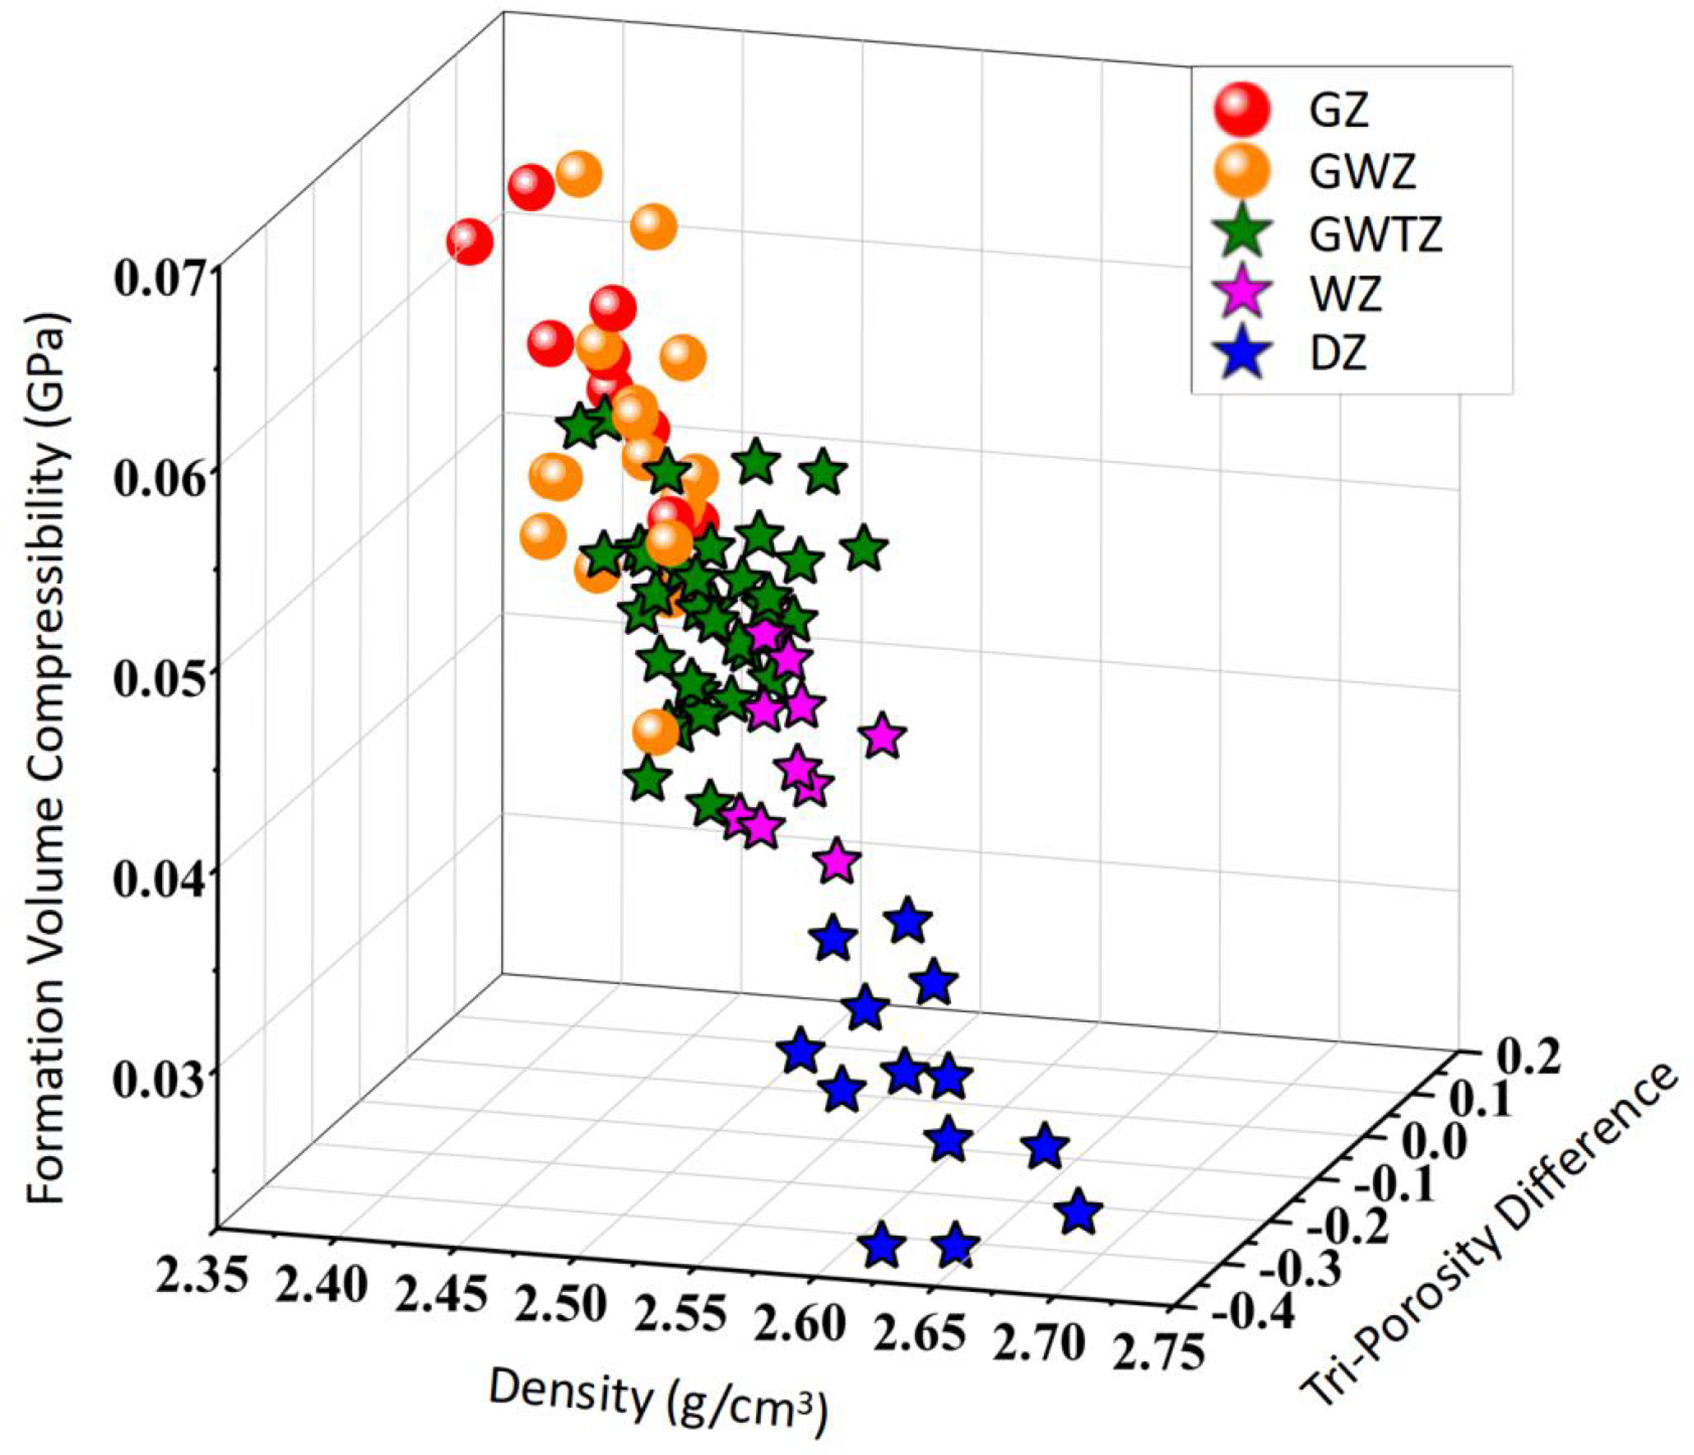
Three-dimensional intersection plot of density, three-porosity difference, and volume compression coefficient.
From Figure 6, it is evident that the distribution of data points for gas layers, water-bearing gas layers, gas–water co-layers, water layers, and dry layers is relatively regular, effectively distinguishing different reservoir fluid types. Table 2 presents the identification criteria for reservoir types with different fluid properties in the study area. However, the discrimination criteria for various types of reservoirs have a certain degree of overlap and are greatly affected by human errors when applied.
Reservoir type discrimination criteria based on 3D intersection chart method.
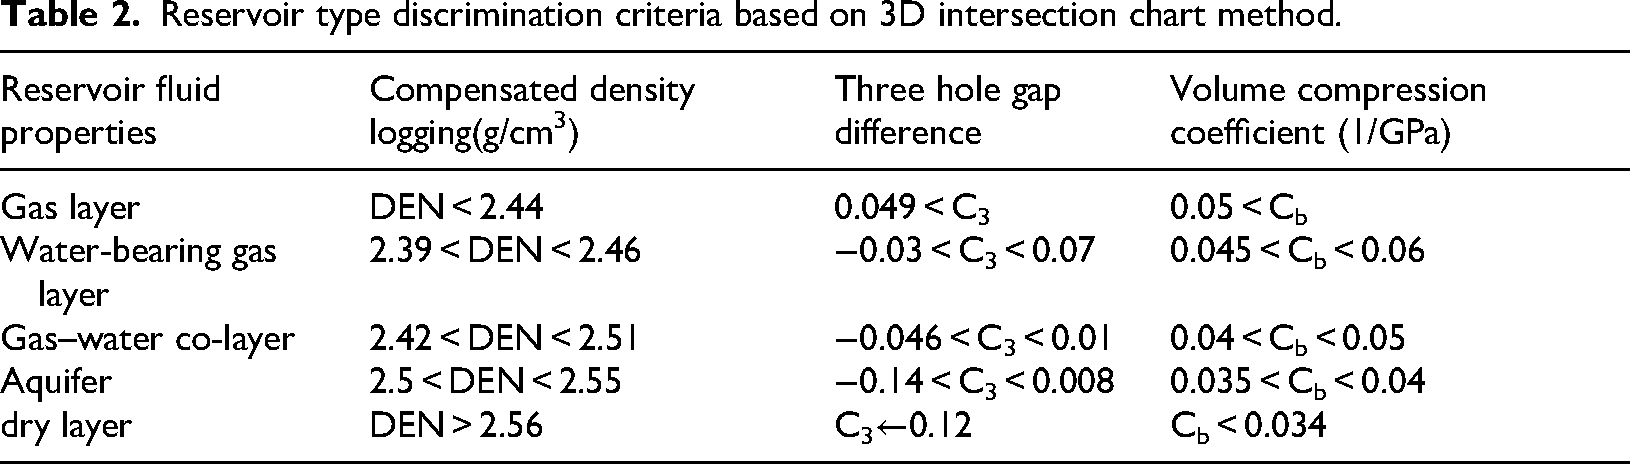
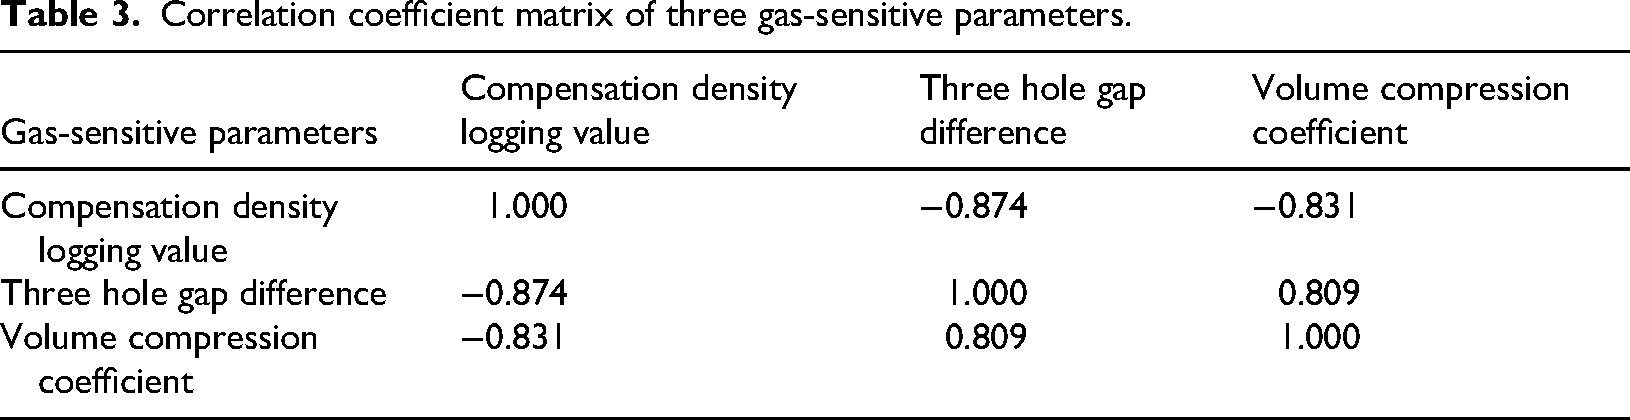
The correlation coefficient matrices of the three gas-sensitive parameters are shown in Table 3. It can be seen from Table 3 that the absolute values of the correlation coefficients of the three gas-sensitive parameters are all above 0.8. From Figure 6 and Table 3, it can be seen that the three characteristic values that have distinct distinguishing features for different fluids have strong correlation. In order to more conveniently identify the type of fluid reservoir and address the limitations of the 3D intersection chart, PCA is introduced to reduce the dimensionality of the features in the 3D intersection chart, thereby constructing a fluid property identification formula.
Correlation coefficient matrix of three gas-sensitive parameters.
Establishment of principal component based model
Perform PCA on sensitive parameter curves, construct a fluid property identification formula, obtain the fluid property identification factor D, and finally determine the range of D values for reservoirs with different fluid properties.
Principal component analysis
PCA is a mathematical dimensionality reduction method that employs an orthogonal transform to transform component correlated random vectors into new component uncorrelated random vectors. With minimal loss of information, multiple original variables are transformed into several composite variables through linear combination. These composite variables represent most of the information in the original data and are uncorrelated with each other (Meng et al., 2023; Ye et al., 2019; Zhang et al., 2022).
Collect m features from n samples Calculate the mean and standard deviation, standardize the features of the raw data to eliminate the influence of dimensionality. The formulas are as follows:
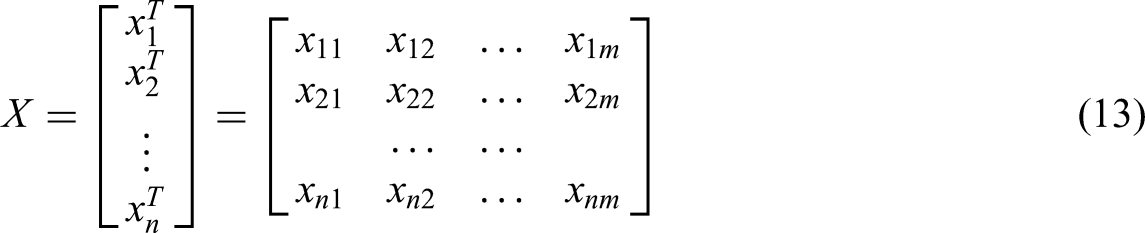
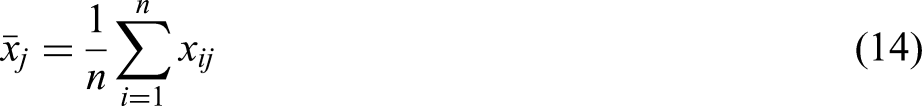
In the formula,
The standardized parameter values are as follows: Calculate the correlation coefficient matrix
of which
In the formula, Calculate the eigenvalues and eigenvectors of the correlation coefficient matrix R. Sort the m eigenvalues of the correlation matrix R as follows:
In the formula, Calculate the information contribution rate and cumulative contribution rate of the eigenvalues
The cumulative contribution rate of principal component 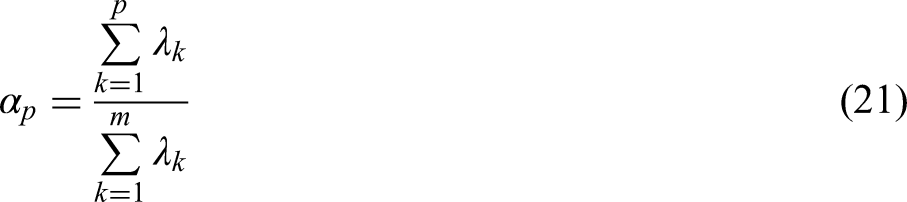
When
Constructing a formula for identifying fluid properties
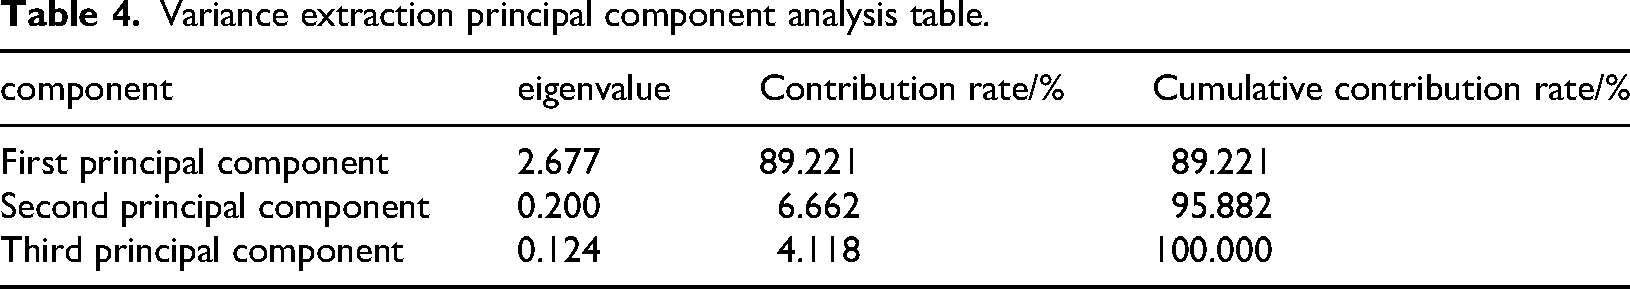
The variance extraction PCA is shown in Table 4. The variance contribution rate of the first principal component is the highest, reaching 89.221%. The eigenvalues are greater than 1, indicating that it has the highest information content; the variance contribution rates of the second and third principal components gradually decrease, and the eigenvalues are less than 1. Since the first principal component contains most of the information in the original data, it is retained.
Variance extraction principal component analysis table.
Finally, construct the fluid property recognition formula (Equation 22):
In the formula, D is the identification factor for fluid properties; 
In formula (23) (Liu et al., 2022), xi corresponds to each gas-sensitive parameter, xmax is the maximum value of the sample array, xmin is the minimum value of the sample array, f(xi) is the normalized gas-sensitive parameter, and the normalized gas-sensitive parameters are all between [0,1].
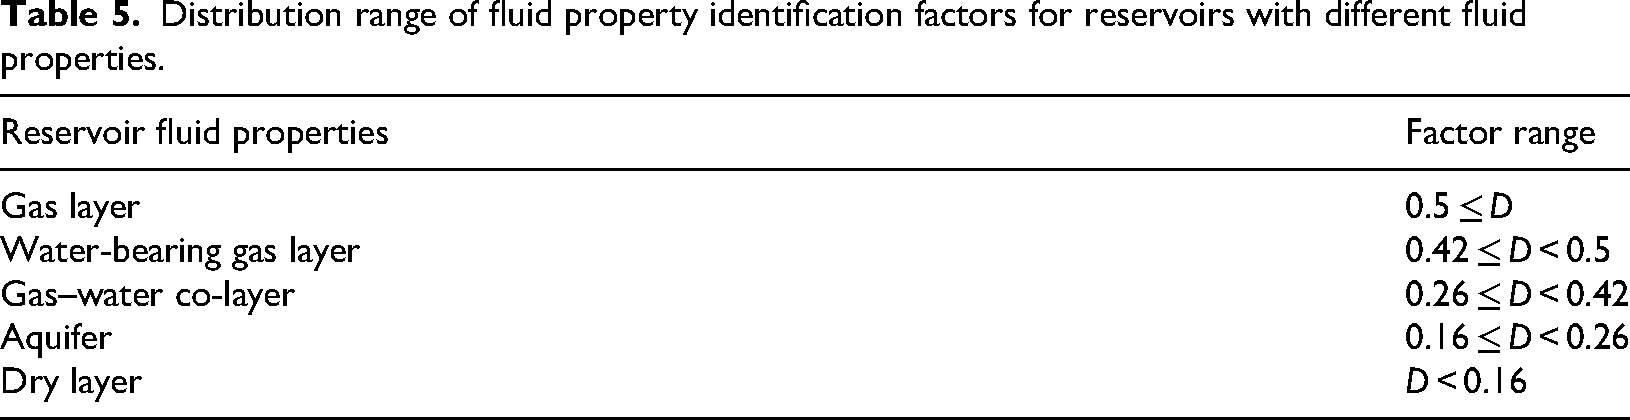
Calculate the D values of reservoirs with different fluid properties and plot them into a box plot, as shown in Figure 7. From the figure, it can be seen that as the gas saturation of the reservoir increases, the fluid property identification factor D value of the reservoir increases. Based on the data distribution of reservoirs with different fluid properties, the distribution range of the fluid property identification factor D value is given. It should be noted that due to the overlap of data distribution between the water-bearing layer and the gas–water layer, the D value range of these two types of reservoirs is divided from the middle part of the data overlap. The fluid property identification criteria for reservoirs are shown in Table 5.
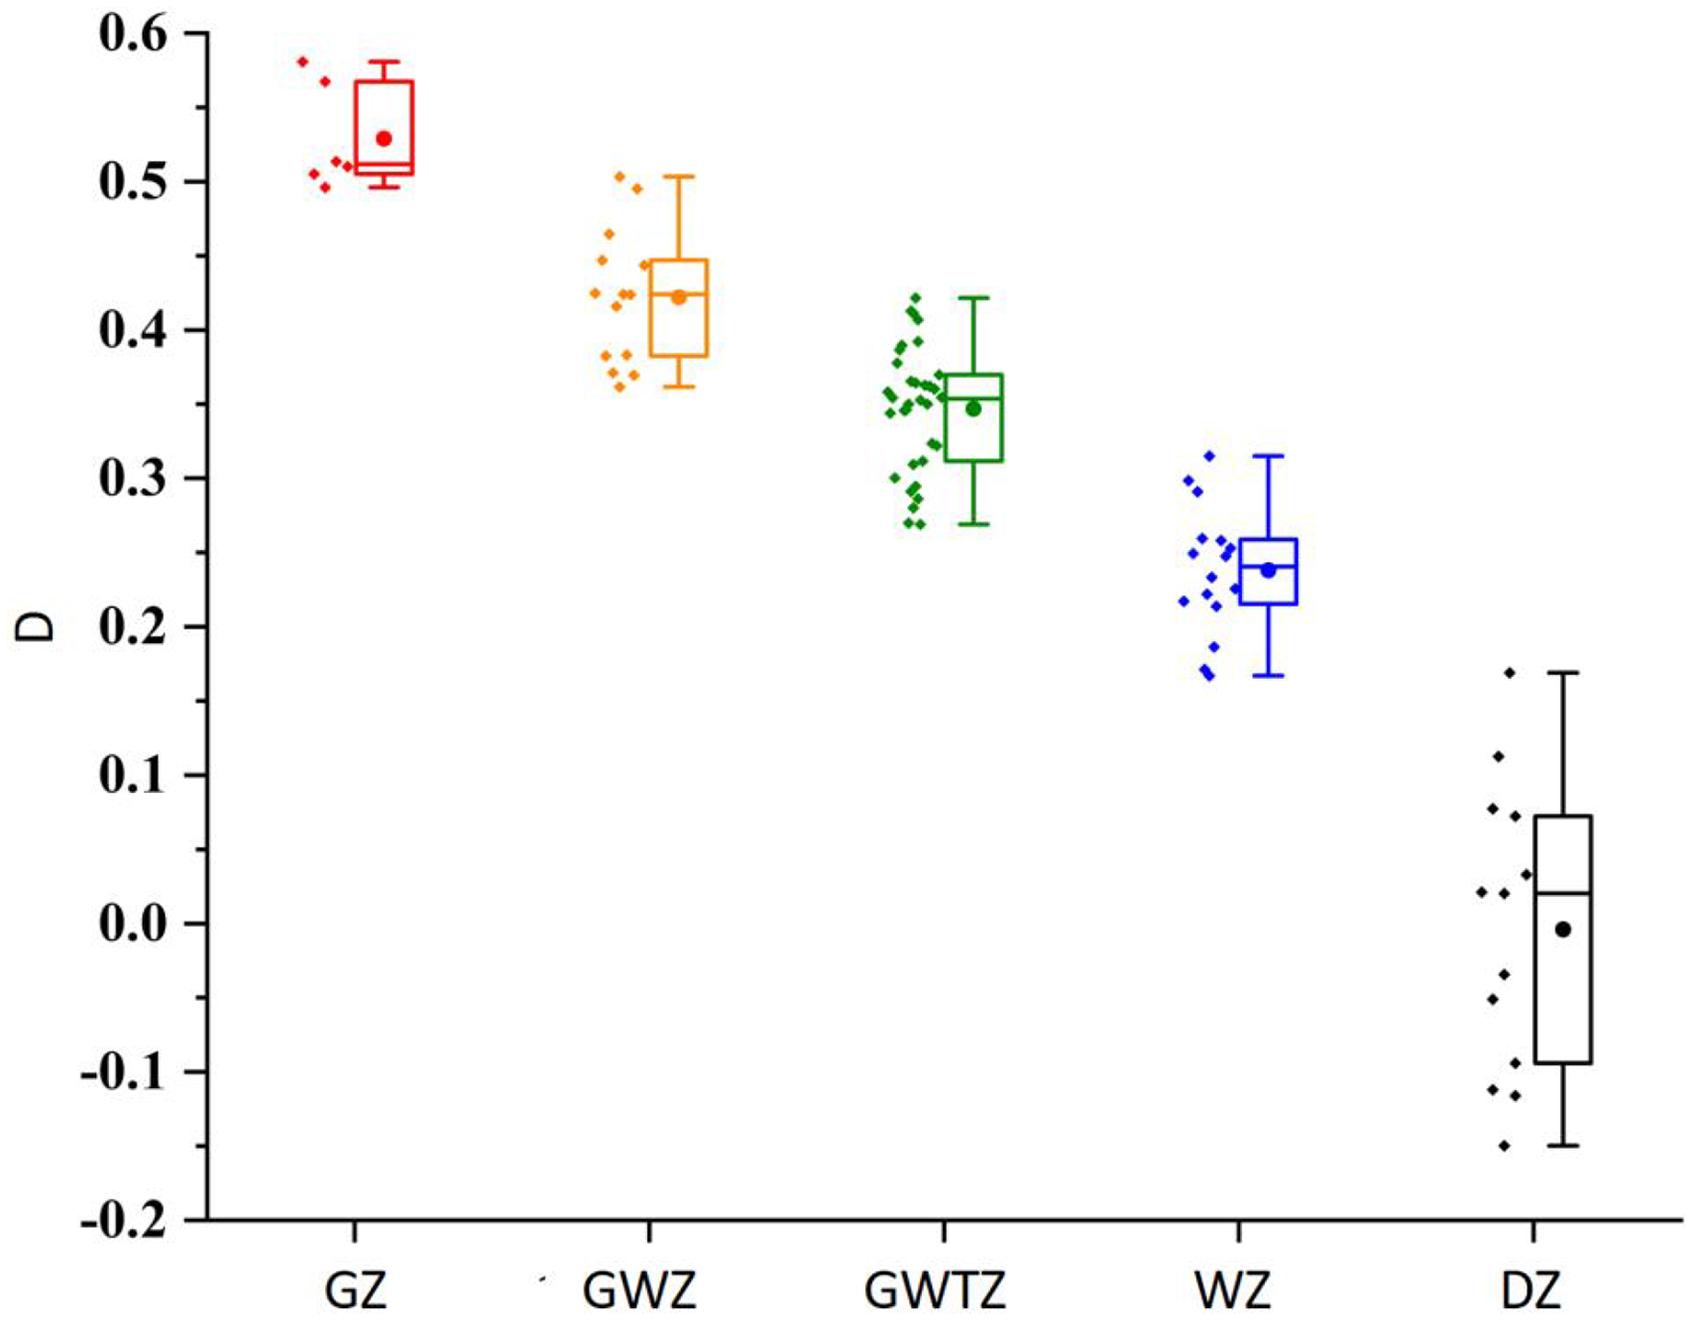
Distribution box plot of fluid property identification factor D in different types of reservoirs.
Distribution range of fluid property identification factors for reservoirs with different fluid properties.
Application effect
The above model was applied to fluid identification in 47 wells in the research area. After gas testing in 73 layers, the fluid identification accuracy of this method reached 83%. Applying this method to actual well data, Figure 8 shows the application result based on the fluid property identification factor D. The average D value of Figure 8(a) is 0.53, so the layer at 1210–1214 m is predicted to be a gas layer, and the gas testing shows that the gas production is 50,000 m3/d and the water production is 0 m3/d, which is consistent with the predicted results. The average D value of the layer at 1793–1795 m of Figure 8(b) is 0.46, so it can be considered as a water-bearing gas layer. The average D value of the layer at 1804–1806 m of Figure 8(b) is 0.35, so it can be considered as a gas–water co-layer. The production test results of these two layers show that the gas production is 21,772 m3/d and the water production is 7.6 m3/d. According to the classification in Table 1, these two formations are water-bearing gas layer as a whole, which shows that the prediction results in this paper are more precise.
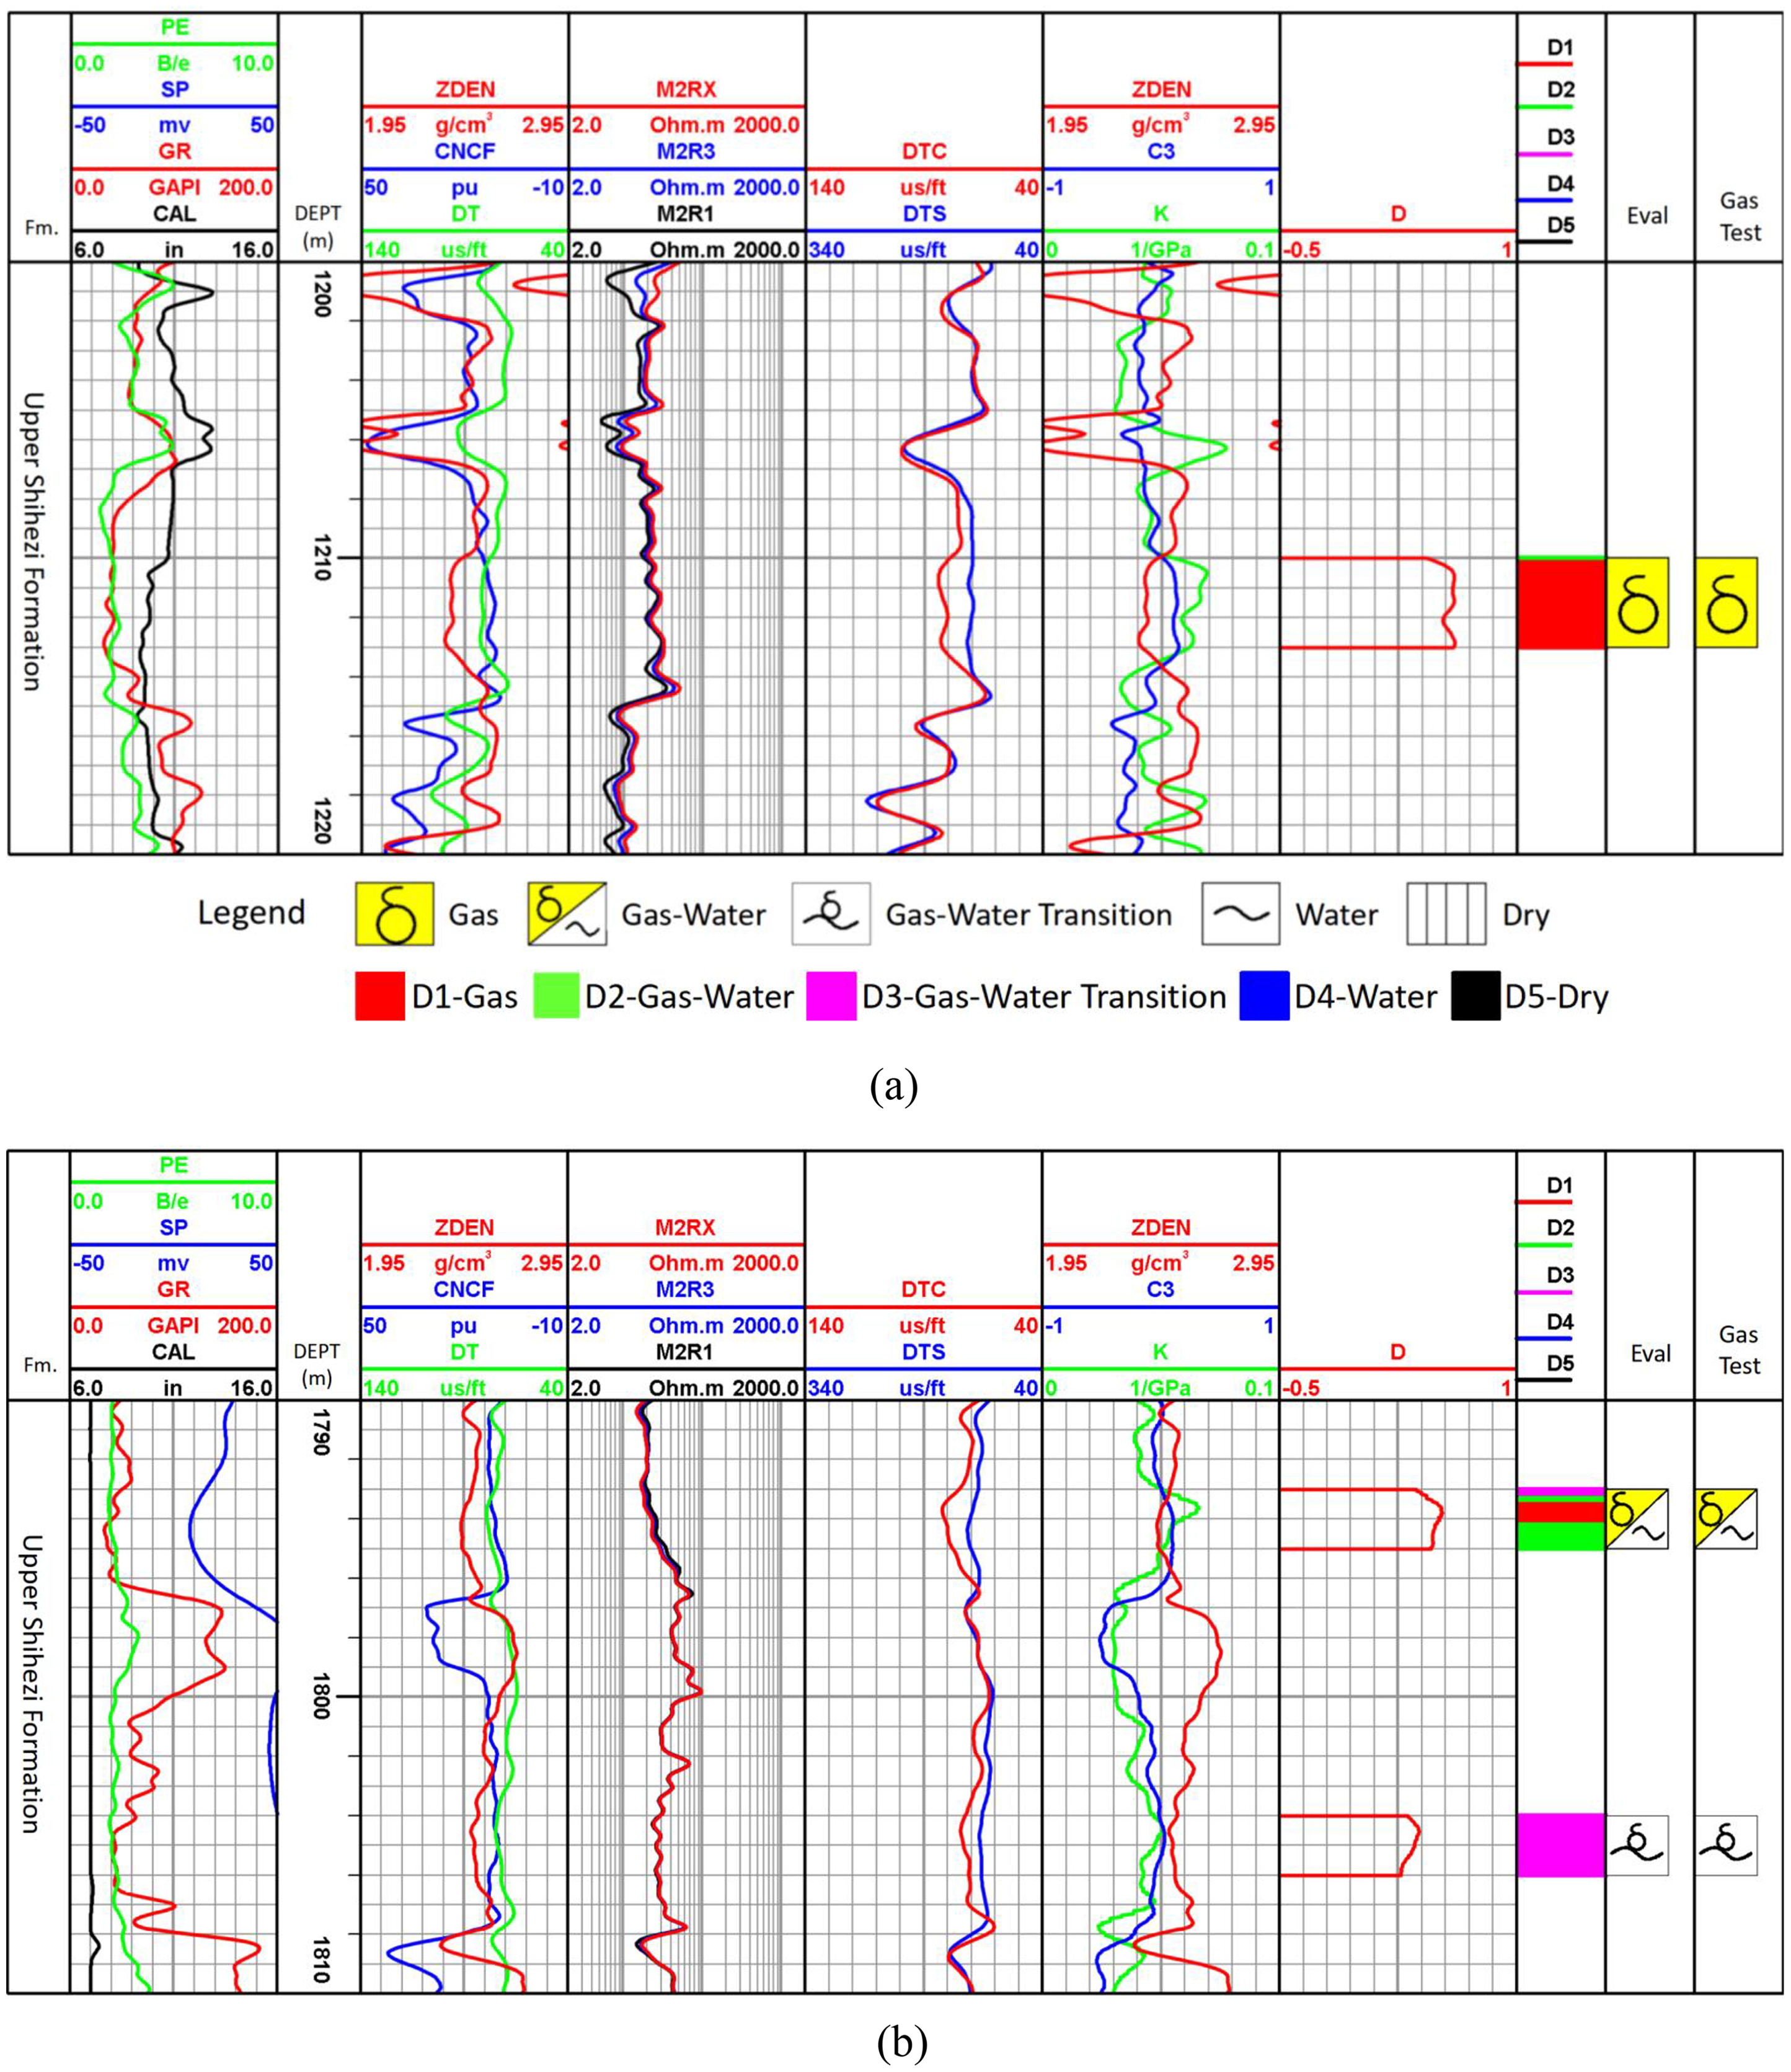
Application effect diagram based on fluid property identification factor D. (a) Identification effect diagram of gas layer recognition; (b) identification effect diagram of water-bearing gas layer and gas–water co-layer.
The application results indicate that this method has good applicability for the identification of fluid properties in the study area. However, this method also has certain limitations. In the lower section of Figure 8(b), some sampling points in the water-bearing gas layer were mistakenly identified as gas layers, but the overall characteristics of the layer were displayed as water-bearing gas layers, and this misjudgment will not affect production. Therefore, neither situation will affect the final result.
Conclusion
Based on the production test data, this paper developed a set of criteria for determining the fluid type of tight reservoirs, then screened the main control parameters for fluid classification, and finally established the fluid classification model from well-logging.
The density logging, the three-porosity differences derived from porosity parameters, and the volume compression coefficient from rock elasticity parameters are the most sensitive to fluid types of tight reservoir. By analyzing gas-sensitive parameters, a three-dimensional intersection chart was established to identify reservoirs with different production capacities. A classification standard for reservoir production capacity was constructed based on PCA. This method was applied to classify the production capacity of complex tight sandstone reservoirs into reservoir categories. After verification of 73 gas layers in 47 wells, the fluid identification accuracy was improved to 83%.
Footnotes
Acknowledgments
The project was supported by the National Natural Science Foundation of China (Grant No. 42204127).
This work is supported by the 14th Five-Year Plan major science and technology project ‘Key Technologies for Exploration and Development of Onshore Unconventional Natural Gas’ (grant no. KJGG-2021-1000).
Funding
The authors received no financial support for the research, authorship, and/or publication of this article.
Declaration of conflicting interests
The authors declared no potential conflicts of interest with respect to the research, authorship, and/or publication of this article.