
Abstract
Significant reserves have been discovered in deep fault-karst reservoirs of the platform area of the Tarim Basin, revealing great potential for lower Paleozoic petroleum resources in the region. Modeling of burial, paleotemperature and hydrocarbon generation history and analysis of fluid inclusion homogenization temperature data was conducted, enabling us to conclude that hydrocarbon charging took place in three periods, mainly occurred during the Hercynian tectonism. The simulations show the following: In the known area, the coincidence rate of simulated oil and gas accumulation and reserve areas is greater than 80%, indicating high reliability of the simulation results. In the undetected area, the predicted oil and gas accumulation areas cover about 50% of the discovered reserve area and still indicate a considerable resource potential. In the prediction area, there is lower oil and gas saturation than that in the reserve area, a relatively scattered accumulation area, and few continuous accumulation areas, indicating poor resources. The favorable resource potential areas cover the fault-karst bodies near Well Shunnan 3 and Well Shunbei 4, northeast of Well Manshen 8, northwest of Well Gulong 2, the karst zones in southwest of the Tazhong bulge and the northwest of the Tabei uplift.
Keywords
Introduction
There are abundant petroleum resources in Tarim Basin. The fourth evaluation of oil and gas resources in China shows that the amount of the conventional oil and gas resources in Tarim Basin is 168.06 × 10⁸ t of oil and gas equivalent including 75.06 × 10⁸ t of oil and 11.7394 × 10¹² m3 of gas (Jianzhong et al., 2019). By the end of 2022, the Ordovician system in Tabei uplift, Aman transition zone and Tazhong uplift have third-level geological reserves of 33.7446 × 10⁸ t of oil, 4.1415 × 10⁸ t of condensate oil and 1.4990 × 10¹² m3 of gas, with a total oil and gas equivalent reserves of 49.8783 × 10⁸ t. This shows that the Ordovician oil and gas resources in platform area have great potential and provide major targets of subsequent exploration.
Cambrian Yuertusi Fm-Ordovician oil and gas system is developed in lower Paleozoic in Tarim Basin. In the platform area of Tarim Basin, Ordovician hydrocarbon accumulation is characterized by “in situ hydrocarbon source, transportation through fault, and accumulation in late period” (Lixin, 2020). Study on the hydrocarbon source reveals that Ordovician oil and gas in the platform area is mainly migrated along the fault system cutting Cambrian strata (Feng et al., 2021). Hydrocarbon distribution in Paleozoic carbonate rocks is controlled by the long-term stable paleo-uplift slope (Guanghui et al., 2010; Jinhu et al., 2011). The oil and gas enrichment is controlled by the development degree of reef-beach reservoirs and weathering crust karst reservoirs, and oil and gas are distributed as quasi-stratified shape in a large scale along the karst zone (Jianfa et al., 2019). In recent years, with deepened understanding of the theory of strike-slip fault-controlled oil and gas and progress of three-dimensional (3D) seismic exploration technology, especially progress of seismic exploration and drilling technology in desert, a better-quality seismic data from deep and ultra-deep strata have been obtained, and dozens of strike-slip faults have been discovered in Paleozoic strata in platform area (Fangzheng 2018; Guohui et al., 2021). These large strike-slip faults running into the basement provide vertical hydrocarbon migration paths due to communication with the hydrocarbon source, and they are transformed by dissolution which results in an effective improvement of reservoir performance of low-porosity and low-permeability carbonate rocks (Rong et al., 2020).
New drilling and seismic data show that these deep-buried carbonate karst reservoirs are spatially dependent in the strike-slip fault (Zeng et al., 2024). Strike-slip fault networks in the paleo-uplifts in the Tarim Basin have attracted tremendous interest because of their effects on distribution of karst-type carbonate reservoir and hydrocarbon migration (Shang et al., 2023). Strike-slip faults in deep basin have an obvious effect on hydrocarbon accumulation (Yin et al., 2023). Based on understanding of strike-slip fault zones controlling development of carbonate reservoirs, hydrocarbon migration and accumulation, and new exploration discoveries, a new interpretation of Ordovician hydrocarbon accumulation in the platform area, i.e., fault-karst reservoir has been obtained (Jianfa et al., 2019; Lixin, 2020).
With fine characterization of strike-slip fault zones and increase of drilling wells, it is found that there is a large change in characteristics of hydrocarbon migration and accumulation in fault zones in various structural positions and sedimentary facies zones, which affects the sustainability of exploration activity. Considering the high drilling cost in ultra-deep strata, it is needed to predict oil and gas accumulation areas and reduce exploration risks by characterizing distribution of fault-karst reservoirs by analysis of hydrocarbon accumulation and simulation of hydrocarbon migration and accumulation.
In recent years, some progress has been made in the analysis of oil and gas system and simulation of hydrocarbon migration and accumulation (Chengzao et al., 2023; Xiongqi et al., 2022). Hydrocarbon migration and accumulation in Tarim Basin was simulated based on basin simulation and hydrocarbon system theory. Shi et al. (2010) developed a 3D three-phase Darcy flow software and obtained a good simulation result of hydrocarbon migration and accumulation history in its application in Kuqa Depression in Tarim Basin. Guo et al. (2013, 2020) summarized conventional study of basin simulation, proposed new application fields and technical problems, illustrated the status quo and progress of three hydrocarbon migration and accumulation simulation technologies, and proposed the flow line simulation result of lower Paleozoic in Mangar sag, Tarim Basin and the simulation result of Cambrian hydrocarbon migration and accumulation in Yulong structure belt of southwestern Tarim Basin. Based on the fault-sand body transportation framework, Xingqiang and Haiming (2020) carried out simulation on hydrocarbon migration and accumulation by using the integrated method of flow path and percolation, and revealed the exploration potential area of the major target layers of Tahe Oilfield in Tarim Basin, and their study is of great significance to exploration deployment in the study area. Based on the main factors of long-distance hydrocarbon migration and accumulation obtained from two-dimensional (2D) physical simulation of hydrocarbon migration and accumulation, Liu et al. (2021) revealed the favorable area of migration and accumulation of Meso-Cenozoic oil and gas in the migration and transport system in the southern Kuqa slope belt in Tarim Basin. Bin et al. (2022) simulated evolution of hydrocarbon “generation—migration—accumulation—adjustment” in the ultra-deep oil and gas system in Tarim Basin with the dynamic principle, and simulation revealed an obvious inheritance of changes in flow line of the oil and gas system and in oil and gas accumulation areas, and proposed that the uplift belt and the dominant migration paths in the slope area in Tarim Basin provide favorable areas for hydrocarbon migration and accumulation.
Application of oil and gas system and migration and accumulation simulation technology in Tarim Basin provides a guidance for future exploration. The above simulation techniques are applicable in simulation of structural reservoirs with conventional reservoirs and continuously developed reservoirs, and they have a good effect on simulation of Ordovician reef-beach reservoirs and weathering crust karst reservoirs in the platform area and are not applicable in simulation of “fault-karst reservoirs.” Thus, a geological modeling and simulation technique with better applicability is needed.
In summary, there are four problems in simulation of Ordovician hydrocarbon migration and accumulation. (i) It is generally thought that the hydrocarbon sources of Ordovician reservoirs are mainly from Lower Cambrian Yuertusi Fm, and there is still a large conflict on the thickness distribution and hydrocarbon generation potential of Yuertusi Fm source rocks. Further investigation is needed. (ii) The matrix pores are not developed in Ordovician carbonate reservoirs, and the reef-beach reservoirs, weathering crust karst reservoirs and fault-karst reservoirs are relatively developed. These effective reservoirs is highly heterogeneous, and an effective method is needed to characterize their heterogeneity. (iii) Multi-period charging occurs during Ordovician hydrocarbon accumulation, and there is still a conflict on the specific number of charging periods and the main charging period. Further investigation is needed. (iv) The Ordovician hydrocarbon accumulation process has been illustrated clearly, and characterization of migration path and prediction of hydrocarbon accumulation potential area have not been operated by quantitative simulation.
To solve above four problems, study on the Yuertusi Fm source rocks, evaluation of characteristics of Ordovician carbonate reservoirs and analysis of the hydrocarbon accumulation period were operated in this paper. Then, with the modeling data of 28 first-order faults and 76 s-order faults in the 3D geological model of the platform area as the research basis, the data of fault-karst zone distribution, seismic attributes, sedimentary facies zones (reefs and beaches) and oil and gas reservoirs were integrated to generate a favorable reservoir distribution diagram. Then, the “hydrocarbon kitchen” location was determined according to the source distribution diagram of Cambrian Yuertusi Fm in the study area, the vertical migration path was determined according to the fault-karst zone distribution, and the possible lateral migration direction was determined according to the physical property distribution of the Ordovician reservoir. A 3D invasion percolation simulation technique constrained by the transport system was used to simulate the vertical hydrocarbon migration from Yuertusi Fm to Ordovician system and and lateral migration and accumulation in Ordovician system. The simulation results revealed main hydrocarbon migration pathways and accumulation areas and predicted the potential hydrocarbon resource areas, and thus, they provide references for describing the formation mechanism of Ordovician reservoirs and selecting exploration targets in the platform area.
Geological settings
Tarim Basin has a higher west part and a lower east part, strata inclined slightly to the north and an altitude of 800–1300 m, and covers an area of 56 × 104 km2. It is a large composite superimposed basin with a structural pattern of “three uplifts and four depressions,” fully developed Phanerozoic strata and a maximum stratigraphic thickness of over 10 km (Guohui et al., 2021). A series of aulacogen and trough structures were formed in the late Paleozoic period due to effects of compressional orogeny. In the early Mesozoic period, a strong extensional movement occurred, which led to basement fault and sediment depression, and several fault basins were formed. From the late Mesozoic period to the Cenozoic period, thrust compression caused fault basins tilted to various degrees.
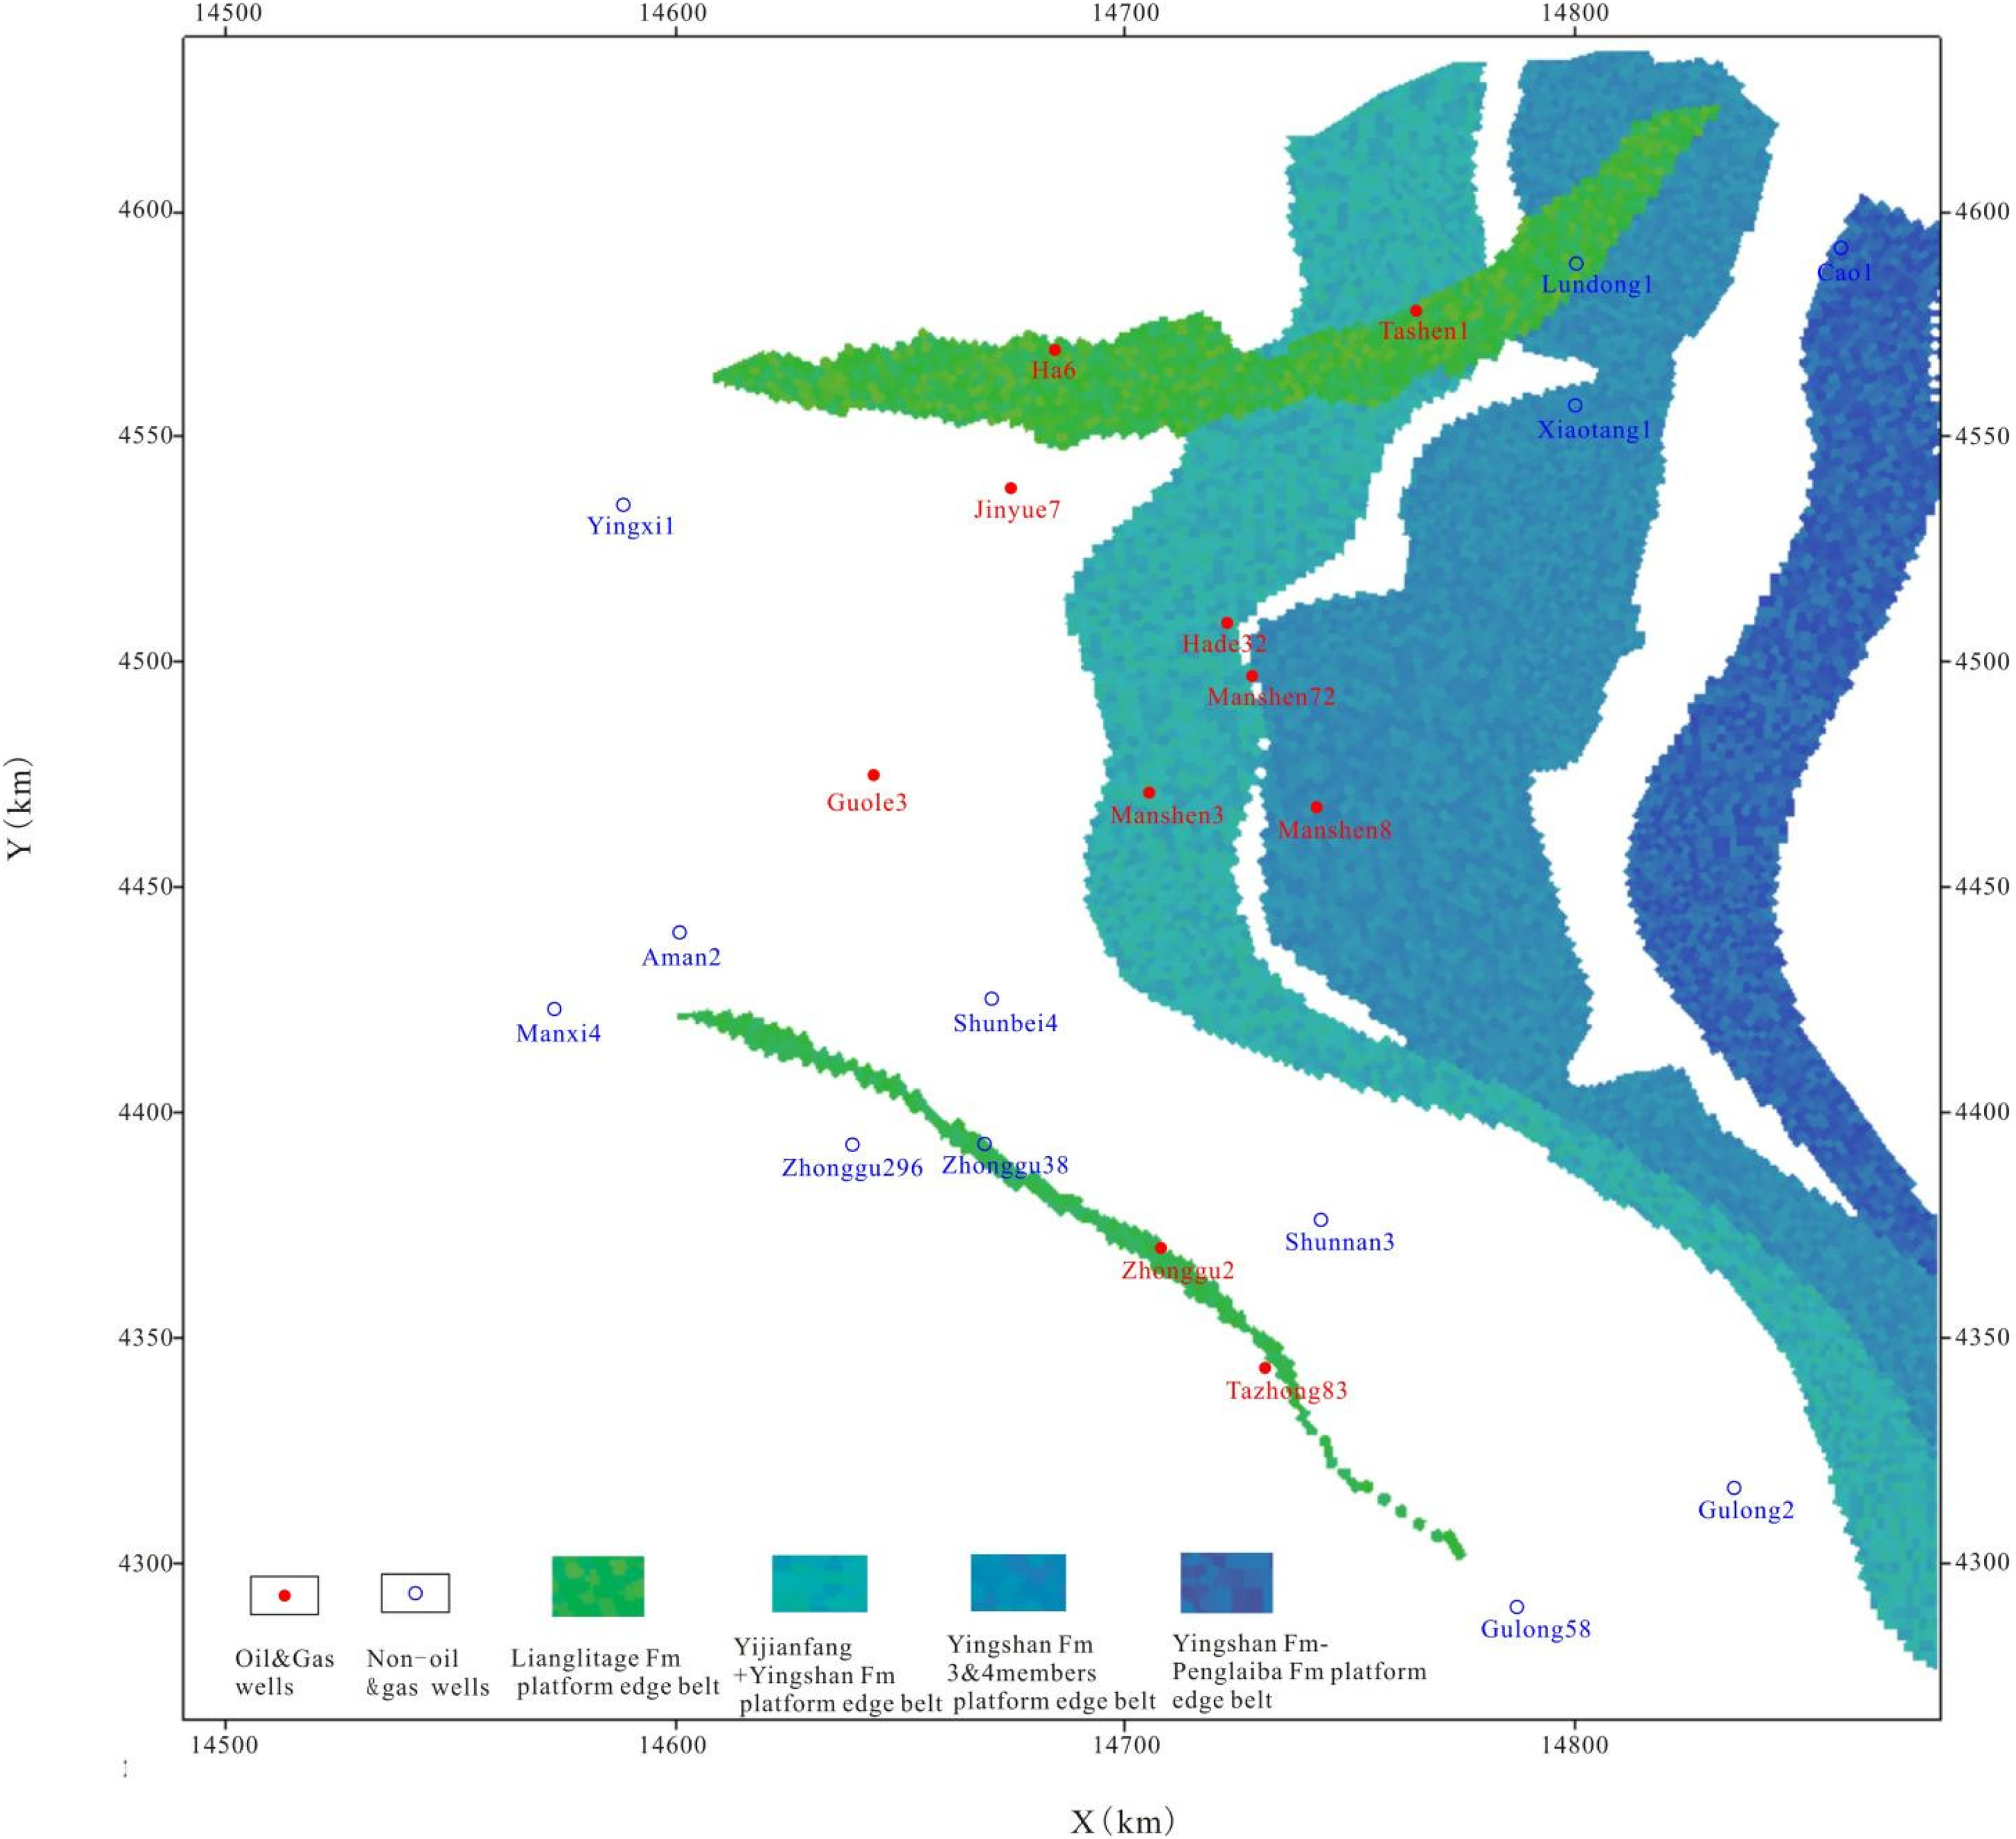
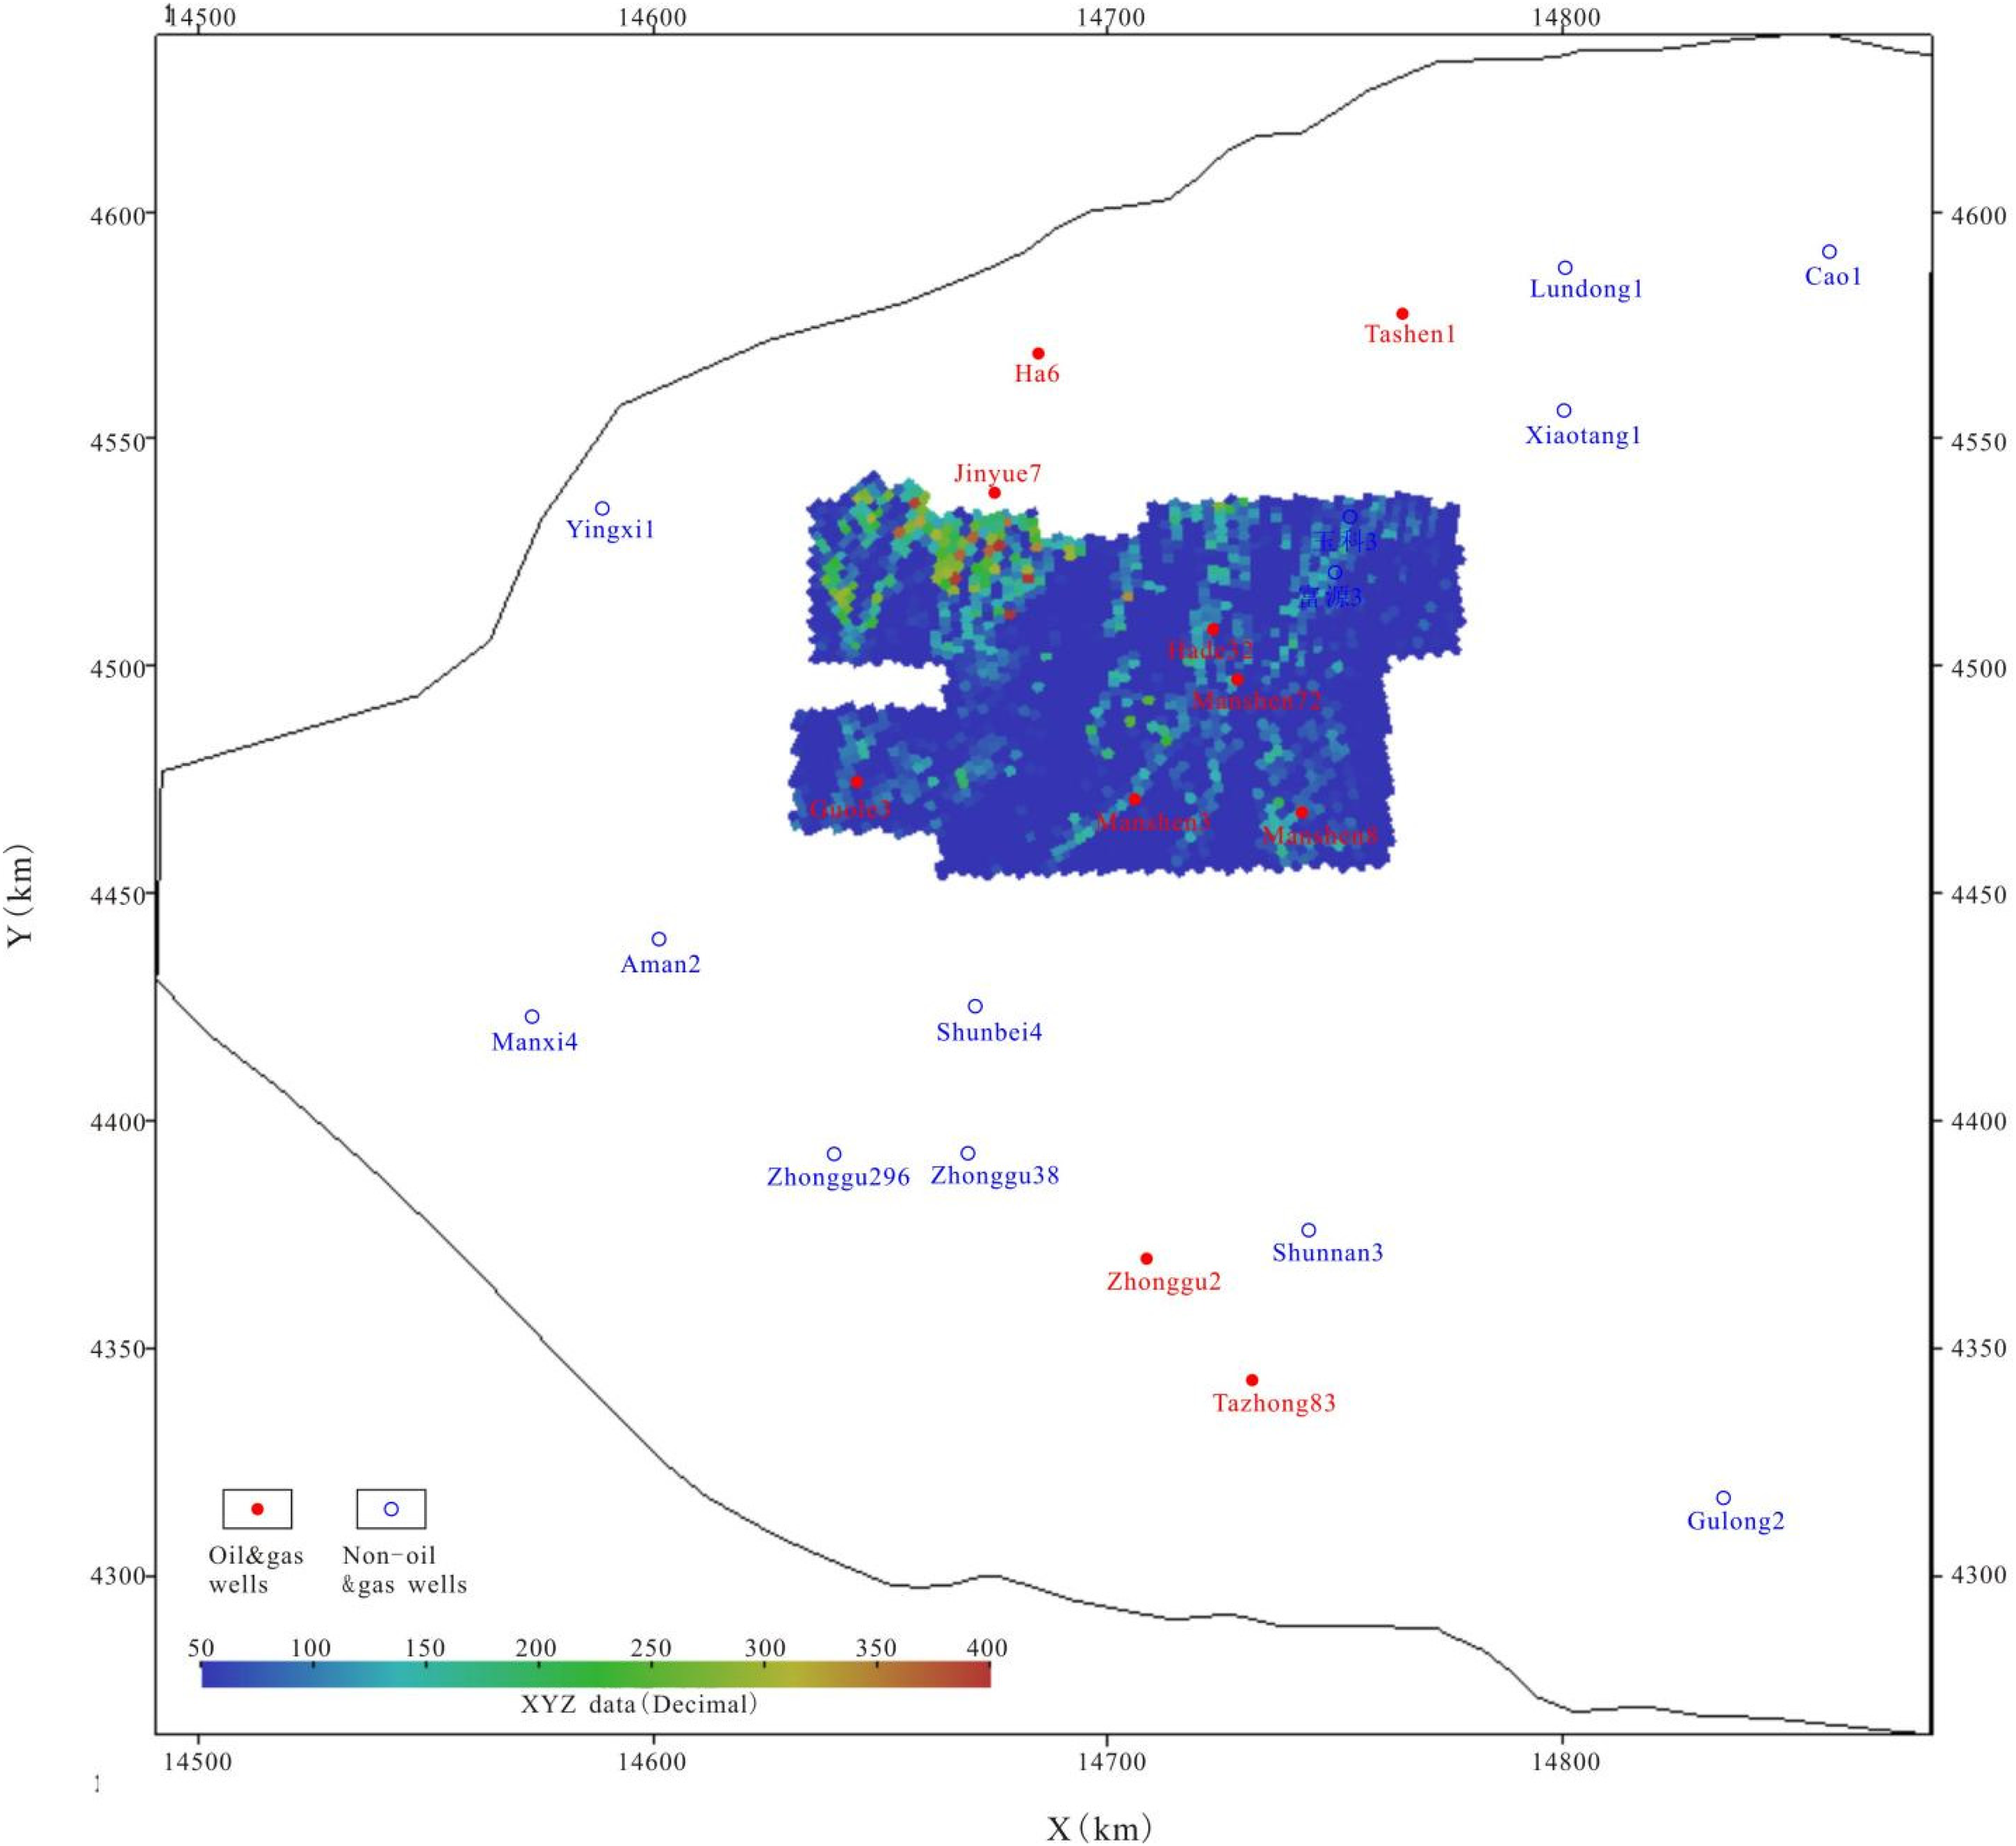
The study area is located in the central part of Tarim Basin, and covers an area of 10.4 × 10⁴ km2 including first-order structural belts of Tabei uplift, central uplift and northern depression (Figure 1). The central uplift includes second-order structural belt of Tazhong bulge. The northern depression includes second-order structural belts of Aman transition zone and Mangar sag. Fuman and Shunbei oil fields discovered in recent years are located in the north and south parts of Aman transition zone, respectively.
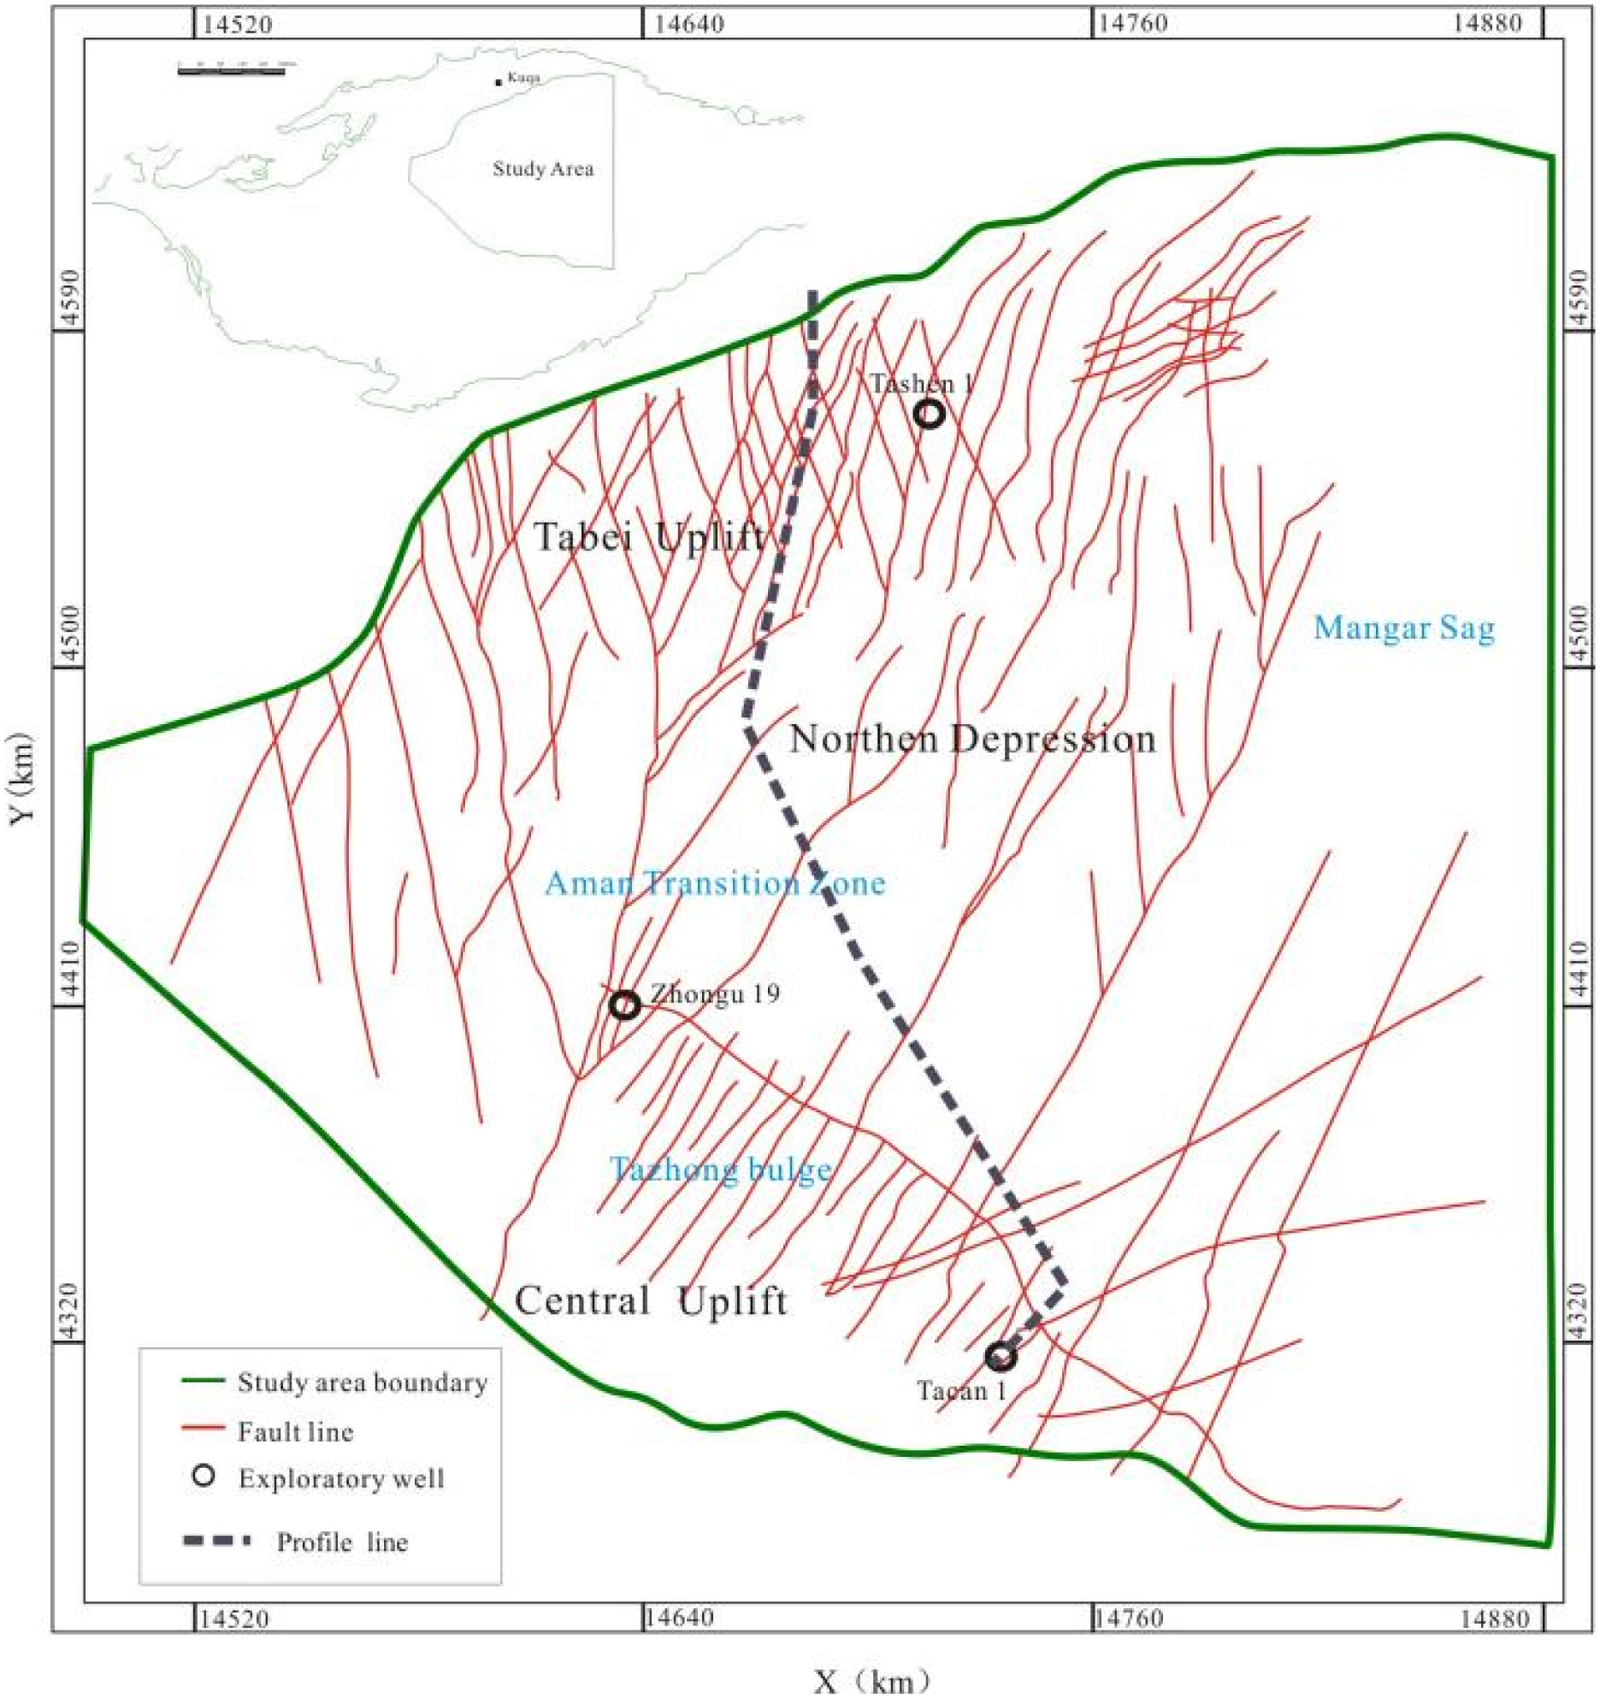
Study area and distribution of fault systems.
Discordogenic faults are widely developed in the study area. They are widely distributed in plane, covering an area of up to 9 × 10⁴ km2 (Figure 1), and have deep vertical distribution directly into lower Cambrian Yuertusi Fm through Ordovician strata (Figure 2). Hydrocarbon transportation and accumulation were controlled by these discordogenic faults.
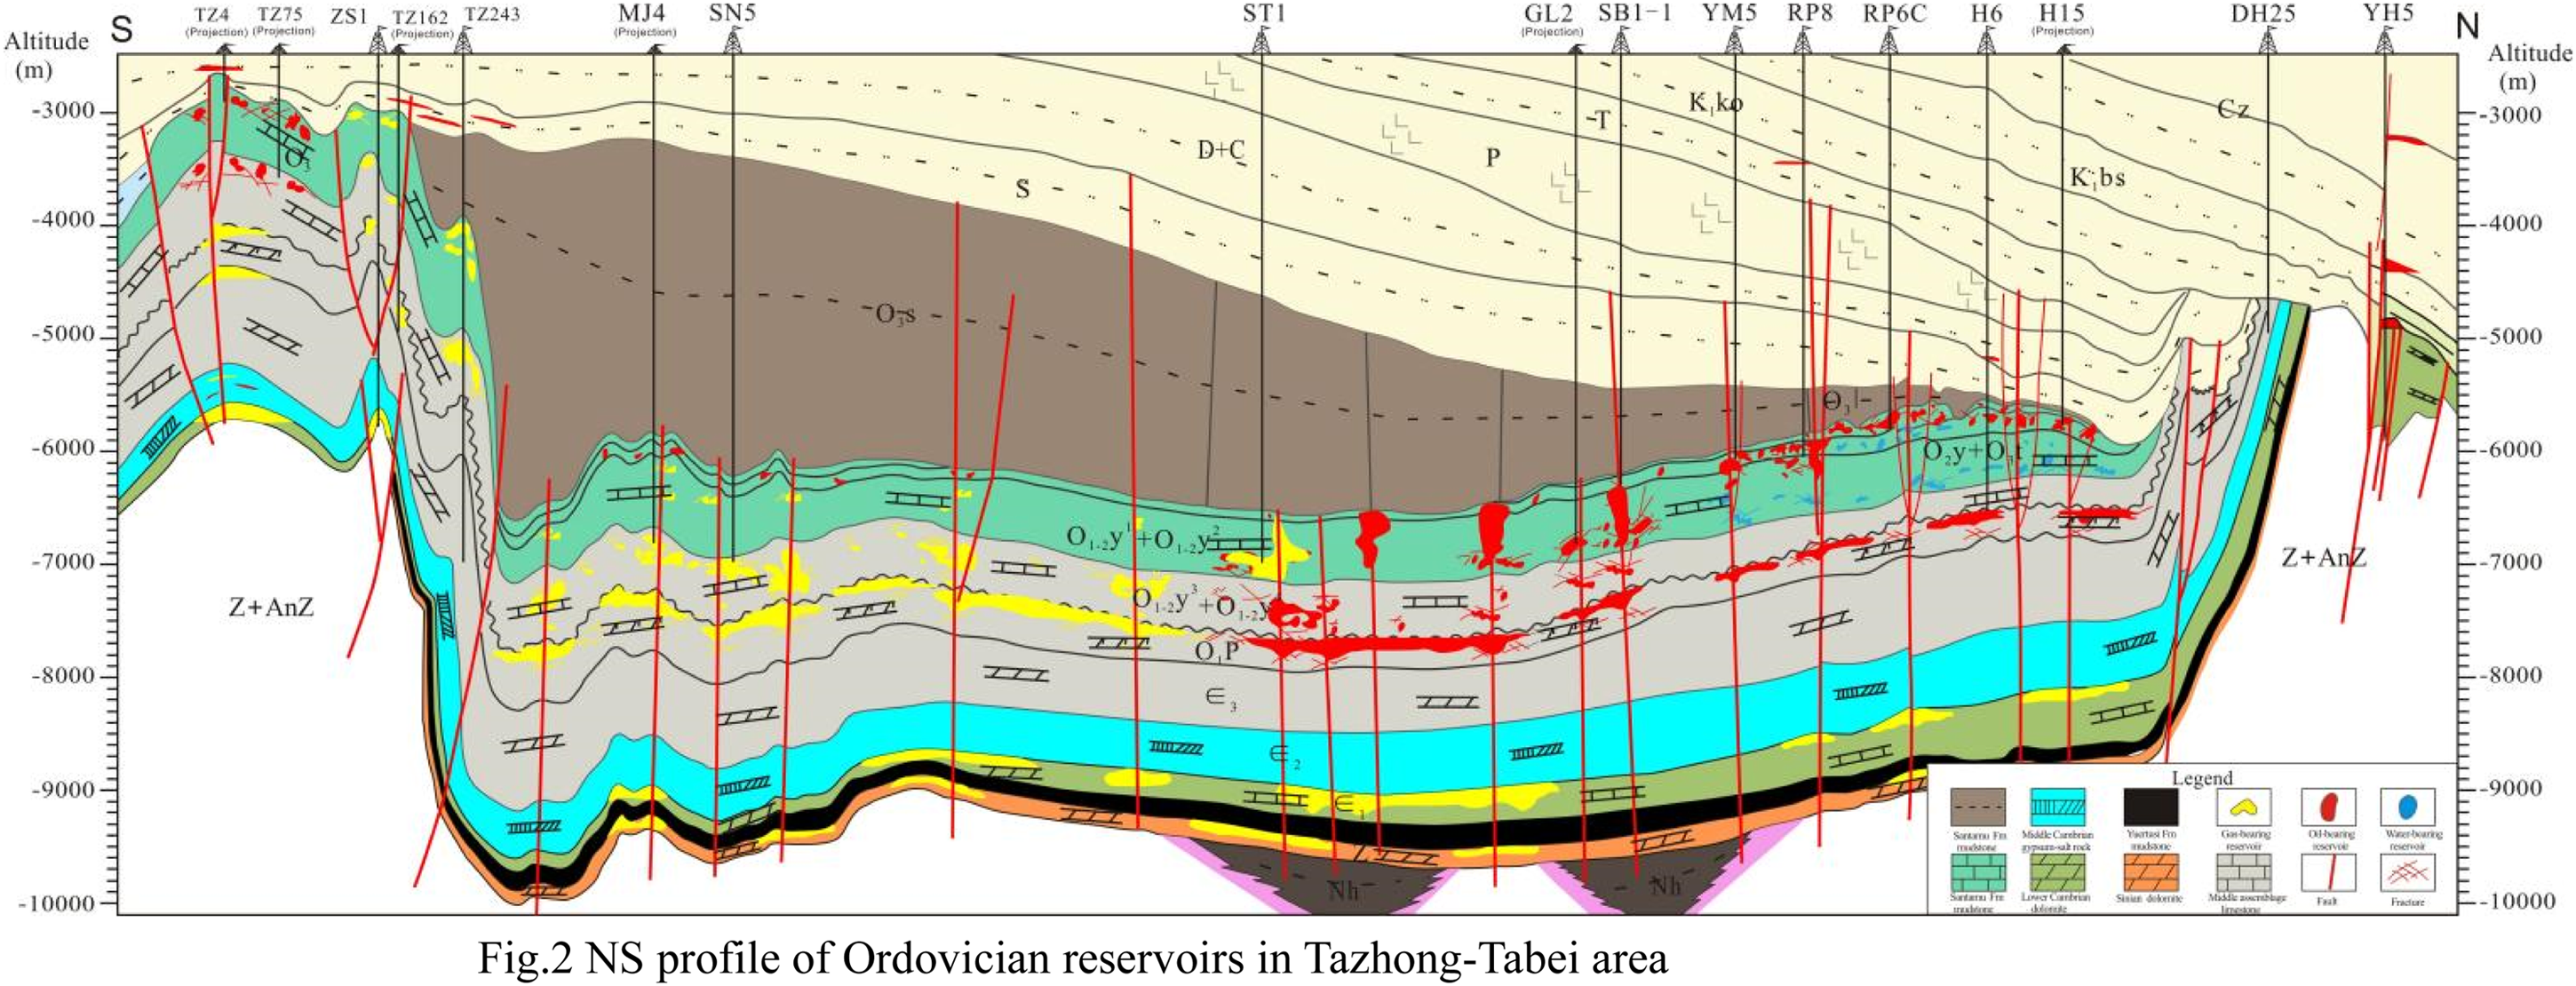
Ns profile of Ordovician reservoirs in Tazhong-Tabei area.
The study on source—reservoir—caprock assemblage of Ordovician reservoirs shows that the hydrocarbon source is from lower Cambrian Yuertusi Fm (Feng et al., 2021; Rong et al., 2020), the major reservoirs include middle-lower Ordovician Yingshan Fm and Yijianfang Fm and upper Ordovician Lianglitage Fm, and the caprock is upper Ordovician Sangtamu Fm (Figures 2 and 3).
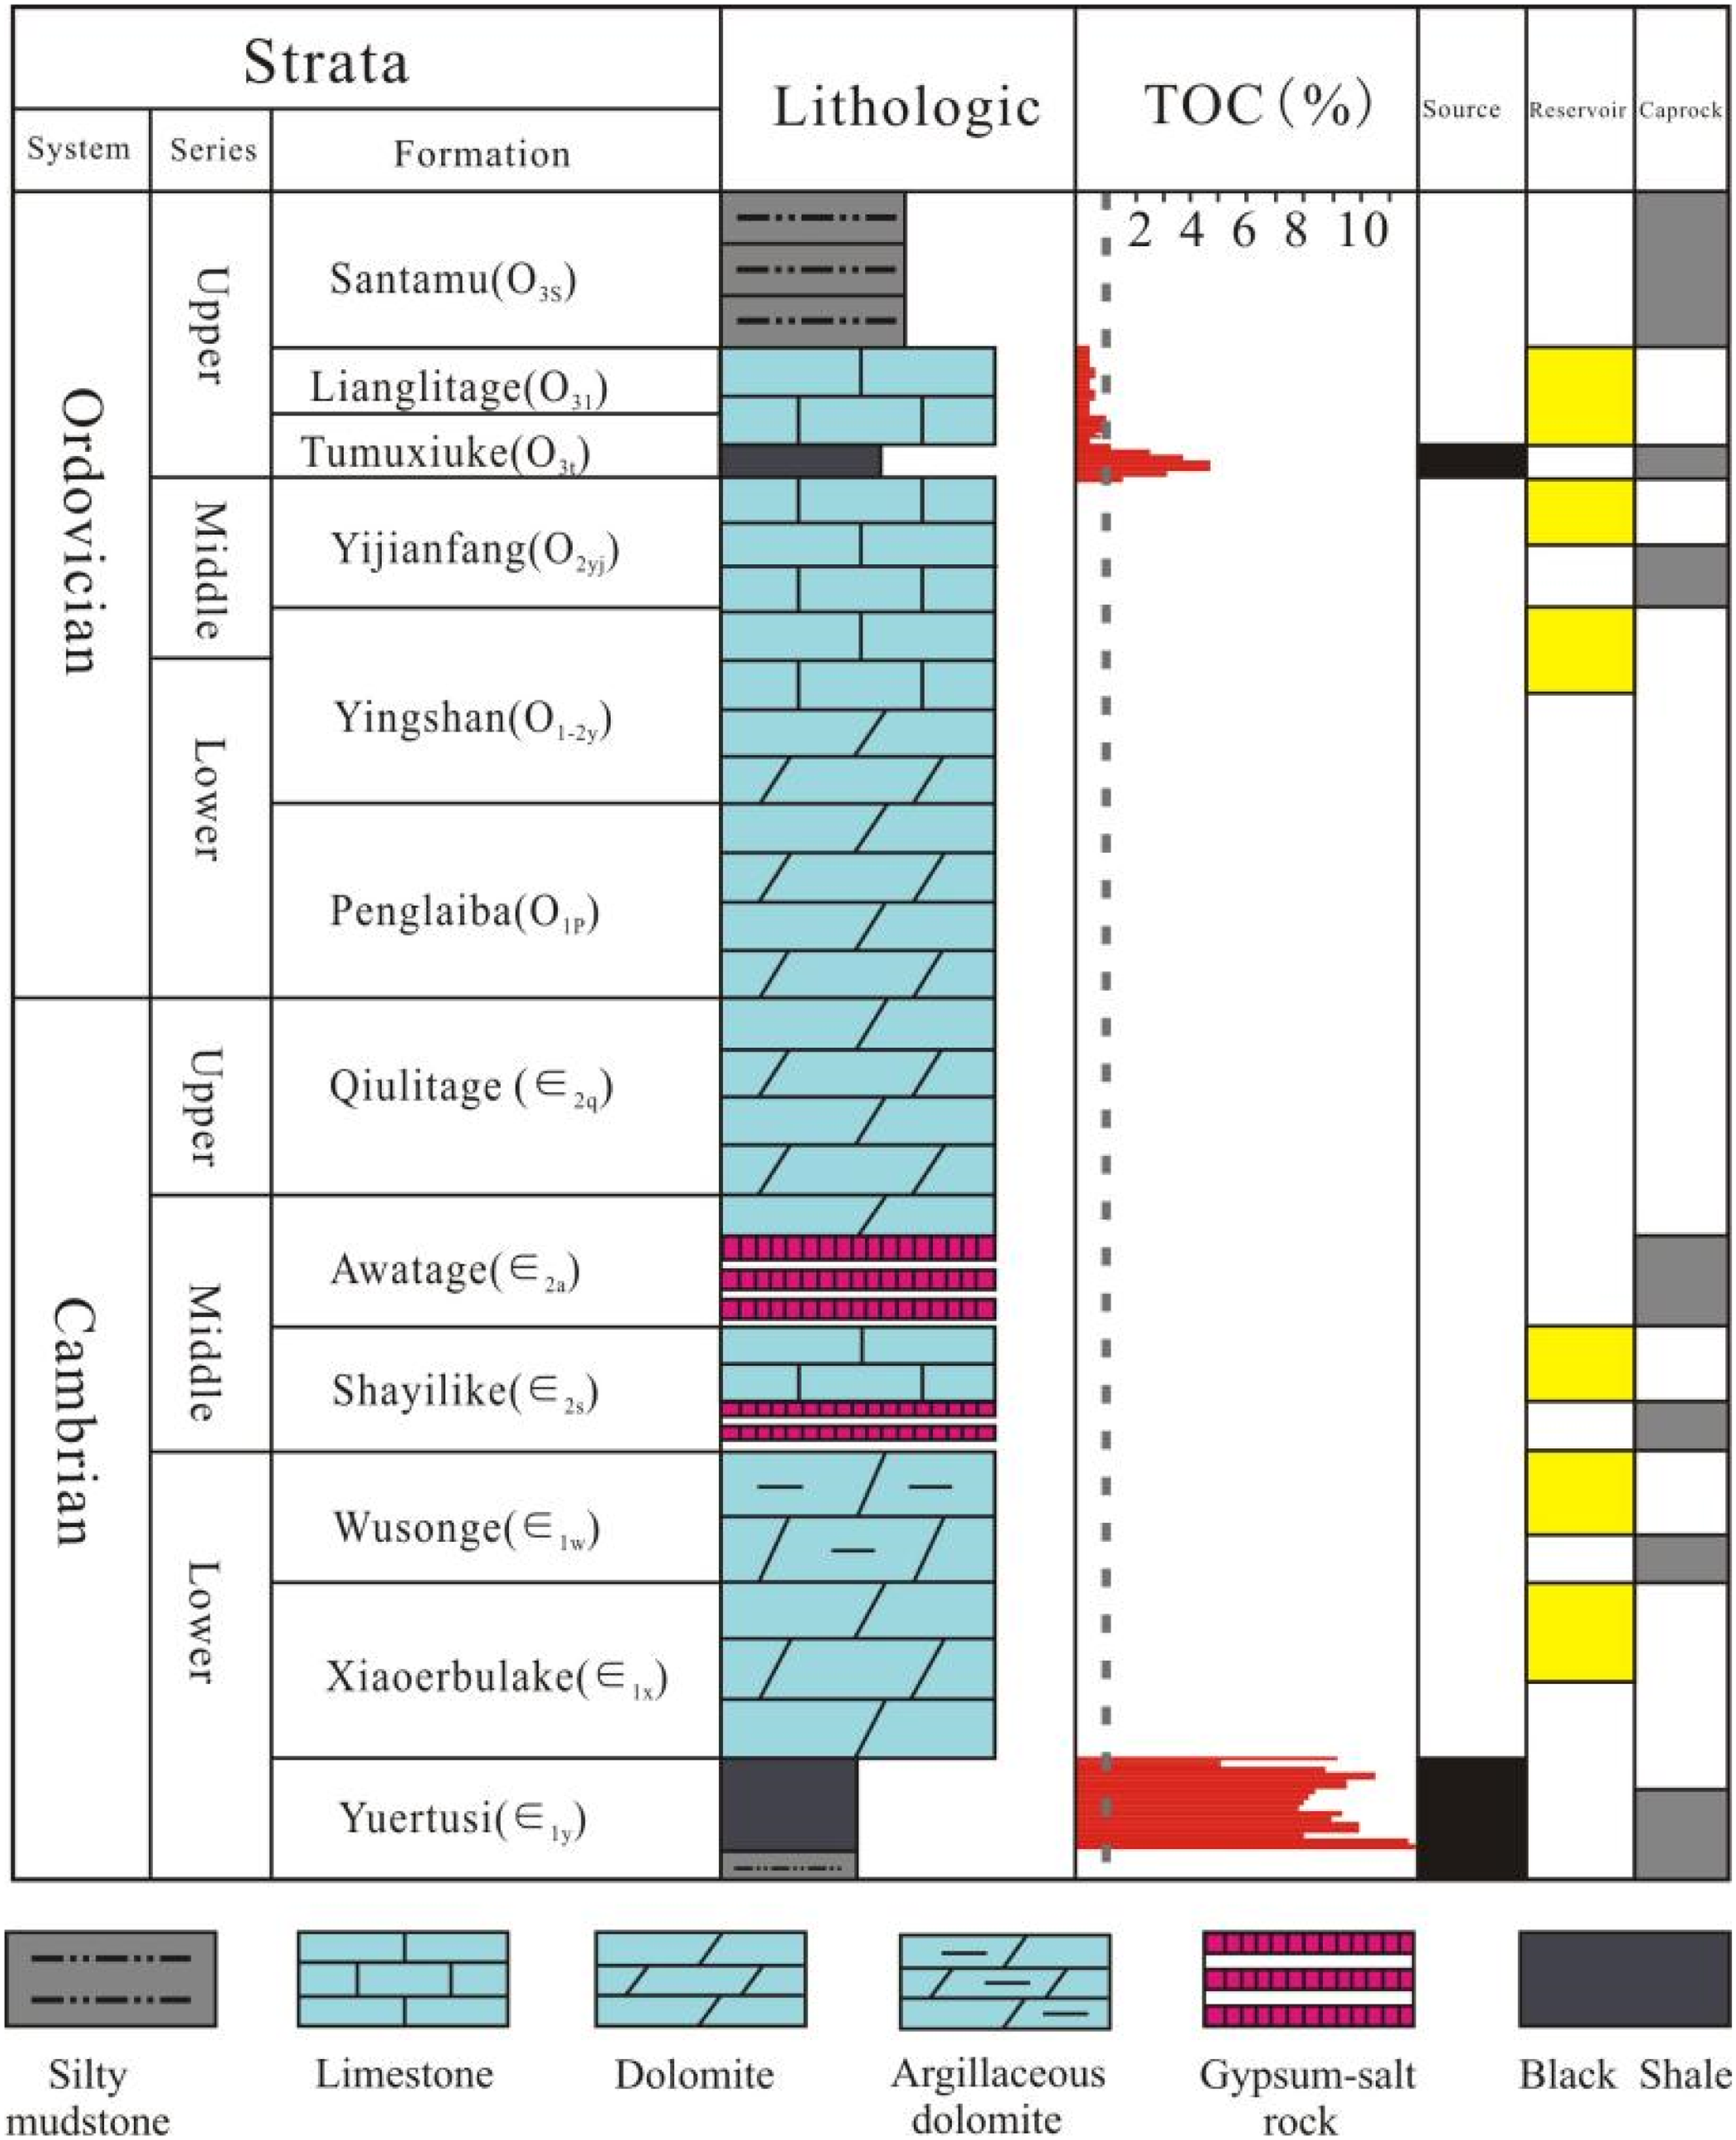
Cambrian-Ordovician stratigraphic column in the platform area of Tarim Basin.
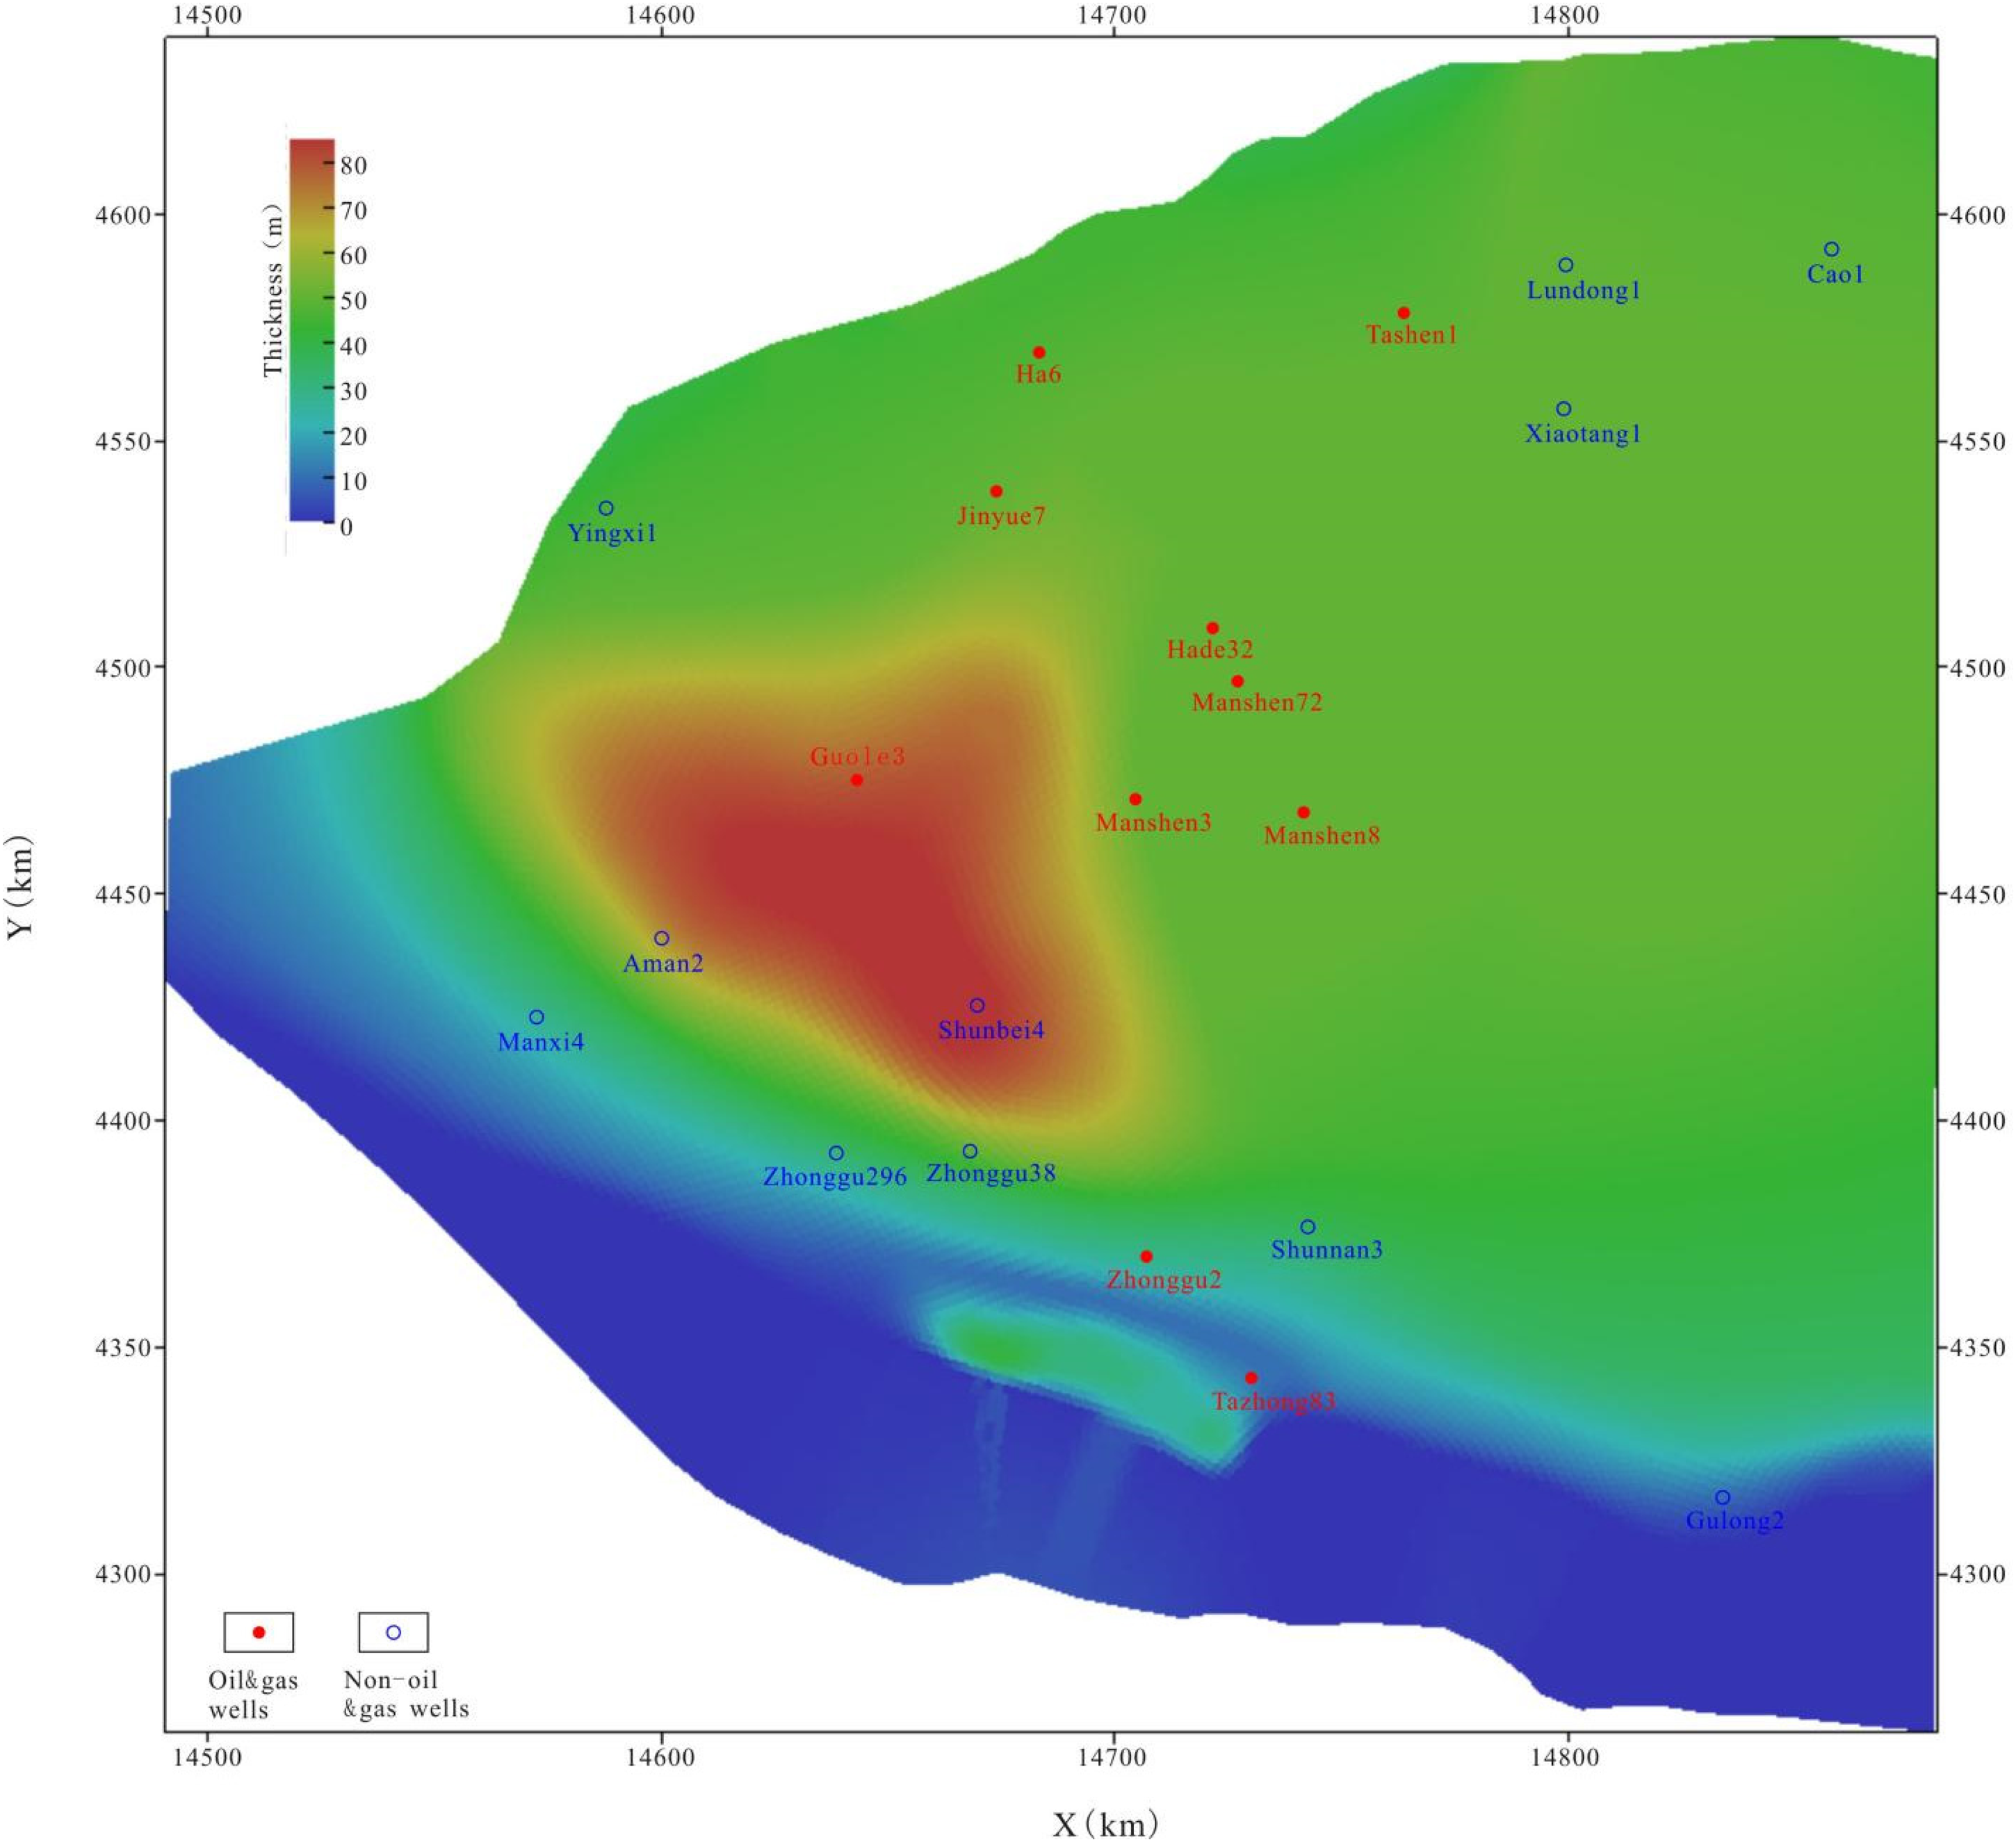
Ordovician strata have a deep burial with a maximum depth of over 10,000 m and are generally classified as deep and ultra-deep layers (Figure 4). The discovered oil and gas reservoirs are mainly karst and fault-karst reservoirs in carbonate rocks. The oil and gas reservoirs discovered previously are mainly distributed in Tabei uplift and Tazhong bulge with relatively small depth (Figure 4). In recent years, new breakthroughs have been made in exploration in Aman transition zone, which indicates a great exploration potential in Ordovician carbonate rocks in the lower part of Tarim Basin.
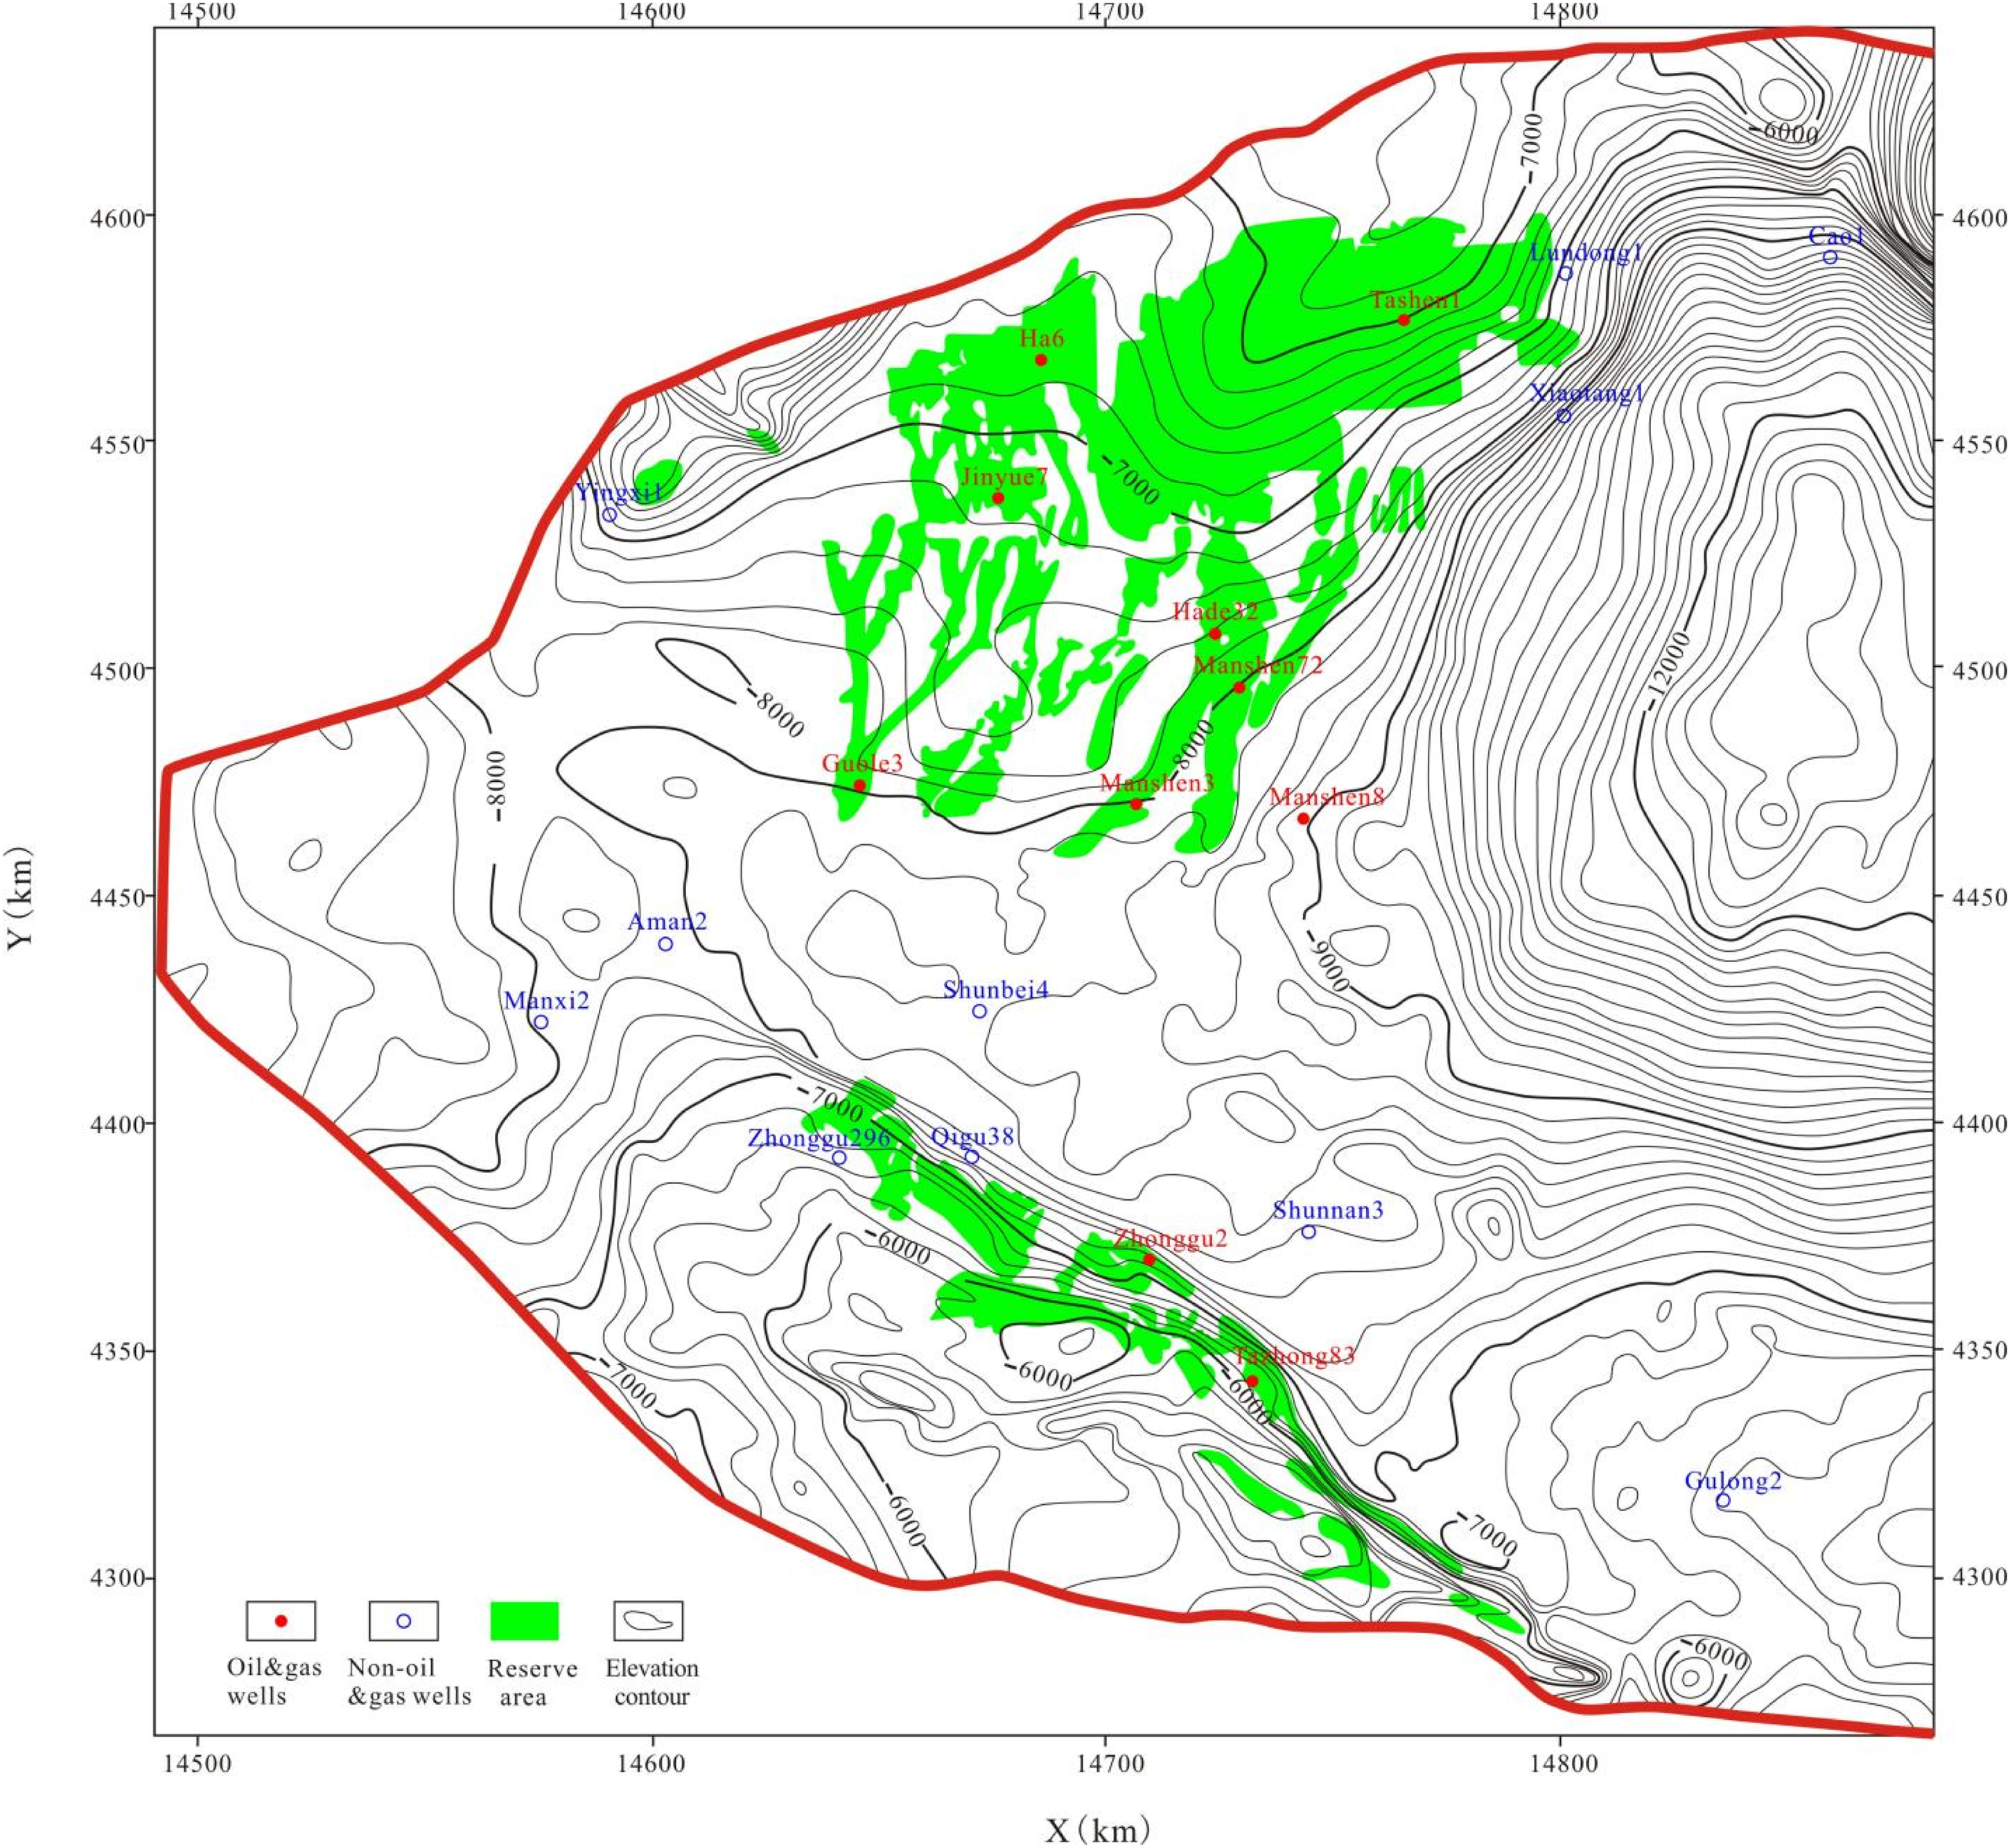
Ordovician bottom elevation and reserve distribution in platform area of Tarim Basin.
Essential elements of Ordovician hydrocarbon accumulation
Characteristics of Yuertusi Fm source rocks
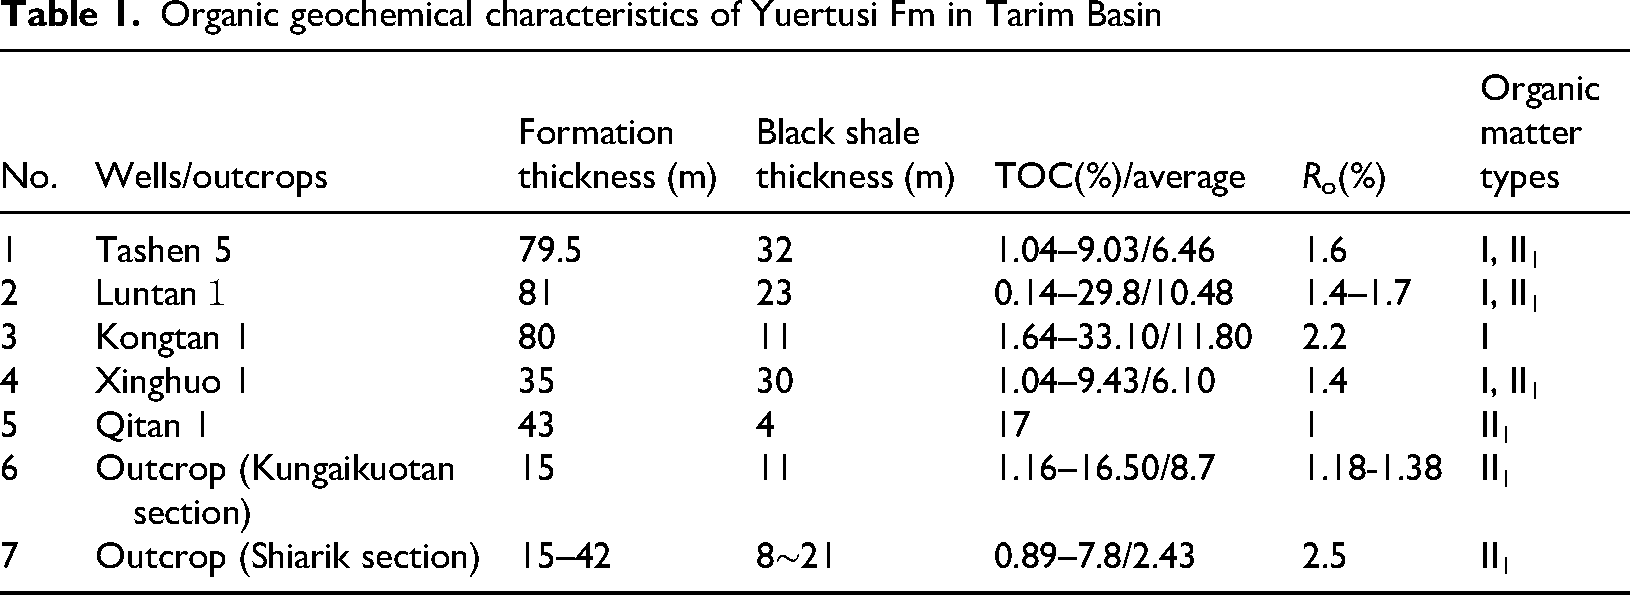
According to drilling data and outcrop observation, it is considered that Yuertusi Fm is a set of high-quality source rocks. Ultra-deep well Luntan 1 drilled into Yuertusi Fm at the depth of 8607.5–8688.5 m. Yuertusi Fm has the thickness of 81 m and is divided into upper and lower members. The upper member is dominated by argillaceous limestone intercalated with grayish black mudstone and has the thickness of 58 m. The lower member is dark gray and black shale and has the thickness of 23 m. The TOC in upper and lower members is 0.14%–29.8% with an average of 5.65%. The lower member has an average TOC of 10.48%, the S1 + S2 content of 0.17–29.08 mg/g with an average of 4.62 mg/g, Tmax of 450–528 °C and Ro of 1.4%–1.7%, and is currently at a high-over maturity stage. The carbon isotope of source rock kerogen ranges from −33.84‰ to −29.02‰, with an average of −30.55‰. The pristane-phytane ratio in biomarkers is relatively high, and the relationship between Pr/nC17 and Ph/nC18 indicates a marine reduction sedimentary environment. The relatively high content of C27 regular steranes indicates that the biogenesis is mainly algae. The source rocks are highly enriched with redox-sensitive trace elements such as Mo, U and V. The trace element ratios such as V/Sc and MoEF/UEF indicate that sulfide water body occurred in the late Sinian period and continued to strengthen in the early deposition period of Yuertusi Fm (Feng et al., 2021). Combining with data from Wells Tashen 5, Kongtan 1, Xinghuo1 and Qitan 1 (Table 1), it is considered that black shale in the lower part of Yuertusi Fm was formed in the sulfur-reduction environment and provides a high-quality Paleozoic hydrocarbon source rock with unusually high abundance.
Organic geochemical characteristics of Yuertusi Fm in Tarim Basin
Yuertusi Fm was also found in outcrops at the edge of Tarim Basin. In Kungaikuotan section in the northwestern part of Tarim Basin, Yuertusi Fm black rock has TOC of 0.07%–16.50% with an average of 2.81%. There are two sets of hydrocarbon source rocks including siliceous rock and black shale. The siliceous rock has TOC of 0.18%–1.54% with an average of 0.82%. Black shale has a high TOC of 1.16%–16.50% with an average of 8.70% (Chen et al., 2023). In Shiarik section (Figure 5) in the southwest of Tarim Basin, serious weathering occurs in Yuertusi Fm, and the black rock series have TOC of 0.89%–7.8% with an average of 2.43%.
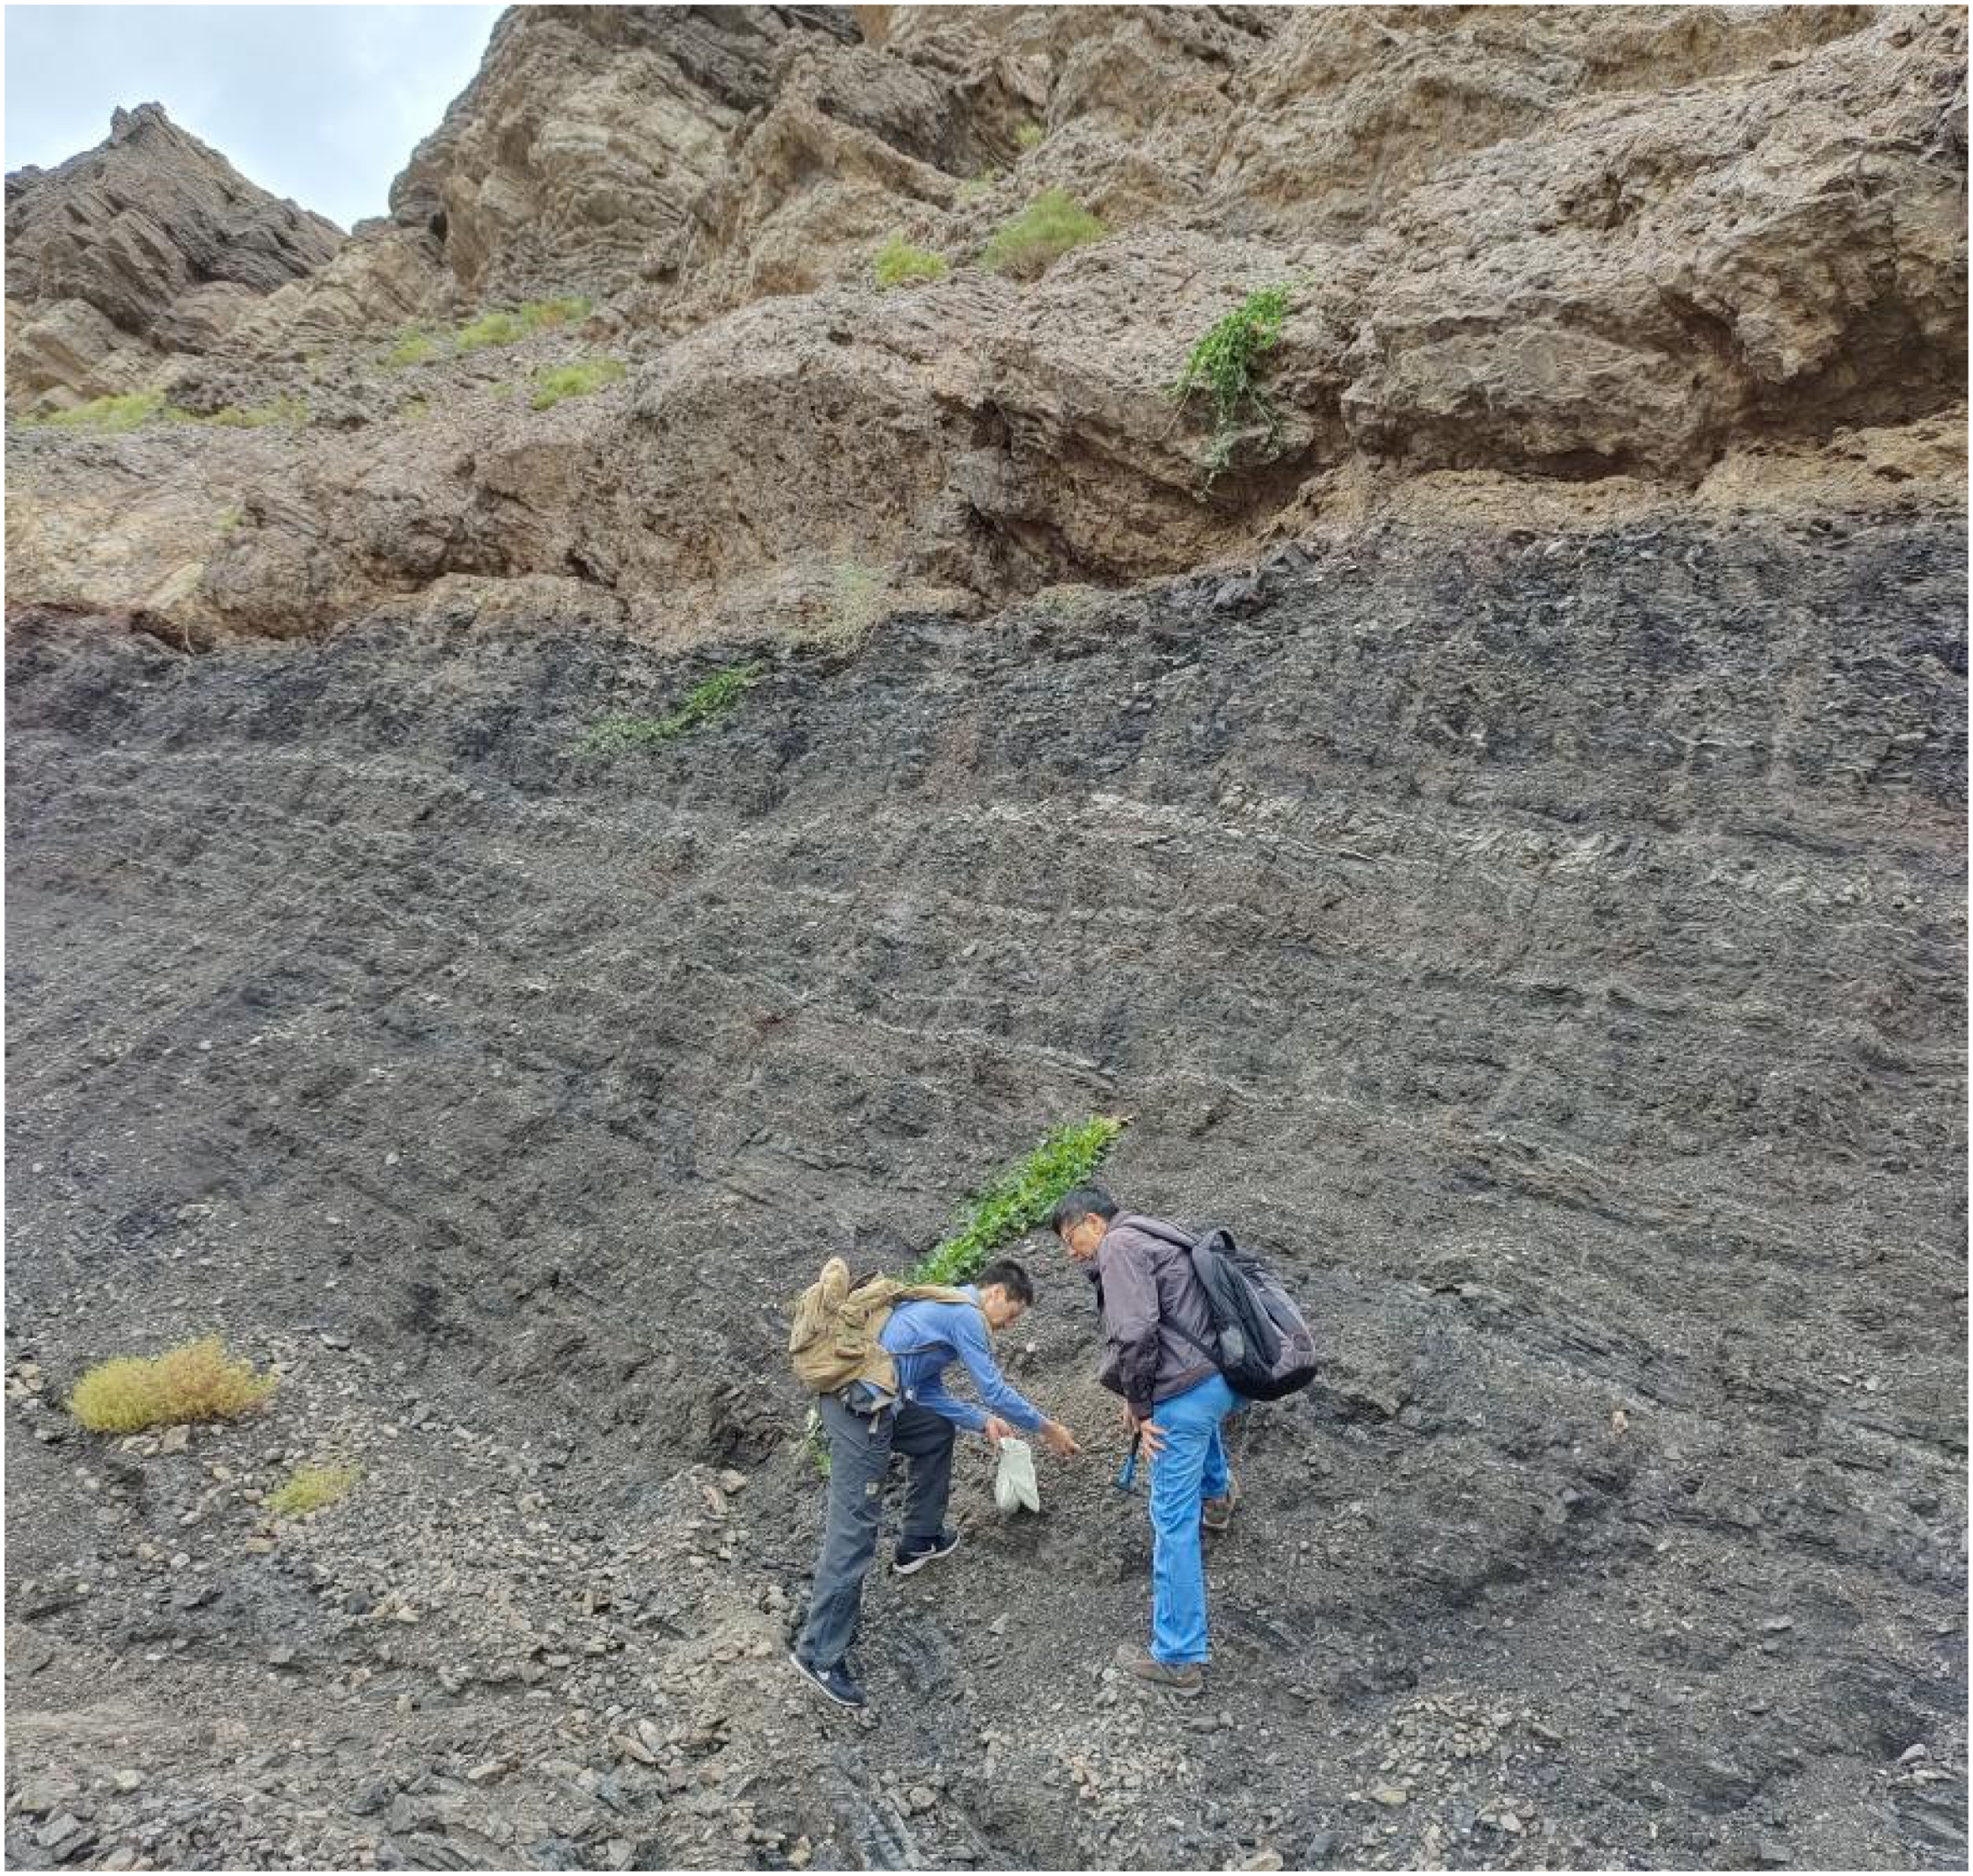
Shiarik section in southwest Tarim Basin (grayish black shale is of Yuertusi Fm).
By the end of 2023, few exploration wells had drilled into Yuertusi Fm, and there is still a large conflict on planar distribution of Yuertusi Fm. Lixin (2020) proposed that the distribution center of Yuertusi Fm is in Mangar sag. Cong et al. (2024) proposed that the platform area during sedimentary period of Yuertusi Fm inherited the late Sinian rift sedimentary setting, and a set of marine source rocks from shelf slope to basin facies were deposited extensively. This set of source rocks have a distribution area of 22.2 × 10⁴ km2, the thickness of 50–150 m, an average TOC of 10.10% and Ro of 1.4%–4.6%, and they are sapropelic high-quality source rocks with a hydrocarbon generation capacity of up to 5485 × 108 t. According to seismic interpretation and core, field outcrop and other data, the plane distribution of Yuertusi Fm was figured out (Figure 6). It is confirmed with the exploration results and test data that Yuertusi Fm is a set of high-quality source rocks and can provide sufficient hydrocarbon sources for Ordovician System.
Source rocks distribution of Yuertusi Fm in platform area of Tarim Basin.
Major Ordovician reservoirs
In the Ordovician period, the sedimentary facies evolved from Penglaiba Fm restricted platform facies, Yingshan Fm—Yijianfang Fm open platform facies—platform edge facies, Tumuxiuke Fm submerged platform facies to Lianglitage Fm platform edge facies—slope facies, and Sangtamu Fm mixed shelf facies.
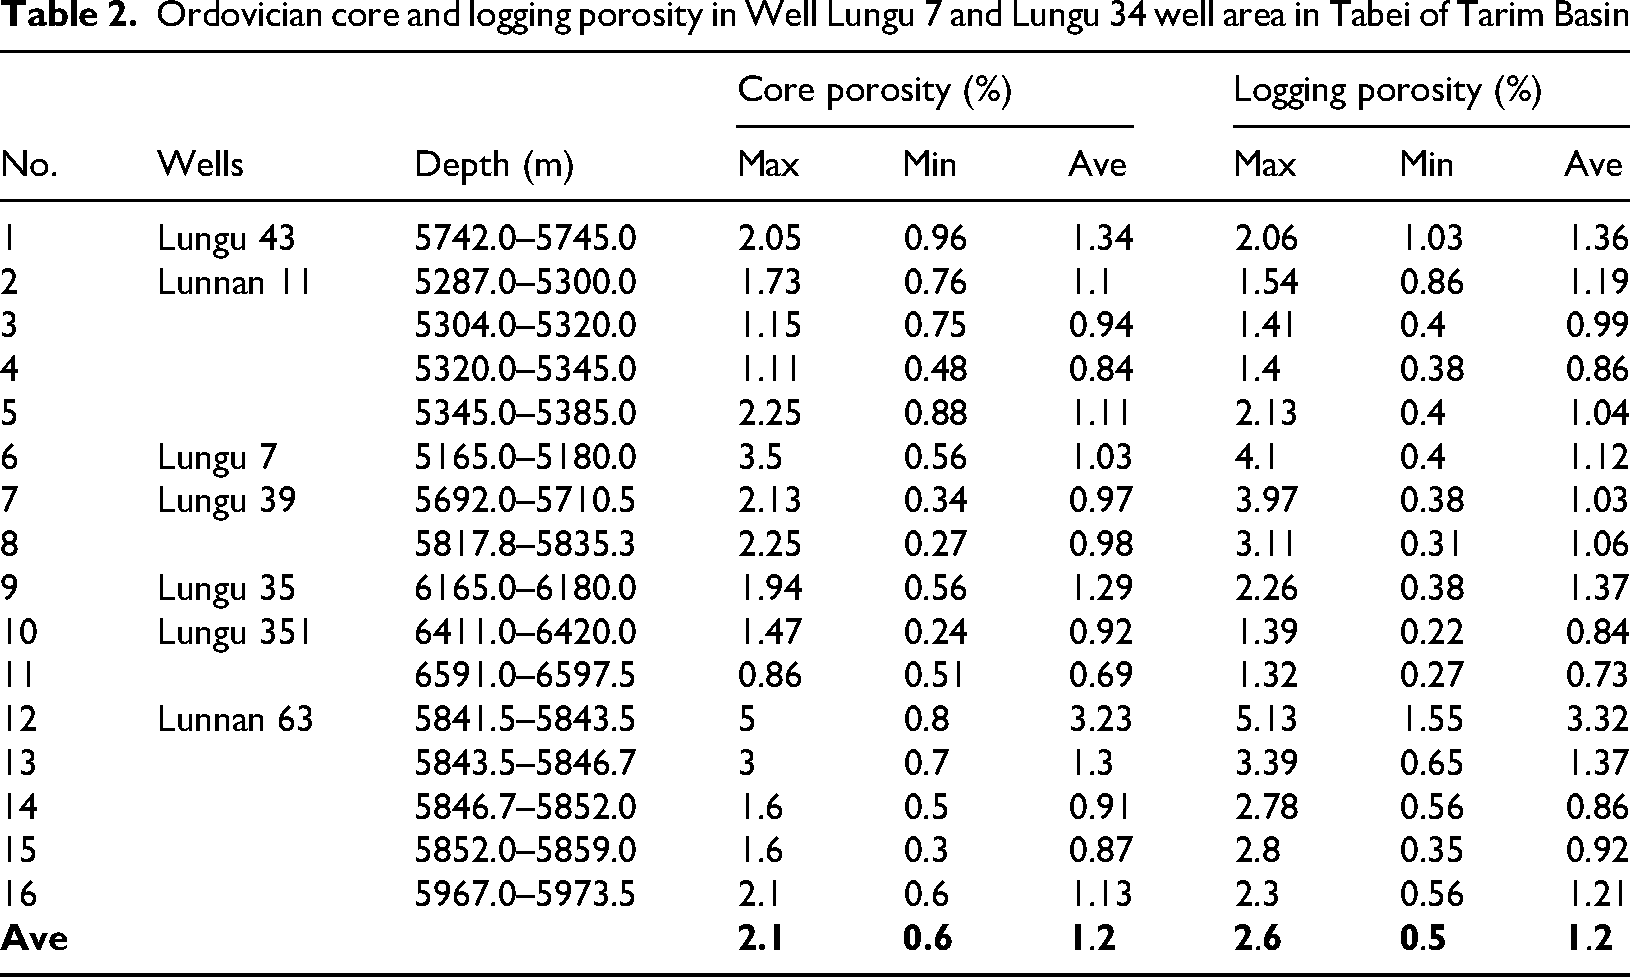
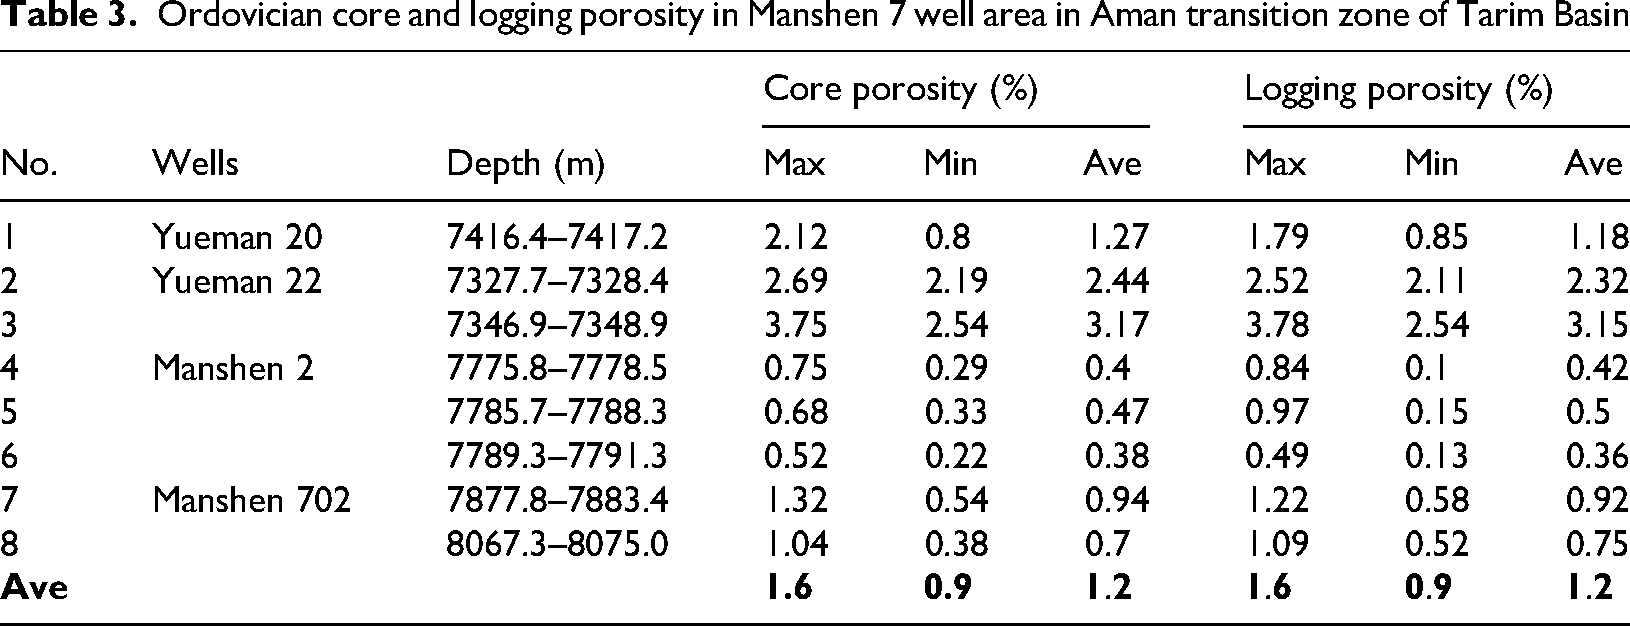
The discovered oil and gas reservoirs mainly occur in Yingshan Fm, Yijianfang Fm and Lianglitage Fm. The reservoir lithology is dominated by granular limestone, followed by micrite. The granular limestone is further divided into sparry sand-gravel limestone, micritic-sparry calcarenite, micritic-sparry bioclastic limestone, micritic-sparry bioclastic calcarenite, sparry oolitic limestone, etc. according to grain types and inter-granular filling characteristics. The reservoirs have wide distribution, several layers, strong physical heterogeneity, and very low average porosity. Statistics show that the samples from Wells Lungu 7 and Lungu 34 in Tabei uplift have the reservoir porosities of 0.3%–3.5%, with an average of 1.2% (Table 2), those from Well Manshen 7 in Aman transition zone has the reservoir porosity of 0.22%–3.75%, with an average of 1.2% (Table 3), and those from Well Zhonggu 29 and its adjacent well area in Tazhong bulge has the reservoir porosity of 0.2%–11.4%, with an average of 1.5% (Table 4).
Ordovician core and logging porosity in Well Lungu 7 and Lungu 34 well area in Tabei of Tarim Basin
Ordovician core and logging porosity in Manshen 7 well area in Aman transition zone of Tarim Basin
Ordovician core and logging porosity in Well Zhonggu 29 and its adjacent well areas in Tazhong of Tarim Basin
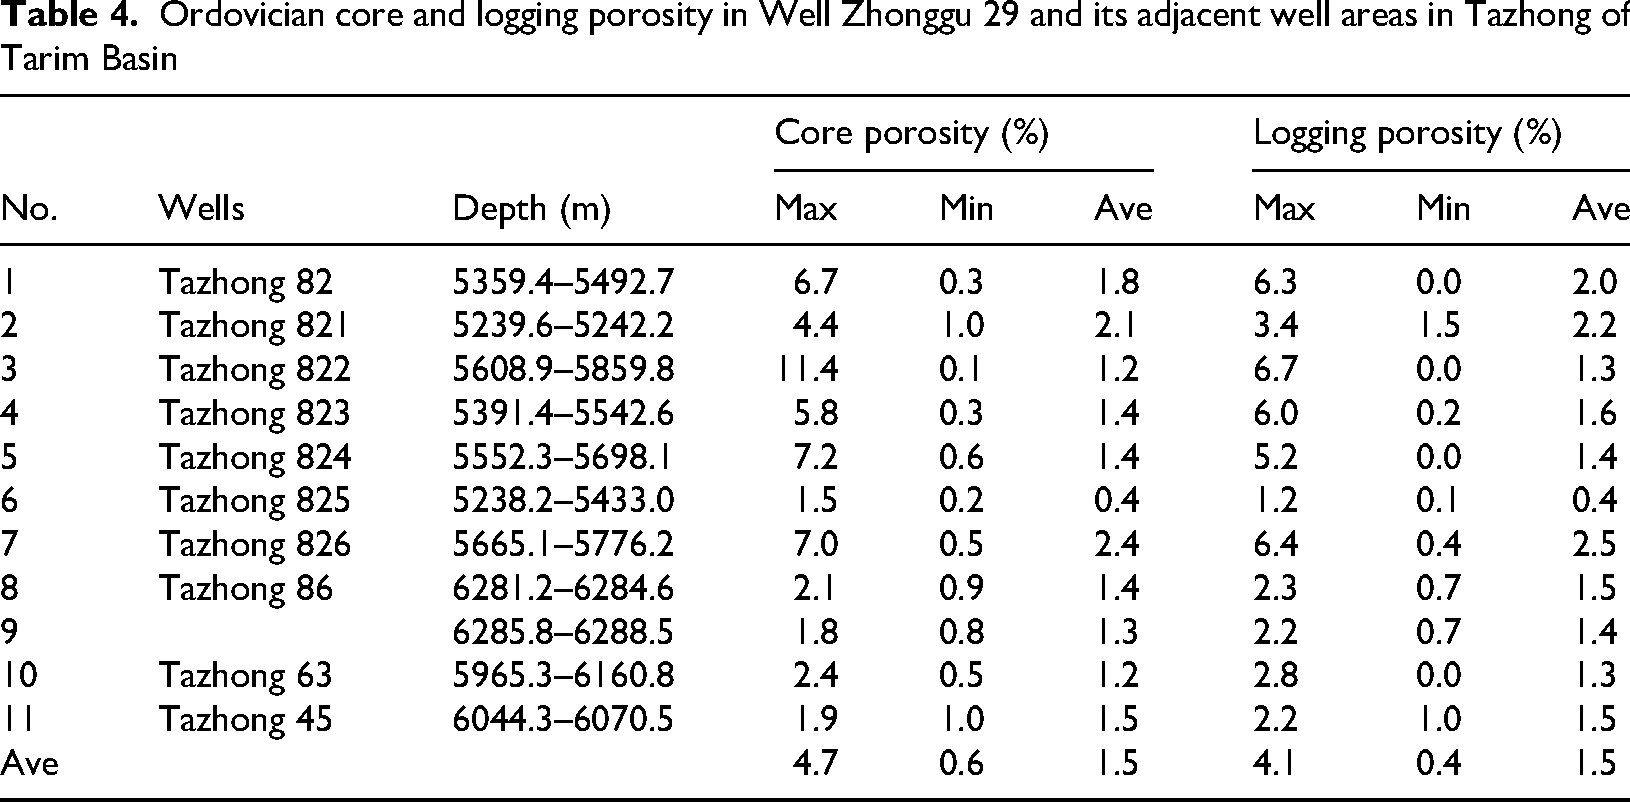
In terms of sample depth, the samples from Tabei uplift, Aman transition zone and Tazhong bulge were acquired at the depth of 5287.0–6597.5 m, 5239.6–6288.5 m and 7327.7–8075.5 m. The samples from Tabei and Tazhong areas were acquired from the depth of 5200 m to 6600 m in deep strata. The samples from Aman transition zone were acquired from ultra-deep strata which are 2000 m deeper than those in Tabei and Tazhong areas. Statistics show that all samples from deep and ultra-deep strata have a low average reservoir porosity which is not affected by change of depth.
In terms of pore types, the vugs and caves caused by karst and the fractures of different origins have a larger effect than that of matrix pores on hydrocarbon accumulation. The core porosity in Tables 2–4 mainly reflects the matrix physical properties but not overall physical properties of Ordovician carbonate reservoirs. Secondary dissolved vugs, caves and fractures provide major storage and percolation spaces in carbonate reservoirs, and this is also reflected in well logging and well testing data.
An integrated analysis of seismic, drilling, logging, and core data and petrology and geochemistry data shows that strike-slip fault, lithology, and diagenetic fluids affect the size and formation of the fault-karst reservoirs (Wang et al., 2024). A large number of test data reveals that vugs, caves and fractures have the average effective porosity of 17.35%, 3.45% and 0.14% respectively (Table 5), indicating strong heterogeneity. Karst reservoirs provide targets of recent exploration, and they are characterized by various types of pore spaces, different degrees of karstification, and distribution in different locations (Jiajun et al., 2023).
Porosity of Ordovician vugs, caves and fractures in the platform area of Tarim Basin
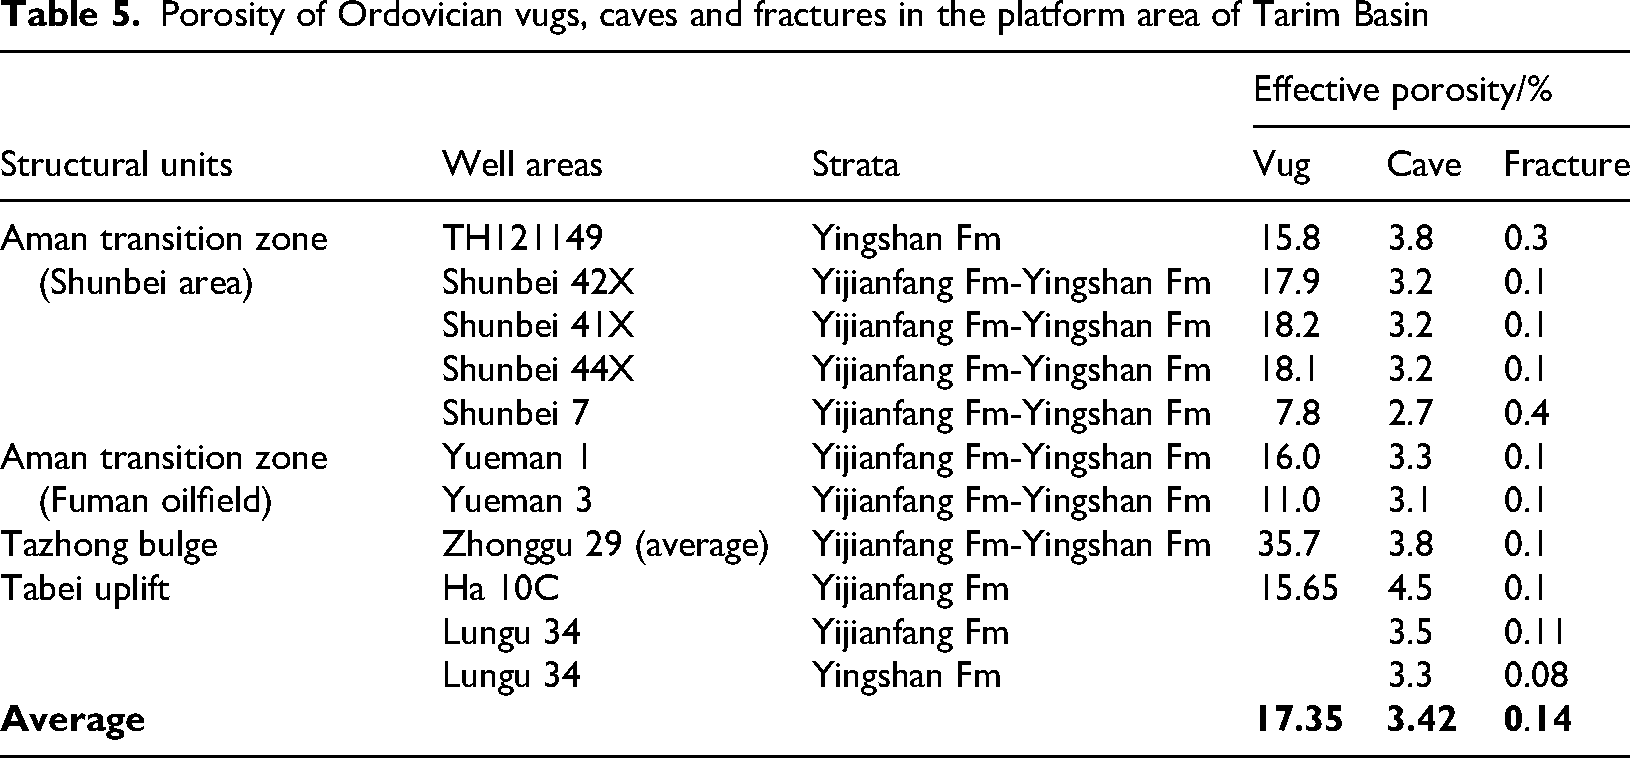
Study and exploration and production practice confirm that the lower limits for porosity of caves and fractures in Well Lungu 7 and Manshen 7 well area are 1.8%–2.2% and 0.04%–0.06%, respectively. Therefore, it is considered that rocks with cave porosity less than 1.8% and fracture porosity less than 0.04% are in-effective reservoirs. Outside the karst area, the reservoir has the poor physical property, and oil and gas basically do not occur.
After analysis of the reservoir physical properties in Tabei uplift and Tazhong bulge, it is realized that reservoirs mainly occur in the edge belt of carbonate rock platform, because more dissolved pores are developed in these platform edge belts. In addition, according to exploration findings and study on seismic attributes in Aman transition zone, it is confirmed that the strike-slip fault zone provides communication with hydrocarbon sources and well-developed dissolved caves and fractures, so it is the occurrence place of fault-karst oil and gas reservoirs. Prediction of distribution of platform edge belt and strike-slip fault zone provides a basis for evaluating the distribution of reservoir physical properties.
With the progress of geophysical interpretation technology and increase of investment in petroleum exploration, five carbonate platform edge belts have been discovered and predicted in Ordovician strata, including Lianglitage Fm, Yijianfang Fm and first-second Member of Yingshan Fm, third-fourth Member of Yingshan Fm and Penglaiba Fm in Tabei uplift and Tazhong bulge (Figure 7). Moreover, a large number of strike-slip fault zones have been discovered in Paleozoic strata in the platform area by using the new technique of ultra-deep geophysical exploration in the desert area (Figure 1). In addition, the porosity distribution of the fault zone was predicted in the 10,000 km2 of Fuman 3D seismic area by analyzing seismic attributes and core and logging porosity data (Figure 8). These reveal the existence of fault-karst zone and reef-beach karst in Ordovician Yijianfang Fm to first-second Member of Yingshan Fm in Fuman area, and great difference of physical properties and strong heterogeneity in different locations (Figure 8).
Superimposition of Ordovician platform edge belts in platform area of Tarim Basin.
Distribution of seismic attribute value of Yijianfang-Yingshan Fm in Fuman area of Tarim Basin.
These results of reservoir distribution prediction and reservoir porosity analysis provide a basis for numerical simulation of Ordovician hydrocarbon accumulation.
Ordovician Sangtamu Fm caprock
There are two major sets of caprocks in lower Paleozoic strata in the platform area, including the gypsum-salt rock in middle Cambrian Shayilike Fm and Awatage Fm (Liu et al., 2024) and the shale in Ordovician Sangtamu Fm. The latter is related to Ordovician hydrocarbon accumulation.
A thick interval (Figure 3) of black shale (Figure 2) is developed in Sangtamu Fm, and it is commonly known as “black quilt” and classified as a good caprock. However, due to the controlling effects of tectonics and sedimentation, a small range of strata gap occurred in the northeast of the platform area. In the strata gap area, Ordovician reservoirs are overlain by Silurian and Carboniferous mudstone. Therefore, it is considered that the caprock in the study area generally has a good quality and provides good sealing effects of oil and gas.
Transport system and accumulation period of Ordovician reservoirs
Transport system
Ordovician discordogenic faults and unconformity planes in the platform area provide the oil and gas transport system. The discordogenic faults play a controlling role in oil and gas accumulation, and provide major channels for oil and gas vertical migration and hub of oil and gas lateral migration (Figure 2). The unconformity plane dissolution zone and the karst pore-fracture system between strata control the plane distribution of oil and gas and provide major channels for lateral migration of oil and gas due to good horizontal permeability (Figure 2).
The rocks near the strike-slip fault zones were affected by structural processes. They were subjected to dissolution after early uplift and exposure and formed a complex oil and gas transport network after later subsidence and burial. Study shows that fracture-related cave reservoirs in Halahatang oilfield are well correlated to early Hercynian, late Hercynian and Yanshanian tectonic events and their associated fluid mixing activity (Zhanfeng et al., 2023). Taking Halahatang oilfield as an example, oil and gas migrated along the discordogenic fault were transported and accumulated in the fault and the complex dissolved pore-fractures in Yijianfang Fm-Yingshan Fm. Affected by the reservoir horizontal heterogeneity, lateral migration and accumulation of oil and gas shows differential enrichment. This complete and effective transport system forms an accumulation model of “vertical communication with source rocks, lateral distribution, and accumulation in fractures and caves” in the platform area (Cong et al., 2024).
Accumulation period
Three periods of hydrocarbon charging were identified in Tazhong oil field. It is believed that predominant hydrocarbon charge occurred during middle–late Permian Hercynian Orogeny (Jiaqing et al., 2023). For SB5 fault zone, two discrete sections of homogenization temperature of aqueous inclusions coeval with oil inclusions indicate that intense charging occurred during early Yanshan Orogeny in ca. 200 to 150 Ma, and minor charging occurred during late Himalayan Orogeny in ca. 20 to 10 Ma. For SB1 fault zone, the extended homogenization temperature range possibly reflects continuous charging from early Yanshan to late Himalayan orogeny in ca. 10 Ma (Cong et al., 2024).
Here, the homogenization temperature of inclusions and burial history are used to analyze major accumulation periods. Analysis of inclusions of asphalt seepage veins in Ordovician Dawangou Fm in Keping area shows the homogenization temperature of 80–90 °C, indicating an early accumulation period. The homogenization temperature of inclusions in Ordovician carbonate reservoirs of Well Yingmai 2 is 70–90 °C (Lixin, 2020). In Yubei area, three sets of inclusions were detected in Ordovician reservoirs in Wells Yubei 5 and Yubei 7, and their homogenization temperatures are 86–105 °C, 136–148 °C and 184–198 °C, respectively. Above data indicate that there are at least three major accumulation periods.
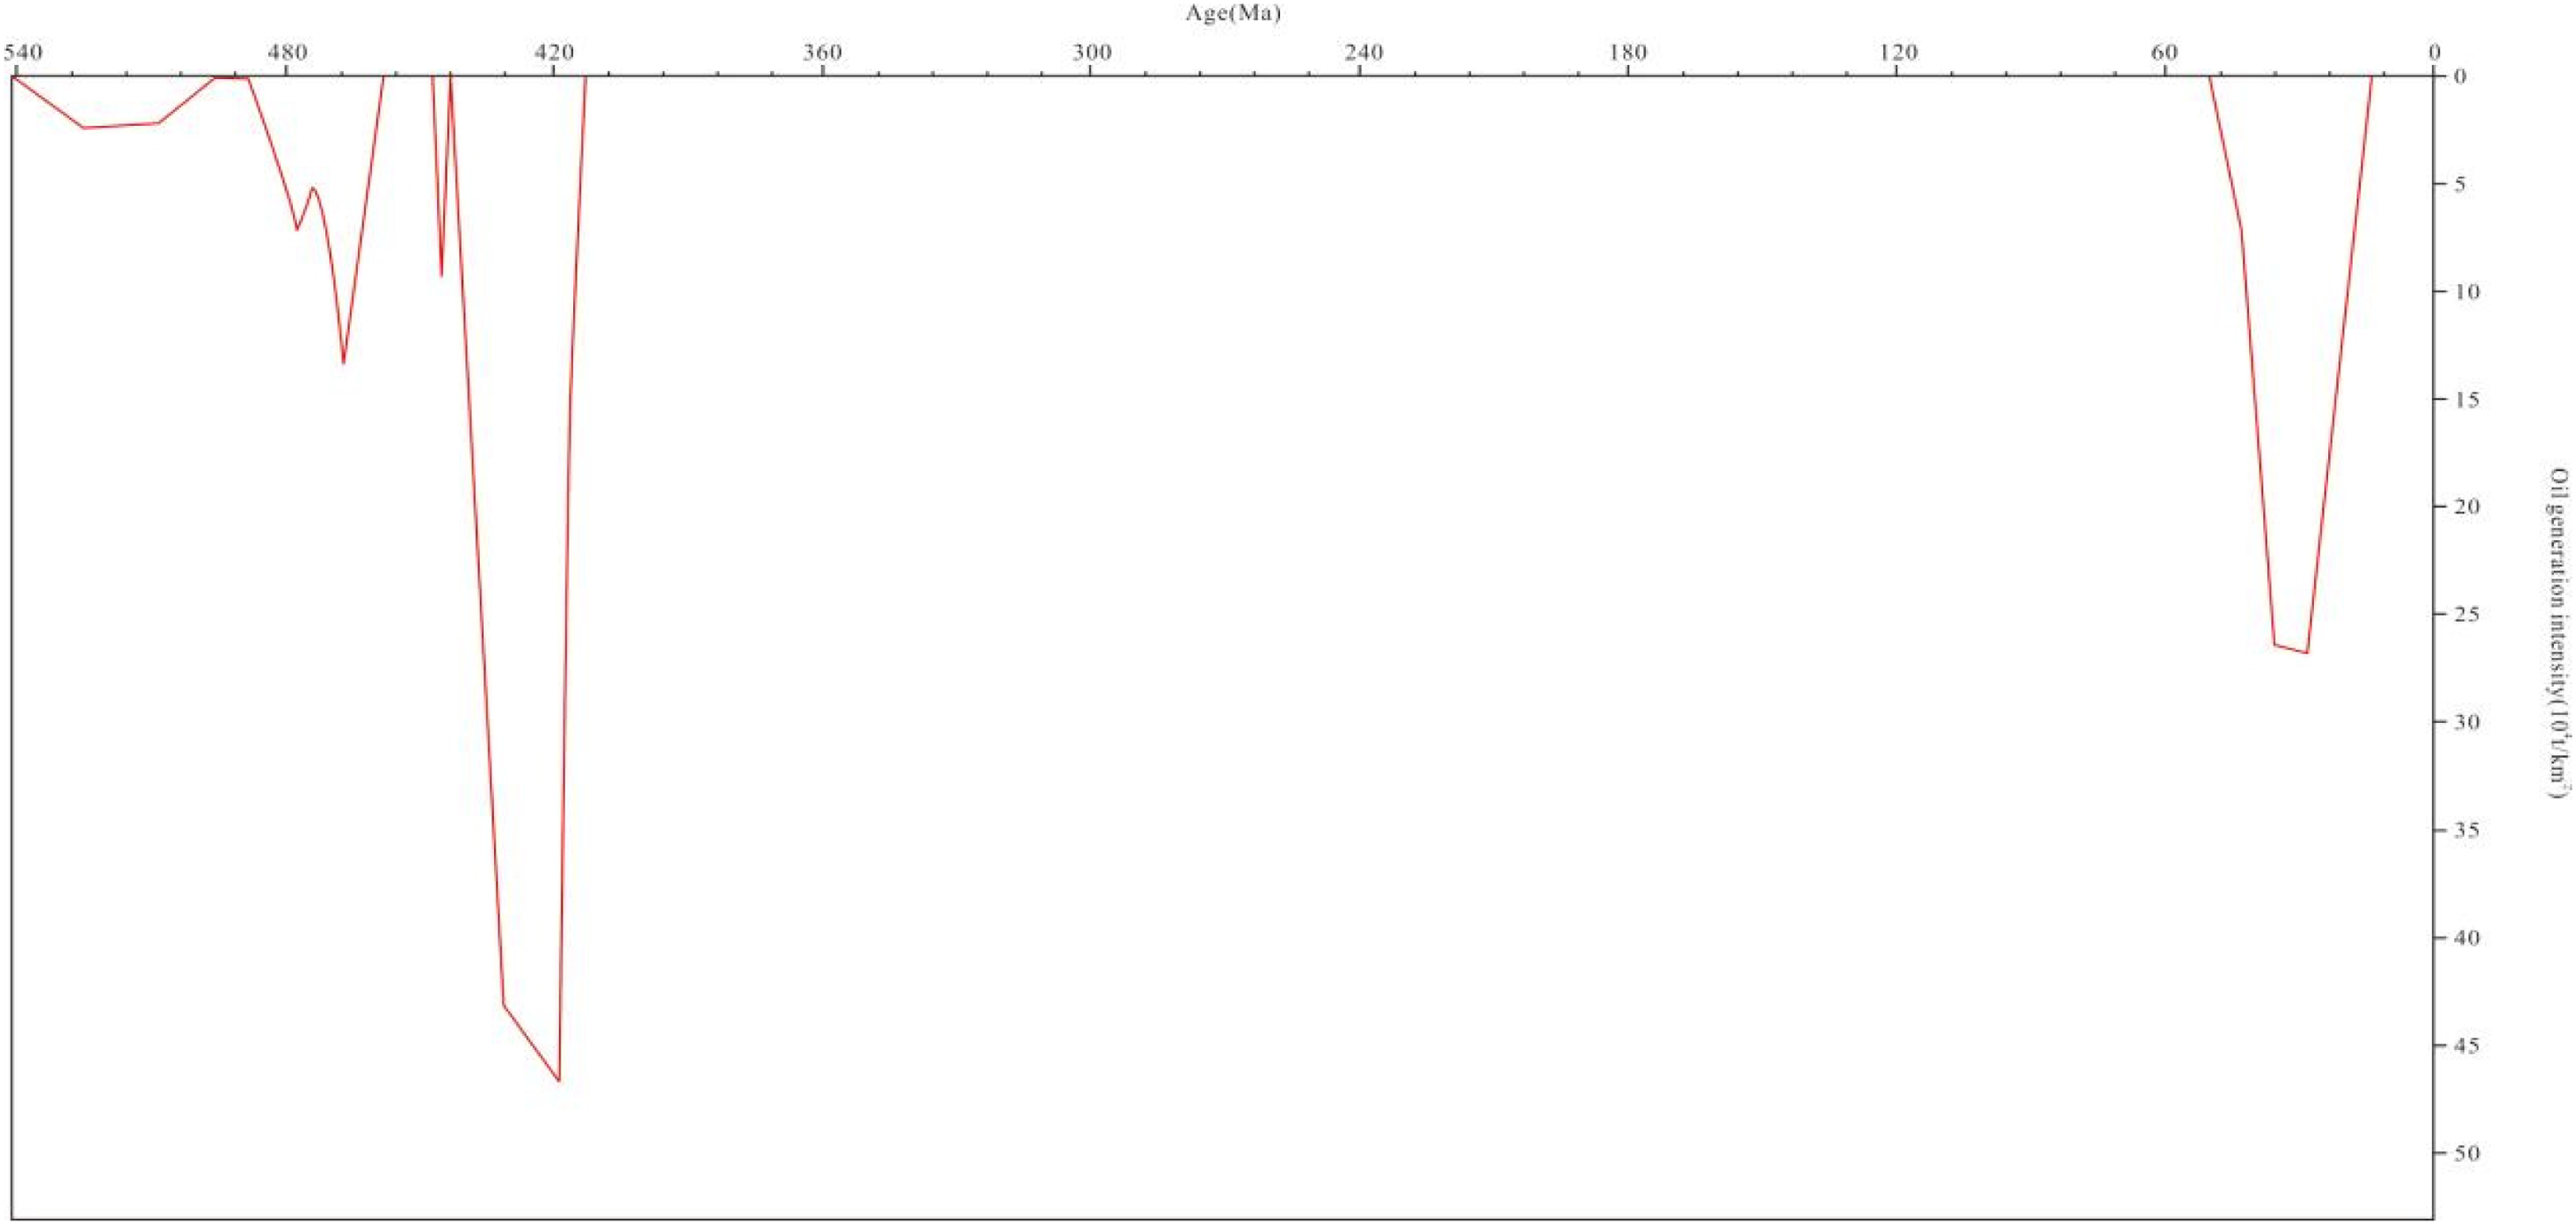
Comparison of the thermal evolution history of Well Luntan 1 (Figure 9) shows that the geological periods of the homogenization temperature of inclusions are in 480–490 Ma in late Caledonian period, 400–430 Ma in Hercynian period and 0–20 Ma in Himalayan period. Correspondingly, the instantaneous oil generation history of Well Luntan 1 (Figure 10) reveals three major hydrocarbon generation periods of Yuertusi Fm, i.e., Caledonian period, Hercynian period and Yanshan-Himalayan period. The most important accumulation occurred in Hercynian period because there was the greatest hydrocarbon generation intensity.
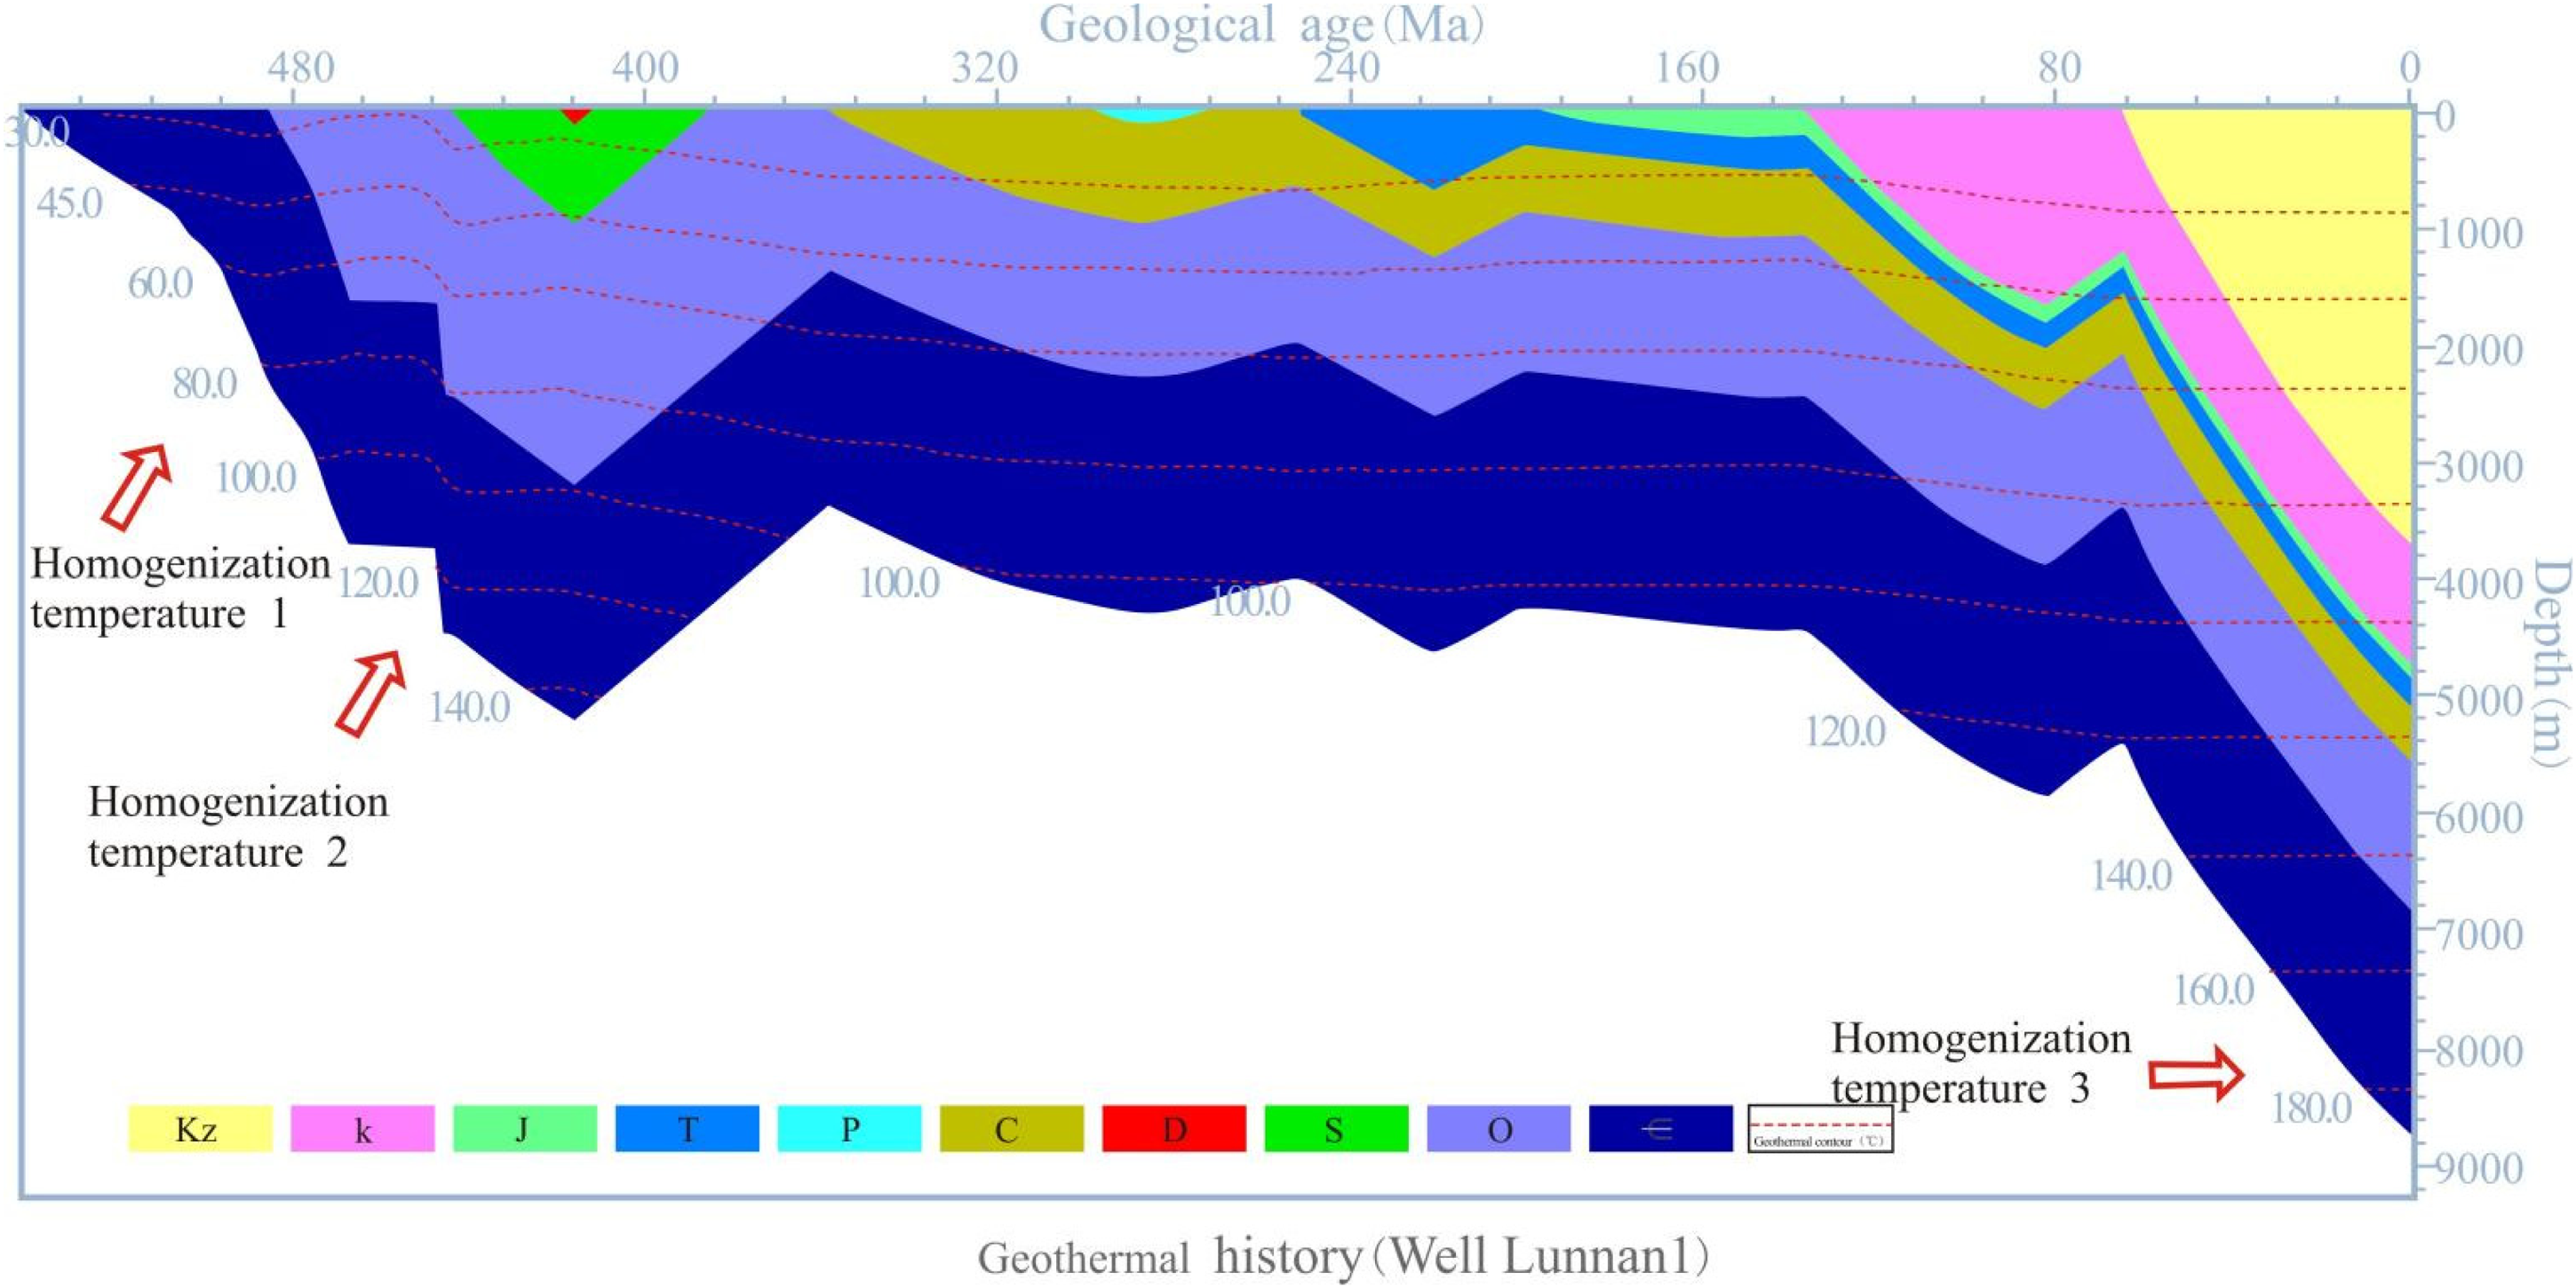
Geothermal history of Well Luntan 1 in Tarim Basin.
Instantaneous oil generation history of Well Luntan 1 in Tarim Basin.
Three major accumulation periods are confirmed according to burial history, thermal history, hydrocarbon generation history and homogenization temperature of inclusions.
3D geological modeling
Geologic model
Establishment of simulated stratigraphic framework
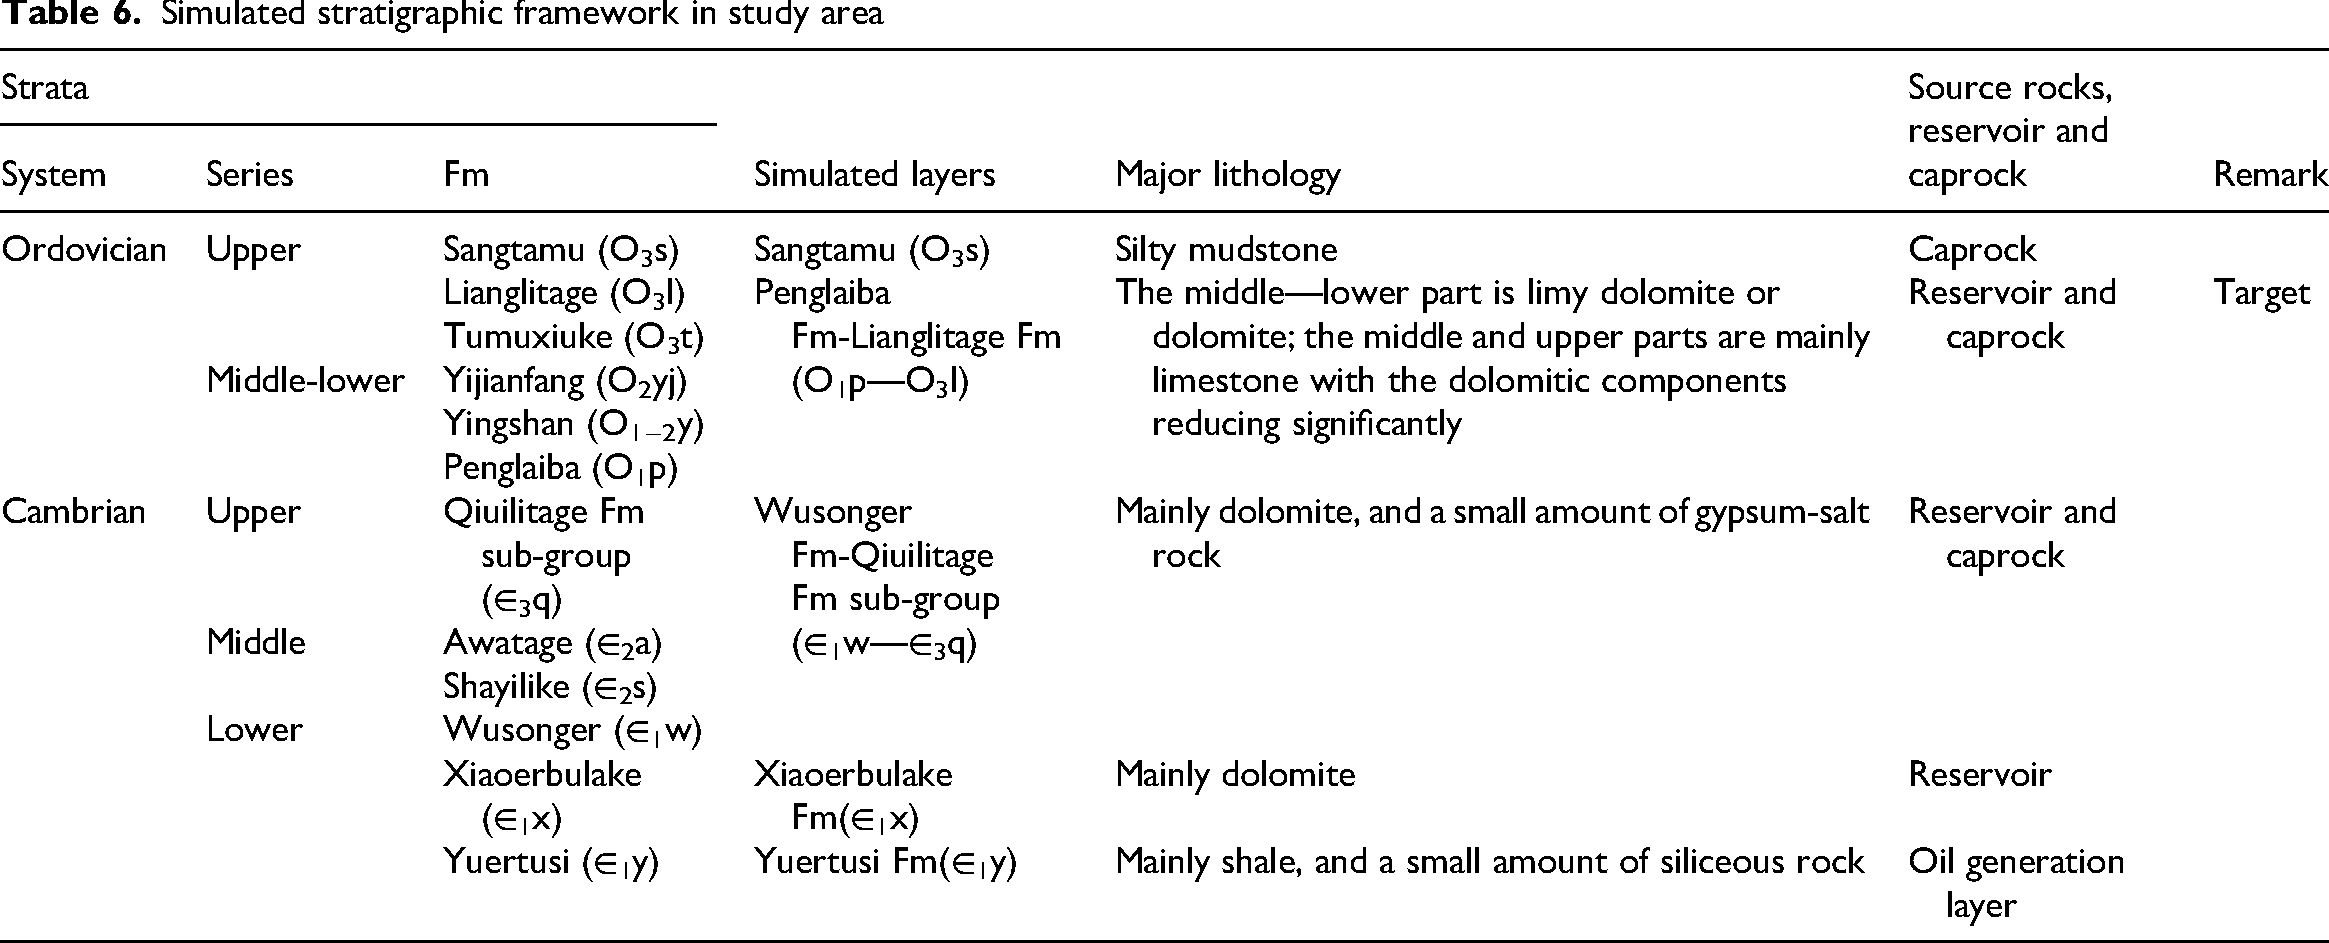
According to simulation need, the stratigraphic framework is set as 5 simulated layers (Table 6) from bottom to top in Cambrian and Ordovician, including lower Cambrian Yuertusi Fm (hydrocarbon supply), Xiaoerbulake Fm (reservoir), lower Cambrian Wusonger Fm to upper Cambrian Qiuilitage Fm sub-group (reservoir and caprock), lower Ordovician Penglaiba Fm to upper Ordovician Lianglitage Fm (simulated target) and upper Ordovician Sangtamu Fm (caprock). These five simulated layers constitute a complete oil and gas system.
Simulated stratigraphic framework in study area
Simulation grids
PEBI grid is applied in 2D plane simulation for characterizing the stratigraphic morphology of the study area. Considering a large scale of the study area, the number of single-layer plane grids is set as more than 20,000. The number of optimized PEBI meshes is 26,812 (Figure 11), and the average mesh density reaches 3.88 km2, which basically meets the requirements of simulation accuracy.
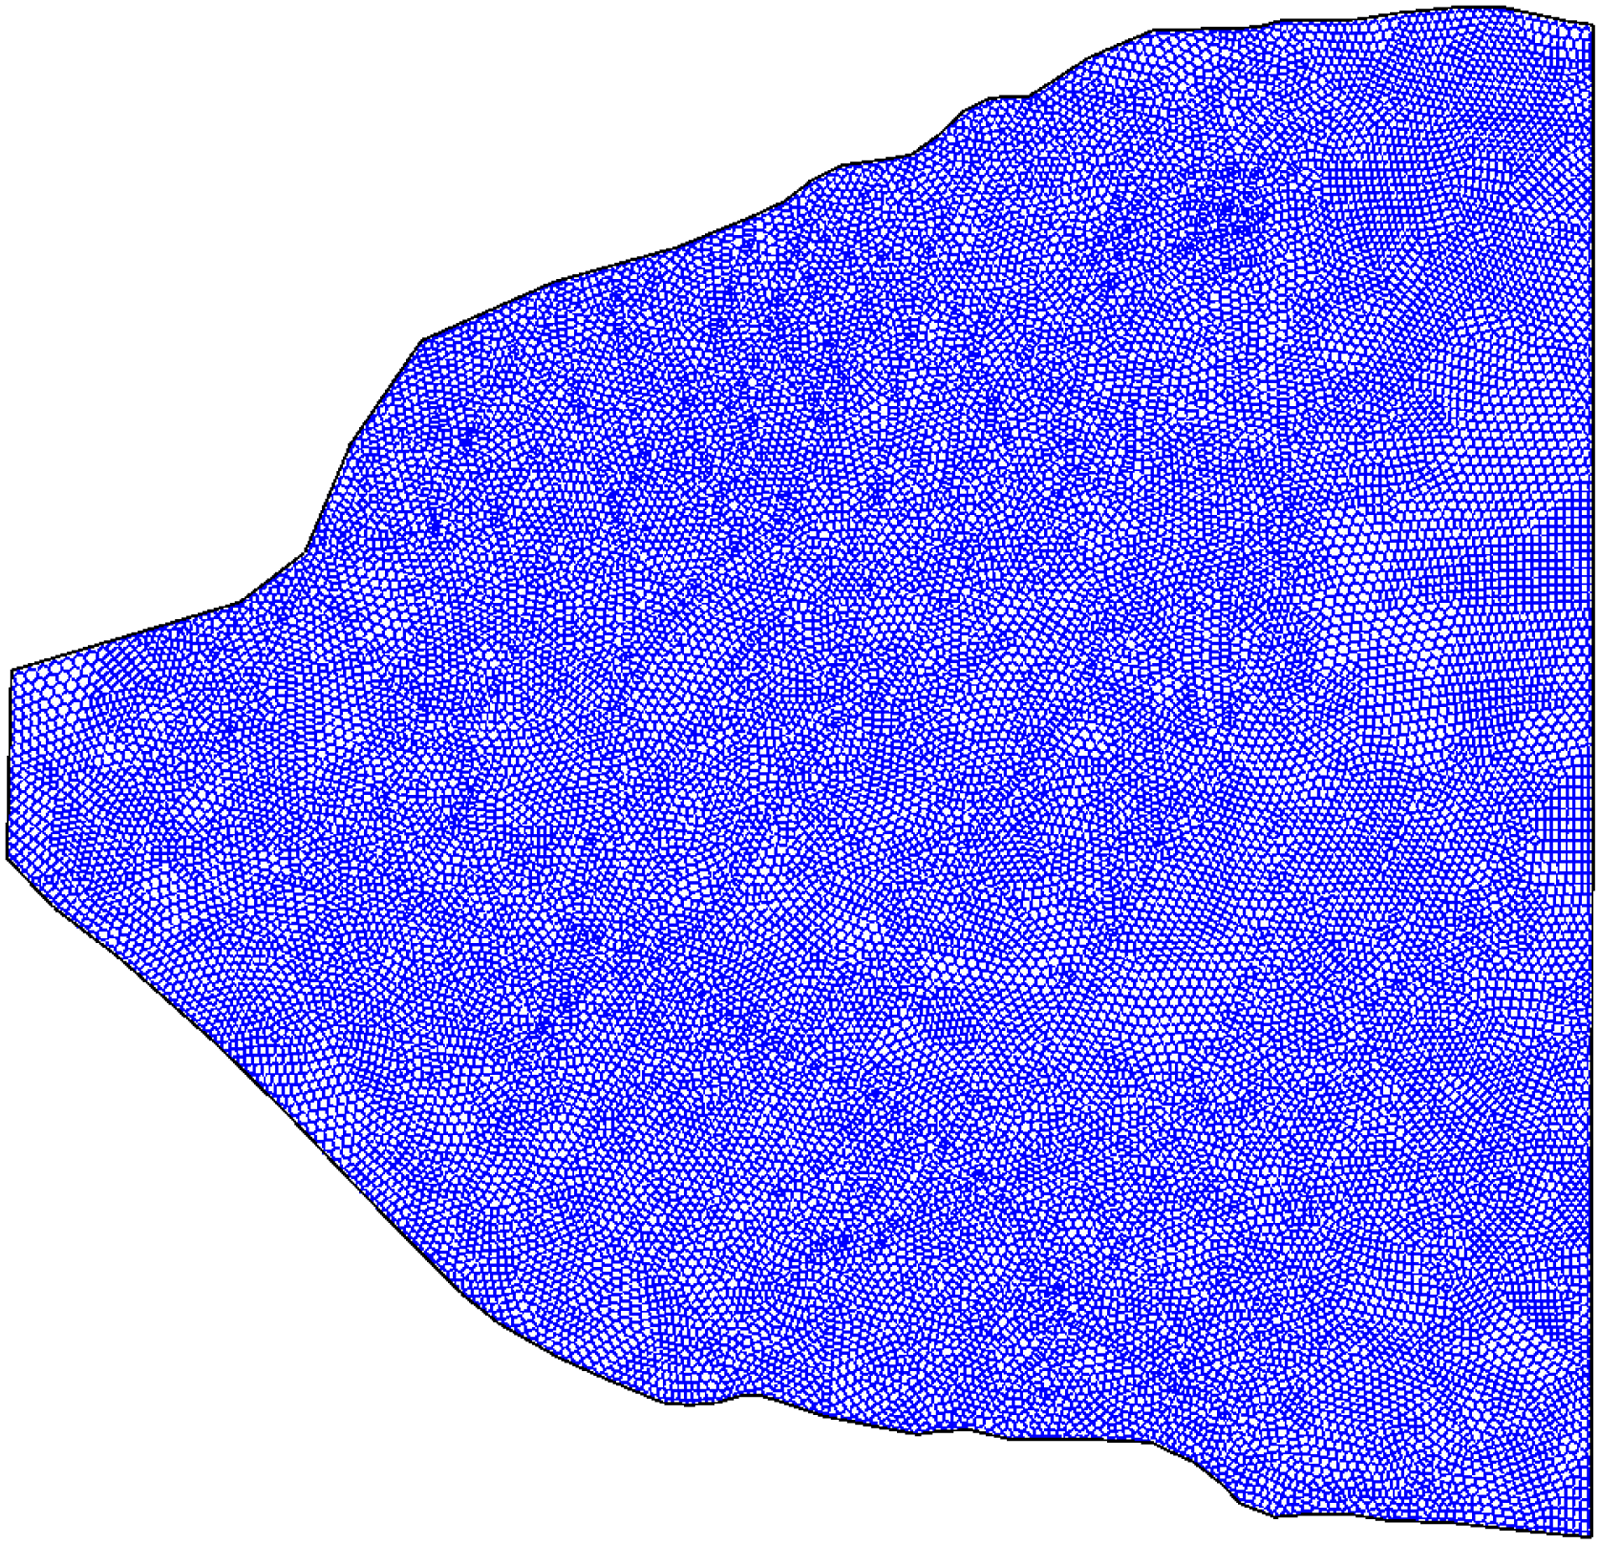
Division results of PEBI grid in study area.
Fault system modeling
To characterize the fault transport system and fault-karst reservoirs, it is necessary to model fault plane of 28 first-order faults and 76 s-order faults (Figure 1) in the study area. The fault planes are established by triangulation technique with upper Ordovician Santamu Fm as the upper limit and lower Cambrian Yuertusi Fm as the lower limit (Figure 12). These fault planes provide important oil and gas transport systems.
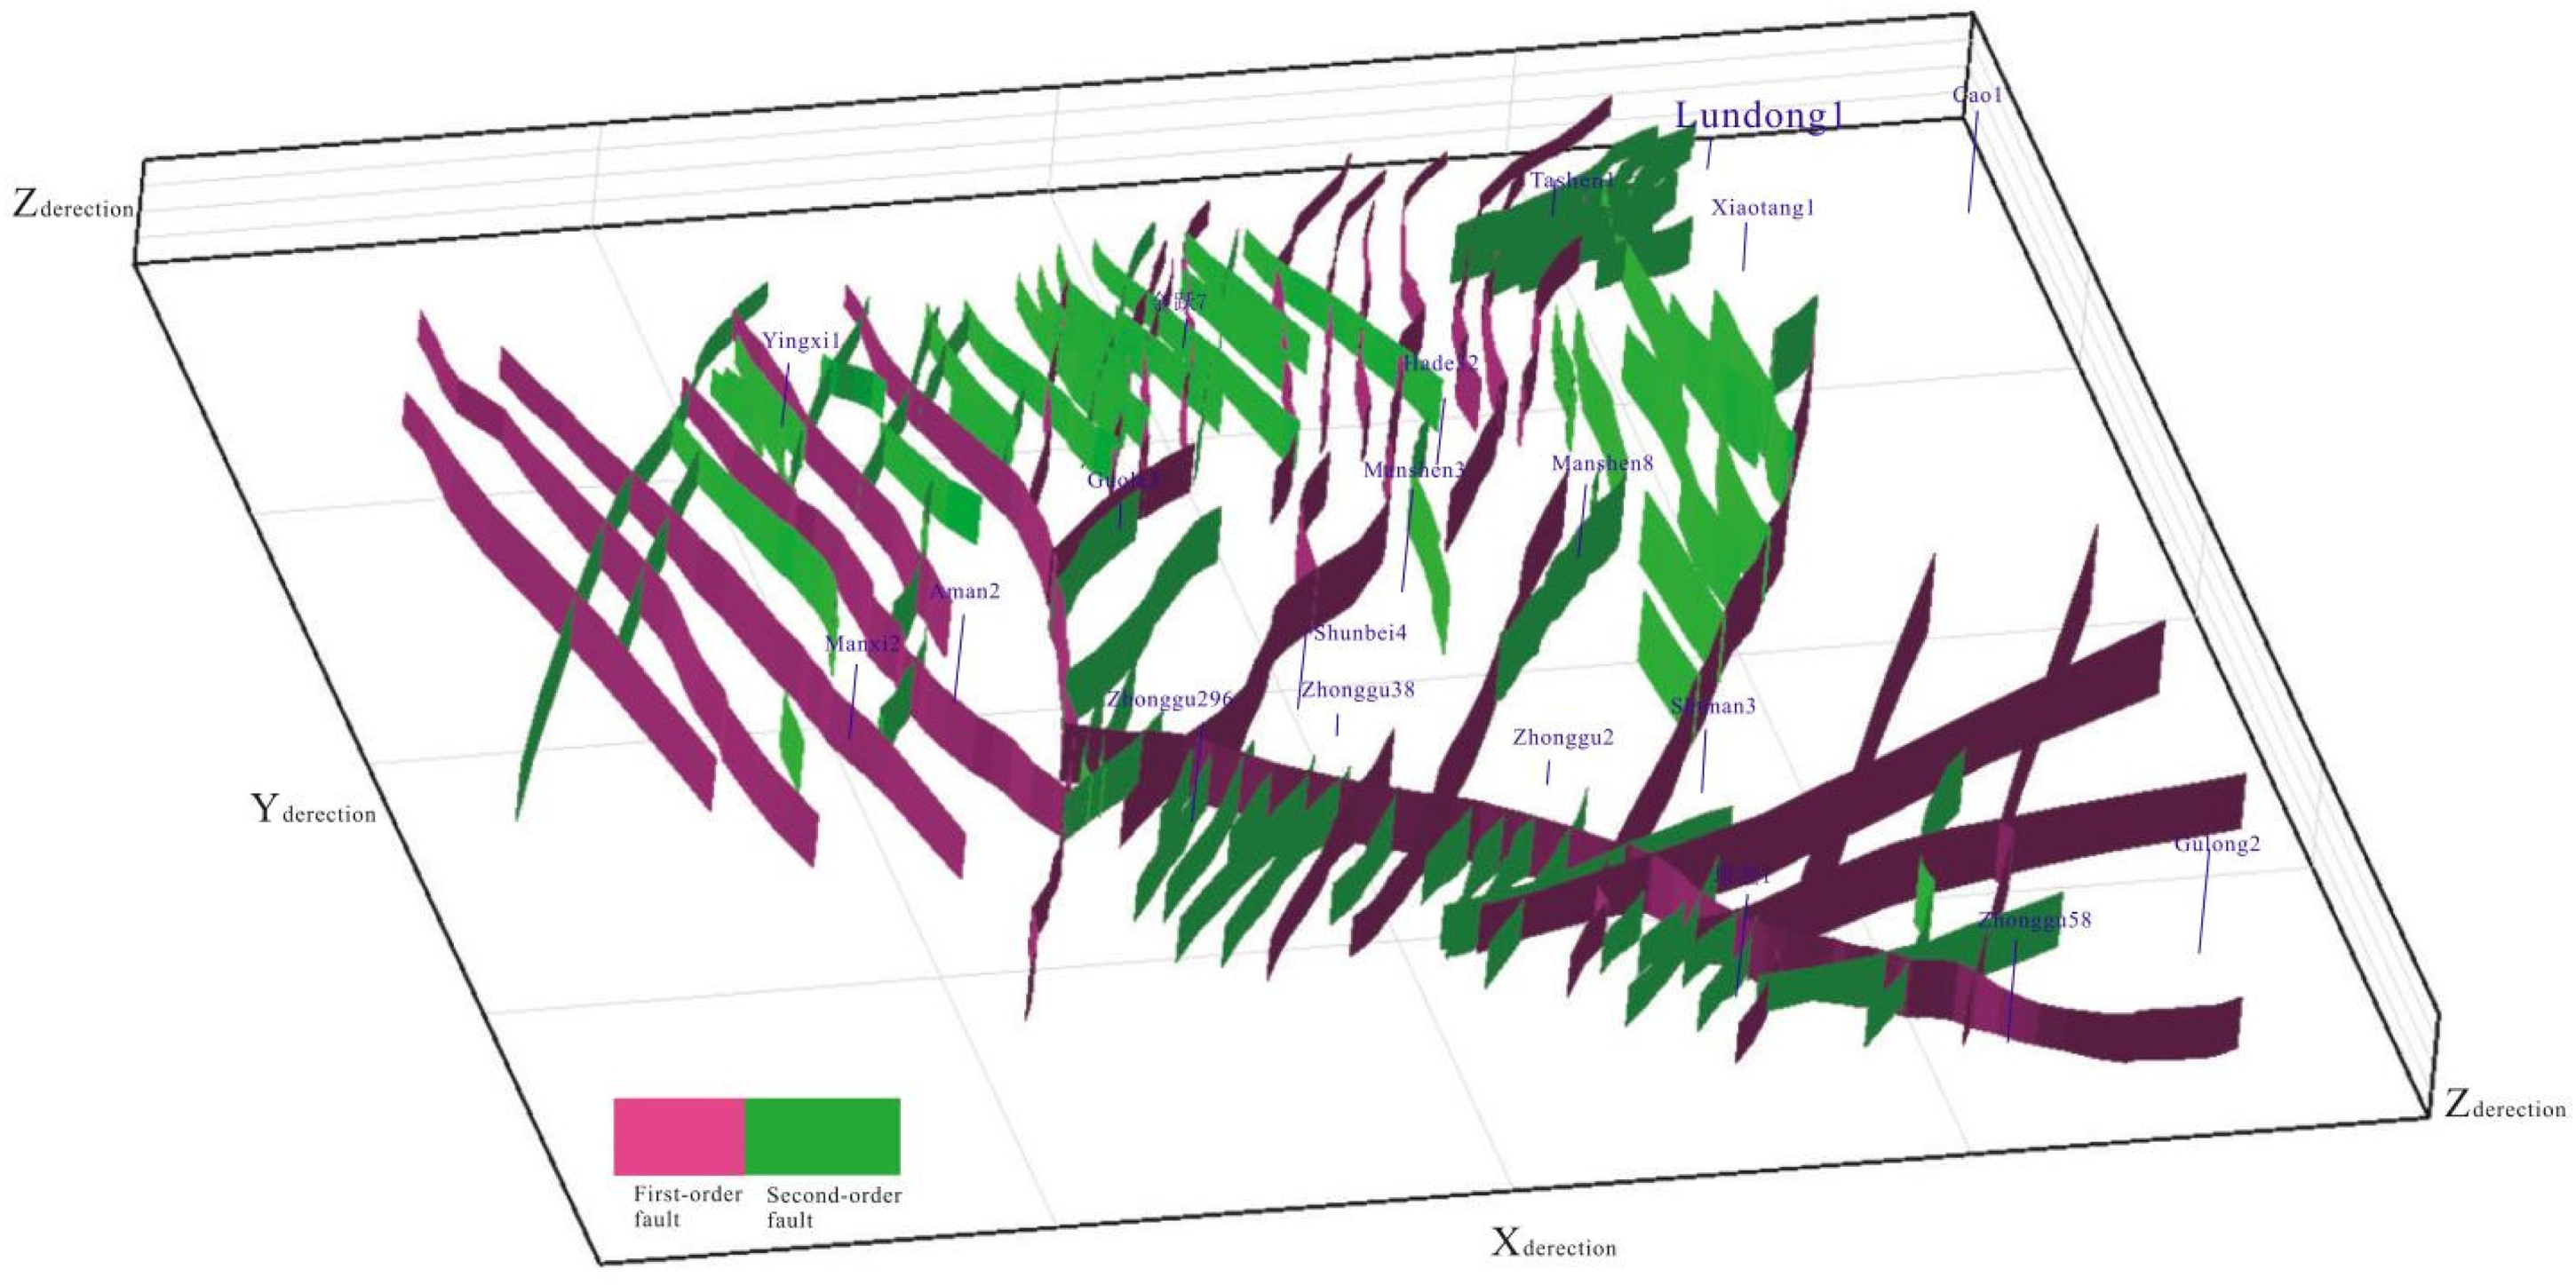
Three-dimensional fault plane modeling of study area (notes: 390 km in x direction; 373 km in y direction; 12 km in z direction).
3D geological model
According to distribution of fault planes, the fault grids are generated. 3D grid data volumes formed by fault grids and PEBI grids of each layer are intersected. The 3D grid data volumes are re-constructed to form a 3D stratigraphic framework model with fault grids (Figure 13), which provides a preparation for stratigraphic attribute modeling and 3D hydrocarbon migration and accumulation simulation.
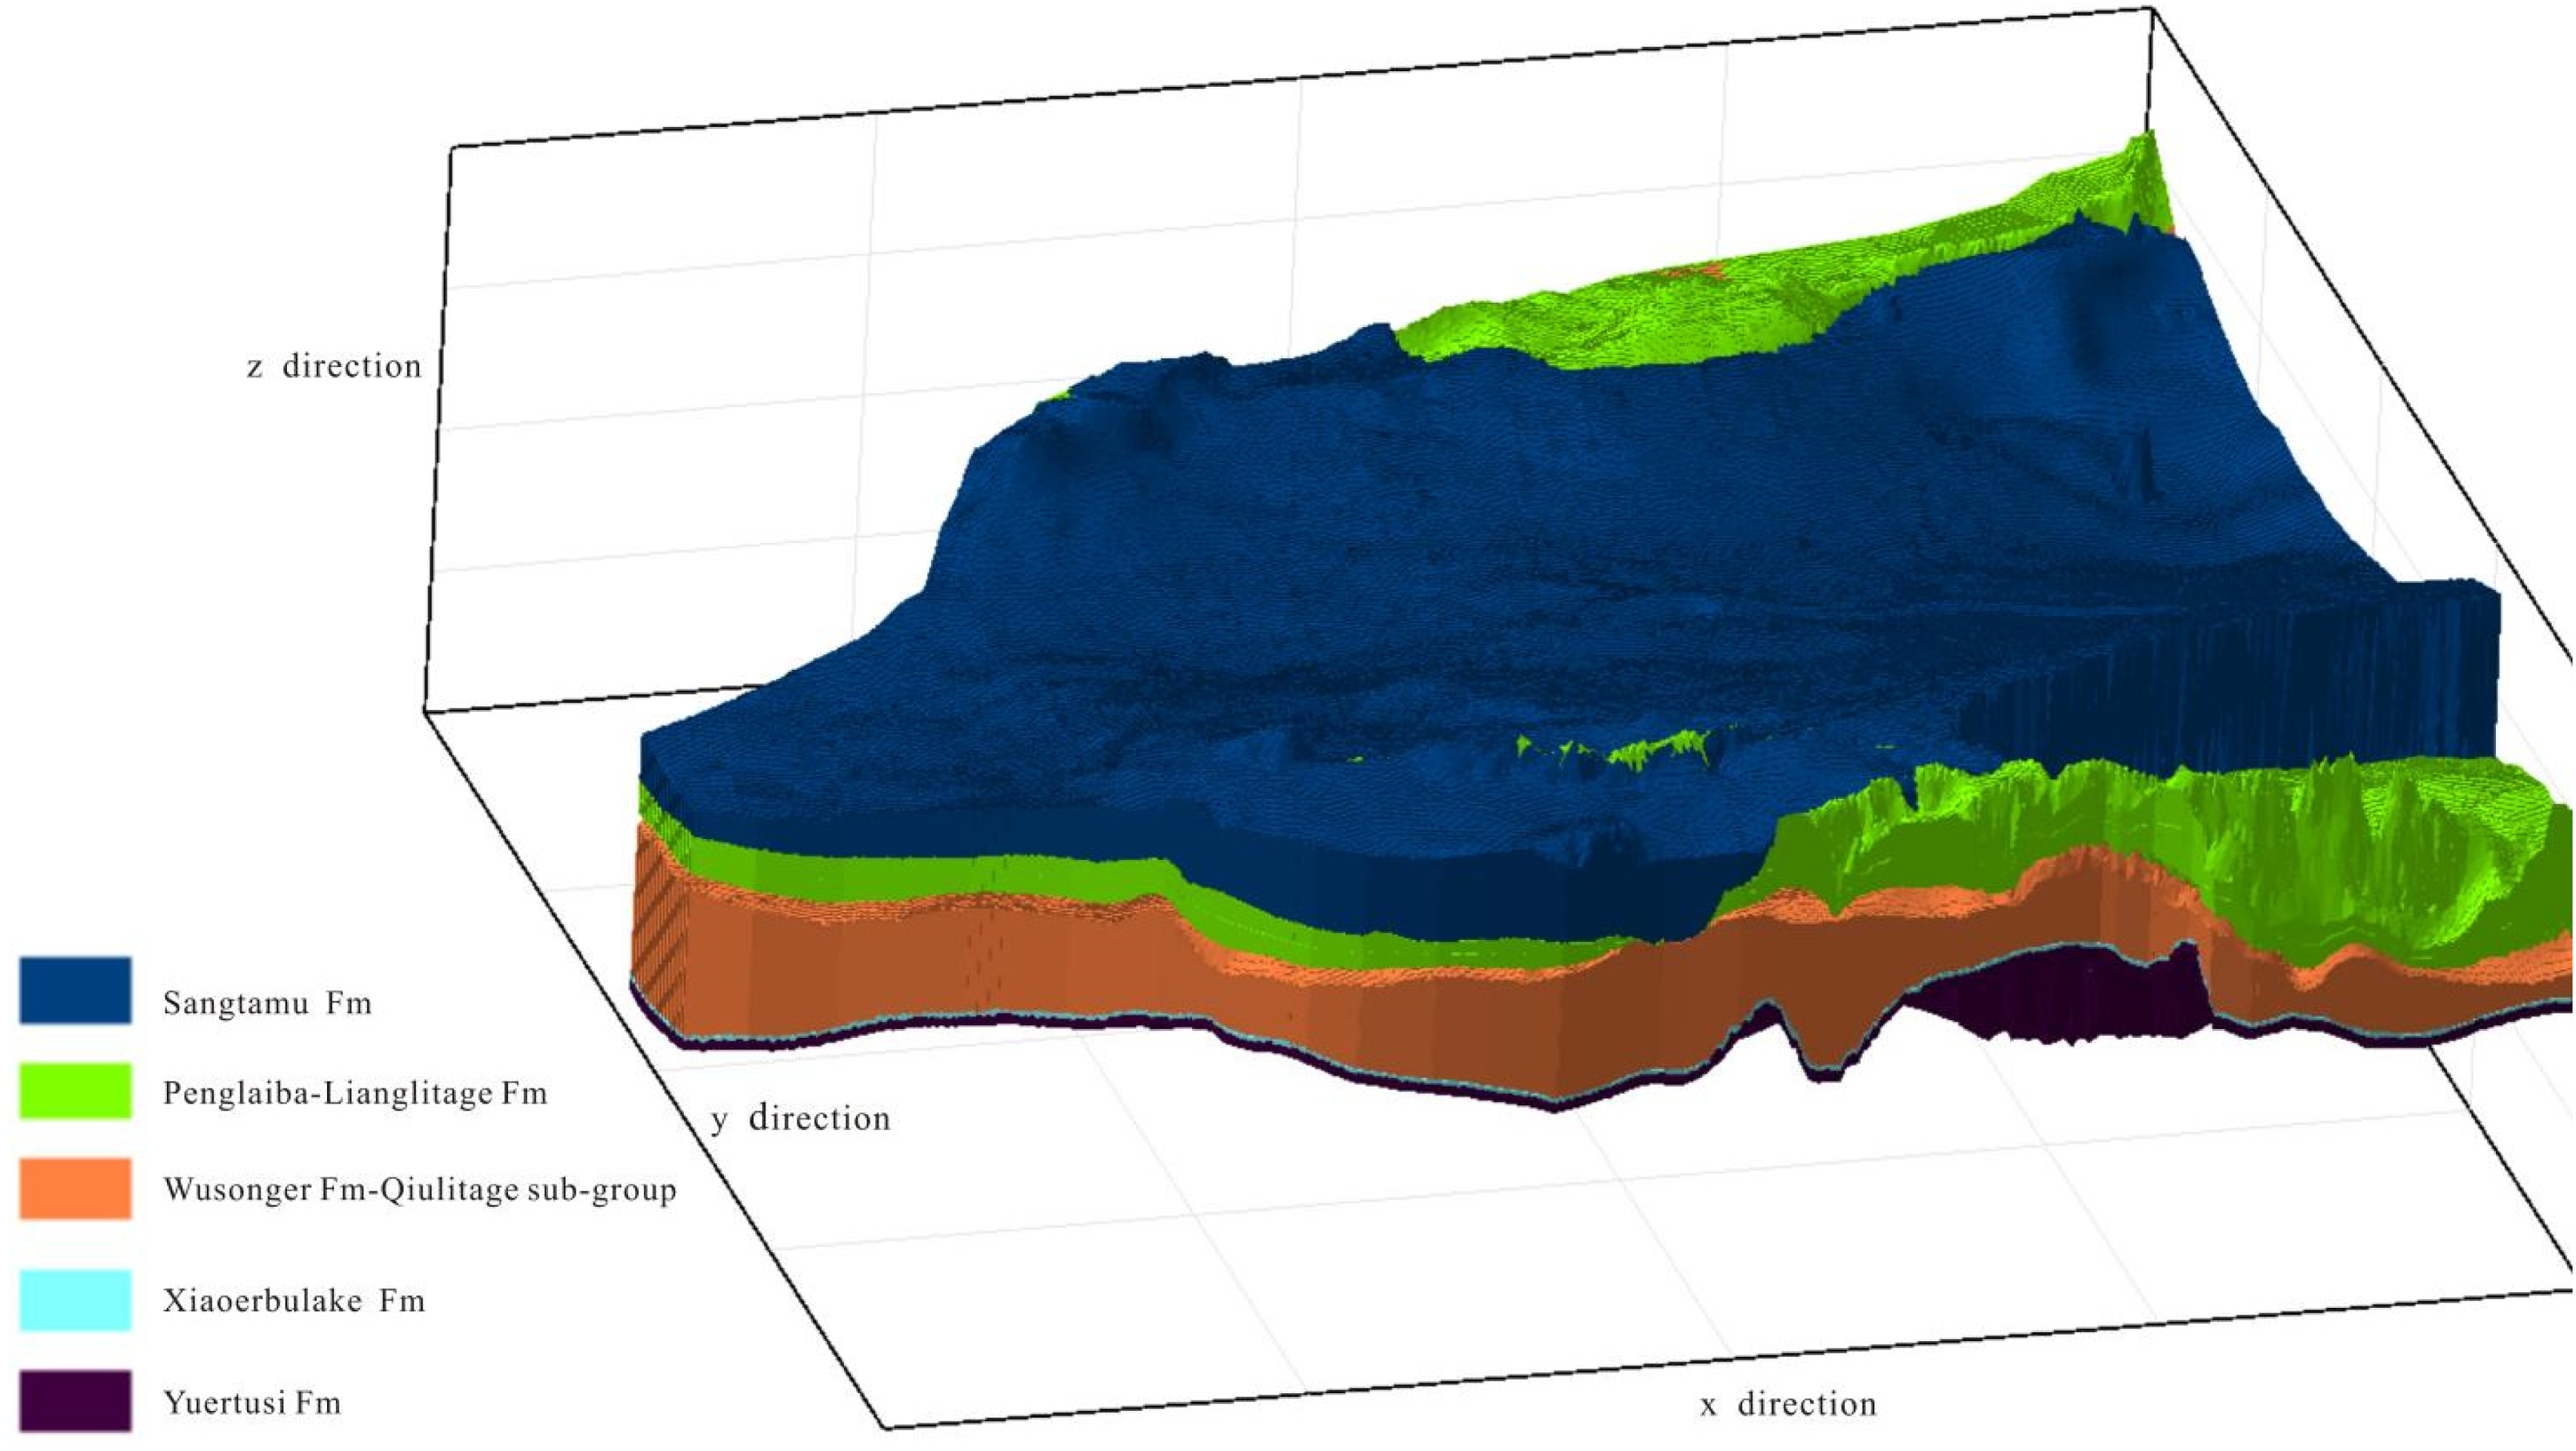
3D geological model of study area (notes: 390 km in x direction; 373 km in y direction; 12 km in z direction).
Attribute modeling
Attribute modeling mainly includes hydrocarbon generation intensity of source rock and reservoir physical property.
Modeling of hydrocarbon generation intensity of source rocks
When hydrocarbon generation intensity data are not available, the hydrocarbon supply range and relative hydrocarbon supply intensity are mainly determined by using hydrocarbon source rock isopach diagram. Under the same organic matter type and similar maturity conditions in the same layer, the thicker source rocks provide stronger hydrocarbon generation and supply capacity (Figure 6).
Reservoir physical properties modeling
Reservoir physical properties mainly refer to porosity and pore throat radius. The former is mainly used to calculate oil and gas saturation, and the latter is mainly used to determine whether oil and gas can migrate. The porosity mainly affects the accumulation amount and loss along the path and has little effect on the hydrocarbon migration direction and accumulation area. Porosity modeling is mainly operated by random sampling according to ranges of statistical data. The pore throat radius determines the hydrocarbon migration path and accumulation area, so it is an important parameter in simulation of hydrocarbon migration and accumulation.
Reservoir physical property modeling is mainly to determine the relative quality of reservoirs according to sedimentary facies, fault-karst body, seismic attributes and reservoir information. The reservoir quality is divided into: The first level with a value of 0.8–1.0 which covers the proved reserve area; the second level with a value of 0.6–0.8 which covers the controlled and predicted reserve areas; the third level with a value of 0.2–0.6 which covers the platform edge belt and fault zone; the fourth level with a value of less than 0.2 which is beyond above-mentioned areas. First, the quantitative evaluation of sedimentary facies (normalized to 0–1) shows a higher value of 0.2–0.6 in the platform edge belt and a lower value of less than 0.1 in other facies belts. Second, quantitative evaluation of the fault-karst body is operated, respectively with the first level fault zone with a higher value of 0.3–0.7 and the second level fault zone with a lower value of 0.2–0.5. Third, in the seismic attribute area, the value is normalized with a maximum of 1 and a minimum of 0. Finally, the discovered reserves area is divided into the proved reserves area with a value of 0.8–1.0 and the controlled and predicted reserves area with a value of 0.6–0.8. Under restrictions of intervals of reservoir conditions in above areas, random interpolation is operated in the sedimentary facies zone, fault-karst body, seismic attribute area and reserve area to obtain the reservoir conditions of grid units. After interpolation, the value in the overlapped area is determined according to the results of multi-source data fusion processing. According to our study, the method of “selecting the best” (maximum value) can be applied in fusion of overlapped area. Multi-source data fusion results reveal that high-quality reservoirs are mainly distributed in the karst belt and fault-karst body in Tabei uplift, Tazhong bulge and Aman transition zone (Figure 14).
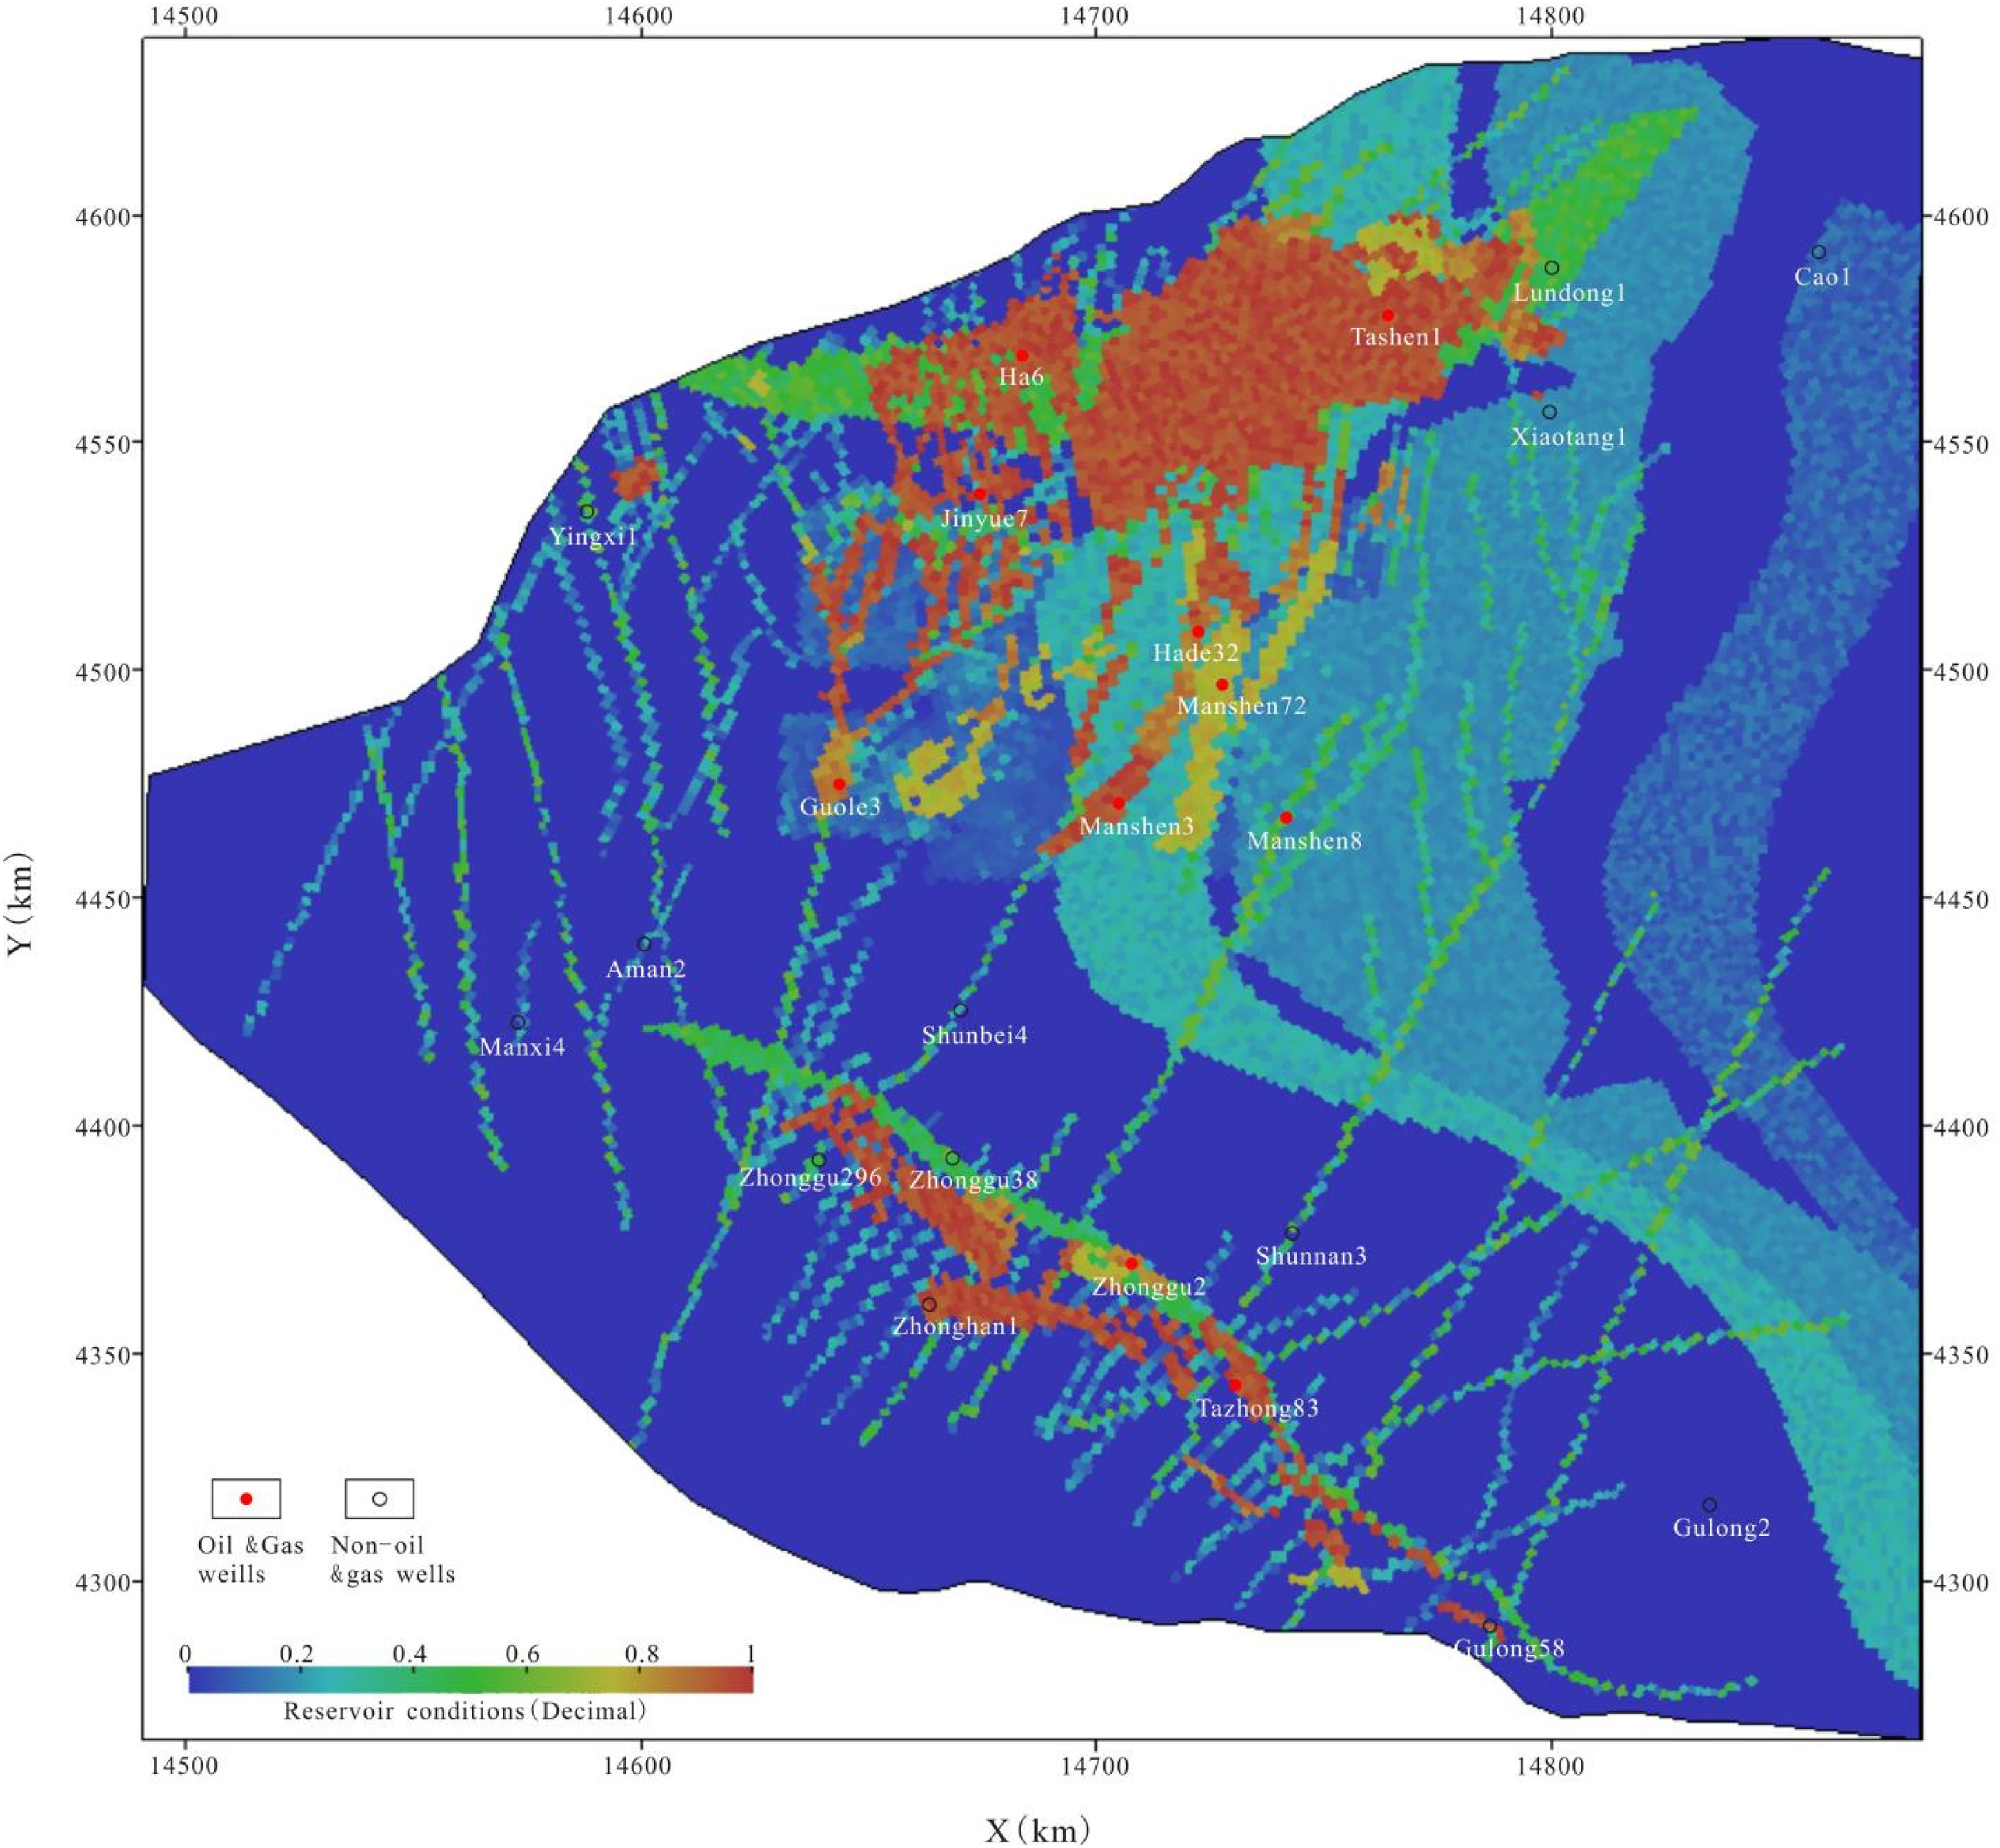
Evaluation value of Ordovician reservoir conditions in platform area of Tarim Basin.
After obtaining the reservoir condition evaluation value diagram, the relationship between porosity, pore throat radius and reservoir condition evaluation value is established respectively, and modeling of porosity and pore throat radius is realized.
Hydrocarbon accumulation simulation method
Conventional method
Hydrocarbon migration and accumulation simulation are mainly operated with 2D flow line simulation, 3D multi-phase Darcy flow simulation and 3D invasion percolation simulation. And the third simulation method is adopted in this study.
The percolation theory was not publicly issued until 1983 by Wilkinson and Willemsen (1983) Meakin et al. (2000) and Carruthers et al. carried out study on the invasion percolation technique by means of experiments and mathematical simulation. Hantschel and Kauerauf (2009) illustrated basic methods, mathematical models and examples of the invasion percolation technique. In China, study on the invasion percolation technique was mainly carried out in numerical simulation. The percolation models were used to study hydrocarbon migration path and change characteristics (Zhou et al., 2007). Shi (2009) carried out study on background, technology, and application effect and scope of the invasion percolation technique and proposed its development direction. Guo et al. (2021) established a 3D numerical model of invasion percolation and applied it to the simulation of western basins in China, which achieves good results. Hydrocarbon migration and accumulation in the silici-clastic reservoir model was simulated with a migration numerical model established with the percolation theory. The simulated pathway distribution and accumulation patterns are significantly different from those obtained with the conventional method (Xiaorong et al., 2023).
Improved invasion percolation model
Mathematical model
The conventional invasion percolation technique is only applicable in tracking of forward migration of oil and gas overcoming the confining force of the pore throat inside the carrier layer. There is no effective method for tracking the hydrocarbon migration on the fault plane.
To solve the problems of tracking hydrocarbon migration on the fault plane, the fault grid is introduced in the 3D geological model. Tracking of hydrocarbon migration on the fault plane is mainly operated based on the methods of the relationship between capillary resistance and driving force of pores and the shale gouge ratio (SGR). The first method is based on the relationship between the capillary resistance and the driving force and is the same as the tracking method in the rock layer. Oil droplets and gas bubbles are driven by buoyancy. When their migration is blocked, subsequent supply of oil and gas fluid is needed to increase the buoyancy so as to overcome the capillary resistance caused by oil and gas fluid deformation. The relative value of capillary force and buoyancy determines whether oil and gas continues to move forward. The capillary force and buoyancy force are expressed as:
The second method is based on the SGR. When the calculation parameters of fault capillary force and buoyancy are not available, and the first method cannot be used, the SGR is used to determine whether the fault in front of hydrocarbon migration is closed or opened (Yielding et al., 1997). According to the relative value of SGR, an empirical formula for converting grid transport capacity is proposed:
when S > Sclose:


In Formula (2)–(4), Tmig is 0–1 where 0 represents closed fault and 1 represents communicated fault. S is 0–1, and a larger value indicates better closure and worse communication. Sclose and Sopen are different in different areas. Taking Shahejie Fm in Bohai Bay Basin as an example, Sclose is 0.85 and Sopen is 0.25.
Either in the first or the second method, when the buoyancy is greater than the capillary resistance or the transport capacity is greater than 0.5, it is considered that fault is communicated and oil and gas can be migrated forward.
Flow line and flow rate diagrams
Flow line diagram is a hydrocarbon migration path diagram showing all prints left after petroleum transport from the source rock and it helps understand the hydrocarbon migration and accumulation process.
Flow line + flow rate diagram is a special flow line diagram with information about oil and gas flow rate. Flow rate refers to the ratio of the net rate to maximum net rate on each flow line segment. The maximum net flow rate is the current maximum of net flow rate in all line segments. The line thickness represents the relative value of the rate, and the color can also be used to represent the relative value of the rate. A larger rate indicates a more important flow line. Thus, the flow line + flow rate diagram can describe major hydrocarbon migration paths.
Simulation results
Simulation results include the flow line + flow rate diagram and the oil and gas saturation diagram.
Hydrocarbon migration paths and major paths
It is revealed in the simulation of flow line and flow rate of hydrocarbon migration that oil and gas are migrated vertically from Cambrian Yuertusi Fm to Ordovician system along the fault-karst zone (Figure 15(a)) and migrated laterally in the karst zone and the fault-karst body when they are blocked by the caprock (Figure 15(b)). In different structural locations, hydrocarbon migration occurs in different patterns (Figure 15). (I) In the high parts such as Tabei uplift and Tazhong bulge, hydrocarbon migration mainly occurs in the lateral direction in fault-karst body and reef flats, convergence occurs in the migration process, and several red lines (major paths) with high flow rates can be observed. (II) In the slope area such as the relatively high part of Aman transition zone, both vertical and lateral migration occur in the fault-karst body, the flow line is mainly the green line with low flow rate, and the red line with high flow rate mainly occurs near Fuman oilfield. (III) In the low part such as the relatively low part of the northern depression, oil and gas migration in the fault-karst body mainly occurs in the vertical direction and secondarily in the lateral direction, and the flow line is basically the green line with low flow rate.
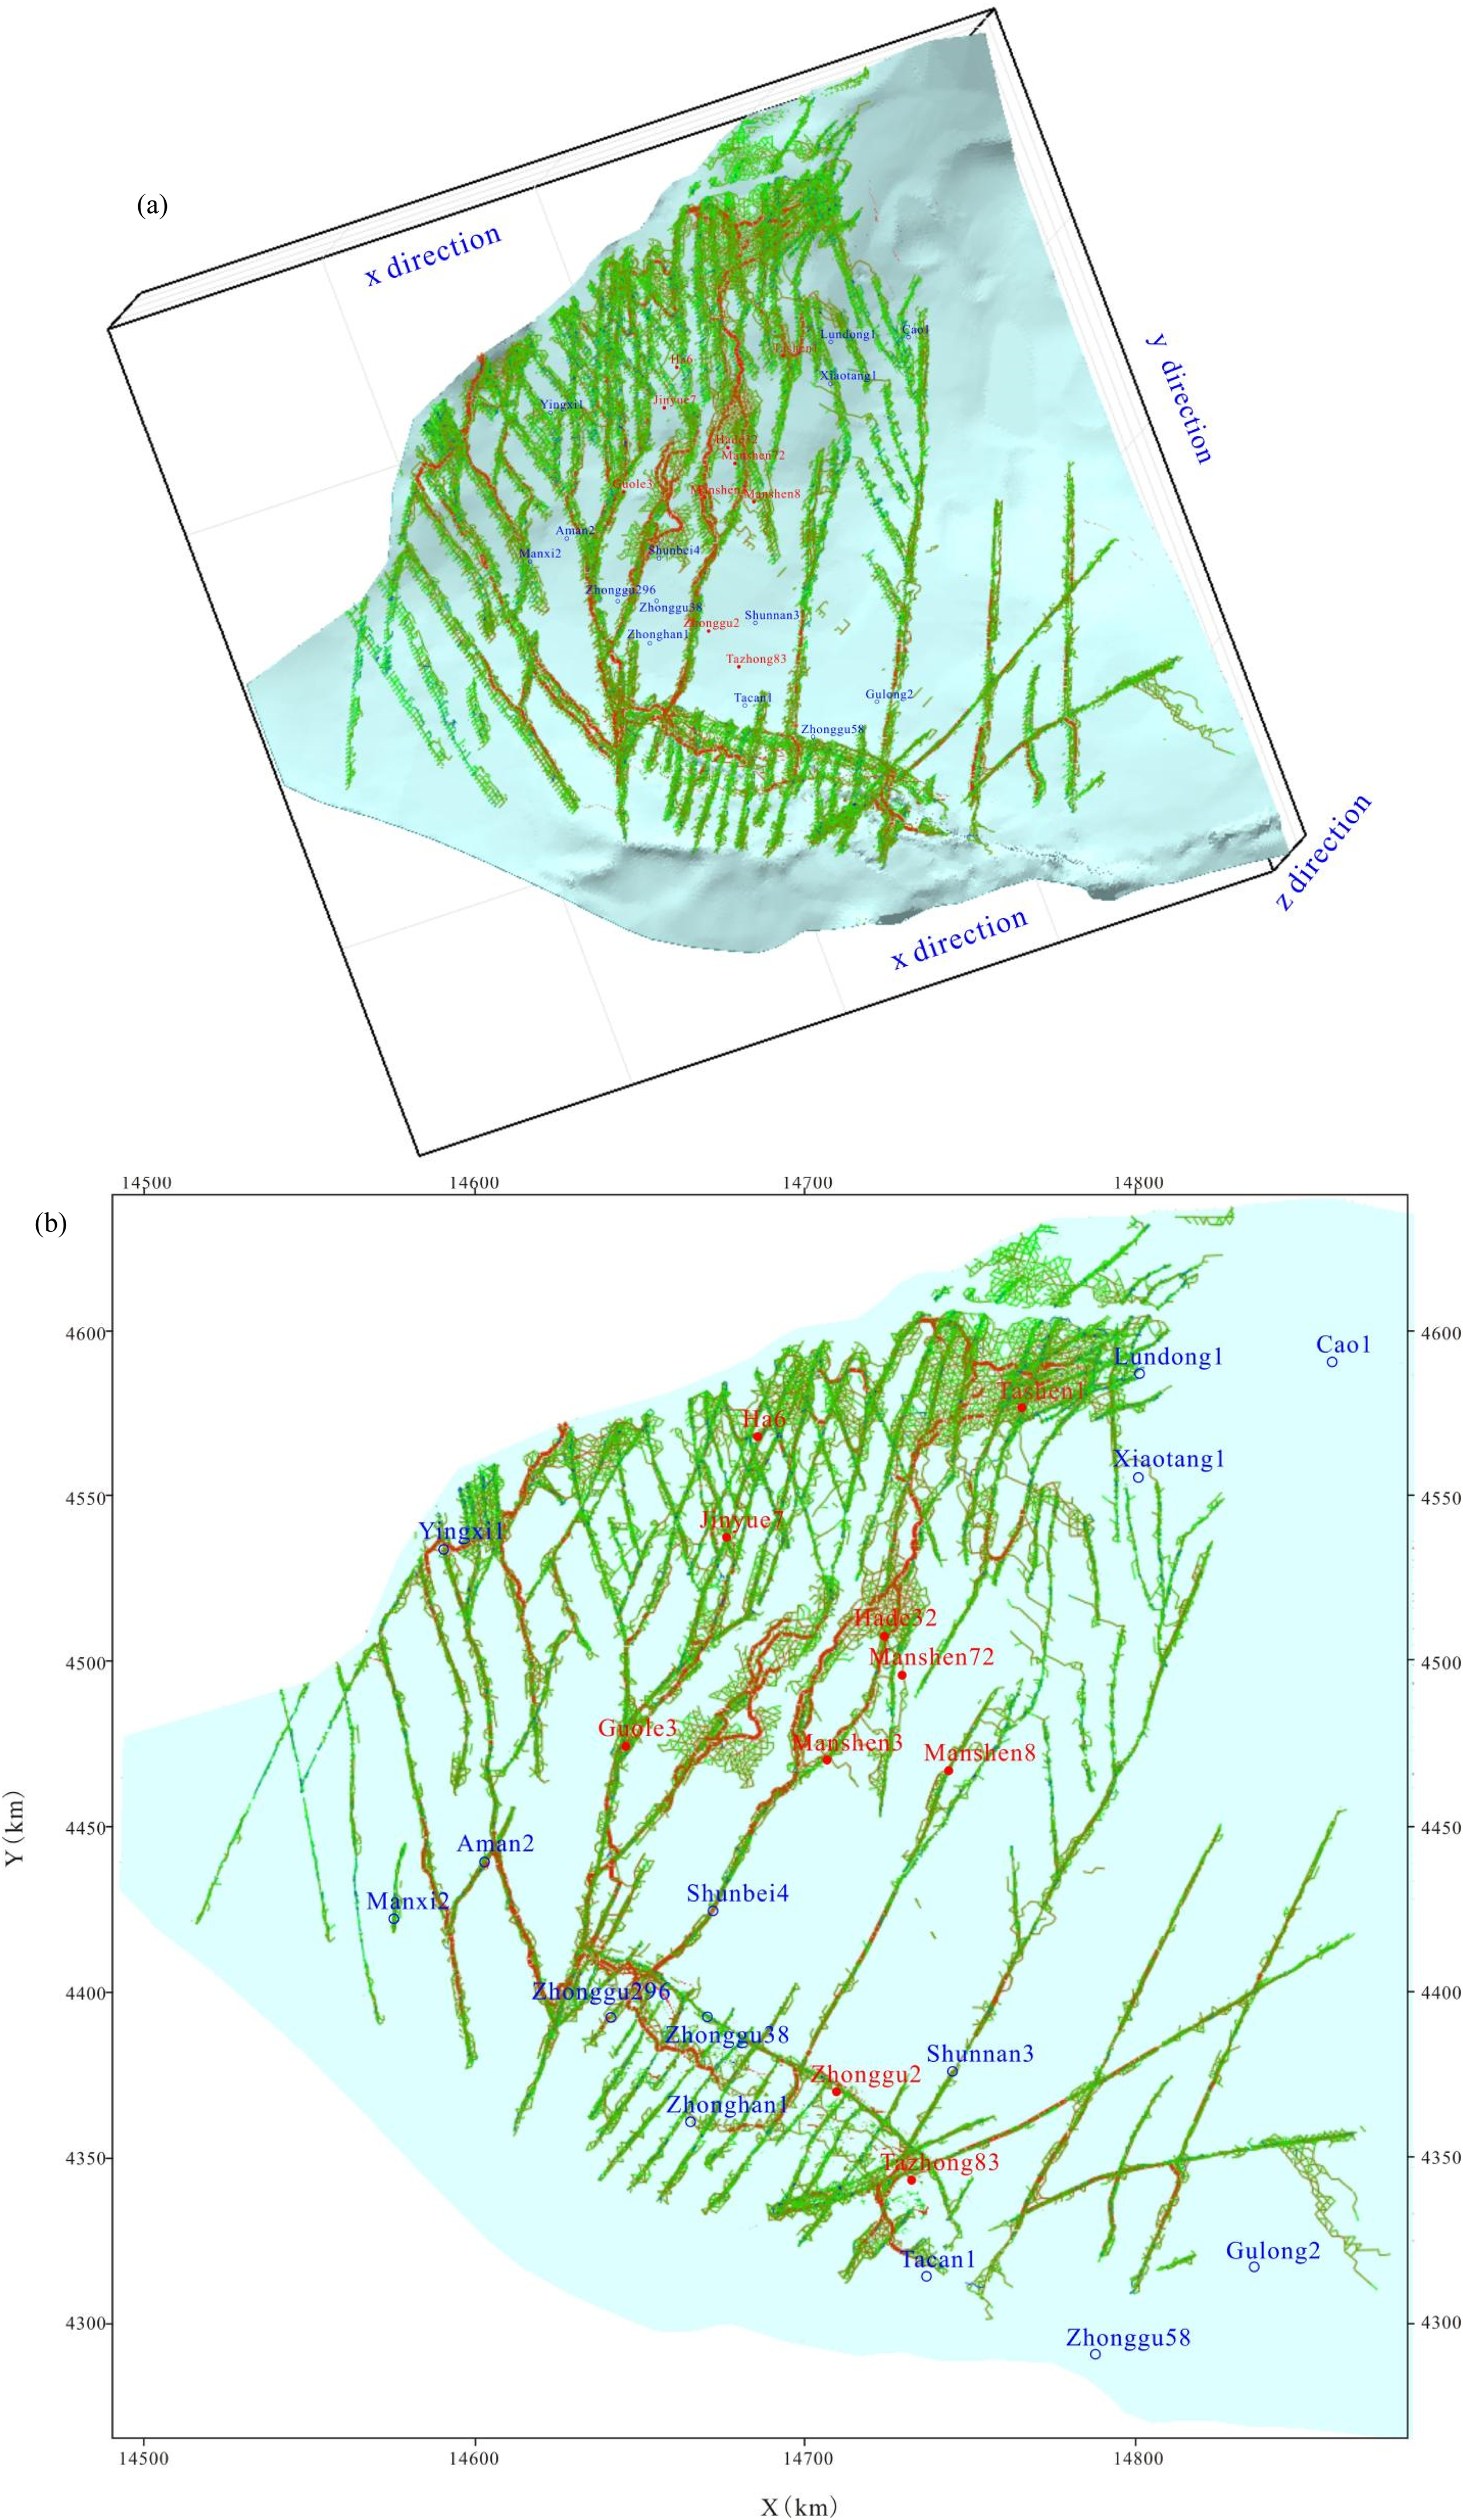
Tracking of hydrocarbon migration path in Ordovician strata in platform area of Tarim Basin. (a) 3D diagram (Notes: 390 km in x direction; 373 km in y direction; 12 km in z direction). (b) Plane projection. Notes: The red line indicates a relatively high flow rate; the green line indicates a relatively low flow rate.
Prediction of hydrocarbon accumulation areas and potential areas
Oil and gas saturation simulation results
It is revealed in the distribution of oil and gas saturation from simulation of hydrocarbon migration and accumulation (Figure 16) that: (I) the high parts are mainly reef-beach oil and gas reservoirs; (II) the slope area is dominated by fault-karst reservoirs; (III) in the lower part, there are a few isolated fault-karst reservoirs.6.2.2 Comparison of simulation results and exploration results.
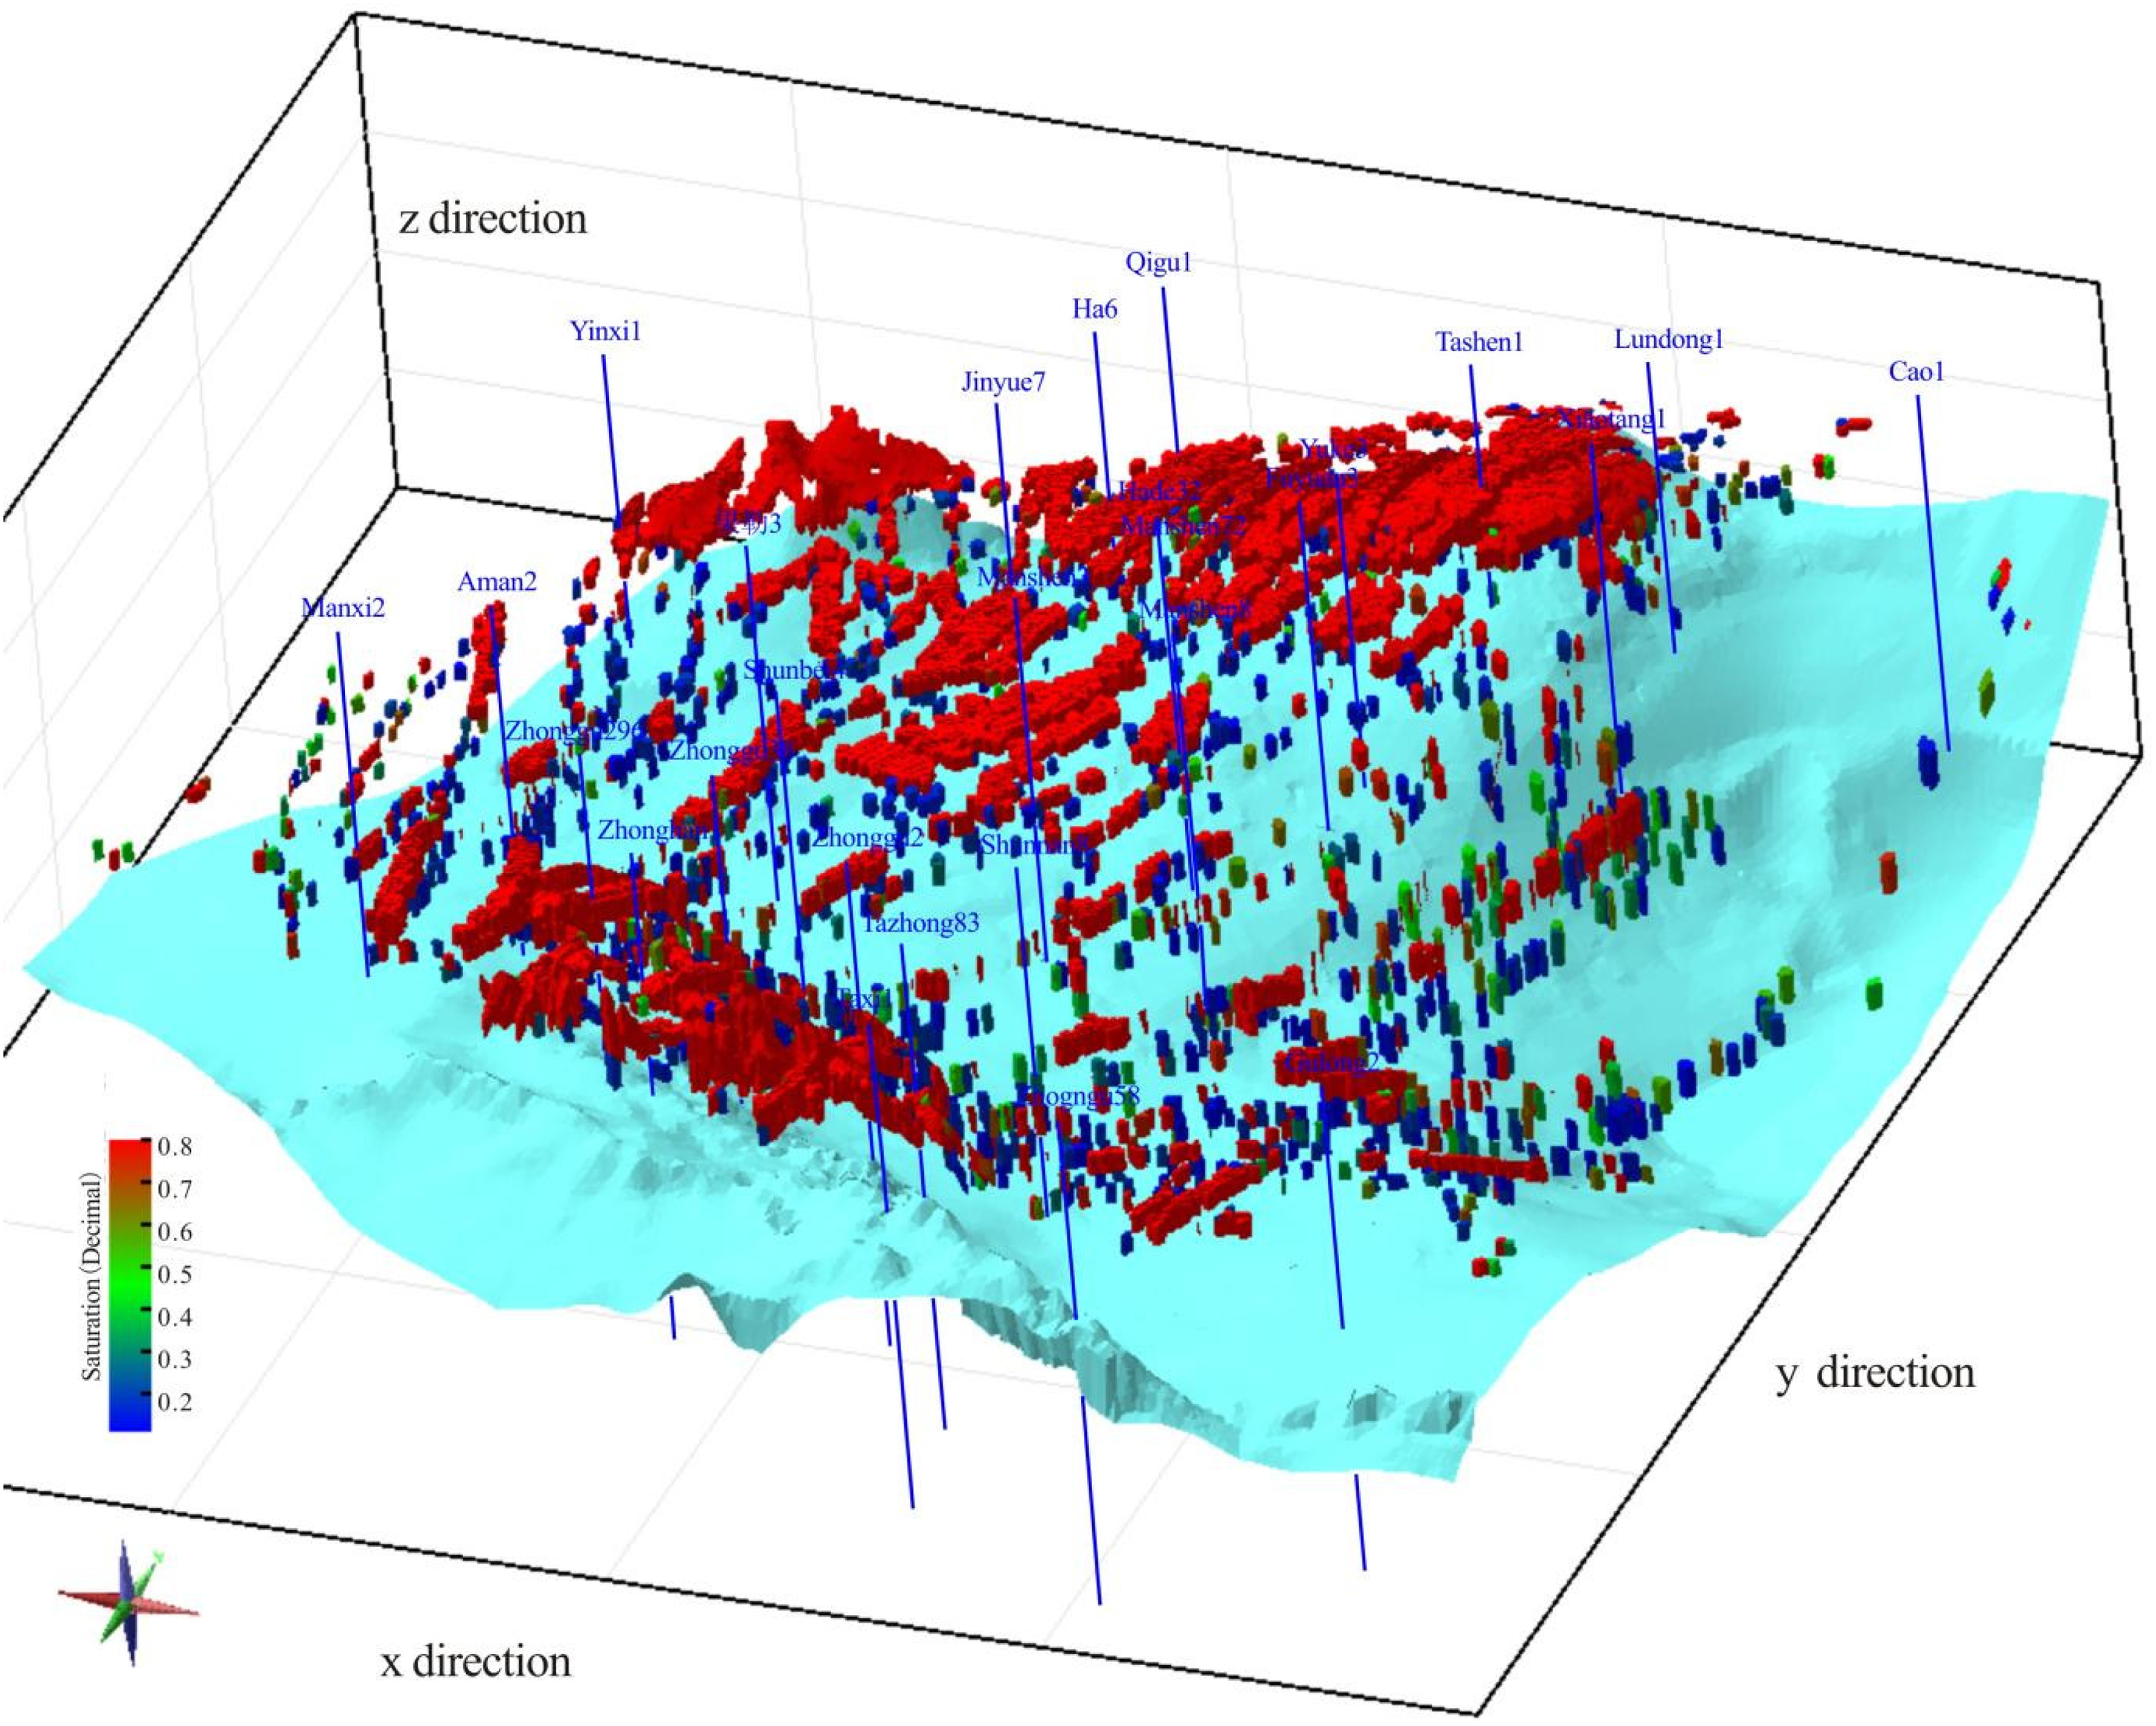
Saturation distribution in simulation of hydrocarbon migration and accumulation in Ordovician strata in platform area of Tarim Basin (notes: 390 km in x direction; 373 km in y direction; 12 km in z direction).
According to superimposition of oil and gas saturation (Figure 16) and reserves area (Figure 17), the conclusions are obtained as follows. In the known reserve areas, the coincidence rate of simulated accumulation area and reserve area is more than 80%, which confirms reliability of simulation. In the undiscovered reserve area, the predicted accumulation area covers about 50% of discovered reserve area, indicating a large resource potential. In the predicted accumulation area, the saturation is generally lower than that in the reserve area, and there is relatively scattered oil and gas distribution and little continuous scale accumulation, indicating a relatively poor economy of undiscovered resources.
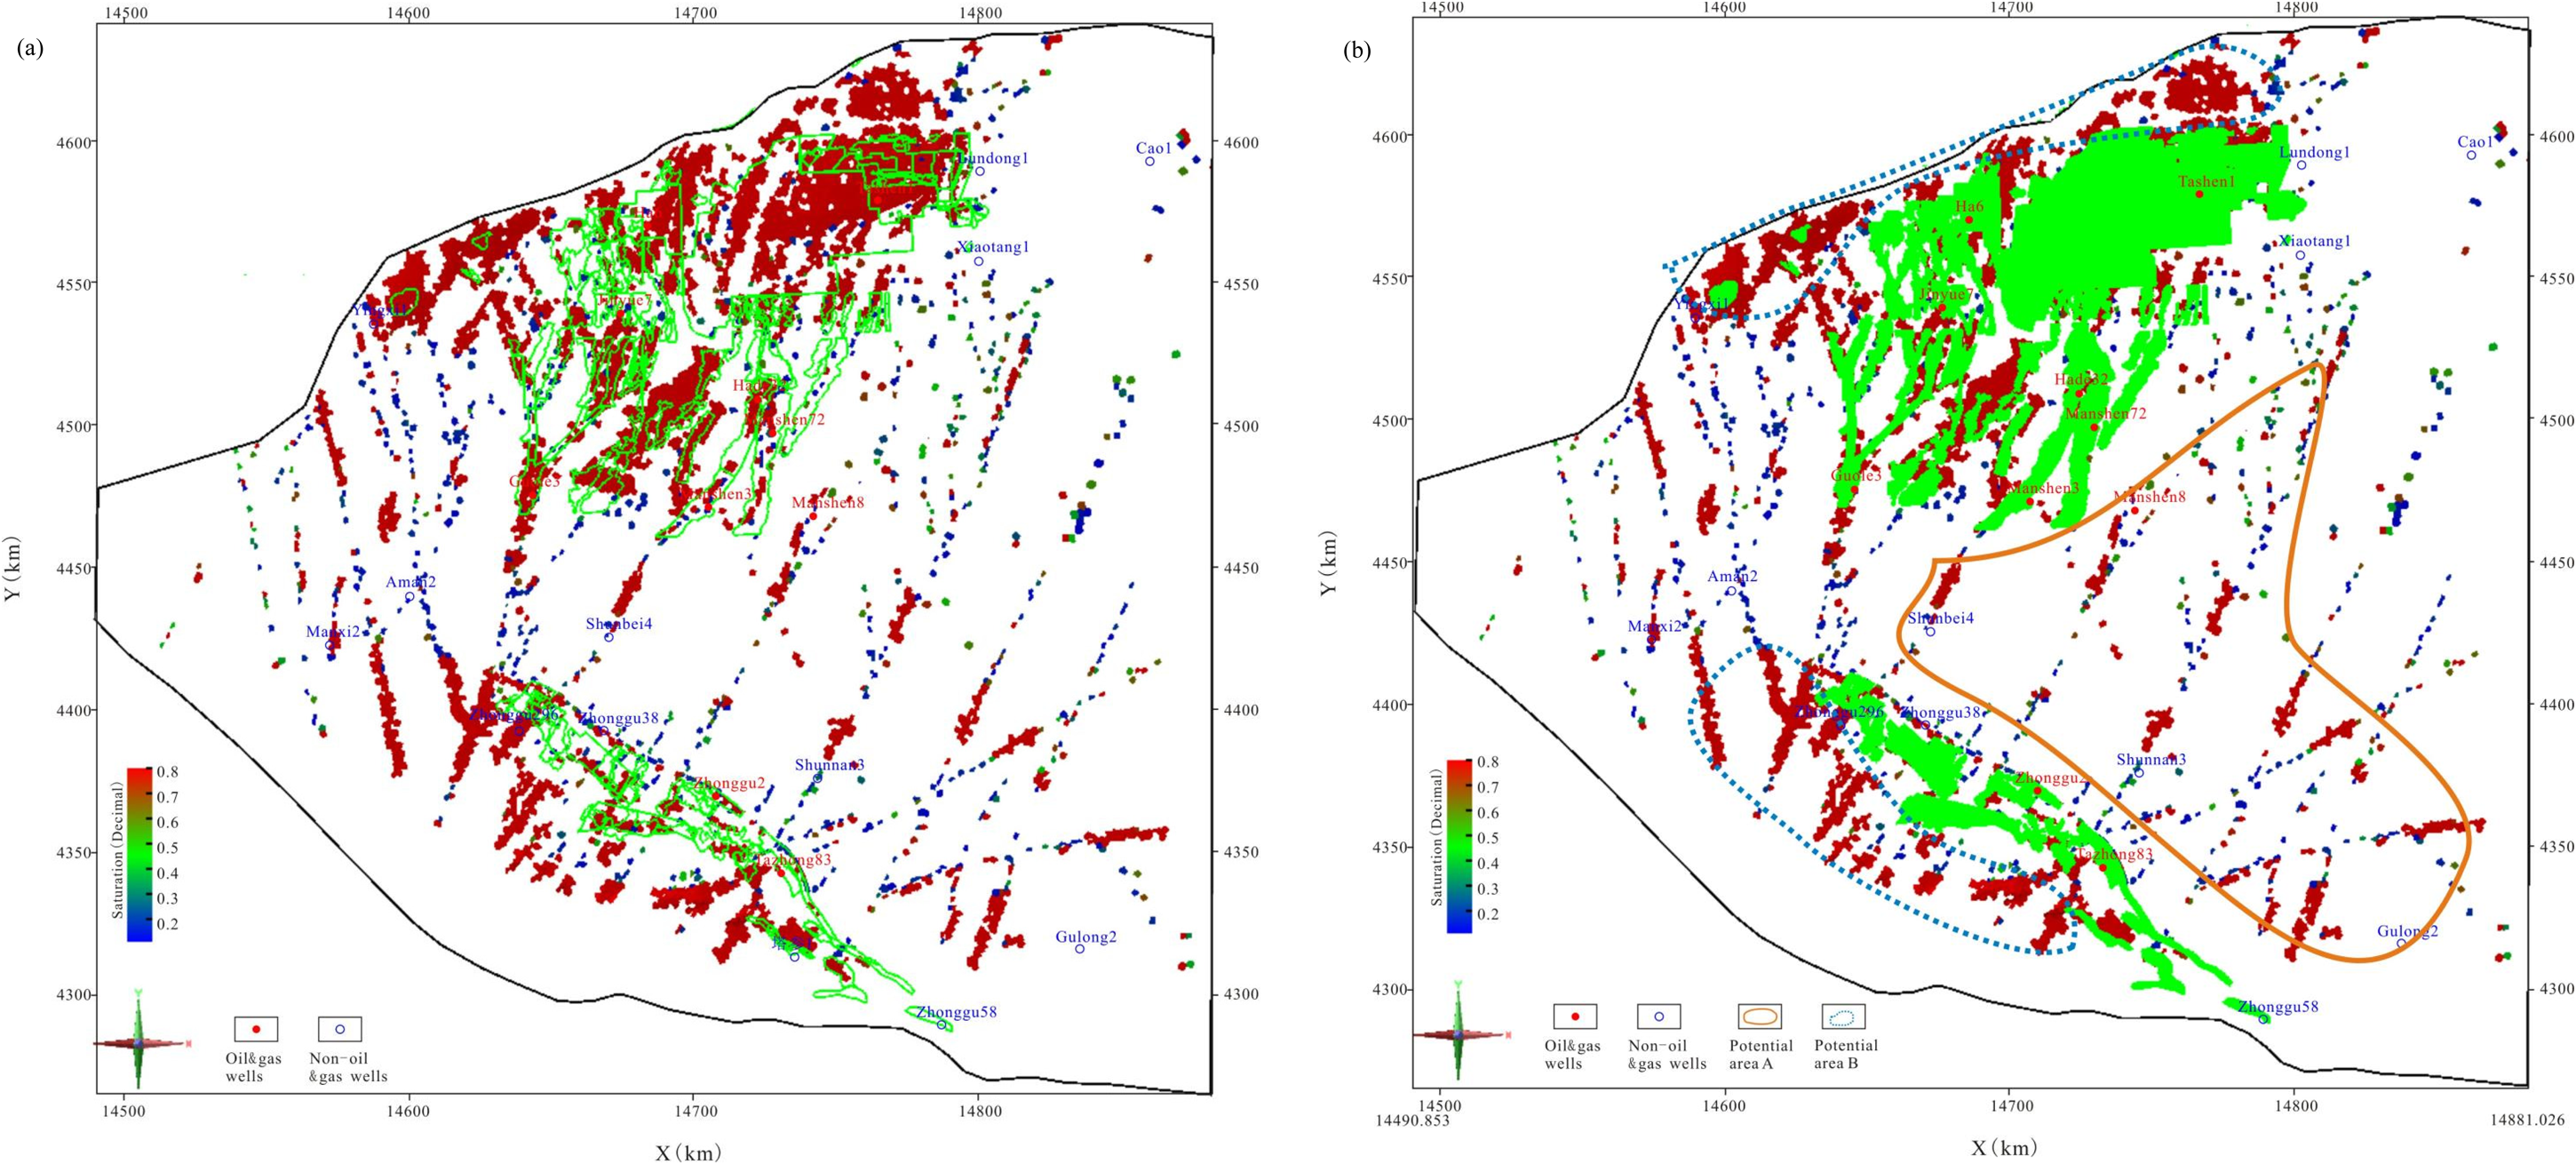
Overlay diagram of oil and gas saturation obtained from migration and accumulation simulation and reserve area distribution in Ordovician in platform area of Tarim Basin. (a) Superimposition of boundary lines (green lines). (b) Area superimposition.
Potential area prediction
Hydrocarbon migration and accumulation simulation reveals the undiscovered oil and gas resource potential distribution area, i.e., the red accumulation area with high saturation outside the reserve area.
Predicted potential area A. The major targets are fault-karst reservoirs in Aman transition zone and include the fault-karst bodies near Well Shunnan 3 and Well Shunbei 4, in the northeast of Well Manshen 8, and in the northwest of Well Gulong 2 (Figure 17(b)). In such areas, risk exploration is mainly carried out to find relatively high parts for the possible formation of structural traps and flat areas for lithologic traps in fault-karst bodies. Predicted potential area B. The major targets are karst reservoirs in uplifts and bulges and include karst zones in the southwest of Tazhong uplift and the northwest of Tabei uplift (Figure 17(b)). In such areas, rolling edge exploration is mainly carried out to find the relatively high part of the karst zone for possible formation of structural traps and gentle slopes for possible sealing of fault-karst bodies.
Geological understanding
Ordovician oil and gas are from the Yuertusi Fm source rocks below, and the discordogenic faults provide vertical oil and gas migration paths. There are both vertical and lateral migration in the fault zone.
In the high parts of uplifts and bulges, oil and gas accumulation is controlled by the faults and the lithology distribution of the karst body.
In the slope area of Aman transition zone, the lithologic trap is formed by local heterogeneous lithologic sealing (slump, etc.) in the fault-karst body, and the fault-karst reservoirs are formed after oil and gas charging in the trap. The formation mechanism and reservoir morphology are similar to those of barrier lake. Isolated karst bodies can also form lithologic reservoirs, such as in Fuman area. Continuous karst bodies are not likely to form lithologic reservoirs in areas with a large slope, such as in the platform edge belt on the west side of Mangar sag.
In the low part of Aman transition zone, oil and gas are migrated to the high part of the slope due to the effects of buoyancy, and it is not likely to accumulate. Nevertheless, hydrocarbon accumulation can be realized in some isolated fault-karst bodies.
Conclusions
The Yuertusi Fm source rock has the best quality among China's discovered Cambrian source rocks, and its hydrocarbon generation center is in Shunbei area where the hydrocarbon generation volume exceeds 5000 × 108 t. In Ordovician carbonate reservoirs, matrix pores are not developed, and reef-beach karst reservoirs and fault-karst reservoirs are relatively developed, but the distribution of these effective reservoirs is highly heterogeneous. Dissolved vugs and caves provide major spaces for oil and gas storage, and faults and fractures provide important channels for hydrocarbon migration. There are multiple charging periods during Ordovician hydrocarbon accumulation, and the most important charging occurs in Hercynian period.
There are different oil and gas migration models in different structural positions. (I) In uplift and bulge areas, lateral oil and gas migration is dominant, and convergence occurs in the migration process. (II) In the slope area such as the relatively high part of Aman transition zone, oil and gas are migrated vertically and laterally, the flow lines are mainly green lines with low rate, and red lines with high rate mainly occurs in Fuman area. (III) In the lower part such as the relatively low part of the northern depression, oil and gas in the fault-karst body are mainly migrated in the vertical direction, and some oil and gas are migrated laterally. The flow line is basically the green line with low rate.
Simulation shows the following results. In the known reserve areas, the coincidence rate of simulated accumulation area and reserve area is more than 80%, which confirms the reliability of simulation. In the undiscovered reserve area, the predicted accumulation area covers about 50% of discovered reserve area, indicating a large resource potential. In the predicted accumulation area, the saturation is generally lower than that in the reserve area, and there is relatively scattered oil and gas distribution and little continuous scale accumulation, indicating a relatively poor economy of undiscovered resources.
The predicted potential area A includes the fault-karst bodies near Well Shunnan 3 and Well Shunbei 4, in the northeast of Well Manshen 8, and in the northwest of Well Gulong 2, etc. In such areas, risk exploration is mainly carried out to find relatively high parts for possible formation of structural traps and flat areas for lithologic traps in fault-karst bodies. Potential area B includes karst zones in the southwest of Tazhong bulge and the northwest of Tabei uplift. In such areas, rolling edge exploration is mainly carried out to find the relatively high part of the karst zone for possible formation of structural traps and gentle slopes for possible sealing of fault-karst bodies.
Footnotes
Nomenclatures
Funding
The authors received no financial support for the research, authorship, and/or publication of this article.
Declaration of conflicting interests
The authors declared no potential conflicts of interest with respect to the research, authorship, and/or publication of this article.