
Abstract
Increased overpressure from tectonic compression stress (IOTCS) plays a key role in rock deformation, seismic activity, and hydrocarbon migration in sedimentary basins. However, the coupled evolution of stress, strain, and pressure during IOTCS remains unclear. The key parameters in existing quantitative evaluation methods of IOTCS are difficult to obtain accurately. Tectonic compression deformation occurs in three stages: volumetric strain, distortion, and rupture, with IOTCS primarily in the first two stages. We developed a constitutive effective stress model for the Coulomb failure stage, combined with plane stress field simulations, to quantitatively calculate IOTCS. This clarifies the stress–strain–pressure coupling process, and provides a quantitative evaluation model with high applicability and accuracy. Applied to the Dabei Gas Field, the results show: (a) IOTCS ranges from 80 to 220 MPa with a 6% relative error compared to aqueous inclusions pressures, indicating high accuracy; (b) IOTCS limits shear fracture development, leading to high fracture density in low fluid pressure zones; and (c) IOTCS increases the driving force for hydrocarbon migration by 1.8 to 2.1 times compared to non-IOTCS conditions.
Introduction
Increased overpressure from tectonic compression stress (IOTCS) is widespread worldwide. It plays a crucial role in controlling the fault activity, rock deformation, seismic activity and fluid properties in rocks (Flemings and Saffer, 2018). Additionally, it influences the migration and accumulation of oil and gas by altering the driving force of oil and gas charging, the physical properties of the reservoir, and the morphology of the traps (Zeng et al., 2010).
Many geologists, including petroleum geologists, pay much attention to estimation of the IOTCS (Bai et al., 1998; Bredehoeft et al., 1994; England, 1987; Grauls and Baleix, 1994; Odaama, 1986; Perrodon, 1992; Sun et al., 1998, 2000; Tan et al., 2001; Thomas et al., 2001; Wang et al., 2004, 2005a, 2005b, 2006; Wu and Wang, 2006). The evaluation methods can be classified into three categories, the first is the equivalent depth method (EDM) (Wang et al., 2022), the second is the terrane sealing coefficient method (TSCM) (Zeng et al., 2010; Zhang et al., 2011), the third is the forward basin modeling (Luo, 2004; Obradors-Prats et al., 2016, 2017). It is well known that the EDM is only accurate in basins where vertical compaction or disequilibrium overpressure. However, when other mechanisms, such as tectonic compaction, chemical compaction or fluid expansion overpressure are involved, the method tends to fail, often leading to an underestimation of overpressure (Swarbrick, 2002). The error in the EDM prediction can reach up to 11 MPa at 3.5 km, as shown by numerical simulations.
The TSCM describes the extent of sealing within the terrane. In a completely sealed terrane, the sealing coefficient is 1, meaning all stress is converted into pore pressure. In a fully open system, the coefficient is 0, indicating that stress cannot be converted into pore pressure. In an incompletely sealed system, the coefficient ranges from 0 to 1, with part of the stress converting into pore pressure (Zeng et al., 2010). The terrane sealing coefficient is 0.76 under the gypsum-salt by Zeng et al. (2010), and 0.721 by Zhang et al. (2011) of Kelasu thrust belt in Kuqu Depression. This method is to some extent subject to subjective factors, and the coefficient will be further revised as the geological background is better understood.
Forward basin modeling based on advanced constitutive models enables numerical simulations of the generation and dissipation of multi-origin overpressure in complex stress environments (Obradors-Prats et al., 2017). These models account for the impact of horizontal stress on compaction and the generation and coupling of different types of overpressure (Albertz and Lingrey, 2012; Luo et al., 2012; Nikolinakou et al., 2012; Smart et al., 2012; Thornton and Crook, 2014). However, it is important to note that these numerical models do not consider the development of deformation structures caused by tectonic activity (Luo, 2004; Obradors-Prats et al., 2017). As a result, the effects of folds and thrusts on sediment properties and pore pressure are not accurately captured, which may lead to significant inaccuracies in pore pressure estimates in tectonically active environments.
The aforementioned studies into IOTCS have made great progress. However, with the deepening of exploration and research, the existing evaluation method of IOTCS has been unable to meet the demand, and an accurate, mature and highly applicable quantitative evaluation method is urgently needed. To solve the problems, this study focuses on the Dabei Gas Field in the Kuqa Depression as a representative case, where overpressure is widely developed with pressure coefficients ranging from 1.5 to 1.8, primarily attributed to tectonic compression and pressure transfer mechanisms. These overpressure conditions have significant implications for hydrocarbon accumulation, as evidenced by Guo et al. (2016) who demonstrated that intense tectonic compression induced thrust fault reactivation, creating crucial migration pathways for hydrocarbons. Building upon these findings, this article proposes a constitutive effective stress models in Coulomb failure stage can be employed in conjunction with technology mature and accurate plane stress field simulation to quantitative calculate IOTCS. Further, exploring its impact on reservoir and oil-gas migration.
Geological setting
Tectonic setting
The Kuqa Depression is located in the northern part of the Tarim Basin (Jia, 2004; Figure 1a, b). It can be laterally divided into four structural belts and three sags: the Northern Monocline Belt, the Kelasu–Yiqikelike Thrust Belts, the Wushi–Baicheng–Yangxia sags, the Qiulitage Thrust Belt, and the Southern Slope belt (Song et al., 2008; Figure 1c). The Dabei Gas Field is located in the western part of Kelasu Thrust Belt (Zhang et al., 2011, 2024; Figure 1c). Vertically, the structural deformation beneath and above the gypsum-salt beds was disharmonic (Chen et al., 2004; Tang et al., 2004). The upper structures, influenced by the gypsum-salt beds, are primarily characterized by thrust faults and fault-related folds. In contrast, the lower structures consist mainly of imbricated thrust slices within the Mesozoic strata and are less affected by gypsum-salt beds (Figure 1e) (Chen et al., 2004; Liu et al., 2000; Tang et al., 2004). The faults are all generally trending in a northeast to east-northeast direction, with fault planes dipping to the north. The faults terminate downward in the Jurassic coal-bearing formations and upward in the Cretaceous, disappearing within the Kumugeliemu gypsum-salt layer (Figure 1e).
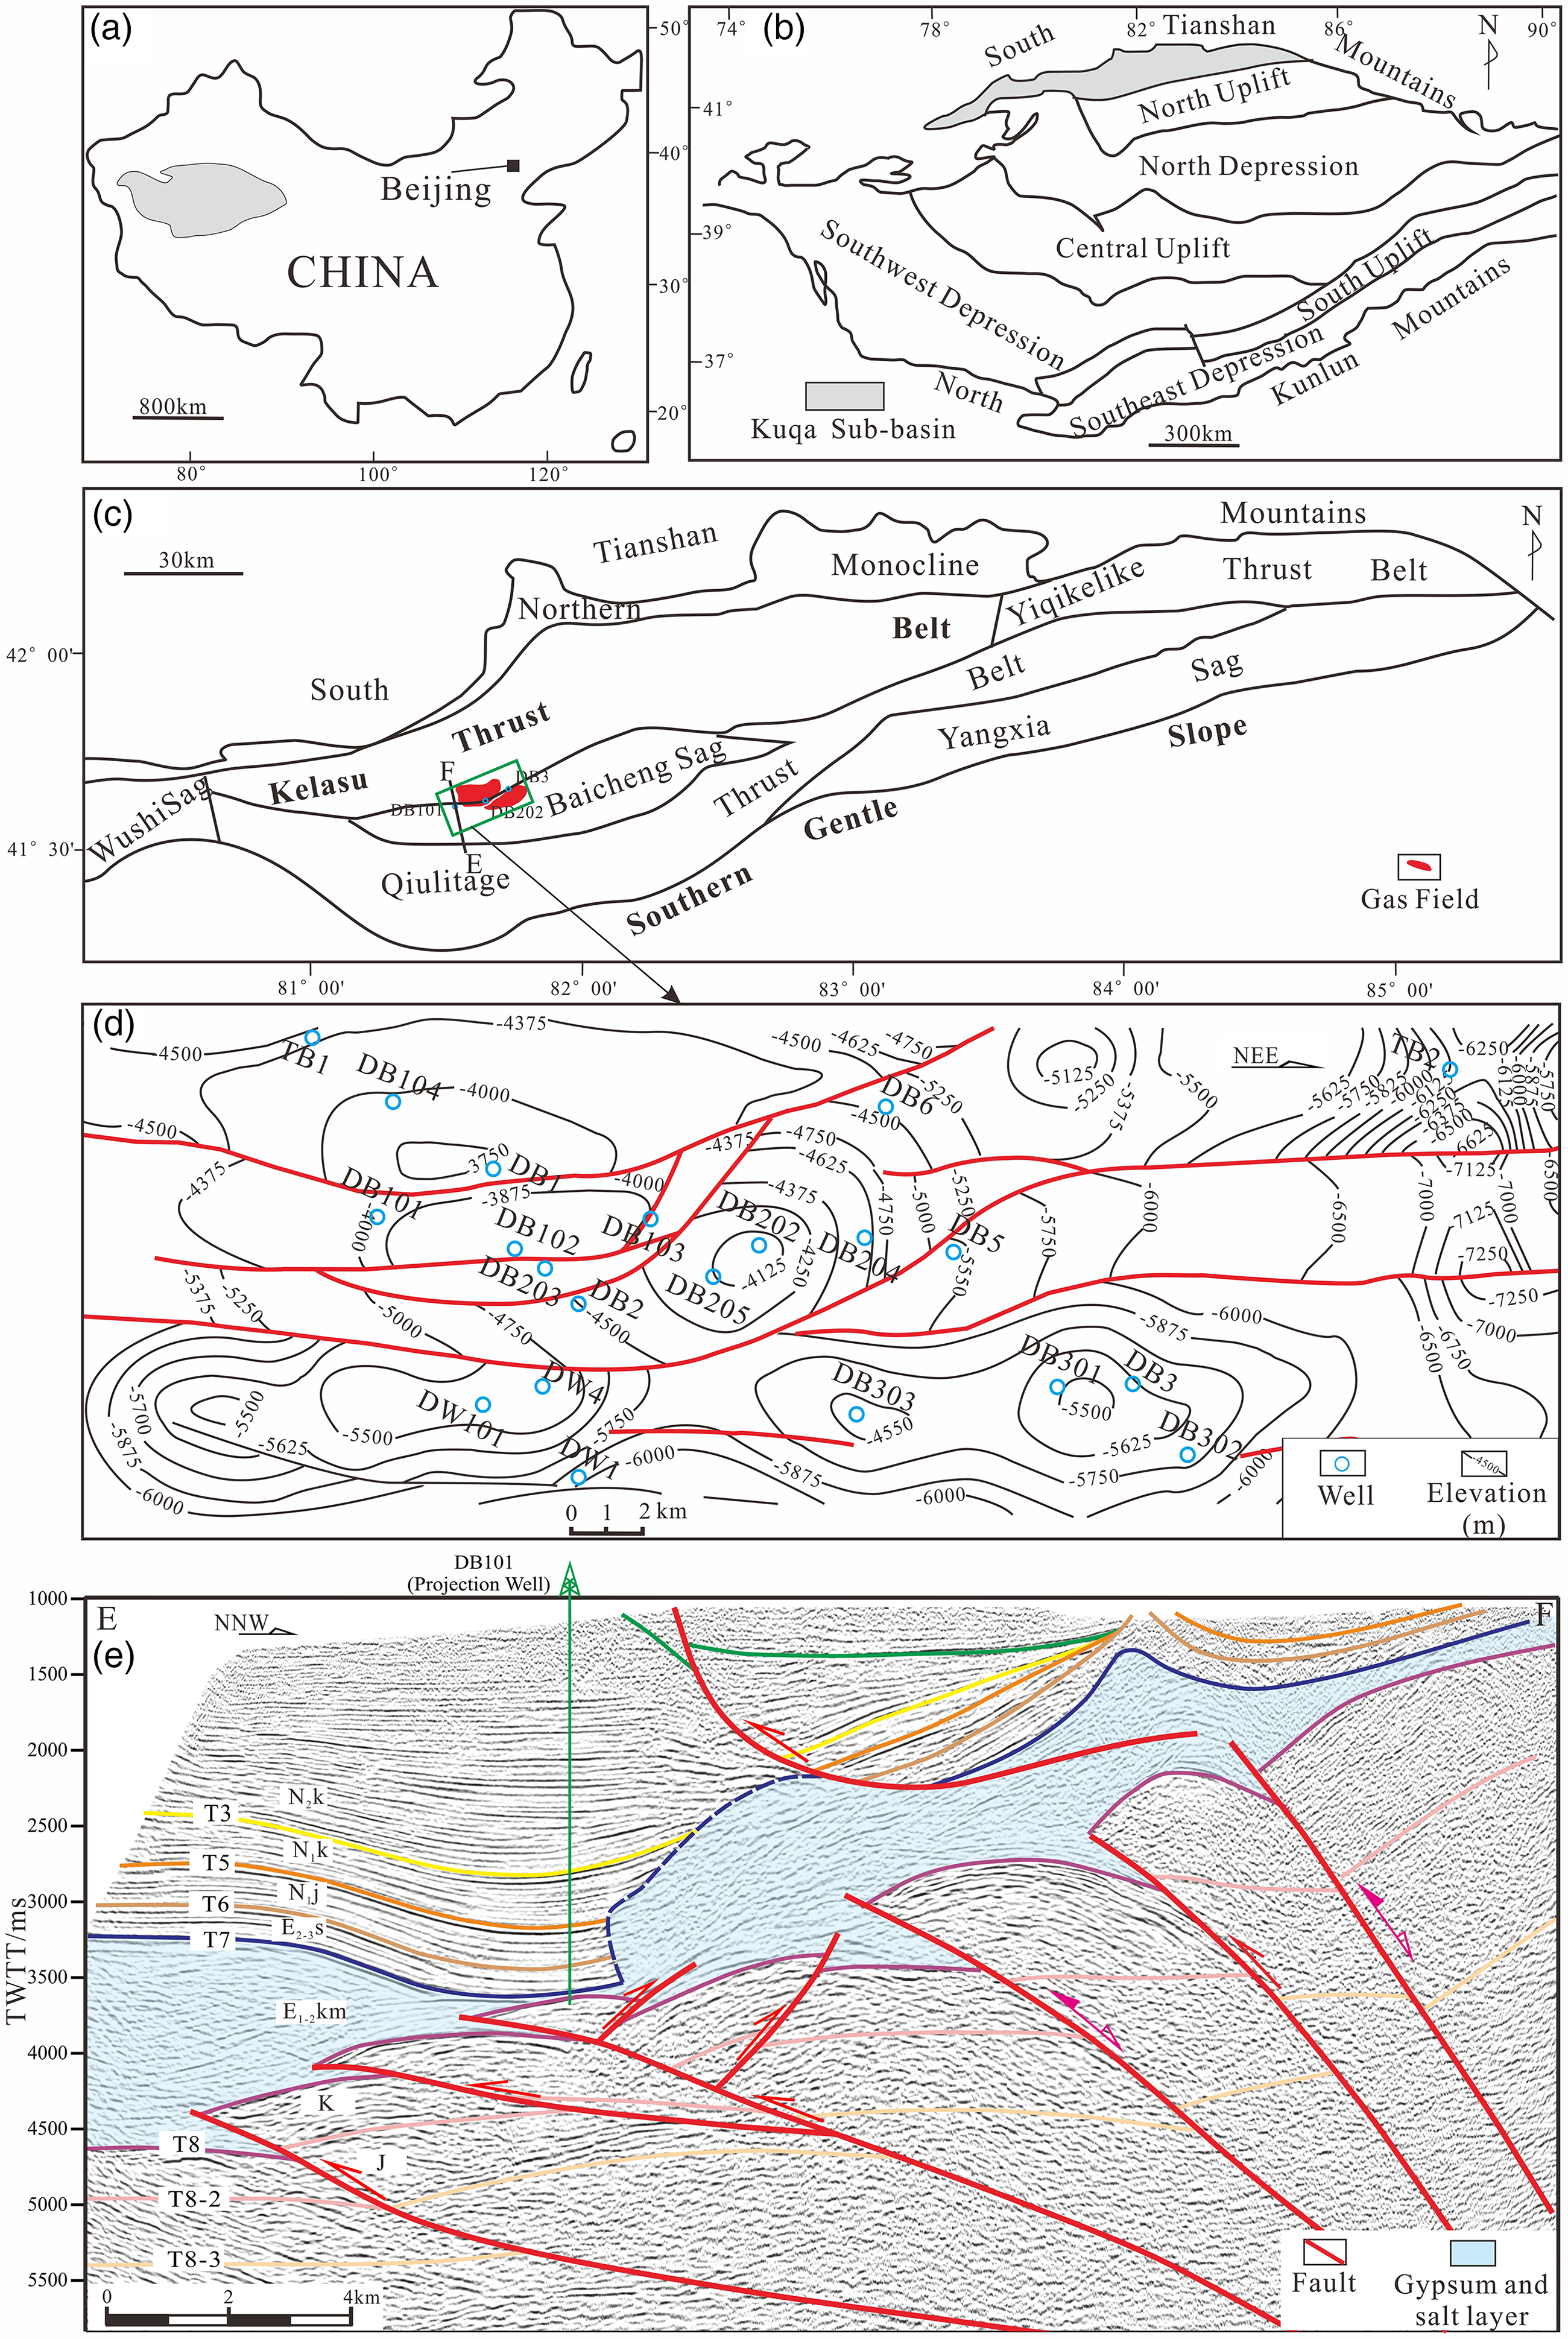
(a) Location of the Tarim Basin in China. (b) The tectonic location of the Kuqa Depression in the tectonic units of the Tarim Basin (after Jia, 2004). (c) The tectonic subunits of the Kuqa Depression, locations of the Dabei gas field, the studied wells and the section EF (after Guo et al., 2016). (d) The top surface structural map of Formation Bashijiqike (K1bs). (e) Structural cross-section EF (Qi et al., 2013). J = Jurassic Systerm, K = Cretaceous System, E1−2km = Kumugeliemu Formation in the Paleocene—Eocene, E3s = Suweiyi Formation in the Oligocene, N1j = Jidike Formation in the Miocene, N1k = Kangcun Formation in the Miocene, N2k = Kuche Formation in the Pliocene, and Q = Quaternary.
Structural evolution
The Kuqa Depression has undergone three evolutionary stages: the early stage, a Late Permian–Triassic peripheral foreland basin stage; the mid-stage, a Jurassic–Paleogene extensional basin stage; and the late stage, a Neogene rejuvenated foreland basin stage (Graham et al., 1993; Jia, 2004; Liu et al., 2022; Lu et al., 1997).
Under the influence of the Southern Tianshan Mountains, the initial tectonic deformation occurred in the northern part of Kuqa Depression during Early Miocene, forming the northern monocline belt. In the Late Miocene, the tectonic deformation front continued to advance, leading to formation of the Kelasu–Yiqikelike structural belt. By the Early Pliocene, the Qiulitage structural belt began to form. In the Late Pliocene, the uplift of Tianshan Mountains accelerated, the crust underwent shortening, and the original tectonic belts were further consolidated, resulting in significant erosion (Li et al., 2012; Tang et al., 2004). During the Quaternary period, a large amount of sediments was deposited in structurally low parts of the Kuqa Depression (Li et al., 2012).
Characteristics of the petroleum geology
The Kuqa Depression formed through discontinuous clastic deposition from the Triassic to Quaternary (Jia, 2004; Figure 2). The primary hydrocarbon source rocks for Dabei Gas Field are coal seams in the Middle Jurassic Kezilenuer Formation and lacustrine mudstones in the Upper Triassic Huangshanjie Formation (Jia and Li, 2008; Figure 2). The main reservoir of Dabei Gas Field consists from the Low Cretaceous Bashijiqike (K1bs) Formation (Figure 2). The regional caprock in the Kelasu Thrust Belt consists Paleogene Kumugeliemu (E1−2km) thick salt and a gypsum unit, ranging from 110 to 3000 m (361–9843 ft) in thickness. This caprock plays a crucial role in preserving hydrocarbons and overpressures within both Cretaceous and Paleogene formations. Fault-related folds are the key zones for gas accumulations in Dabei field, with the top tight sandstone unit of the K1bs formation serving as primary reservoir (Guo et al., 2016; Wang et al., 2018, 2023).
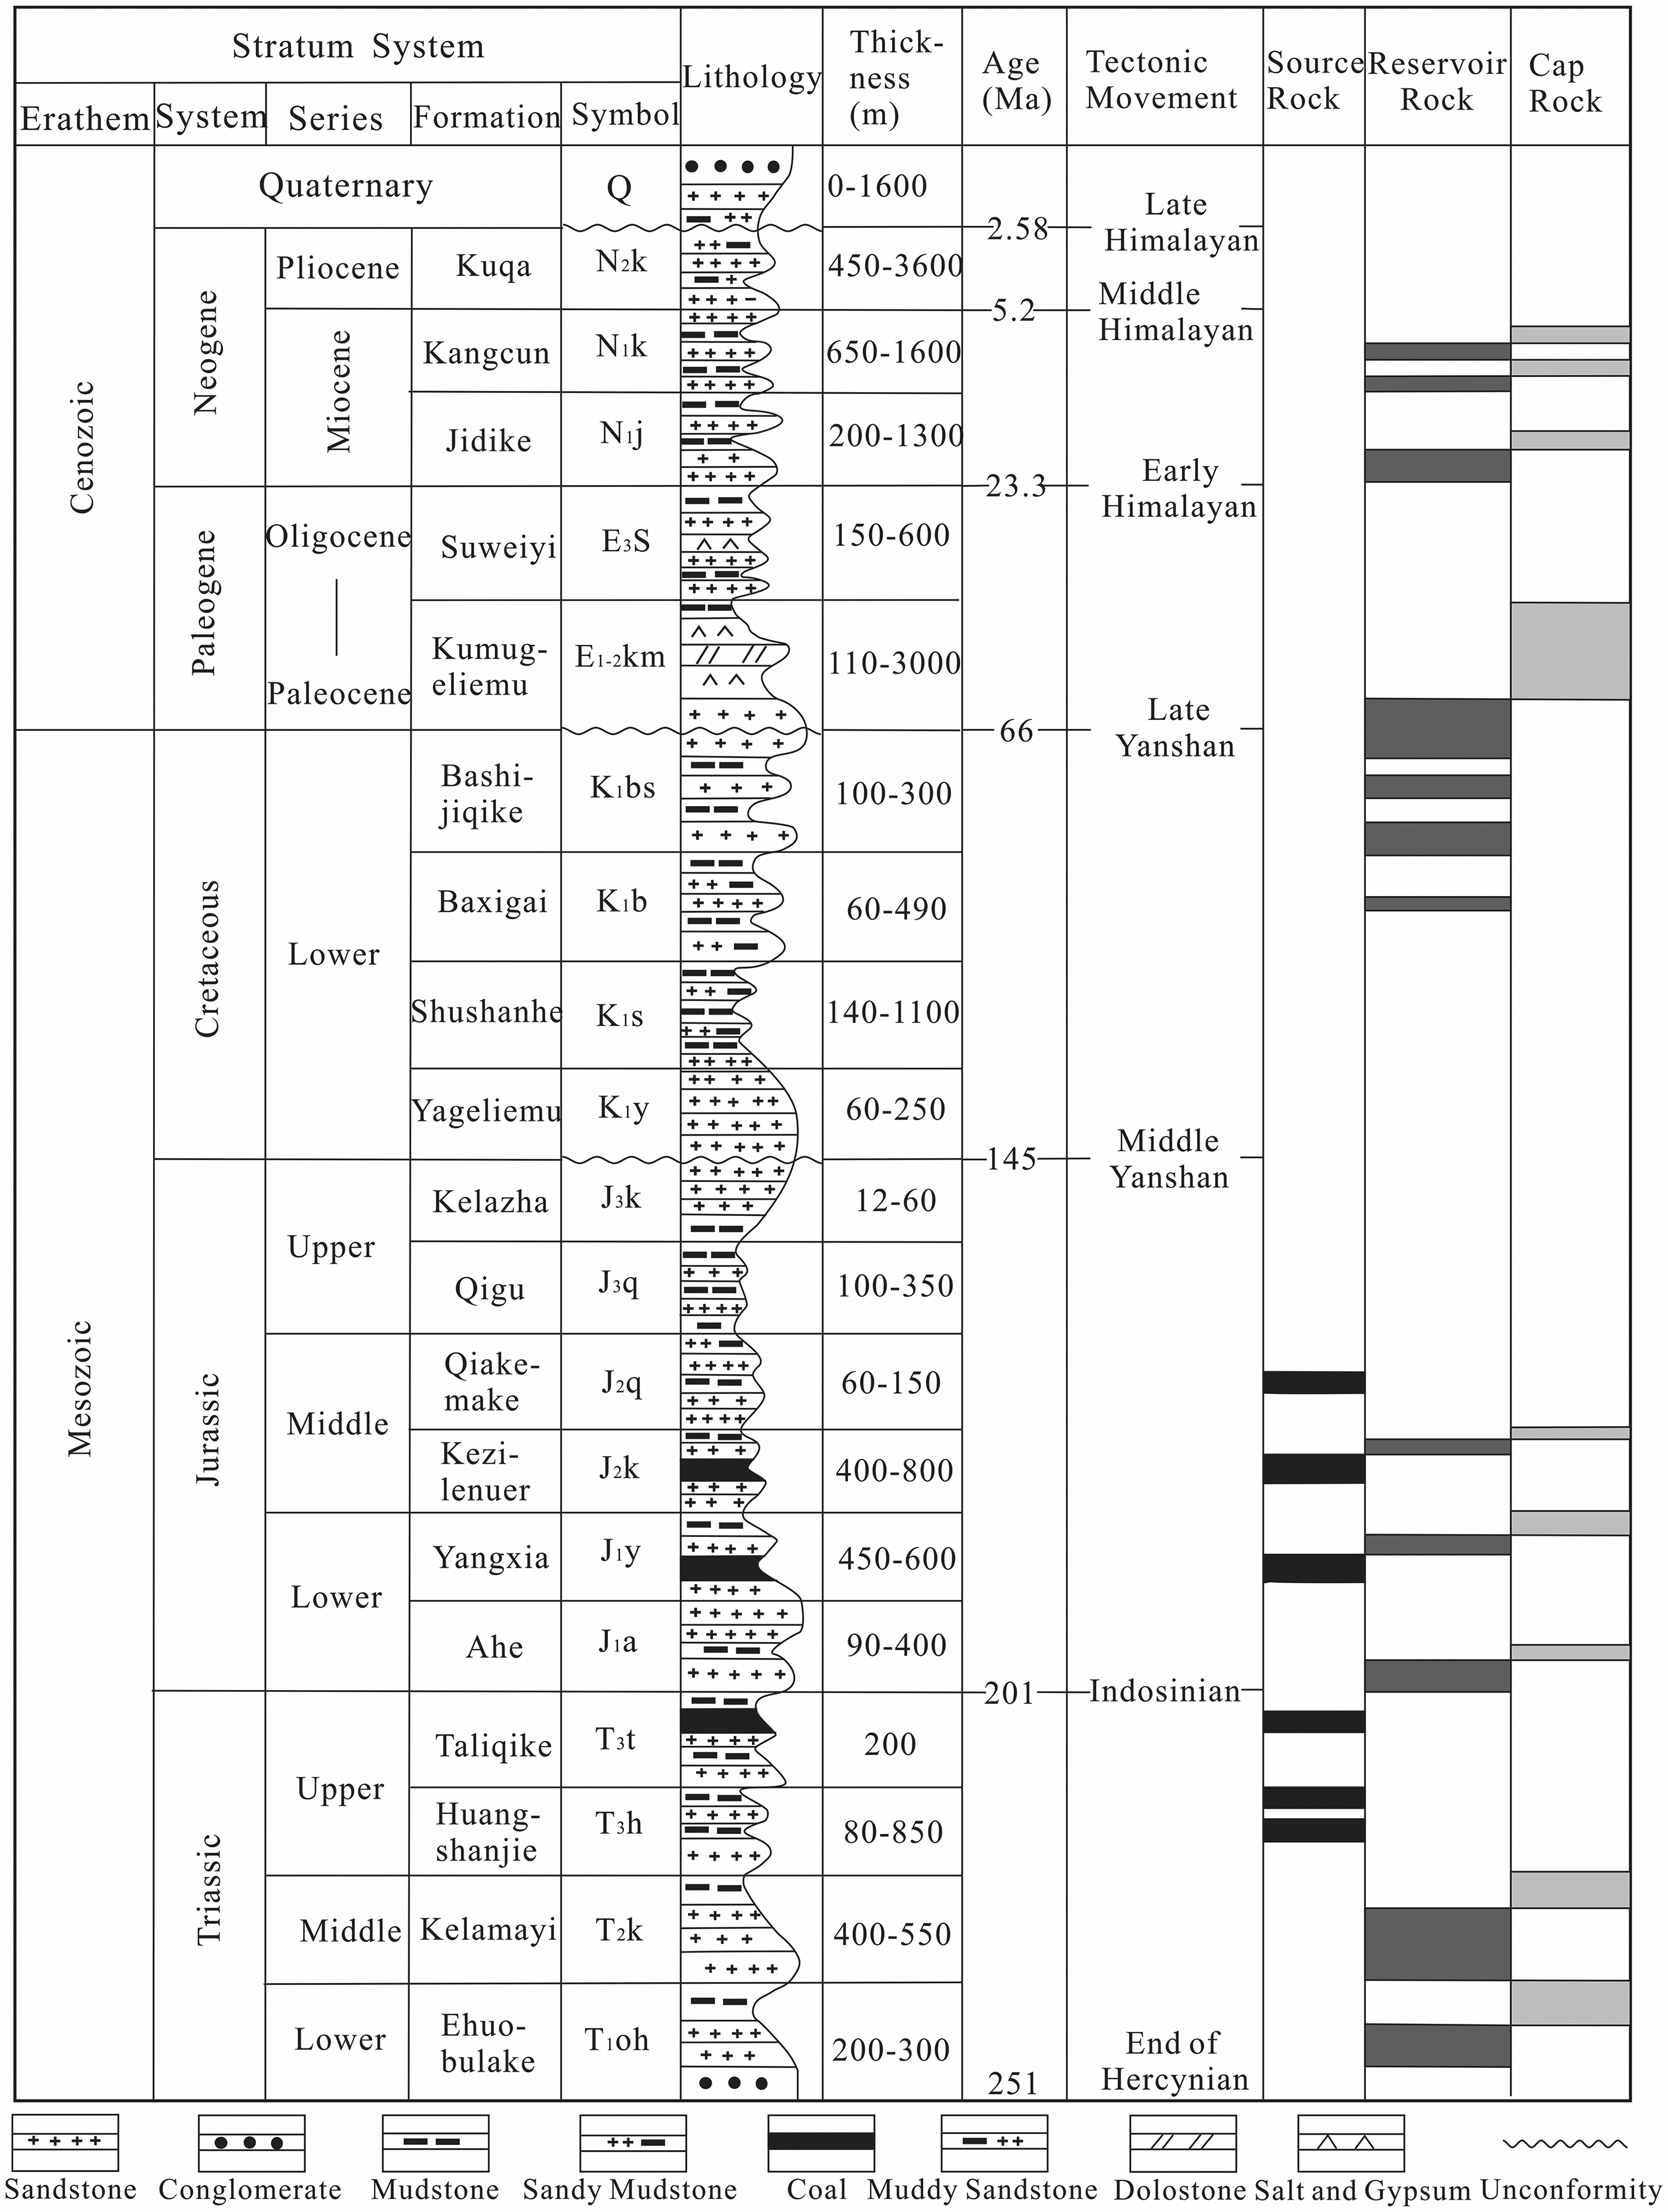
Lithostratigraphy, tectonic evolution and the elements of major petroleum system in the study area (after Guo et al., 2016; Jia, 2004).
According to hydrocarbon charge history study (Sun et al., 2018), two stages of hydrocarbon charging occurred: the first stage involved condensate oil charging (6–4 Ma), and the second stage involved natural gas charging (3–0 Ma). The structural traps were primarily formed at the end of Miocene (5.2 Ma), providing favorable conditions for gas and oil accumulation (Tang et al., 2004). The strong correlation between natural gas generation, trap formation, and hydrocarbon migration contributed to formation of large oil and gas fields, such as the Dabei Gas Field.
Pore pressure characteristics at the present day
In this study, 52 Drill Stem Test (DST) pressure data points were obtained in the Dabei Gas Field to examine overpressure characteristics. A reservoir is considered to be overpressured if pressure coefficient exceeds 1.2 (Guo et al., 2010). The pressure-depth plots clearly show high overpressure with pressure coefficients reaching up to 1.8 (Figure 3). Most of measured pressure coefficients range from 1.5 to 1.6, corresponding to pore fluid pressures between 87.3 MPa and 123.5 MPa in the depth interval from 4992 m to 7398 m (Figure 3).
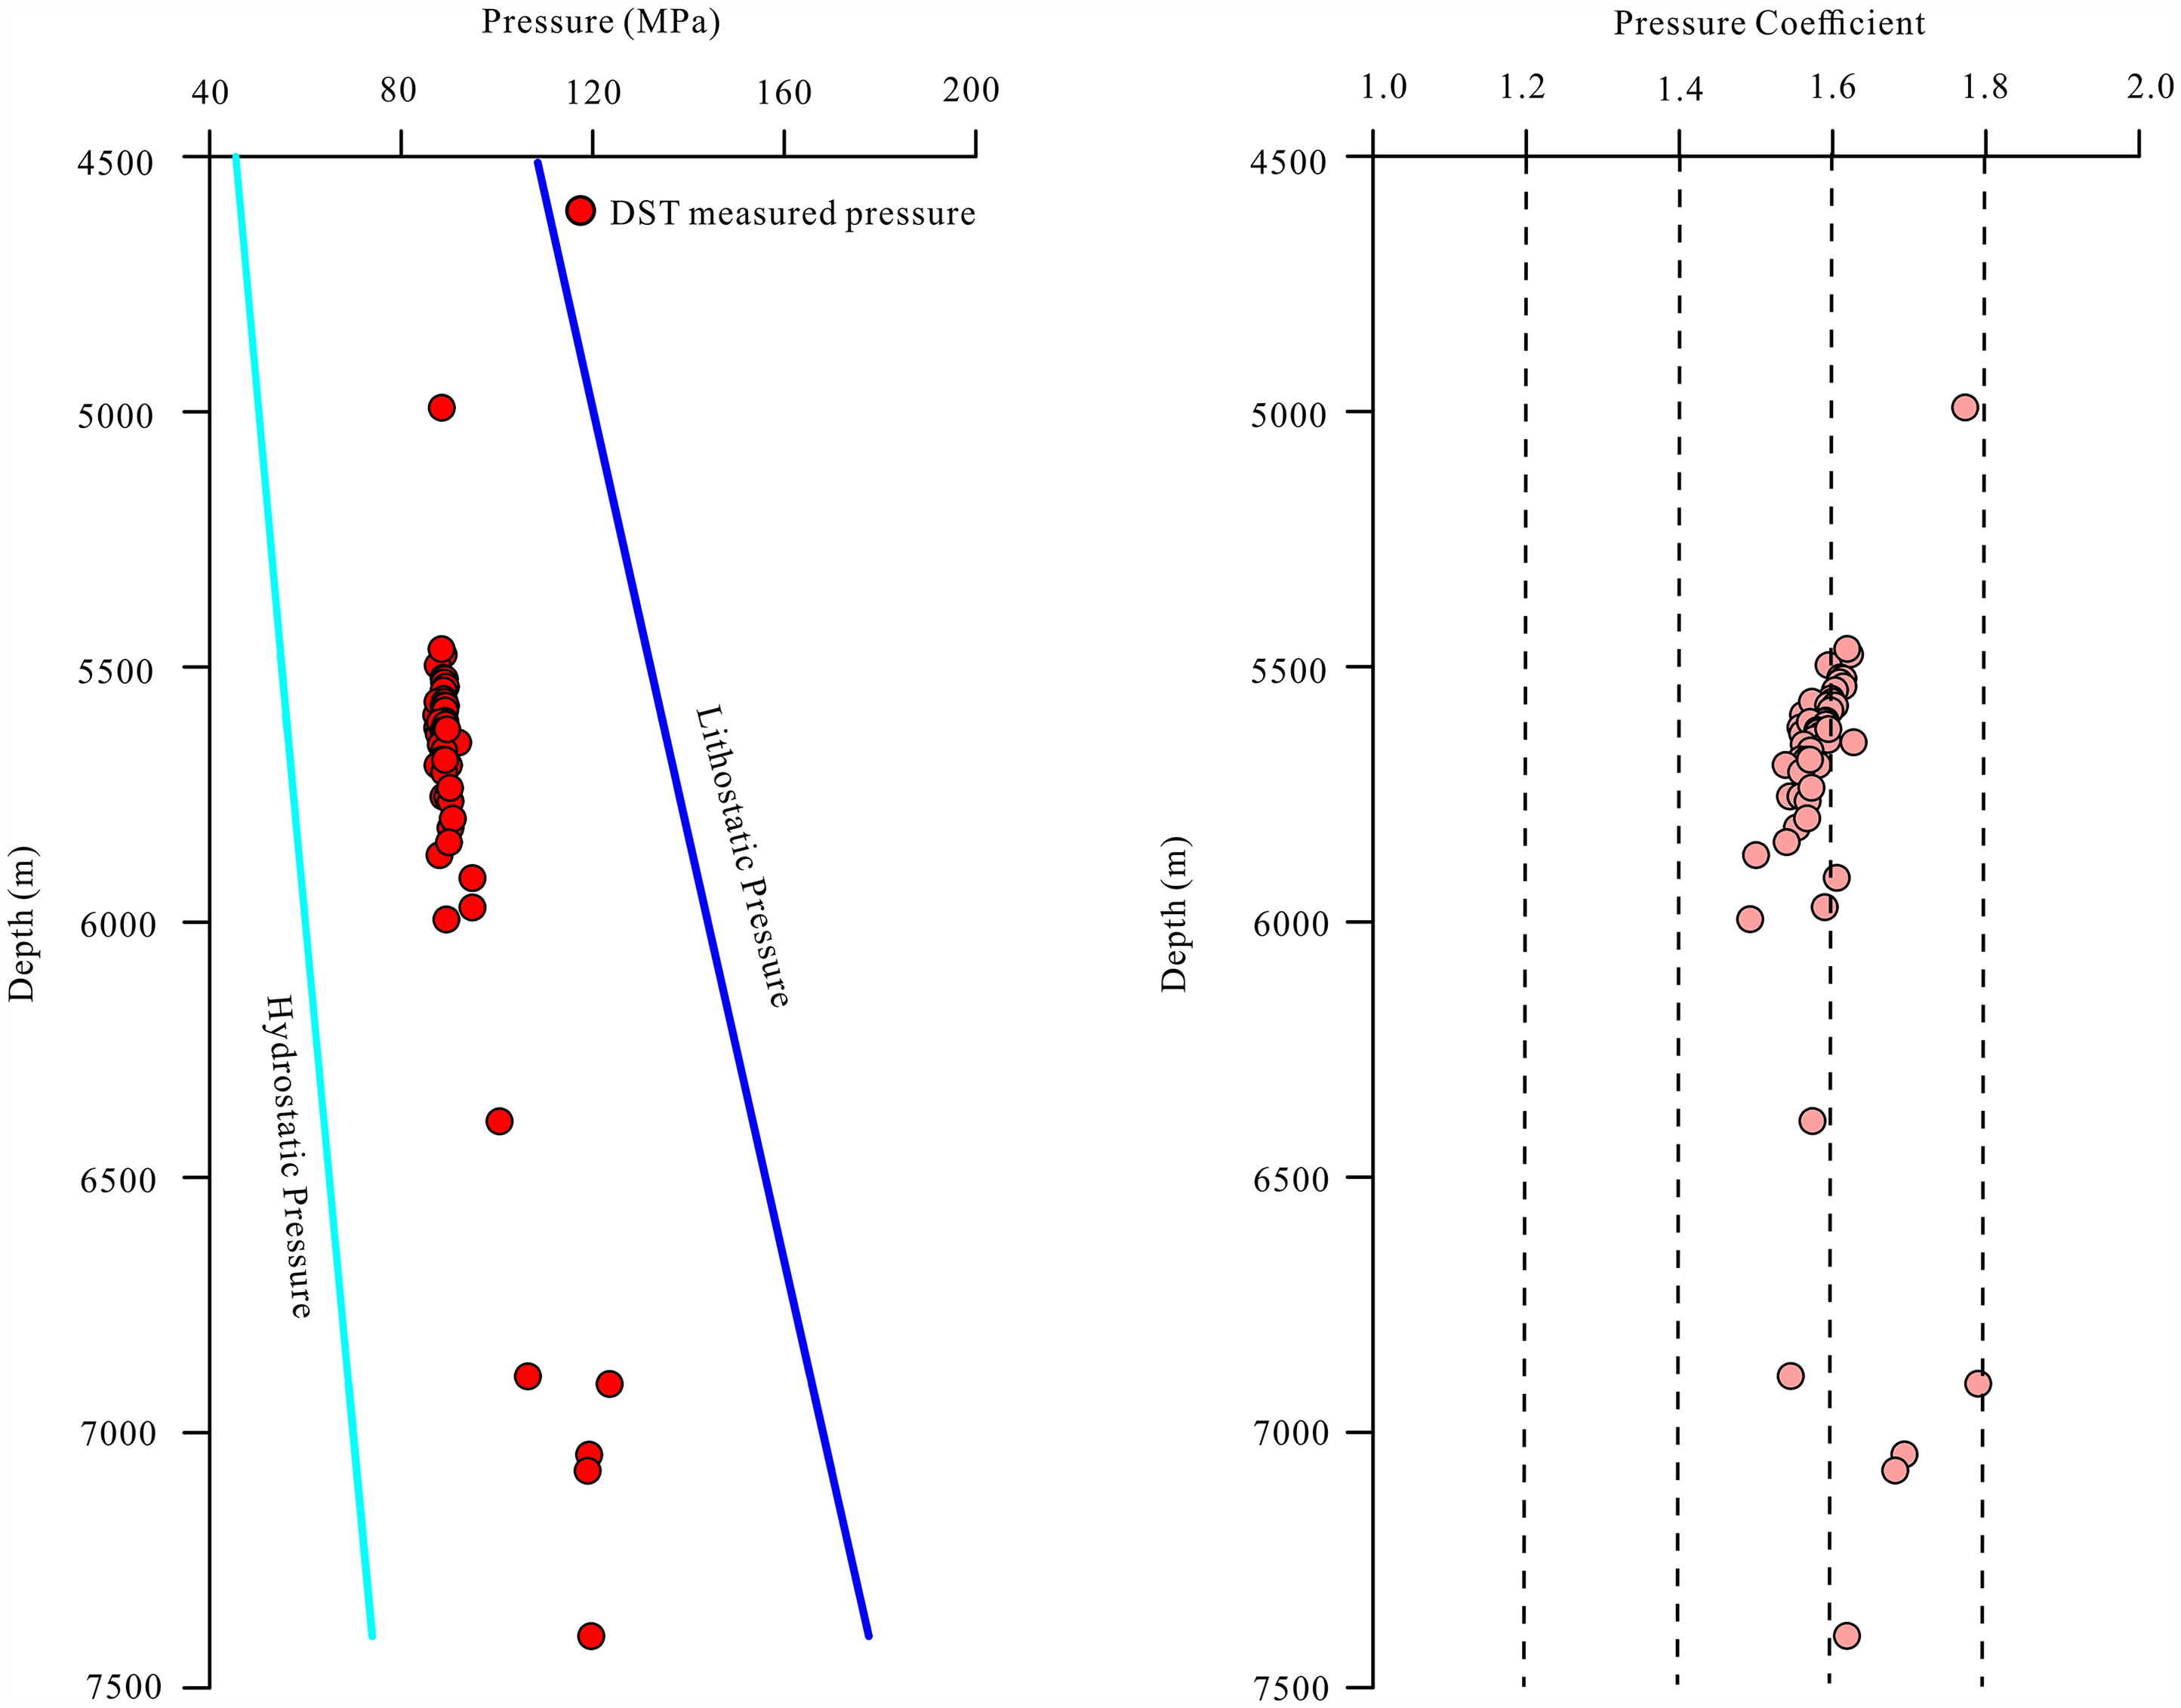
Plots of pressures and pressure coefficients vs. depths for Dabei gas field in the Kelasu Thrust Belt of Kuqa Foreland Basin. The hydrostatic pressure (9.8 MPa/km) is the continuous column of static water fluid and the lithostatic pressure (25 MPa/km) is the overburden stress.
By well-log responses and comprehensive analysis of geological conditions, overpressures in mudstones of Dabei Gas Field can be generated by horizontal tectonic compression and compaction disequilibrium, the former is main overpressure mechanism (Guo et al., 2016). In sandstones, overpressure is primarily generated by horizontal tectonic compression, with pressure transfer from hydrocarbon charge acting as a secondary mechanism (Guo et al., 2016).
The model of quantitative evaluation of IOTCS
Geomechanical model for IOTCS
In this article, we consider the assumptions: the tectonic loading is approximately horizontal. Based on the numerical simulations of the rock deformation process (Wang et al., 2010), and theoretical analyses of pore pressure and stress field evolution, the IOTCS in a semi-close sedimentary basin system can be categorized into three stages.
Stage 1. Pressurization during volumetric strain. During the initial period of stage 1, the maximum principal stress is vertical stress and the minimum principal stress is minimum horizontal stress (represented by gray circle in Figure 4c). In case of tectonic compression, the maximum horizontal stress exceeded that observed during the maximum burial period, an additional tectonic compaction (a layer-parallel shortening) occurred that included both elastic and plastic diminution of pore, and fluid pressure increased (Figure 4a and d). As pore pressure increased, maximum and minimum effective stresses started to decrease. However, according to the model of Tingay et al. (2009), the high coupling ratio induced by the high overpressure can cause the minimum horizontal stress to increase and decrease in the minimum horizontal effective stress is smaller than maximum horizontal effective stress and vertical effective stress. Therefore, Mohr's circles shifted to the left accompanying the decreased diameter (represented by the blue solid arrow and the circle in Figure 4c). During the late period of stage 1, when the maximum horizontal stress exceeded the vertical stress, the maximum principal stress became the maximum horizontal stress. The minimum principal stress remained the minimum horizontal stress when increase in the minimum horizontal stress induced by the coupling of pore pressure and stress (Tingay et al., 2009) are relatively small. As the pore volume decreased and pore pressure increased, maximum effective stress increased and minimum effective stress decreased and Mohr's circles increased in diameter (represented by blue dotted arrow and circle in Figure 4c).
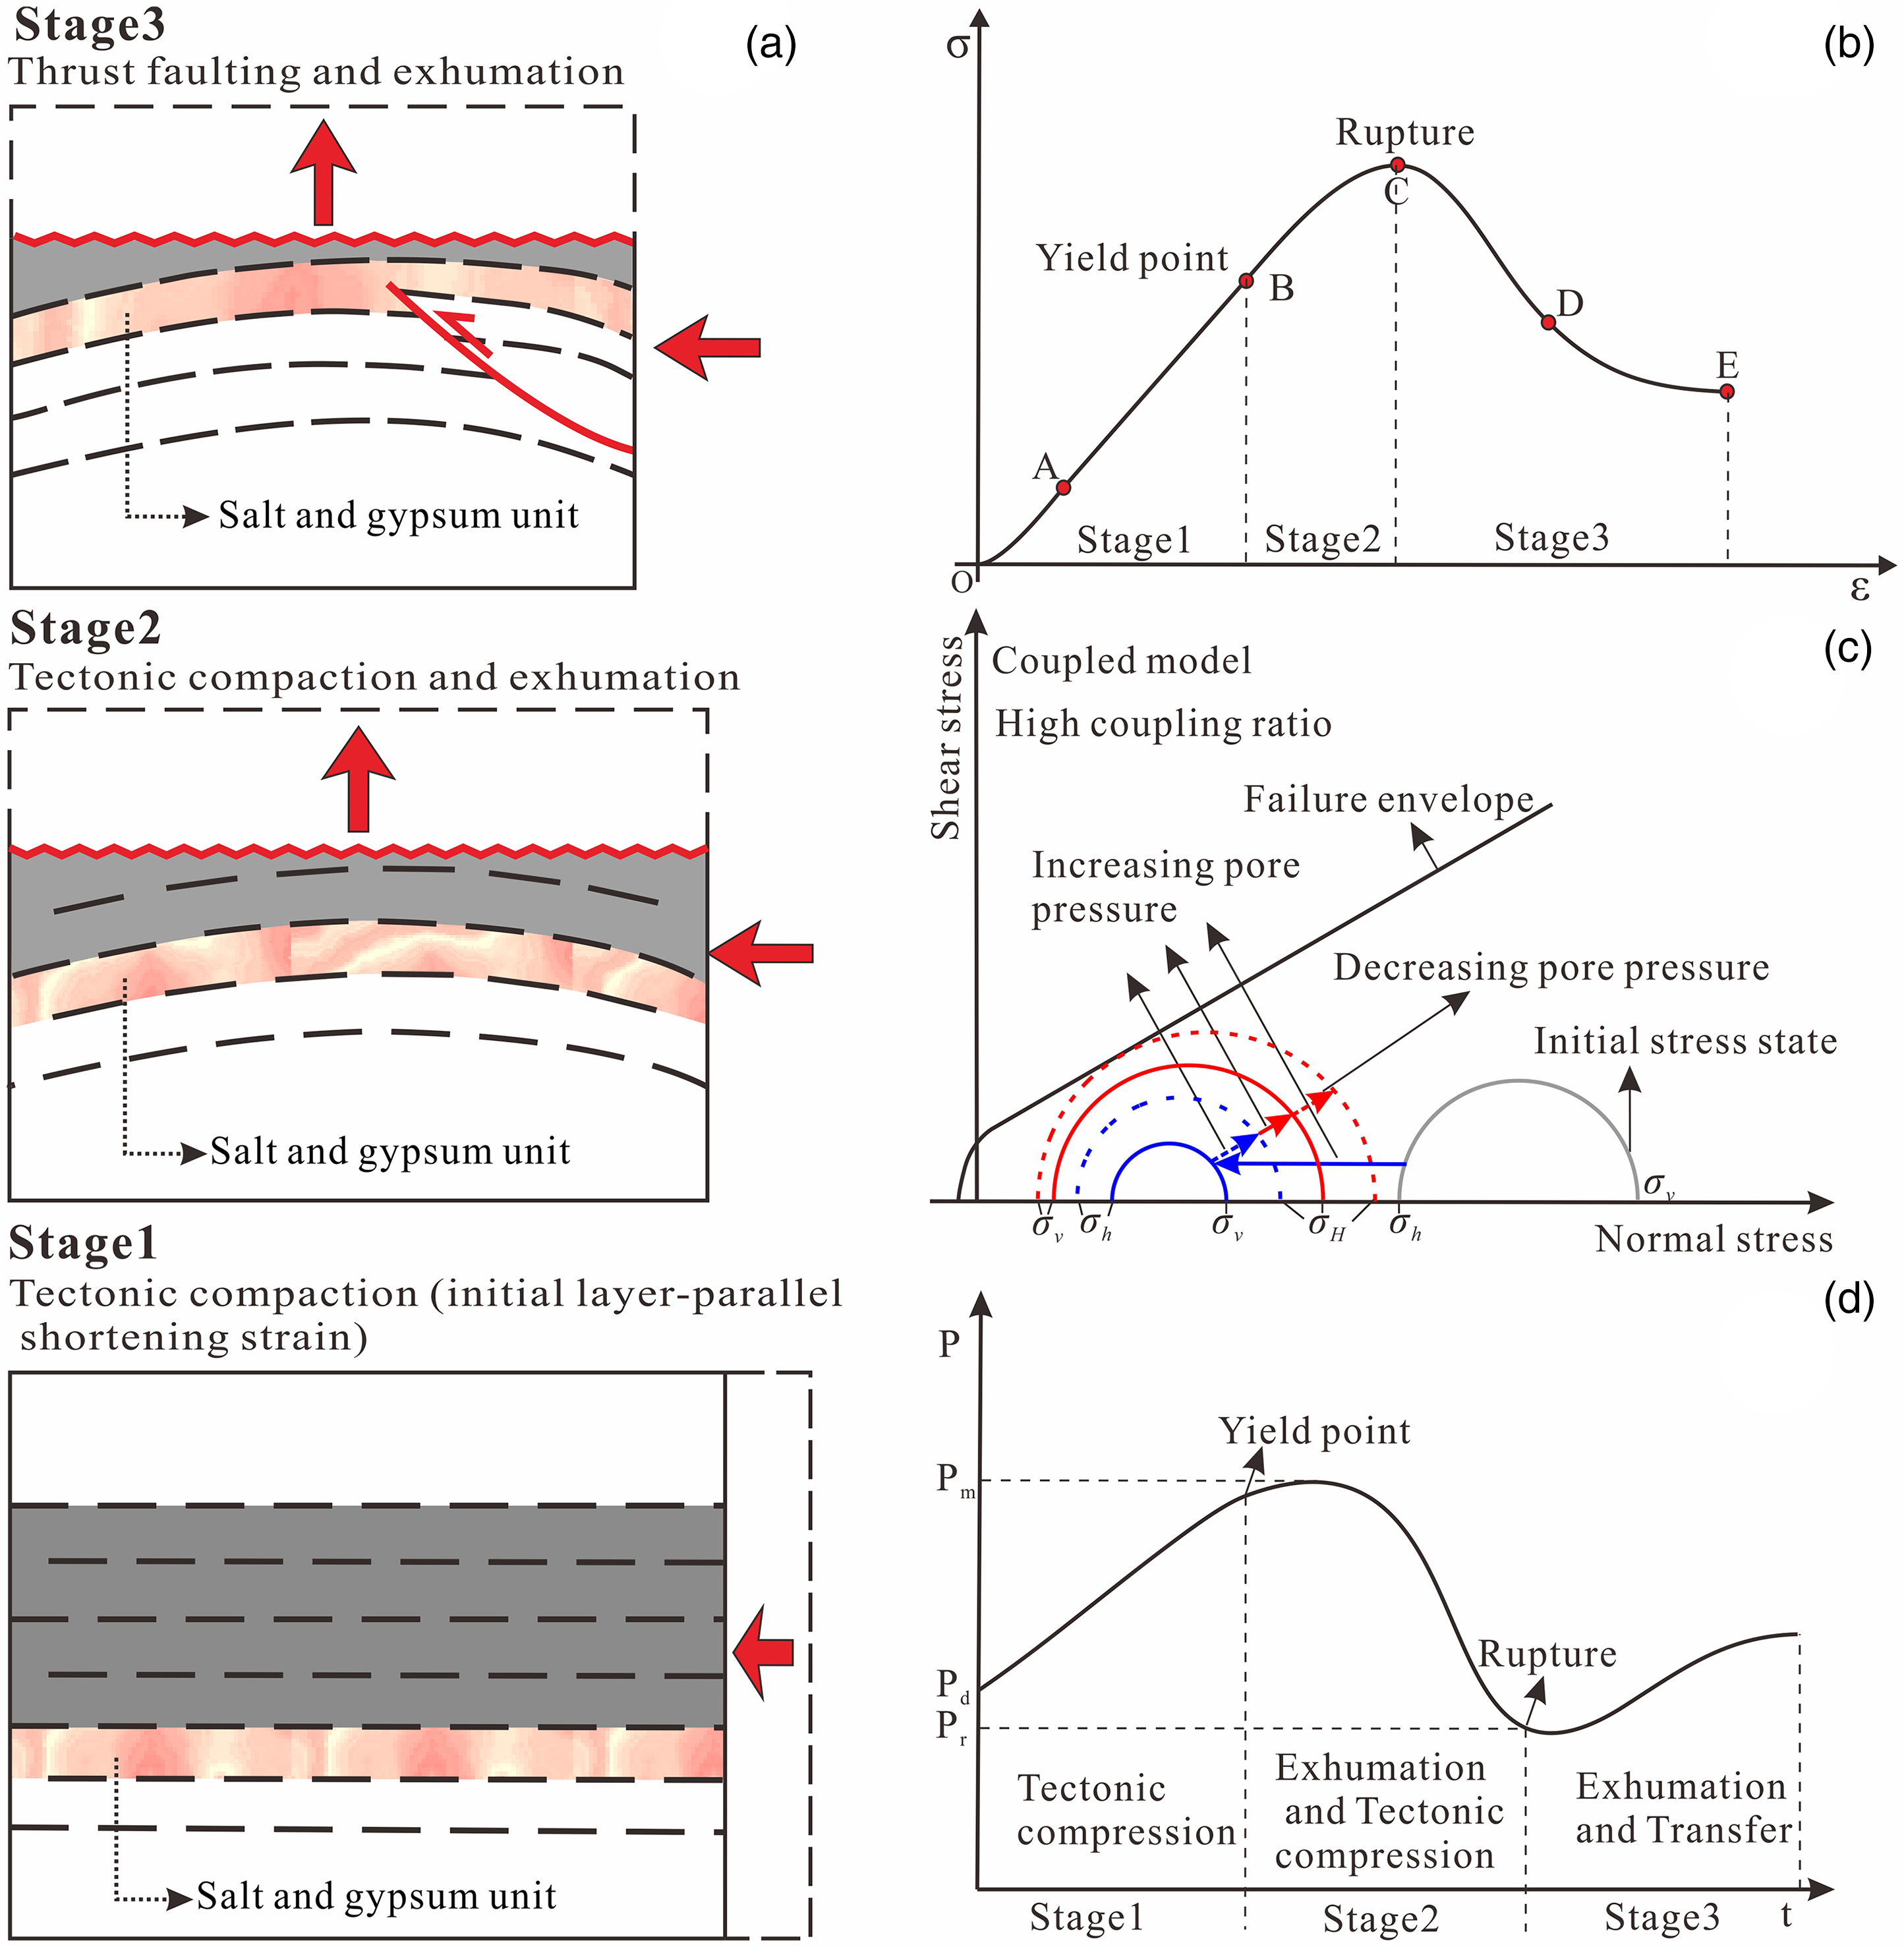
Geomechanical model for the coupling of tectonic stress and fluid pressure (so called increased overpressure induced by tectonic compression stress (IOTCS)). (a), The geological model of three stages of the tectonic compression. Stage 1: after maximum burial, additional tectonic compaction can reduce the porosity and yield a layer-parallel shortening. Stage 2: tectonic compaction indicated by folding and exhumation. Stage 3: brittle rupture occurs and forms thrust fault. (b) The stress–strain curve corresponding to the elastic–plastic deformation. (c) Model incorporating pore pressure–stress coupling (modified from Tingay et al., 2009). (d) The corresponding evolution of fluid pressure. Pd = fluid pressure at maximum burial period, Pm = maximum fluid pressure induced by IOTCS, Pr = fluid pressure at maximum folding period, δH = horizontal maximum effective stress, σh = horizontal minimum effective stress, and σv = vertical effective stress.
Stage 2. Pressurization during distortion. During this stage, the maximum principal stress remained the maximum horizontal stress, whereas the minimum principal stress became the vertical stress. Rocks mainly experienced distortion and exhumation that were both elastic and plastic change in shape of body without fracture (Figure 4a, b). The pore pressure was controlled by the tectonic loading and exhumation. When the tectonic compression dominated variation in pore pressure, the pore pressure continuously increased, however, the increment rate became slow because of the unloading induced by exhumation (Figure 4d). As the tectonic compaction developed and pore pressure increased, maximum effective stress continuously increased, whereas minimum effective stress decreased. Mohr's circles increased in diameter (represented by the red solid arrow and the circle in Figure 4c). When the exhumation dominated variation in pore pressure, the pore pressure started to decrease from maximum value (Figure 4d). The maximum effective stress continued to increase because of the continuous tectonic compaction and the minimum effective stress that was decreased by exhumation, which continuously increased the diameter of Mohr's circles (represented by the red dotted arrow and circle in Figure 4c).
Stage 3. Rupture and decouple. When Mohr's circles came in contact with the failure envelope, brittle rupture occurred and formed a thrust fault (Figure 4a, b). The maximum effective stress and pore pressure was released by thrust fault, and overpressure decoupled from the rock stress (Figure 4d). If the thrust faults connect the higher pore pressure formation downward and do not cut through the cap rock upward, which will increase the overpressure transferred in the strata by the thrust fault (Figure 4d).
Based on the aforementioned analysis, the IOTCS occurred mainly during stage 1 and stage 2, the release of maximum effective stress and transfer of overpressure by the thrust fault mainly occurred during stage 3 (Figure 4d). The pore pressure at the endpoint of stage 2 represents the final result increased by tectonic compression stress. At this point, the strata deformation (including volumetric strain and distortion) reaches its maximum, after which the system enters the fault slip stage. Therefore, we define the period when the rock reaches the point of rupture, which marks both end of stage 2 and beginning of stage 3, as the maximum folding period (MFP).
Mathematical model for IOTCS
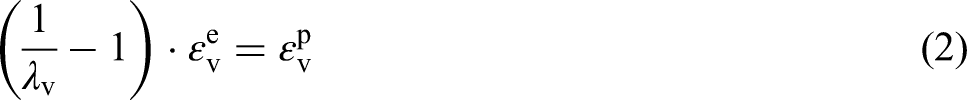
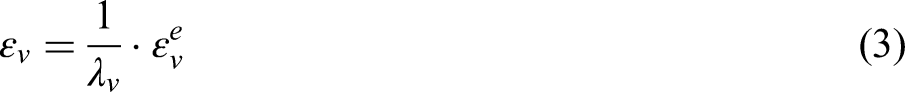
The IOTCS occurred during both stages of the volumetric strain (stage 1 in Figure 4a and b) and distortion (stage 2, in Figure 4a and b). The volumetric strain equation is as follows:

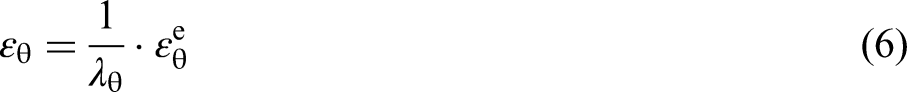
Similarly, the distortion can be divided into two categories: elastic and plastic. The distortion equation is as follows:

The plastic distortion can be represented using the elastic distortion as follows:
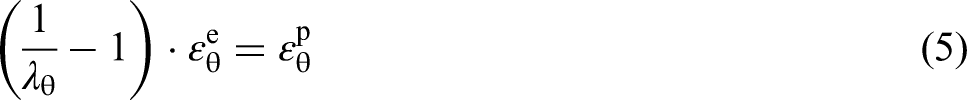
Thus, the distortion can be expressed as follows:


With these boundary conditions and constitutive equations, straightforward algebraic manipulation results in the following relations for the effective stresses at the MFP:


The results of quantitative evaluation of IOTCS
The horizontal effective stress σH and σh at the MFP
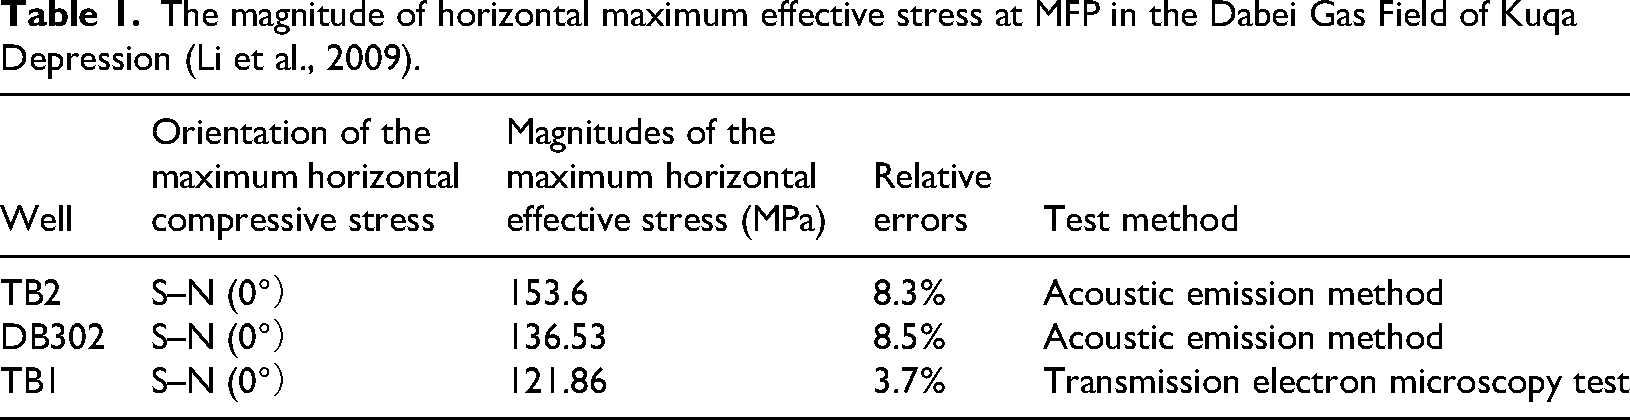
Using a method based on the minimum principal axis of rock magnetic susceptibility, Zeng et al. (2004) determined the direction of the maximum principal compression stress. They found that during Late Himalayan period, which corresponds to both the maximum folding and the main hydrocarbon charging phase, the direction of maximum compressive stress was approximately S–N (0°). The magnitude of this paleotectonic effective stress at the MFP was primarily determined through acoustic emission methods and transmission electron microscopy test (Ding and Shao, 2001; Hardy et al., 1989; Li et al., 2009; McComick, 1977; Michihiro et al., 1985). The paleotectonic effective stress data acquired from the MFP within the K1bs in the Kuqa Depression (Table 1).
The magnitude of horizontal maximum effective stress at MFP in the Dabei Gas Field of Kuqa Depression (Li et al., 2009).
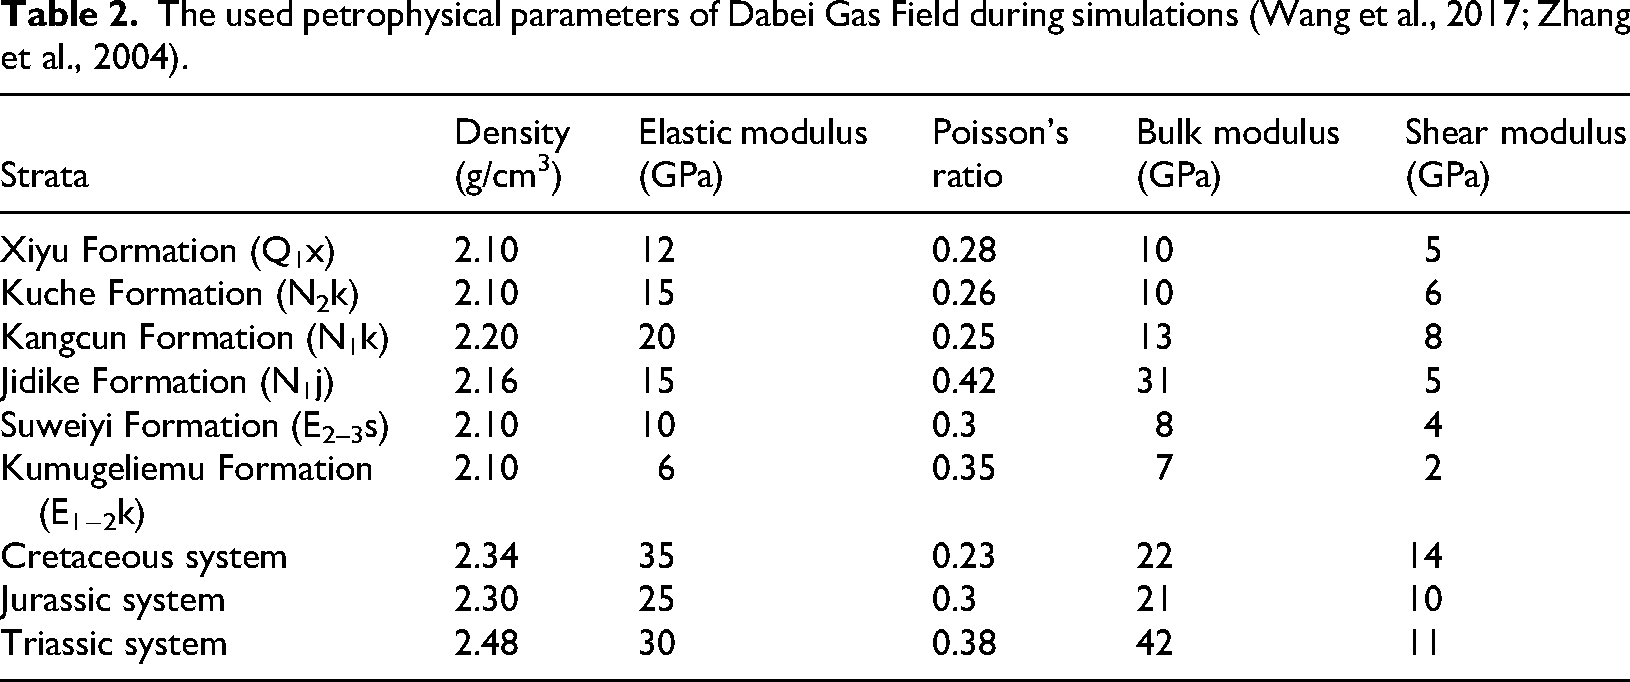
Using fault stripping, we obtained the paleo-elevation and the 3D geological bodies with a certain thickness of formation K1bs during the MFP (Figure 5). Numerical simulation is based on restored 3D geological bodies (Figure 5). Features of main thrusts and recoil faults, treated as broken belts filled with weak medium, are incorporated into the models. The petrophysical parameters used in the simulations are primarily derived from monoaxial and triaxial rock mechanics test conducted by Wang et al. (2017) and Zhang et al. (2004) (Table 2). Additionally, petrophysical parameters for the Jurassic and Triassic systems are included, derived from log data conversion (Table 2). The 3D geological bodies are modeled as elastic materials. The mode's bottom is constrained by support, while top surface is free (Figure 6). Displacement is allowed on north side, and south side is fixed (Figure 6). The east and west sides are active (Figure 5). Gravity is considered (Figure 6). The faults are bounded with strata (Figure 6).
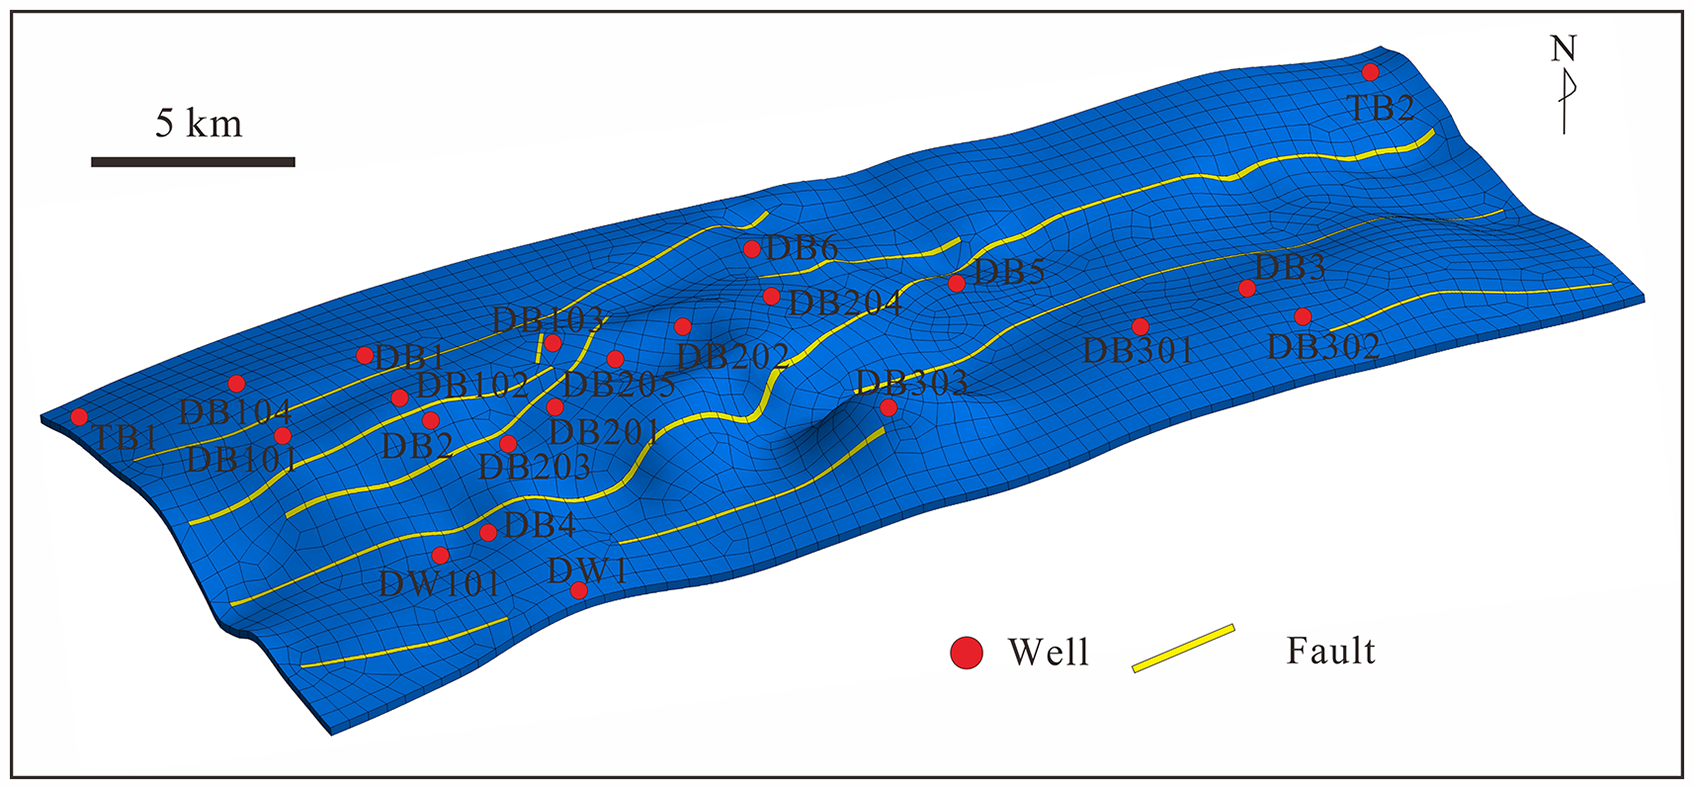
Geological model of the Formation Bashijiqike (K1bs) of the Dabei Gas Field at maximum folding period.
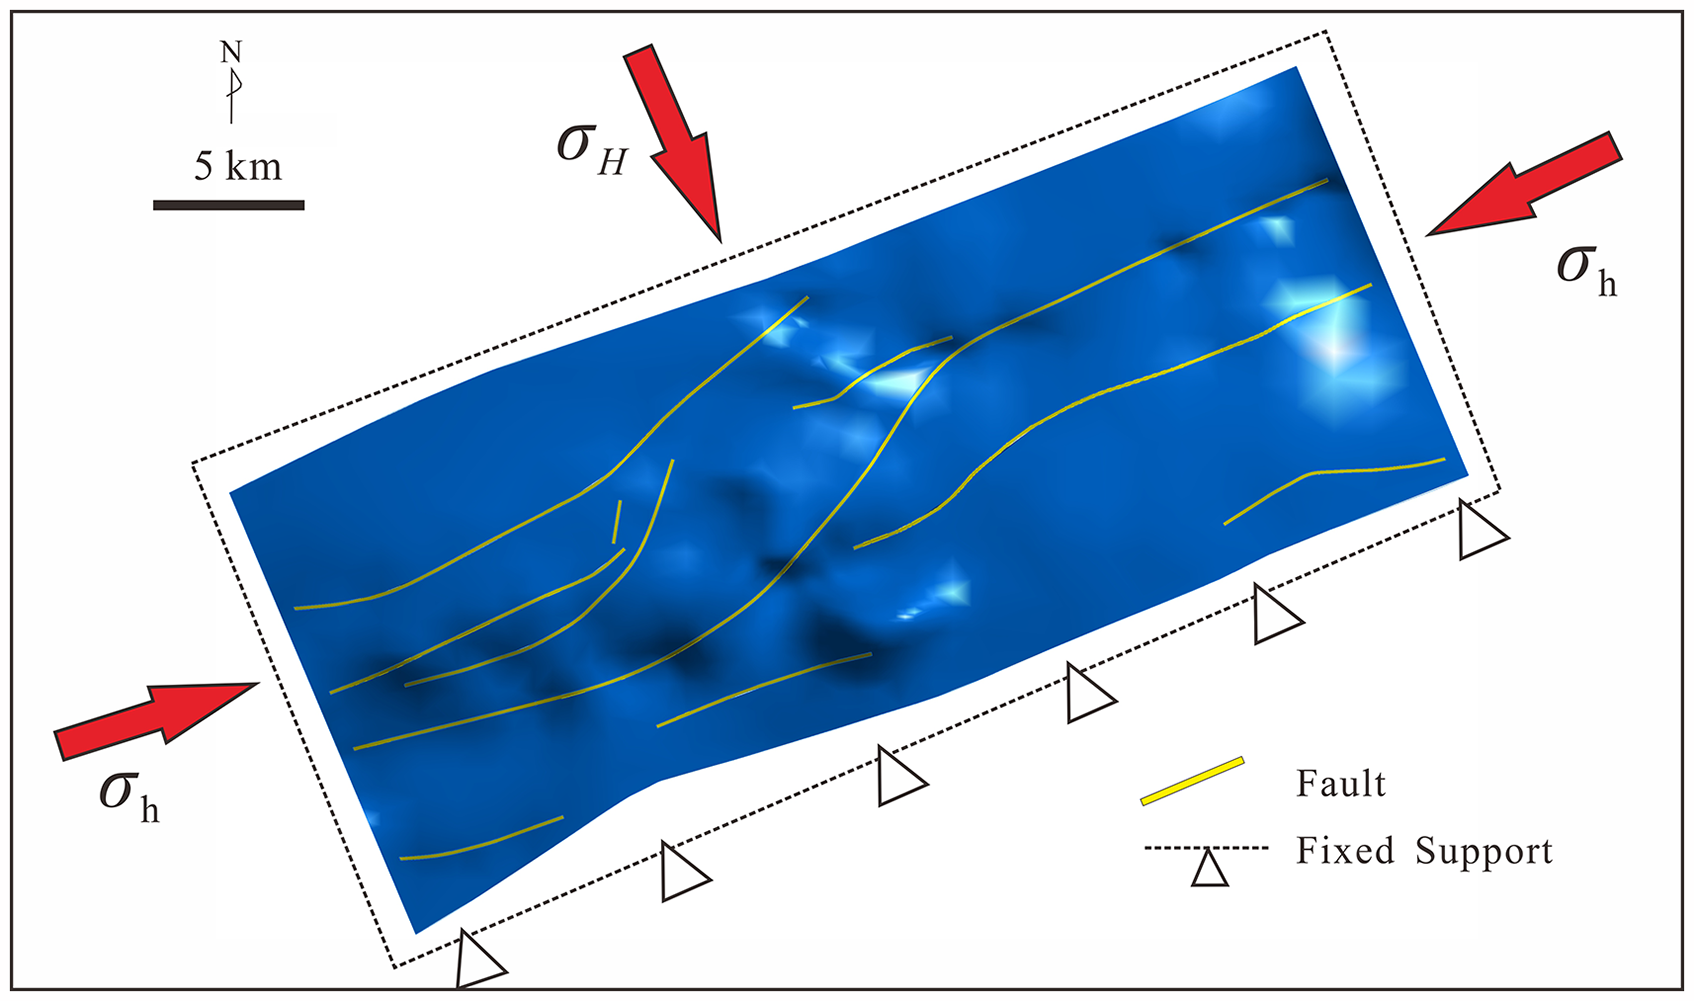
Boundary conditions of paleotectonic stress field numerical simulation.
The used petrophysical parameters of Dabei Gas Field during simulations (Wang et al., 2017; Zhang et al., 2004).
Using the ANSYS17.0 finite element program developed by ANSYS Company, USA, we derived more accurate estimates of the maximum and minimum horizontal effective stresses, constrained by measured paleotectonic effective stress data obtained from acoustic emission and transmission electron microscopy tests. The relative errors between the measured and the numerically simulated maximum horizontal effective stress is less than 10% (Table 1).
The distribution of the maximum and minimum horizontal effective stresses of main reservoir K1bs at the MFP are showed in Figure 7 through finite element numerical simulations based on Figures 5 and 6. Most of fault zones have high maximum horizontal effective stresses and low minimum horizontal effective stresses (Figure 7a, b). The high tectonic stresses (maximum and minimum horizontal effective stresses) distribute in the northeastern Dabei Gas Field (Figure 7a, b).
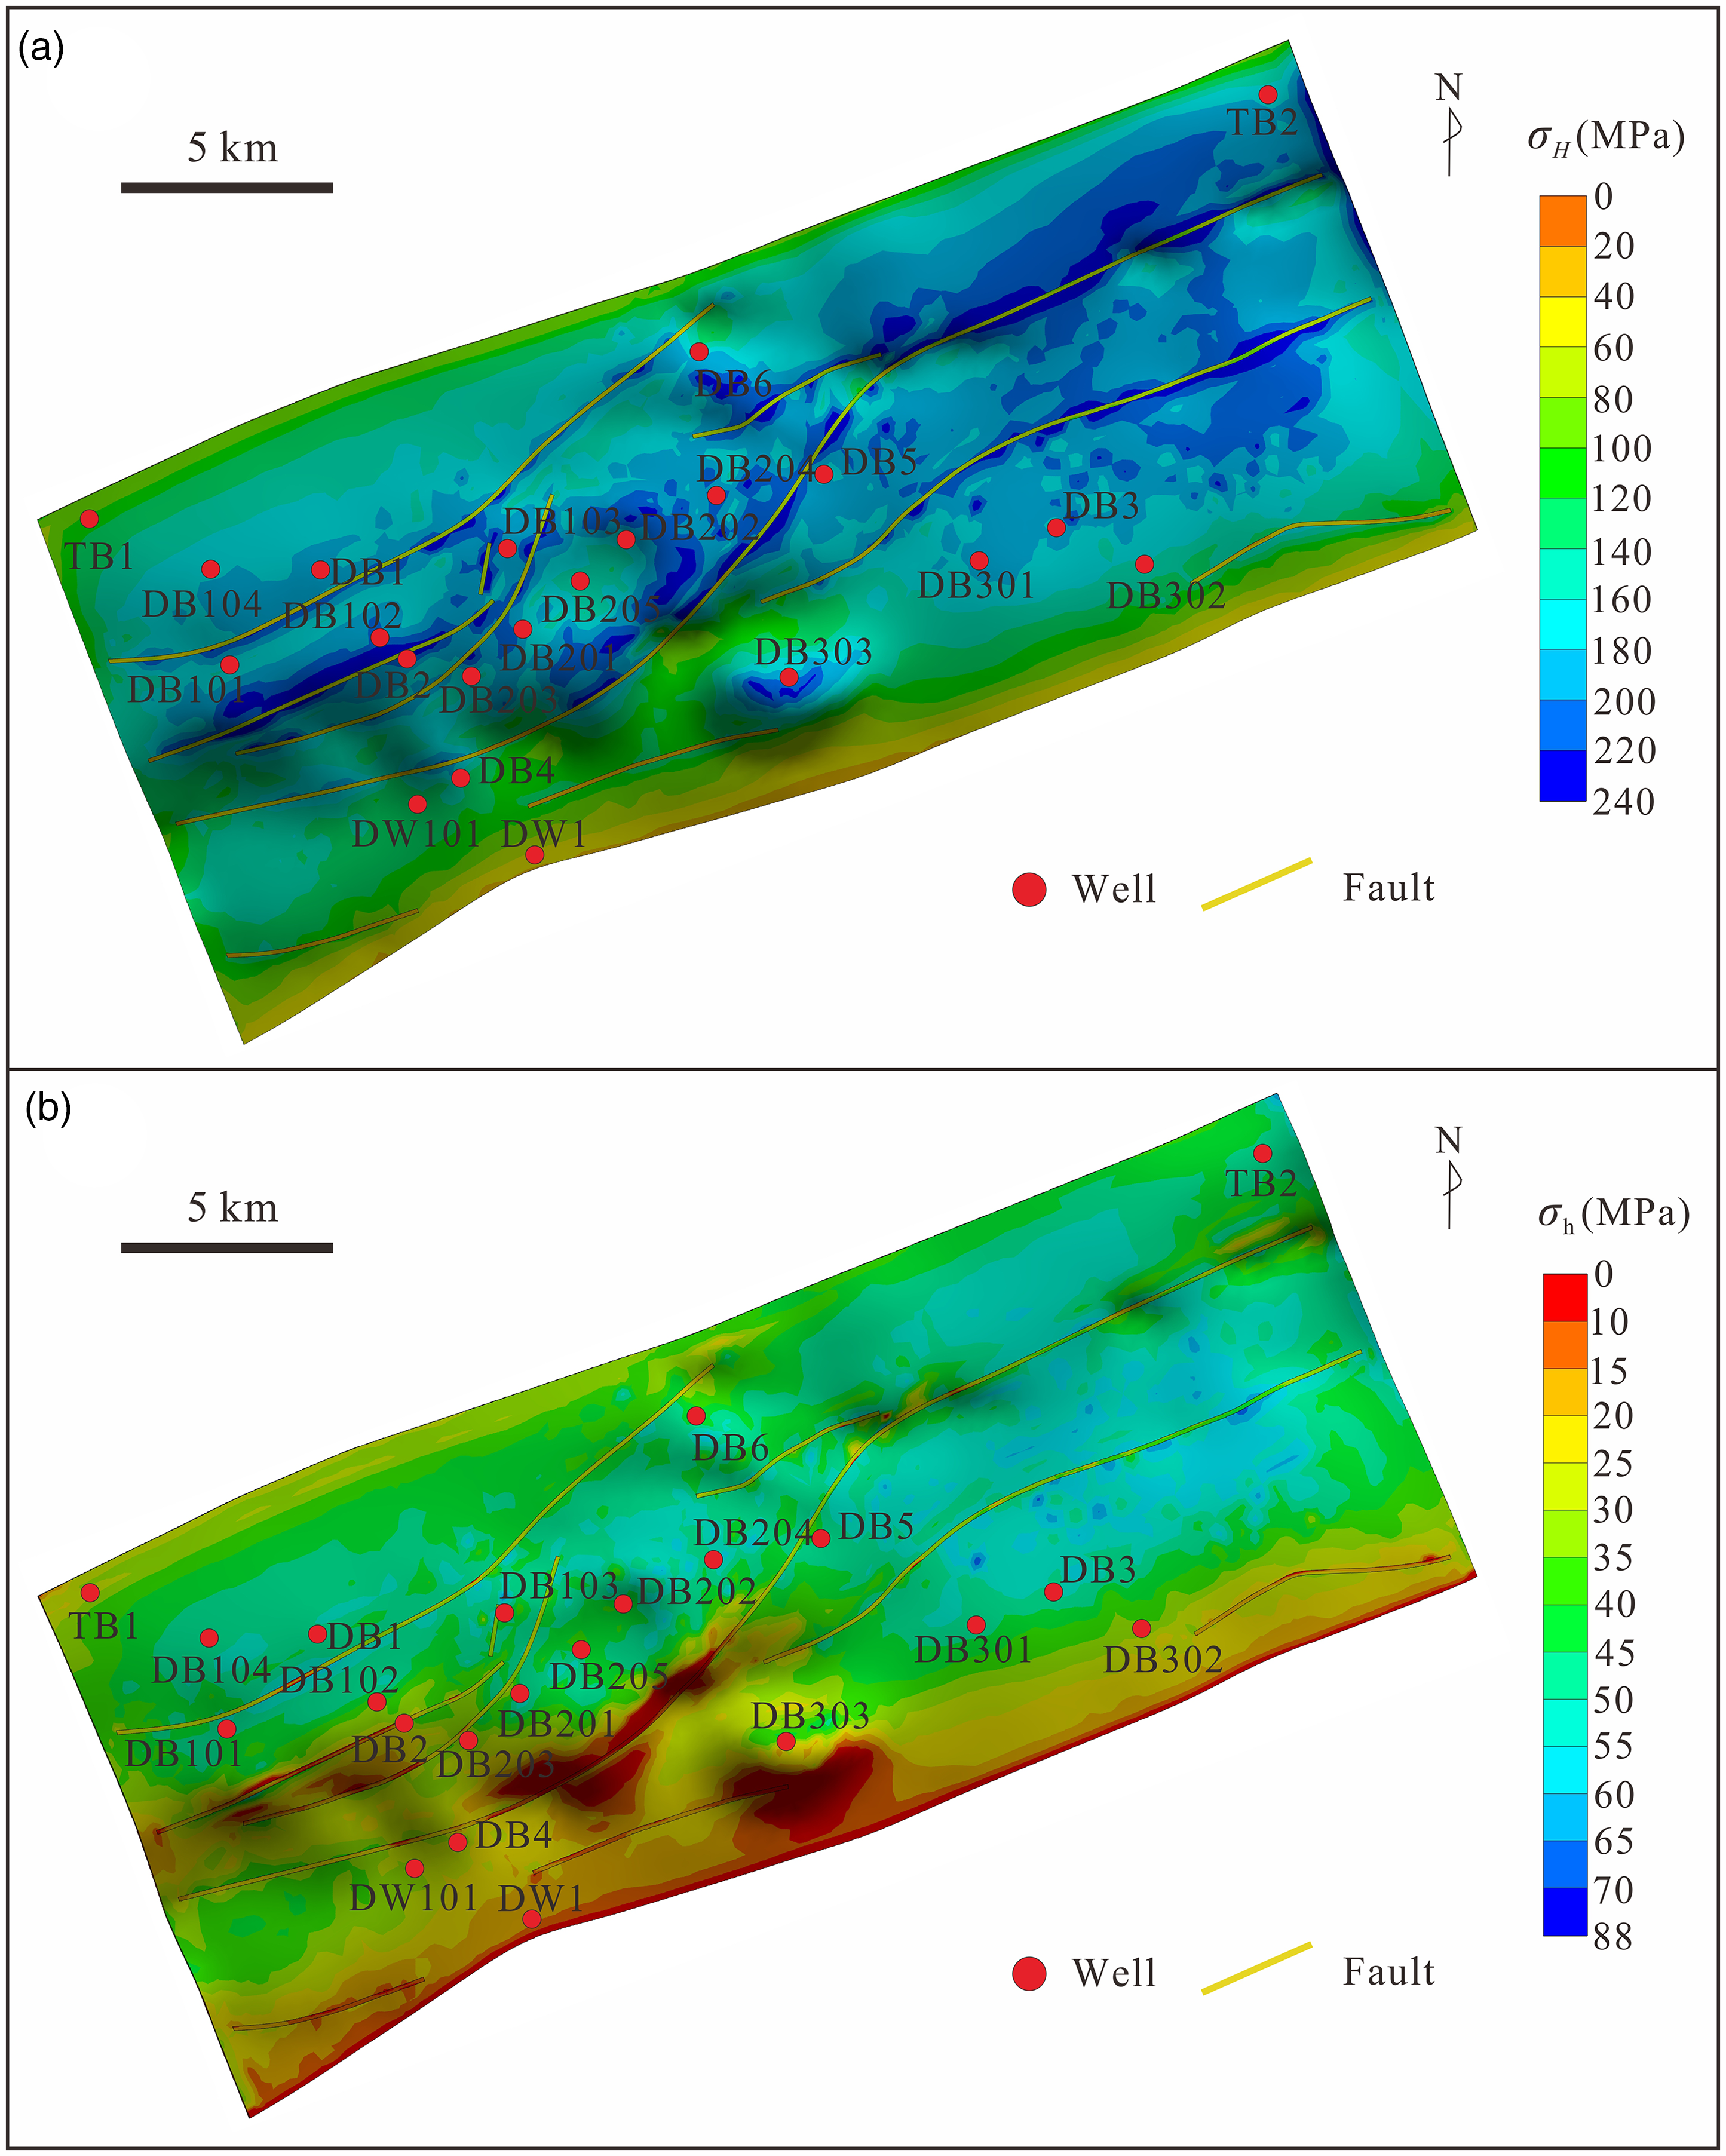
Plane stress field of maximum horizontal effective stress (a) and minimum horizontal effective stress of Formation Bashijiqike (K1bs) at maximum folding period (b). σH = maximum horizontal effective stress, σh = minimum horizontal effective stress.
The VES σv at the MFP
Assuming that the volumetric strain resilience rate λv is approximately consistent with the distortion resilience rate λθ. Therefore, equation (9) can be transformed into following equation:
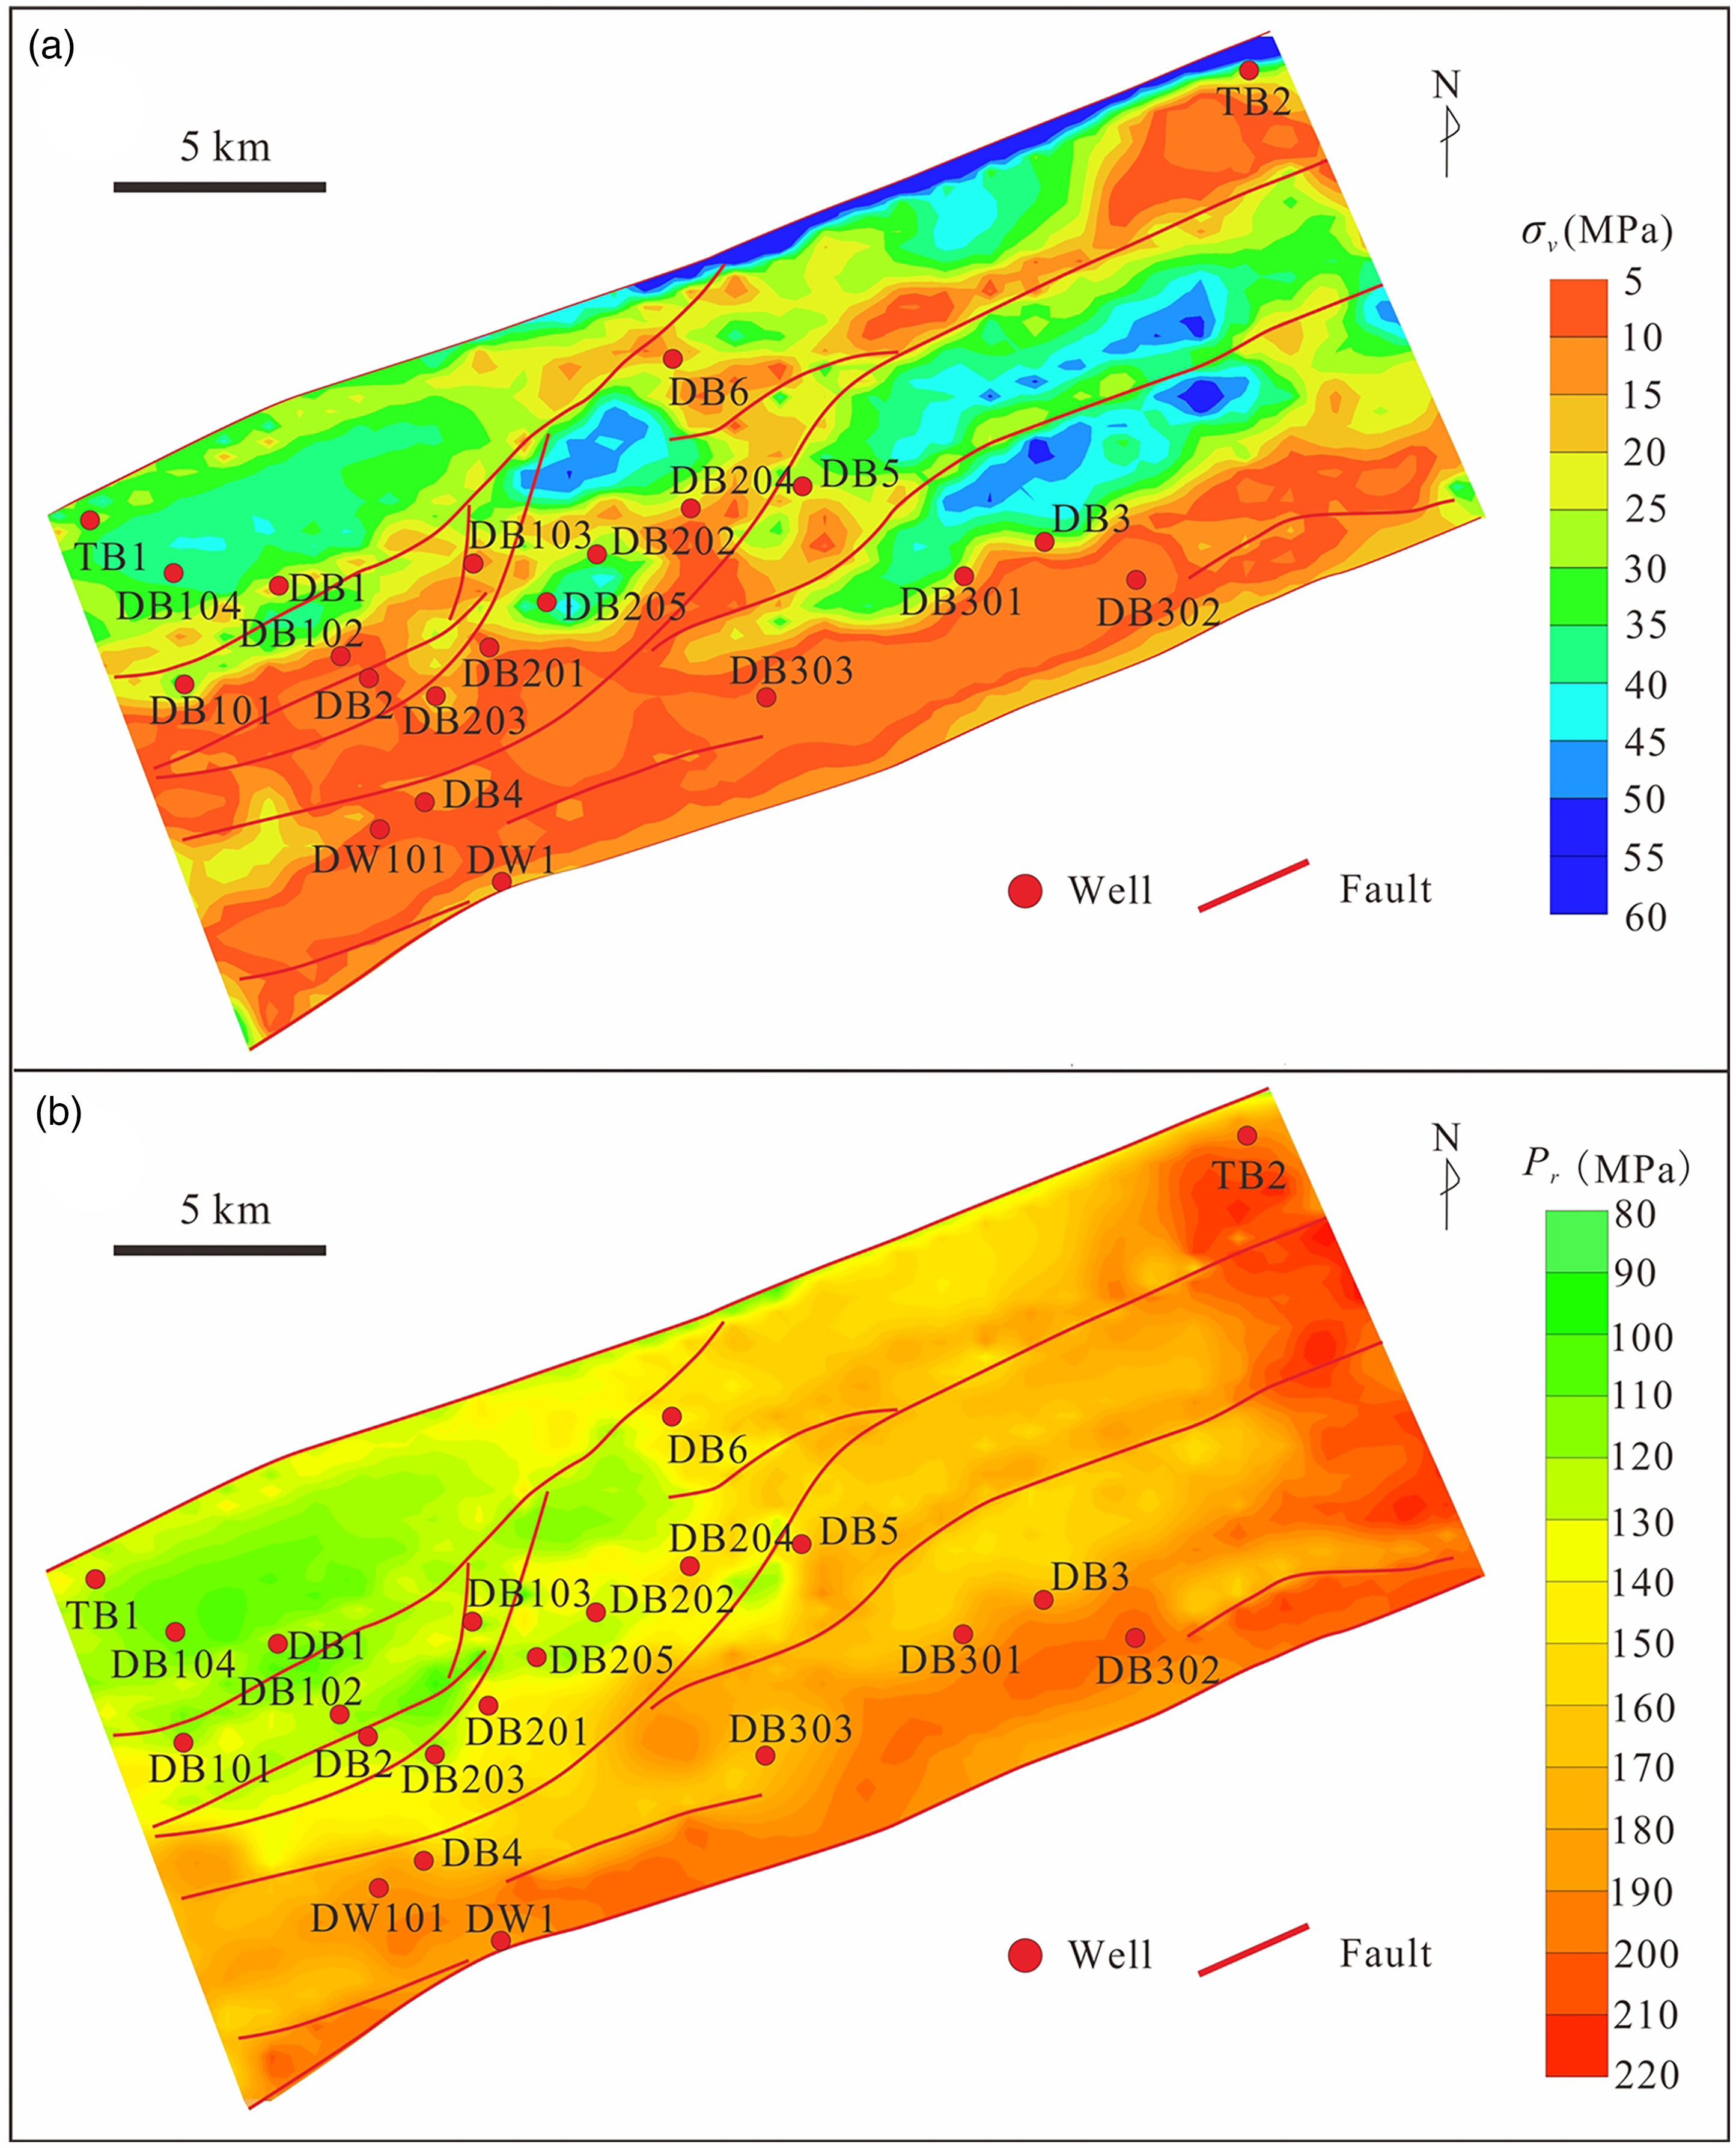
Plane stress field of vertical effective stress (a) and plane map for fluid pressure (b) of Formation Bashijiqike (K1bs) at maximum folding period. σv = vertical effective stress, Pr = fluid pressure at maximum folding period.
The pore fluid pressure at the MFP
As rock mainly behaved as a slip along the thrust fault and the compaction was weak during the stage of rupture and decouple, we assumed that the bulk density at MFP is approximately consistent with the current bulk density. Vertical stress was calculated using following equation:
Discussion
Applicability of the model of quantitative evaluation of IOTCS
The model of quantitative evaluation of IOTCS describes the basic law of rock compressive deformation, which can be applied to evaluate the overpressure induced by compressive deformation. Rock compressional deformation can be generally divided into three stages: volumetric strain, distortion, and rupture (fault). The IOTCS is mainly developed in the volumetric strain and distortion stages. In the rupture stage, the maximum effective stress and pore pressure were released by thrust fault. Then, overpressure decoupled from rock stress. Almost all deformations caused by the tectonic compressive stress will undergo a process from bulk deformation to distortion deformation (Figure 4a; Stage 1 and Stage 2), including formation process of new faults and reactivity of existing ones. Therefore, the model is suitable for evaluating the volume deformation and distortion caused by various structural compressive stresses.
This model describes the basic deformation process and stress–strain relationship in process of tectonic compression but still has some limitations. This model is only applicable to brittle, brittle-plastic deformation. The stress–strain behavior of pure plastic deformation cannot be characterized by this model. The stress–strain constitutive equation (equation (8)) only expresses the stress–strain relationship of rock deformation at the macroscopic scale. The problem of local stress redistribution owing to rock deformation cannot be described.
In addition, this model is only applicable to formations beneath and without the gypsum-salt beds. Due to gypsum and salt beds have high fluidity and can cause stress concentration in the overlying formations (Obradors-Prats et al., 2016), the planar stress field simulation cannot accurately capture the stress characteristics. Besides that, the local thickening and thinning of gypsum and salt beds also affected the morphology of ancient structures. Although, we used fault back-stripping to restore the ancient tectonic structures of the MFP, the effects of local thickening and thinning of the gypsum and salt beds were minimized as much as possible in our planar stress field numerical simulation. However, the reconstructed paleo-structure may still differ from the actual structural form, which could be one of the reasons for relative error between IOTCS calculations and paleo-pressure recovered from inclusions. Furthermore, another potential source of error may stem from the inclusion of the initial hydrocarbon migration-induced pressure increase (6–4 Ma) in the IOTCS values, resulting in systematically higher IOTCS measurements compared to paleo-pressure estimates derived from fluid inclusions.
Implications for rock rupture
Previous studies have shown that the ruptures (such as fracture and fault) mainly controlled by differential stresses and pore fluid pressure in the single sand body (Davatzes et al., 2003; Maerten and Maerten, 2006). With same differential stress, the higher pore pressure, the more likely rock is to rupture (Figure 9a gray solid line → red solid line). To some extent, pore fluid pressure is positively correlated with fracture density. However, there is a negative correlation between pore fluid pressure (the fluid pressure of MFP) and linear density of fracture in Dabei Gas Field (Figure 9b).
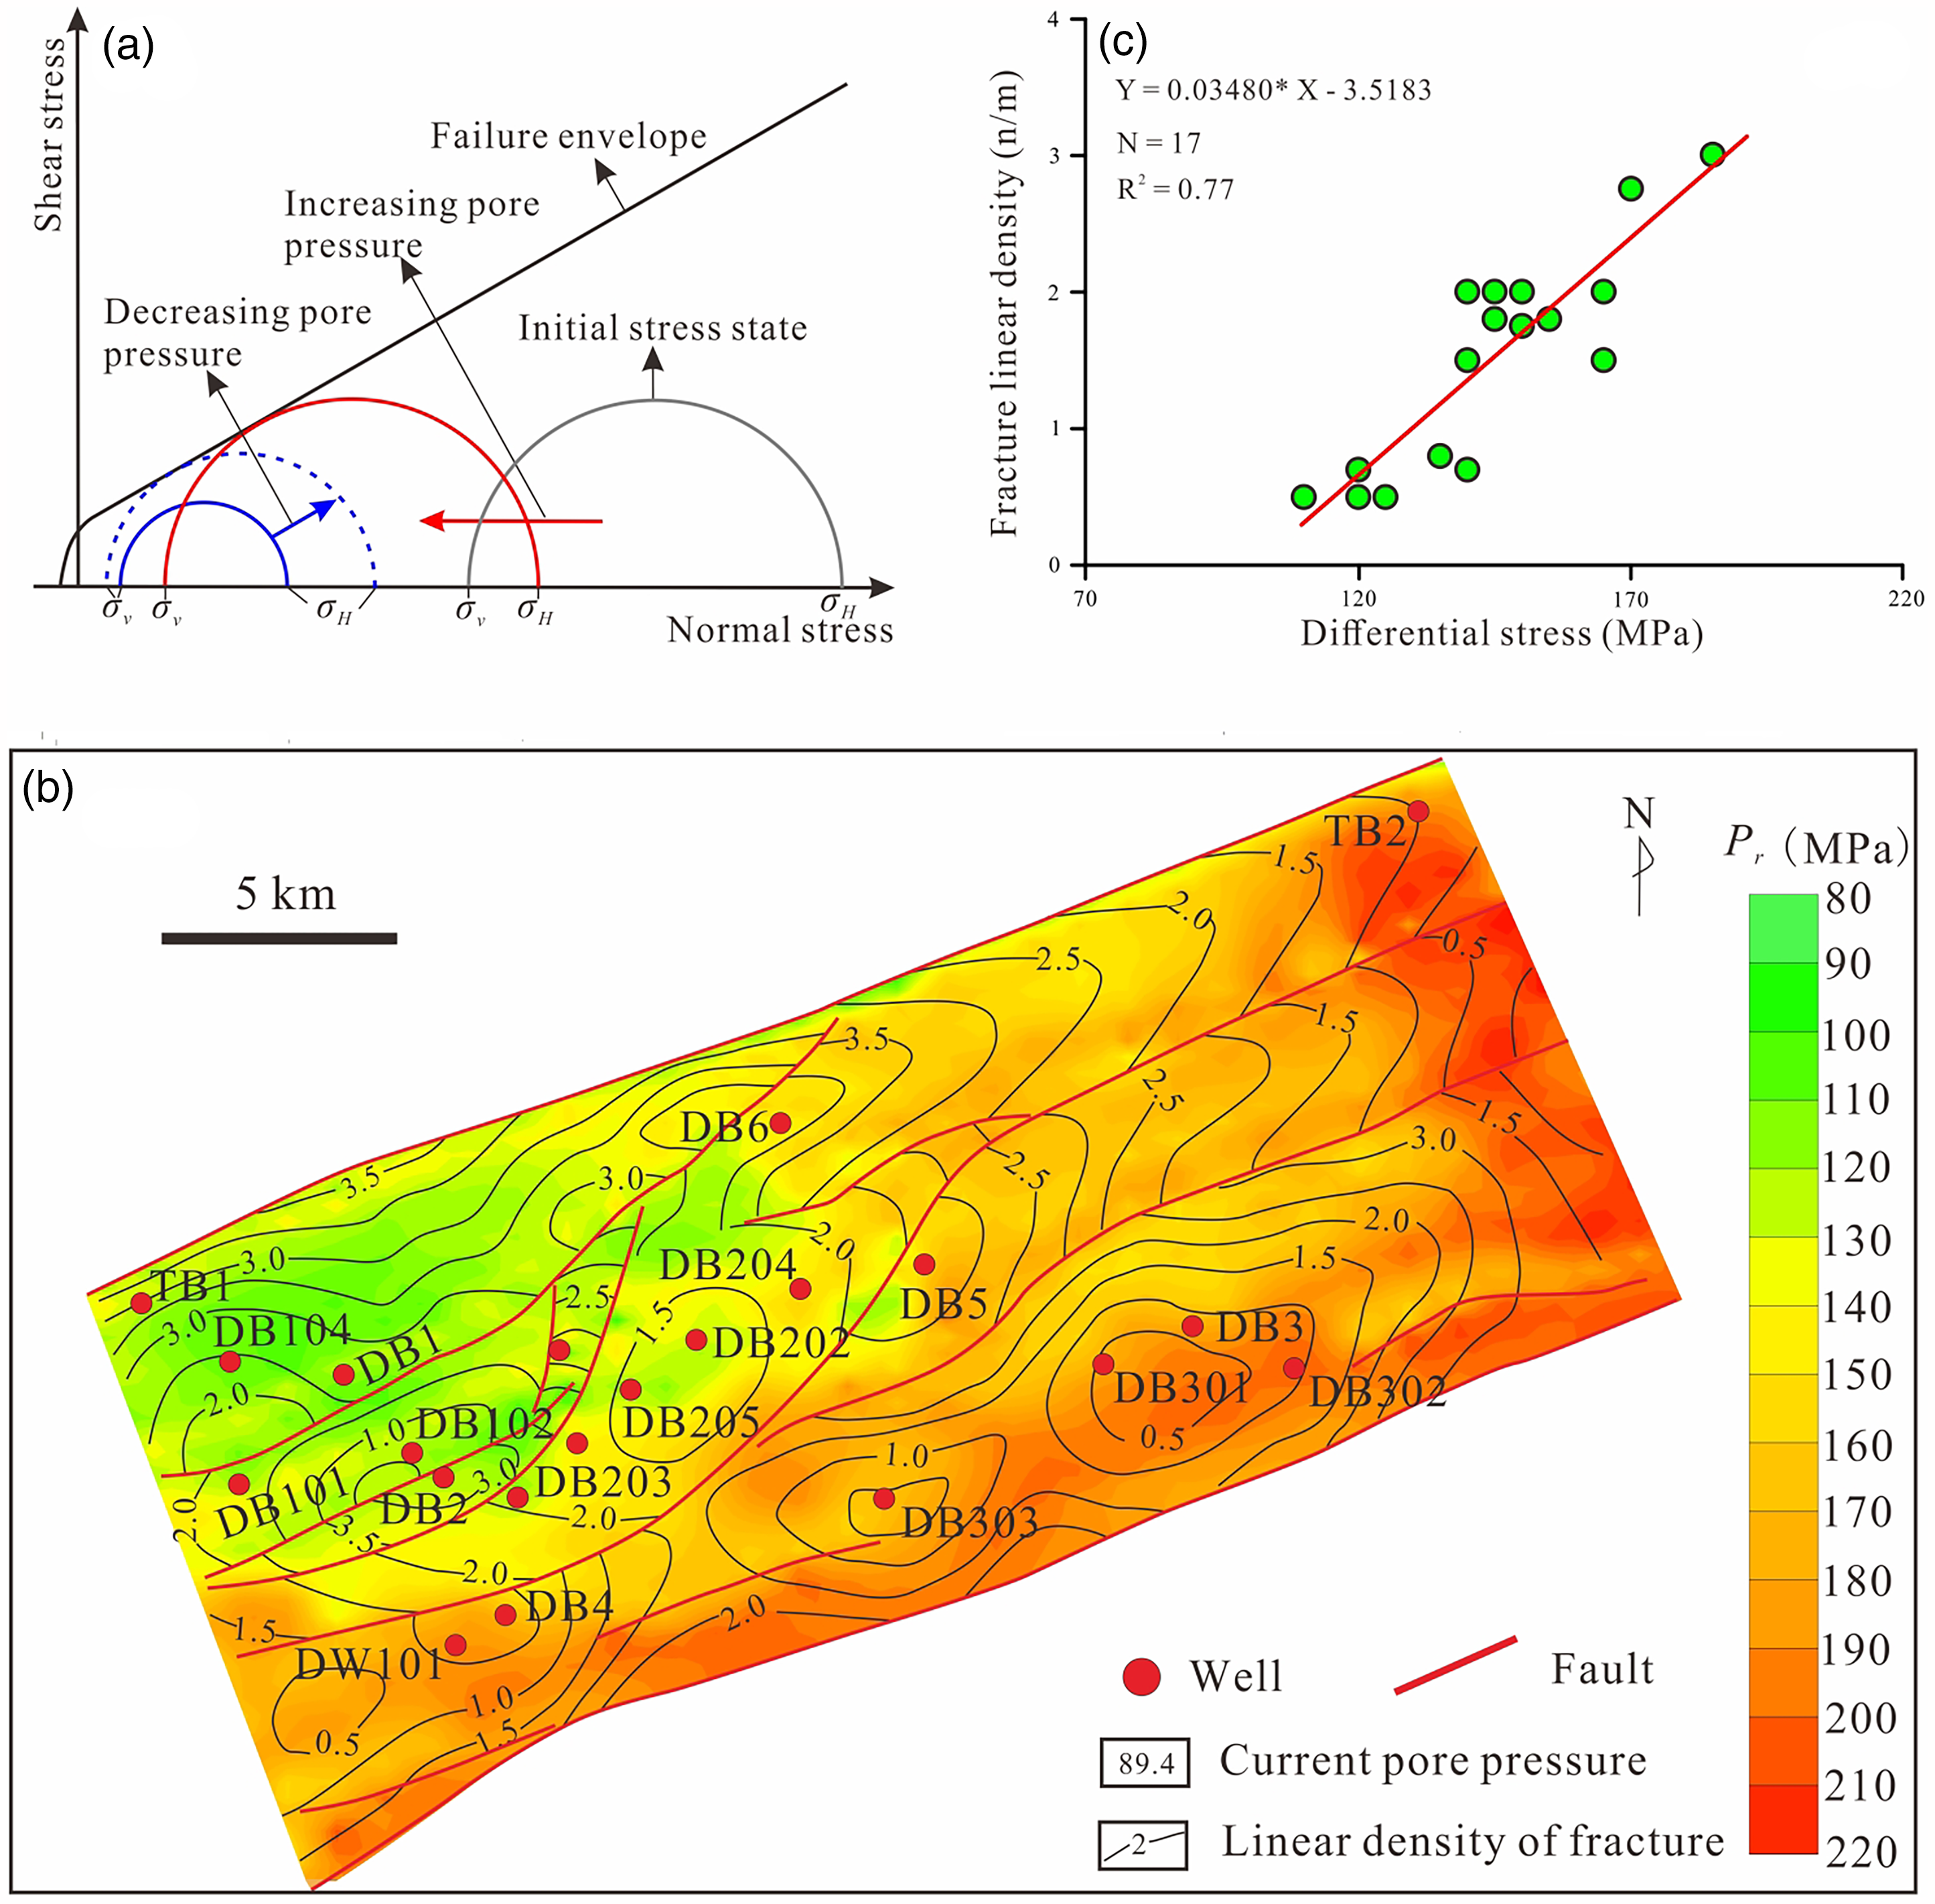
(a) Rock rupture model. (b) Planar distribution of the MFP pore fluid pressure and fracture linear density (Zhang et al., 2012). (c) Relationship between differential and fracture linear density.
As previously mentioned, Kuqa Depression has undergone significant erosion, with an erosion thickness ranging from 450 to 1650 m. Of this, approximately 200 to 900 m of erosion thickness is attributed to fault slip, while the remainder results from strata folding and uplift caused by tectonic compression. As strata undergo erosion, Vertical effective stress and pore pressure decrease due to a reduction in vertical stress. Meanwhile, horizontal maximum effective stress (maximum effective stress σ1) increases as pore fluid pressure decrease, leading to an increase in differential stress. This causes the strata to become more prone to shear fracturing during the uplift and erosion stages (Figure 9a blue solid line → blue dotted line). As shown in Figure 9c, Fracture linear density is directly related to differential stress; the higher the differential stress, the greater the fracture linear density.
As pore pressure decreases, vertical effective stress decreases, while horizontal maximum effective stress and differential stress increase accordingly. Based on empirical relationship between differential stress and fracture line density (Figure 9c), it is evident that when fluid pressure is zero, both differential stress and fracture line density reach their maximum values. This indicates that the presence of IOTCS weakens the rock's ability to develop shear fractures.
Implications for hydrocarbon migration and accumulation
Tectonic stress is a primary driving force for hydrocarbon migration and accumulation (Hua, 1995; Hubbert, 1953; Hunt, 1990; Li, 1994; Liu et al., 2000; Odaama, 1986). Through the IOTCS, tectonic stress enhances the driving power. Fluid potential directly represents the driving power (Lerche, 1990; Wang and Xie, 1998; Welte et al., 1997). The hydrocarbon head, which reflects fluid potential, can be calculated as follows (Hubbert, 1953).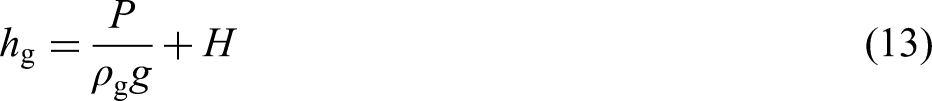
The MFP (approximately 2.58 Ma) is just within the period of natural gas charging period (0–3 Ma) (Sun et al., 2018). Taking the Pr for IOTCS, gas density (0.283 g/cm3), the acceleration of gravity (9.8 N/kg), and the elevation at MFP of Dabei Gas Field, we calculated gas heads by using equation (13). The gas head distribution at the MFP suggests that the Dabei Gas Field lies in a region with low gas potential, favorable for gas accumulation (Figure 10).
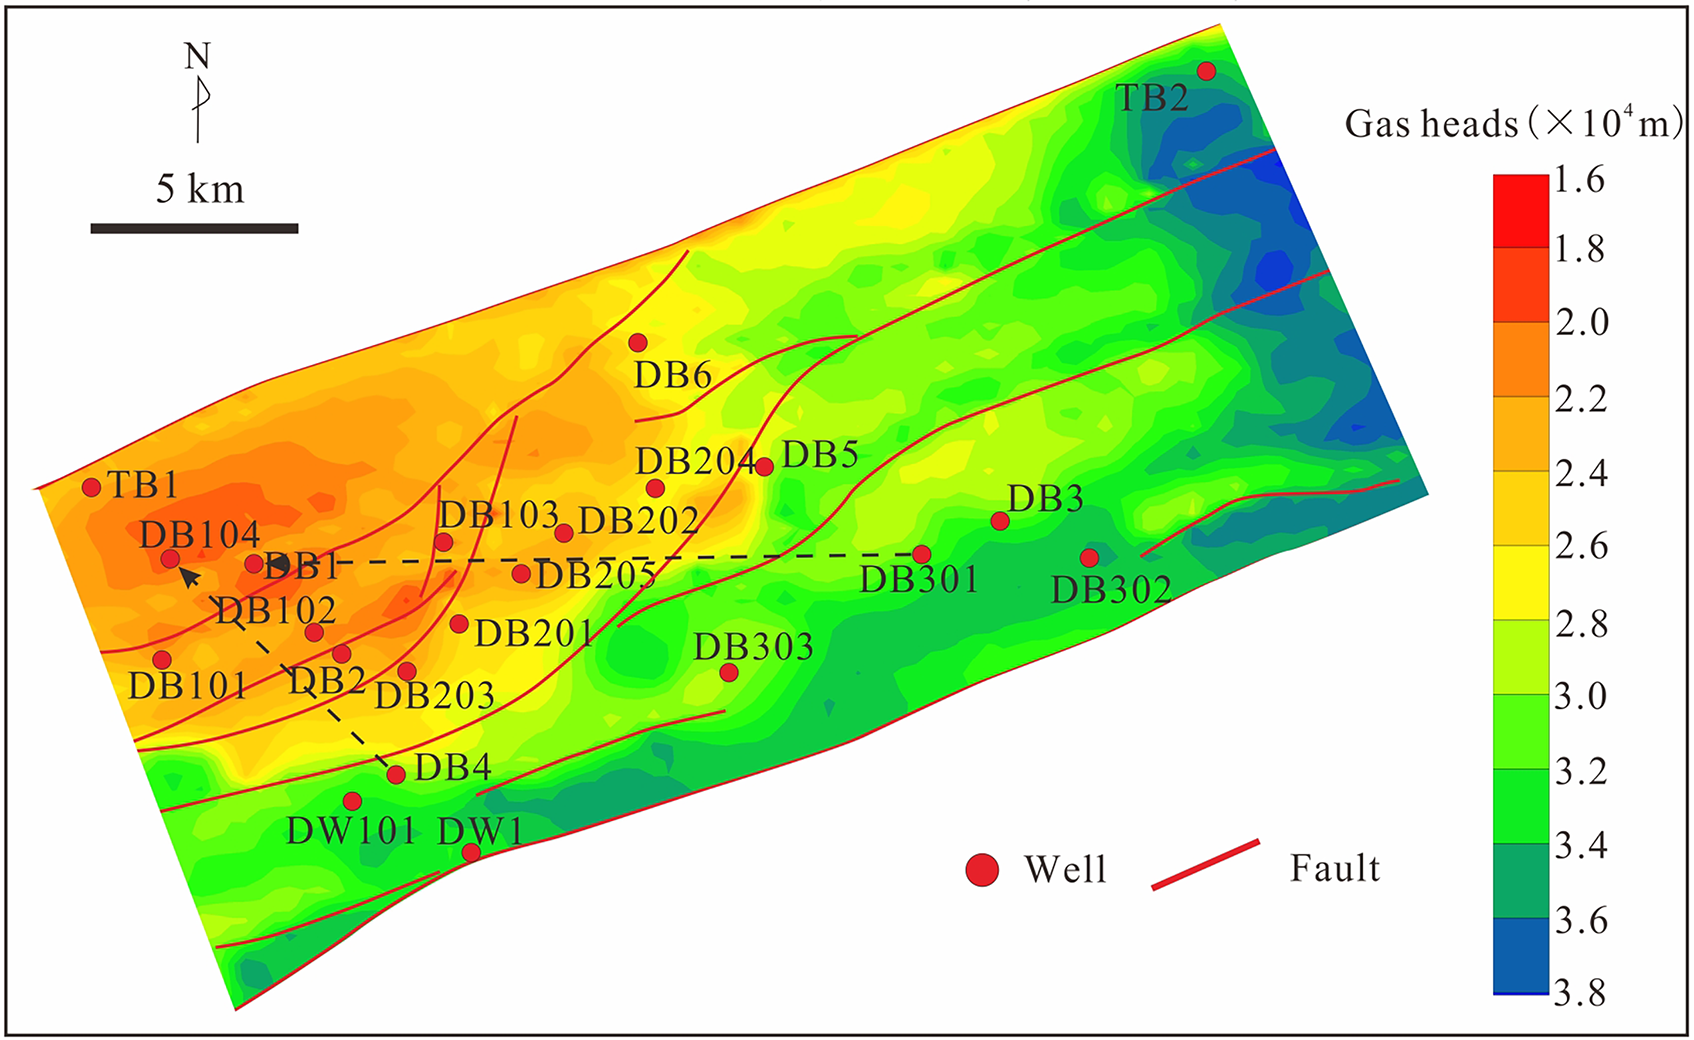
Plane map for gas potential (gas heads) of Formation Bashijiqike (K1bs) at maximum folding period.
The fluid potential gradient is a measure of driving force for oil and gas migration. The greater fluid potential gradient, the stronger driving force. The mathematical expression for fluid potential gradient is:


Select two fluid potential gradient directions that are approximately perpendicular to the equipotential lines, specifically the DB301 → DB1 direction and the DB4 → DB104 direction (as shown in Figure 10). Calculate the IOTCS potential gradient (equation (15)) and the non-IOTCS potential gradient (equation (16)). The results show that the IOTCS potential gradient is generally higher than the non-IOTCS potential gradient, with the ratio n ranging from 1.8 to 2.1. This indicates that the IOTCS increases the driving force, making it 1.8 to 2.1 times greater than the non-IOTCS during the MFP.
Conclusion
During the IOTCS, the coupled evolution of stress, strain, and pressure remains unclear, and there is a lack of high applicability and accuracy evaluation methods. We developed a constitutive effective stress models in Coulomb failure stage can be employed in conjunction with plane stress field simulation to quantitative calculate IOTCS. This method eliminates the interference of subjective human factors and clarifies the coupled evolution process of stress, strain, and pressure in the IOTCS.
The application of the new model in Dabei gas field reveals the following: (a) The IOTCS ranges from 80 to 220 MPa, and the relative error obtained from the aqueous inclusions is 6%, which is relatively small, indicating accurate results, (b) controlled by the IOTCS, low fluid pressure zone developed high fracture density, high fluid pressure zone developed low fracture density, the presence of IOTCS weakens the rock's ability to develop shear fractures, and (c) the gas potential is characterized by low value in northwest and higher value in the surrounding areas. IOTCS have amplified this difference, enhancing the charging dynamics. Compared to conditions without IOTCS, the gas potential gradient has increased by 1.8 to 2.1 times. The formation of Dabei Gas Field was facilitated by strong charging dynamics influenced by IOTCS. Similar processes may have contributed to formation of other gas fields in foreland basins, such as Kela-2 gas field, Iran's Ahvaz oil field, Canada's Prudhoe Bay oil field, and Pakistan's Bakhteyari oil field.
Footnotes
Nomenclature
Acknowledgments
This work was supported by the National Natural Science Foundation of China (project no. 41972133), Natural Science and Basic Research Program of Shaanxi Province (project no. 2021JCW-04), and the Major National Science and Technology Project (No. 2017ZX05008-004-004).
Funding
The authors disclosed receipt of the following financial support for the research, authorship, and/or publication of this article: This work was supported by the National Natural Science Foundation of China, the Major National Science and Technology Project, Natural Science and Basic Research Program of Shaanxi Province (grant numbers 41972133, 2017ZX05008-004-004, 2021JCW-04).
Conflicting interests
The authors declared no potential conflicts of interest with respect to the research, authorship, and/or publication of this article.