
Abstract
The Bohai Bay region is a primary accumulation area of oil and gas in offshore China, in which overpressure commonly occurs in the Paleogene strata; the analysis on distribution characteristics and genetic mechanisms of the overpressure would provide geologic evidences for making plans of well drilling and logging as well as oil and gas exploitation; additionally, it could lay the geological foundation for studying how overpressure controlled hydrocarbon accumulation. Based on research, the overpressure of the study area starts from the second member of the Dongying Formation and ends in the third member of the Shahejie Formation. The distribution of overpressure is mainly controlled by the sag–salient tectonic framework within the basin, which means overpressure mainly develops in sags or slopes; however, high areas stay normal pressured. In the study area, pressure develops around Bozhong Sag and in northern Liaodong Bay reaches the peak. The genetic mechanisms of overpressures in the Paleogene reservoirs are mainly disequilibrium compaction, hydrocarbon generation of the organic matter, fluid charging, and transmission or the superimposition of the former two. Different strata have different genetic mechanisms of overpressure. The chief genetic mechanisms for the generation of overpressure of the Dongying Formation are disequilibrium compaction while the genesis of the formation of overpressure in the Shahejie Formation is more complicated in some extent. The first member of the Shahejie Formation dominated by disequilibrium compaction and hydrocarbon generation of the organic matter plays a supplemental role, while the second member of the Shahejie Formation, as the primary reservoir strata, is dominated by fluid charging and transmission, and the third member of the Shahejie Formation is the main source rock interval; its overpressure is closely related to hydrocarbon generation. Each contribution ratio for overpressure forming by different genetic mechanisms has been judged and figured out quantitatively according to geological, geophysical, and geochemical characteristics of the target strata.
Keywords
Introduction
The phenomenon of overpressure commonly exists in the main hydrocarbon basins worldwide (Xu et al., 2004). It has been proved through oil and gas exploration that overpressure is closely related to the generation, migration, and accumulation of oil and gas. In terms of oil and gas generation, overpressure can decrease the maturity of source rocks and delay their thermal evolution process (Hao, 2005). In a word, overpressure is both constructive and destructive to the migration and accumulation of oil and gas. The overpressure in source rocks can be an effective driving force for the primary migration of oil and gas. The mudstone with overpressure can be effective caprocks and they are favorable for the storage of oil and gas. Sandstone reservoirs with high secondary porosity and overpressured microfissures resulted from the effect of organic acid and reservoir overpressure are the best reservoirs among all the subfacies (Liu, 2010). However, if the abnormal pressure in the reservoir is too high, it will break through the blockage of caprocks, faults, etc. thus resulting in the escaping of oil and gas. From this perspective, the study of the features of overpressure distribution in sedimentary basins and their genetic mechanisms can not only help us to get hold of the principles of the oil and gas migration and accumulation so as to guide the oil and gas exploration but also provide technical support for the precise prediction of the formation pressure before drilling and ensure the safety of well drilling.
The precise prediction of formation pressure sets a foundation for the analysis of the features of overpressures distribution and their genetic mechanisms. At present, whether it is in China or in other countries, the logging data and the seismic-horizon velocity data are commonly applied in the prediction of the formation pressure, the corresponding methods are equivalent depth method, Eton method, Bowers method, and Fillippone method. In the study of the formation pressure, the most basic and complicated problem is to explore the genetic mechanisms of the overpressure. Based on previous studies, it is commonly accepted that the main overpressuring mechanisms are as follows: (1) the overpressure mechanism of disequilibrium compaction (Vejbæk, 2008) relating to sedimentation, (2) the overpressure mechanism relating to hydrocarbon generation and cracking, (3) the overpressure mechanism relating to mineral diagenesis, (4) the overpressure mechanism relating to hot water heating, (5) the overpressure mechanism relating to buoyancy (density difference), (6) the overpressure mechanism relating to tectonism (Xie et al., 2006). Among which, the former two mechanisms could generate large-scale overpressures independently (Guo et al., 2010).
In recent years, the scholars in China and abroad pay much attention to the overpressure in permeable formations whose origins, characteristics, and distribution are quite different from that in low-permeable shale formations (Luo, 2000, 2003). The transmission of the overpressure caused by the flow of the overpressured fluid is the main mechanism for the generation of the overpressure in the reservoir (Liu, 2002; Liu and Xie, 2003), which can be divided into the lateral transmission (Li et al., 2008) and the vertical transmission (Hao, 2005; Ramdhan, 2010, 2011; Tingay et al., 2009; Webster et al., 2011). Plenty of examples show that the overpressure in the reservoir is often the direct signature of the oil and gas migration and accumulation (Guo, 2010; Hao, 2005; Li et al., 2008).
The Bohai Bay region is a primary accumulation area of oil and gas in offshore China, overpressure commonly occurs in Paleogene strata. However, the genetic mechanisms and distribution characteristics are still ambiguous, especially the contribution ratio for overpressure forming by different genetic mechanisms. The studies on genetic mechanisms and distribution characteristics would provide geologic evidences for making plans of well drilling and logging as well as oil and gas exploitation, and it could improve the theory of overpressure controls hydrocarbon accumulation. In this paper, the main methods adopted to work out the formation pressure of single wells are equivalent depth method, Eaton method, and Bowers method. First, to analyze developed features of overpressure of single wells, then to discuss the distribution features of overpressure in Paleogene reservoirs both vertically and laterally. Besides, based on rock types, logging data, interpretation results, and oil test results of abnormal pressure interval, combining such data as source rock indices of thermal evolution, crossplot of velocity, density, and vertical effective stress, the three mechanisms of disequilibrium compaction, hydrocarbon generation of the organic matter, and fluid charging and transmission of the working area are comprehensively analyzed, from the single well to the whole block of the Paleogene reservoirs, from mudstone layers to permeable reservoirs. Meanwhile, the geological, geophysical, and geochemical response characteristics of different mechanisms of overpressures in the whole study area are displayed. The final analysis is to figure out the distributive ratio for overpressure forming by different genetic mechanisms quantitatively.
Geological setting
Bohai bay is situated between Tanlu Fault and Cangdong Fault, in which the four first-grade structure units, namely, the Liaohe Depression, the Huanghua Depression, the Chengning Uplift, and the Jiyang Depression, stretch seaward, and it covers an area of 42,000 km2 (Figure 1). Tanlu Fault is of great importance to the formation, sedimentation, and structural evolution of the basin (An and Ma, 2001; Qiu, 2007). The characteristics of the tectonic subsidence of Bohai area are displayed differently in the main sags. The subsidence first occurred in the southern and the northern area and then it moved on to the middle part. In the end, the subsidence mainly occurred in the middle part and the subsidence center is obviously migrated to the center of the bay (Hao, 2005). The time of major subsidence of the depression matches well with the active stretching time of fault activities, which means that the fault activities not only controlled the formation of the hydrocarbon generating sag, but also controlled the distribution of source rocks. Furthermore, it has brought a great influence to the distribution of overpressures driven by disequilibrium compaction and hydrocarbon generation.
Areal structure location and the distribution of major wells in the study area of the Bohai Bay Basin.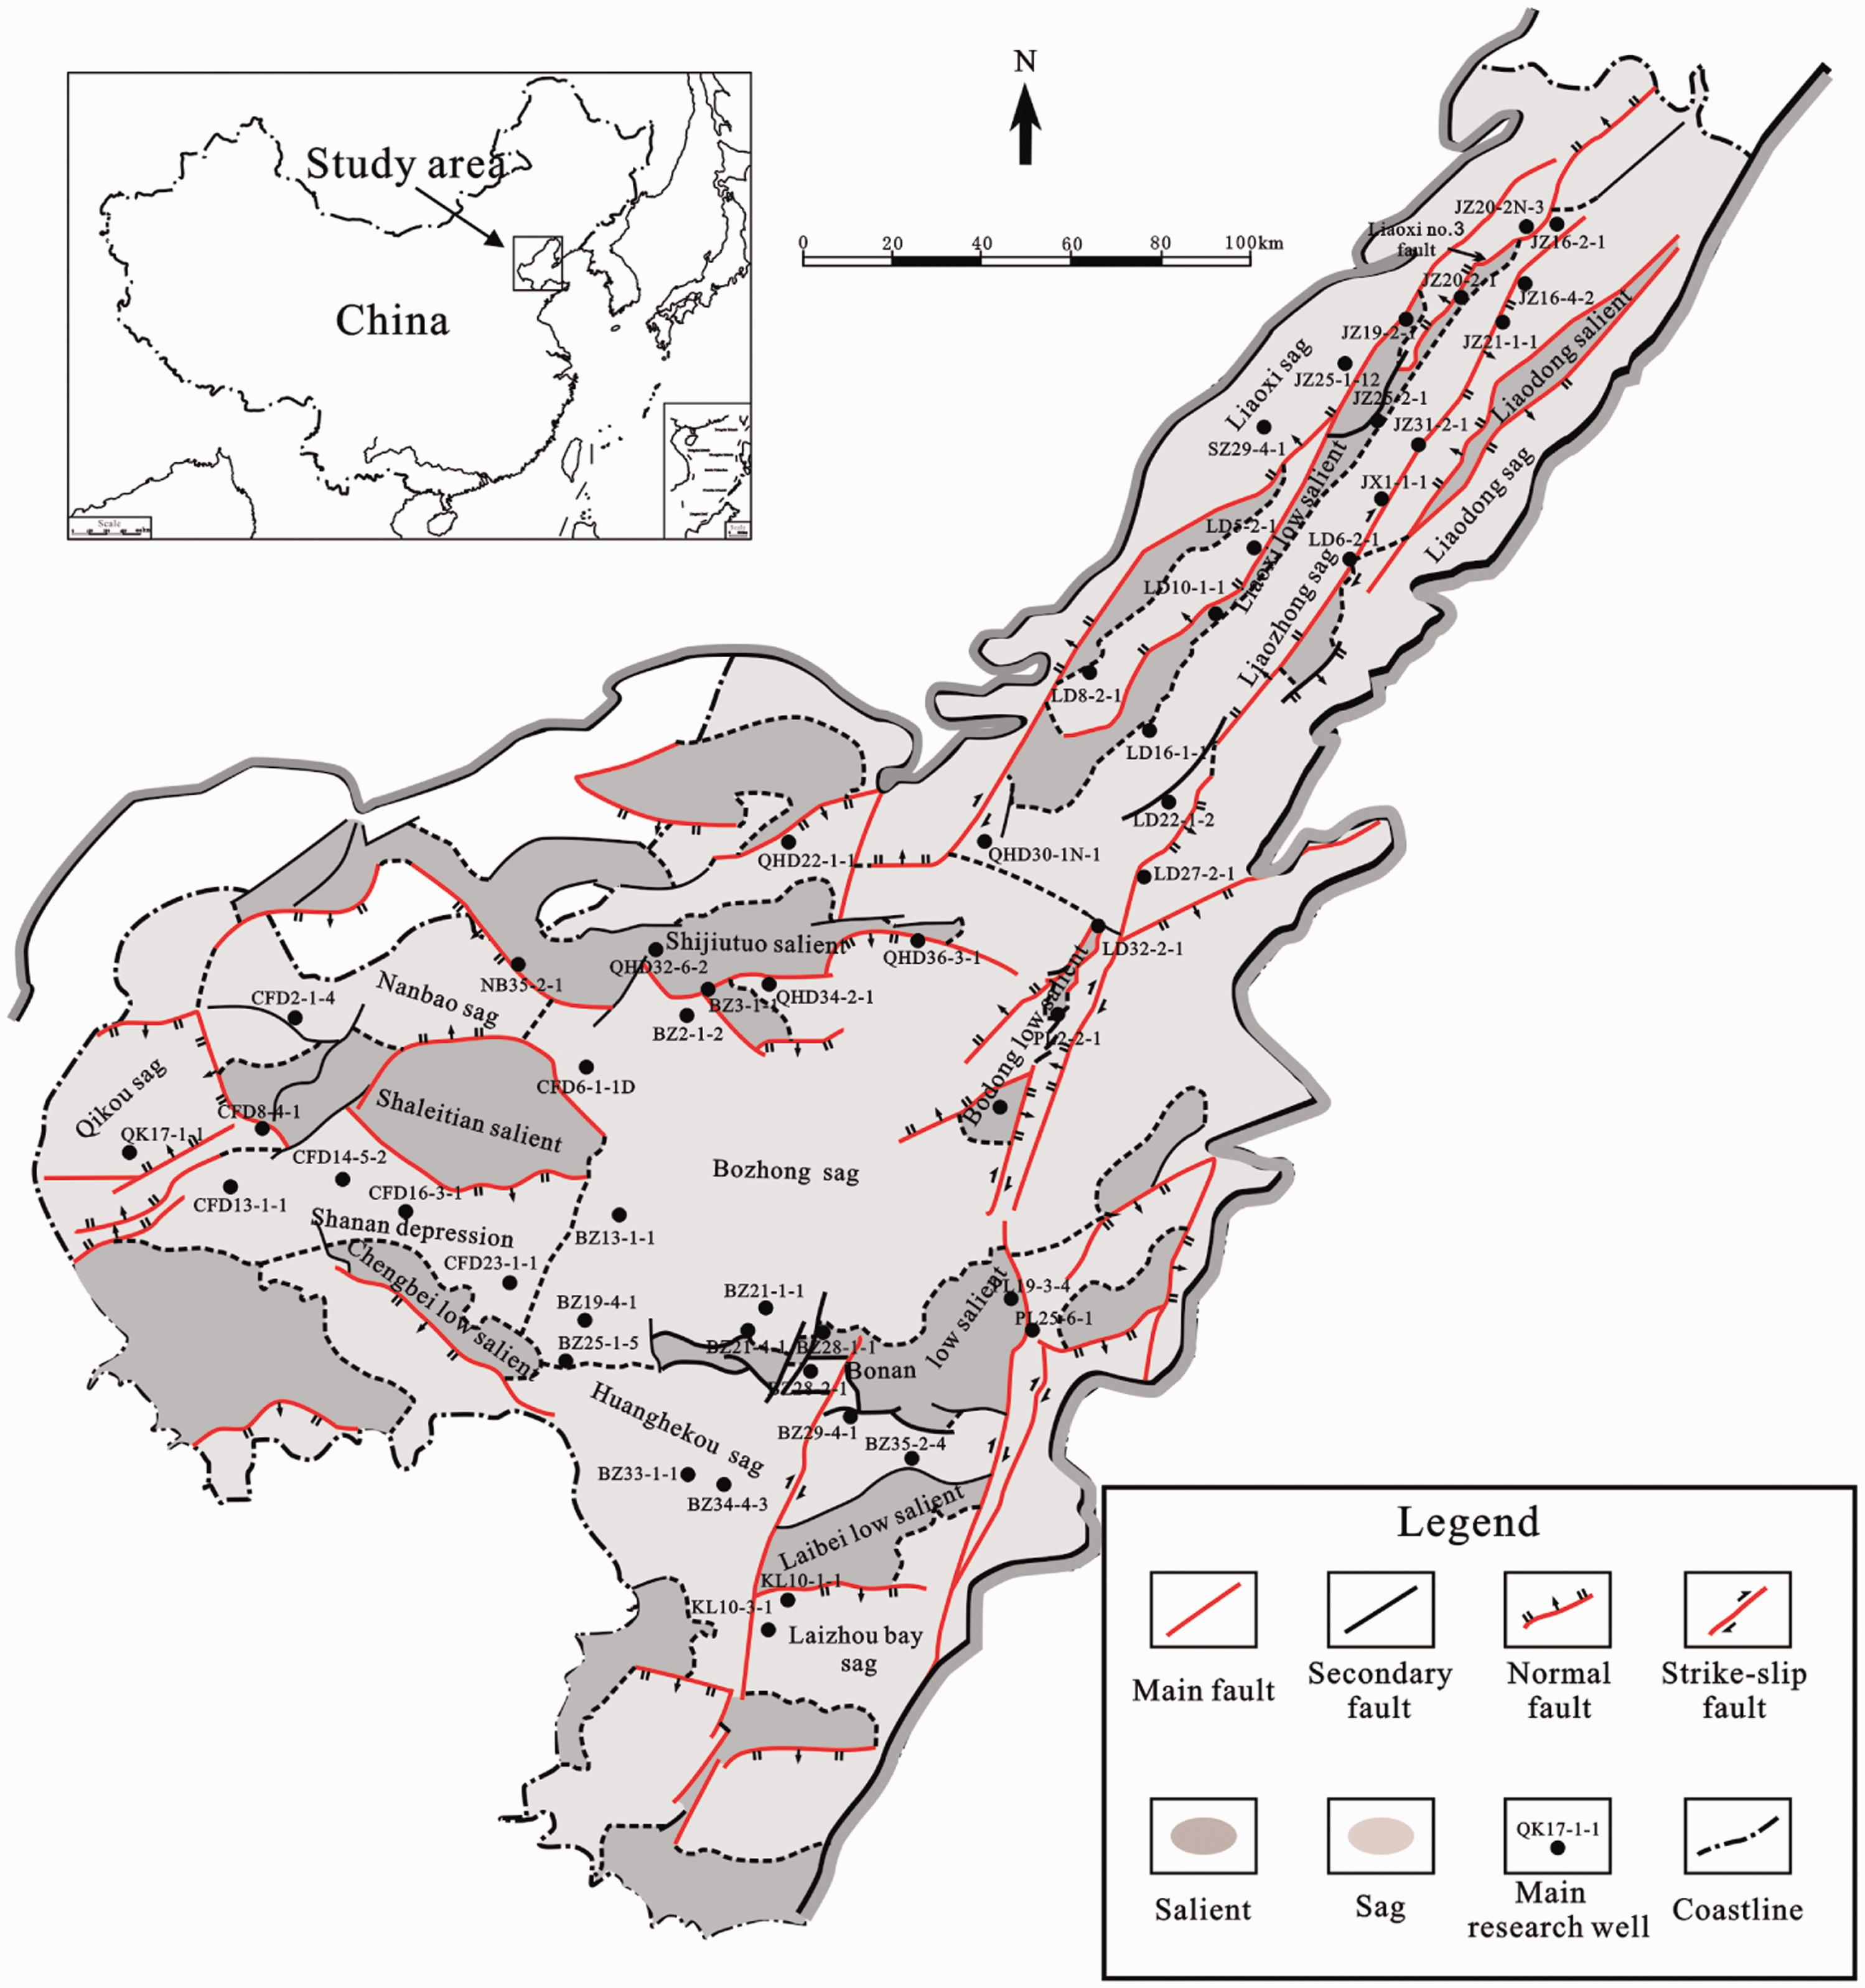
The strata of Cenozoic group mainly develop in the area of Bohai Bay. From its lower part to its upper part, there are Kongdian Formation (Ek), the Shahejie Formation (Es), and the Dongying Formation (Ed) in the Paleogene, the Guantao Formation (Ng), the Minghuazhen.
Formation (Nm) in the Neogene and the Pingyuan Formation (Qp) in the Quaternary. This paper is focused on the Paleogene reservoirs (depth over 2000 m) of the areas of the lower part of the second member of the Dongying Formation and the third member of the Shahejie Formation. The lithology of the lower part of the second member of the Dongying Formation is gray and dark-gray lacustrine mudstone interbedded with deltaic sandstone. The lithology of the third member of the Dongying Formation is dark-gray thick-bedded mudstone, thin-bedded limestone, and inferior shale. The lithology of the first member of the Shahejie Formation is dark-gray mudstone interbedded with thin-bedded shale or limestone and biogenic dolomites. The lithology of the second member of the Shahejie Formation is sandstone interbedded with gray-green or gray mudstone. The lithology of the third member of the Shahejie Formation is gray or dark-gray mudstone interbedded with sandstone, shale, and limestone. The third member of the Shahejie Formation is the main hydrocarbon source intervals of the study area (Guo, 2016) and some sections with deeper burial depth in the third member of the Dongying Formation can also become favorable hydrocarbon source intervals (Figure 2).
Strata integrated column of the Bohai Bay Basin, showing the lithology, sedimentary facies, tectonic evolution, and source–reservoir–caprock combination.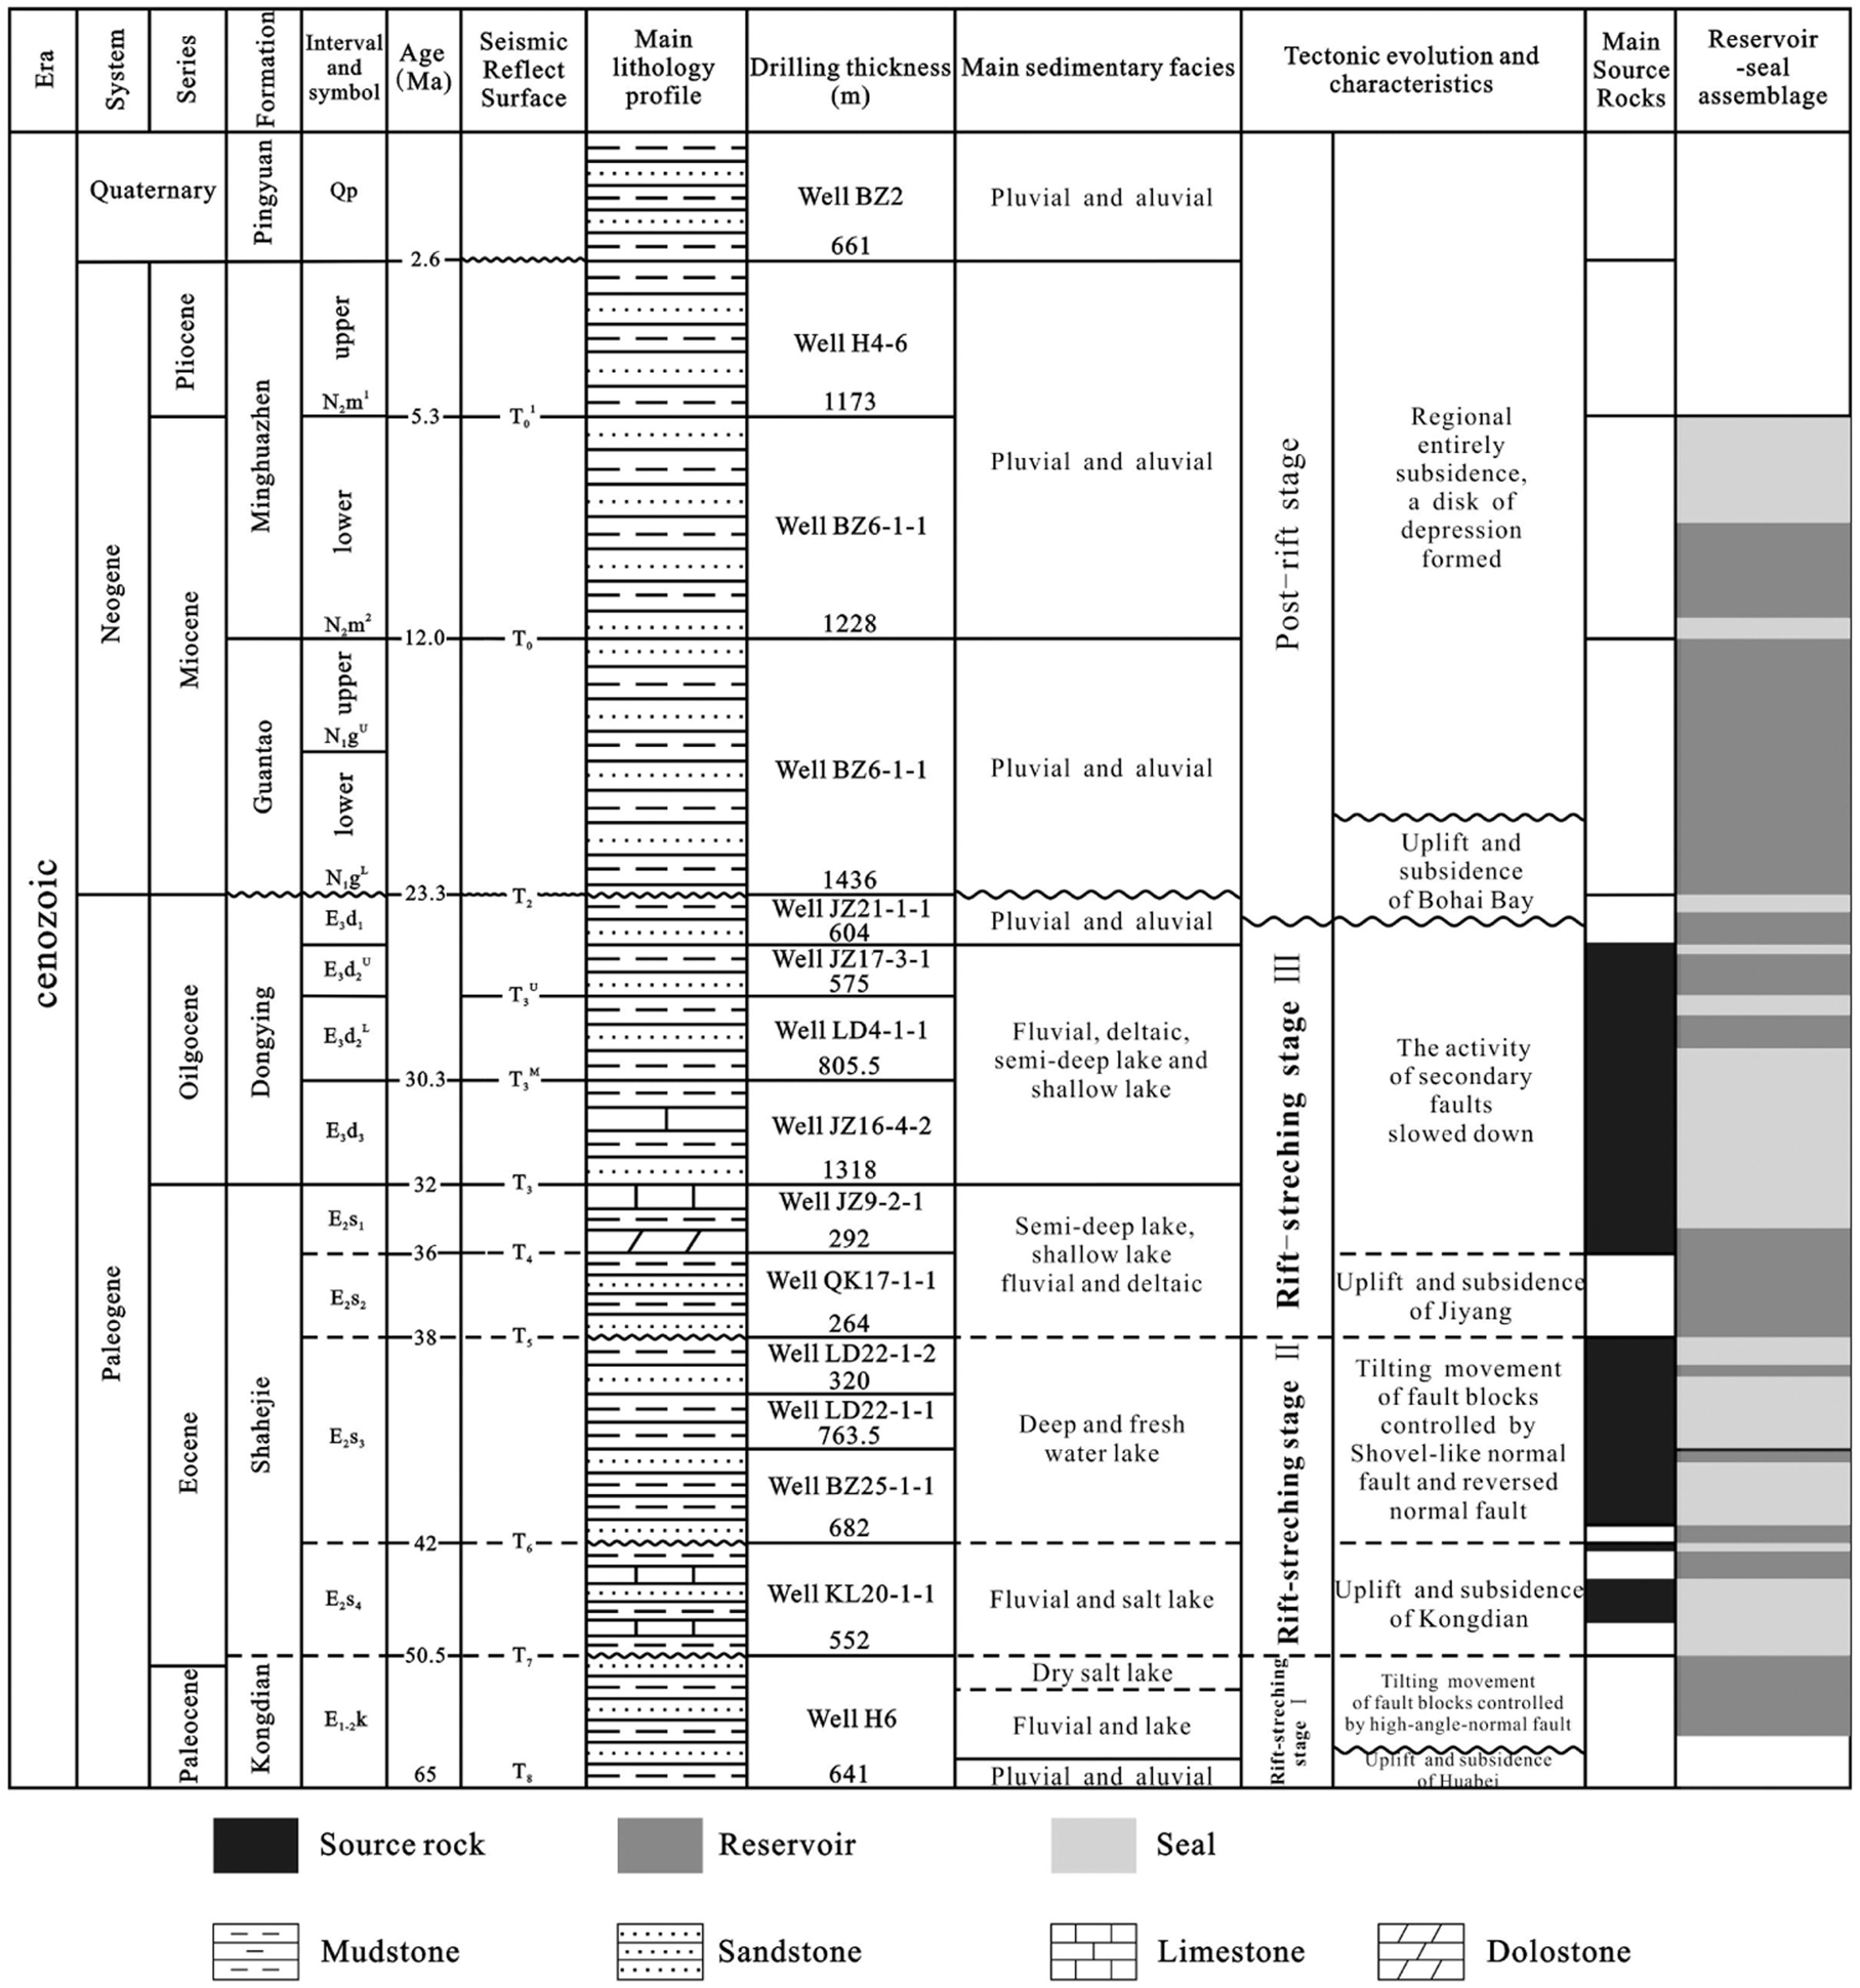
Methodology
The geophysical logging data are obtained from the response of the strata to the electrical property, which are featured by good vertical continuity, high resolution, and reliability and they can directly reflect the actual situation of the strata (Bian and Liu, 2009). Logging parameters such as neutron porosity, dual lateral resistivity, density, and acoustic travel time are especially sensitive to the overpressured strata and therefore they can be applied in the calculation of the pore pressure formation (Yuan et al., 2010). Compared with the resistivity logging data, the acoustic logging data are more precise and better in effect due to their immunity to borehole size, formation temperature, and the water salinity of the formation (Ruth, 2004). In this paper, the acoustic travel time curve is mainly applied in the restoration of fluid pressures in formation pores.
The main methods adopted in the restoration of the formation overpressure are as follows:
Equivalent depth method. This method is based on logging data, and according to effective stress principle, pressure of overlying strata equals the sum of vertical effective stress and pore fluid pressure. If Point A (in overpressure interval) and Point B (in overlying normal pressure interval) have same acoustic travel time, the effective stress of them is also the same. Thus, when the pressures in overlying strata of Point A, B and formation pressure of Point B are obtained, the pressure of Point A in overpressured interval could be figured out; this method is only applied in calculating overpressures caused by disequilibrium compaction of mudstone. Bowers method. This method is proposed in 1994 by Bowers in Exxon Company; it takes into consideration the factor of disequilibrium compaction and the other factors that might influence the abnormal pressure, other factors are unified by fluid expansion principle, thus to attributes the generation of abnormal pressure to the following two major aspects: disequilibrium compaction and fluid expansion. The theoretical basis of the method is still the effective stress law, but without building normal compaction trend line of mudstone, it suggests that the vertical effective stress can be worked out through the original loading curve and unloading curve equations of the vertical effective stress and the sonic velocity. Based on the effective stress law the strata pore pressure can be obtained with the help of the load pressures from the overlying strata and the vertical effective stress. Eaton method. Through this method, the strata pore pressure can be obtained with the help of the power exponent relationship between strata pore pressure and seismic wave travel time or other parameters: Pp = Po − (Po − Ph)(△tn/△t0)n, in which Pp represents strata pore pressure (MPa), Po represents lithostatic pressure (MPa), Ph represents hydrostatic pressure(MPa), Δtn means the travel time of seismic wave in normal compacted mudstone, Δt0 means the travel time of seismic wave in actual mudstone of same depth, n is Eaton index. This method should have supposed deposition compaction condition, and only applied in sand–shale rock sequence, the index of power varies from different areas and boundary wells. Commonly, the exponent value of overpressure caused by undercompaction is accepted as 3, if other mechanisms exist, the exponent is changed, hence, the overpressure caused by other mechanisms could be figured out by this method.
Logging restore with formation pressure profile and characteristics of the development of overpressures
Through the above three methods, the formation pressures from 180 wells in the study area are restored. Checking the pressures with the logging data can not only help us analyze the precision of the prediction on formation pressures but also provide a large quantity of pressure data for the subsequent analysis of the causes of the overpressures. For this reason, the development characteristics of overpressure in the typical wells of the main structural unit of the study area are first analyzed, and the pressure zones of those typical wells were distributed, the strata with pressure coefficient range between 0.9 and 1.1 are identified as normal pressure interval, the strata with pressure coefficient range between 1.1 and 1.4 are identified as transition pressure interval, and the strata with pressure coefficient over 1.4 are identified as super high pressure interval. The transition pressure together with the super high pressure is generally called as abnormal high pressure. Four typical wells have been chosen for overpressure analysis, the description is as follows:
The well BZ25-1-5 is located at the salient between the Bozhong sag and the Huanghekou sag, the profile of the formation pressure of which can be seen in Figure 3, in which starting from N1mu to the depth of 2784 m in the well at the top of E3d2U, the pressure is basically normal. The abnormal pressure of this well generally develops below the depth of 2784 m at the top of E3d2U, the strata between E3d2U and E2s3L commonly develops overpressures with the highest pressure coefficient reaching 1.75. In the sections below the E2s3L, the formation pressure begins to drop, with the measured formation pressure value in good agreement with the calculated formation pressure value.
Composite profile of the formation pressure of well BZ25-1-5.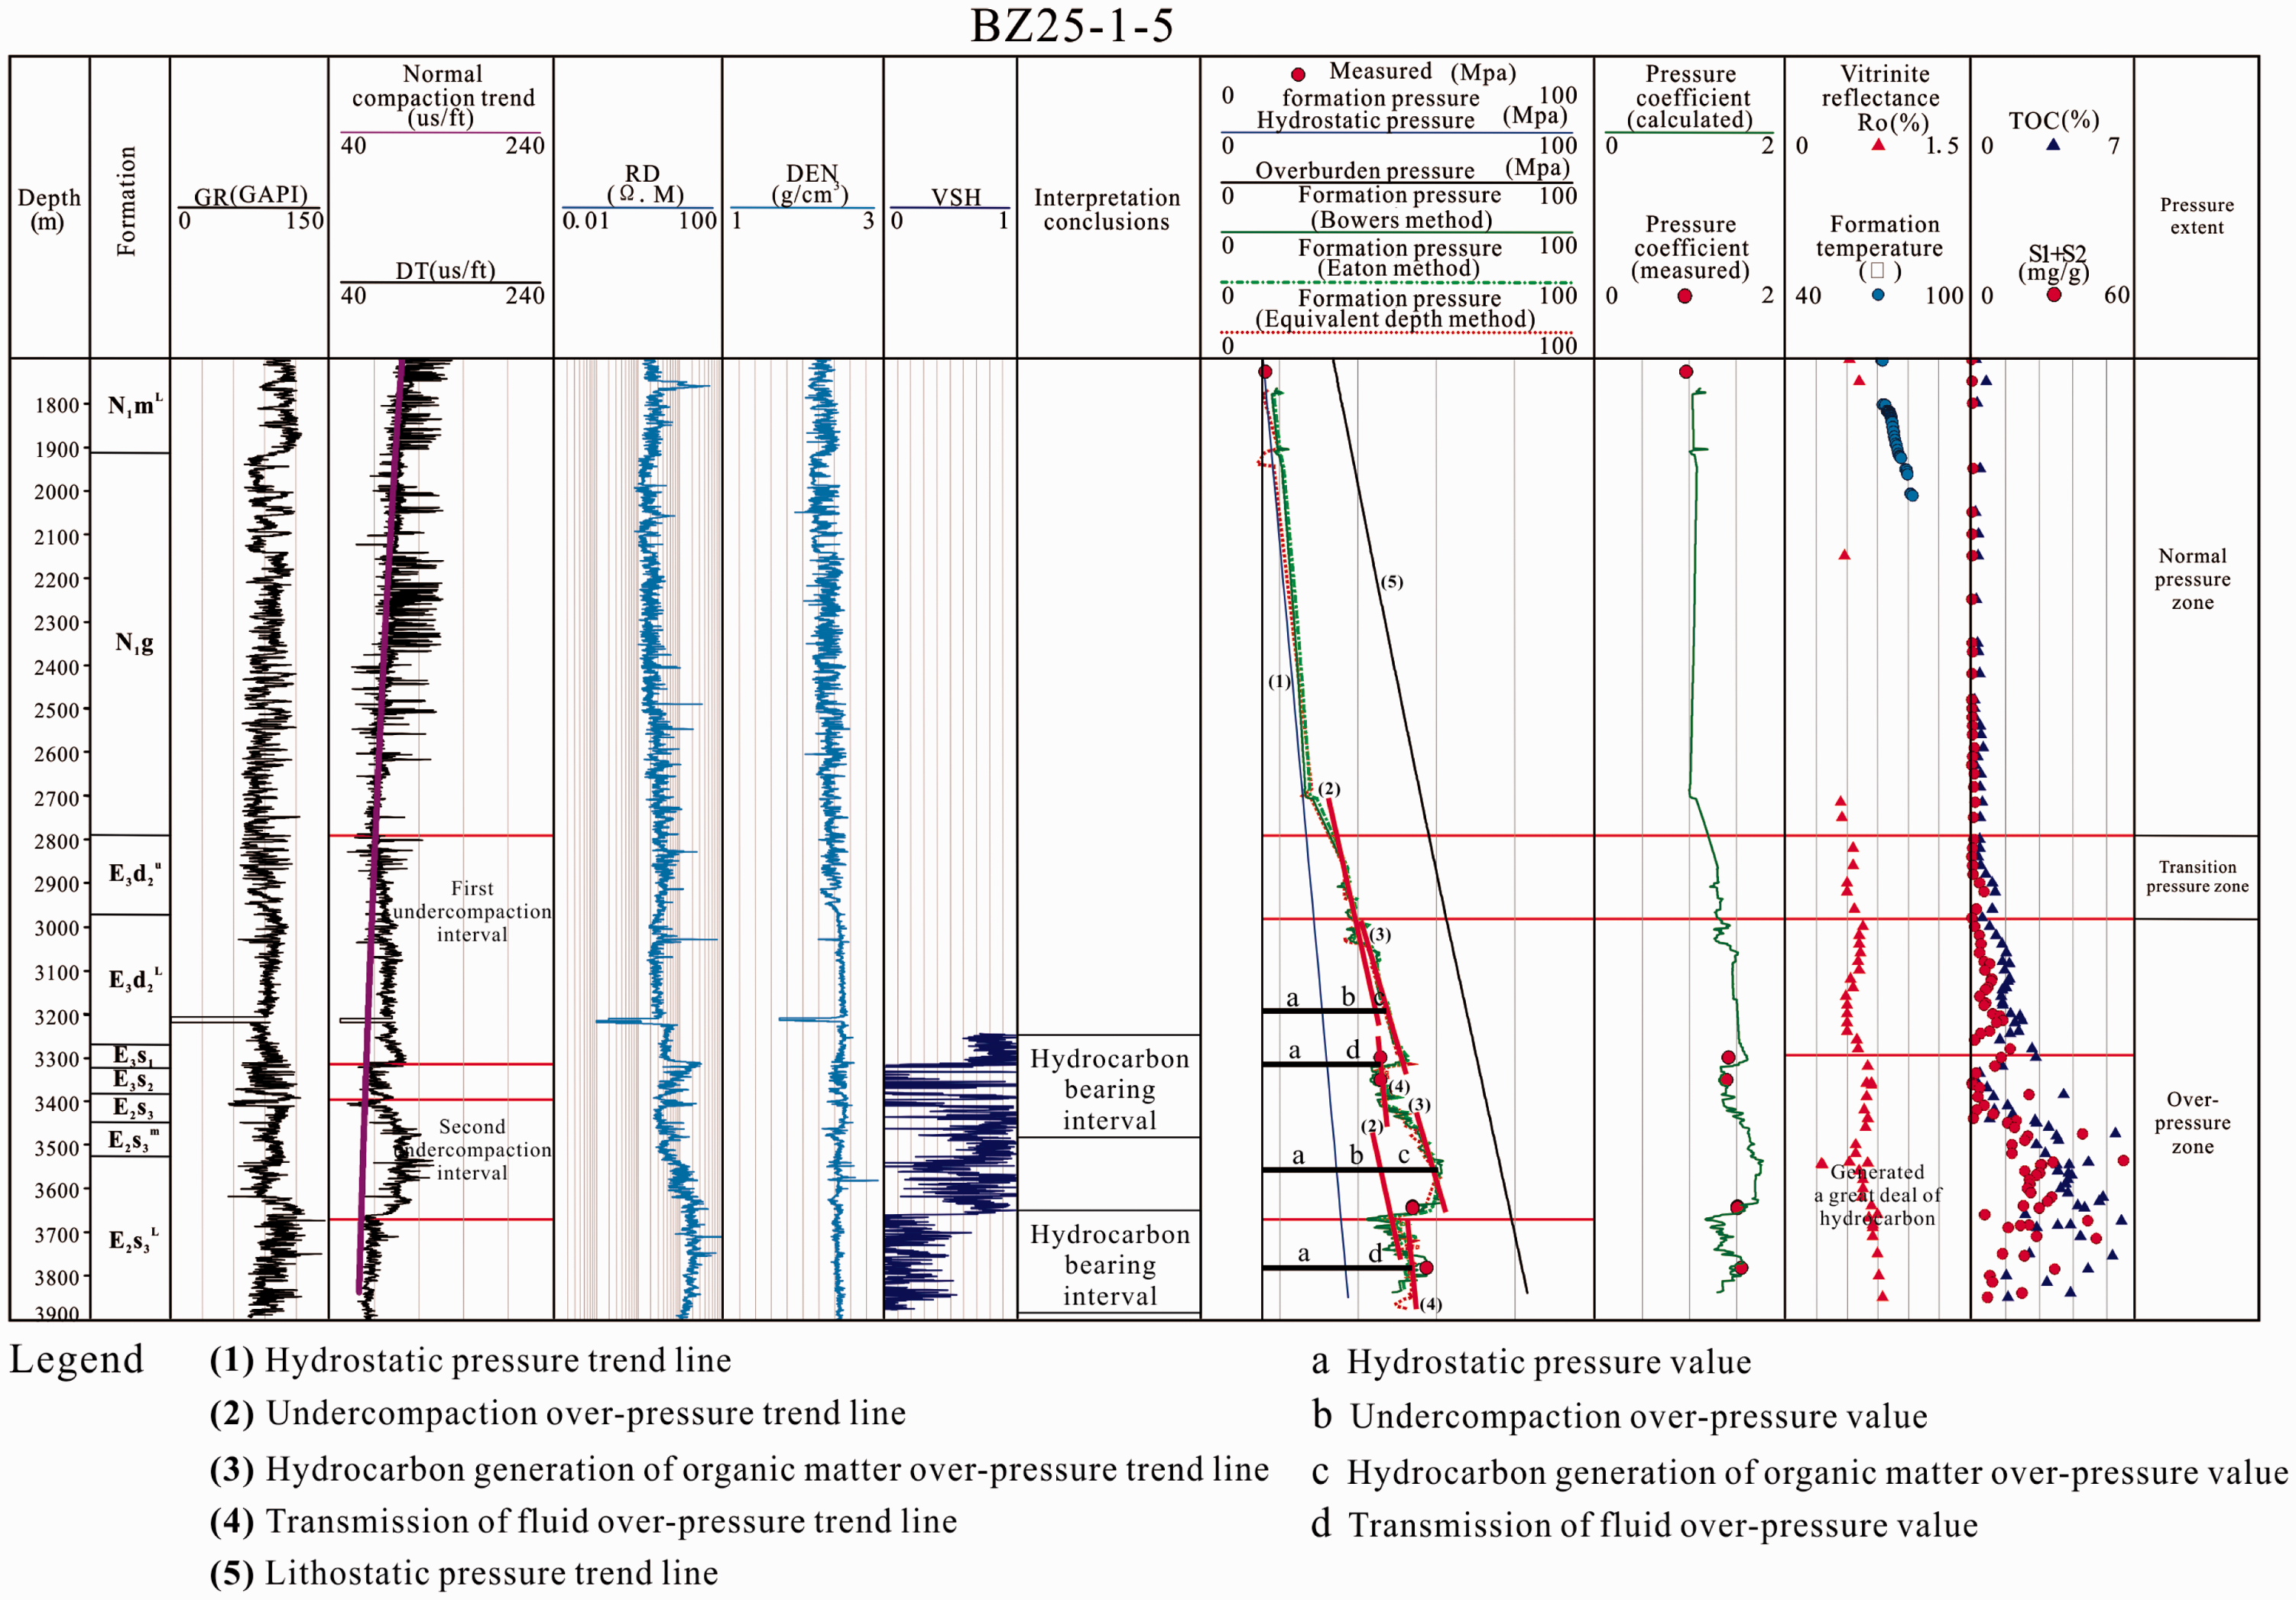
The well Qk17-1-1 is located at Qinan step-fault zone in the south of Bohai Bay, the profile of the formation pressure of which can be seen in Figure 4, starting from the upper part of the Minghuazhen Formation (N1mu) to the bottom of the upper section of the second member of the Dongying Formation (E3d2u) (at the depth of 2738.7 m), the pressures are basically normal, these strata are regarded as the normal pressure interval. The abnormal pressure of this well starts from the top of the lower part of the second member of the Dongying Formation (E3d2L) and the abnormal pressure generally develops in the lower part of the second member of the Dongying Formation (E3d2L), the third member of the Dongying Formation (E3d3), and the upper part of the first member of the Shahejie Formation (E2s1). The maximum pressure coefficient is 1.53. The measured formation pressure value is in a good agreement with the calculated formation pressure value above the second member of the Shahejie Formation (E2s2). Normally, there exists a corresponding relationship among the overpressured formation section, the acoustic travel time and the abnormal resistivity. However, some deviation can be found in the calculated pressure and the measured pressure in a few measuring points in the second member of the Shahejie Formation. For example, at the depth of 3310.5 m in the well, the measured pressure coefficient is 1.15 while the calculated pressure coefficient is 1.40; the difference in the data of these measuring points may due to the abnormal acoustic travel time caused by the great differences in lithology there.
Composite profile of the formation pressure of well QK17-1-1.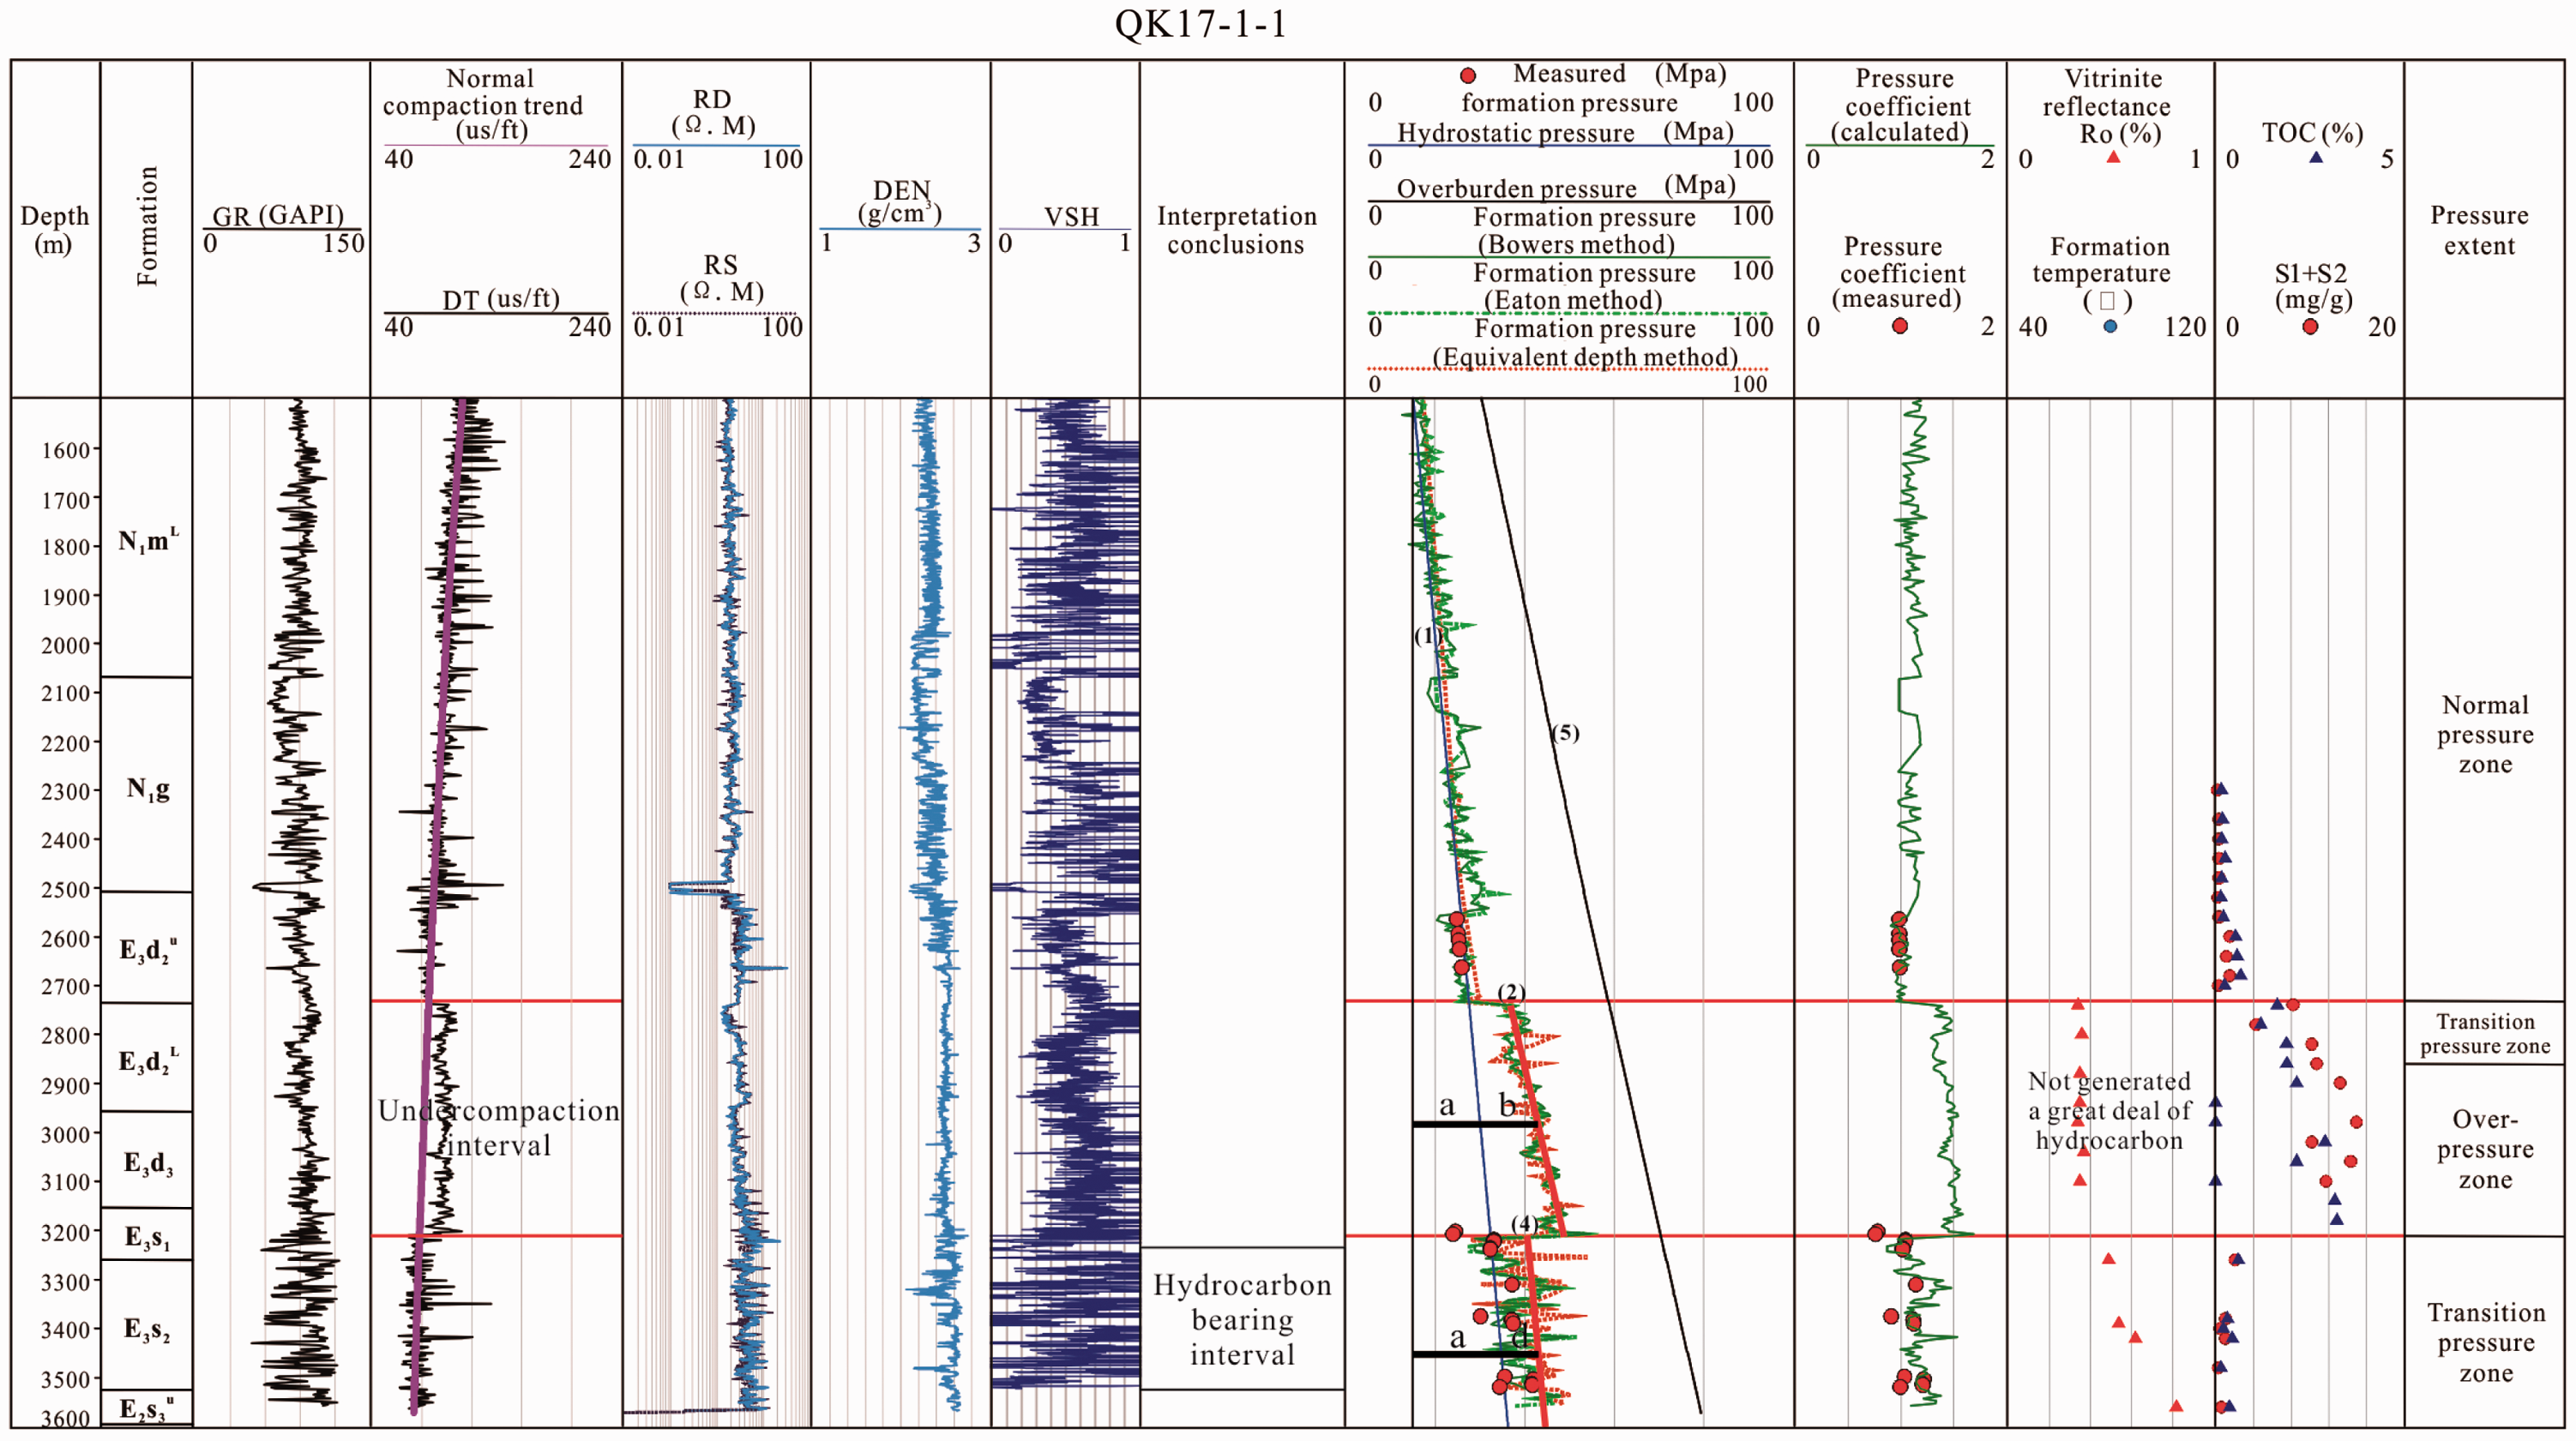
The well KL-10-1-1 is located at the downthrow side of the fault in the ramp region between the Laizhou Bay sag and the Lai bei low salient, the profile of the formation pressure of which can be seen in Figure 5, in which from N1mu to the depth of 2818.7 m in the well at the middle part of E2s3M is regarded as the normal pressure interval. The abnormal pressure of this well starts from the middle part of E2s3M (2818.7 m). Below this depth, the overpressure generally develops and its degree tends to amplify sharply. According to the pressure coefficient division standard, the transition pressure interval is from the middle of E2s3M (at the depth of 2818.7 m) to the depth of 2920 m. The super high pressure interval is from the depth of 2920 m to the bottom of E2s3M, the maximum pressure coefficient of this well reaching 1.70. The measured pressure coefficient is between 1.00 and 1.14, which mainly occurs at the top of the overpressured zone. The calculated value of its formation pressure is in good agreement with its measured value.
Composite profile of the formation pressure of well KL10-1-1.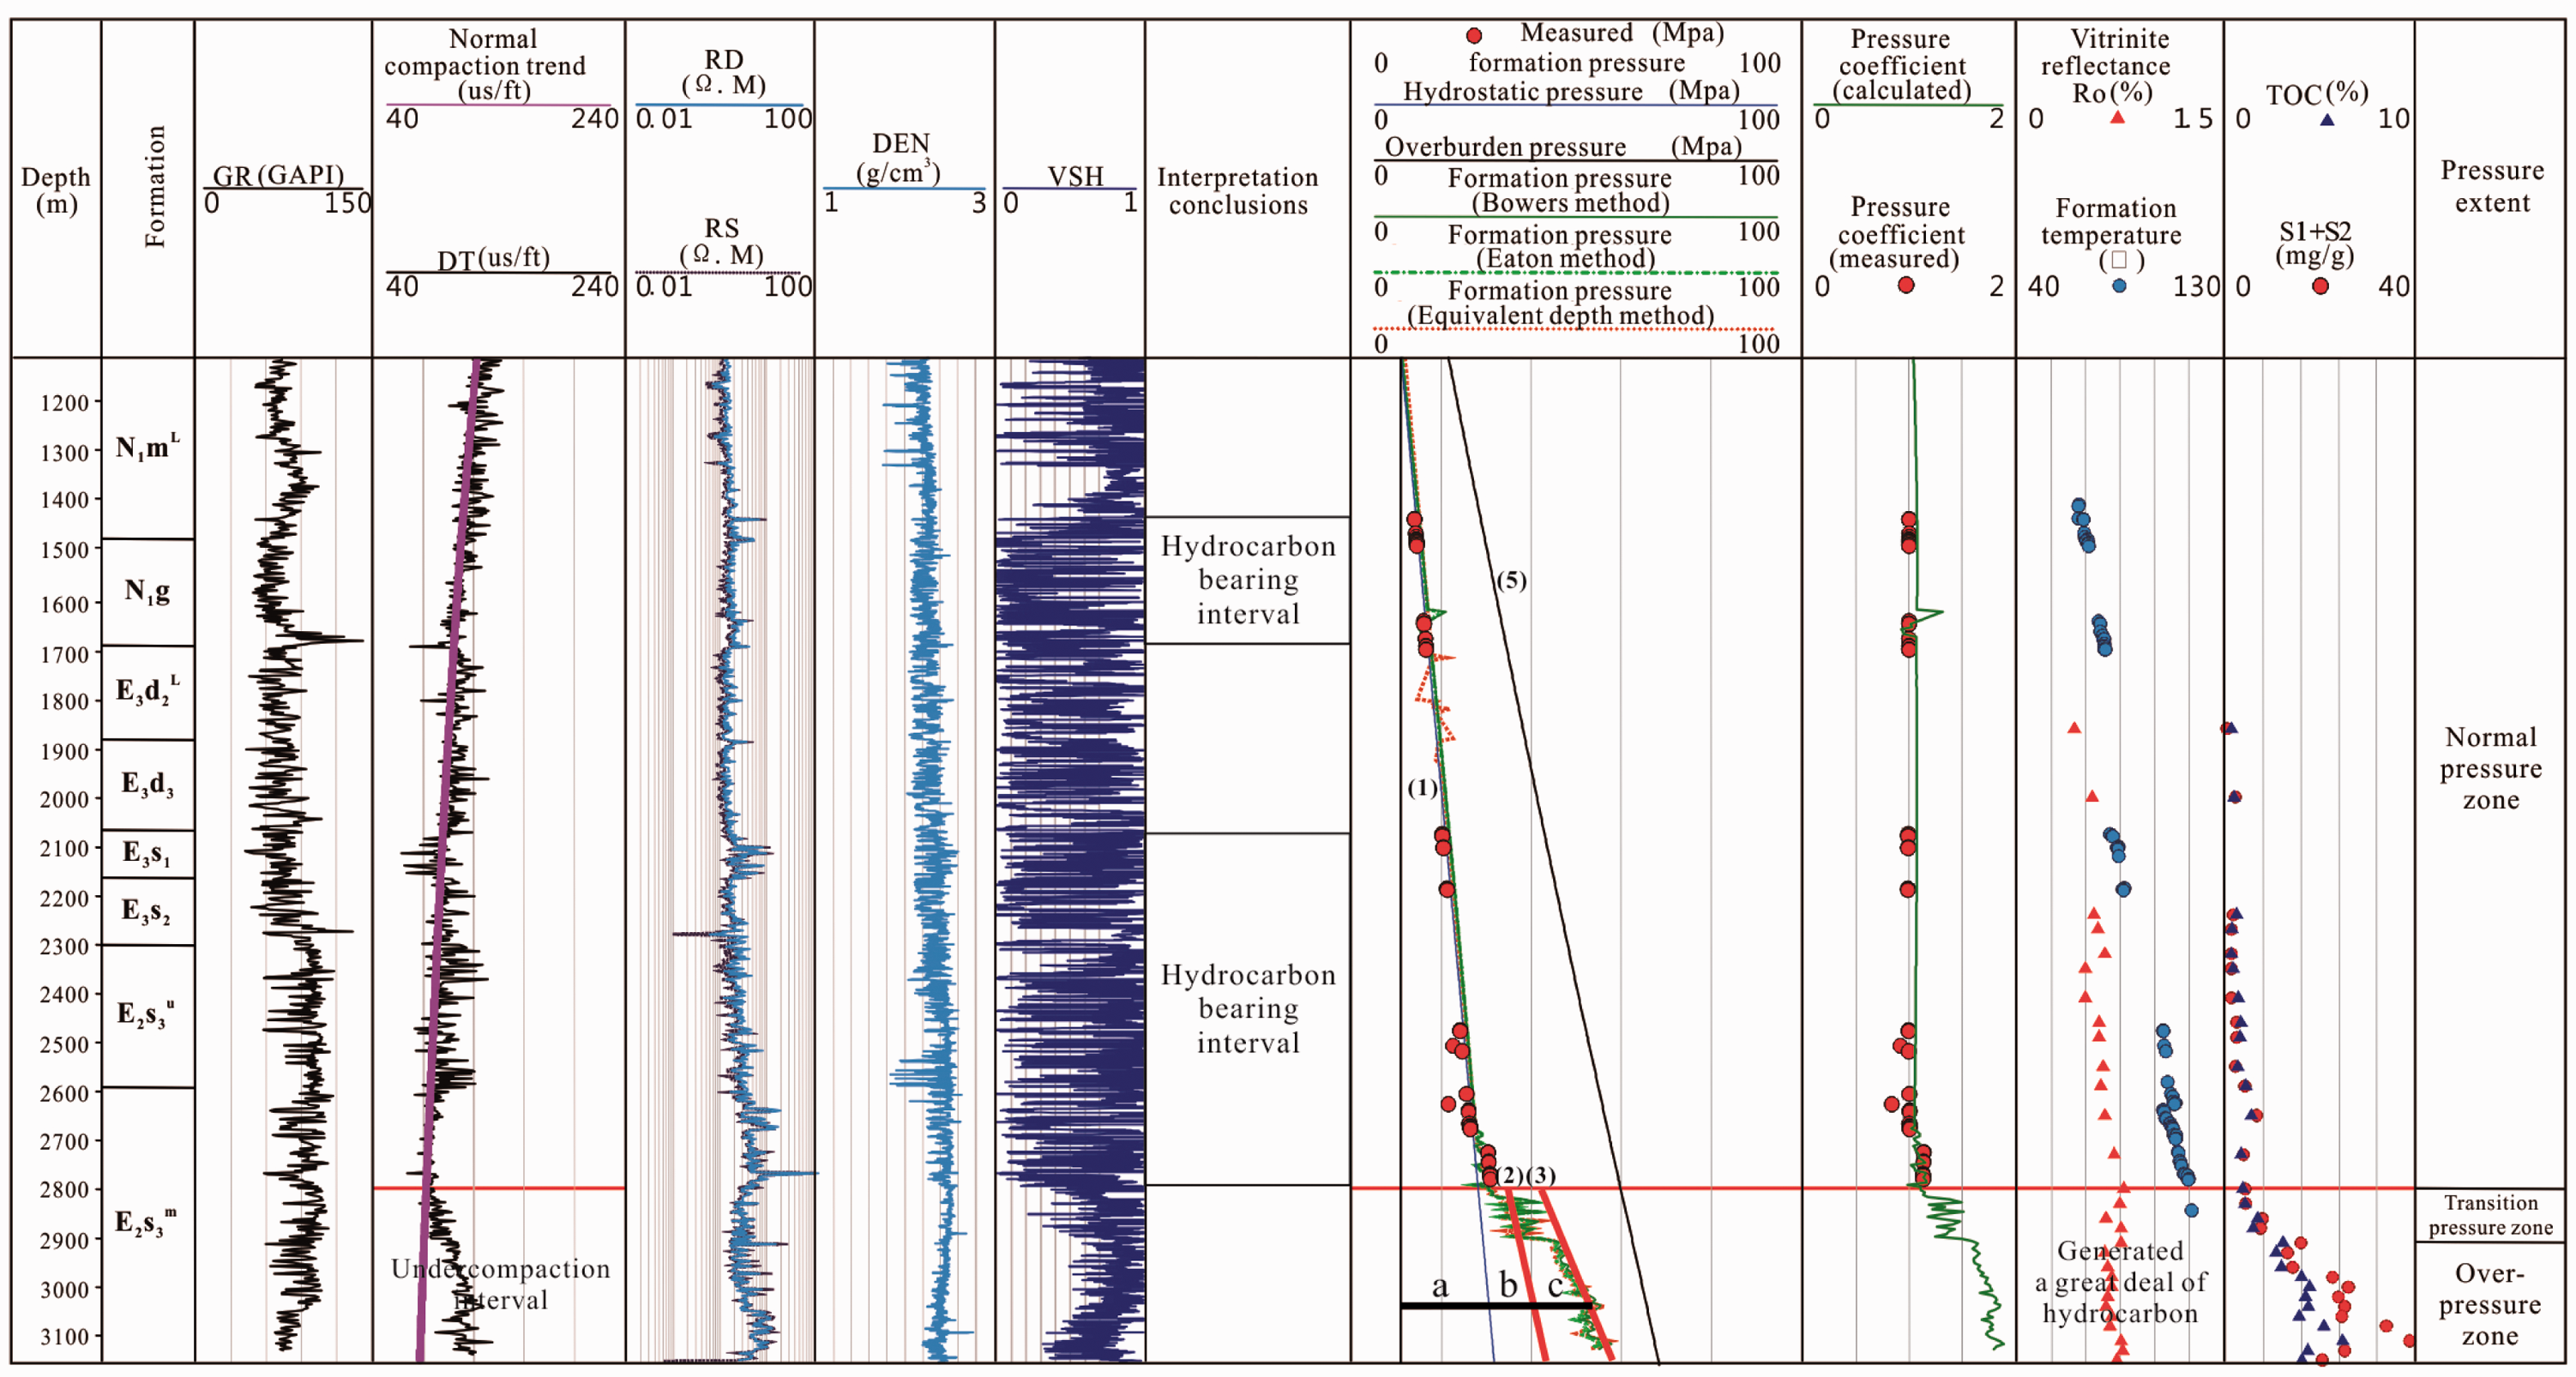
The well JZ20-2N-3 is located in the ramp region between the Liaoxi sag and the Liaoxi fault No. 3, the profile of the formation pressure of which can be seen in Figure 6, in which from N1mL to the upper part of E3d2L (at the depth of 2150 m), the pressure is basically normal. The abnormal pressure of this well starts at the depth of 2150 m in the upper part of E3d2L, and the super high pressure generally develops below the middle of the E3d2L (at the depth of 2270 m), with its highest pressure coefficient close to 1.70. According to the pressure coefficient division standard, the transition pressure interval is from the upper E3d2L (at the depth of 2150 m) to the middle of E3d2L at the depth of 2270 m. The super high pressure interval is from the lower E3d2L at the depth of 2270 m to the bottom of E2s1 at the depth of 3070 m. The pressure begins to drop from the depth of 3070 m, so the strata from the bottom of E2s1 at the depth of 3070 m to the bottom of E2s3 are divided as another transition pressure interval. The measured formation pressure coefficients of this well are between 1.42 and 1.43. For a few measuring points, the calculated pressure value is smaller than the measured pressure value.
Composite profile of the formation pressure of well JZ20-2N-3.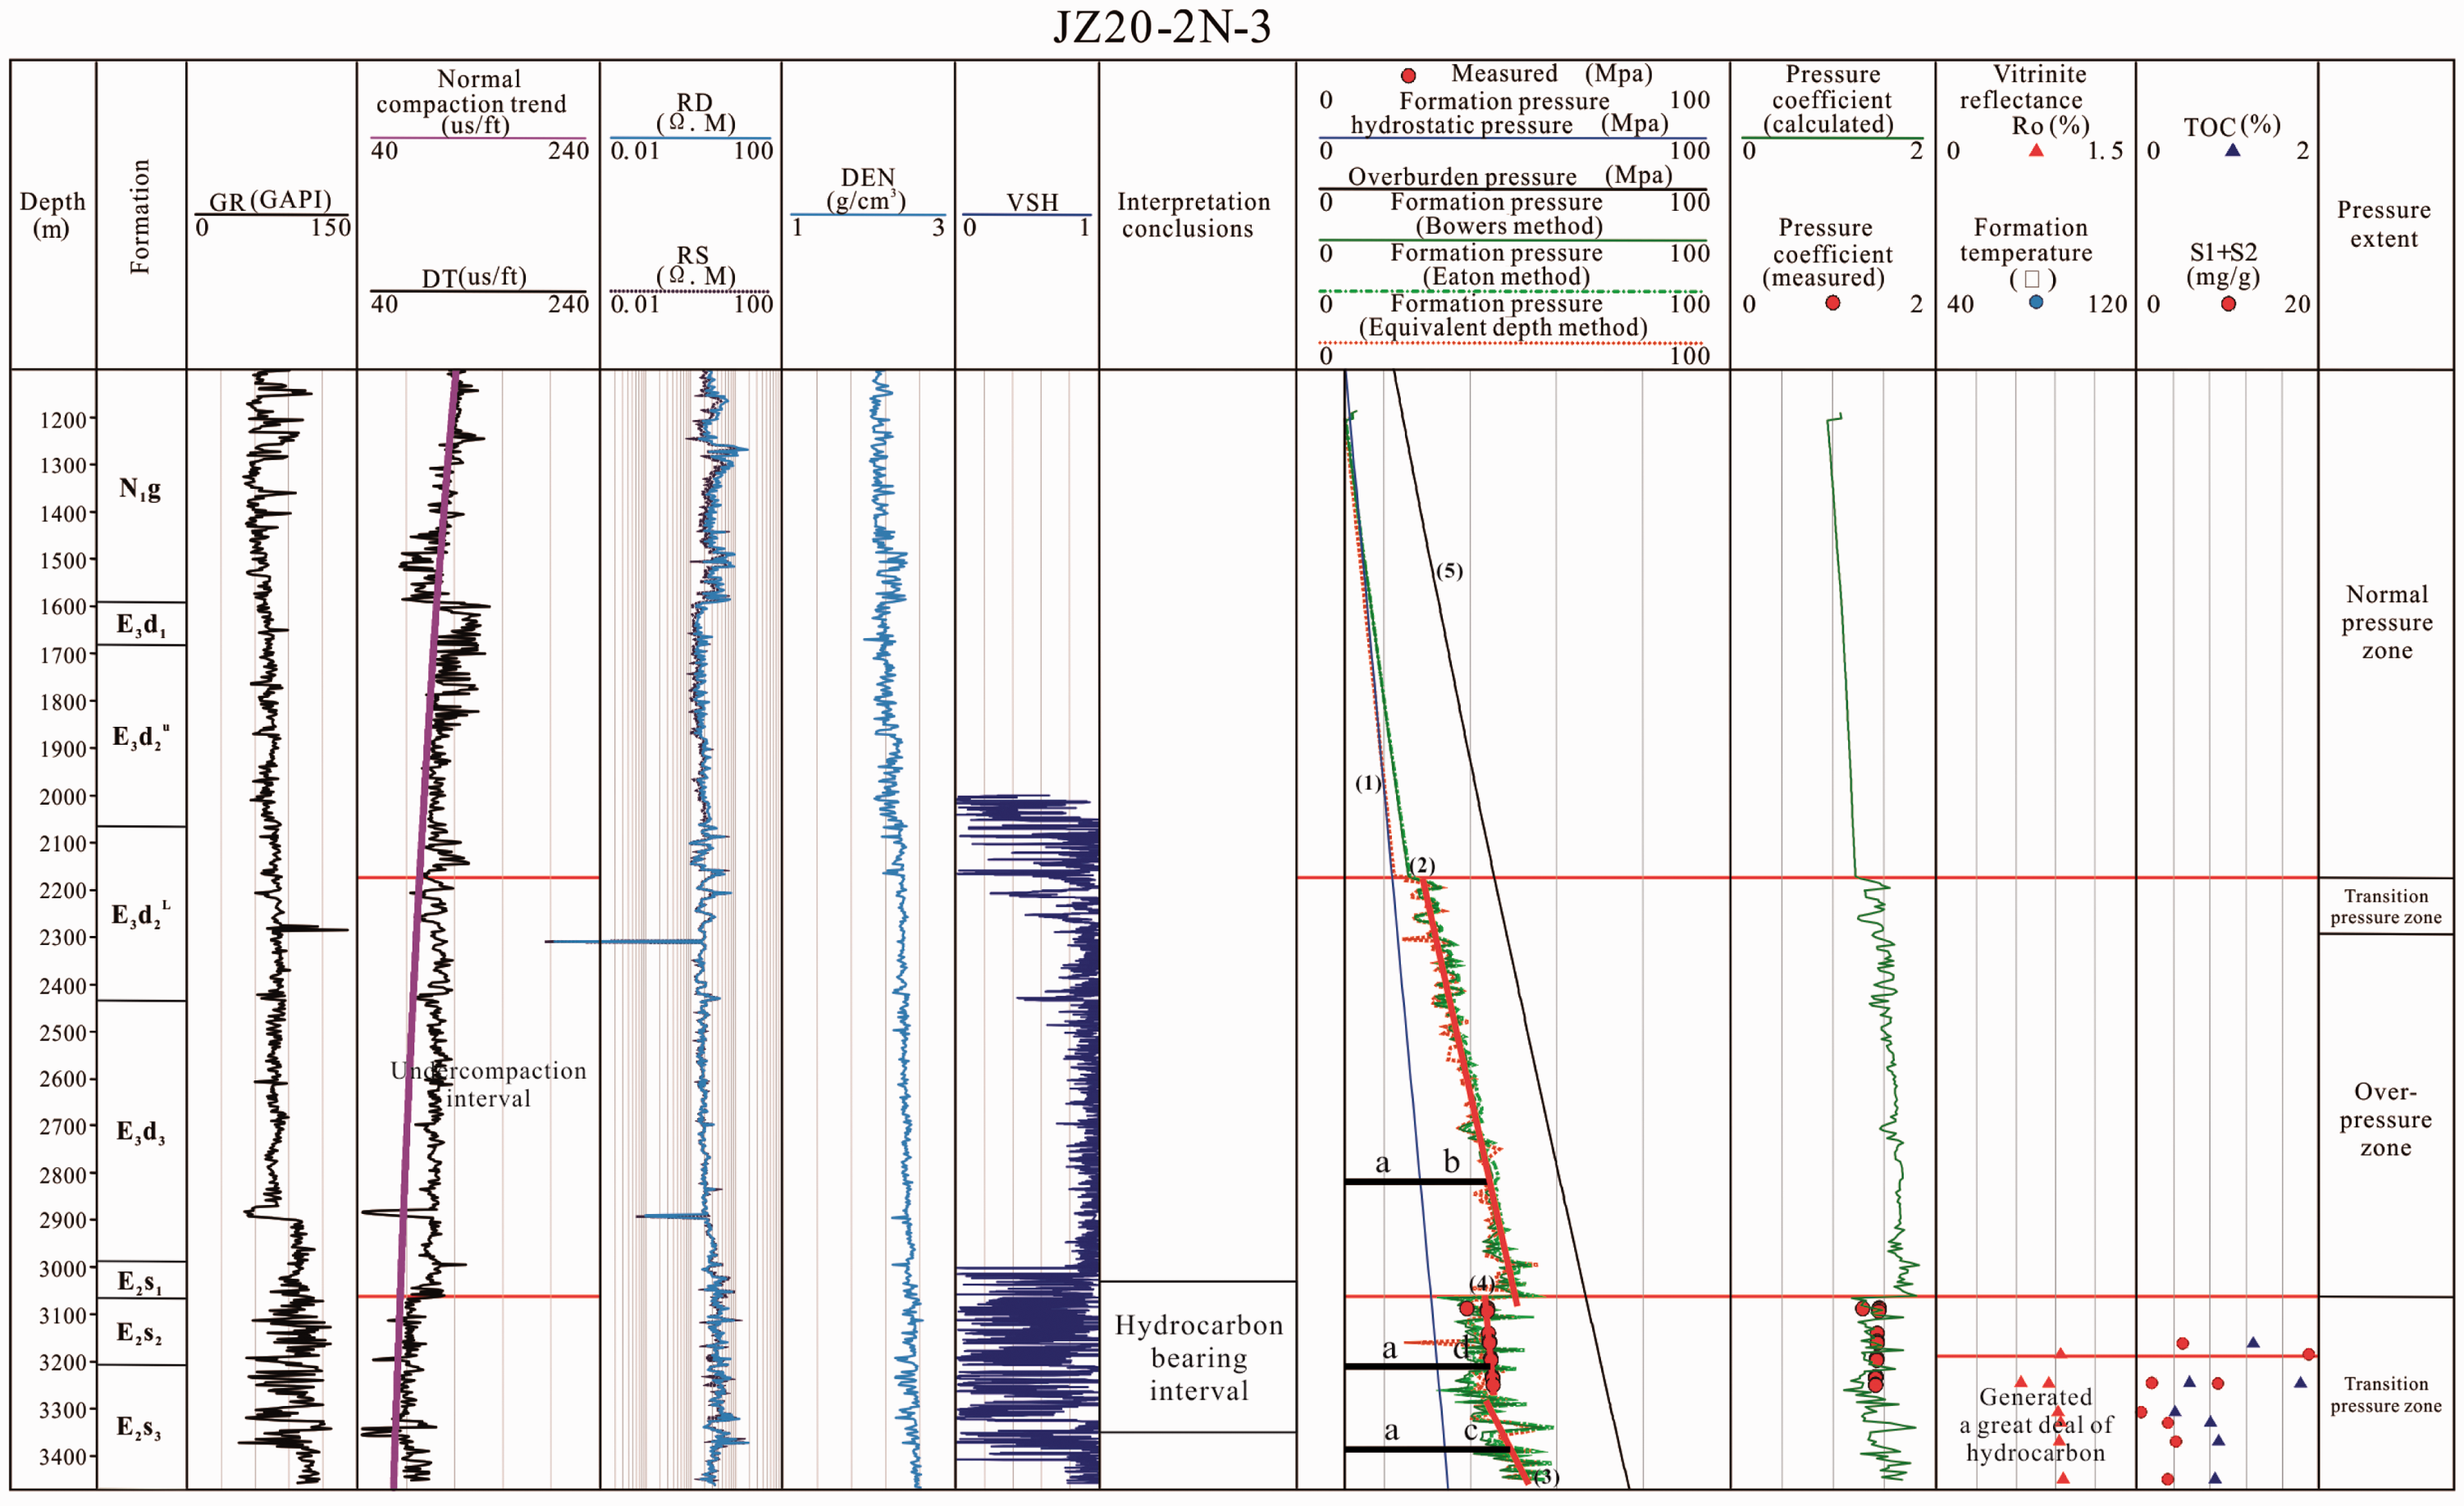
Distribution characteristics of formation overpressures
To the typical overpressure basins like Bohai Bay, an understanding of the patterns of the Paleogene reservoir pressures from a regional perspective and the evaluation of the genetic mechanisms of the overpressures in different formations can not only ensure the precise prediction of the formation pressure of the undrilled sections within the study area before drilling but also guide the exploration of oil and gas. For example, the lateral variation of the overpressures of highly porous sandstone is quite likely the evidence of the parallel migration of oil and gas (Luo, 2007). In this paper, from 180 single well formation curves, 60 curves are chosen. (The wells are on or near 9 2D seismic interpretation profiles in our study area.) On the basis of the 60 well formation curves, a fence diagram of formation pressure distribution in Bohai Bay is drawn (Figure 7), the purposes of which are as follows: the first and the main purpose is to explore the characteristics of the vertical and horizontal distributions of the overpressures of the Bohai Bay area; the second one is to evaluate the genetic mechanisms of the different formations. Then, the main overpressured Paleogene layers—namely the third member of the Dongying Formation; the first, second member of the Shahejie Formation; and the third member of the Shahejie Formation—have been set out as examples to analyze the plane distributive features of the Paleogene overpressures in Bohai Bay area.
Fence diagram of formation pressure distribution in the Bohai Bay Basin.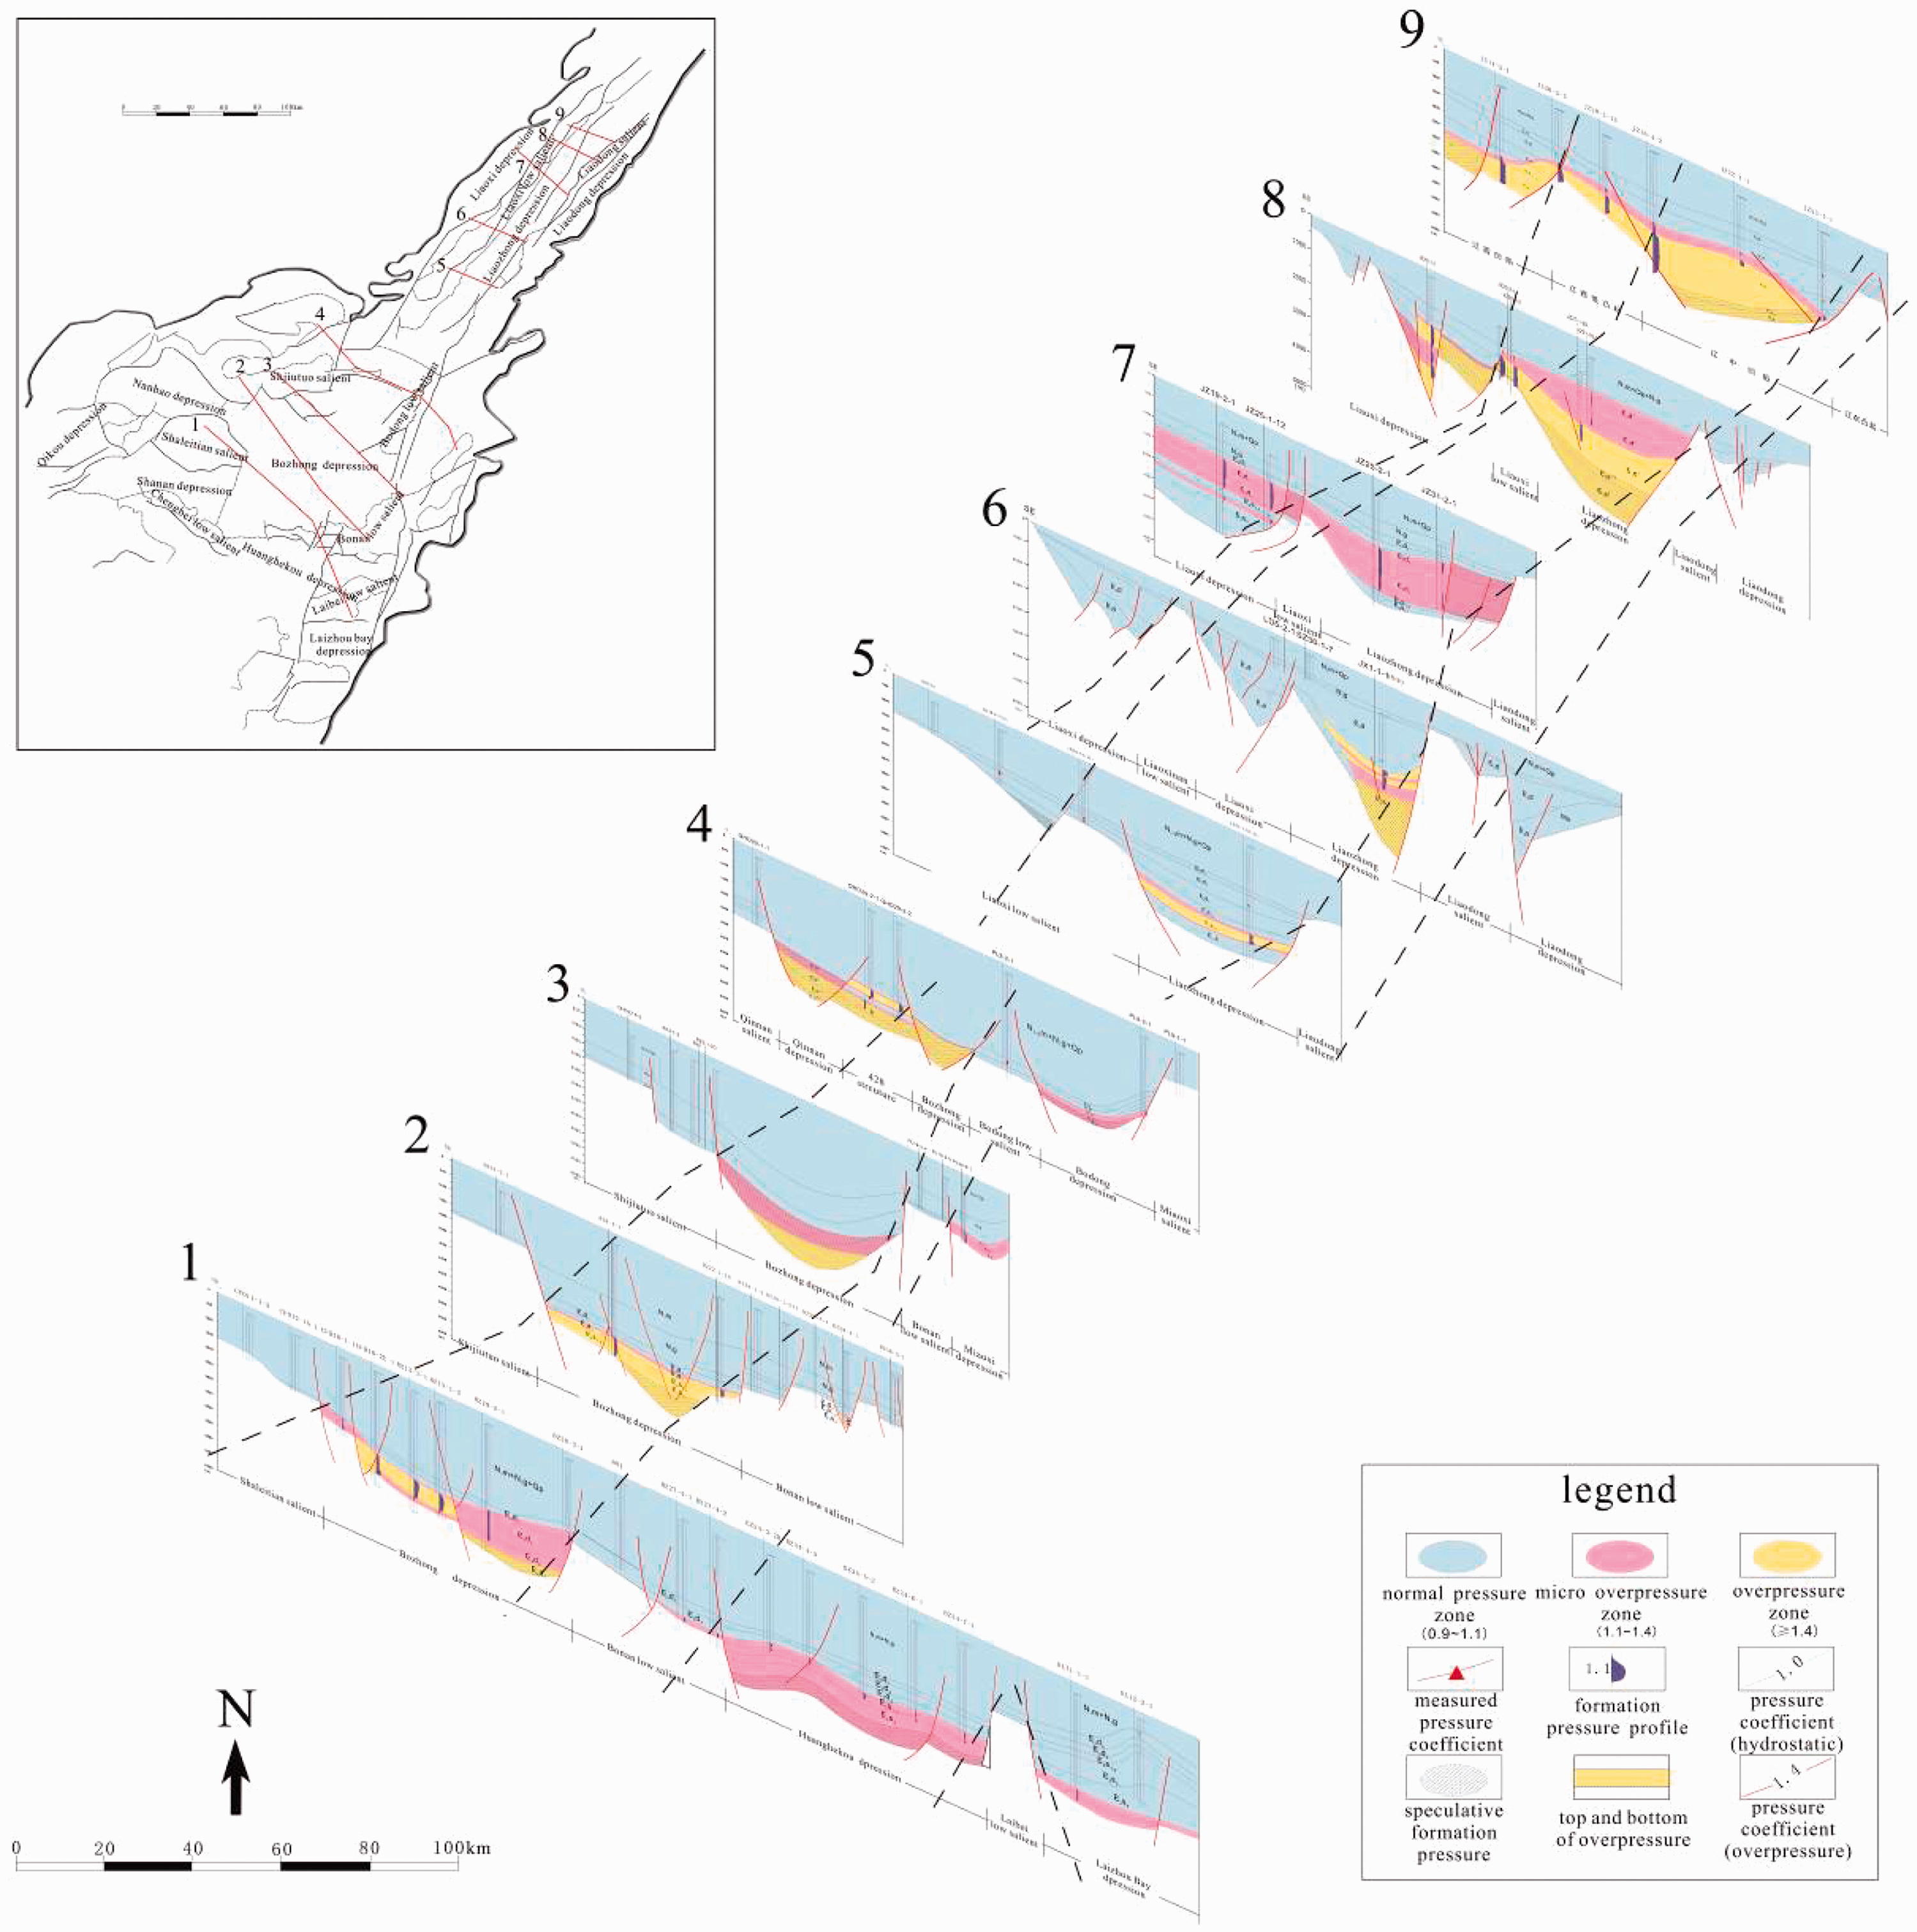
Distribution features of formation overpressures horizontally and vertically of Paleogene reservoirs
Starting from the second member of the Paleogene Dongying formation in Bohai Bay area, overpressures begin to develop, with the central parts of the sag and the peripheral ramp regions being the main areas for the development of overpressures. Comparatively speaking, the depth of the layers in the central salient is shallow, with the pressure being basically normal. Within Bohai Bay, the sags around the central part of Bohai Bay and the north of Liaodong Bay develop the biggest degree of overpressures. Along the ninth survey line in the north of Liaodong Bay, overpressure develops extensively. In the second member of the Dongying Formation, transitional overpressure (pressure coefficient between 1.1 and 1.4) develops, and strata below the third member of the Dongying Formation are defined as overpressured zones. The eighth survey line is similar to the ninth survey line and overpressures extensively develop below the third member of the Dongying Formation. From the horizontal distribution of the formation pressures of the second member of the Shahejie Formation along the eighth and ninth survey lines, it can be seen that starting from the Liaoxi sag and the Liaodong sag to the direction of the Liaoxi salient, formation depth drops. The formation overpressure extent tends to decrease, which indicates that the oil and gas migrate and accumulate from the lateral sags to the Liaoxi salient by the driving of overpressure, which is in agreement with the research results of oil and gas migration and law of oil and gas field distribution (Xu et al., 2011). Along the seventh survey line the overpressure degree is relatively smaller, with only transitional overpressure being observed. However, the development of transitional overpressures is with excellent lateral continuity. Alone the fifth and sixth survey lines, overpressures can only be observed in the Liaozhong sag. Transitional overpressure belt and overpressure belt appear alternatively. Comparatively speaking, the overpressure degree in the Shahejie Formation is larger. The first, second, third, and fourth survey lines all go through the Bozhong sag. The overpressure degree of the sags around the Bozhong sag is the largest. In spite of the fact no drilling has done that reached the Shahejie Formation, it can be safely assumed that large degree overpressure develops in the Shahejie Formation and the overpressure degree in the Huangheko sag is smaller than that of the Bozhong sag. From the north to the south, with the fifth survey line as the border, the development of the overpressure has experienced a process of decreasing and increasing. The third member of the Dongying Formation and the third member of the Shahejie Formation are the study areas, in which the Paleogene reservoir overpressure degree is the largest. The state of the distribution of overpressures is mainly controlled by the tectonic framework of “sag–salient.”
Distribution features of the Paleogene overpressures
Distributive features of the third member of the Dongying Formation
In Figure 8, area with red shadows is the calculated overpressure data of the third member of the Dongying Formation by logging curves (the biggest pressure coefficient). In the study area, the center area of main sags and ramp regions around them all develops overpressures, especially Bozhong Sag and the northern Liaodong Bay develop big extent of overpressures. In well JZ16-4-2, the bottom of the third member of the Dongying Formation has the biggest overpressure extent, with a pressure coefficient of 1.98. Generally, the pressure coefficient is decreasing from the center to the edge of the sag, to become a normal hydrostatic pressure at last.
Superimposition of the depositional rate and pressure coefficient of the third member of the Dongying Formation, the Bohai Bay Basin (the depositional rate is from data of CNOOC (2010)).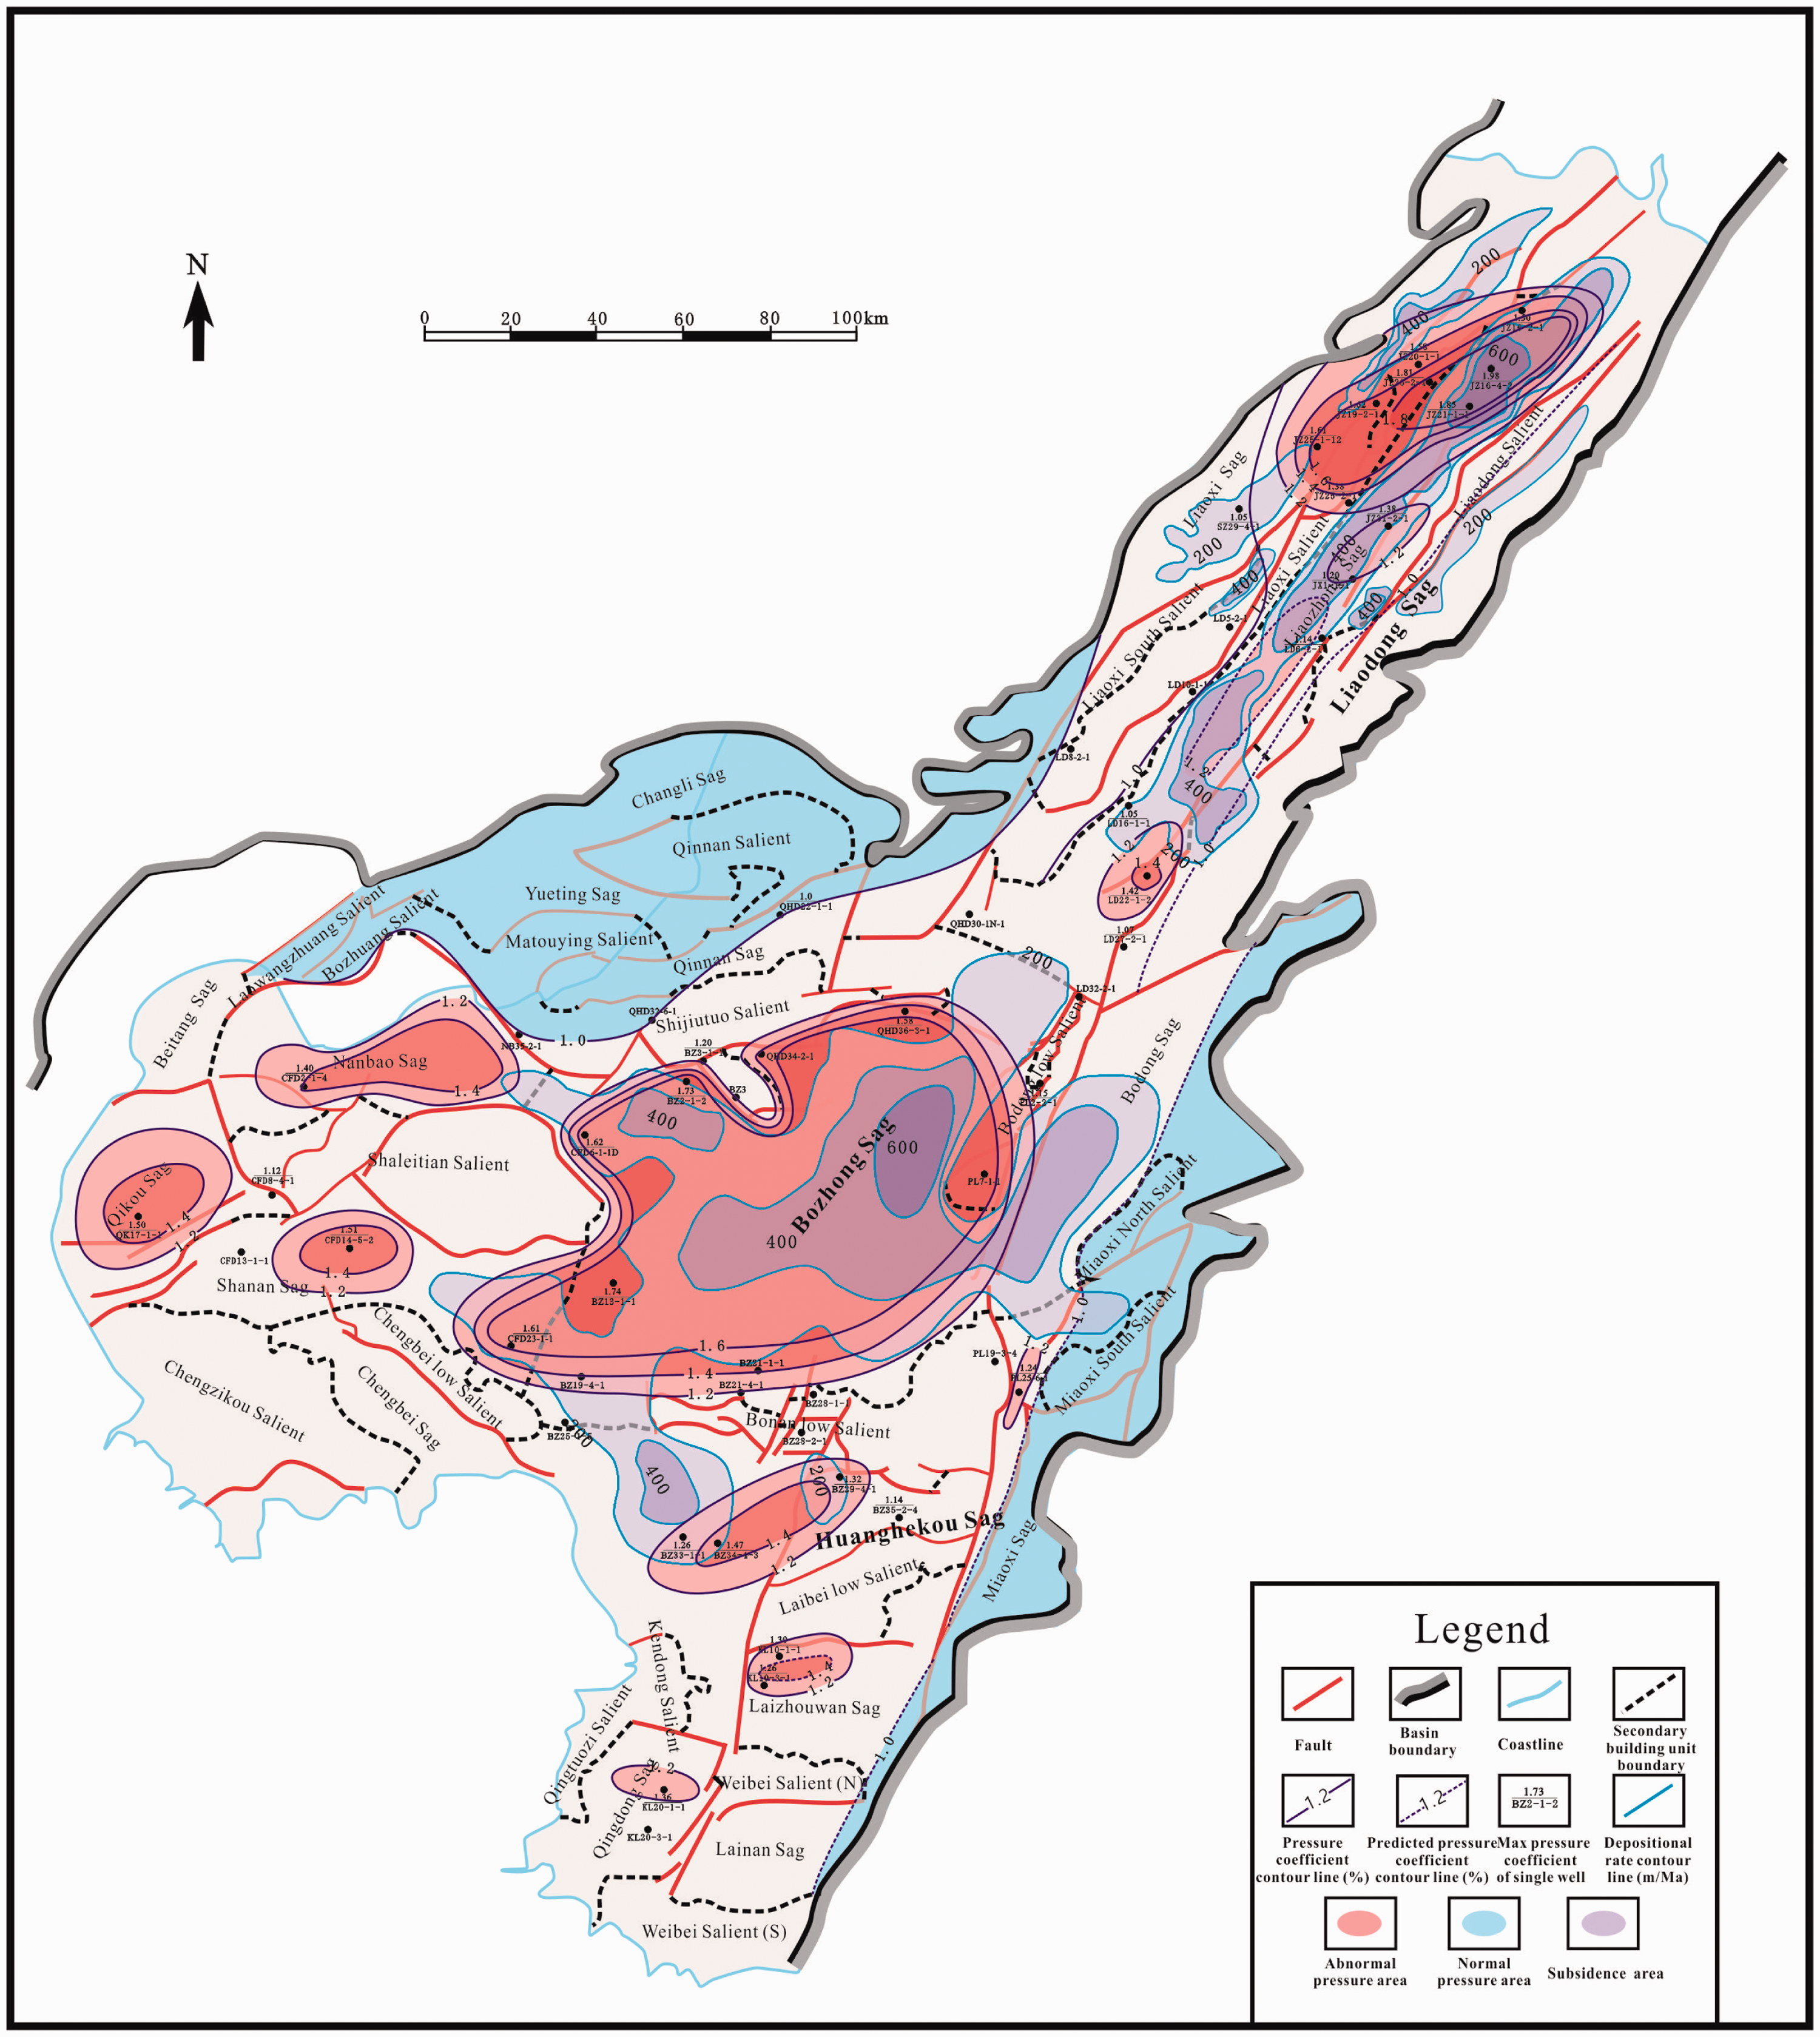
Distributive features of the first and second member of the Shahejie Formation
In Figure 9, area with red shadows is the calculated overpressure data of the first and second member of the Shahejie Formation by logging curves (the biggest pressure coefficient).
Superimposition map of the depositional rate and pressure coefficient of the first and second member of the Shahejie Formation, the Bohai Bay Basin (the depositional rate is from data of CNOOC (2010)).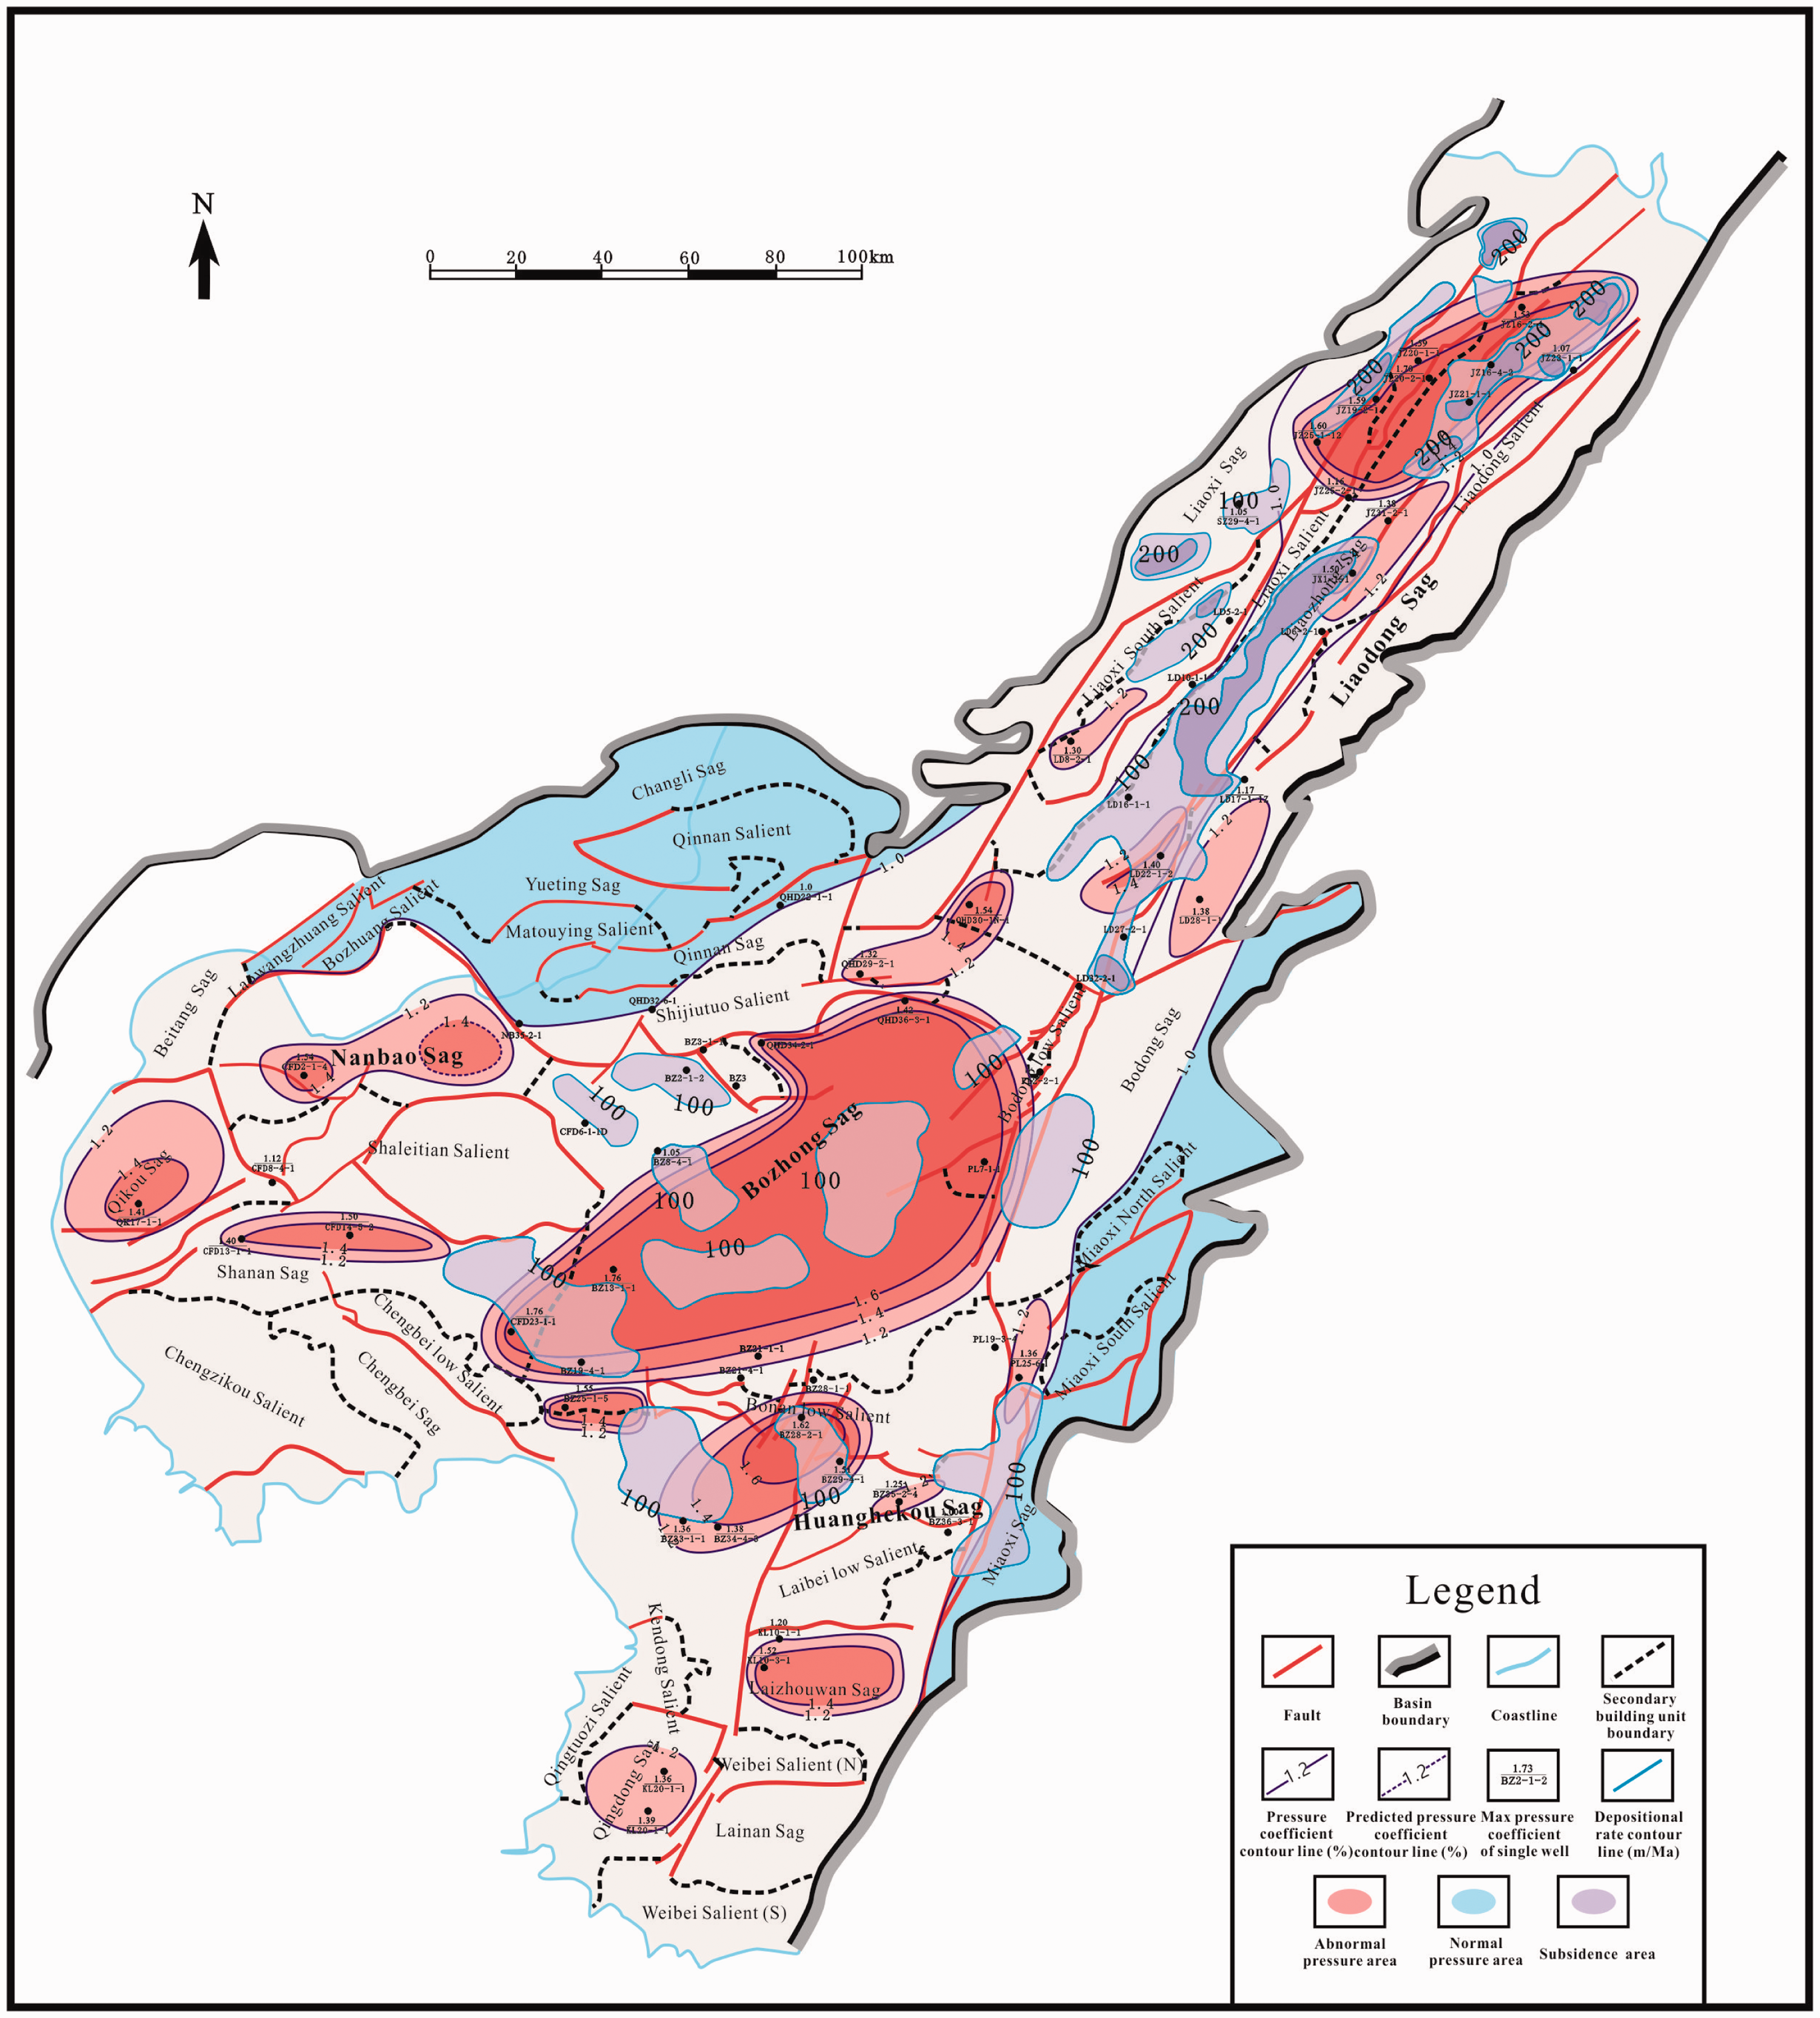
Compared with the distributary features of the biggest pressure coefficient of the third member of the Dongying Formation, the main overpressured zones of the first and second member of the Shahejie Formation are the Bozhong Sag, the Nanbao Sag, the Huanghekou Sag, and the northern Liaodong Bay, but all of them are not as overpressured as the third member of the Dongying Formation. Within these two members, wells BZ13-1-1 and CFD23-1-1 have the biggest extent of overpressure, with the pressure coefficient of 1.76. The trend of overpressure change is also decreased from center to edge of the sag; the ramp regions in between the sag and the salient are usually the areas with fast-changing pressure coefficient.
Distributive features of the third member of the Shahejie Formation
Compared with the distributary features of the biggest pressure coefficient of the third member of the Dongying Formation (Figure 8), the main overpressured zones of the third member of the Shahejie Formation are the Bozhong Sag, the Shanan Sag, the Huanghekou Sag, and the northern Liaodong Bay (Figure 10), but still not as overpressured as the Dongying third Formation (only based on the present logging data we have). Within this formation, wells BZ25-1-5 and CFD23-1-1 reach the biggest overpressure extent, with the pressure coefficient of 1.79. Although there are no well drilled until the third member of the Shahejie Formation in the deep areas of the Bozhong Sag and the northern Liaozhong Sag, it still could be predict that the overpressures in this formation are favorably developed.
Superimposition of the depositional rate and pressure coefficient of the third member of the Shahejie Formation, the Bohai Bay Basin (the depositional rate is from data of CNOOC (2010)).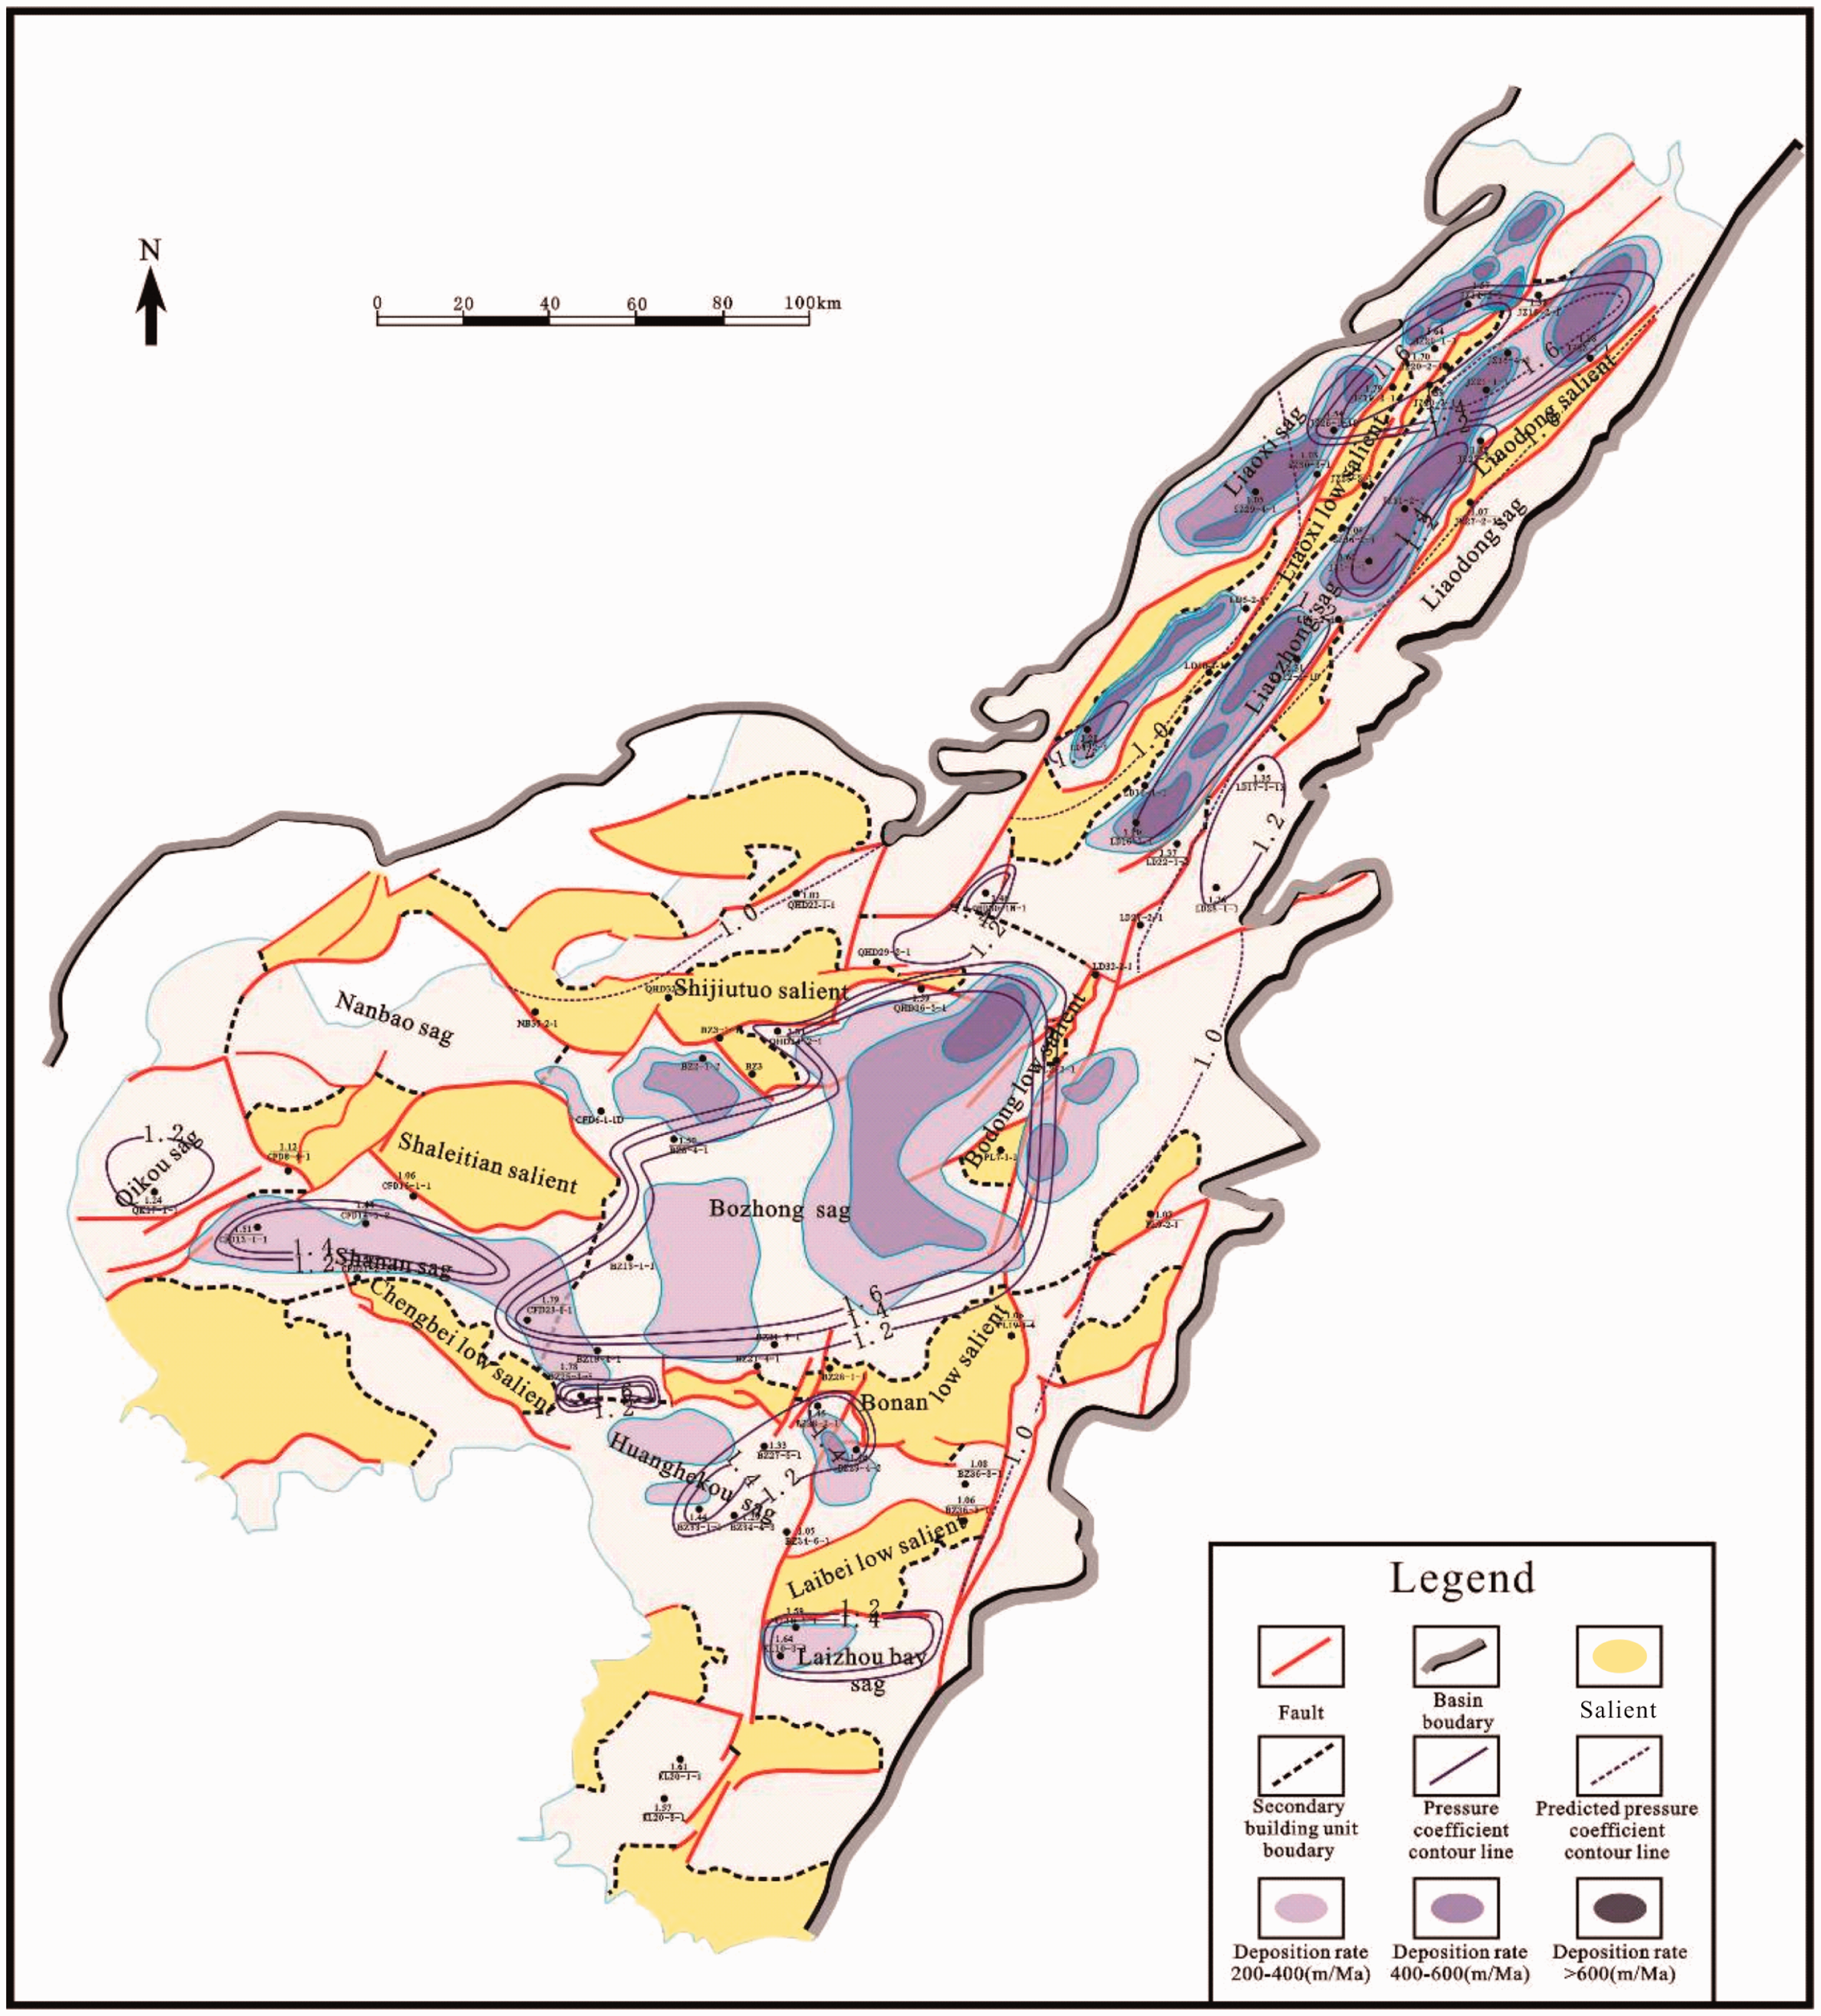
The genetic mechanisms of formation overpressures
Genetic mechanisms and characteristics of abnormal formation pressure
Under the situation without tectonic compression, pressure of overlying strata is the sum of formation pore pressure and vertical effective stress, the vertical effective stress is the main factor of formation compaction diagenesis (Bowers, 2002). With the increase of depth, the vertical effective stress of the frame also increases regularly. However, in the case of disequilibrium compaction in mudstone layers, as the formation porosity remains unchanged, the vertical effective stress also remains unchanged. For this reason, the overpressure due to disequilibrium compaction would not lead to the decrease of the vertical effective stress. Toward the formation high pressure caused by disequilibrium compaction, the commonly accepted point of view is that part of pressure that rock skeleton should afford had transformed to formation pore fluid, thus caused fluid overpressure. The sum of formation pore pressure and the pressure that rock skeleton afforded has remained unchanged, one decreased while another increased; the pressure that rock skeleton afforded is reflected by compaction extent, and the direct manifestation is formation of velocity changes. For the formation of overpressure caused by fluid expansion, by the influences of heating, hydrocarbon generation of organic matter, fluid transmission, diagenesis, etc. fluid expansion happens, which caused formation pressure increasing, together with effective stress decreasing, that is the so-called stress unloading, and porosity increased, while velocity decreased.
Disequilibrium compaction would not cause effective stress increasing and also would not cause effective stress decreasing, while fluid expansion may cause effective stress decreasing, then makes an inversion of velocity curve. Therefore, on the crossplot of the velocity and vertical effective stress, it can be found that the measuring points, whether they are formed by normal compaction or disequilibrium compaction, are all in conformity with the loading curve. However, the overpressure caused by fluid expansion can result in the decrease of vertical effective stress of the frame. This phenomenon is called unloading process; this process is featured by the fast changing velocity and the almost unchanged density (Huffman, 2006). Within a same velocity changing range, the stress unloading curve has a bigger formation stress variation than that of the compaction trend line. With a same velocity, the unloading curve has smaller formation stress value than that of compaction trend line, which represents a bigger formation pressure (Figure 11). The predicted difference of formation pressures equals the difference of formation stress on unloading curve and compaction trend line. Thus, under condition of fluid expansion, the formation undercompaction theory (method: equivalent depth of logging) would underestimate the formation pressure.
Evolution diagram of the formation of overpressure (Tingay, 2007).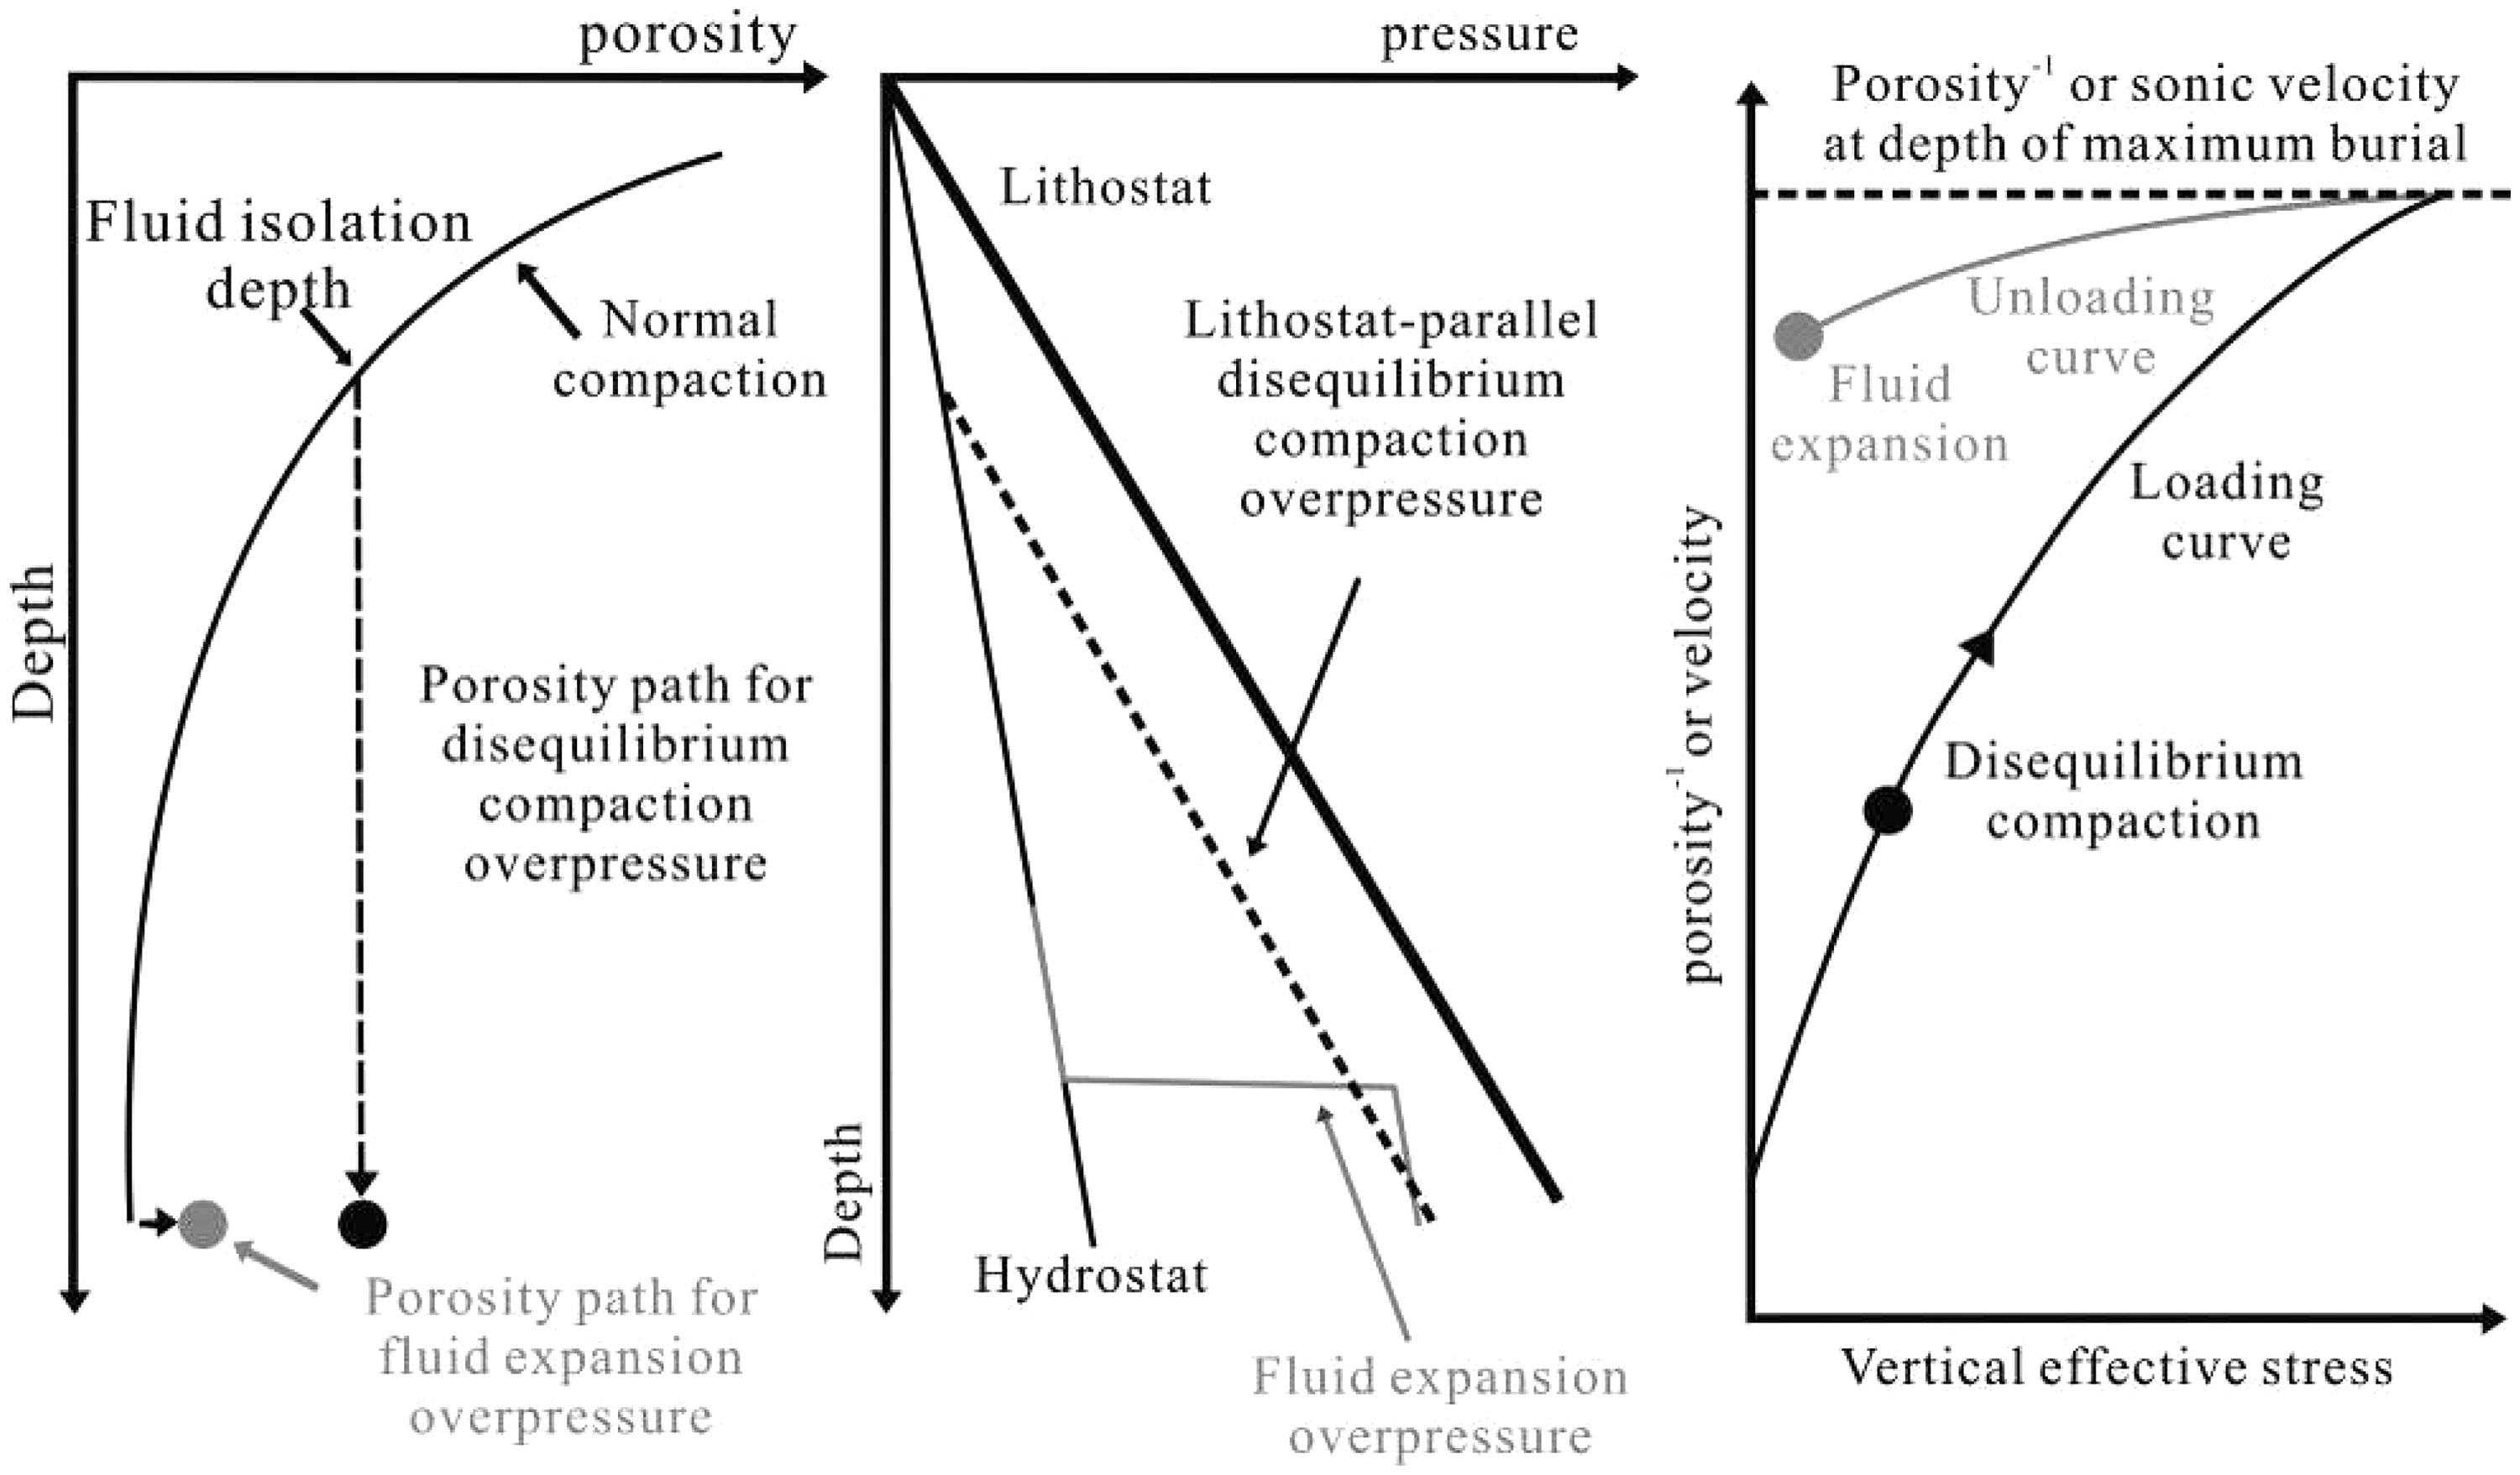
Analysis of the genetic mechanisms of the overpressure for typical wells
The crossplot of its velocity, density, and vertical effective stress can be used to judge whether the genetic mechanisms of disequilibrium compaction, hydrocarbon generation of organic matter, and fluid transmission existed or not (Figure 11). Then, relying on the velocity of normal pressuring points and the vertical effective stress, the loading curve can be drawn. If the data from the overpressure points are cast in the crossplot of the velocity and vertical effective stress, the pressuring points due to disequilibrium compaction can be generally found in the loading curve, which are featured by lower acoustic velocity and vertical effective stress; the pressuring points due to fluid expansion can be found above the loading curve and featured by relatively higher acoustic velocity and lower vertical effective stress. The primary reason for overpressure in Bohai Bay basin is the disequilibrium compaction (Hao, 2005). Because of the limited influence of hydrothermal pressurization brings to the formation pressure, it is hard to estimate the influence caused by clay minerals transformation in diagenetic processes in the whole Bohai Bay area, therefore, in this paper, the genetic mechanisms relative to fluid expansion are mainly considered as hydrocarbon generation of organic matter and fluid transmission. According to literature research, hydrocarbon generation of organic matter and fluid transmission are also main factors of abnormal pressure generation in Bohai Bay basin; however, overpressure caused by fluid transmission only happens in permeable sandstone reservoirs and overpressure caused by hydrocarbon generation of organic matter mainly happens in argillaceous source rocks (Guo, 2010; Li et al., 2008; Shen, 2016).
In this paper, based on crossplots of velocity, density, and vertical effective stress of four typical wells, combined with pressure profiles of 60 wells which cross or near nine geologic profiles, the vertical effective stress and velocity range of Paleogene reservoirs can be determined, judging the overpressure origin is mainly based on the crossplot of vertical effective stress and velocity, because it is hard to differentiate different types of overpressure only with vertical effective stress.
On crossplot of velocity and effective stress, mudstone that disequilibrium compacted is located at loading curve, the disequilibrium compacted mudstone points have a velocity range of 2.5–3.7 km/s, and vertical effective stress is ranged between 15 and 35 MPa.
Mudstone source rocks that have high content of organic matter and have already entered in the mature oil generation period are capable of generating overpressures caused by hydrocarbon generation of organic matter. These kinds of mudstones usually have characteristics of high gamma value, high resistivity, low velocity, and low density. On crossplot of velocity and effective stress, it is located at unloading curve, velocity is commonly below 3.2 km/s, and effective stress distributes between 10 and 15 MPa.
Overpressure caused by fluid transmission happens in permeable mudstone strata, as same as overpressure caused by hydrocarbon generation of organic matter; it is also located at unloading curve, but it has higher velocity that is above 3.5 km/s; influenced by fluid charging, the effective stress distributes widely and has a range of 18–40 MPa. Sandstone with stronger fluid charging has a lower value of vertical effective stress, while sandstone with weaker fluid charging has a higher value of vertical effective stress.
The contribution ratio of each genetic mechanisms of overpressure has been discussed and quantitatively calculated under the range of effective stress and velocity. This method is applied for sedimentary basin with overpressured clastic rocks; however, different sedimentary basins have different background and different clastic deposits, so the range of vertical effective stress and velocity should have fluctuated a little.
The generalized columnar section of the formation pressure of the well BZ25-1-5 is seen in Figure 3 and its crossplot of velocity, density, and vertical effective stress can be seen in Figure 12(a) and (b), in which it can be found that the overpressure develops below the top of the second member of the Dongying Formation (at the depth of 2784 m), among which the bottom depth of the second member of the Dongying Formation is shallower than 3270 m and the maturity of organic materials (Ro, max: the mean maximum reflectance values of vitrinite) is basically smaller than 0.7%, this means it has not yet generated a great deal of hydrocarbon, when the depth is below 3020 m, the overpressure caused by hydrocarbon generation begins. Above the depth of 3020 m, the trend of changes in formation pressures (line (2)) is basically in a parallel with the lithostatic pressure line (line (5)), which indicates that the overpressure here may mainly be caused by disequilibrium compaction. According to the analysis of the crossplot of its velocity, density, and vertical effective stress, the trend of the changes of the velocity and density with the changes of its vertical effective stress is basically in agreement with the trend of changes under normal pressure, which is in line with the changes of the loading curve. So it can be judged that below the depth 3020 m of the second member of the Dongying Formation, overpressure is only caused by disequilibrium compaction, and over the depth of 3200 m, overpressure is supposed to be caused by disequilibrium compaction plus hydrocarbon generation of the organic matter. According to Figure 3, the entire E3d2 develops overpressure caused by disequilibrium compaction, along the (2) line and extends to the bottom of E3d2, the overpressure caused by disequilibrium compaction (its pressure value equals to the length of b) and hydrocarbon generation of the organic matter (its pressure value equals to the length of c) can be clearly differentiated. According to calculation obeying proportion principle, for instance, at the depth of 3020 m, the proportion of the overpressure caused by mudstone disequilibrium compaction accounts for 79%, and hydrocarbon generation made 21% of the total contribution. The first and second members of the Shahejie Formation are main hydrocarbon-generating sections, in which the measured pressure coefficient at the depth of 3300.15 m in the well is 1.414 and the pressure coefficient at the depth of 3351.54 m in the well is 1.394. It is quite obvious that the overpressured points are formed by the charging and transmission of fluid, the transmission of fluid overpressure trend line (line (4)) is parallel with the hydrostatic pressure trend line (line (1)) (Figure 3). Among the overpressures, a part of it is formed by the charging and transmission of the water from the disequilibrium compacted mudstone to the reservoir and another part of it is formed by the migration and accumulation of the oil and gas generated by source rock in the reservoir. On the crossplot of effective stress, velocity, and density, for the data deviate from the loading curve of disequilibrium compaction and fall on the unloading curve, this could be corresponding to the oil production strata of thick sandstone, in which acoustic travel time fluctuates a lot, porosity and density had little changes and the pressure coefficient almost remained unchanged. The third member of the Shahejie Formation are the main hydrocarbon source layers of the well and the organic materials are with high organic maturity, large amount of organic carbon, and great hydrocarbon potential. The degree of overpressure in this member is also the largest of the well. The mechanism of the overpressure in this member is hydrocarbon generation and disequilibrium compaction of mudstone. Based on calculations in Figure 3, at the depth of 3600 m, the overpressure caused by hydrocarbon generation accounts for 56.4%, and the proportion of mudstone disequilibrium compaction drops to 43.6%. The lower part of the lower section of the third member of the Shahejie Formation is also a major oil and gas production reservoir, with a higher production of oil and gas but a smaller overpressure degree. It is not difficult to see from Figure 12(a) and (b) that the overpressure in the reservoir is formed by the charging and transmission of oil and gas, the transmission of fluid overpressure trend line (line (4)) is parallel with the hydrostatic pressure trend line (line (1)) (Figure 3). The abundant oil supply is provided by the Bozhong sag and the Huangheko sag on the two sides of BZ25-1 area and the good sealing of the overpressured caprocks in the upper part plays a very important role in the generation and preservation of the overpressure.
(a) Crossplot of the velocity and vertical effective stress of well BZ25-1-5 and (b) crossplot of the density and vertical effective stress of well BZ25-1-5.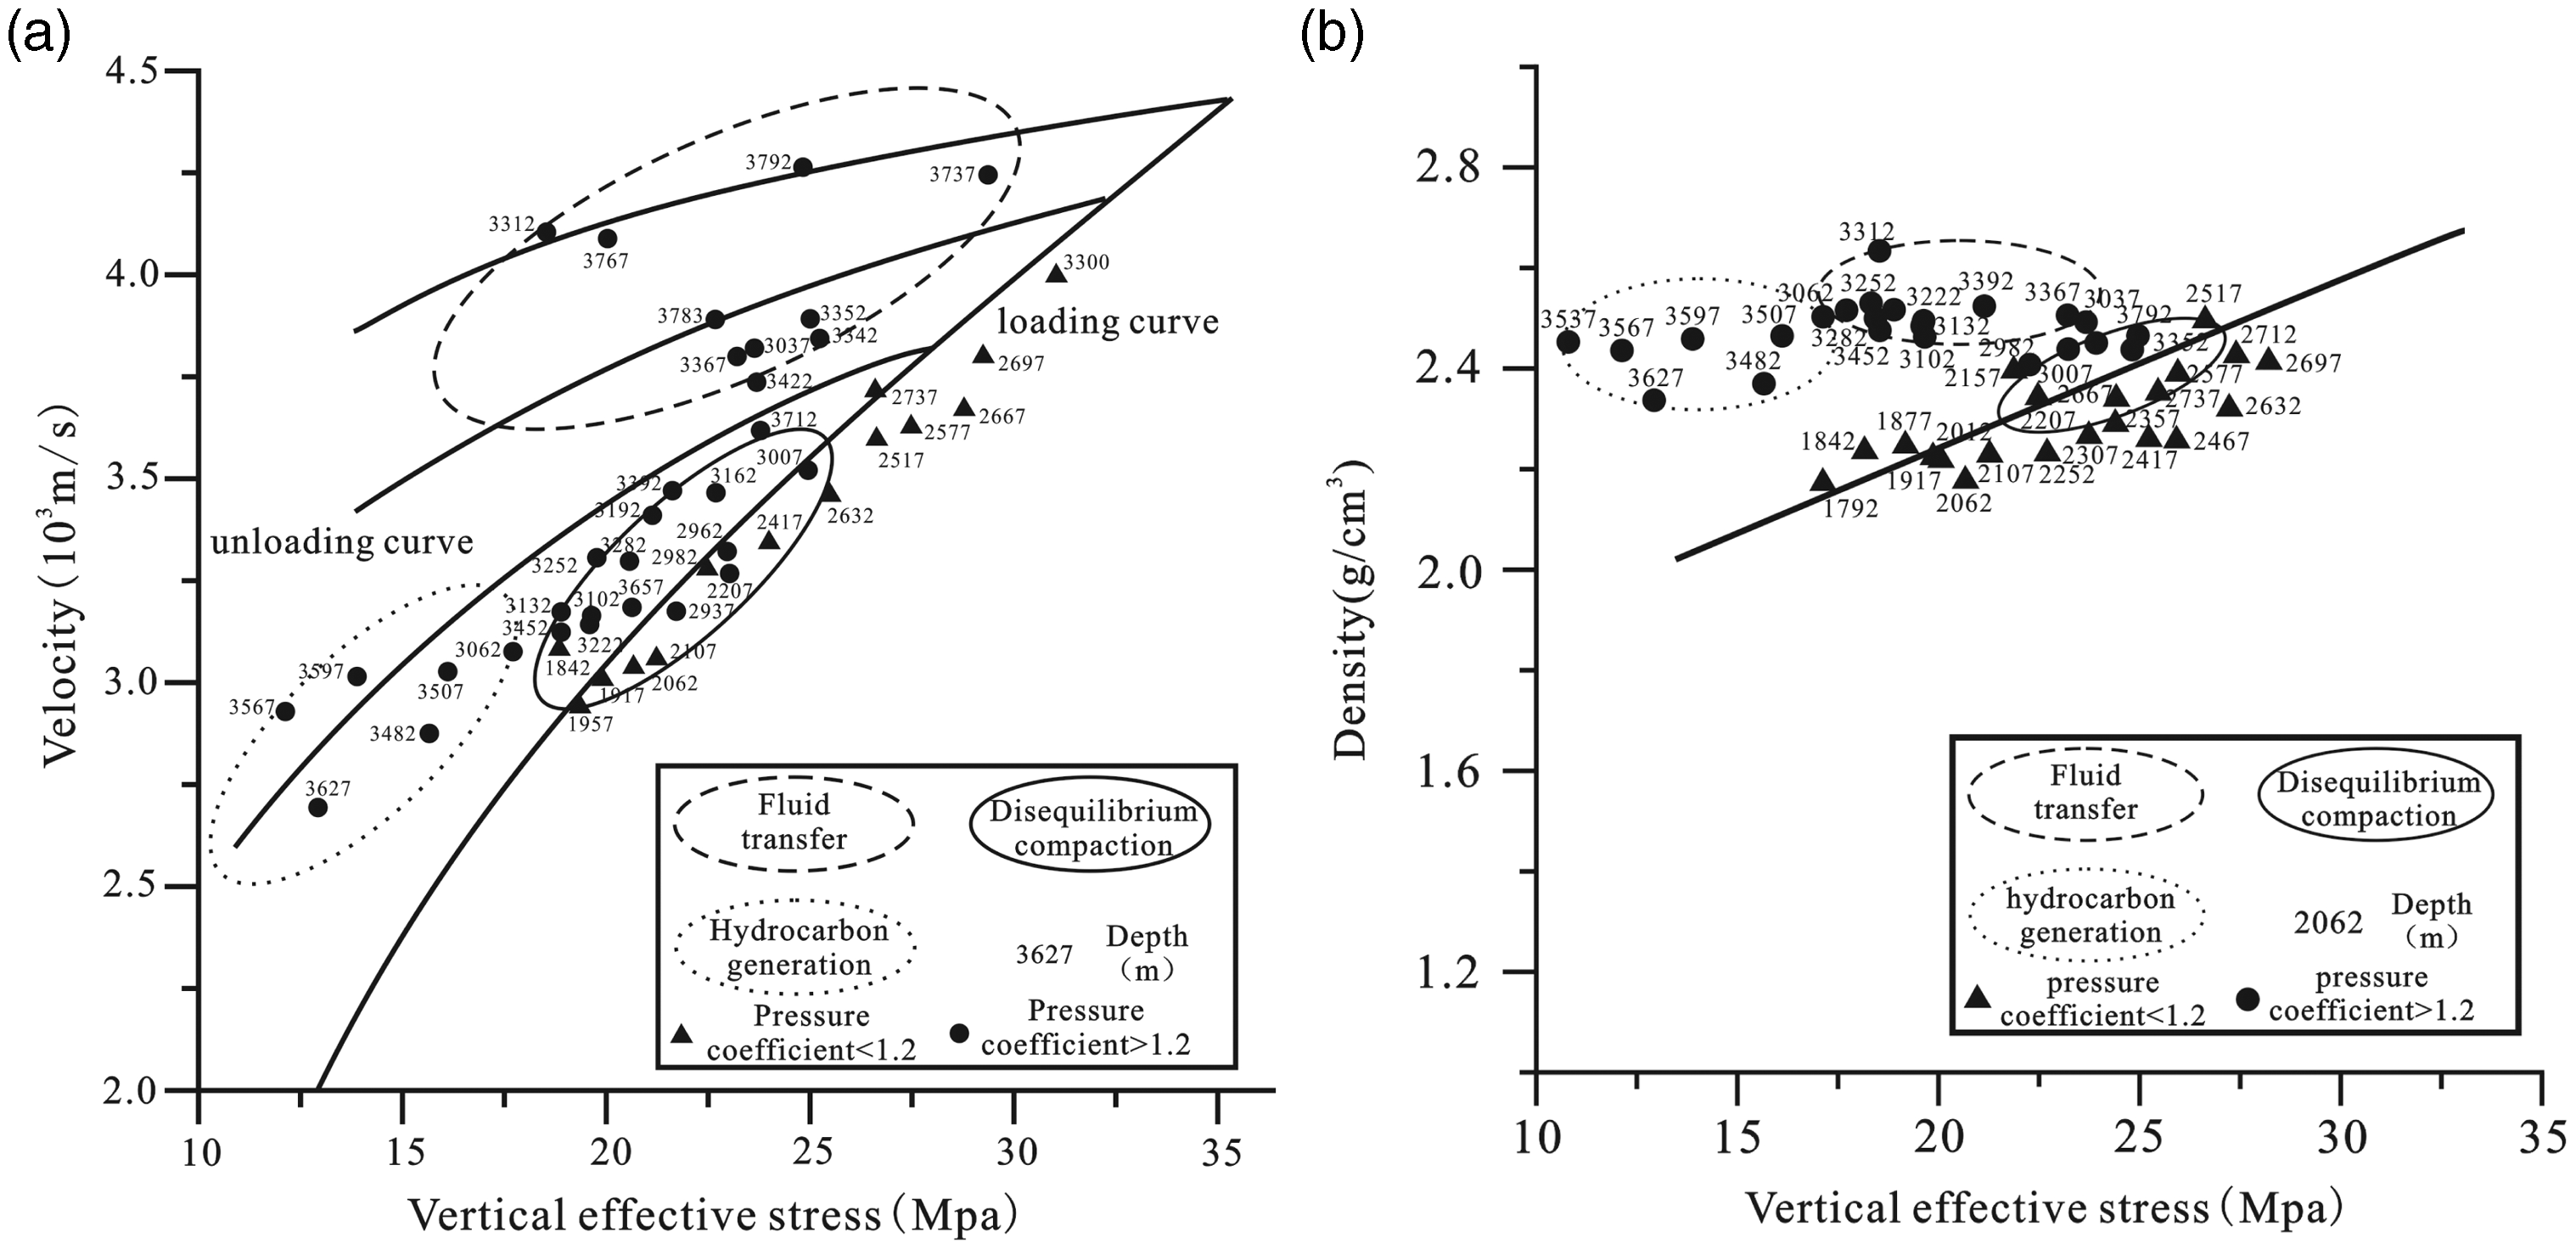
The generalized columnar section of the formation pressure of the well QK17-1-1 is seen in Figure 4 and its crossplot of velocity, density, and vertical effective stress can be seen in Figure 13(a) and (b). Its abnormal pressure mainly occurs in the lower part of the second and the third members of the Dongying Formation and the first member of the Shahejie Formation. The lower part of the second member of the Dongying Formation to the first member of the Shahejie Formation is less than 3250 m and the maturity of its organic matter (Ro) is below 0.5%. Its trend line of the change of formation pressure (line (2)) is basically in parallel with the trend line of the lithostatic pressure (line (5)) (Figure 4). From the crossplot of velocity, density, and vertical effective stress, it can be found that the trend of changes in the velocity and density with the vertical effective stress is basically in conformity with that of normal pressuring points, which is in accordance with the changes of the loading curve. On the basis of the above data, it can be determined that the genetic mechanism of the overpressure in the lower part of the second member of the Dongying Formation and the first member of the Shahejie Formation is disequilibrium compaction. The second member of the Shahejie Formation is the main production bay that contains both hydrocarbon reservoirs and aqueous layers. At the depth of 3503–3515 m, the measured pressure coefficient is 1.212–1.223. The velocity, density, and vertical effective stress of the measured points in this section manifest the features of the loading curve, by which it can be assumed that the transition pressure of the aqueous layers is due to the water from the mudstone migrating to the sand layer. In the meanwhile, the transition pressure of the hydrocarbon reservoirs is formed in a different way, the hydrocarbon generated from the overpressured source rocksmigrates vertically or horizontally to the reservoir, in which the water is displaced by hydrocarbon. The required conditions for the reservoir to develop overpressure are the supply of overpressure energy and the excellent sealing surroundings.
(a) Crossplot of the velocity and vertical effective stress of well QK17-1-1 and (b) crossplot of the density and vertical effective stress of well QK17-1-1.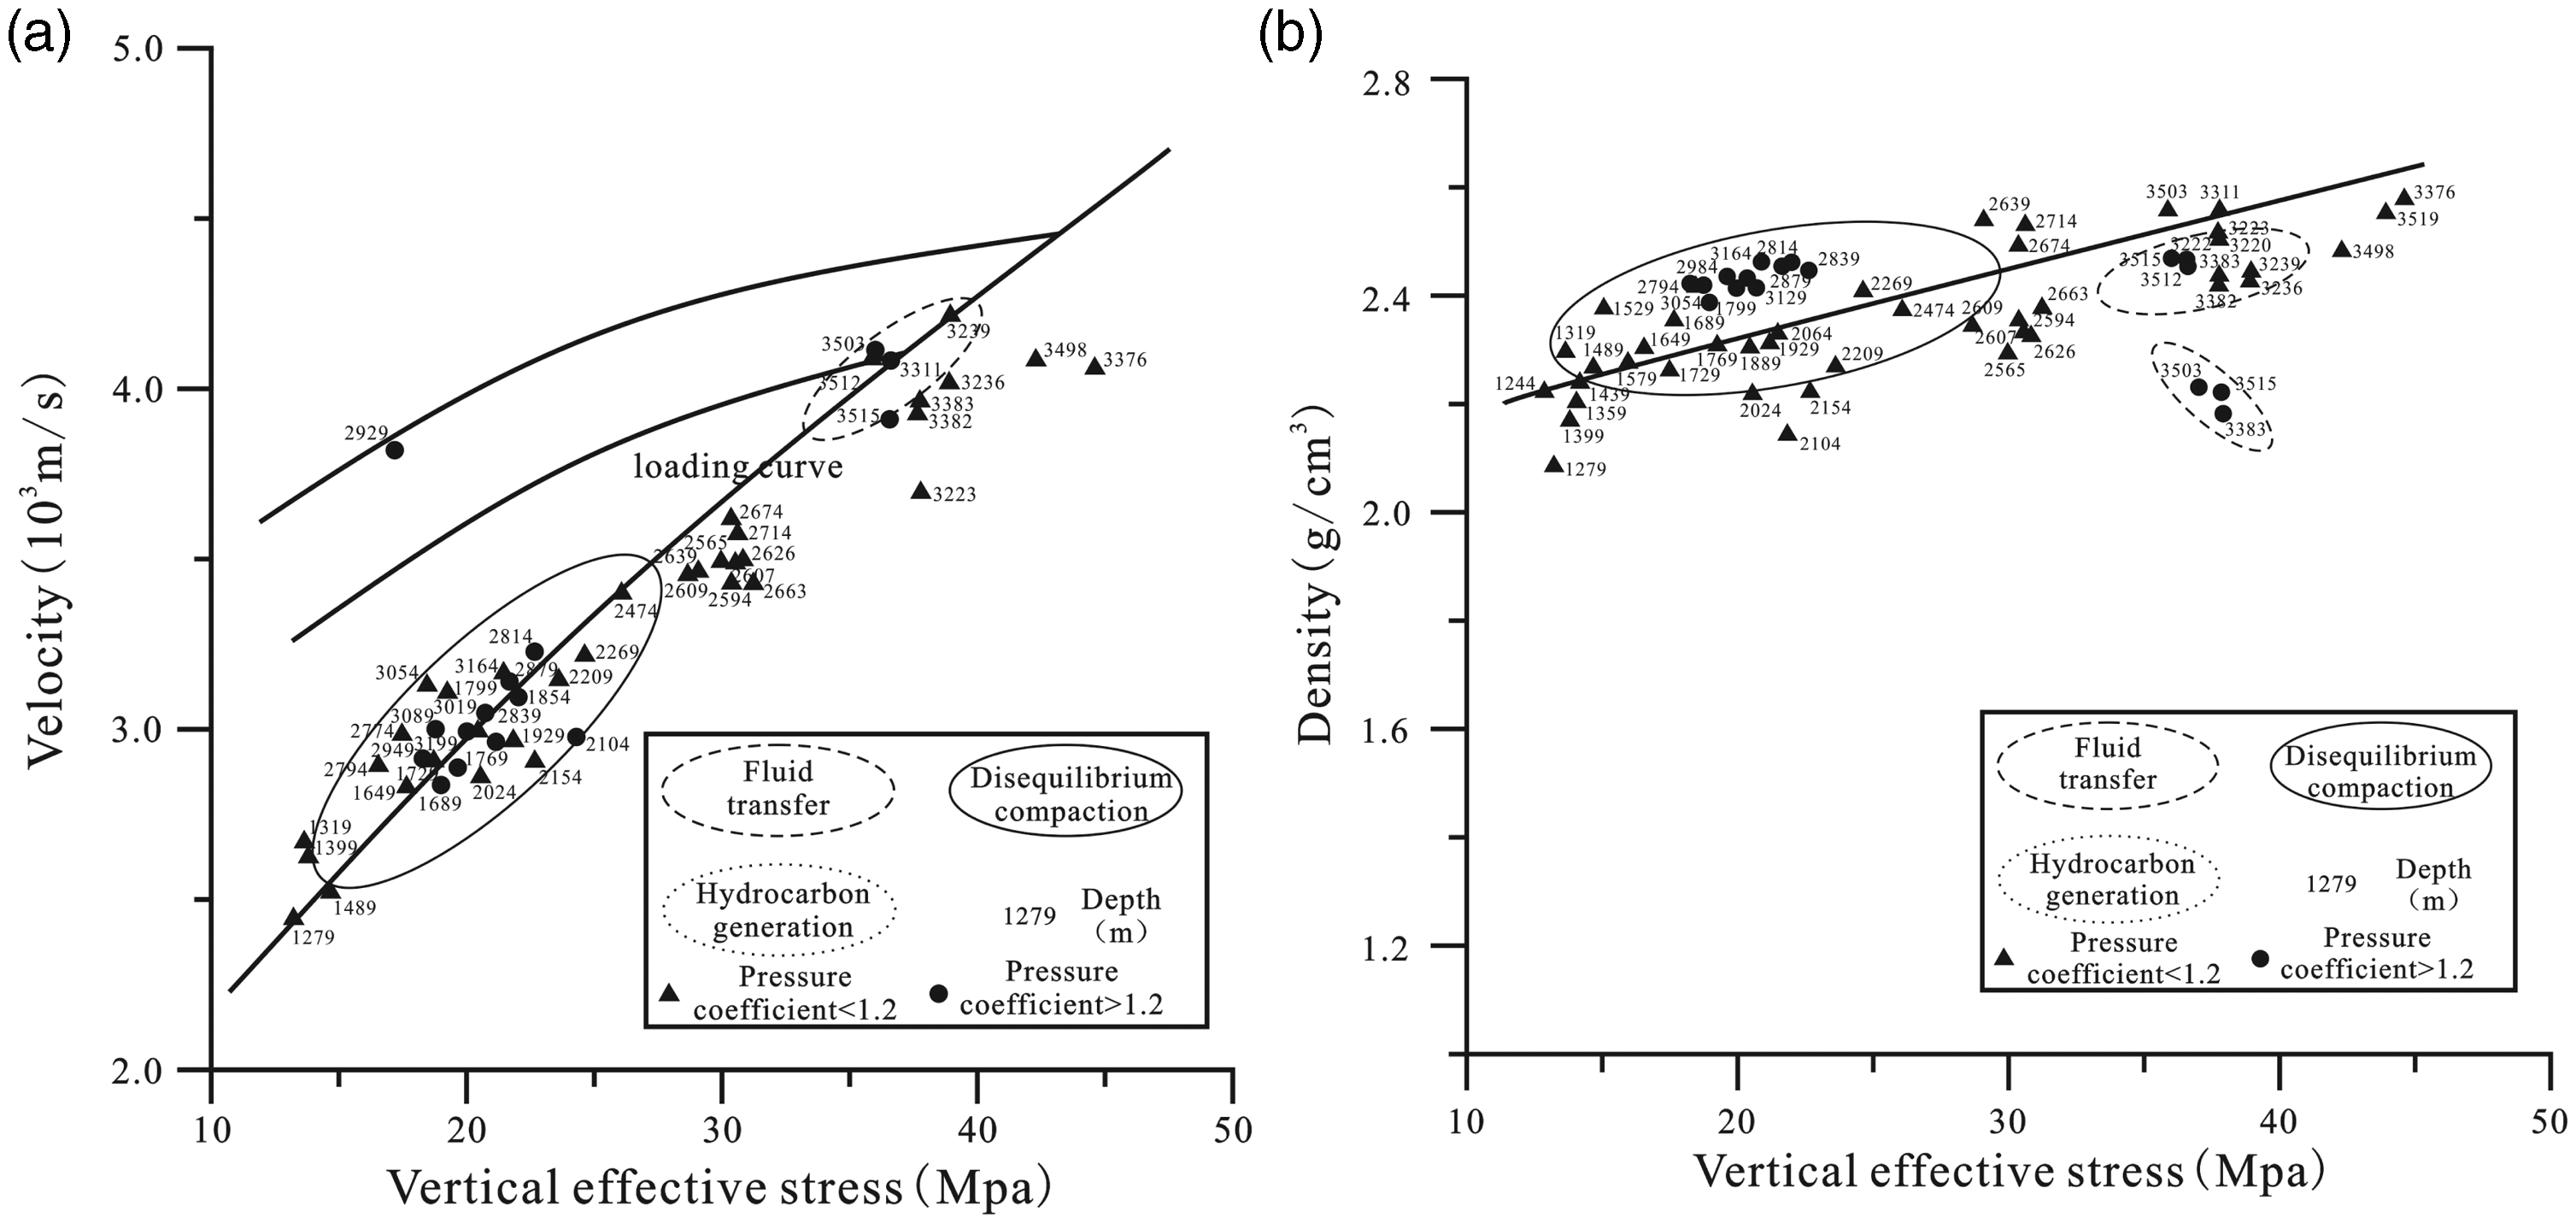
The generalized columnar section of the formation pressure of the well KL10-1-1 is seen in Figure 5 and its crossplot of velocity, density, and vertical effective stress can be seen in Figure 14(a) and (b), in which it can be found that in the middle part of the third member of the Shahejie Formation, at the depth of 2819.7 m in the well abnormal pressure develops and the development degree is not only large but also in a trend of increasing fast. The samples obtained from the depth of 2819.7 m to the depth of 2900 m in the well of the middle part of the third member of the Shahejie Formation show relatively smaller amount of organic carbon and hydrocarbon potential; this is regarded as the transition pressure interval, the trend line of the change of formation pressure (line (2)) is basically in parallel with the trend line of the lithostatic pressure (line (5)) (Figure 5). On the basis of the analysis of Figure 14(a) and (b), it can be found that the pressuring points of the section of the well are in agreement with the trend of changes of the loading curve. According to calculation on this figure, the overpressure mechanism of this interval is dominated by hydrocarbon generation, which accounts for 56% at the depth of 3020 m for instance, whereas the proportion of mudstone disequilibrium compaction is 44%. When depth increased, the proportion of hydrocarbon generation related to overpressure also increased.
(a) Crossplot of the velocity and vertical effective stress of well KL10-1-1 and (b) crossplot of the density and vertical effective stress of well KL10-1-1.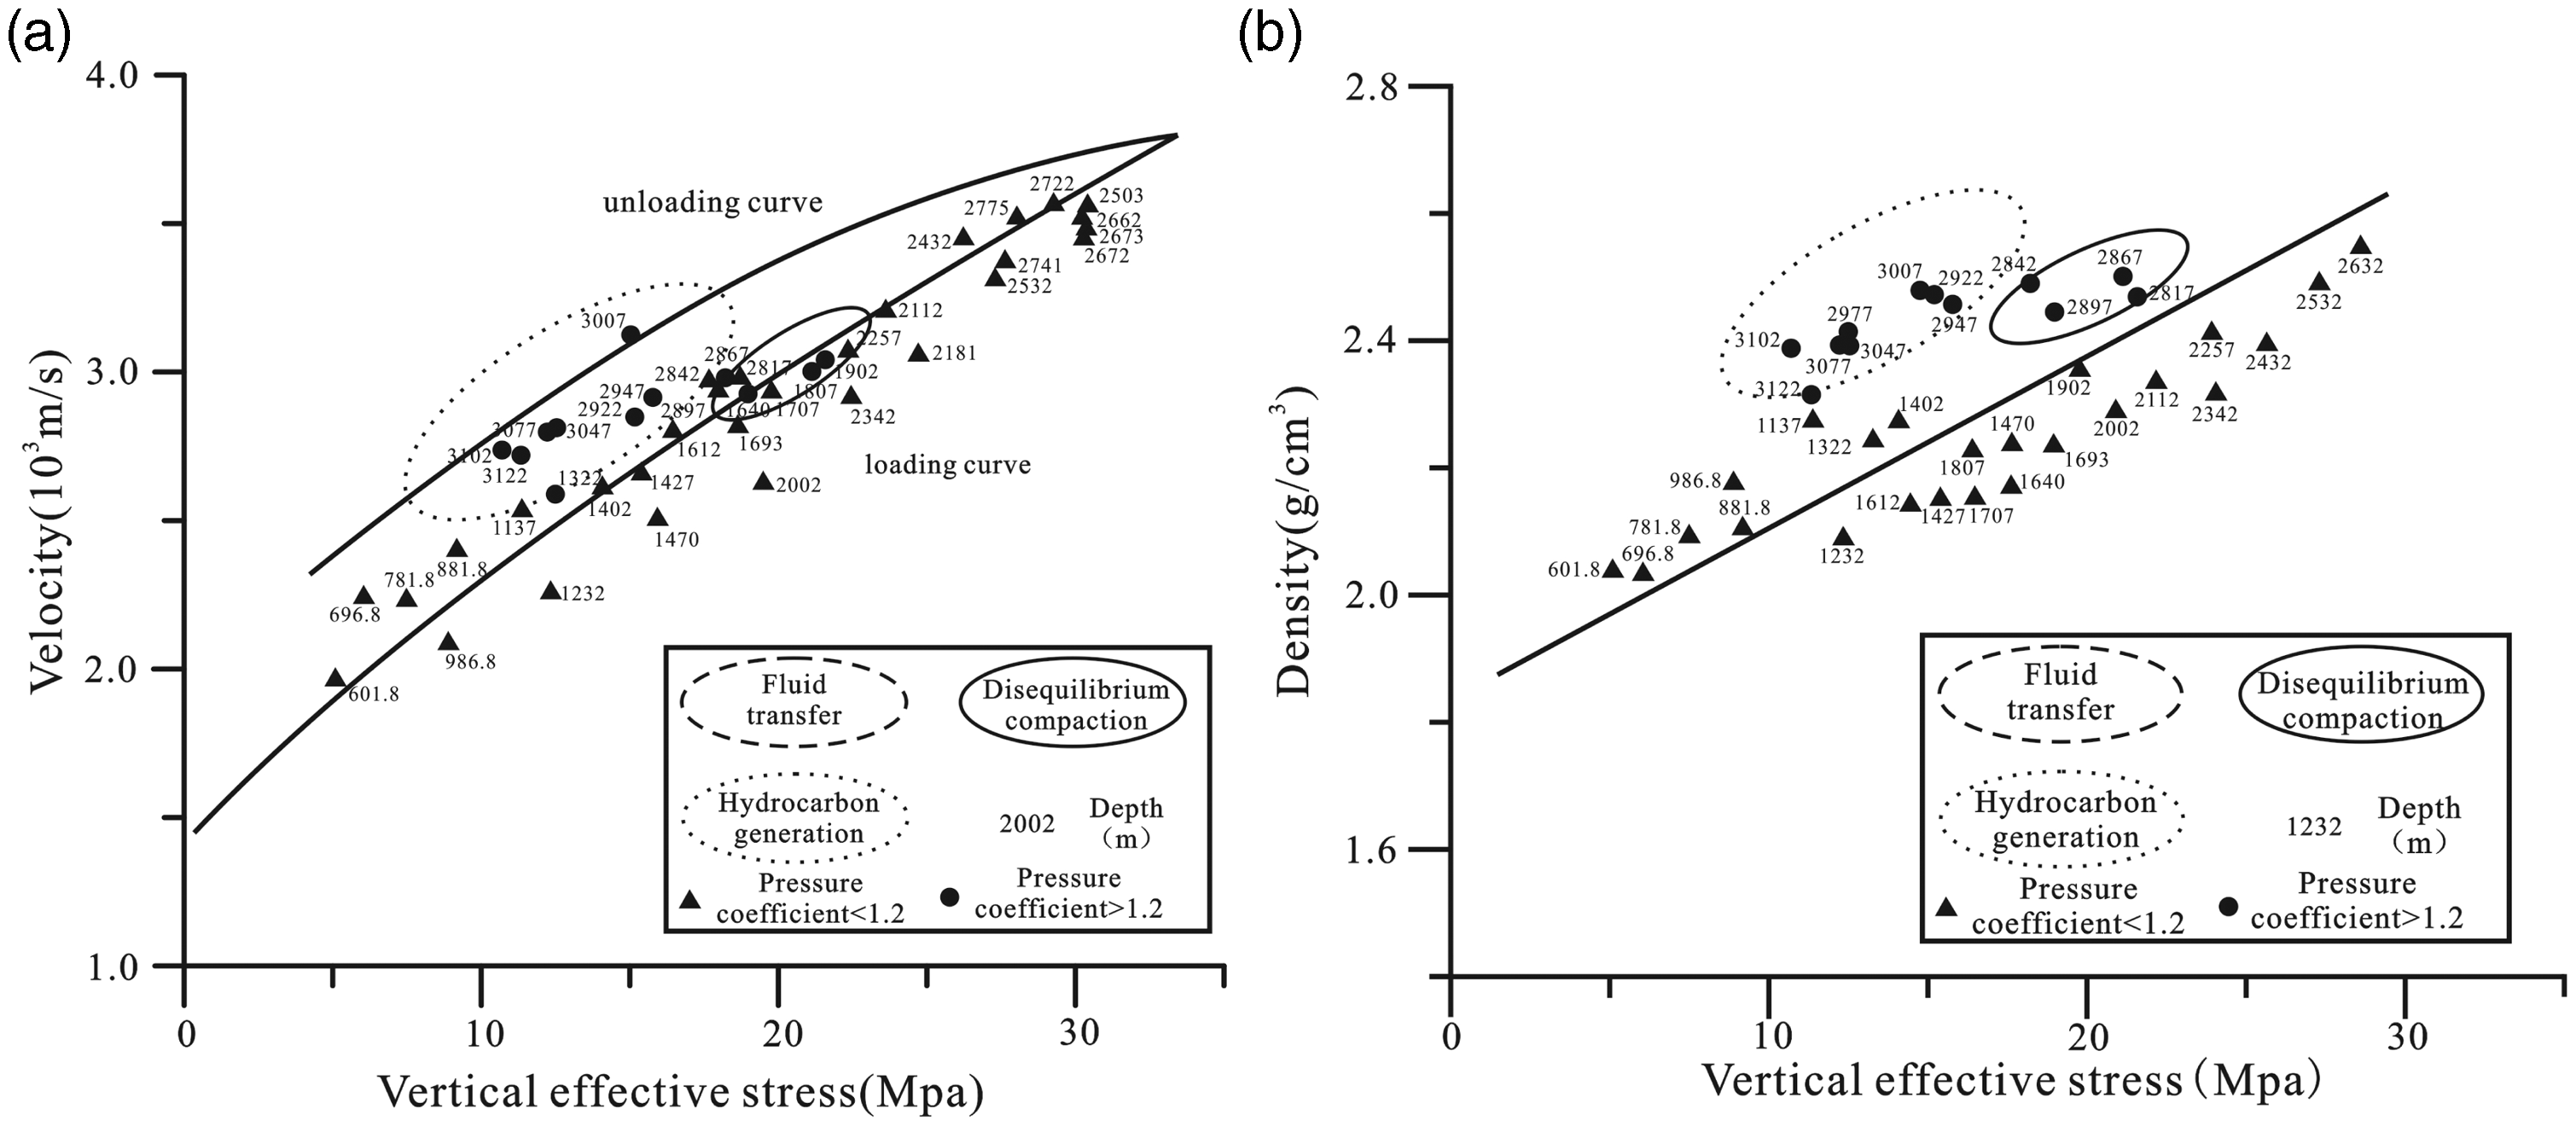
The generalized columnar section of the formation pressure of the well JZ20-2N-3 is seen in Figure 6 and its crossplot of velocity, density, and vertical effective stress can be seen in Figure 15(a) and (b), in which it can be found that the abnormal pressure develops below the depth of 2200 m in the well of the lower part of the second member of the Dongying Formation, among which the burial depth of the lower part of the first member of the Shahejie Formation is less than 3080 m and hydrocarbon generation has made little contribution to the formation of the overpressure. The trend of formation pressure changes (line (2)) in this part is basically in parallel with the trend line of the lithostatic pressure (line (5)) (Figure 6). According to the analysis, the trend of the changes of the velocity and density with the changes of its vertical effective stress is basically in agreement with the trend of changes under normal pressure, which is in line with the changes of the loading curve. It is safe to conclude that the genetic mechanism of the overpressures in the second and third members of the Dongying Formation and the third member of the Shahejie Formation is disequilibrium compaction. The second member and the top of the third member of the Shahejie Formation are the main oil generation sections. The measured formation pressure coefficient is 1.421–1.455 and within the depth of around 200 m in the well the formation pressure coefficient basically remains unchanged, the transmission of fluid overpressure trend line (line (4)) is parallel with the hydrostatic pressure trend line (line (1)) (Figure 6). It is safe to say that the overpressure is formed by the charging and transmission of fluid. The abnormal pressure developed in the Shahejie Formation of the JZ20-2N gas field is mainly from the overpressure of the third member of the Shahejie Formation in the Liaozhong Sag. The overlying thick mudstone of the Dongying Formation has made a large contribution for the accumulation and preservation of the JZ20-2N reservoirs (Li et al., 2008). The reservoir has entered the stage ofa great deal of hydrocarbon generation below the top of third member of the Shahejie Formation, and almost no disequilibrium compaction occurs, thus it can be determined that the overpressure develops in this interval is mainly because of hydrocarbon generation.
(a) Crossplot of the velocity and vertical effective stress of well JZ20-2N-3 and (b) crossplot of the density and vertical effective stress of well JZ20-2N-3.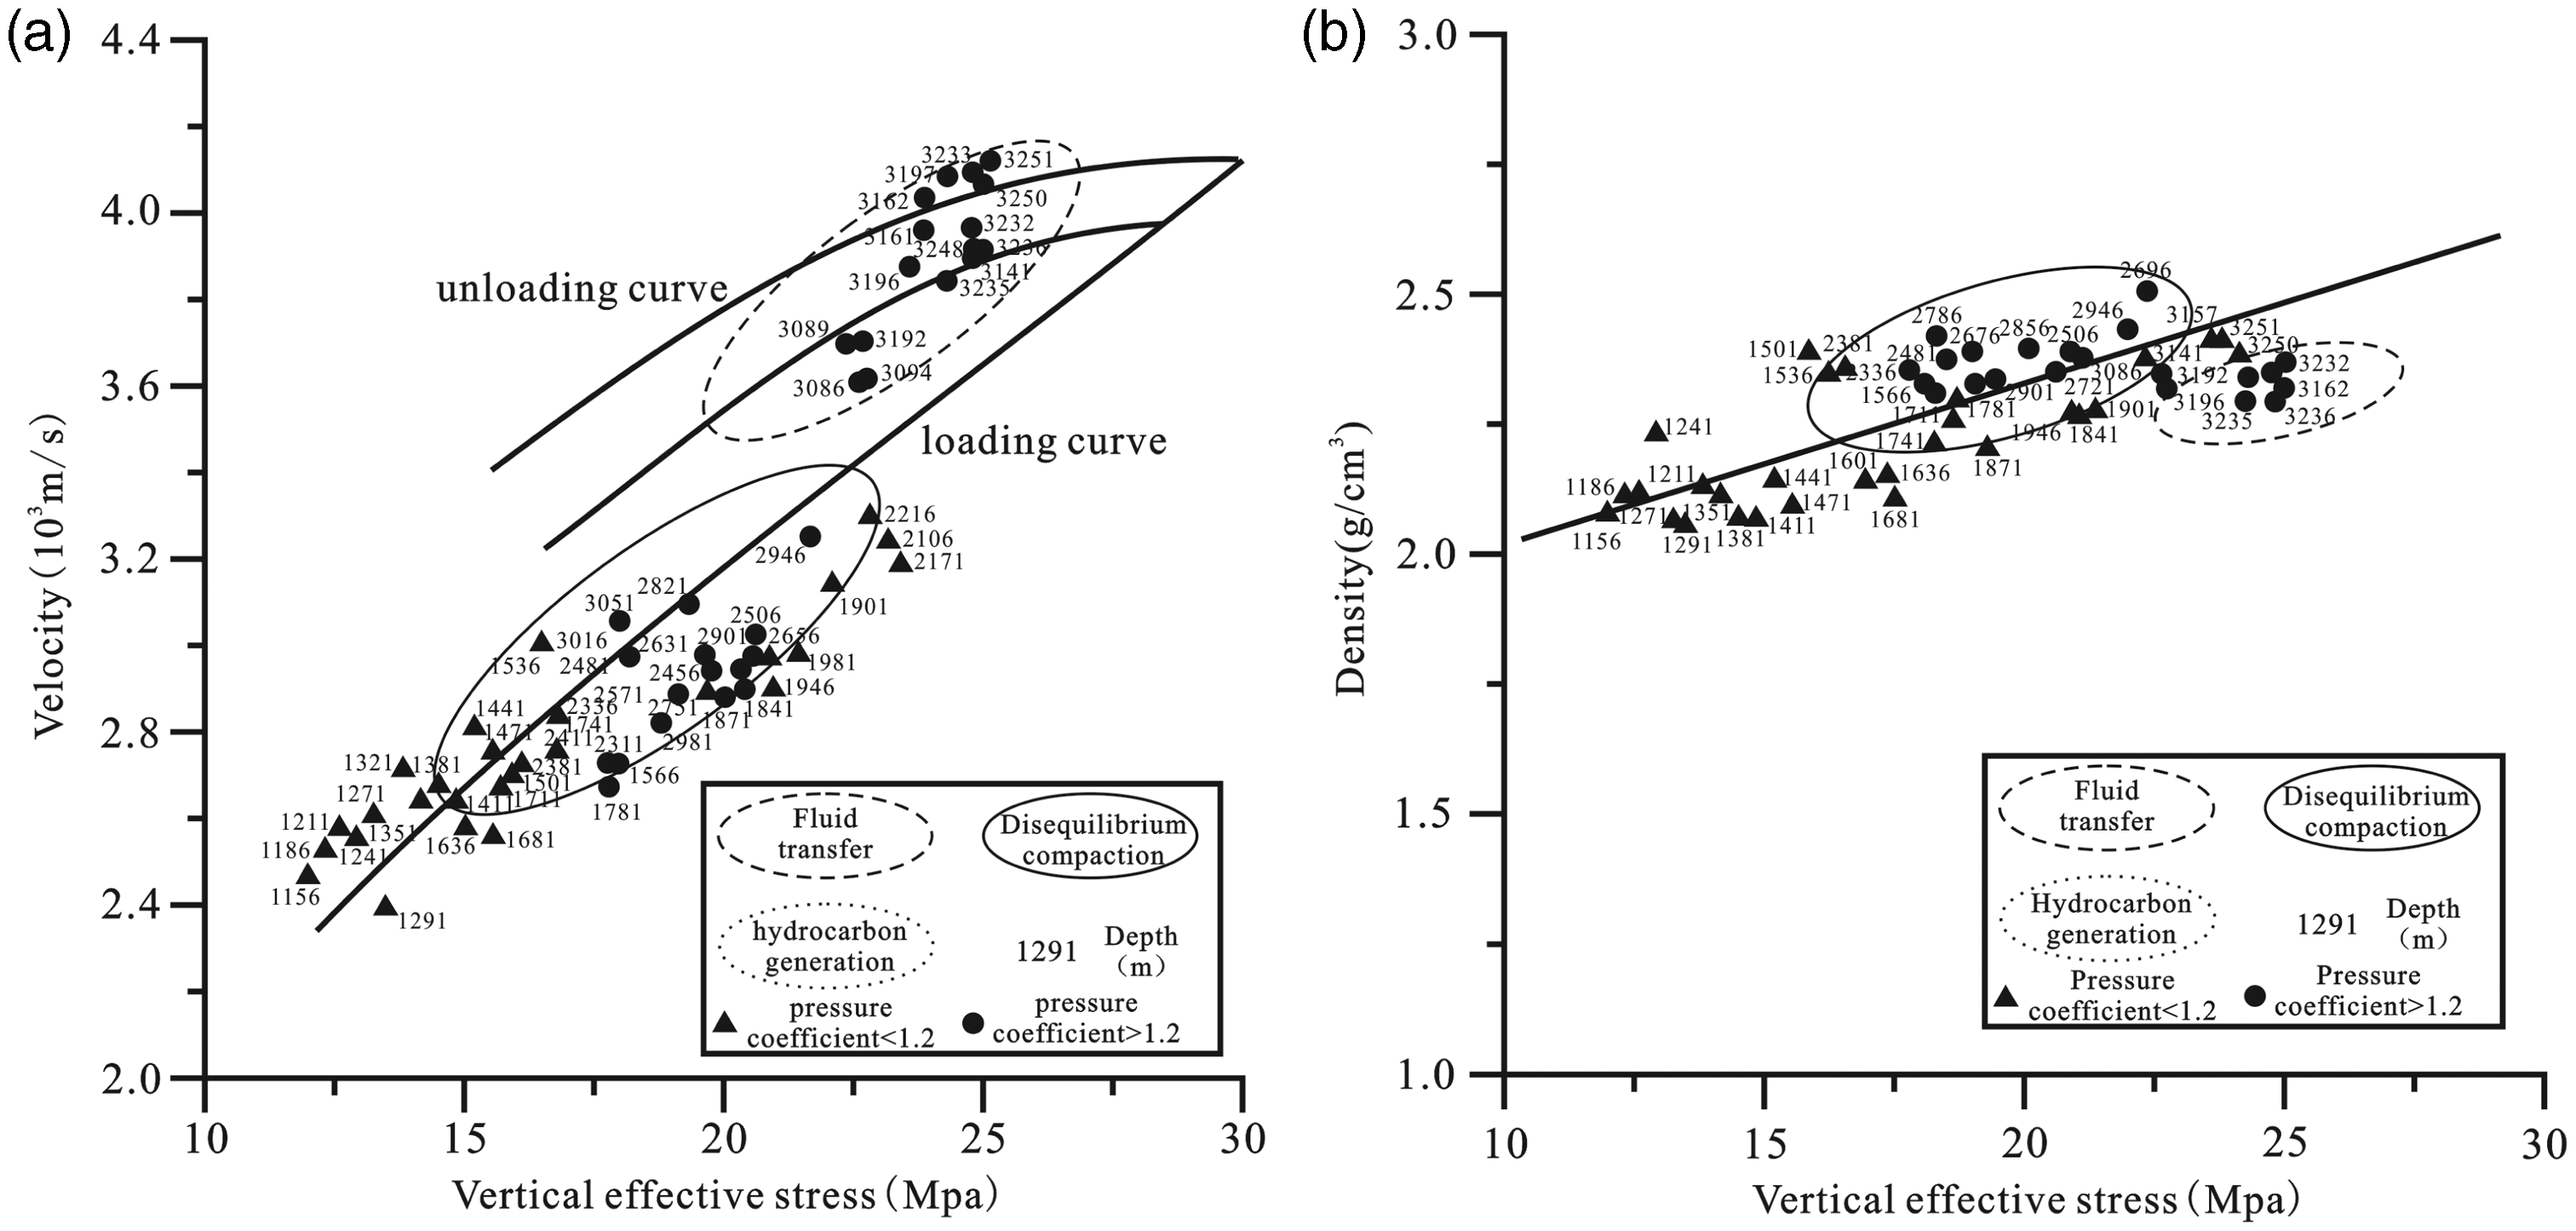
On the basis of the above analysis of different genetic mechanisms of the overpressures in different wells, the genetic mechanisms of the overpressures can be classified into the following types: (1) disequilibrium compaction, (2) dominated by disequilibrium compaction and hydrocarbon generation of organic matter plays a supplemental role, (3) dominated by hydrocarbon generation of organic matter and disequilibrium compaction plays a supplemental role, (4) fluid transmission.
Relationship among the overpressure distribution, depositional rate, and organic matter maturity of the third member of the Shahejie Formation
The previous researches of other scholars (Jiang et al., 2010; Liu et al., 2009) show that in most of the wells of the Bohai Bay Basin, the third member of the Dongying Formation and the third member of the Shahejie Formation are not only main members developing giant sets of heavy bedded black mudstone in the study area and their sedimentary rate is also the biggest. The fast sedimentary rate can not only result in disequilibrium compaction of the mudstone but also enable the organic matter to step into the threshold of hydrocarbon generation, which is quite likely to result in the development of large-scale and high degree overpressures. The third member of the Shahejie Formation is chosen as a case study. In order to ensure a comprehensive study of the plane features of the overpressure distribution of this member, a superimposition chart of its depositional rate, present organic matter maturity, and pressure coefficient contour is drawn and the analysis of the genetic mechanism of the single well is combined.
The distribution of the depositional rate and organic matter maturity of the third member of the Shahejie Formation is shown in Figure 10. The depositional rate of the Bozhong sag, the Liaozhong sag, the Liaoxi sag, and the Huangheko sag is all bigger than 200 m/Ma. However, within the same sag, different structure realms show different depositional rate. For example, the depositional rate of the northeast part of the Bozhong sag, the three subsags in the Liaozhong sag (namely the north subsag, the middle subsag, and the south subsag), and the central part of the Liaoxi sag even reaches 600 m/Ma (Figure 10). The depositional rate and the organic matter maturity of source rock of the third member of the Shahejie Formation are basically in positive correlation. Apart from some areas in the Liaoxi sag in which their depth is relatively shallow and their organic matter maturity is relatively low, the other sags have all reached the threshold of hydrocarbon generation. The central-north part of the Bozhong sag and the central-north part of the Lioazhong sag both have reached the gas generation threshold (Figure 16). It can be clearly seen from the figure that in the third member of the Shahejie formation, overpressures are just observed in the areas where the high degree depositional rates and high organic matter maturities are distributed, which manifests that the main genetic mechanism of the overpressures in this member is hydrocarbon generation of organic matter and disequilibrium compaction of mudstone plays a supplemental role.
Superimposition map of the organic matter maturity of source rock and pressure coefficient of the third member of the Shahejie Formation, the Bohai Bay Basin (the maturity of organic matter is from data of CNOOC (2010)).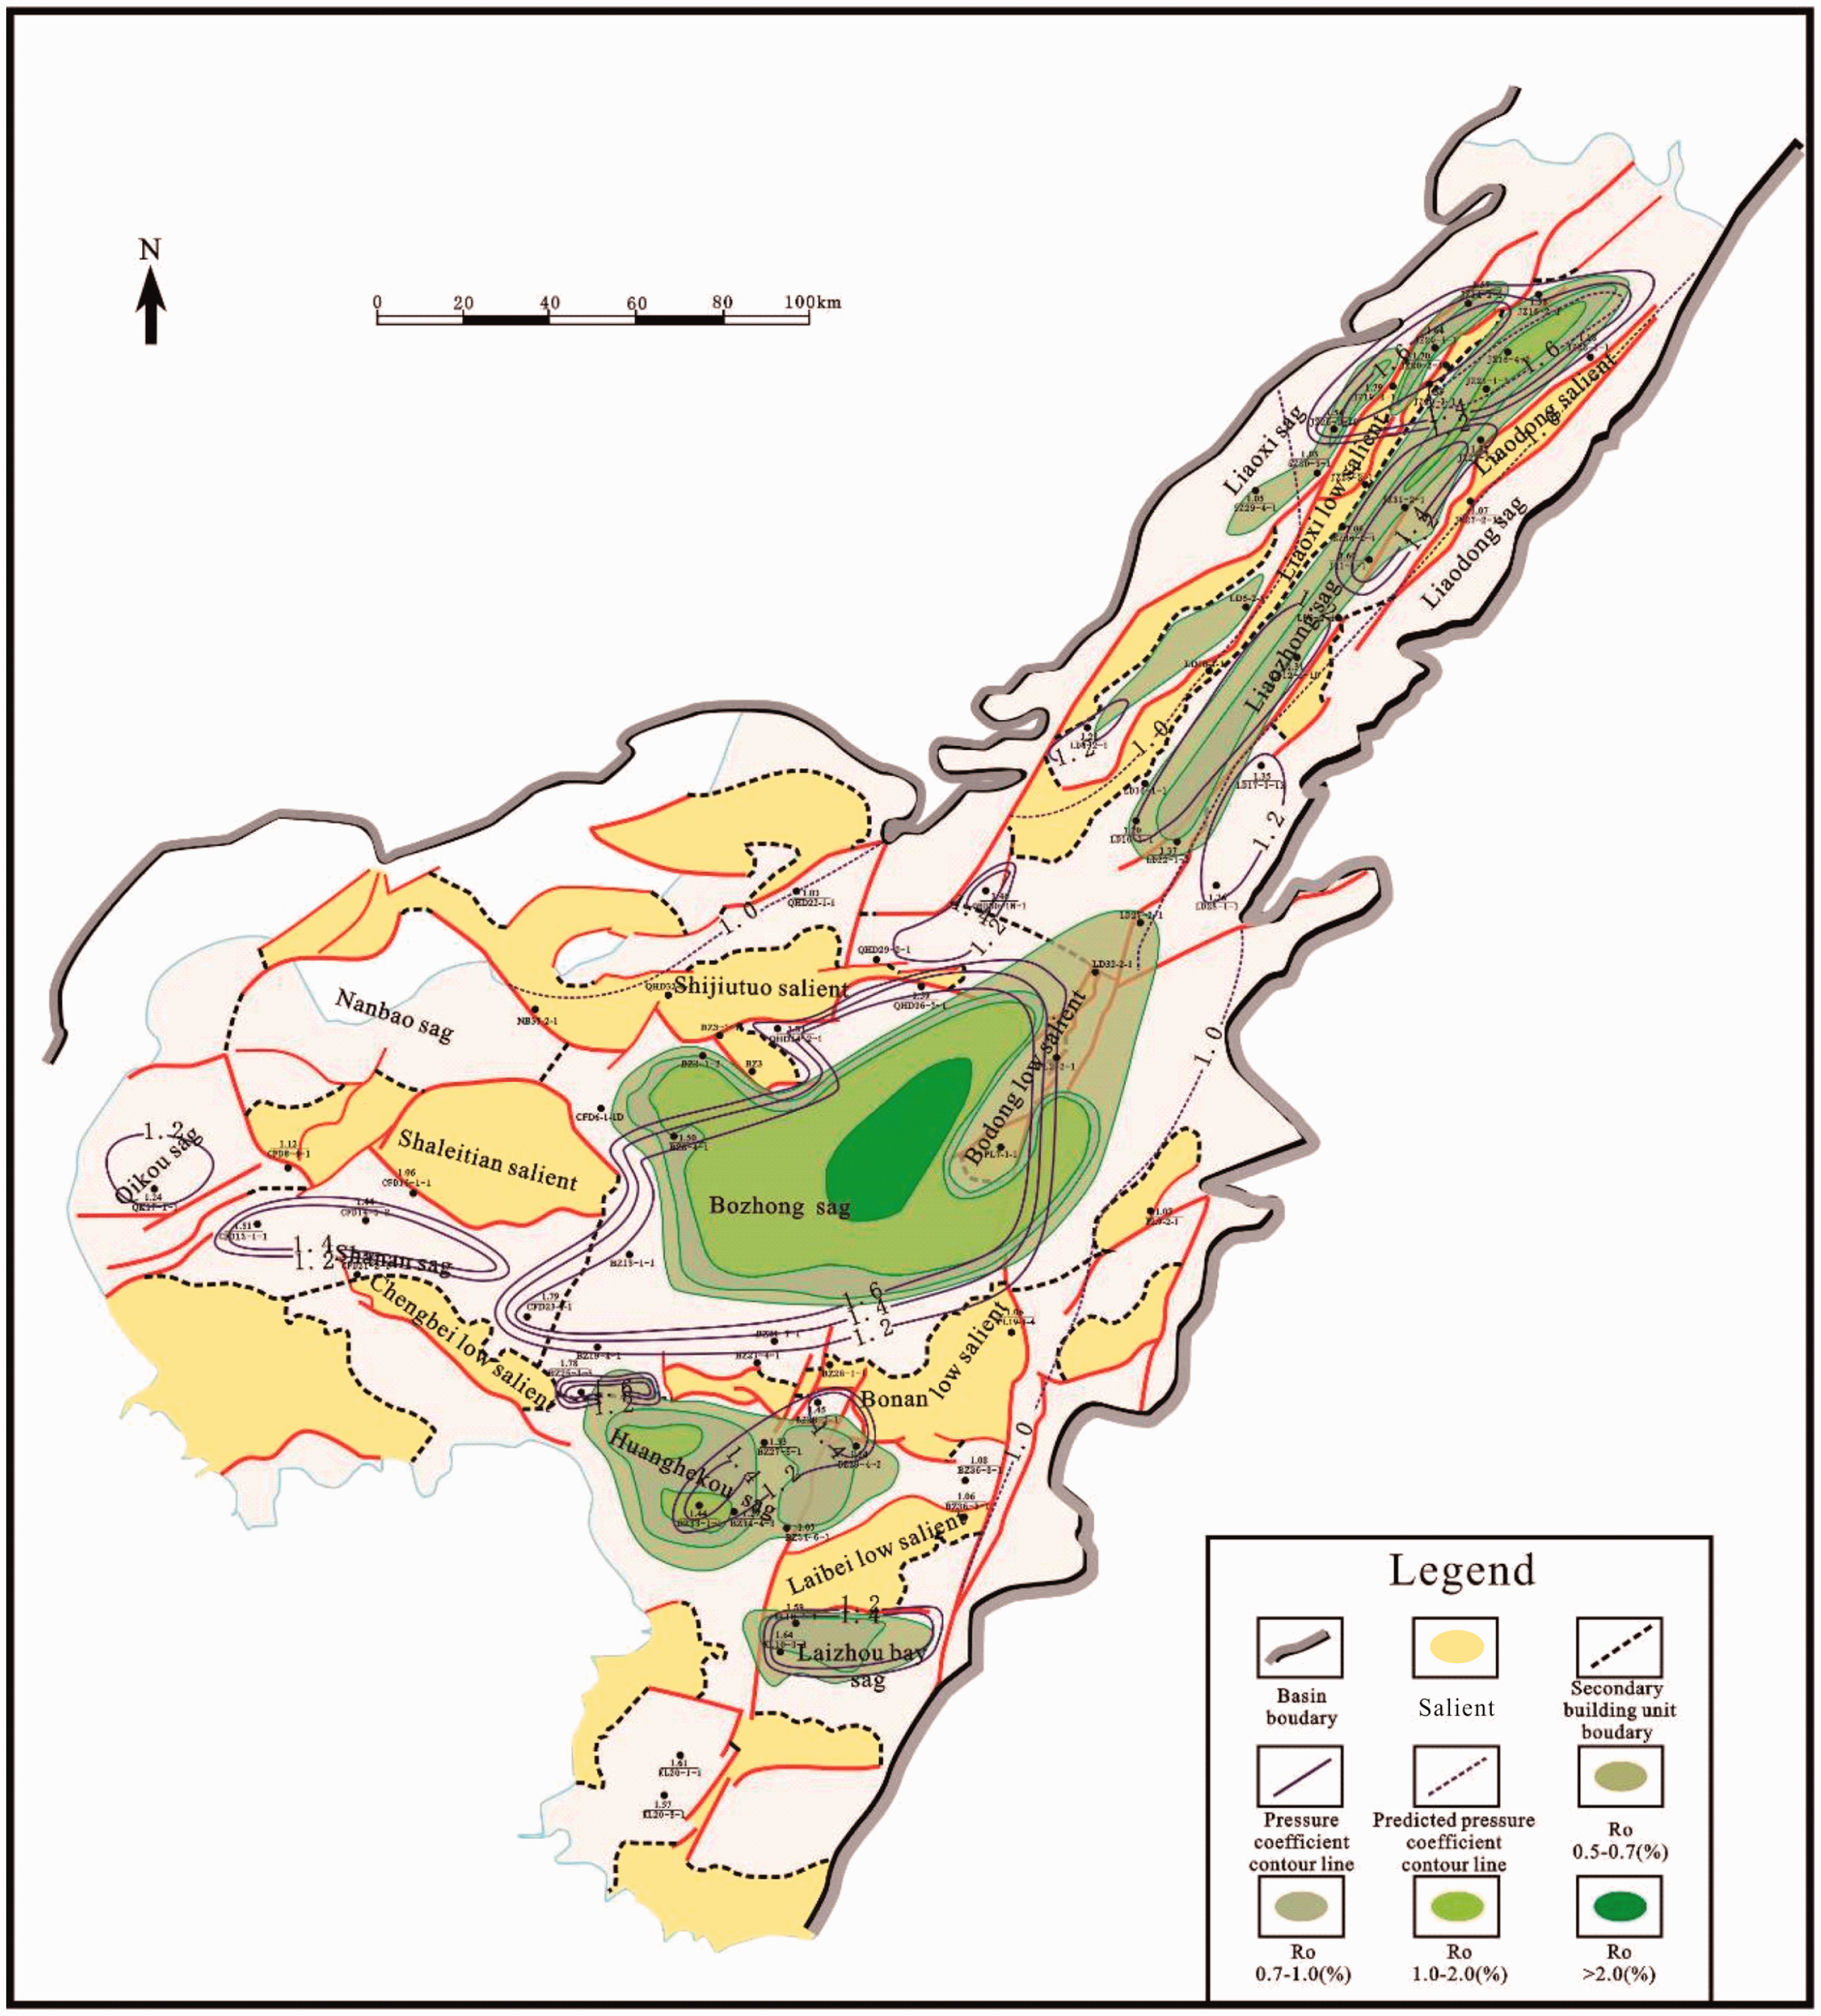
Conclusions
The main genetic mechanisms for the overpressures of the Paleogene in Bohai bay area are as follows: disequilibrium compaction, hydrocarbon generation of organic matter, charging and transmission of fluid, or the combination of the two factors among them. The overpressures in the shallow parts of mudstone layers are formed by disequilibrium compaction; the pressure increasing due to hydrocarbon generation in the deeper parts of the sags stimulates the degree of the overpressures. The overpressures in the reservoir are basically formed by the charging and transmission of fluid. Among this kind of overpressures, a part of them is formed by the charging and transmission of the water from the disequilibrium compacted mudstone to the reservoir and another part of it is formed by the process of oil and gas generated from overpressured source rock and transmitted to the reservoir. Different genetic mechanisms of overpressures possess particular geological, geophysical, and geochemical response characteristics. The discrimination of the geneses of the overpressures in different sections can be differentiated through the crossplot of velocity, density, and vertical effective stress. The overpressures in the Paleogene of Bohai bay basically starts from the second member of the Dongying Formation, only in well KL10-1-1, overpressure was found that starts from the third member of the Shahejie Formation. The overpressures mainly developed in the lower section of the second member of the Dongying Formation to the third member of the Shahejie Formation. Below the second member of the Dongying Formation, the overpressure is not only widely distributed and its degree is also increasing gradually. Especially, the third member of the Dongying Formation is the interval with the most widely distributed overpressures. In the central parts of each salient belt, the pressures are basically normal, the sags and the ramp regions around are the main areas that overpressures developed. Overpressures mainly developed in areas around Bozhong sag, Huangheko sag, and the north and south of Liaodong bay and the pattern of overpressure distribution is controlled by the tectonic framework of “sag–salient” of the basin. The genetic mechanism of the overpressures in the second member of the Dongying Formation is disequilibrium compaction. The main genetic mechanism of the overpressures in the third member of the Dongying Formation is disequilibrium compaction, However, Liaozhong sag and some deeper parts of Bozhong sag are able to generate hydrocarbon and the pressure increasing caused by hydrocarbon generation has also made some contribution to it. The geneses of the overpressures in different members of the Shahejie Formation are relatively more complicated. The main geneses of the overpressures in its first member is disequilibrium compaction and hydrocarbon generation of organic matter plays a supplemental role, and the overpressures in some reservoirs are formed by the charging and transmission of oil and gas. The geneses of the overpressures in the second member of the Shahejie Formation are the charging and transmission of oil and gas. The third member of the Shahejie Formation is the main source rock interval in the study area, the geneses of its overpressure is mainly hydrocarbon generation, but the disequilibrium compaction of mudstone still has some impact because of the high depositional rate. This paper has figured out distributive ratio for overpressure forming by different genetic mechanisms quantitatively. The measured overpressure reservoir is mainly oil- and gas-bearing layers, which directly indicates that the charging and transmission of oil and gas in the formation is critical for the generation of overpressures in permeable formations. It also indirectly shows the contribution of the pressure increasing caused by hydrocarbon generation in the source rock layers around reservoirs.
Footnotes
Declaration of conflicting interests
The author(s) declared no potential conflicts of interest with respect to the research, authorship, and/or publication of this article.
Funding
The author(s) received no financial support for the research, authorship, and/or publication of this article.