
Abstract
This study examines the dynamic relationships between renewable energy consumption (REC), GDP or economic growth (EG), financial development (FD), and green innovation (GI) in eight MENA countries during the period of 1996–2021 through the lens of lobbying effect, sustainability, and energy transition theories. Employing FMOLS, DOLS, and CCR estimators for long-run coefficients, complemented by Dumitrescu-Hurlin causality tests, we find that there is a statistically significant link between RE and EG at the 1% level; a 1% increase in lnEG corresponds to an increase in lnREC by 1.150%, 0.959%, and 0.553%, respectively. Then, we establish a positive and significant sign at the 1% level between REC and the FD; an upsurge by 1% in lnFD will raise the level of lnREC by 0.113%, 0.050%, and 0.171%, respectively. However, the FMOLS and CCR estimation shows a negative and significant sign at 1% between REC and GI; an increase of 1% in lnGI will decrease the level of lnREC by 0.175% and 0.359%, respectively. We identify one bidirectional causality between REC and FD and two one-way causality, one running from EG to REC and the other from REC to GI. These results suggest the need for policy refinements, particularly in aligning innovation strategies with renewable energy deployment to enhance sustainability in the MENA region.
Introduction
The increasing demand for natural resources significantly strains ecosystems, resulting in critical environmental issues. Today, fossil fuels account for more than 80% of EIA's energy worldwide (EIA, 2021). Since the ground-breaking study by Erdal et al. (2008), Korkut Pata et al. (2023), and Yu and Hwang (1984), the link between energy consumption and GDP has garnered significant attention (Rafindadi, 2016) establishing energy as an essential factor in achieving economic prosperity. Moreover, within the sustainability domain, which includes economic, sociocultural, and ecological aspects, ecological concerns are prominent and have been thoroughly documented by academics and policymakers (Frodyma et al., 2022; Si Mohammed and Ugur Korkut, 2023). REC is a significant predictor of environmental sustainability (Abbas et al., 2024; Chica-Olmo et al., 2020; Mohammed et al., 2024; Rafindadi and Ozturk, 2017; Salaheddine and Hacen, 2024; Sari Hassoun and Mekidiche, 2018; Wang, Hossain et al., 2023). By shifting from traditional energy to REC, societies can reduce CO2 emissions, decrease air and water pollution, and enhance energy security (Bellos, 2018; Dong et al., 2022; Sari-Hassoun et al., 2019). The theoretical construct suggests that the magnitude of a non-RE capacity is a crucial determinant of its carbon intensity. Under conditions where other factors remain unchanged, countries with substantial non-RE resources tend to follow development paths that depend more heavily on CO2 than those with limited non-RE reserves. Additionally, it's notable that energy-rich countries exhibit a reduced reliance on RE. For example, RE sources contribute only 0.09% to the primary energy mix in petroleum-rich countries like Saudi Arabia. Similar figures are observed in Algeria and Iran, where RE accounts for 0.25% and 1.64% of the primary energy mix, respectively.
In this pursuit, Green innovation (GI) entails creating and implementing new ideas, technologies, and practices that are environmentally sustainable and apply to various industries, including greener energy (Appiah et al., 2023; Sari Hassoun and Ayad, 2020; Shahzad et al., 2023; Su and Fan, 2022). Furthermore, GI encompasses many initiatives and advancements, such as creating efficient energy storage solutions such as advanced batteries and pumped hydro storage (Sonu et al., 2023; Vadiee and Martin, 2012). Additionally, bioenergy production advancements contribute to GI by facilitating the conversion of organic materials into biofuels such as bioethanol and biogas. Furthermore, the adoption of electric vehicles (EVs) and advancements in battery technology are significant steps toward reducing the transportation CF, which has traditionally relied on conventional energy (Dall-Orsoletta et al., 2022; Li et al., 2023; Rubio et al., 2023). Finally, GI minimizes waste by designing products and systems prioritizing reuse, recycling, and resource efficiency, thereby contributing to a more sustainable and less wasteful future(Li et al., 2022; Wang, Razib et al., 2023). Simultaneously, well-developed financial systems can mobilize resources more efficiently, providing capital for large-scale RE projects and green technology, offering subsidies and grants, and reducing uncertainty risk in the energy market (Hung, 2023; Li and Umair, 2023).
The FD plays a crucial role in enhancing the transition toward REC by facilitating investments, reducing associated risks, and providing the necessary financial infrastructure (Sari-Hassoun et al., 2019). Robust financial systems facilitate greater access to capital for RE projects, stimulate innovation through increased funding opportunities, and support the development of sustainable energy technologies (Cheikh et al., 2025; Horvey et al., 2024). Additionally, FD helps to lower the cost of capital, improve risk management, and create favorable conditions for private sector participation in the RE sector (Li and Umair, 2023; Sari-Hassoun et al., 2019). Furthermore, these developments extend their influence on policy decisions, advocating for renewable-friendly policies and subsidies (Liu et al., 2023). FD component is one obstacle to introducing REC in developing countries (Alam et al., 2024; Baudino, 2024; Lahiani et al., 2021). However, other scholars see that FD can positively support the introduction of RE in several countries (Guo et al., 2023; Mukhtarov et al., 2022; Somoye et al., 2022). Kihombo et al. (2022) stated that FD has emerged as a key factor influencing countries’ economic advancement, and the rapid increase in production, which has resulted in increased energy consumption, should be considered. According to Boufateh and Saadaoui (2020), factors such as financial openness, energy prices, structural changes, turmoil crises, and inflation significantly influence the dynamics of RE adoption, and investment not only influences the financial sector but also plays a significant role in determining energy consumption levels. In this regard, there are several investigations on the link between FD and energy use in development (Ma et al., 2022; Shahbaz et al., 2021). Danish and Ulucak (2021) demonstrated that an efficient financial system can enhance the availability of loans, increasing their capacity to acquire energy products. Renewables are widely recognized since they are essential to achieving sustainable development goals (SDGs) and can add value to socioeconomic aspects by meeting energy demands, reducing the impact of pollution, and raising population well-being. Aydin and Bozatli (2023) indicated that increased usage of REC might increase financial inclusion and reduce the risk of economic policy uncertainty. The study contends that the complex link between GDP and RE significantly impacts policymakers. A nation with adequate energy resources can experience enhanced productivity and various economic benefits, such as increased competitiveness, the fulfillment of previously unmet demands, and the generation of new value (Abbass et al., 2022). Also, the 2030 SDGs can be attained innovatively by converting the economy from traditional to greener energy (Murshed et al., 2021). Likewise, Usman and Makhdum (2021) stated that it was impossible to underestimate RE consumption to accomplish SDGs.
This research emphasizes the association between GDP, FD, and GI in eight MENA nations. The MENA region was chosen as a focal case study because of the dynamic structural, economic, and societal transformations in recent years (Ayad et al., 2023). These include rapid economic progress and evolving financial systems. Furthermore, these countries’ commitment to enhancing their RE sector is grounded in their focus on rapid economic progress and evolving financial systems. Thorough environmental evaluations are vital for identifying and reducing the effects of mining activities, and these sectors have been identified as major contributors to environmental degradation, notably air pollution-related health problems. Consequently, there is a strategic need for a shift toward RE in these oil-rich nations to alleviate the negative environmental impacts linked to their conventional energy sectors, as suggested by the curse carbon hypothesis.
Figures 1 and 2 illustrate the trajectory of GI and REC in eight MENA countries from 1996 to 2021. They both show a complex and varied environmental focus and energy use. This variability shows how these countries approach environmental issues and RE at different stages of development, priorities, and strategies. GI data, measured as the percentage of environmental patents over total patents and focus on the development and diffusion of environment-related technologies, shows significant differences between countries. Algeria, Morocco, and Saudi Arabia have higher average percentages of 20.44%, 17.75%, and 19.45%, respectively, indicating a focus on environmental innovation, while Egypt and Lebanon have lower averages with 9.71% and 8.84%, respectively. Government policies, economic shifts, and international environmental agreements may cause such fluctuations. The REC trends are also varied. Egypt has a high maximum RE consumption with an average of 153019.2 terajoule, due to significant investments in this sector from previous years. However, Saudi Arabia's lower consumption may reflect its fossil fuel-based energy mix and economy. Tunisia and Morocco have wide ranges, which may indicate changing infrastructure and investment in RE technologies. This regional variation reflects each country's unique challenges and opportunities. Natural resource availability, economic conditions, technological advances, and policy frameworks may influence these trends. Countries rich in fossil fuels may have fewer economic incentives to invest heavily in RE.
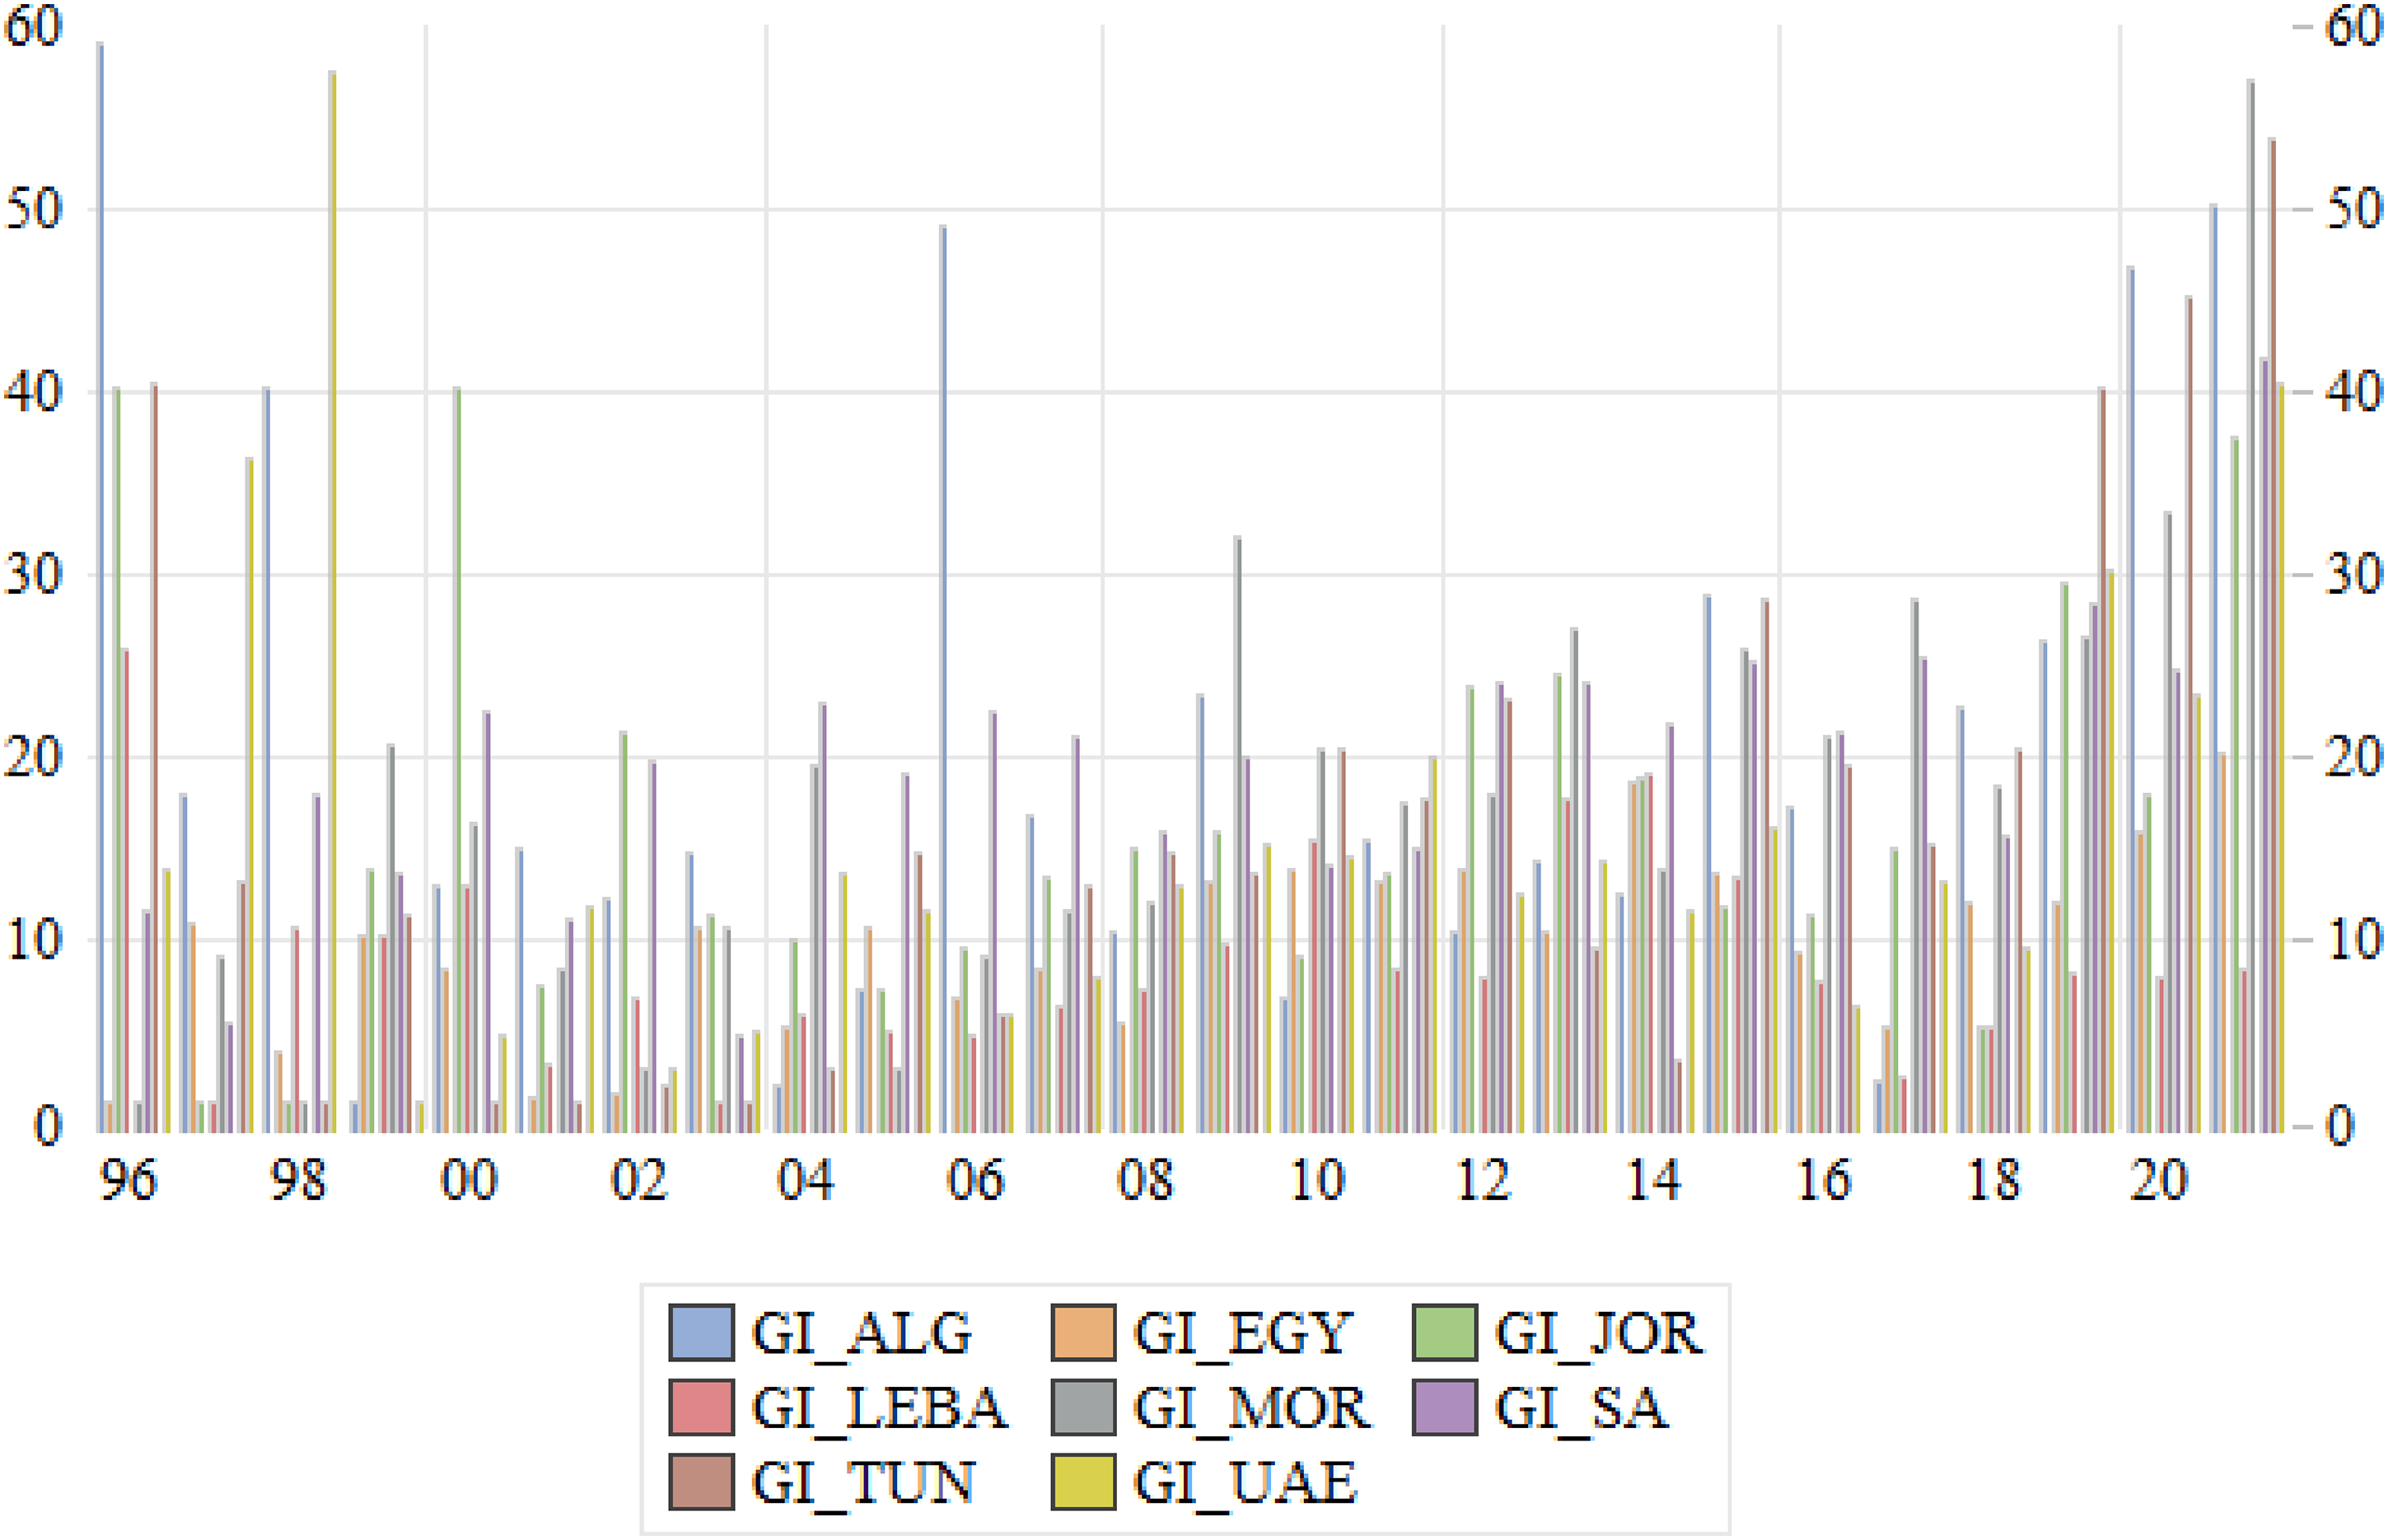
GI in the MENA region's chosen countries from 1996 to 2021.
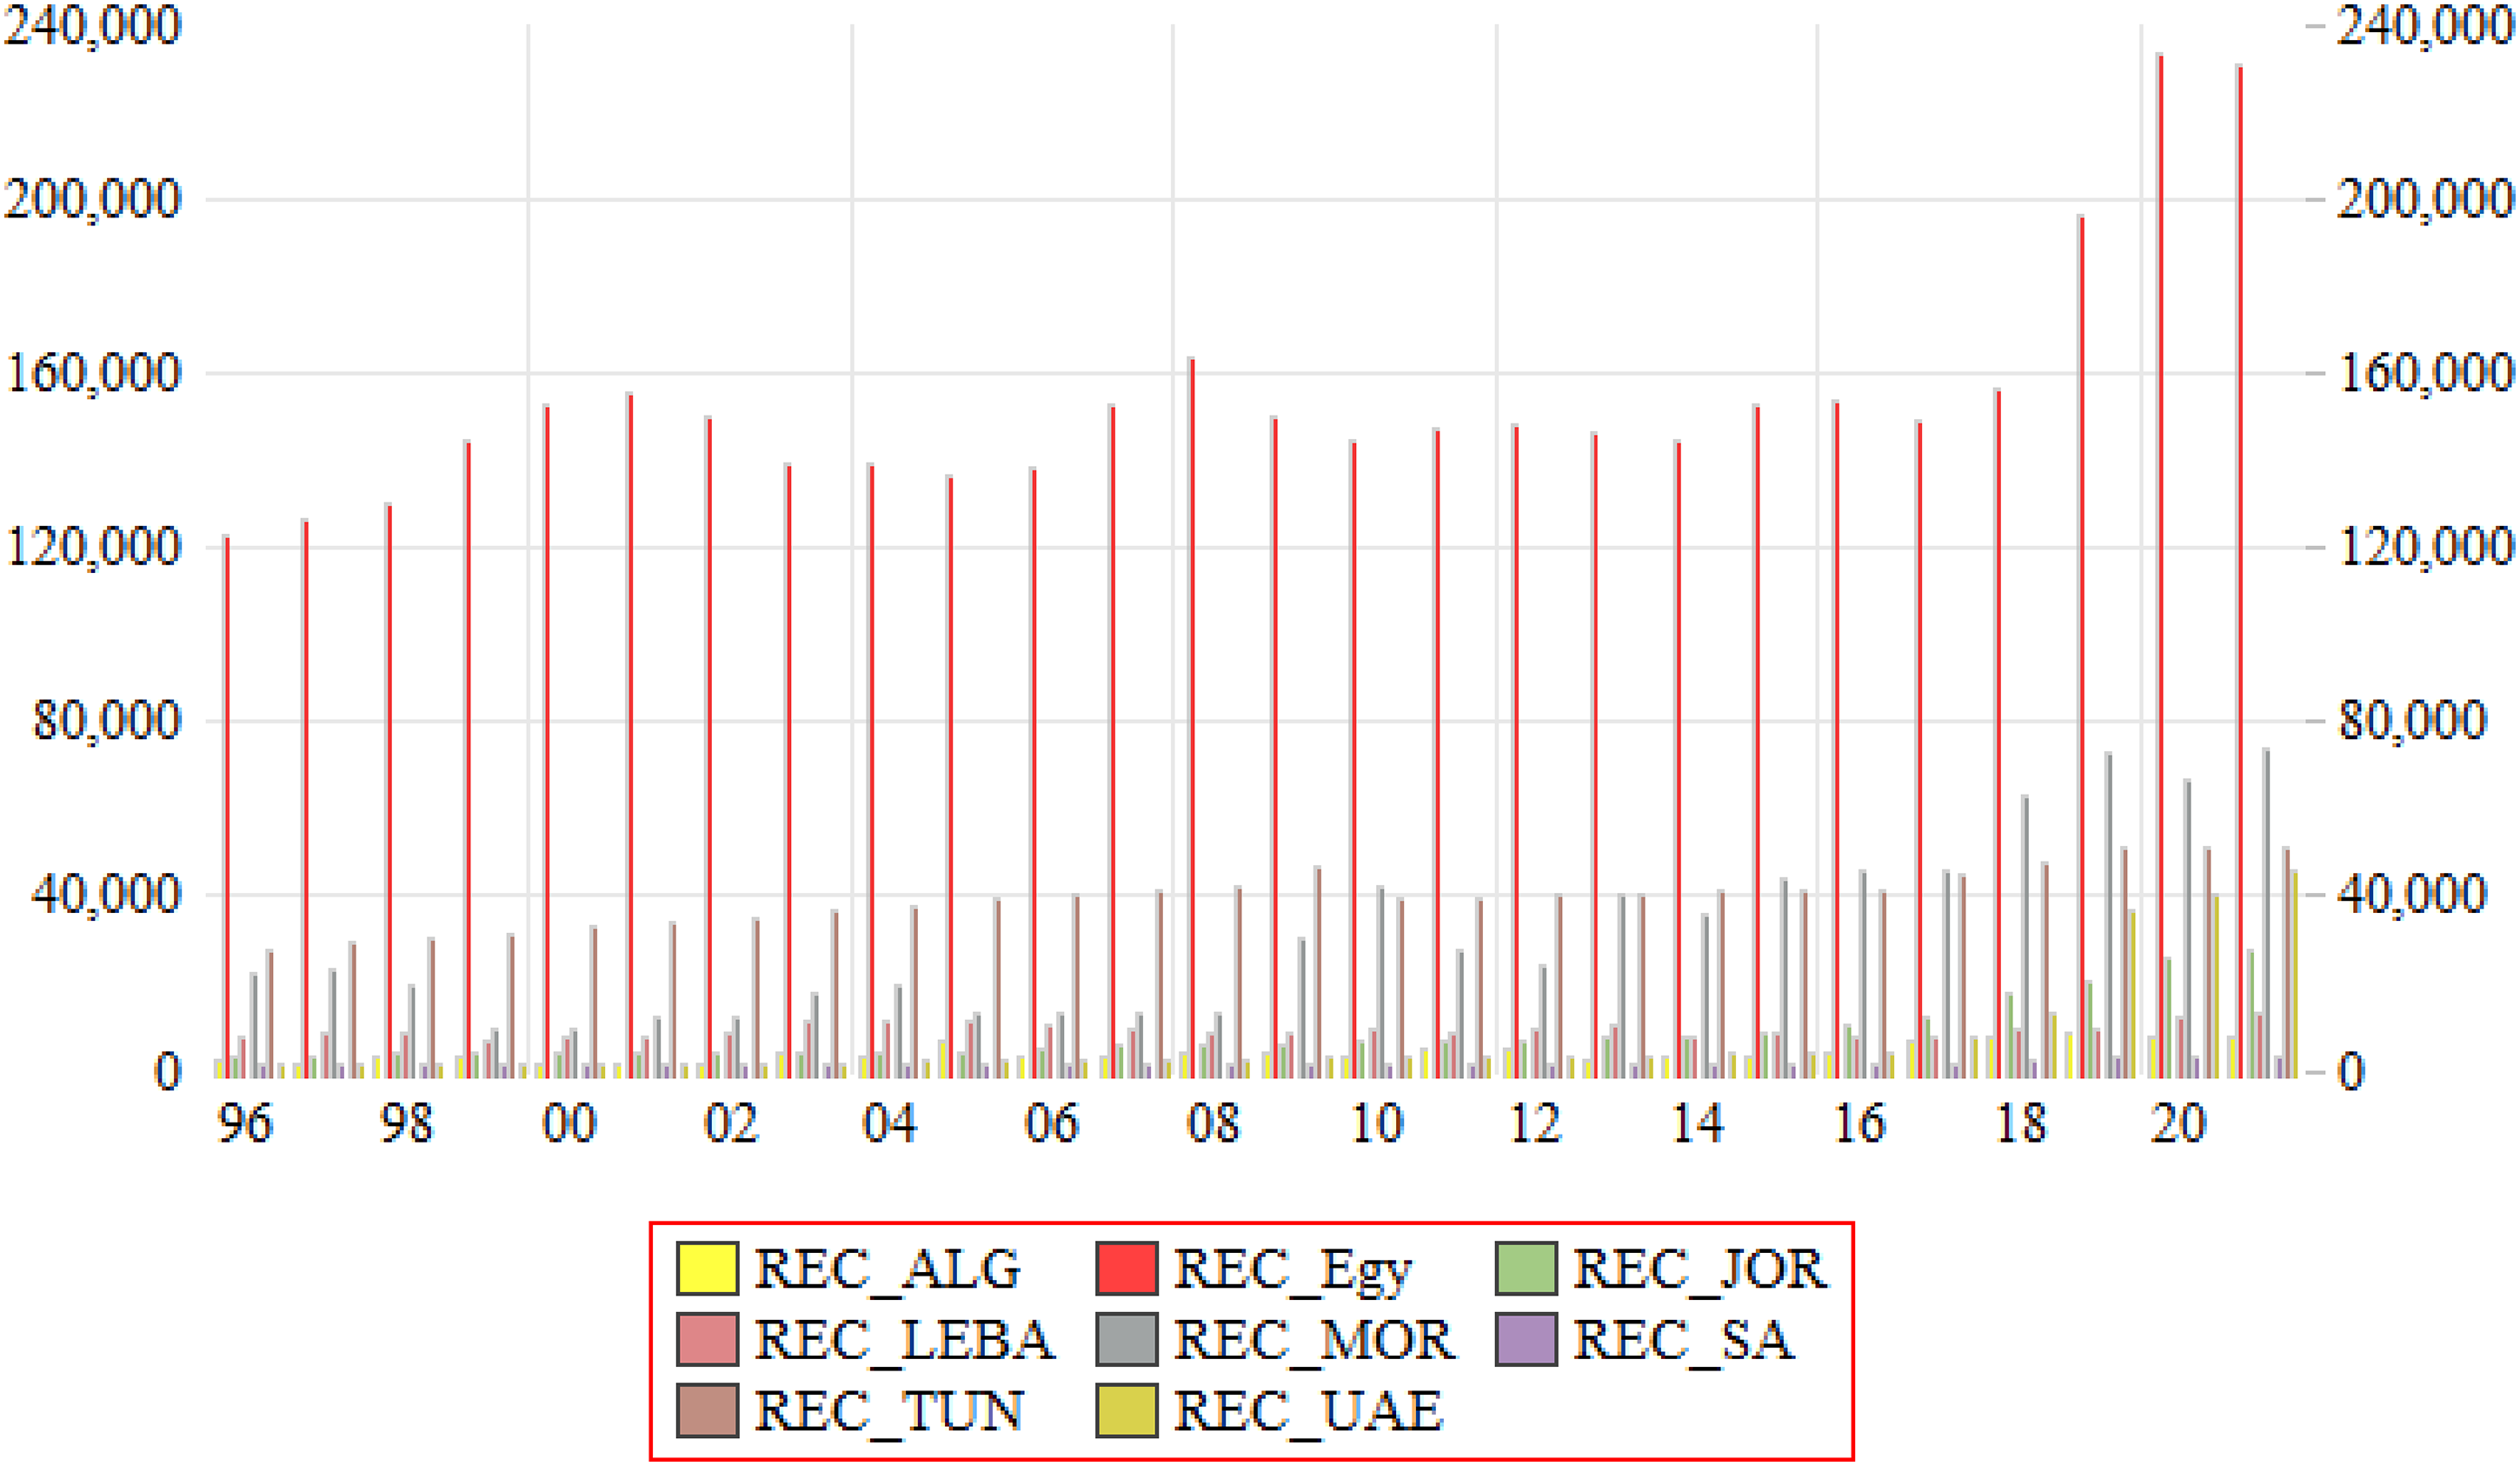
REC in the MENA region's chosen countries from 1996 to 2021.
Furthermore, regional policymakers face obligations from international agreements, particularly the imperative to achieve SDGs by 2030 (Göll et al., 2019). The agricultural sector and water remain essential and are the main sources of employment and political stability in the MENA (Haouas et al., 2023). The study will also explore how RE is affected by GDP, FD, and GI to dominate these patterns. The existing literature will be strengthened by new evidence on this topic. This study offers three potential contributions to the existing literature on energy, particularly considering the selected groups of countries. Prior research has scarcely examined the link between the FD index and REC in the MENA countries. Therefore, (1) only scarce research has examined the link between FD and non-conventional energy, especially in this region under the carbon curse. (2) MENA countries have some of the world's highest per-capita CO2 emissions and some of the highest growth rates due to the cheapness of oil and gas. Consequently, thе study prominеntly accеntuatеs thе pеrspеctivе of REC, GI, and thе sustainability of thе financial sеctor in this rеgion, undеrscoring its importancе and thе associatеd implications for еnеrgy and еnvironmеntal sustainability. The study concludes that GDP, FD, and GI either have no effect on or have a negative or positive impact on REC and will serve as the basis for the policies that will be implemented to promote RE development to avoid the existence of the carbon curse. (3) The nuanced implications of varying REC primary determinants offer potential advantages in discerning distinct and actionable heterogeneous effects while facilitating the quantification of associated trade-offs and benefits. The efficacy of bootstrap tests is evaluated in this research article through a simulation study that incorporates various datasets, employs the modern CCR method, and contrasts it with FMOLS and DOLS techniques. (4) The empirical pursuits will improve SDG 7, SDG 9, and SDG 13 policy design and increase environmental awareness by interacting with REC, GDP, FD, and GI.
In general, the literature has examined the effects of FD and GDP on RE sources in great detail. Recent contributions highlight the intricate relationships between these variables and recommend adding new ones, like adding GI to our model. In particular, the impact of GDP, FD, and GI varies with varying levels, as shown by interaction effects from multiple prior regressions. Based on these assumptions, this research attempts to add to the body of knowledge in several ways. First, to the best of our knowledge, this study is the first to evaluate the inclusion of GI while considering the development and diffusion of environment-related technologies. Second, we focus our analysis on eight Middle East and North Africa (MENA) countries, comprising the world's major oil-producing economies with abundant oil supplies, to account for cross-sectional dependence (CSD) and spillover effect. Furthermore, to our knowledge, no prior research has examined the relationship between REC, GDP, FD, and GI in eight MENA nations between 1996 and 2021. This research contributes to the United Nations’ Sustainable Development Goals. Correlations between economic expansion, renewable energy consumption, and financial mechanisms promoting growth through green jobs support Goals 7 and 8. However, the negative linkage between renewable innovation and capacity draws attention to Goal 9's infrastructure and technology targets. More effective solutions seem necessary to transition from dependence on polluting sources. Consider Goal 13 and combating climate change. Integrated strategies must consider economic, financial, and technical coordination. However, the study's insights reveal the complexity of this objective. Achieving lower emissions demands sophisticated policy reforms synchronizing R&D with deployment. Regional collaboration under Goal 17 is crucial to balance economic aims with sustainability. Partnerships could help design holistic solutions accounting for varied circumstances across nations. Lastly, insights advocate comprehensive reform. Innovations must serve renewable scaling-up to enhance environmental performance across the Middle East and North Africa. But goals interconnect, and trade-offs exist. Policymakers face difficult choices balancing near-term economic welfare with future-proofing against climate hazards. With political will and commitment to cooperation, however, targets can complement rather than compete.
The structure of the research process is as follows: Basic information about the topic is described in the first section of the research, and the literature review is presented in the second section. The dataset, model, and method are explained in detail in the third section of the study. The fourth section presents the analysis findings, and the conclusion and discussion section includes policy suggestions that fall within the purview of the findings.
Literature review
This section presents the neoclassical growth theory, energy transition theory, and lobbying effect theory as the theoretical frameworks and summarizes previous empirical research examining the relationship between REC, GDP, FD, and GI.
Theoretical background
Solow was the main developer of neoclassical growth theory, highlighting how labor, capital, and technology propel economic expansion (Solow, 1956, 1994). This theory asserts that technological advancements and increases in labor and capital inputs are the main drivers of long-term economic growth (EG). As an essential type of capital input, energy is vital to the production process and, consequently, to industrialization. In the neoclassical growth framework, energy production is a type of capital investment. Productivity and EG increase when industrial activities are made possible by dependable and efficient energy infrastructure.
Moreover, in this paper, we focus on the energy transition theory, which asserts that by assisting environmentally friendly businesses, implementing RE sources, and encouraging ecological innovations, FD plays a crucial role in rerouting rents from polluting activities to the RE sector (Shahbaz et al., 2021). Furthermore, it is challenging to study RE in MENA nations that rely heavily on fossil fuels because they have several oil lobbies and interest groups with significant negotiating power in oil-rich nations (Baudino, 2024). The “lobbying effect theory” states that these organizations significantly influence governments to oppose funding for the growth of non-oil industries, such as investments in RE (Somoye et al., 2022). Consequently, they can strengthen reliance on oil rents in spite of growing environmental concerns by putting the interests of the oil industry first and preventing the adoption of cleaner technologies and diversification of energy sources.
Therefore, to analyze and determine whether or not these countries have the foundation and framework required for the adoption of clean energy, we focus this paper on the relationships between REC, GDP, FD, and GI in eight MENA countries.
Empirical review
Although scholarly works on the association between REC, GDP, GI, and FD are abundant, studies are lacking due to how quickly technology and the economy are developing and changing. In light of this, it is clear that research in energy, environmental technology, GDP, and financial aspects is essential for attaining sustainable development.
FD is often considered a driving force behind sustainable growth and technological advancement. Access to well-functioning capital markets and efficient financial systems can facilitate investments in cleaner, more energy-efficient technologies. Some papers have shown a positive relationship between FD and energy in Malaysia (Islam et al., 2013), Turkey (Ozturk and Acaravci, 2013), 27 European countries (Çoban and Topcu, 2013), Nigeria (Rafindadi, 2016), Japan (Rafindadi and Ozturk, 2017), ASEAN + 6 countries (Hoang, 2021), and France (Rafindadi et al., 2022), while Chen (2025) shows a negative relationship between FD and energy in four BRICS countries.
Tan and Uprasen (2022) established that foreign direct investment (FDI) dissuaded host nations from utilizing RE due to the scale effect. In contrast to developing countries with weak financial systems, wealthy countries can use their funds to support the development of RE sources, according to Akpanke et al. (2023), which supports the findings of Pata et al. (2022) that the depth of financial instruments in the US encourages the use of RE sources. The environment suffers due to nations’ heavy reliance on fossil fuels with limited resources. Samour et al. (2022) examined EG and FD instruments on REC in the United Arab Emirates from 1989 to 2019, and they indicated that EG and FDI can significantly increase the UAE's RE potential. Using the dynamic ARDL approach, Islam et al. (2022) found that FDI stimulates all energy resources in Bangladesh. Nchofoung et al. (2023) found that environmental tax or green taxation as an FD instrument and EG have a positive and significant on RE for 49 global countries. The positive and significant relationship between FD and REC was found in the investigations of Akintande et al. (2020) in the five most populous nations in Africa, Somoye et al. (2022) in Nigeria, Mukhtarov et al. (2022) for Turkey, Guo et al. (2023) for 30 China provinces, Liu et al. (2023) for G7, Sari-Hassoun et al. (2019) for 12 Arab countries, Horvey et al. (2024) for 47 African countries, and Cheikh et al. (2025) for 31 African countries
Anton and Afloarei Nucu (2020) analyzed the link between REC and FD in 28 EU countries from 1990 to 2015, employing a panel fixed effects model, indicating the positive influence of the financial markets on RE consumption. Zeren and Hizarci (2021) identified a long-term favorable link between FD and the adoption of biomass energy.
Similarly, Kevser et al. (2022) examined the connection between GDP, FD, and biomass in African countries from 1993 to 2017. Their analysis using the DH causality framework revealed a reciprocal positive link between GDP, FD, and biomass energy. Furthermore, given the unique financial market conditions, the implications of biomass energy may differ on a national scale. Peng et al. (2022) utilized panel cointegration to study the effects of ecological innovation, financial regulations, and GDP on FD and REC in 29 OECD countries. Their findings show that financial advancement, EG, and environmental technology positively correlate with REC. Panel data methodologies were used by Fang et al. (2022), who evaluated the effects of GDP, FD, and GI on REC in 15 BRIC countries from 1998 to 2019, finding that GDP, FD, and GI all positively impact REC.
However, the negative and significant relationship between FD and REC was established in the studies of Lahiani et al. (2021) for the USA, Baudino (2024) for 35 of OPEC+, Saqib et al. (2024) for 10 leading mineral-exporting countries, and Alam et al. (2024) who investigated the relationship between FDI and REC in India during the period of 1980 to 2023. They established a negative and significant connection among variables in the short run, while in the long run, the sign was positive and insignificant.
Following a succinct and thorough explanation of the empirical findings on FD and REC, we focus on green technology and GI. Green technology is pivotal in counteracting environmental deterioration, enhancing energy utilization efficiency, and shifting to RE. Scholarly investigations propose that incorporating green technology, encompassing RE sources and energy-efficient innovations, can markedly diminish energy intensity. Recent scholarly work has empirically investigated the association between the advancement of environmental innovation and REC. Geng and Ji (2016) found a positive and significant relationship between GI and REC in six major developed countries during 1980–2010. Vural (2021) showed evidence that GI significantly impacts REC in selected South America. Shahzad et al. (2021) used the panel cointegration technique to investigate the impact of environmental technology and GDP on RE across 29 OECD from 1994 to 2018. They established both GDP and environmental technology (GI) positively impact RE. Bashir et al. (2022) examined the impact of GDP and environmental technology (GI) on RE in the G-7 countries from 1994 to 2018. They concluded that environmental technology and GDP positively impact REC. Fang et al. (2022) showed a positive connection between GI and REC in 15 BRICS countries from 1998 to 2019. Aydin and Bozatli (2023) employed ARDL and NARDL to investigate the link between EG, FD, and GI regarding the REC in the OECD countries from 1994 to 2019. They revealed that, in the long run, GDP has little effect on the REC, while FD and GI, on the other hand, have a significant impact. Usman et al. (2023) established a positive and significant relationship between GI and REC in 15 European countries from 2005 to 2018. Alam et al. (2024) investigated the relationship between GI and REC in India from 1980 to 2023. They established a positive and significant connection among variables in the short and long run. Baudino (2024) discovered that patent applications had a favorable and noteworthy effect on RE consumption, indicating that technological innovation is a key factor in promoting RE usage for 35 of OPEC+.
However, Khan et al. (2021) showed that GI negatively influences REC levels in 69 countries enlisted under China's Belt and Road Initiative. Alexiou (2023) examined the relationship between patent systems and RE use for 47 nations and found that growth and R&D lower the use of RE. Benfica and Marques (2024) studied the relationship between GI and REC in the context of six Latin American countries from 2015 to 2020. They showed that GI is insignificant with a weak energy structure and might not have an immediate impact on REC. However, higher GI investment positively correlates with REC in nations with moderate energy efficiency, highlighting the significance of fostering technological innovation in these settings.
On the other hand, the nexus between RE and GDP is a complex and increasingly relevant field of research, particularly within sustainable development and environmental preservation (Chica-Olmo et al., 2020; Haq et al., 2024; Rehman et al., 2022; Shahzad et al., 2023; Si-Mohammed et al., 2022; Usman and Hammar, 2021). Considerable scholarly attention has been directed toward investigating this correlation, resulting in a prevailing agreement that the shift towards sustainable energy sources significantly contributes to fostering economic advancement, albeit with certain intricacies and subtleties (Khan et al., 2020; Wang et al., 2023). The conventional EG paradigm relied heavily on fossil fuels, which, although efficient in propelling industrialization and GDP, resulted in environmental deterioration and heightened carbon emissions (Raza et al., 2019).
Numerous scholarly investigations have underscored the enduring economic advantages of allocating GDP resources, such as fiscal policy and public spending toward sustainable energy sources (Anbumozhi et al., 2018; Caglar and Ulug, 2022). The advantages encompassed in these benefits consist of an augmented level of energy security, diminished reliance on imported fuels, and the alleviation of the detrimental consequences arising from the volatility of non-REprices on economies (Mitić et al., 2022; Tiwari et al., 2023). Fang et al. (2022) established a positive relationship between GDP and REC in 15 BRICS countries from 1998 to 2019. Aydin and Bozatli (2023) exposed that in the long run, GDP positively affects the REC in the OECD countries. Adem and Çetin (2024) examined the effects of trade openness, natural resources, GDP, FD with broad money as a percentage of GDP, and FDI on the use of RE in 15 African nations between 1980 and 2018. Using Driscoll-Kraay and FGLS estimation, they discovered that while FD and natural resources impede the use of RE, GDP, FDI, and trade openness promote it. Additionally, they demonstrated a bidirectional causal relationship between using RE and all independent variables. Horvey et al. (2024) showed a positive and significant relationship between REC and GDP for 47 African countries.
However, Hoa et al. (2023) found that GDP, FDI, and energy consumption hinder RE use in several Asian countries. Baudino (2024) discovered a negative and significant relationship between GDP and REC, indicating that EG in 35 of OPEC+ nations is still heavily reliant on fossil fuels rather than RE. Cheikh et al. (2025) establish a negative relationship between REC and GDP for 31 African countries.
Methods
Data
This study utilized annual data for four key variables: REC, economic progress, FD, and GI. The dataset comprises annual statistics from eight MENA countries from 1996 to 2021. Figure 3 illustrates the data trends, while Table 1 presents the corresponding sources and measurement details.
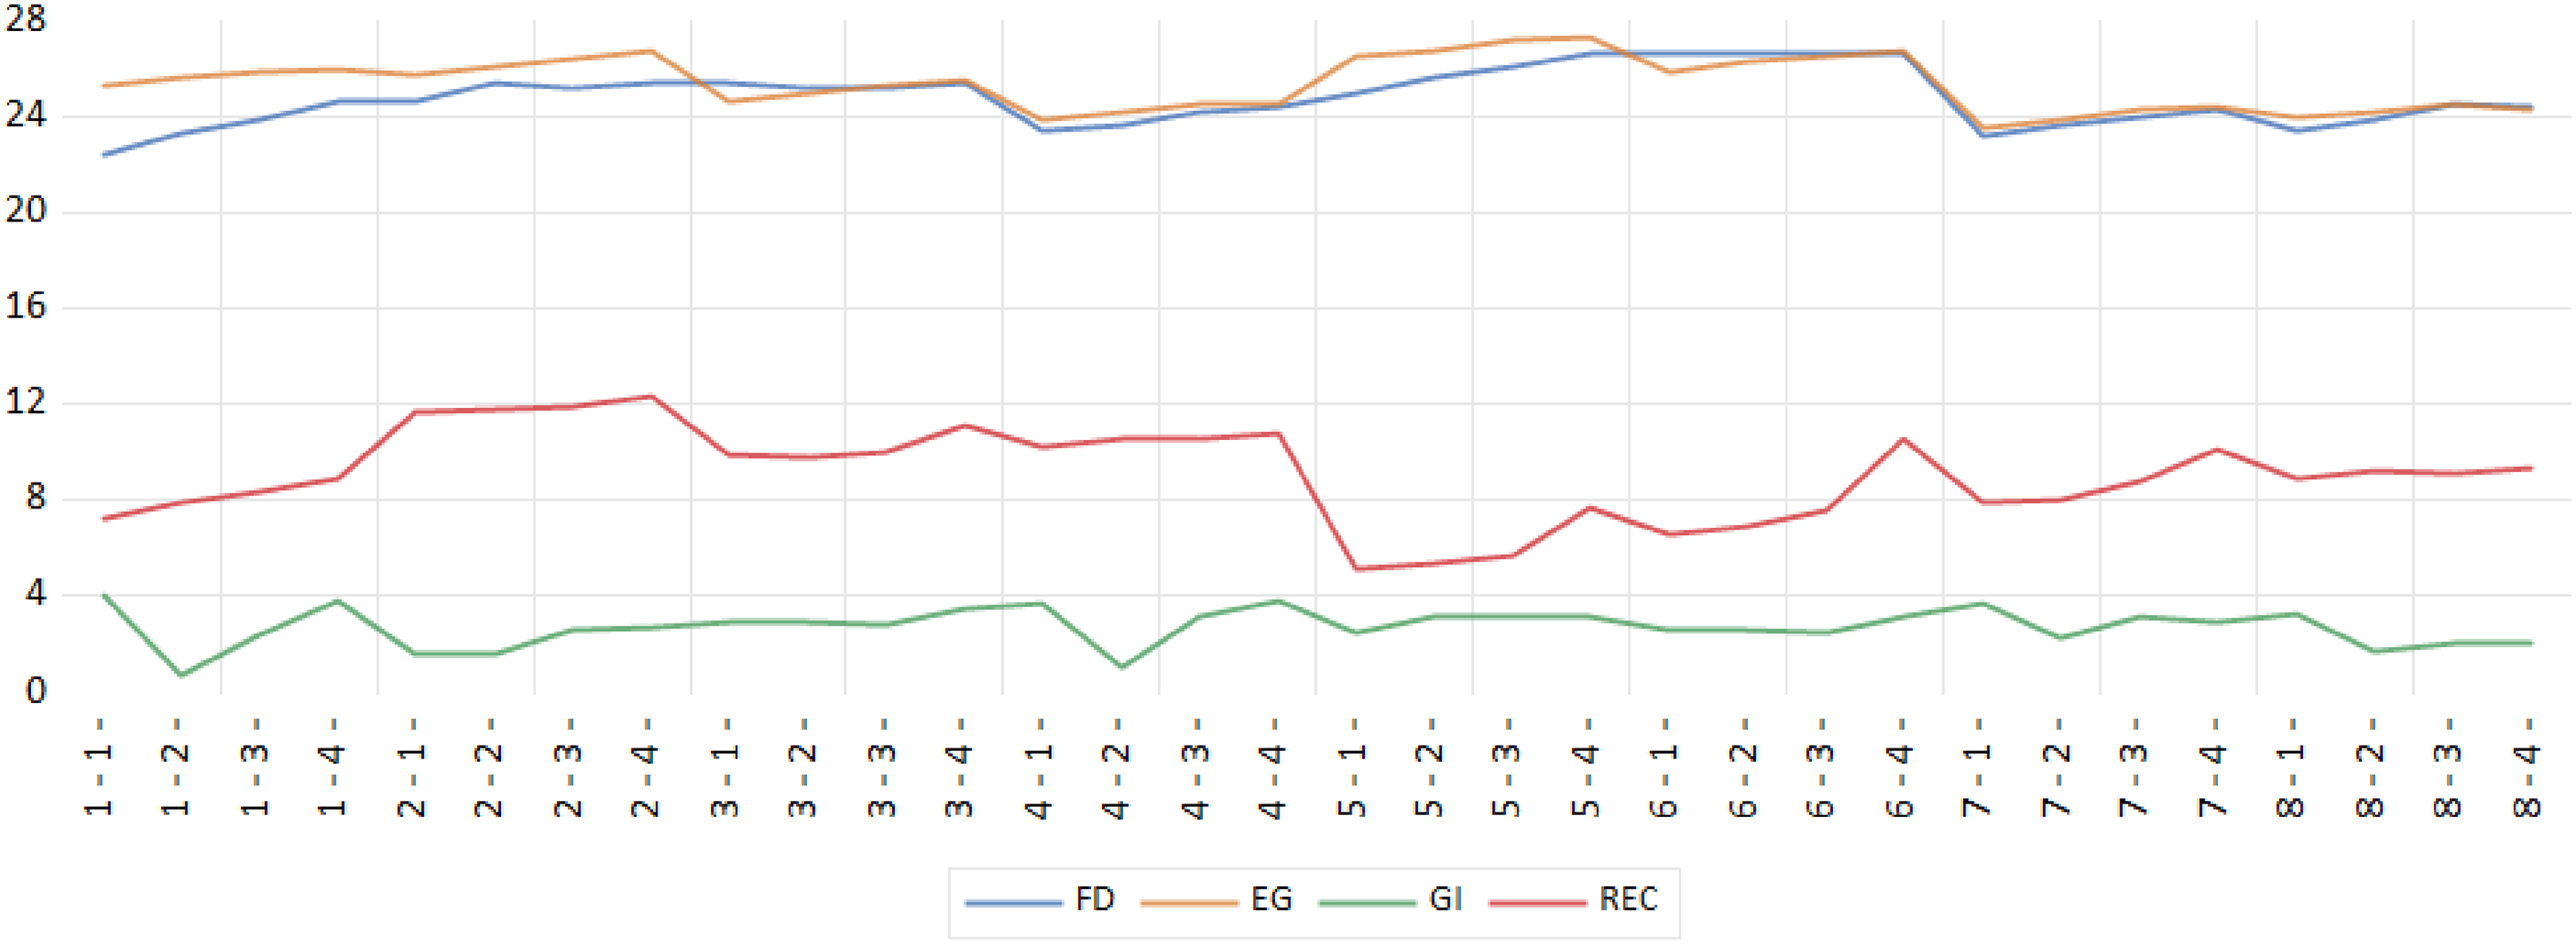
Data trend.
Variables description.
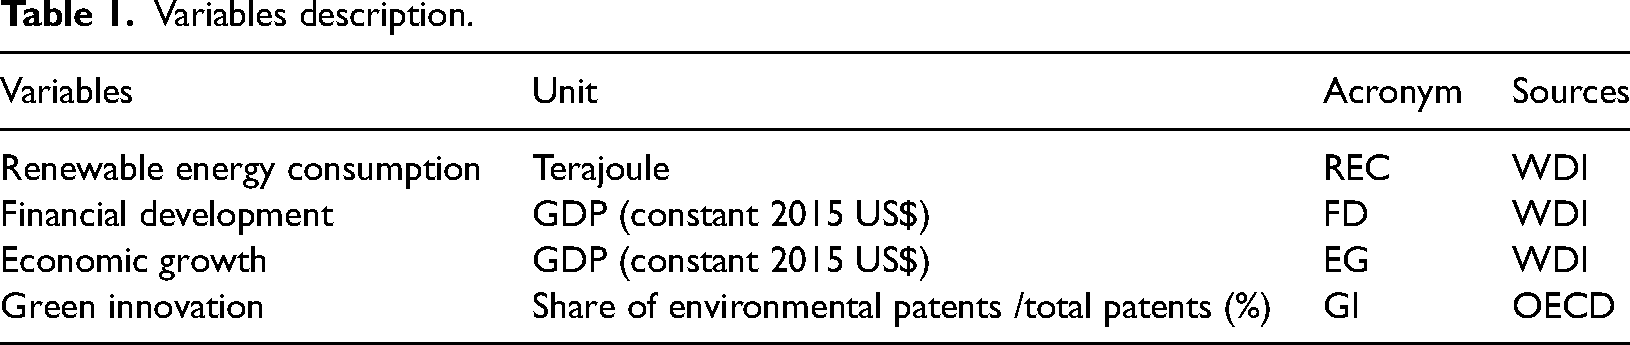
The FD (IMF, 2024) is a quantitative measure designed to assess a country's level of financial maturity. This index represents the amount of domestic credit extended to the private sector by various financial institutions, including monetary authorities, depositary banks, and other data-reporting institutions. Domestic credit encompasses various fiscal instruments, including loans, non-equity securities acquisitions, trade credits, and other receivable accounts, each creating a repayment obligation. It is worth noting that in some cases, these obligations may extend to include credits granted to public sector bodies. The term “financial corporations” is all-encompassing in the architecture of this index, encompassing not only the traditional deposit-accepting establishments—such as banks endorsing transferable deposits—but also a diverse set of financial entities incurring liabilities via time-sensitive or savings deposits. This category includes but is not limited to, financial and leasing companies, monetary lenders, insurers, pension funds, and currency exchange entities that have a significant impact.
EG from Bank (2024), denoted as EG, is measured using the GDP growth metric, expressed in consumer prices. The methodology for computation entails aggregating the gross value added from all domestic producers within the economy, supplemented by any product-related taxes, and subtracting any subsidies that are not inherent in the product's valuation. This calculation excludes fabricated asset depreciation and natural asset attenuation and degradation considerations. The resulting figures are denominated in US dollars and expressed in constant prices relative to 2015. The official exchange rates from 2015 are used in the currency conversion process to the dollar denomination, with alternative conversion metrics for a select group of nations where the sanctioned exchange rate does not accurately reflect the rate pragmatically applied during real-time foreign currency exchanges.
As a result, the acronym REC (BP, 2024) stands for total energy consumption from renewable sources. This category includes, but is not limited to, hydroelectric power, solid biofuels, wind-driven energy, solar power, liquid biofuels and biogas, geothermal sources, marine energy, and waste-derived energy.
GI often represented by environmental technology patents is critical in addressing pressing global issues such as climate change and localized pollution. In this context, the importance of collaborative efforts in technology development stands out. One notable aspect is that international research and technological cooperation can enable local enterprises to leverage pre-existing technologies, thereby increasing local absorptive capacities. This facilitation then drives global adoption of more environmentally friendly technologies. Furthermore, inventors prioritize protecting their intellectual property in countries with potential for investment, exports, or other forms of market engagement. They frequently operate in several geopolitical markets. Compared to other alternative innovation metrics, patent data have several appealing qualities. They have many uses and are quantitative, comparable, and output-focused. They can also be broken down, which is valuable when analyzing environmental technology. However, not all discoveries or innovations are protected by patents.
Moreover, the number of patents alone does not accurately represent their relative importance and impact. Analytical techniques have been developed to address these limitations, considering factors such as patent family size and relative technological advantage. However, it is crucial to interpret these signs carefully (OECD, 2024).
Methodology
The subsequent model was applied to assess the influence of EG, FD, and GI on REC utilization. All variables were log-transformed for the analysis.
Indeed, the unit root (UR) test with the (Pesaran, 2007) CIPS (CSD) test would be an appropriate approach to examine the CSD test. This test considers heterogeneity in the autoregressive coefficient of the ADF regression, allowing for differences between panel members. To account for potential common characteristics, the dataset incorporates one latent common factor complemented by various factor loadings. The CIPS statistic is obtained by performing panel-specific ADF regression analyses on the averaged values of the explanatory and non-explanatory variables. Lagged variances are included to address serial correlation. These regressions are described through CADF analyses, which account for potential interactions and interdependencies among panel observations by considering (CSD). We then use the test developed by Karavias et al. (2021) and Ditzen et al. (2021) to determine whether there are multiple breaks at unknown breakpoints. The common correlated effects (CCE) based test mainly deals with CSD by adding cross-sectional averages of the independent and dependent variables to the regression model. Allow for multiple breaks occurring at different dates for different panel units and can handle both mean shifts and slope changes.
After checking each variable's structural break and order of integration, we shall move to the panel cointegration test (Westerlund, 2007). This test is a CSD test for the second generation of cointegration.
Furthermore, no a priori knowledge of the integration order of the relevant variables is necessary for this test. If there is a cointegration link, we can make an appropriate model for it, such as fully modified ordinary least squares (FMOLS), dynamic ordinary least squares (DOLS), and canonical cointegration regression (CCR).
Additionally, we selected these estimation methods to avoid issues related to long-run links among co-integrating equations. Phillips and Hansen (1990) propose an estimator based on semi-parametric correction. The FMOLS method is advised for I(1) cointegrated series and can be computed as follows:
Park (1992) introduced an alternative estimation method the CCR estimator, which is closely associated with FMOLS. The CCR procedure utilizes a normal distribution mix that is free of non-scalar nuisance parameters and enables asymptotic Chi-square testing. The CCR estimator can be calculated as follows:
The third method is the DOLS estimator introduced by Stock and Watson (1993). This technique outperforms FMOLS and CCR by eliminating the dependence among the regressors (Kao and Chiang, 2001). The key principle behind this estimator involves augmenting the co-integrating equation by incorporating lags of the independent variables (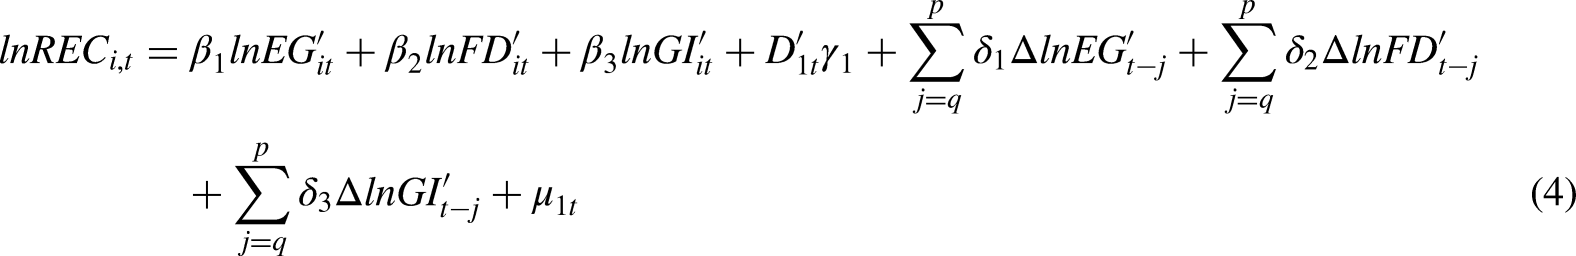
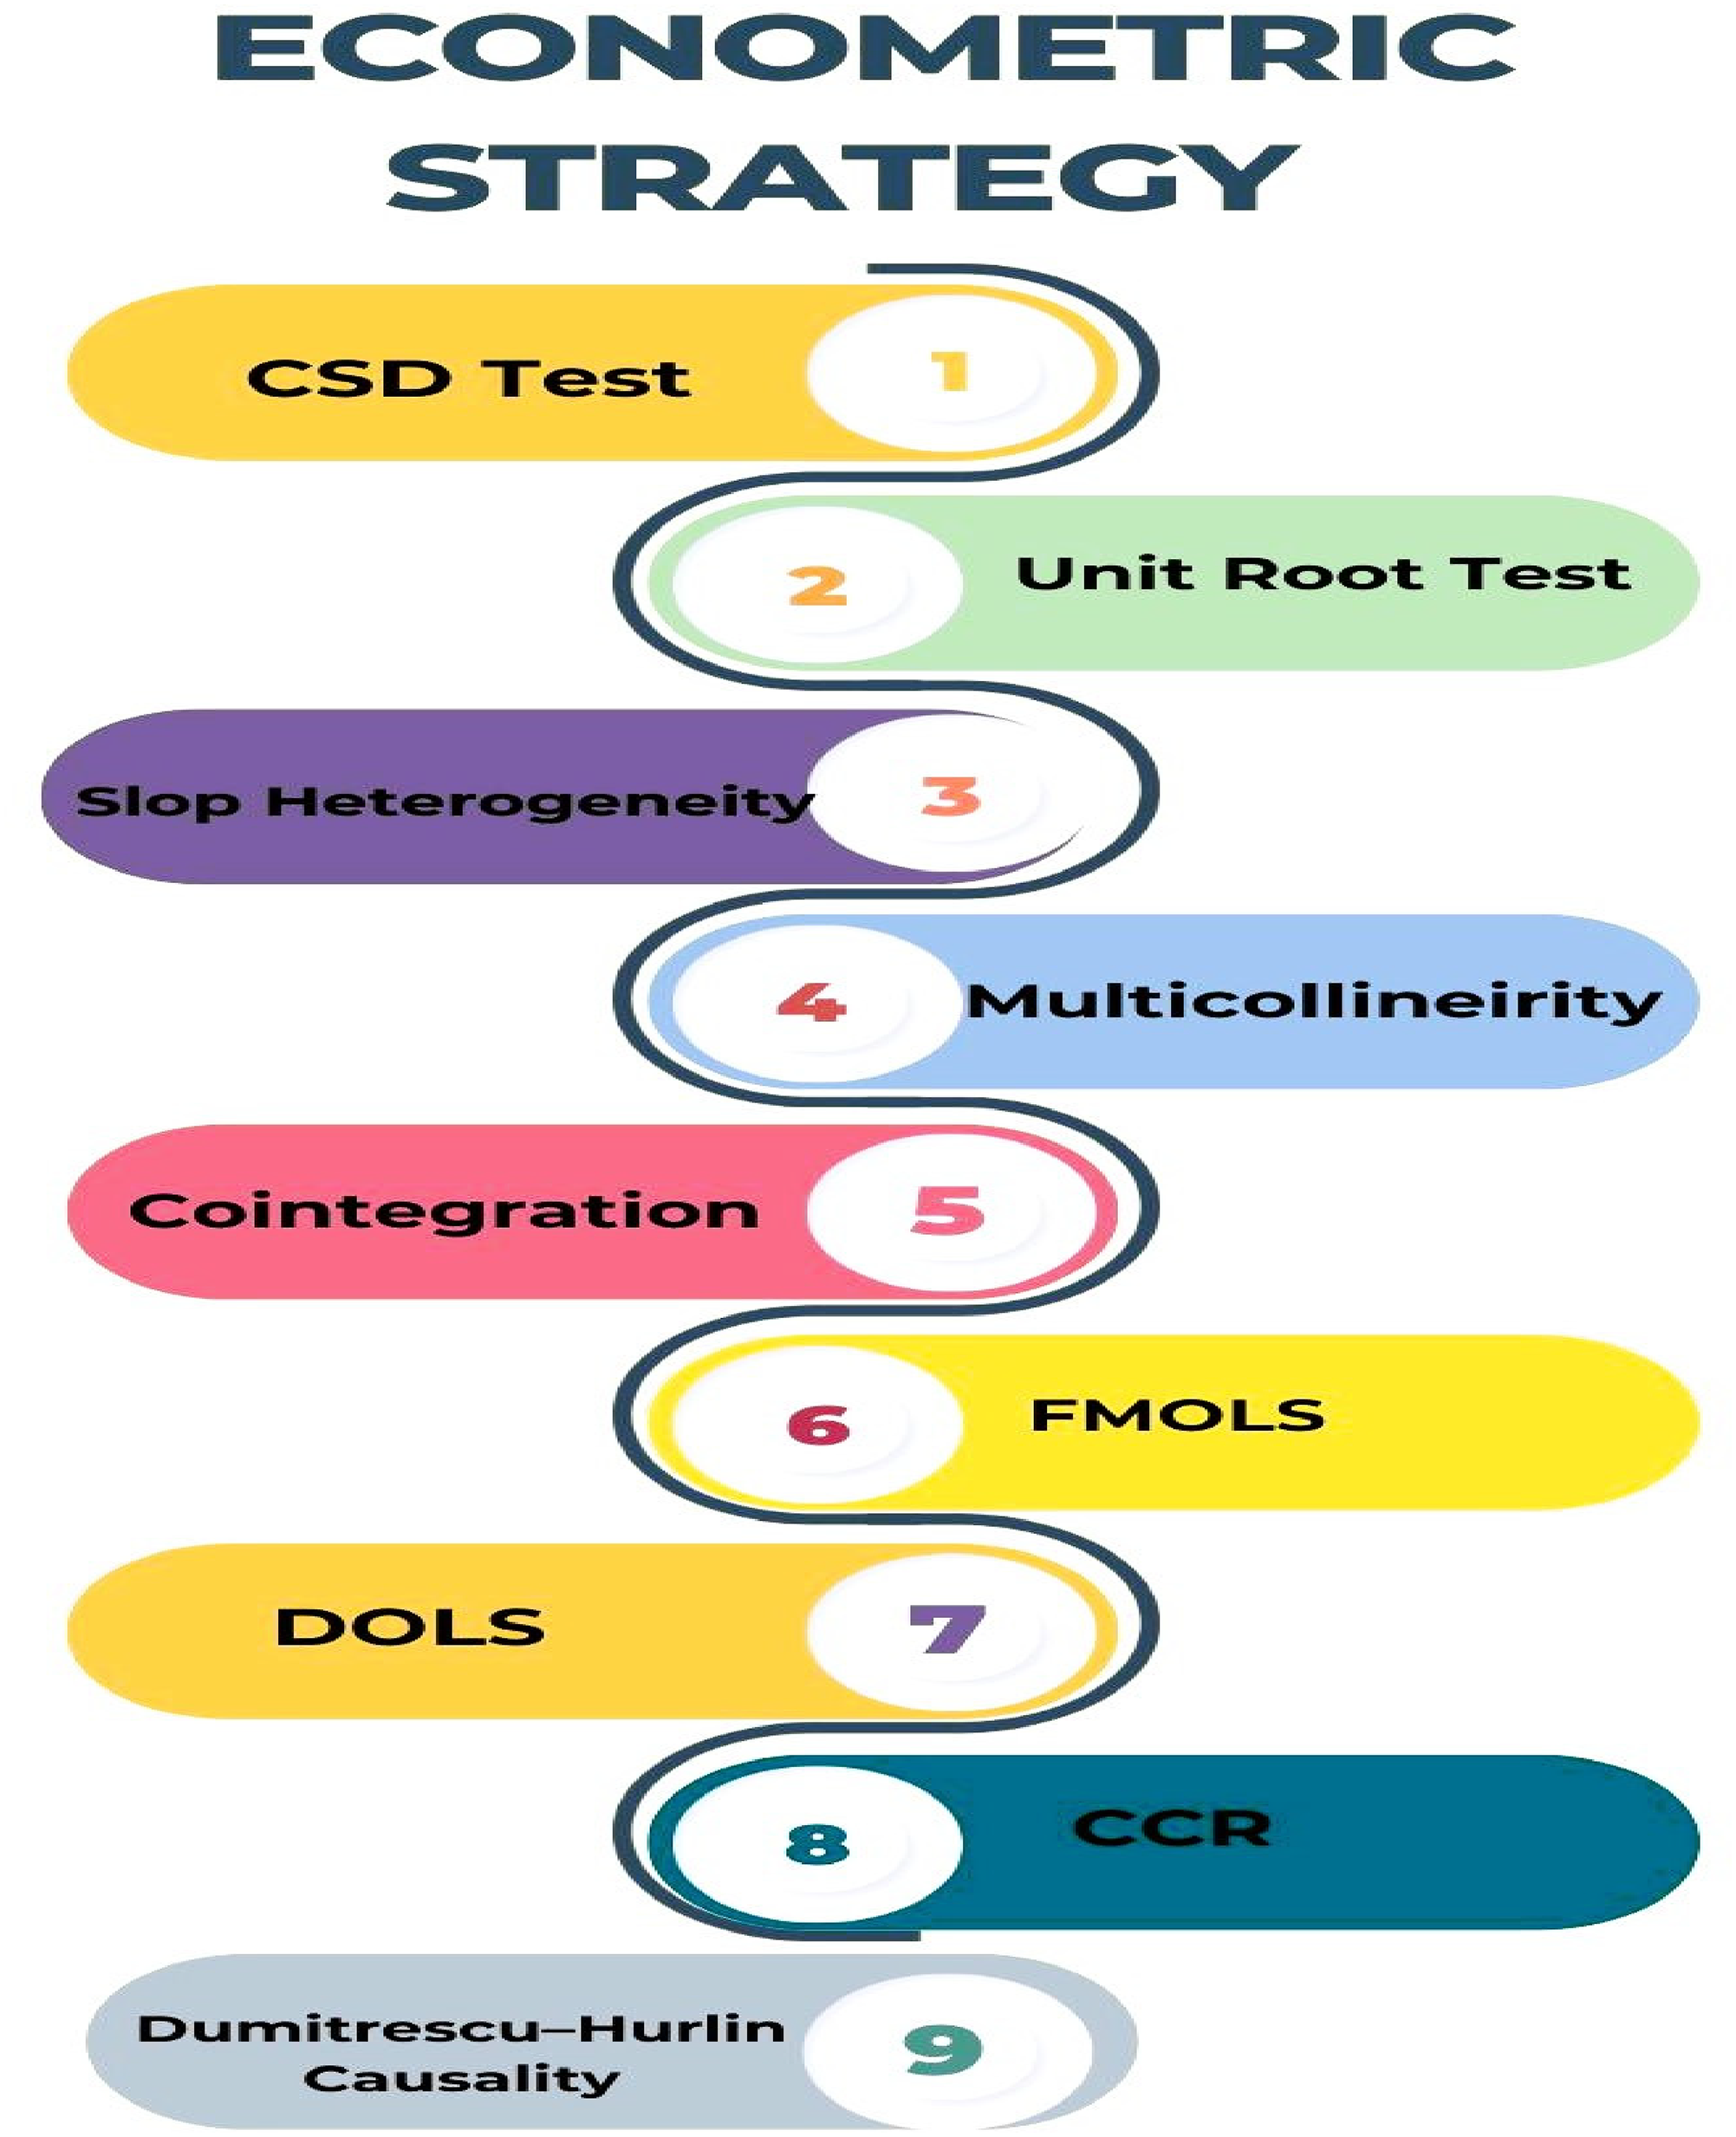
Econometric strategy.
Results and discussion
Primary statistics
Table 2 provides an overview of the descriptive statistics for the dataset. The average value of lnREN is 8.8496, varying in magnitude from 5.087 to 12.3565. Besides, the average value of lnEG is 25.389, with fluctuations ranging from 23.497 to 27.313. The average value of lnFD is 20.5622, with fluctuations ranging from 0 to 26.72, and the average value of lnGI is 2.411, with variations ranging from 0 to 4.074. However, all these series do not follow a normal distribution because the Jarque-Bera probabilities are inferior to 0.05.
Descriptive statistics.
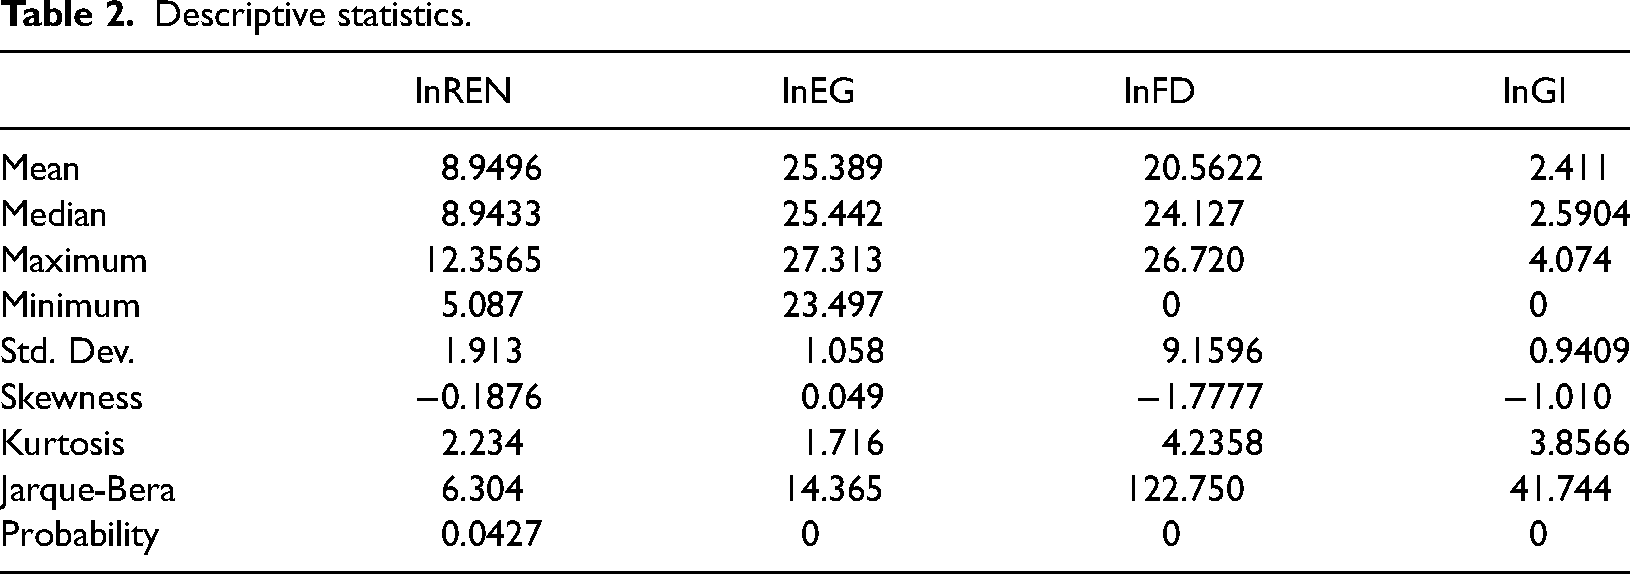
Figure 5 displays the correlation findings. Conspicuously, GDP and renewable consumption REC show the highest negative correlation, where the correlation coefficients are −0.75, followed by nexus REC*GI at about −0.65. At the same time, it positively correlates with FD with a correlation value of 0.19.
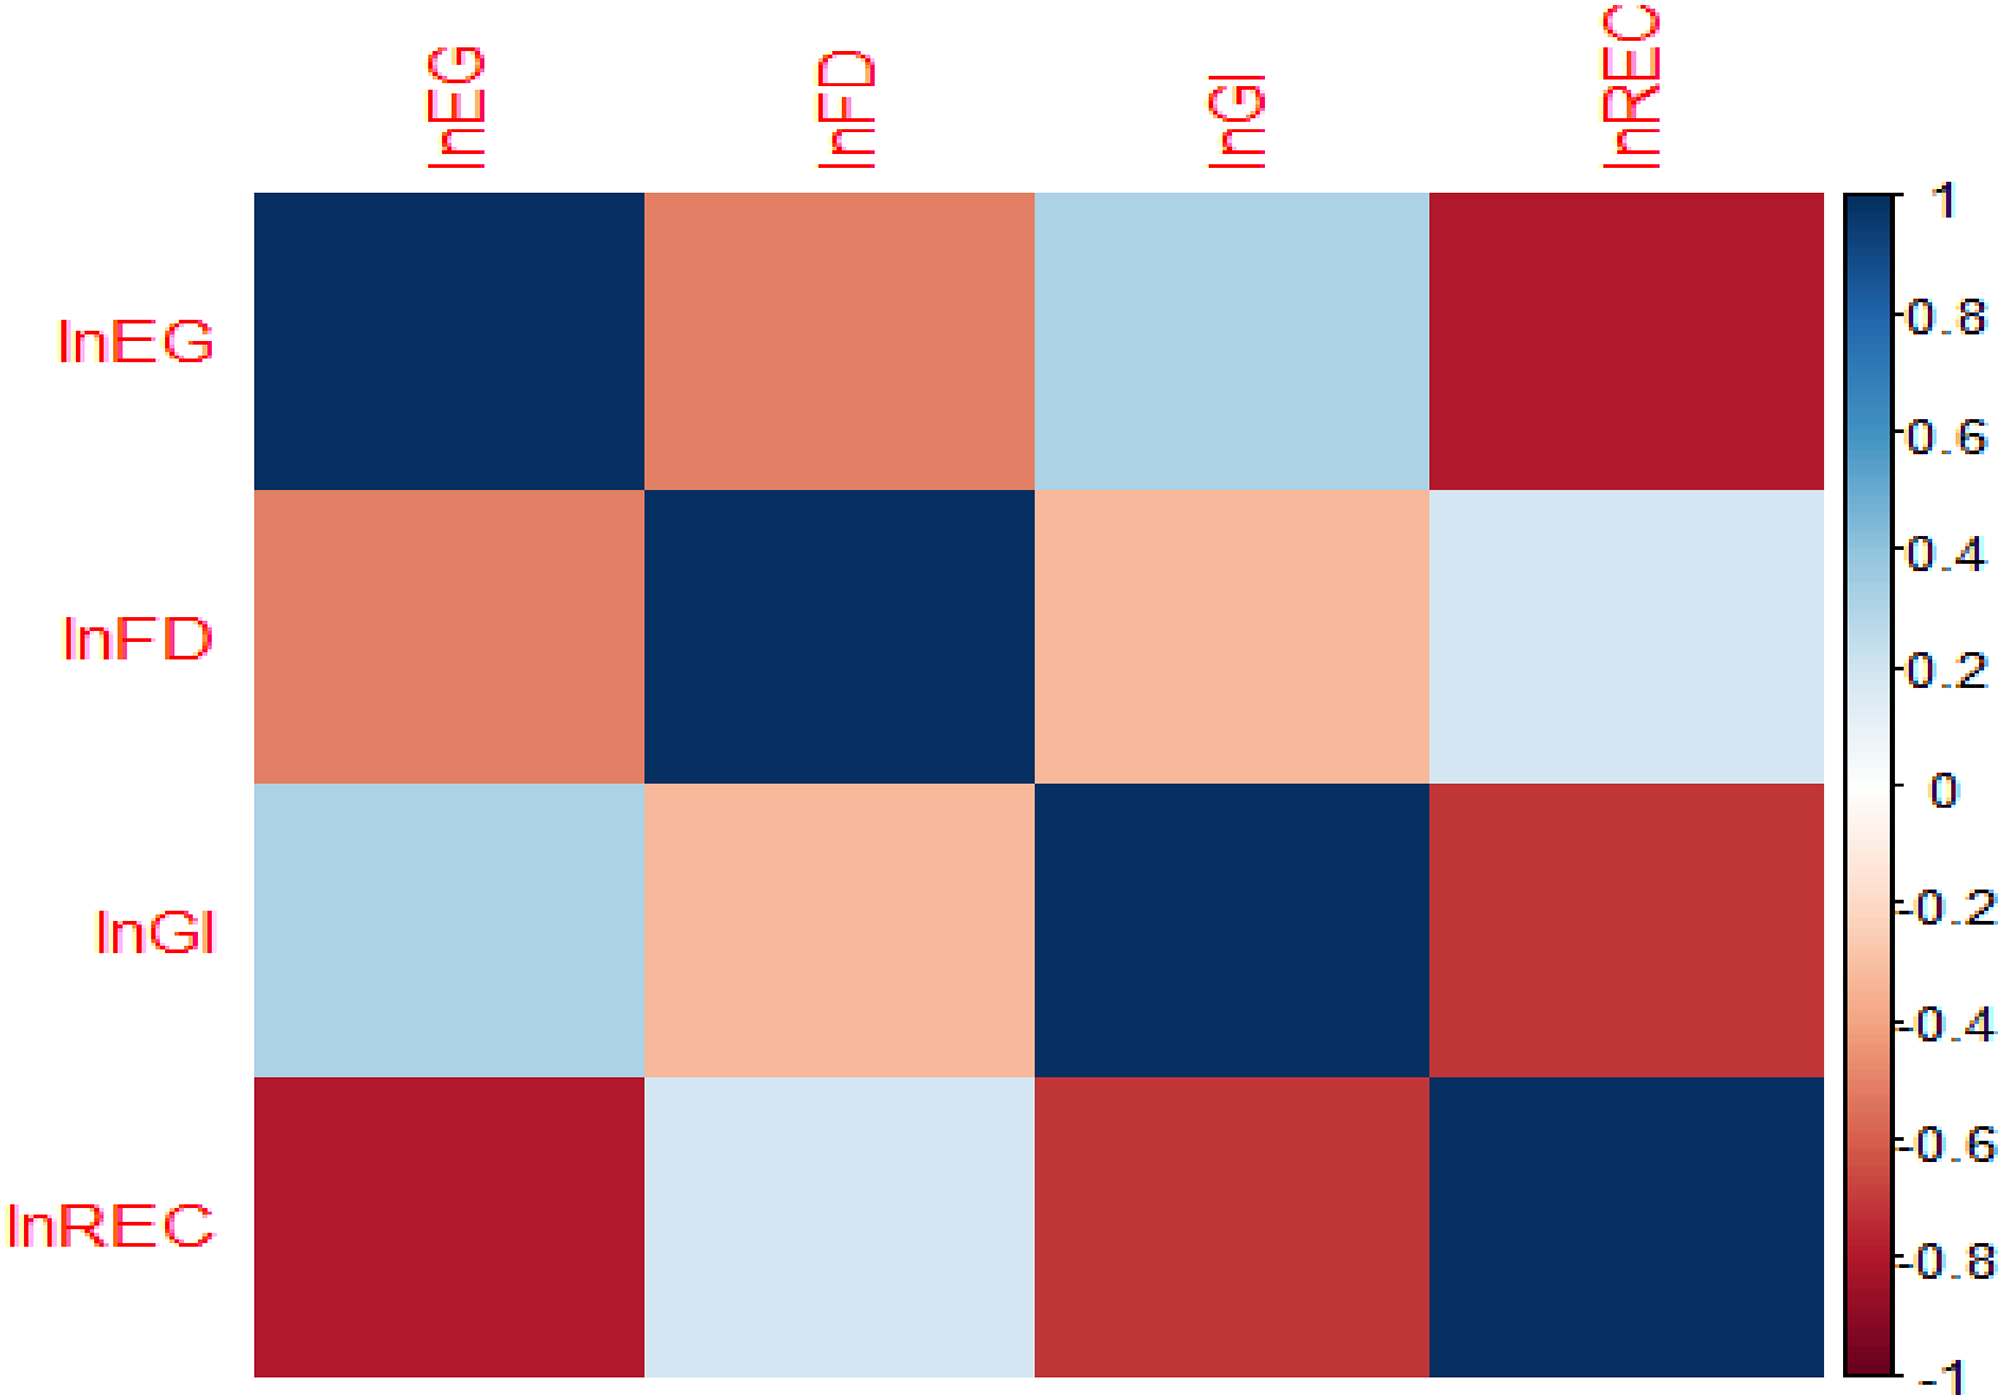
Correlation matrix.
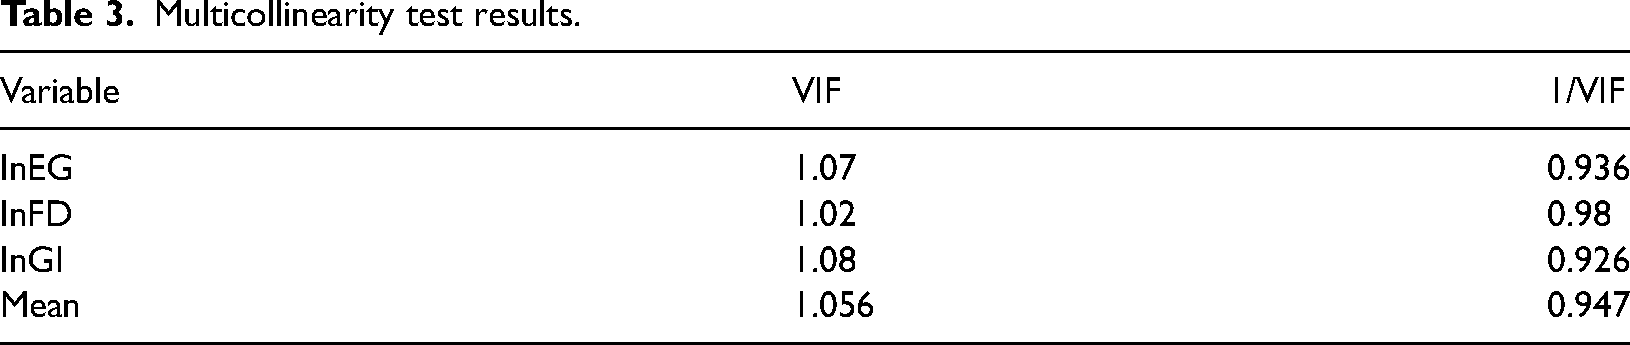
We conducted a multicollinearity assessment to identify any potential multicollinearity and to confirm that the model does not suffer from omitted variable bias. The results, as displayed in Table 3, reveal no multicollinearity concerns, as evidenced by the absence of significant coefficients. This finding supports the robustness of our model and the credibility of the ensuing analyses.
Multicollinearity test results.
Evaluating CSD among the series is a critical aspect of the analysis. Table 4 displays the CSD results for the model and the variables, as determined using Pesaran's (2004) CD test.
CSD test.
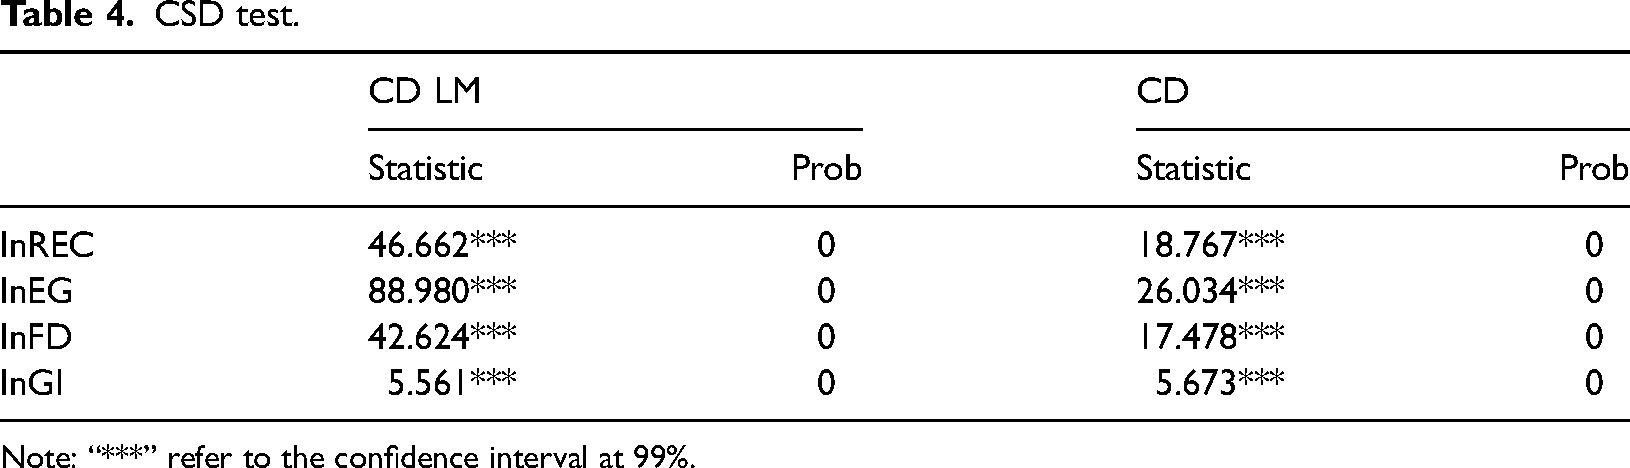
Note: “***” refer to the confidence interval at 99%.
Based on the findings from Table 4, we can state categorically that these eight MENA countries have a spillover effect or neighboring effects and share nearly the same socioeconomic status. As a result, a sudden shock in one nation may similarly impact the economic situation in the rest of the MENA region.
Structural breaks and CIPS test results
After verifying the CSD, we can confirm that there is a CSD for each variable; therefore, we can use the structural breaks test in the panel data model. Table 5 shows the basic structural break test.
Basic structural break test.
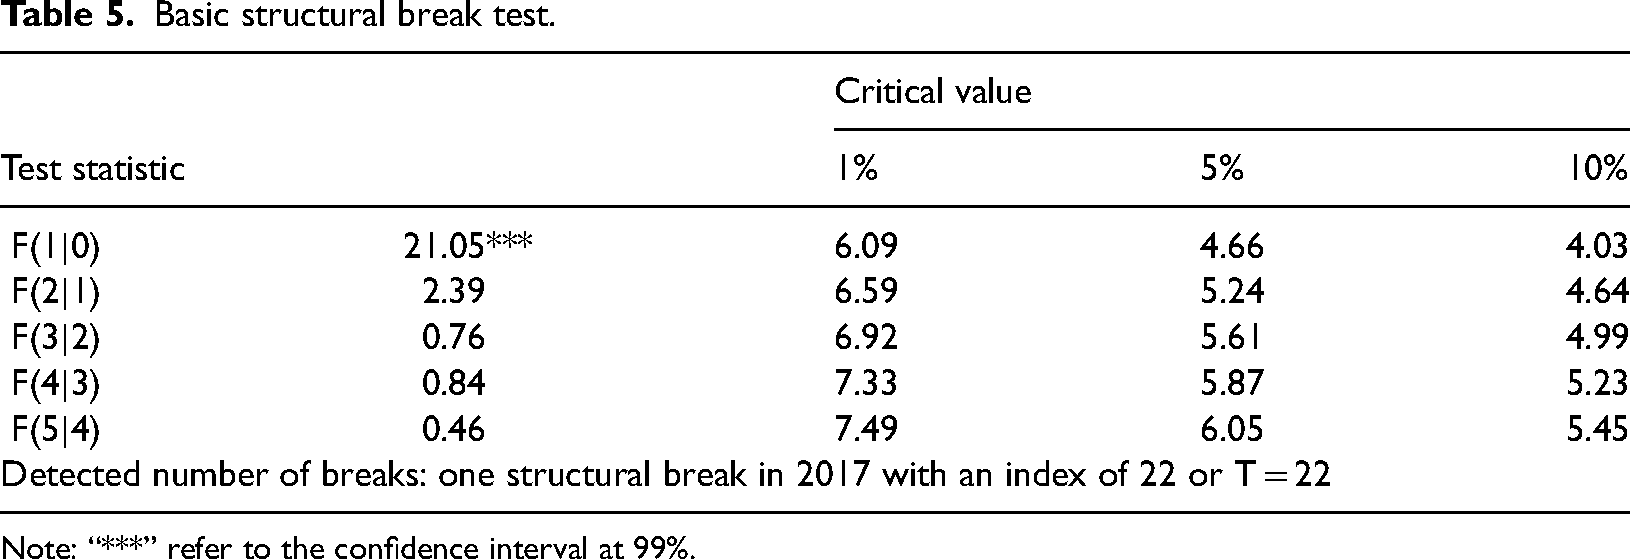
Note: “***” refer to the confidence interval at 99%.
According to the findings, there was a significant structural break in 2017 at the significance level of 1%, indicating that some MENA nations had a large growth potential of their RE during this time. In particular, Algeria, Saudi Arabia, and the United Arab Emirates had more than 70%, 40%, and 130%, respectively. Moreover, they demonstrated a robust economy, growing digital banking and fintech by expanding their green bonds and sustainable finance. There was also a rise in funding for clean energy tech startups in 2017 (Table 6).
Multiple structural breaks test.
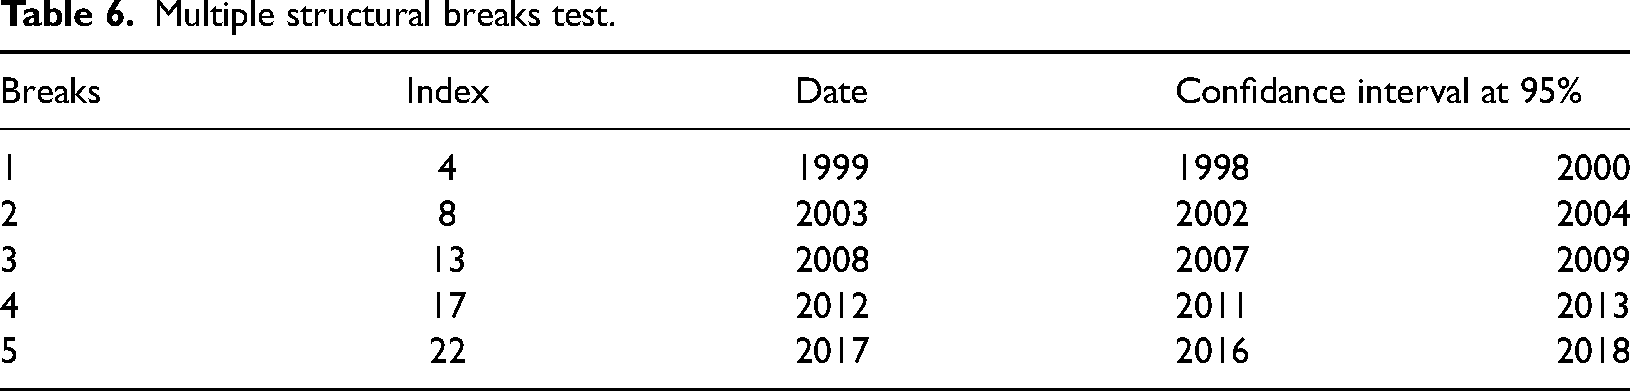
The second test shows five structural breaks in the model, with the most significant one in 2017, followed by structural breaks in 2008, 2003, 2012, and 1999. This sequential test uses standard 15% trimming at each end of the sample, meaning there are five structural breaks at maximum. These findings show that the low level of oil prices, between $14.42 per barrel and $19.35 per barrel in 1999, was behind this structural break. MENA nations also saw little progress during this time in developing their financial markets, economic diversification initiatives, and RE. To combat climate change and increase their economic diversification, some MENA nations began considering implementing energy efficiency laws and cleaner production techniques in 2003. We also know that the Iraq War affected regional investment during this time, and oil prices were between $28 and $30 per barrel. The findings also indicate that the 2008 global financial crisis was the cause of this structural disruption, as the MENA region's EG plummeted due to the oil price dropping from a peak of $147 per barrel to just $32. Moreover, following the Arab Spring, the MENA nations implemented new financial regulations in 2012 to achieve stability and FD. The oil prices increased to about $109–112 per barrel, which had a favorable effect on these EG countries have launched RE projects with the UAE's Masdar City development and solar park project, Saudi Arabia's 41 GW solar energy target by 2032, Jordan's RE law, Egypt's large-scale solar project planning, and Morocco's Ouarzazate Solar Power Station project.
We then advance to the second-generation panel stationarity, which accounts for this condition. The results of the Pesaran panel CSD unit root test for the four variables are presented in Table 7. This test is crucial for determining the stationarity of the variables while accounting for the CSD observed in the earlier analysis.
Unit-root tests.
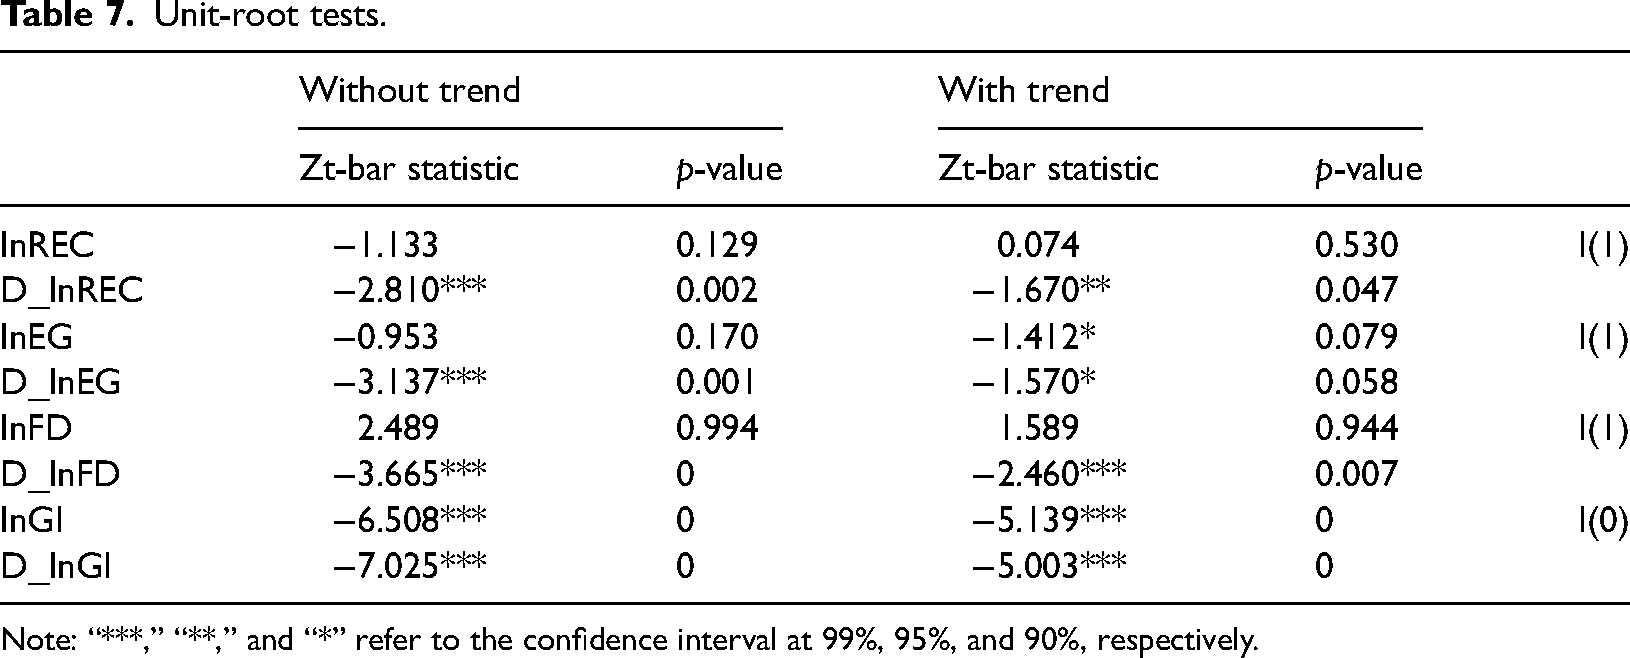
Note: “***,” “**,” and “*” refer to the confidence interval at 99%, 95%, and 90%, respectively.
The results from Table 7 demonstrate that, except lnGI, which is stationary at the I(0) level, the rest of the variables are stationary at the I(1) first difference, indicating they are first-order integrated. As a result, our analysis now turns to the Westerlund test, which effectively accounts for CSD. Our research primarily focuses on the panel integration relationship, allowing for a heterogeneous integration order, particularly when the dependent variable displays non-stationarity. However, the FMOLS, DOLS, and the CCR generally produce the most reliable results. This method ensures a comprehensive examination of the long-term links between the variables while considering the complexities introduced by CSD.
Co-integration test
We now examine whether a long-run link exists between the relevant variables based on CSD and unit root findings. Table 8 displays the result of the Westerlund test.
Westerlund panel cointegration result.
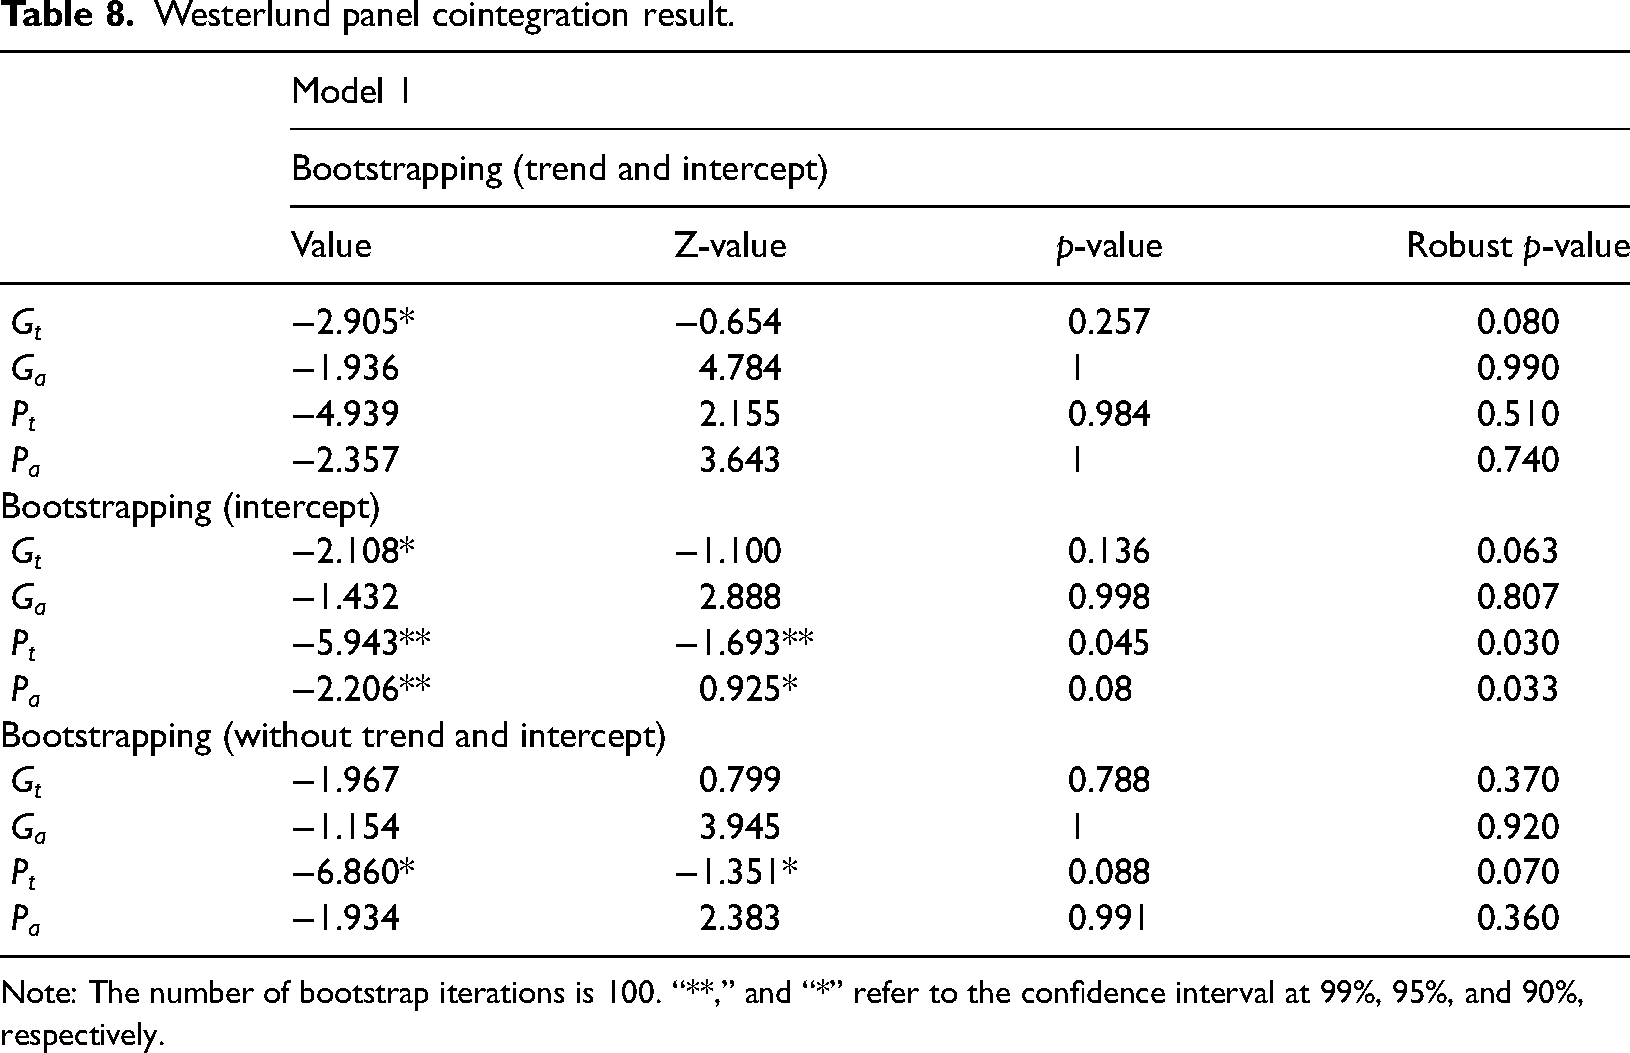
Note: The number of bootstrap iterations is 100. “**,” and “*” refer to the confidence interval at 99%, 95%, and 90%, respectively.
The results of Table 8 indicate a long-term link between variables for a model. These findings also illustrate that the REC and independent variables are cointegrated, leading to good cointegration links between the variables across countries. Now that cointegration has been established, we can concentrate on the FMOLS, DOLS, and CCR models.
Long-run estimations and discussion
The long-run estimation analysis produced many interesting results, as shown in Table 9.
Long-run findings.
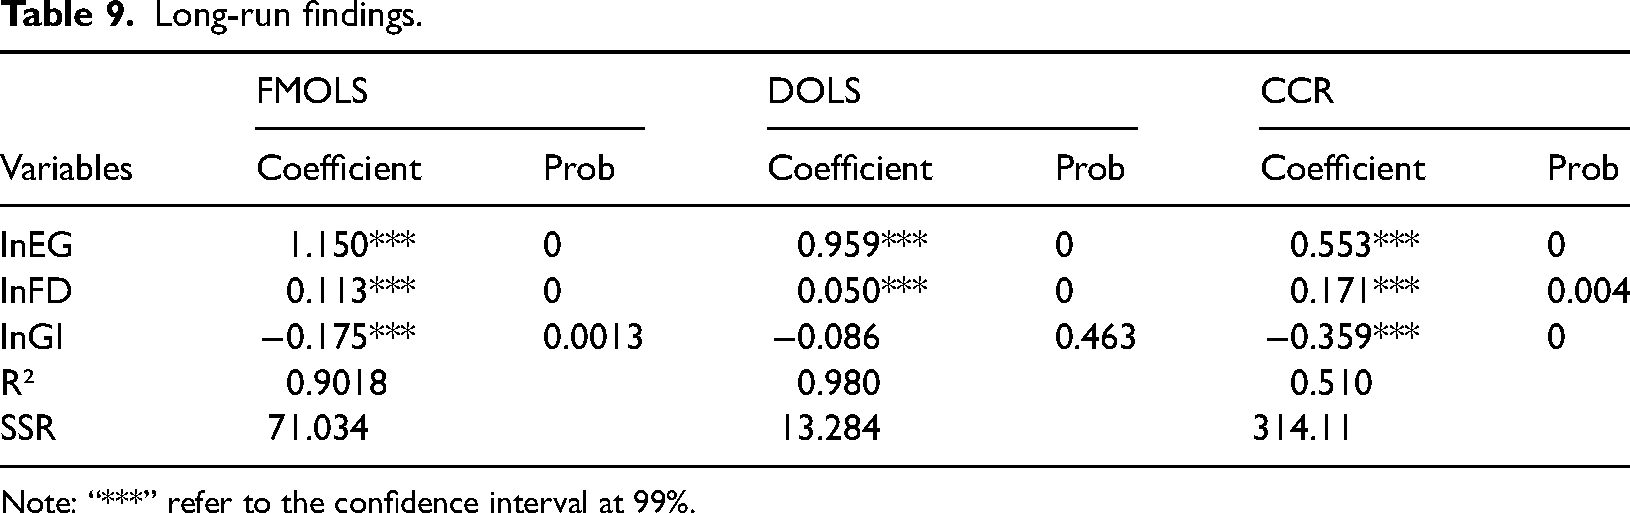
Note: “***” refer to the confidence interval at 99%.
The outcomes from Table 9 show that all three estimation methods—except for the variable (lnGI) in the DOLS estimation, which is insignificant—confirmed the same coefficient signs and are statistically accepted at the 1% level.
The empirical analysis reveals a statistically significant link between RE and EG at the 1% level. In the respective models, a 1% increase in lnEG corresponds to an increase in lnREC by 1.150%, 0.959%, and 0.553%. Such findings suggest that EG promotes incorporating and using RE within the economic circuitry. This result implies a higher dependence on conventional energy sources as EG rises, most likely due to pre-existing infrastructure and industry preferences for fossil fuels in MENA countries. The oil industry's continued dominance in these economies may also encourage investments in adopting REs and increase the likelihood of a shift to clean energy. This outcome is consistent with the findings of previous studies (Adem and Çetin, 2024; Anton and Afloarei Nucu, 2020; Aydin and Bozatli, 2023; Eren et al., 2019; Fang et al., 2022; Horvey et al., 2024; Somoye et al., 2022).
Furthermore, the outcome exhibited a positive and significant sign at the 1% level between REC and the FD, meaning that an upsurge by 1% in lnFD will raise the level of lnREC by 0.113%, 0.050%, and 0.171%, respectively. This positive contribution shows that these countries can use financial innovation to promote RE as a vital resource, focus on more environmentally friendly projects, and support entrepreneurs in developing environmental technologies. This result is supported by the outcomes of previous studies (Cheikh et al., 2025; Islam et al., 2022; Kevser et al., 2022; Liu et al., 2023; Nchofoung et al., 2023; Peng et al., 2022; Rafindadi, 2016; Samour et al., 2022; Sari-Hassoun et al., 2019). However, a government's focus on bolstering well-established industries like oil and gas may coincide with financial integration in financial markets (Huang et al., 2024). Additionally, MENA nations, many of which have economies heavily dependent on oil, will allocate their financial resources away from RE because they prefer the traditional sectors. This could suggest that the oil industry is encouraged to step up lobbying efforts by the growing financial integration of stock markets. Furthermore, investors’ perception of the oil industry as more established and stable in the financial markets than more recent and riskier sectors supporting alternative RE supports this dynamic (Matallah et al., 2023). The amount of oil revenues allocated to RE in oil-exporting nations is still small despite growing international pressure to switch to cleaner energy sources, especially when FD levels are high (Baudino, 2024).
However, the FMOLS and CCR estimation shows a negative and significant sign at 1% between REC and GI, while the coefficient is insignificant with the DOLS estimation. This means that an increase of 1% in lnGI will decrease the level of lnREC by 0.175%, 0.086%, and 0.359%, respectively. This inverse link demonstrates how poorly supported the adoption of cleaner technologies is in these MENA nations. This finding is consistent with the outputs of Khan et al. (2021), Alexiou (2023), and Benfica and Marques (2024). In order to maximize their impact on the energy transition, innovation efforts must be paired with supportive policies and incentives, as this result demonstrates that the effect is far from strong enough to encourage the introduction of RE. The FD and GI results suggest that financial and technological resources are insufficient for green investments. Rather, financial markets appear to support the dependence on fossil fuels, perhaps as a result of the strong influence of oil lobbyists that mold investment preferences and policy orientations in these nations and may impede the development of RE projects, providing empirical support for the lobbying effect theory rather than the energy transition theory (Baudino, 2024). This finding revealed that technological innovation is not necessary to promote RE use. However, even though it had a positive effect, it is insufficient to counteract the negative effects of oil rents, particularly in Saudi Arabia, Algeria, and the United Arab Emirates. This suggests that in order to maximize the impact of innovation efforts on the energy transition, they must be combined with supportive policies and incentives (Figure 6).
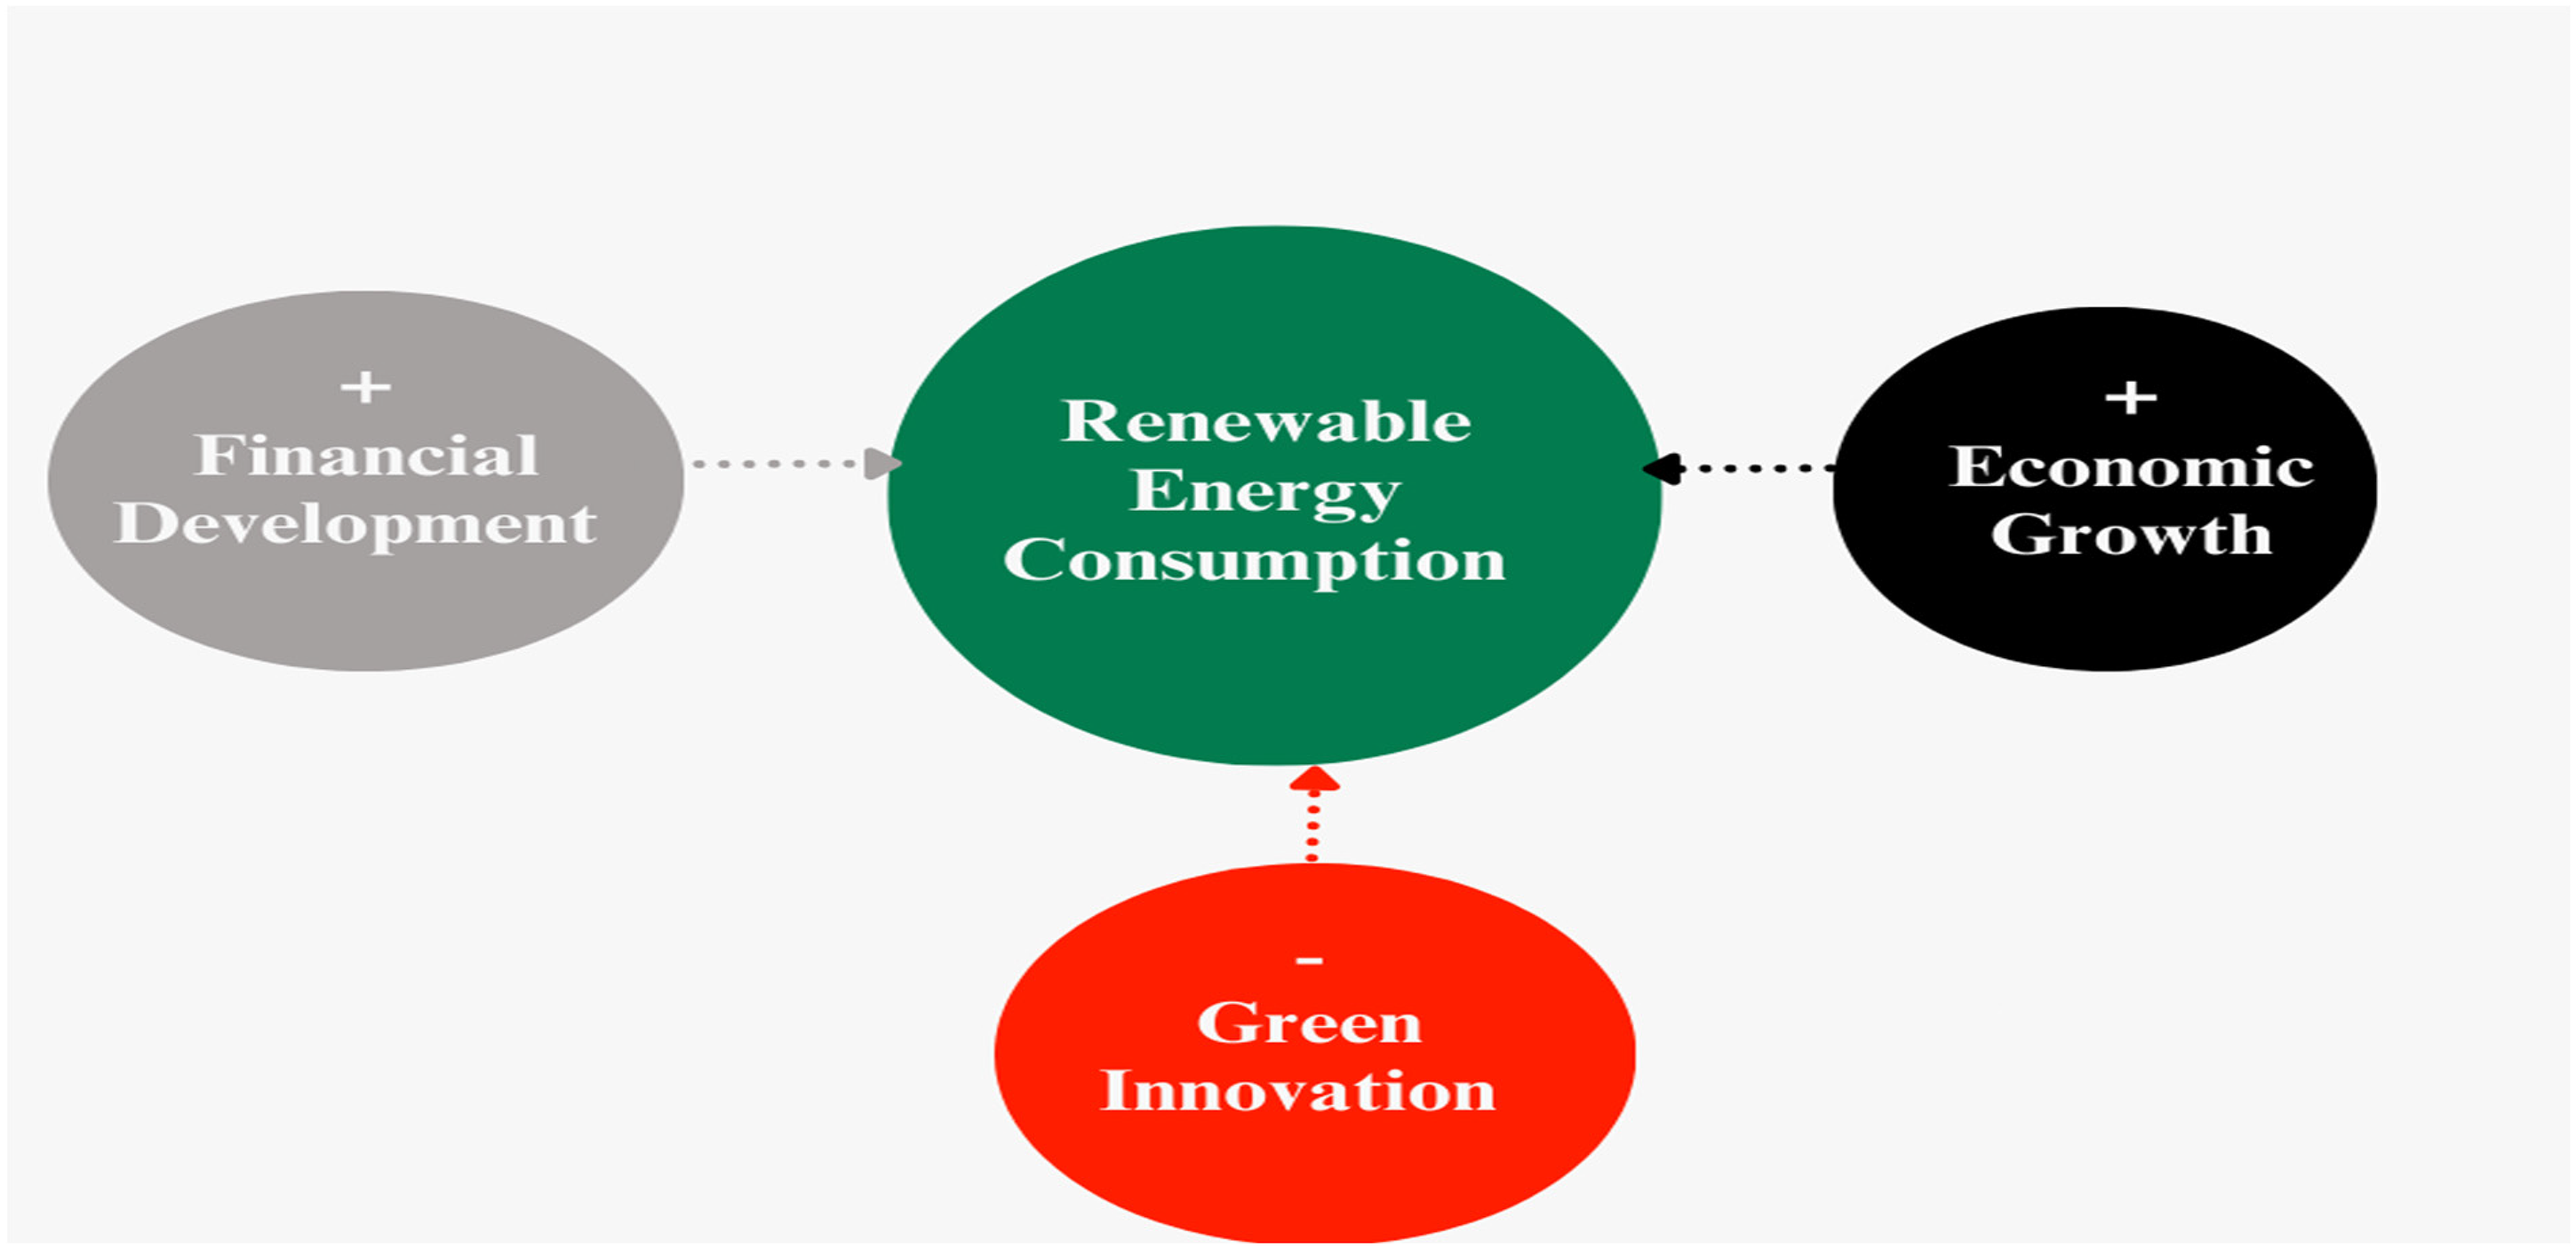
Long-run results.
As a general result, a significant investment in R&D and green patents (GP) is necessary to support low-carbon innovation and greener energy. R&D spending contributes to developing cutting-edge technologies and deepens our comprehension of the world. Numerous studies have examined the effects of GP, innovation, and FD spending on RE. The literature shows that strategies like innovation, greener energy, energy efficiency measures, and RE are ineffective in MENA countries but effective globally.
Causality findings and discussion
We examine the causality proposed by the DH test in this section, as shown in Table 10. The findings of the causal link are shown in Table 10.
Dumitrescu-Hurlin causality test.
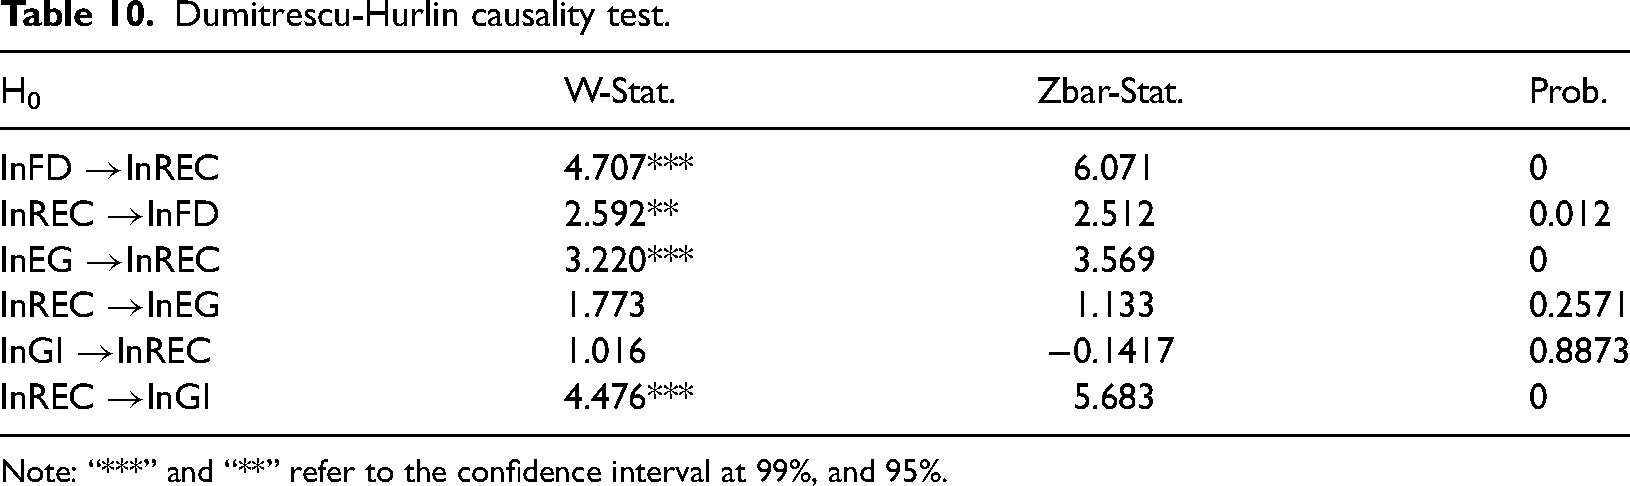
Note: “***” and “**” refer to the confidence interval at 99%, and 95%.
We discovered a bidirectional causality between FD and REC at the significance level of 5%. This finding indicates that financial markets are facilitating the adoption of RE and that a more efficient allocation of loans in terms of quantity, volume, and distribution to the private sector can stimulate EG. However, it is important to note that the financial systems in some MENA countries are relatively underdeveloped compared to those in wealthier nations, hindering their ability to achieve rapid FD and enhance RE adoption. These countries are not investing the required credit and financial resources in renewables because they heavily rely on the oil sector and hardly think it represents a more stable financial energy market than renewables. This result is consistent with the findings of Kevser et al. (2022), Habiba et al. (2022), and Adem and Çetin (2024). The two-way causality suggests that FD is crucial in promoting and enabling the adoption and expansion of RE sources. Nevertheless, a significant obstacle arises when conducting a comparative analysis with more affluent countries. Certain countries in the MENA region are undergoing a developmental phase in their financial infrastructures. As a result, this presents challenges and restrictions in the timely attainment of FD and the expansion of RE projects. This revelation underscores the crucial necessity of developing and executing specific strategies and interventions to strengthen financial systems, thereby facilitating the progress of these nations toward advancements in RE. Innovative financial systems can mobilize resources, allocate capital, and manage risks, encouraging investments in RE and other sectors. RE companies and entrepreneurs can find research, development, and deployment funding more easily. Better capital access can overcome the high upfront costs of developing and installing RE infrastructure. FD often produces new financial products and services, including green bonds, RE certificates, and other risk mitigation instruments for RE projects. Financial innovations make RE investment more appealing and feasible for the public and private sectors. Moreover, a strong financial sector boosts investor confidence and increases the investor's trust in the financial system and will be willing to invest in long-term projects like RE. According to Rafindadi (2016), energy consumption outlets exceeding a certain environmental pollutant threshold should be subject to a tax system or financial levy. On the other hand, industrial facilities in MENA nations with no history of releasing dangerous environmental pollutants may be eligible for subsidies. In order to implement RE into the financial system, the MENA government should collaborate with key law enforcement agencies. This should involve giving specific and standard subsidies and grants by adopting significant, nationally recognized standards. Since all of the MENA region's governments frequently heavily subsidize fossil fuels, which reduces the financial appeal of RE. Price competitiveness of renewables is still a problem until these subsidies are changed. Therefore, lobbying theory here shows that fossil fuel lobbyists frequently seek to preserve or expand fossil fuel subsidies, artificially lowering the cost of conventional energy sources. Due to market distortion caused by these subsidies, RE sources appear less economically feasible. By claiming that subsidies should continue to exist in order to safeguard the economy and consumers, lobbyists use their political connections to sway policy.
On the other hand, we find that there is a one-way causality running from EG to REC at the significance level of 1%, suggesting that while these nations’ economic standing supports the deployment of RE, the RE is not yet mature enough to be a significant component of the dominant energy source in these large fossil fuel-dependent nations. This result is supported by the findings of Adem and Çetin (2024). The positive influence and the unidirectional causality direction running from EG to REC in the MENA region for the long term can exhibit a complex interpretation. As an economy expands, there is generally an increase in the demand for energy to support various sectors such as industries, households, and transportation. Throughout history, fulfilling this requirement has predominantly relied on the utilization of fossil fuels, thereby exacerbating environmental deterioration and climate change. Nevertheless, within the present framework of heightened environmental consciousness and the drive for sustainable development, there is a growing convergence between EG and environmentally friendly initiatives and policies. This implies a positive effect of GDP growth on the levels of investment and consumption in RE sources such as wind, solar, and hydropower. In addition, a robust economy has the potential to stimulate advancements in technology and the expansion of infrastructure. The economic resilience exhibited can facilitate progress in RE technologies, enhancing their efficiency, affordability, and widespread availability. Consequently, both the public and private sectors are expected to demonstrate a heightened propensity to adopt and invest in REC, increasing their utilization.
Furthermore, EG frequently leads to an elevated level of societal well-being and an enhanced level of public consciousness regarding environmental concerns. In the given context, there tends to be an increased societal inclination towards cleaner and more sustainable energy alternatives, thereby compelling governmental bodies and enterprises to address this demand by augmenting the provision of RE sources (Azam et al., 2023). Moreover, as the economy experiences growth, the MENA government acquires additional resources to provide subsidies and incentives for RE initiatives, thereby promoting their advancement and utilization. In a globalized economy, a MENA’s economic performance and reputation are intricately linked to its commitment to upholding international environmental norms and agreements, supporting the results of Luo et al. (2023). The study suggests policies to direct substantial FDI into these eight MENA RE sectors. It also highlights the need for efficient policies and practices that promote energy efficiency and the use of equipment and products compatible with MENA's densely populated environment. Similarly, such countries need to create significant organizations that encourage adopting energy-efficient practices and increase awareness of the use of RE resources. Funding and training for pertinent departments in universities and polytechnics to support the creation, administration, oversight, assessment, and execution of RE projects across MENA countries is another way to guarantee this (Rafindadi, 2016). Any effort to cut energy, though, will seriously harm EG of some MENA countries. Therefore, investing heavily and wisely in sustainable and RE sources using the profit from other sectors (such as the oil industry) is the only way to lessen these negative effects. Lobby theory states that the fossil fuel industries have made significant investments in the extraction of oil and gas and the infrastructure currently in place. These industries may use lobbying to thwart or impede RE policies because shifting away from fossil fuels could jeopardize their bottom line. We also estimate unidirectional causality from REC to GI at a significance level of 1%, demonstrating that these MENA nations have been investing in RE and green energy in recent years. However, the lack of attention to local or global environmental issues in the environmental patents discourages international cooperation in developing new technologies. This result contradicts the reasoning of the previous studies (Alam et al., 2024; Baudino, 2024; Bashir et al., 2022; Habiba et al., 2022; Usman et al., 2023; Vural, 2021), which contend that GI enhances REC in different regions. Therefore, this finding may be ascribed to diminished educational attainment, which could constrain comprehension and uptake of emerging technologies. A scarcity of GP and constrained research and development (R&D) endeavors may impede the advancement and implementation of GI. Furthermore, continual reliance on and endorsement of conventional energy sources can hinder the progress toward adopting RE. In the given context, a region can experience a decline in REC despite implementing GI. This can occur if these innovations are not sufficiently developed, comprehended, or supported or if the infrastructural and policy framework continues to favor non-RE sources. Large oil and gas reserves, for instance, are the foundation of the economies of Saudi Arabia, the United Arab Emirates, and Algeria. As a result, there is a disincentive to make the rapid switch to RE since it may disrupt long-standing industries and national incomes. Lobby theory states that large, multinational energy companies, including the giants of fossil fuels frequently hold major patents about green technologies. These businesses might employ patents to keep their hold on the market for RE. Through lobbying, they could advocate for patent protection regulations that hinder MENA governments or local businesses from obtaining or using the technology affordably.
Conclusions and policy recommendations
This study analyze the link between REC, EG, FD, and GI with a panel data of eight countries in the MENA region during the period of 1996 to 2021. The results reveal a significant association at the 1% level between REC and EG and between REC and FD. These outcomes suggest that EG can facilitate the adoption of RE and strong financial and economic systems can support energy-saving policies. However, we establish that GI has a negative impact on REC at the significance level of 1%, which means that these MENA nations lack the environmental technology required to permit renewables to their fullest extent, combat climate change, and mitigate environmental issues. The DH causality test shows a bidirectional causality between REC and FD, while there is a one-way causality running from EG to REC, and an unidirectional causality running from REC and GI.
These nations are deficient in a crucial resource in terms of economic, financial, and environmental technology. Adopting stronger and more adaptable regulations might also aid in promoting RE and sustainability as well as delaying the degradation of the environment. Enacting strict energy regulations and investing in renewable infrastructure are essential to reducing the possible depletion of energy resources, because we are consuming fossil fuels at a rate that far exceeds their natural formation. It should be noted that there may be an opportunity to reduce the potential negative impacts on human health and productivity by utilizing cleaner RE sources like solar, wind, and hydropower. In this regard, Rafindadi and Usman (2020) demonstrated the necessity for energy policymakers to foster an environment that stimulates substantial investment in the energy mix required to produce electricity. This energy mix ought to be infinite and inexhaustible, much like RE, with cheaper costs and a smaller carbon footprint. The selected energy mix must also be able to meet the country's energy needs despite all the challenges without jeopardizing the country's distinct economic systems or subsystems (for instance, by causing a power outage). They also showed how important it is to give the energy sector enough funding and how resiliently they can manage it. Policies that prioritize preserving the oil industry's dominance may hurt the use of RE. Governments should consider passing legislation limiting the oil industry's lobbying capabilities to counterbalance the influence of strong fossil fuel interests. This could include all those involved in the policy-making process, from RE supporters to decision-makers and stakeholders (Baudino, 2024; Matallah et al., 2023). Financial markets might be discouraged from preserving the status quo if governments levied fines for continuing investments in fossil fuel projects. It is also essential to promote green growth strategies because they allow EG to be independent of fossil fuels (Saqib and others, 2024).
On the other hand, the inverse correlation observed between GI and resource efficiency and conservation (REC) is worth noting, which suggests adopting a more nuanced approach to policies about GI. Policymakers must investigate the various factors that contribute to the observed negative correlation. These factors may include potential dependencies on conventional energy sources and any obstacles hindering the widespread adoption of environmentally friendly technologies. Addressing these challenges may entail implementing educational initiatives to enhance awareness and comprehension of green technologies, providing greater support for R&D endeavors, and implementing reforms to diminish dependence on non-renewable resources.
We endorse the following policy recommendations for an effective and sustainable energy transition in oil-producing countries. First, more open and supportive policy frameworks need to be put in place to give clear guidelines for adopting RE solutions. Accordingly, earlier research has shown how unclear policy frameworks hinder the adoption of effective solutions promoting RE sources in developing and emerging economies. Second, the financial markets must change immediately to create a more effective distribution, volume, and loan amount to the private sector, which will trigger an economic situation. It should not be forgotten, though, that MENA countries’ financial systems are only mediocre compared to those of wealthy countries, preventing them from quickly achieving FD and increasing renewables. Third, with nations like Saudi Arabia, the United Arab Emirates, Algeria, and Morocco having high levels of solar radiation, we know that the MENA region is among the sunniest in the world. GI is essential for optimizing this potential, especially in solar photovoltaic (PV) technology, such as advanced solar panels (bifacial panels, perovskite solar cells), solar thermal systems, and solar energy storage (batteries and molten salt systems). Improvements in energy storage, solar efficiency, and panel manufacturing costs can help MENA nations better utilize their abundant solar resources. Significant wind resources are also found in the region, particularly in parts of Morocco and the Gulf of Suez in Egypt. Innovations in wind turbine design with larger, more efficient turbines and materials can increase energy generation in these areas. MENA nations have the potential to lead the world in RE technology by supporting innovation ecosystems and investing in domestic R&D. GP in solar, wind, and storage technologies can help nations create new revenue streams by enabling the development of intellectual property (IP) that can be exported or licensed.
Therefore, to wrap it up, MENA nations can realize the full potential of RE, lower costs, improve energy security, generate employment, and establish themselves as global leaders in the clean energy transition by concentrating on technological advancements in solar, wind, storage, and grid infrastructure. For the region's sustainable and prosperous future, private sector investment, government assistance, and international cooperation will be essential.
Our manuscript presents several limitations that could inform future research. First, the focus of our analysis is limited to the MENA region, which constrains a broader understanding of how sustainability and global crises, such as the COVID-19 pandemic and conflicts like those between Russia and Ukraine and in the Red Sea, influence both developing nations and other countries within the MENA region. Second, the study does not account for key macroeconomic variables, such as green productivity, financial inclusion, currency devaluation, economic globalization, education, skilled human capital, trade diversification, geopolitical risk, and carbon intensity. Third, a microeconomic and sectoral-level analysis may be significant in the long term. Future research could explore these micro-level dimensions, address the study's limitations, and examine the effects of energy transition on both renewable and traditional energy sources across different sample populations. For future investigation, researchers must use sophisticated techniques that consider structural breaks and economic shocks originating from the series of panel and time-series data to produce accurate and effective empirical results.
Footnotes
Acknowledgements
The authors extend their appreciation to the Deanship of Scientific Research at King Khalid University for funding this work through a large group research project under grant number RGP2/300/45.
Author contributions
All the authors have contributed equally to scheming the research, studying concepts or design, processing data collection, calculating, and writing the manuscript. All authors read and approved the final manuscript.
Availability of data and materials
All relevant data are publicly available. Still, data are available on request from the corresponding author.
Declaration of conflicting interests
The authors declared no potential conflicts of interest with respect to the research, authorship, and/or publication of this article.
Funding
The authors disclosed receipt of the following financial support for the research, authorship, and/or publication of this article: This work was supported by the Deanship of Scientific Research, King Khalid University (grant number RGP2/300/45).