
Abstract
This study introduces a novel comparative analysis of thermal management systems for lithium-ion battery packs using four LiFePO4 batteries. The research evaluates advanced configurations, including a passive system with a phase change material enhanced with extended graphite, and a semipassive system with forced water cooling. A key innovation lies in replacing water with a nanofluid in a single cold plate surrounded by a phase change composite, leveraging the superior thermal properties of nanoparticles. Further advancements are presented in a three-plate system and a complex-plate system, which employ modified cold plate designs and two-dimensional flow dynamics for enhanced cooling. Among these, the complex-plate system with nanofluid proved most effective, reducing the maximum temperature by 17.17% from 88.17 °C in the passive system to 73.03 °C, while extending the operational temperature threshold by 7.41%. Nanoparticles contributed to a 9.46% temperature reduction, highlighting their impact on thermal performance. Notably, the complex-plate system surpassed the three-plate configuration in efficiency, achieving superior cooling with lower pumping power requirements. This study emphasizes the novelty and practicality of integrating nanofluids and advanced cooling designs, setting a benchmark for optimizing lithium-ion battery thermal management systems.
Introduction
Lithium-ion batteries (LIB) recently have occupied a decent part in humans’ lives, due to its use in a variety of applications in portable electronics, power tools and, to humans’ interest, electric vehicles (EV) industry; and because of their high potential, their demand to increase even more in the near future. In general, LIBs have various features that distinguish them from other battery types in the market, making them dominate in the electrochemical energy storage field. On the other hand, there are some disadvantages that could be dangerous and hurdle the development and use of this technology which is mainly its high heat generation rate. In conclusion, lithium-ion batteries are considered one of the most promising technologies in recent times; that's why it is important for us, as engineers, to establish ways to preserve the health and elongate the lifetime of these batteries in order to utilize them in the best way possible.
Passive thermal management system (PTMS) is a system that utilizes cooling technologies depends solely on conduction, natural convection, and radiation (not that effective compared to the previous two) to complete the heat transfer process. This type of system doesn’t require any external energy and only uses ambient environment for heat removal. Thus, this system has relatively low expenses, is widely used and easy to implement. Parsons and Mackin (2017) simulated the transient thermal response of a 15-cell, 48 volts, LIB pack for an unmanned ground vehicle using ANSYS Fluent. He found that the maximum temperature of the batteries has exceeded 60°C, which was the maximum temperature recommended by the manufacturer. So, he redesigned the pack to install a passive thermal management system that included a composite-expanded graphite matrix within a phase change material (PCM) which was made of paraffin wax. After simulation, the temperature was found to have decrease to 50.3°. Eventually, the proposed system has successfully kept the temperature below the maximum.
Active thermal management system is a system that utilizes technologies that require external energy source for the transfer process to occur. These systems increase the effectiveness of the heat rejection by increasing the rate of fluid flow during convection. On the other hand, these systems are generally more complex and expensive than PTMS, they need external energy source in order to operate, and there is also a possible introduction of audible noise to the system. Qian et al. (2016) investigated the performance of a LIB pack using a liquid cooling method depends on mini-channel cold plate model. They concluded that the mini-channel cold plate thermal management system has good cooling efficiency in controlling the battery's temperature using a five-channel cold plate, and it also improve the temperature uniformity. Moreover, Wei and Agelin-Chaab (2018) proposed utilizing any combination of conductive, convective, and evaporative phase change cooling effects to enhance cooling efficiency and temperature uniformity. Their design includes a simple air-cooling duct placed horizontally as a base, and a series of hydrophilic water channels surrounds the battery where the driving force is the gravitational or capillary force. These channels are exposed to the air flow to help extract the latent heat from the coolant. The water source is the recycled condensate from the air-conditioner (A/C), thus coolant adds no extra weight to the vehicle. The air and coolant used will be released to the atmosphere without harming the environment. In addition, Ma et al. (2017) proposed a liquid cooling system design for a LIB pack. After employing computational fluid dynamics (CFD) modeling to investigate the heat transfer performance of this cooling system, they showed that the total temperature of the battery pack decreases with the temperature of the coolant. In addition, they managed to control the maximum temperature under 40 °C for an evenly distributed 192 battery cells.
A comparison between the active and passive thermal management systems is important for providing insight into the pros and cons of each system. The passive cooling system is suitable to fulfill the running range under the same intensive conditions excluding the need for an additional fan power. Thermal management systems using PCM are investigated within double-wall tank (Miansari et al., 2020) and in nanochannel contains Au nanoparticles (Wang et al., 2023). Pu et al. (2024) presented a compact hybrid battery thermal management system (BTMS) that combines PCM with liquid cooling in a honeycomb shape. They showed that coolant flow rate minimally affected maximum temperature. Li et al. (2024) used embedded heat pipe system in BTMS and results in fast heating and enhanced temperature consistency. Moreover, Samadani et al. (2012) studied the thermal management for battery life cycle for plug-in and electric vehicles.
Semipassive thermal management utilizes an active–passive cooling combination to bring out the best out of the two methods. Common thermal management systems tend to use active methods in cooling, mainly liquid or air. However, passive technologies in cooling are not common due to their low-heat removal efficiency. So, if active cooling is added to a passive cooling system, the heat dissipation performance can be improved, and at the same time minimizing the drawbacks for active cooling, such as lowering the energy required for active cooling. Hassan (Fathabadi, 2014) proposed a design in which hybrid thermal management system is used to optimize the thermal performance of the pack. The active part includes thin air ducts in which air flows, and the passive part includes phase change material/expanded graphite. Temperature and voltage distribution are calculated numerically, and simulation results were obtained and plotted using Matlab. Moreover, Hémery et al. (2014) evaluated the effect of the thermal runaway and age of an LIB by testing a built air-cooled battery module and using electrical heaters instead of real cells (for safety purposes). In this study, a thermal management system based on PCM installation was developed and an active liquid cooling system is added to initiate at the melting temperature of the PCM. Furthermore, Ling et al. (2015) studied passive thermal management using PCMs. Their study showed that natural convection of air isn’t enough for rejecting heat accumulated out of the PCM which will lead to battery failures. So, they created a hybrid system that integrates PCMs with forced air convection to prevent heat from accumulating and keep the temperature below the maximum operating level. Additionally, Gresham-Chisolm and Smith (2019) studied the performance of passive cooling methods when an active cooling method is used to improve the efficiency by providing a semipassive cooling system. They used a cooling plate (active system) to improve the efficiency of heat removal in a composite system (semipassive). They found that the thermal runway time increased and an increase in the optimum temperature range. Later, Gresham-Chisolm and Smith (2020) used wavy designed thermal management system on LIB modules where this system benefits from the phase change composite capabilities in keeping temperature uniform and thermal conductivity to enhance cooling. Furthermore, Mahek et al. (2023) introduced optimized thermal management system in lithium ion cells to the uniform cooling by allowing higher turbulence. They studied the effects of parameters such as inlet pressure and outlet velocity on cooling and showed that temperature decreased dramatically with reducing outlet dimensions.
Recently, Song et al. (2024) introduced pressure relief valve to increase safety in liquid cooled LIB. Bi et al. (2023) focused on studying the combustion characteristics of LIBs at various charging rates where they showed that jet flames may result at high charging rate. Weragoda et al. (2024) minimized the thermal contact resistance, reduced weight, and installed wick structure on battery's surface that enabled direct cooling. The use of nano-enhanced PCM (NePCM) proves to have prominent effects on thermal performance Jourabian et al. (2020) and Bayat et al.( 2018). Moreover, Sun et al. (2023) experimentally used Paraffin as PCM on LIBs to improve cooling and compared different thermal management systems and Ho et al. (2021) ran experiments on n-eicosane PCM water based to measure the thermophysical properties. Bais et al. (2024) investigated experimentally NePCM with different concentrations to find the optimum case with discharge time.
LIBs have a lot of attention for quite some time, Suryavanshi et al. (2024) simulated different air-cooling layouts on batteries and examined different parameters’ effects as air velocity. Chen et al. (2024) examined experimentally the state of charge and state of health and state of power in a battery management system that are utilized in EVs and results in safer and more efficient operation. Ma et al. (2024) studied an interesting topic on linking data resistance for LIBs where it can save testing cost for thermal modeling.
In this study, forced liquid inside cold plates as the active-cooling part is used to extract heat from a PCM with extended graphite (heat sink) placed between the heat source and the cold plate, which presents the passive cooling part. To improve the cooling efficiency even further, using a nanofluid composed of copper oxide and water as the forced liquid flowing through the cooling plate due to its superior thermos-physical properties as viscosity, thermal diffusivity, thermal conductivity, and convection heat transfer coefficient. This result will be compared with the results obtained when using liquid water as the forced liquid.
Methodology
Computational fluid dynamics analysis
CFD performs simulations for fluid mechanics and interaction with surfaces defined by boundary conditions, and heat transfer using numerical methods. In this study, the battery simulation and results were performed and obtained using the ANSYS Fluent Computational Fluid Dynamics software.
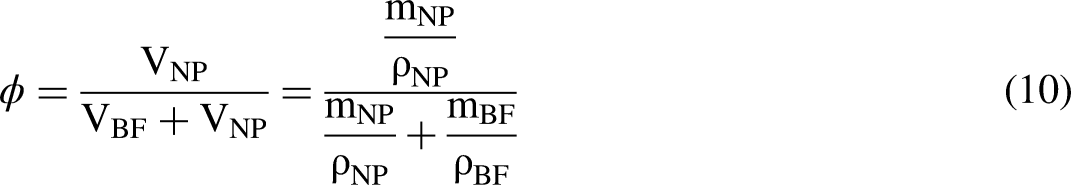
In this work, four batteries were installed in the thermal management system as in Grisham et al. (Gresham-Chisolm and Smith, 2019) where an aluminum casing and a plastic insulation cover, defined in Parsons and Mackin (2017), were integrated into the model. In the passive thermal management system, paraffin wax with extended graphite phase change material was used as heat sink, encompassing the batteries and enclosed by the aluminum casing from both ends. In the semipassive systems, a cold plate is installed in between the batteries and in direct contact with the PCM, allowing the CuO, water-based nanofluid to pass through its channel and absorbing the heat from the PCM. Three semipassive thermal management systems were modeled where the cold plate has a different configuration in each system as shown in Figure 1 below. The properties of all the materials used in the thermal management systems are shown below in Tables 1 and 2. Also, geometry and dimensions of the battery and cold plate (with inner cross-sectional area of 4 × 35.5 mm2) are shown in Figure 2.
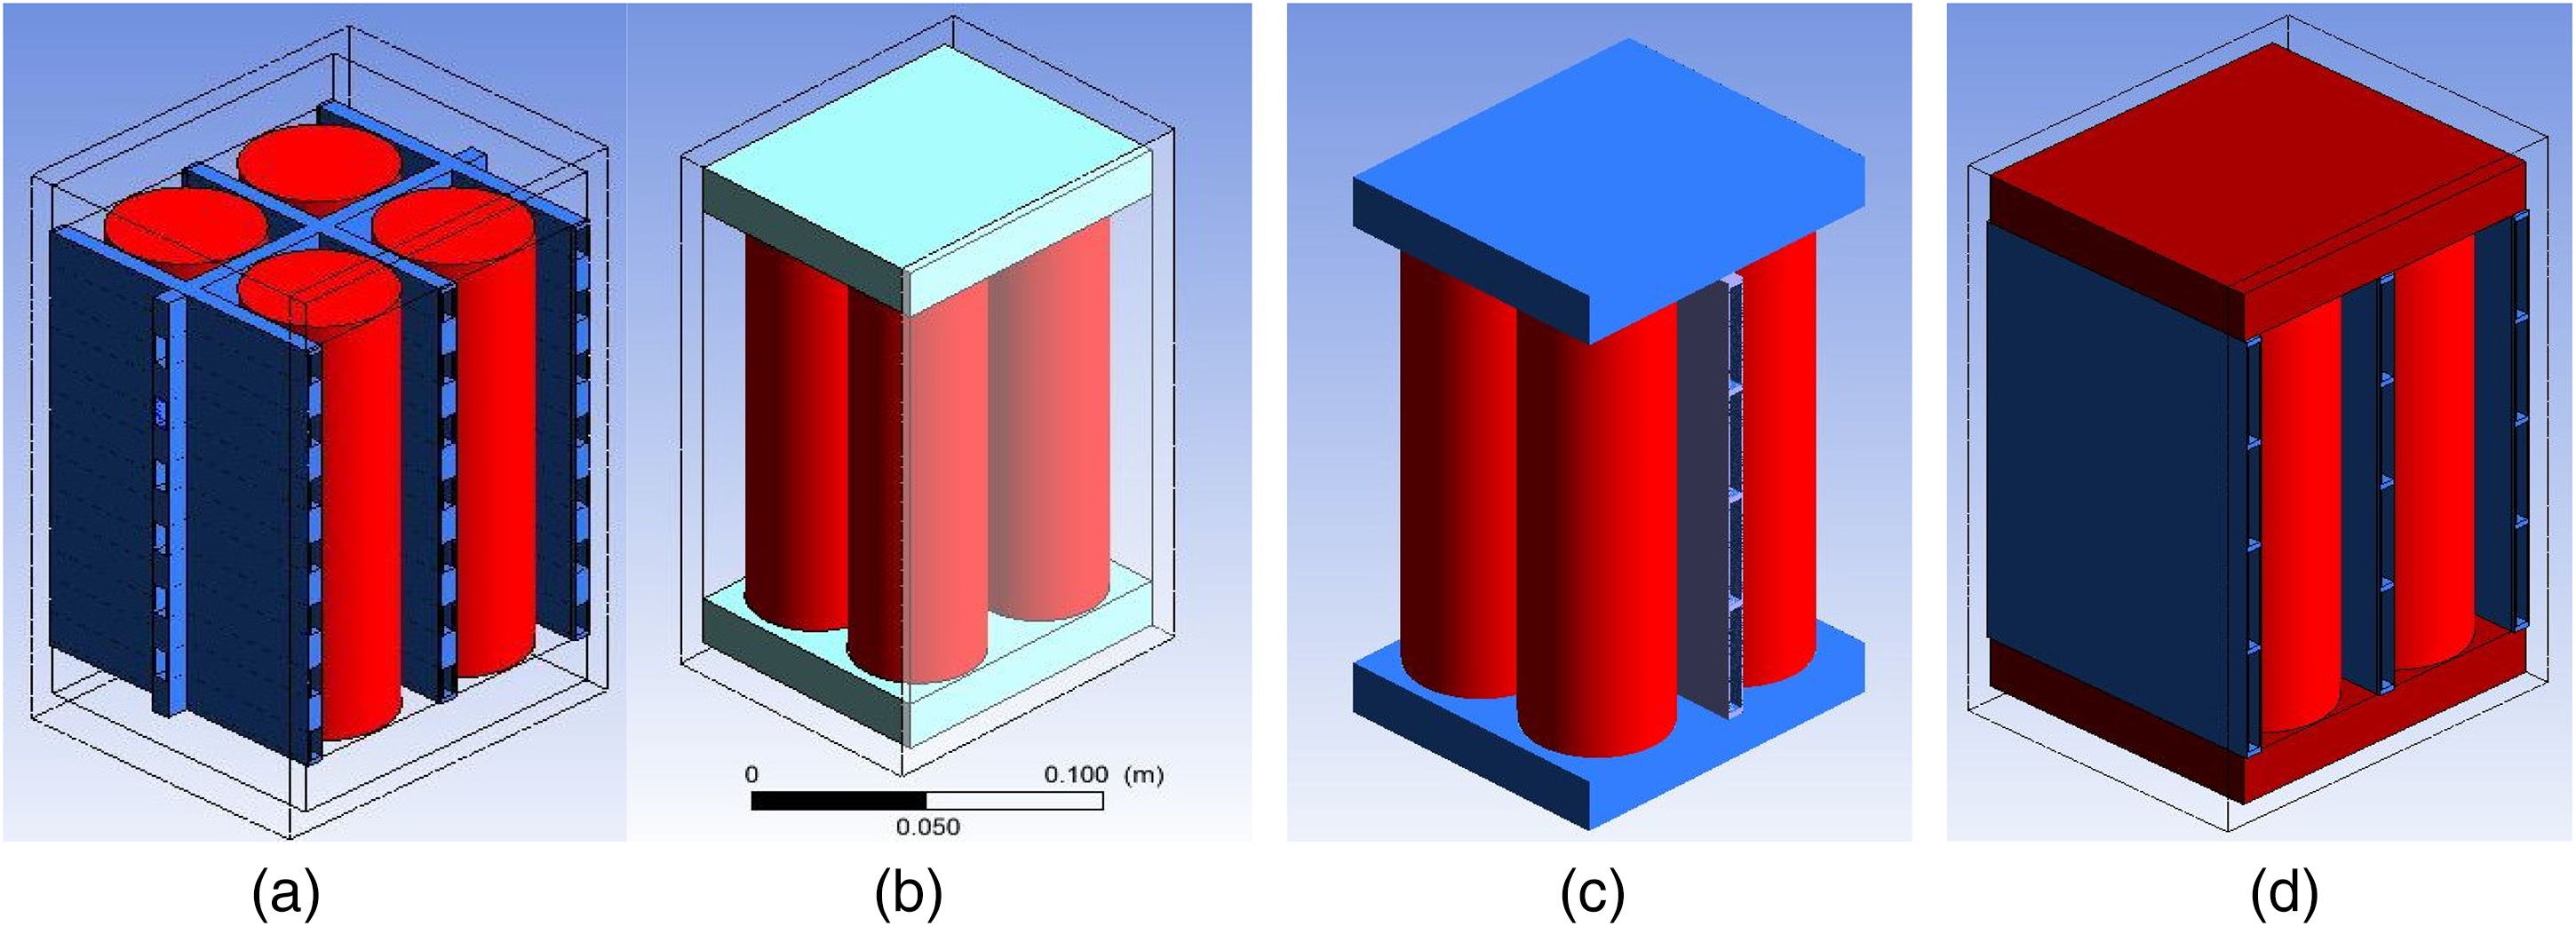
(a) Passive thermal management model, (b) initial semipassive thermal management model, (c) modified semipassive thermal management model (one-dimensional), and (d) modified semipassive thermal management model (two-dimensional).
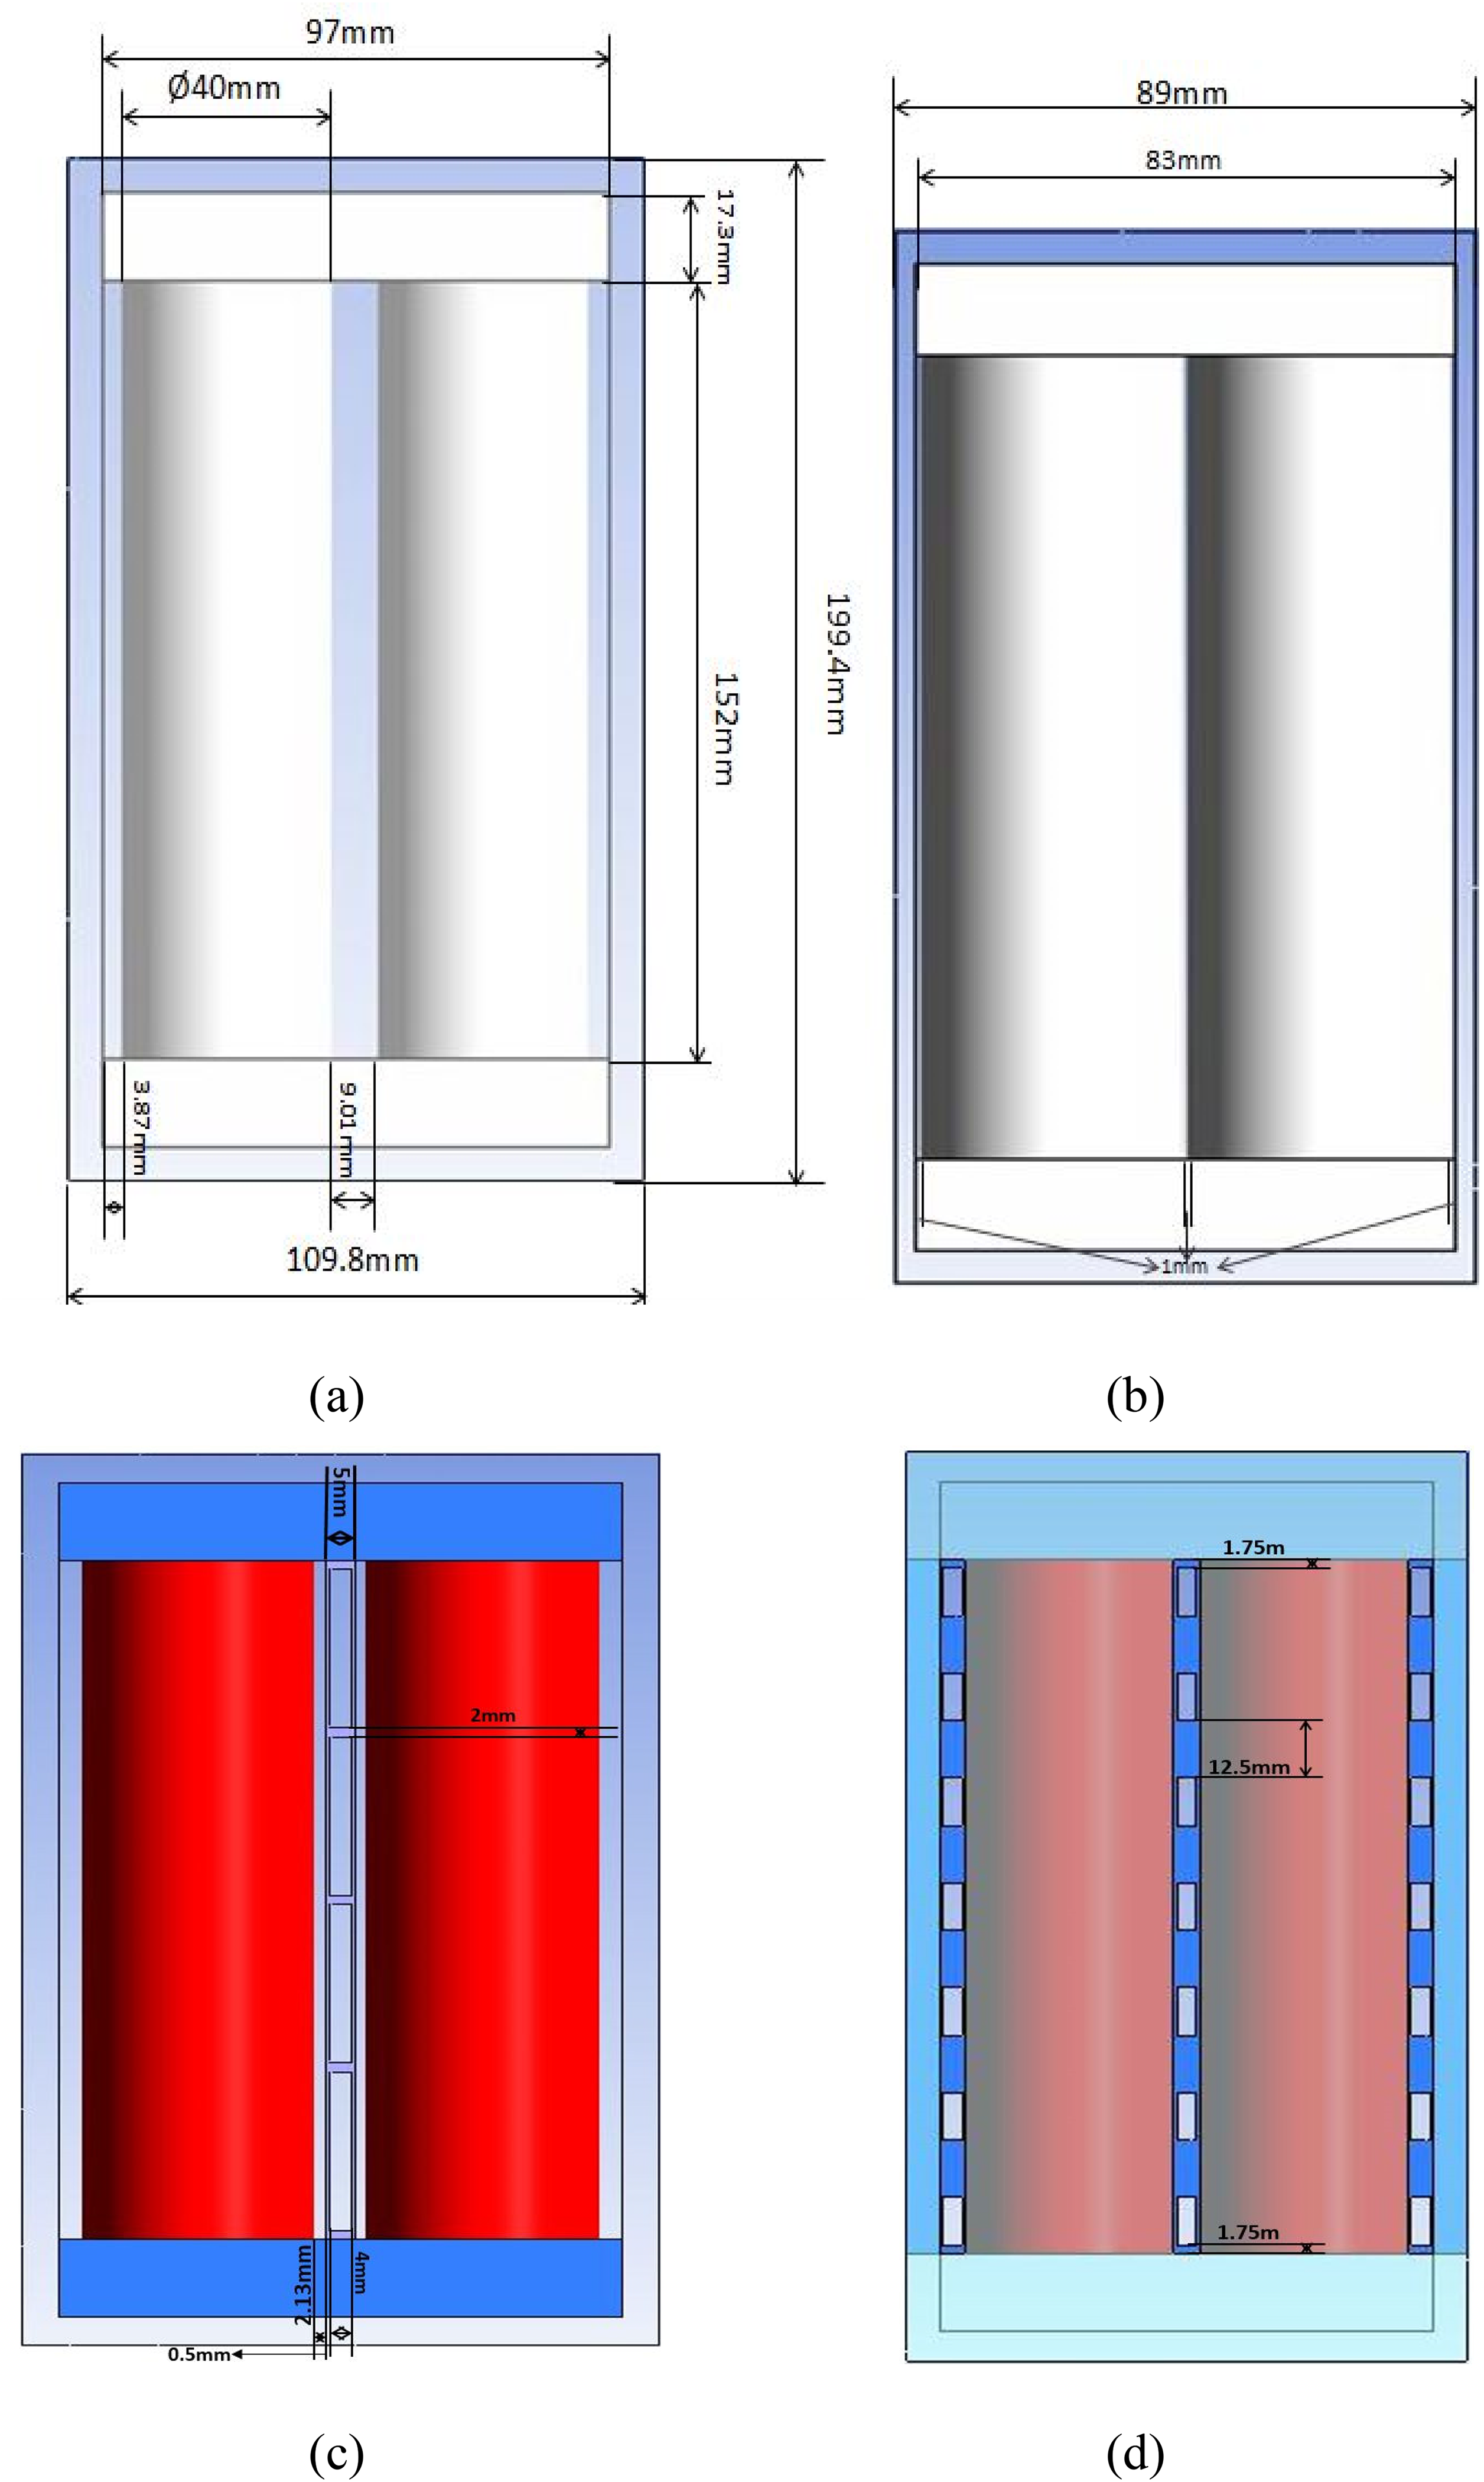
(a) Battery front view dimensions, (b) battery side view dimensions, (c) cold plate, and (d) modified cold plate.
Material properties used in the thermal management systems (Parsons and Mackin, 2017).
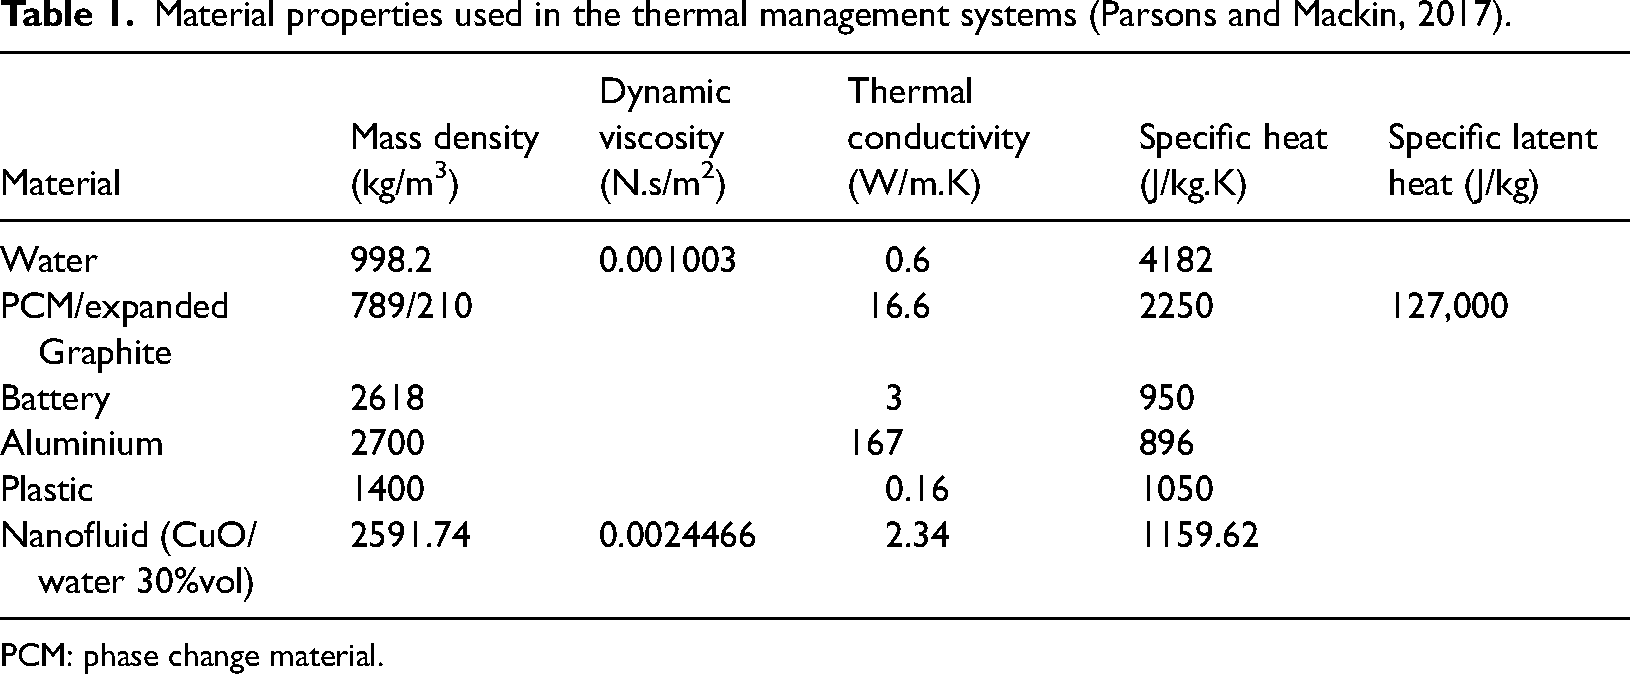
PCM: phase change material.
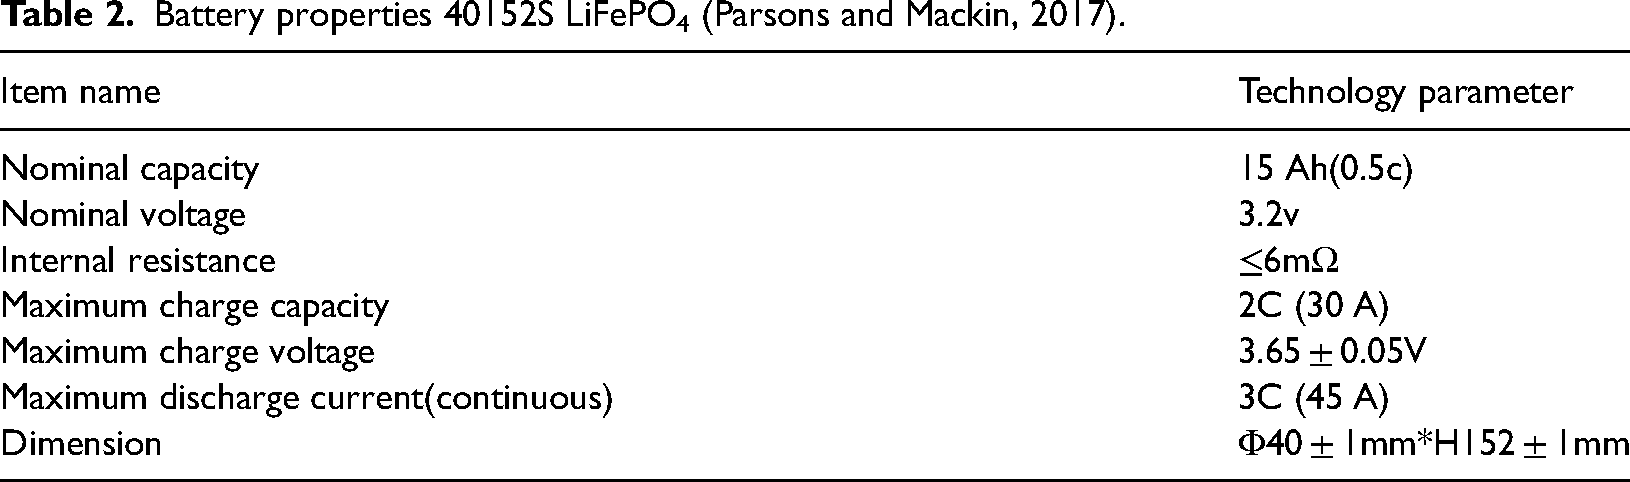
Battery properties 40152S LiFePO4 (Parsons and Mackin, 2017).
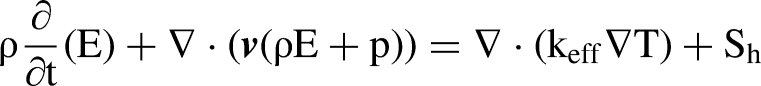
The governing equations as in Parsons and Mackin (2017) are


In this study, the batteries are designed as cylindrical heat generation sources as assumed by Parsons and Mackin (2017). The heat generation was assumed to be uniformly distributed throughout the cells. The heat generation rate applied for each battery is a time-dependent function obtained by fitting the average of heat generation rates measured experimentally for a (5P) discharge divided by the battery cell volume into a polynomial curve (Parsons and Mackin, 2017). The function is shown below:
As for the phase change material, paraffin wax, Rubitherm RT-42, with an expanded graphite matrix was chosen for this study. RT-42 was used due to its high specific latent heat of fusion and its melting point within battery pack's operating temperature range (Parsons and Mackin, 2017). The extended graphite impregnated within the PCM to improve its thermal conductivity, so that the resultant composite will be highly thermally conductive and heat absorptive at the same time. Moreover, the PCM expanded graphite (EG) is more light-weighted than other conductive materials due to its relatively low density, thus it is more suitable to install into the vehicle battery. The heat in a phase change material from below melting point temperature to a temperature above is expressed in following equations (Gresham-Chisolm and Smith, 2019):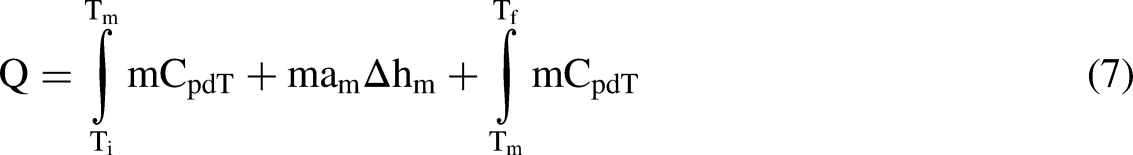

Due to the complexity of modeling the phase change process, it was modeled using a method developed by Farid et al. (1998) by treating the specific heat of the PCM/EG as a temperature dependent. Using effective specific heat over the melting temperature range for the latent heat of fusion of the PCM, a curve was created between the temperature and the effective specific heat of the paraffin and the specific heat of the composite material to model the phase change process using Farid et al. (1998) method and Parsons and Mackin (2017). In addition, the density was assumed to be constant where any density change is considered negligible.
Nanofluid is used in this study as the working fluid in the cold plates due to its enhanced thermophysical properties. The results between nanofluid and water as working fluids are compared to test the effect of nanofluid on the cooling effectiveness of the system. Here, copper oxide nanoparticles within water are the nanofluid chosen in this study.
To calculate the effective thermal conductivity of the nanofluid, an equation was developed using a modified Maxwell model created by Yu and Choi (2003) and used by Poplaski et al. (2017) shown below:


The materials and their properties are shown in Table 1. For the PCM/EG, the density was assumed constant and equals 789/210 kg/m3 as in Parsons and Mackin (2017), and the specific heat was modeled as a temperature dependent where the dependency type is a piecewise linear function defined using 40 data points (Parsons and Mackin, 2017).
The flow is assumed laminar, from Reynolds number calculations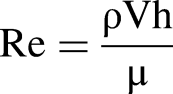
and
Numerical solution
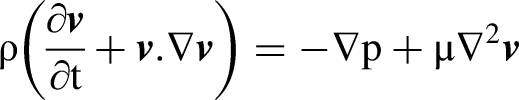
The governing equations used in this simulation are the continuity equation, the momentum equation as well as the energy equation which can be implemented in this solution by turning on the energy model. Since the fluid used in this study is incompressible, the fluid density is considered constant and thus all the derivatives of density are equal to zero. In addition, due to the horizontal flow of the liquid through the channel, the gravity was neglected as it would not affect the flow. As a result, the governing equations (1)–(3) (Parsons and Mackin, 2017) become
Before solving these equations, a setup of this problem is prepared in ANSYS Fluent. Using thermal management model (Gresham-Chisolm and Smith, 2019) and battery model (Parsons and Mackin, 2017) as a reference in this study, and based on that, applying changes to the model and the working fluid in order to improve the cooling effectiveness without making changes on the calculation settings. Using the same batteries as Parsons and Mackin (2017), and using similar discharge rate used in Parsons and Mackin (2017) at 240 W (5P) rate such that to have the same heat generation rate for the battery cells.
The materials and their properties in Table 1 were defined and specified for each part of this model. For the PCM/EG, the density was assumed constant as in Parsons and Mackin (2017), and the specific heat was modeled as a function of temperature (Farid et al., 1998) as described earlier and shown in Figure 3 where the function type is a piecewise linear function with defined using 40 data points (Parsons and Mackin, 2017). As for the batteries, a similar discharge rate to (Parsons and Mackin, 2017) batteries was used at 240 W (P5) in order to generate heat at the same rate as previously experimented. The heat source term was added for each battery cell zone, where a user-defined function (UDF) is used to define the generation rate as a function of time. This UDF was written using a C++ code, interpreted into Fluent and assigned for each battery cell.
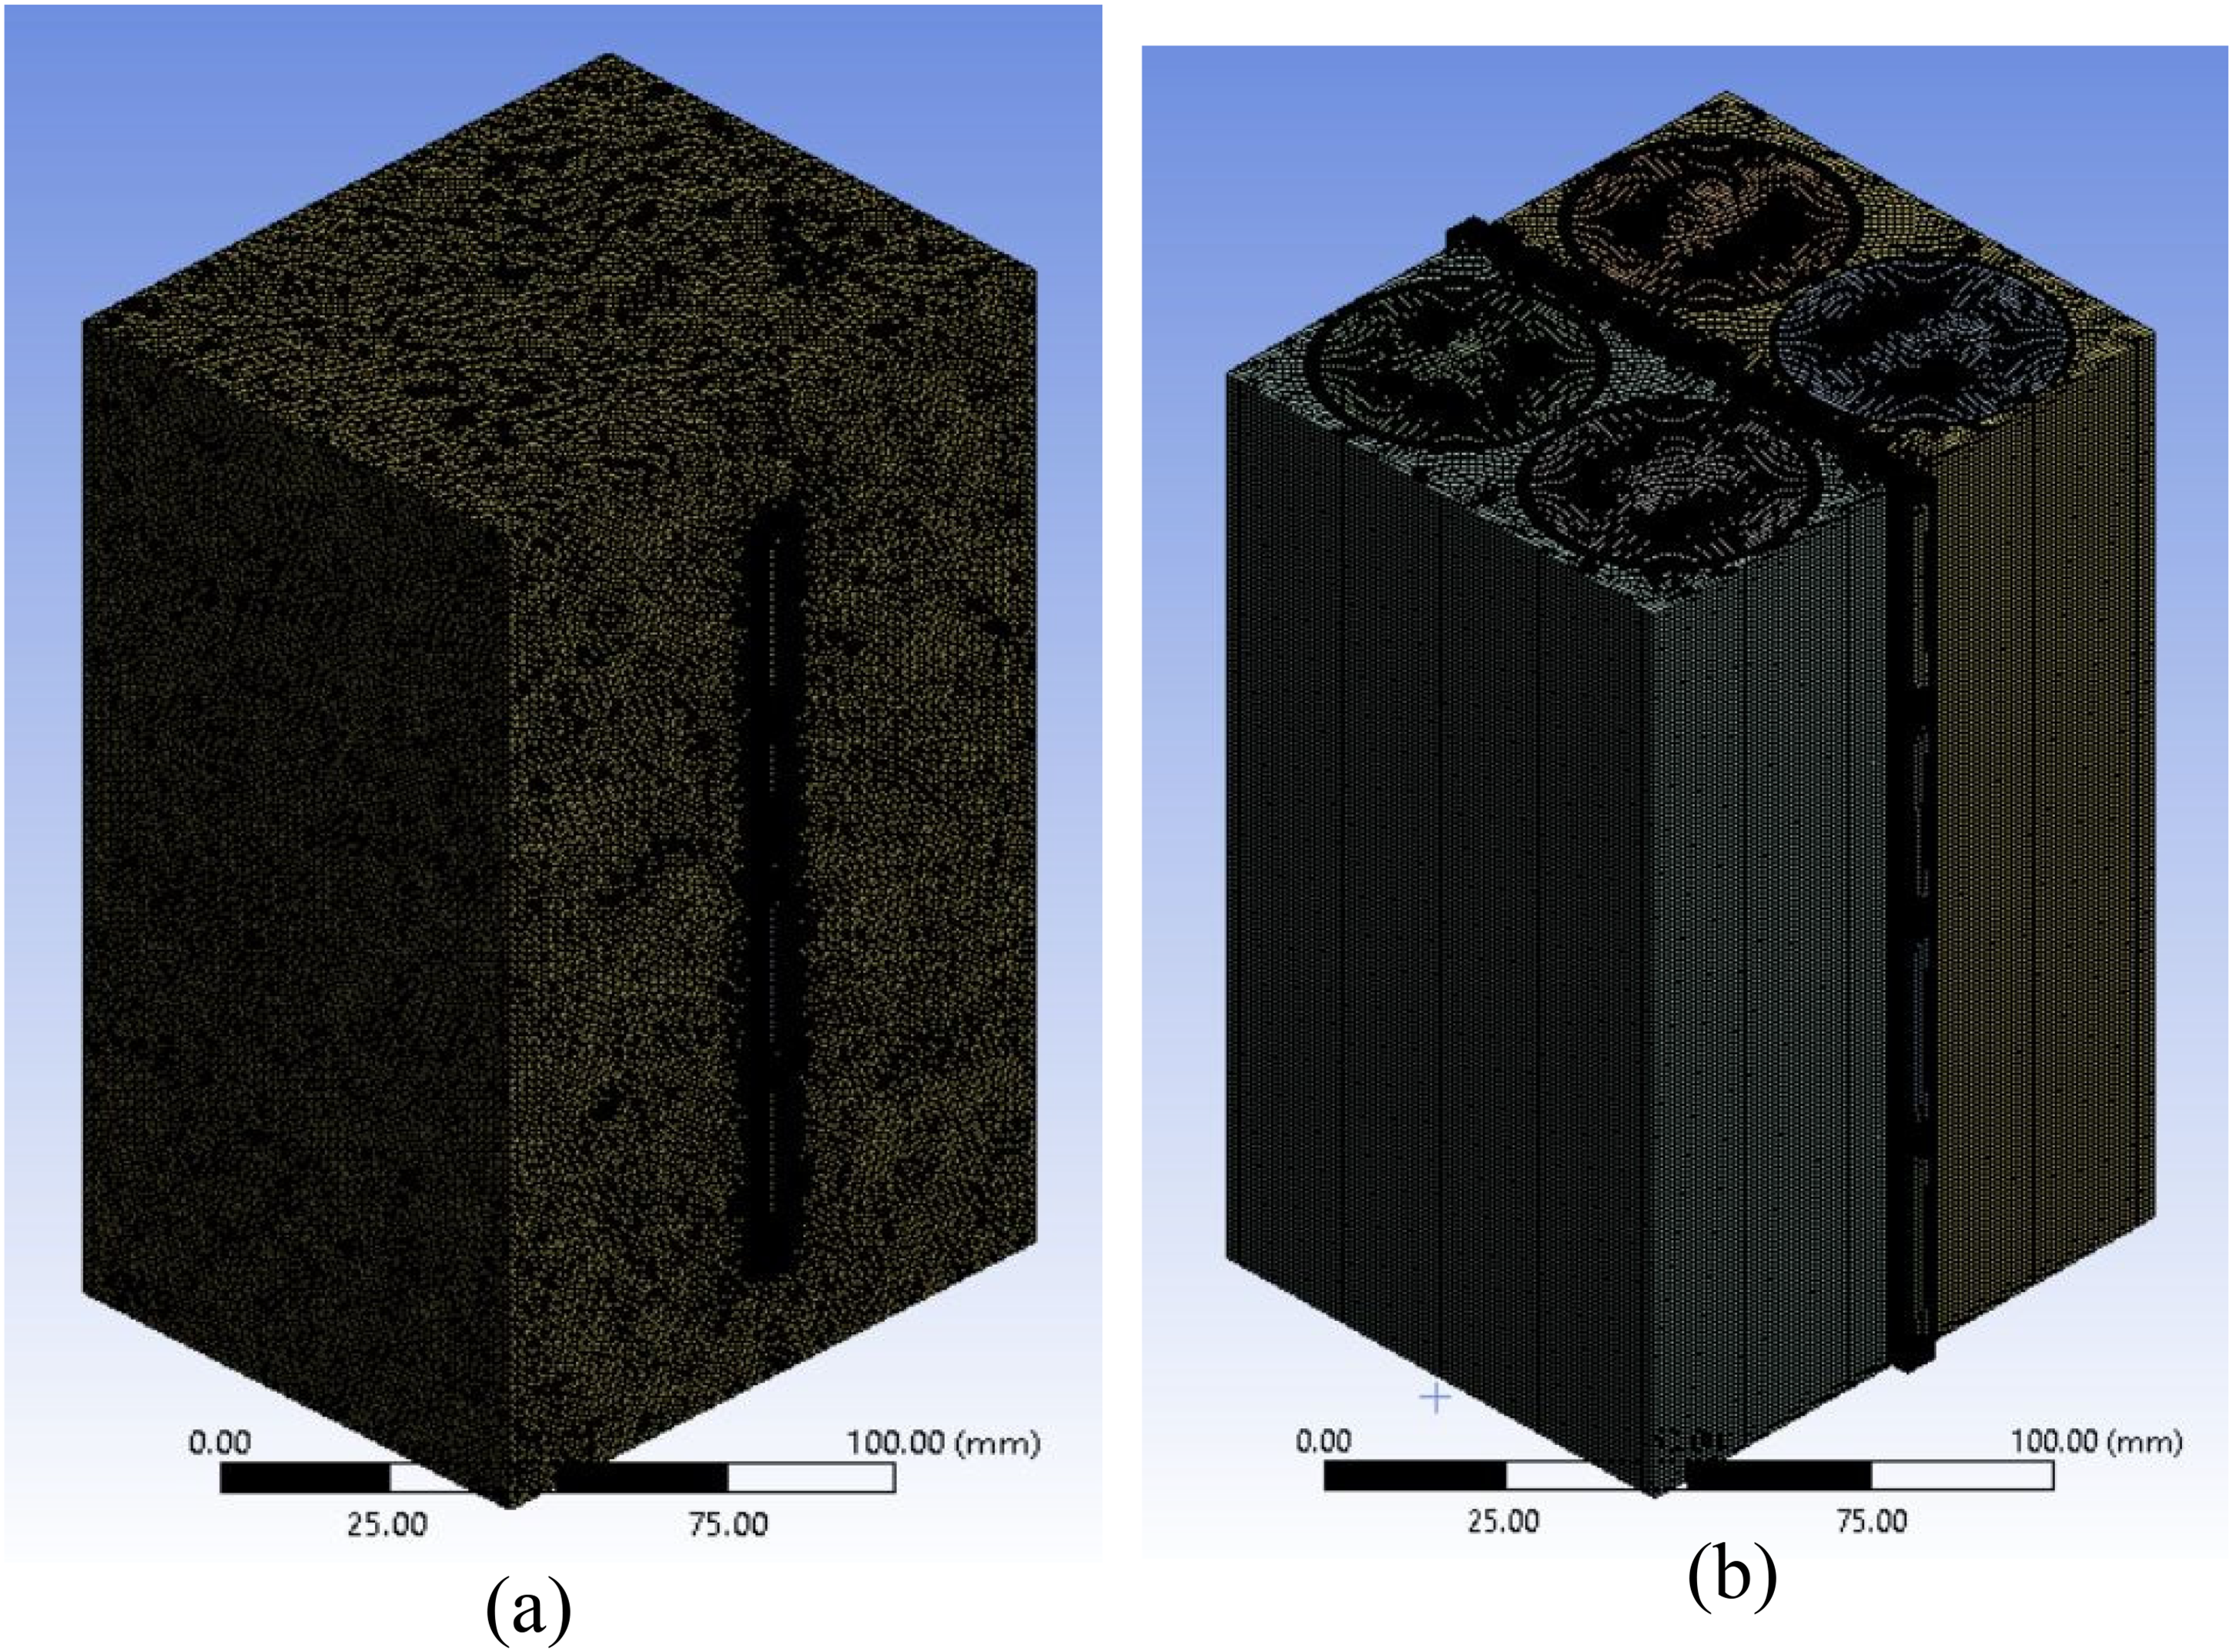
Mesh of the initial semipassive battery pack: (a) with cover and (b) without cover.
The boundary conditions are set similar to Gresham-Chisolm and Smith (2019). The initial temperature for the batteries and the ambient temperature are set to 26.85°C. At the inlets, the working fluid enters with a velocity of 0.5 m/s and a temperature of 26.85 °C. At the outlets, the outlet gauge pressure is set to zero. As of the fluid part, the no-slip condition is defined for interior walls of the channel. At the exterior surfaces of the battery cover, a uniform heat convection occurs with a heat transfer coefficient set to 2 W/m2 K.
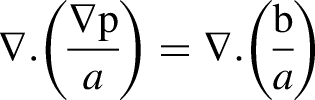
In order to solve the governing equations, ANSYS Fluent uses two main types of solvers: the pressure-based and the density-based solvers. Since this study involves using a low-speed incompressible fluid, the pressure-based solver was selected. The pressure-based solver employs different algorithms to overcome the difficulties mentioned previously. The Semi-Implicit Method for Pressure-Linked Equations (SIMPLE) algorithm considers one of these algorithms and is used in this study to resolve the pressure–velocity coupling. The solution procedure starts with discretization and linearization of the momentum equation using the finite volume method which is written as follows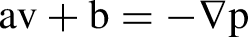
Mesh development
Here an example is shown for one of the meshes for the initial semipassive TMS in Figure 3.
Grid independence check
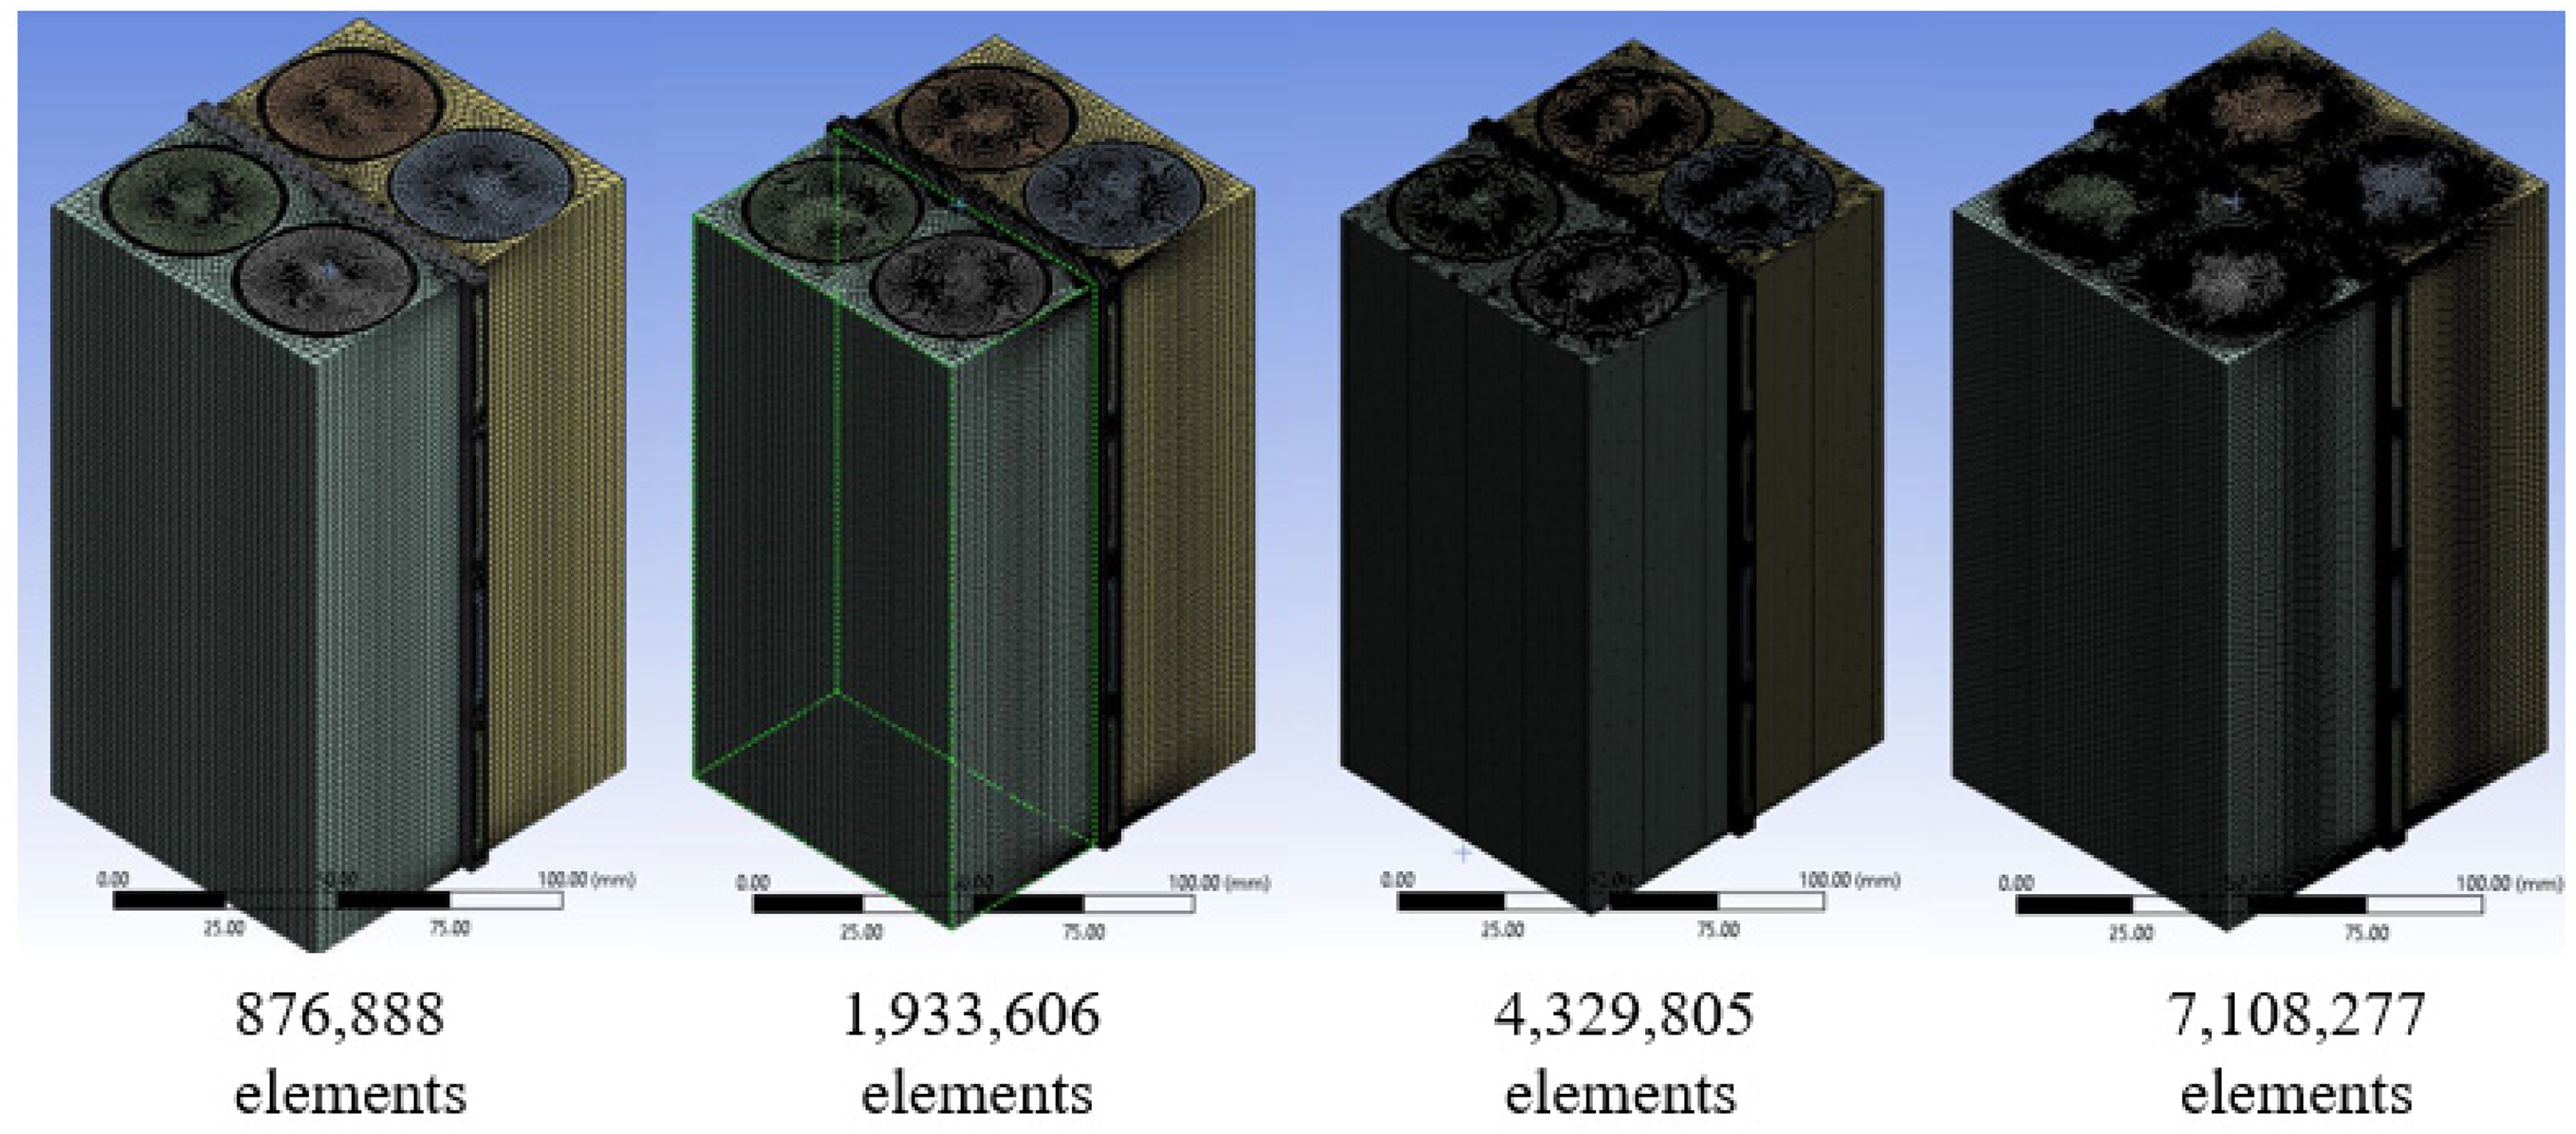
To acquire the most suitable mesh for each system, a number of meshing iterations were performed for each system. Taking the initial semipassive system for example as in Figure 4, four iterations were applied. Firstly, a mesh is used with low elements number of 876,888 and the maximum temperature for the system was 82.31 °C. Secondly, a finer mesh of 1,933,606 elements is used and the maximum temperature decreased to 82.3 °C. Thirdly, the mesh is improved up to 4,329,805 elements and the maximum temperature for the system was 82.29 °C. Finally, the mesh elements are increased to 7,108,277 but the maximum temperature did not change from the previous iteration. So, to save simulation time and preserve the accuracy the third mesh is used with 4,329,805 elements.
Meshing iterations.
Results and discussion
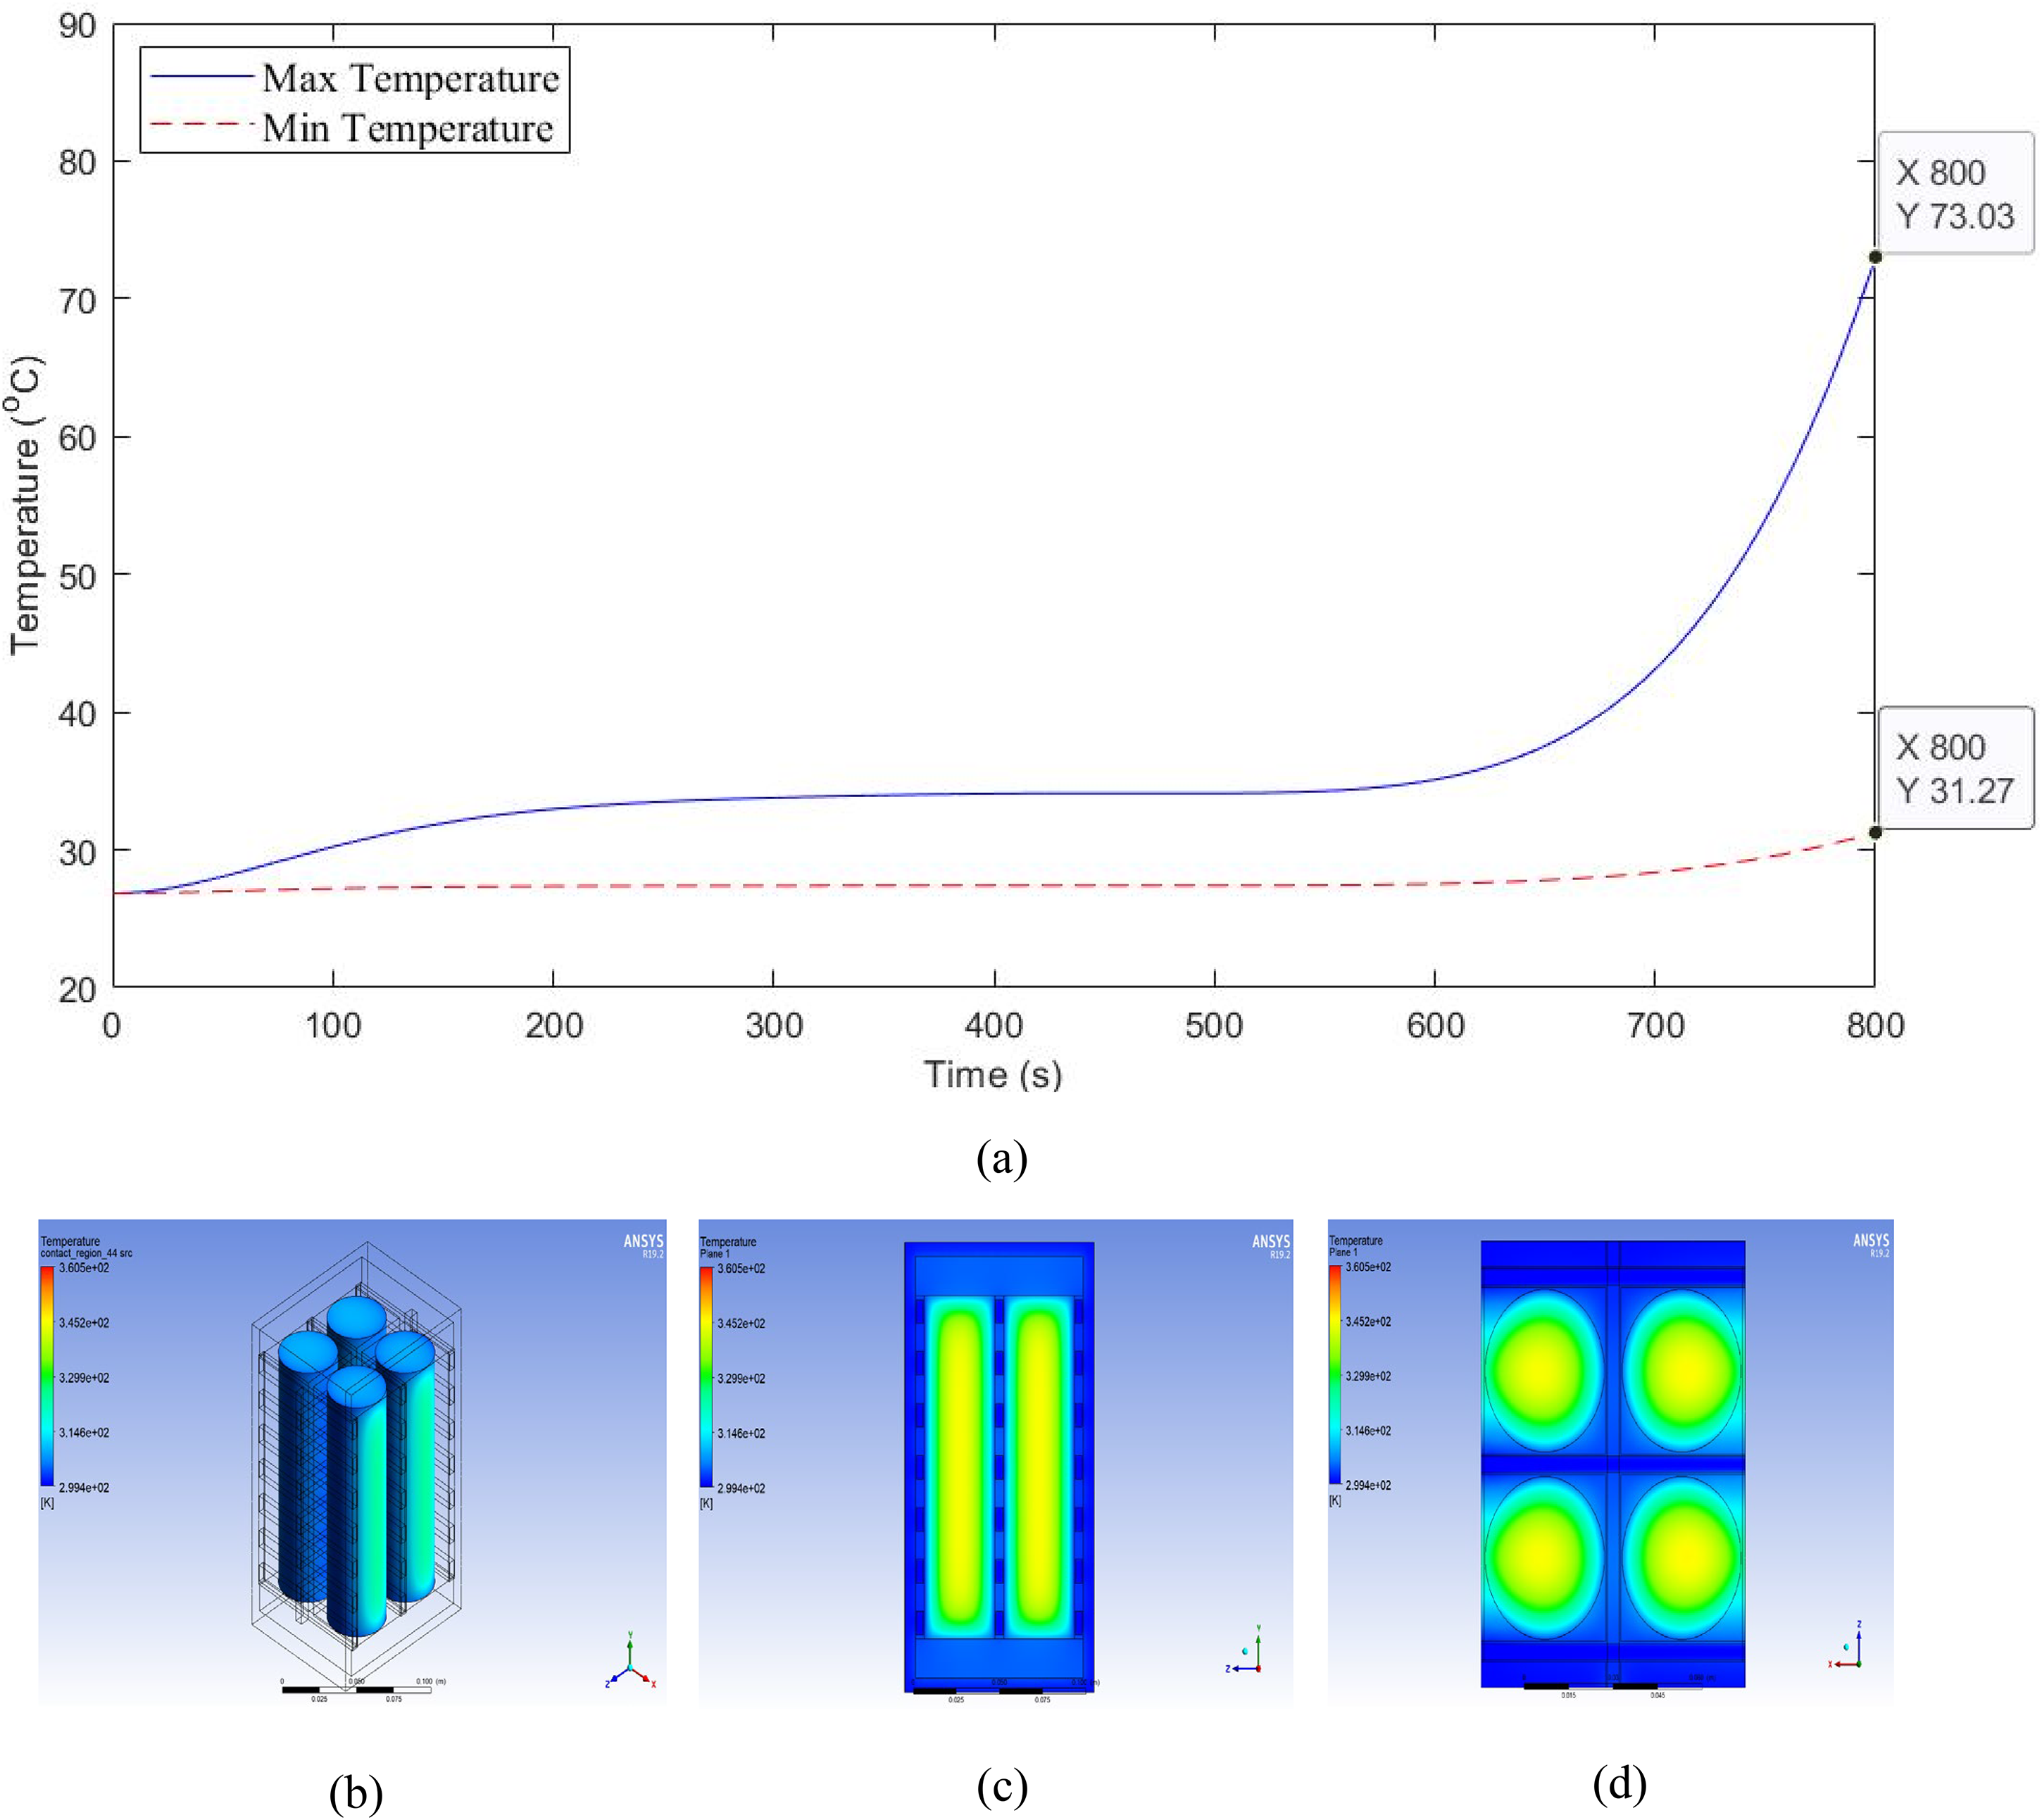
The impact of nanofluids on the thermal management system's cooling performance is examined across various semipassive thermal management configurations. For the passive thermal management system, simulation results reveal significant temperature variations at 800 seconds. Specifically, Figure 5(a) illustrates the temporal evolution of maximum and minimum temperatures, while Figure 5(b) shows the corresponding temperature contours on the battery cells’ surface. At this time, the maximum temperature reaches
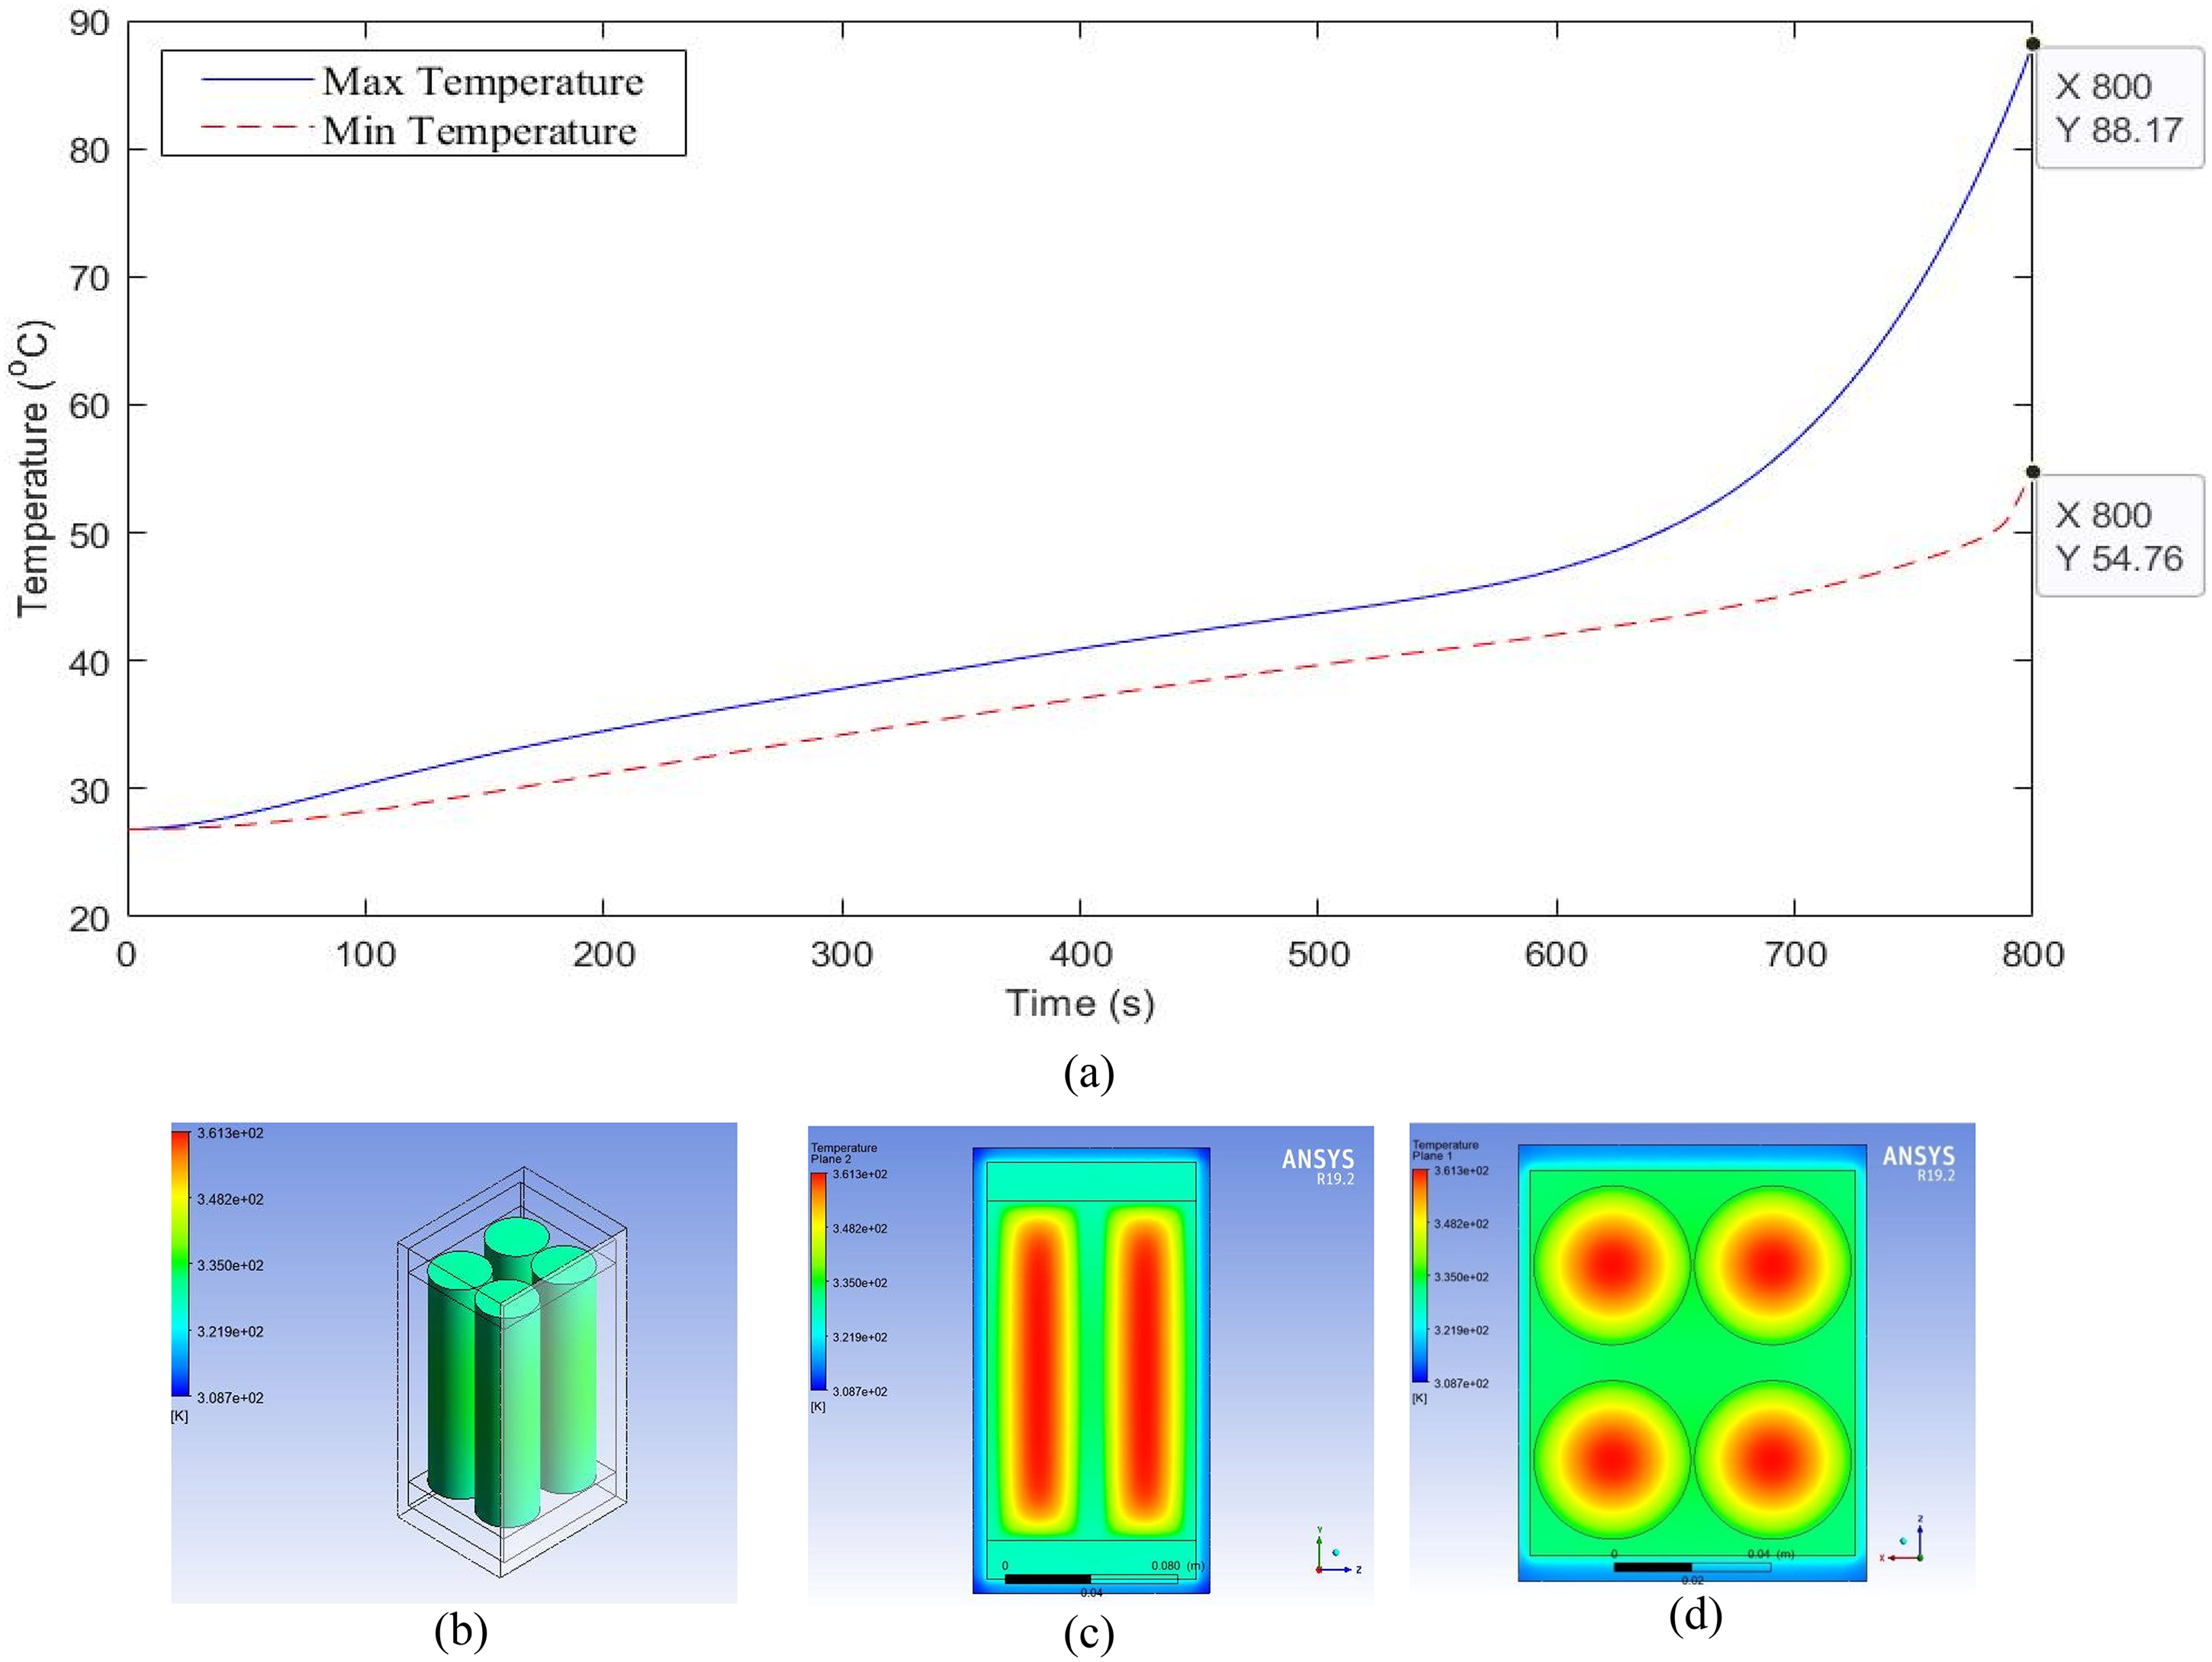
(a) Temperature profile of the battery, (b) temperature contours at the surface, (c) temperature contours in the center of the cells (front view), and (d) temperature contours in the center of the cells (top view).
As depicted in Figures 5(c) and (d), the highest temperatures are concentrated at the center of each cell, where heat generation is most intense due to electrochemical reactions and poor heat dissipation. It is important to note that the manufacturer's specified maximum operating temperature for the cells is
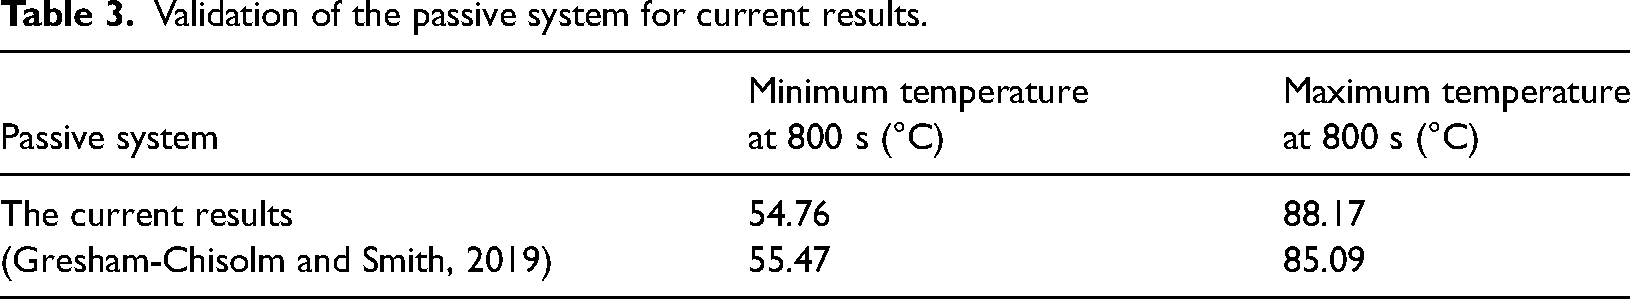
In order to validate this work, the previous results have been compared with the work of Gresham-Chisolm and Smith (2019) on the passive cooling system as shown below in Table 3. For the maximum temperature, at 800 s the deviation is 3.08°C. And for the minimum temperature, at 800 s the deviation is 0.71°C.
Validation of the passive system for current results.
For a semipassive cooling using water (simple plate) the maximum and minimum temperature at 800 s are shown in Figure 6(a), the temperature contours of the battery cells’ surface at 800 s is shown in Figure 6(b). Here at 800 s, the maximum temperature is 82.29°C and the minimum temperature is 33.88°C. The temperature semiconstancy raises to 48.41°C. Then a large variation occurs as the time increases as shown in Figure 6(a). As seen in Figure 6(c) and (d) that the maximum temperature appears in the center of each cell. Also, the manufacturer's design maximum temperature of cells is surpassed at 741 s.
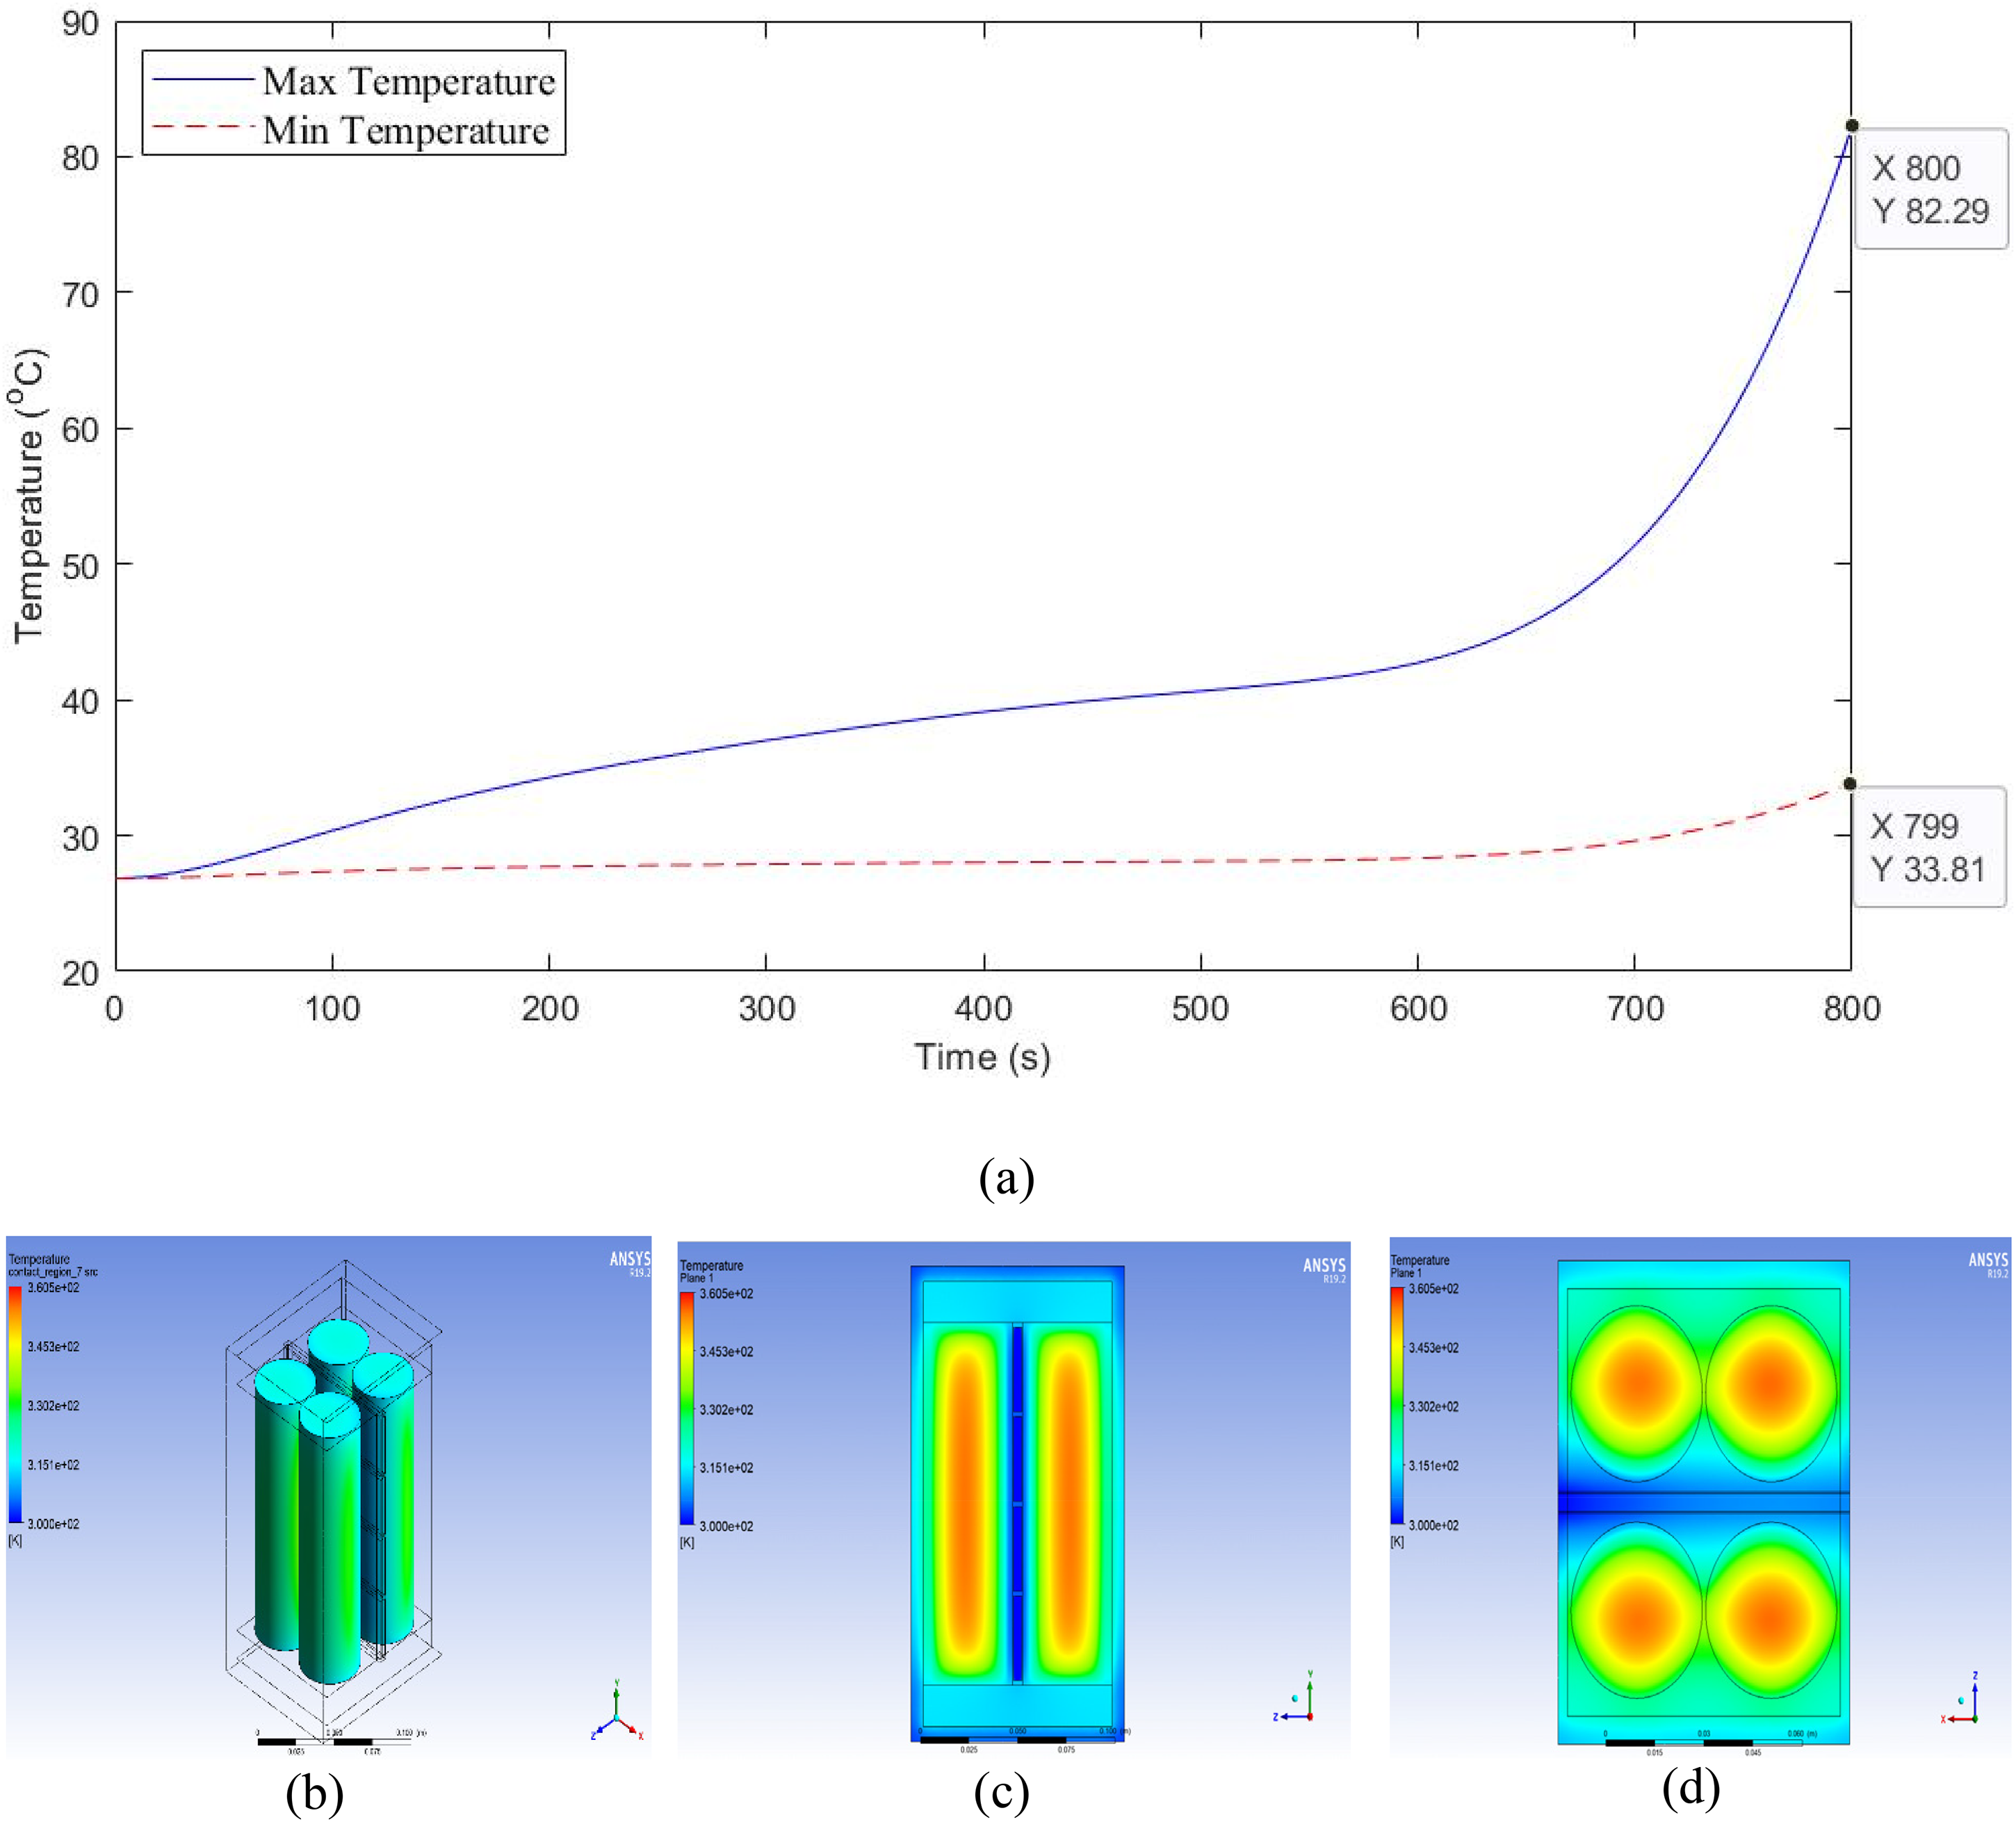
(a) Temperature profile of the battery, (b) temperature contours at the surface, (c) temperature contours in the center of the cells (front view), and (d) temperature contours in the center of the cells (top view).
After adding a simple cold plate through which nanofluid of 30% nanoparticle volumetric fraction passes, the simulation resulted in the maximum and minimum temperature at 800 s shown in Figure 7(a), the temperature contours of the battery cells’ surface at 800 s is shown in Figure 7(b). Here at 800 s, the maximum temperature is 81.71 °C and the minimum temperature is 31.57 °C. The temperature semiconstancy raises to 50.14 °C. Then a large variation occurs as the time increases as shown in Figure 7(a). As seen in Figure 7(c) and 7(d) that the maximum temperature appears in the center of each cell. Also, the manufacturer's design maximum temperature of cells is surpassed at 742 s. This shows the difference with Figure 3 using semipassive model where water was used as the working fluid to compare the impact of the nanofluid with water.
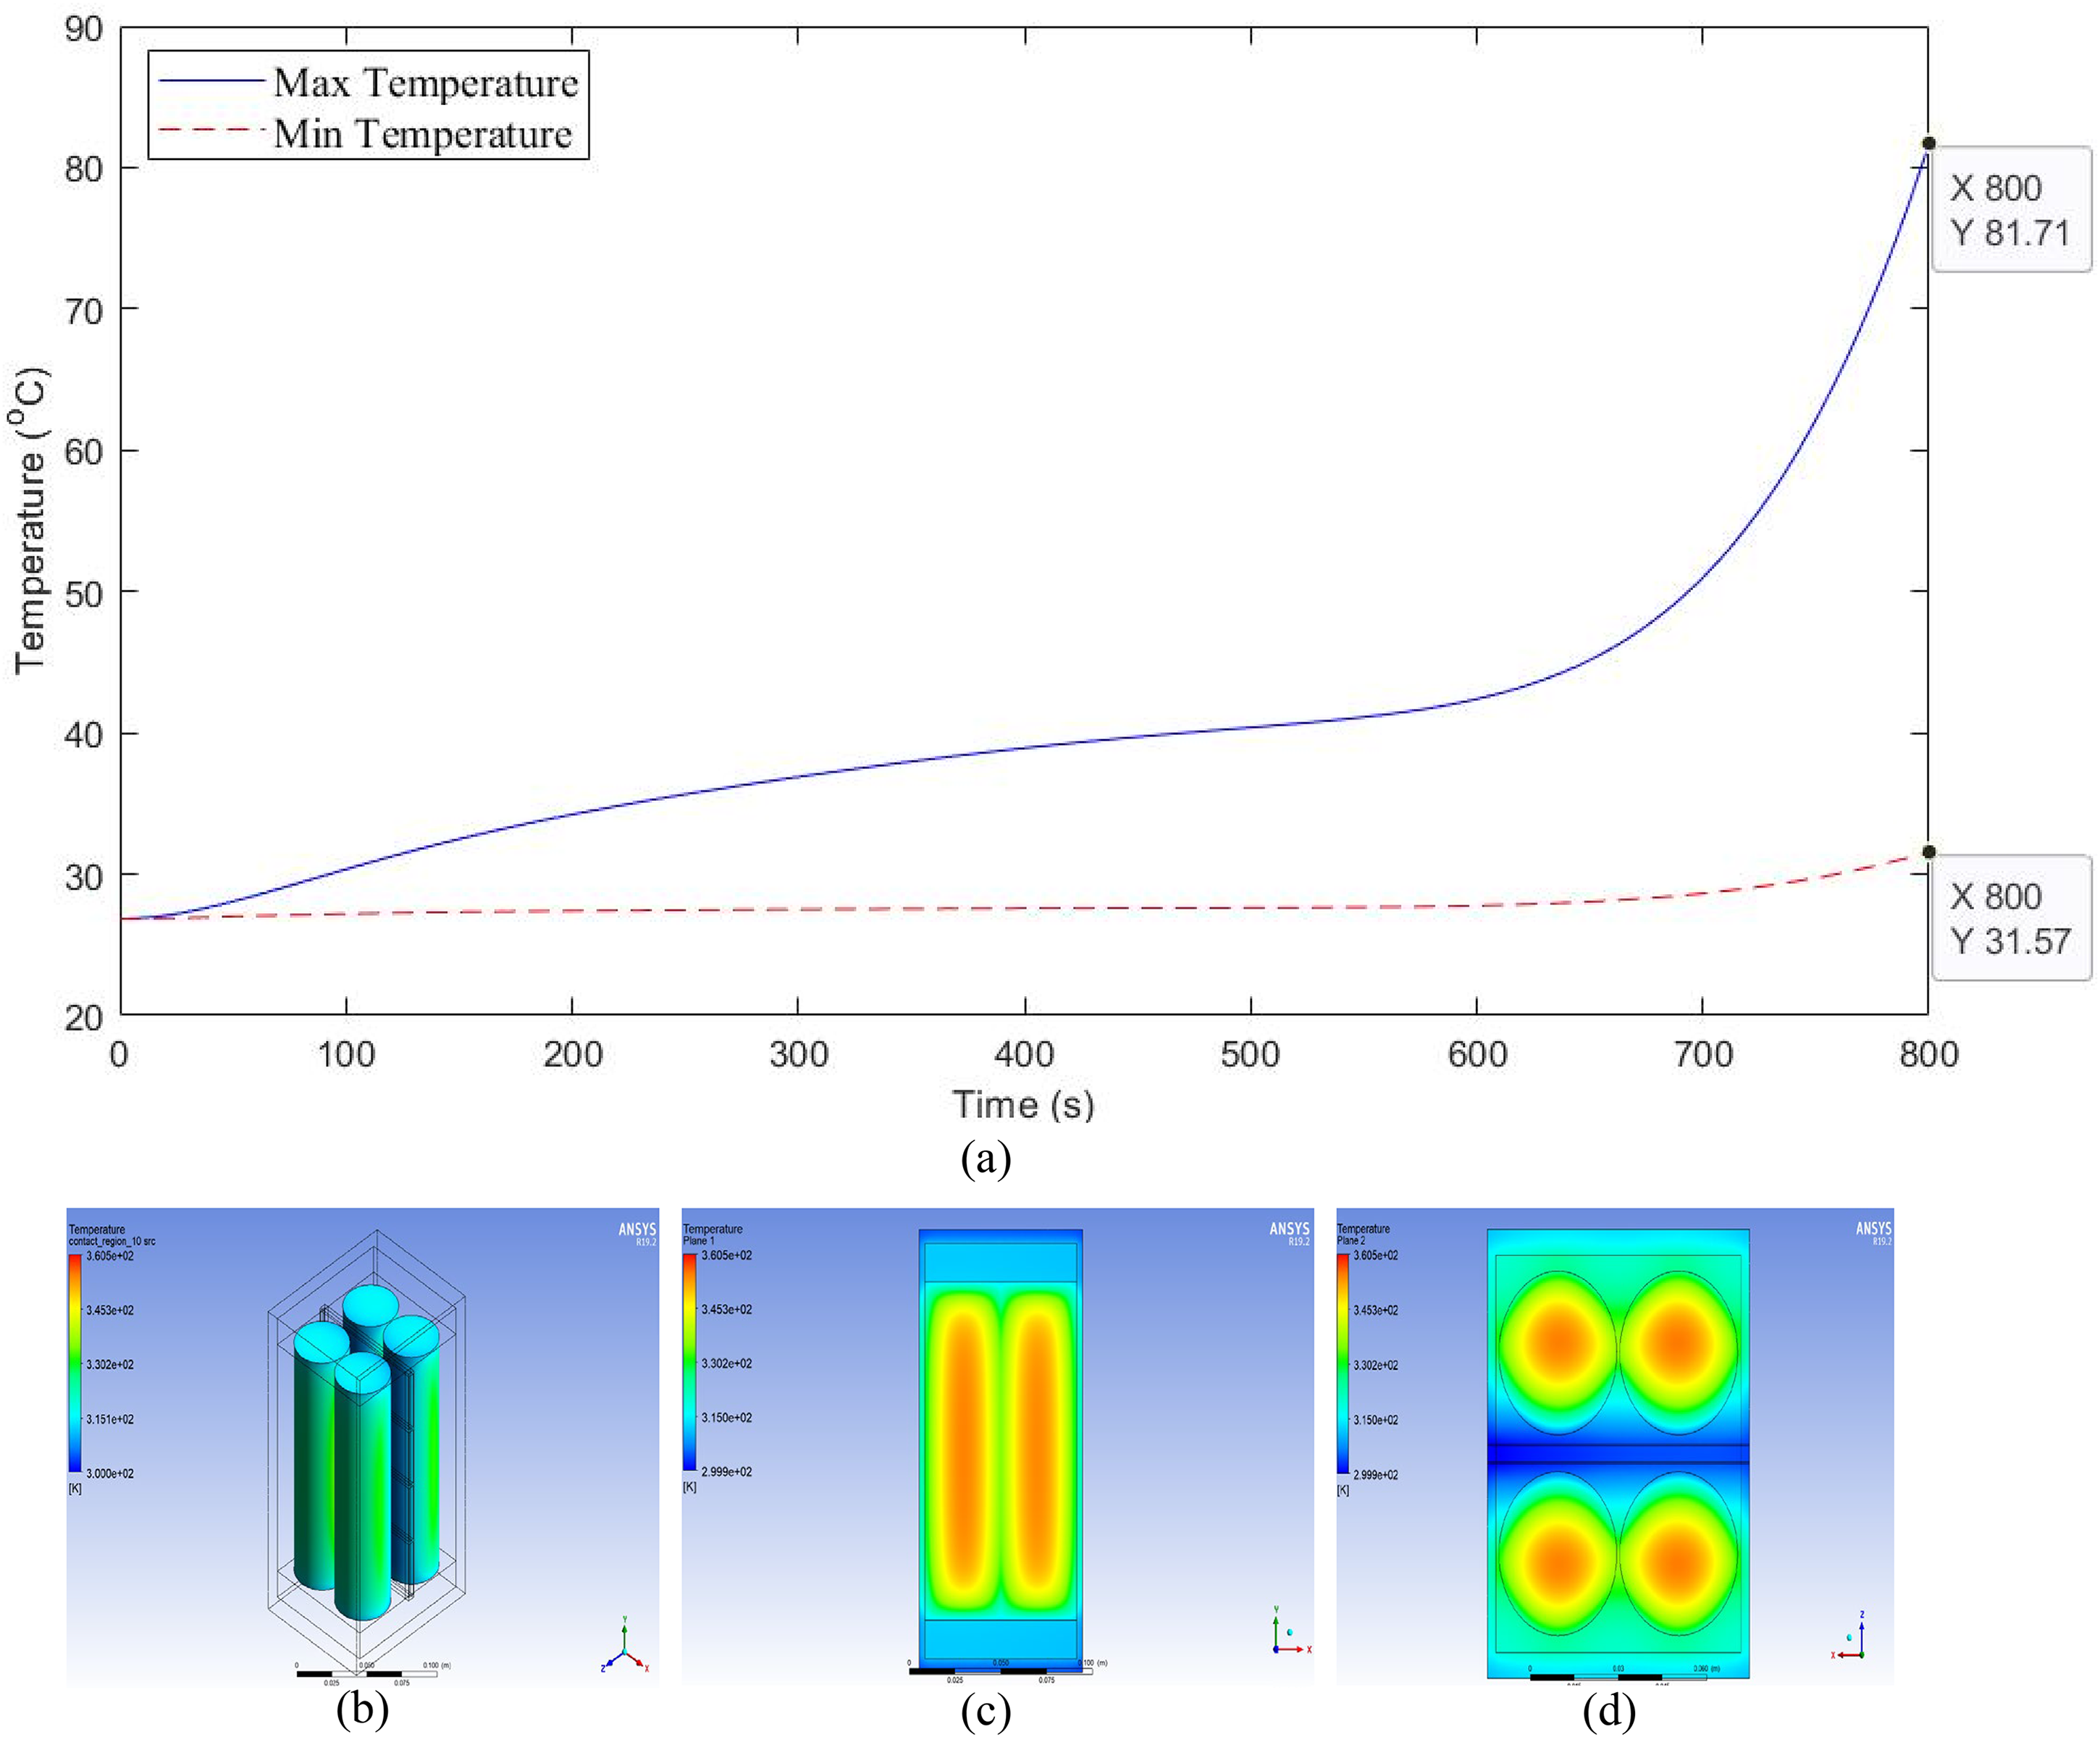
(a) Temperature profile of the battery, (b) temperature contours at the surface, (c) temperature contours in the center of the cells (front view), and (d) temperature contours in the center of the cells (top view).
For semipassive cooling using water (semicomplex plate) the maximum and minimum temperature at 800 s are shown in Figure 8(a), the temperature contours of the battery cells’ surface at 800 s are shown in Figure 8(b). Here at 800 s, the maximum temperature is 75.54°C and the minimum temperature is 32.51°C. The temperature semiconstancy raises to 43.03°C. Then a large variation occurs as the time increases as shown in Figure 8(a). As seen in Figure 8(c) and (d) that the maximum temperature appears in the center of each cell. Also, the manufacturer's design maximum temperature of the cells is surpassed at 764 s.
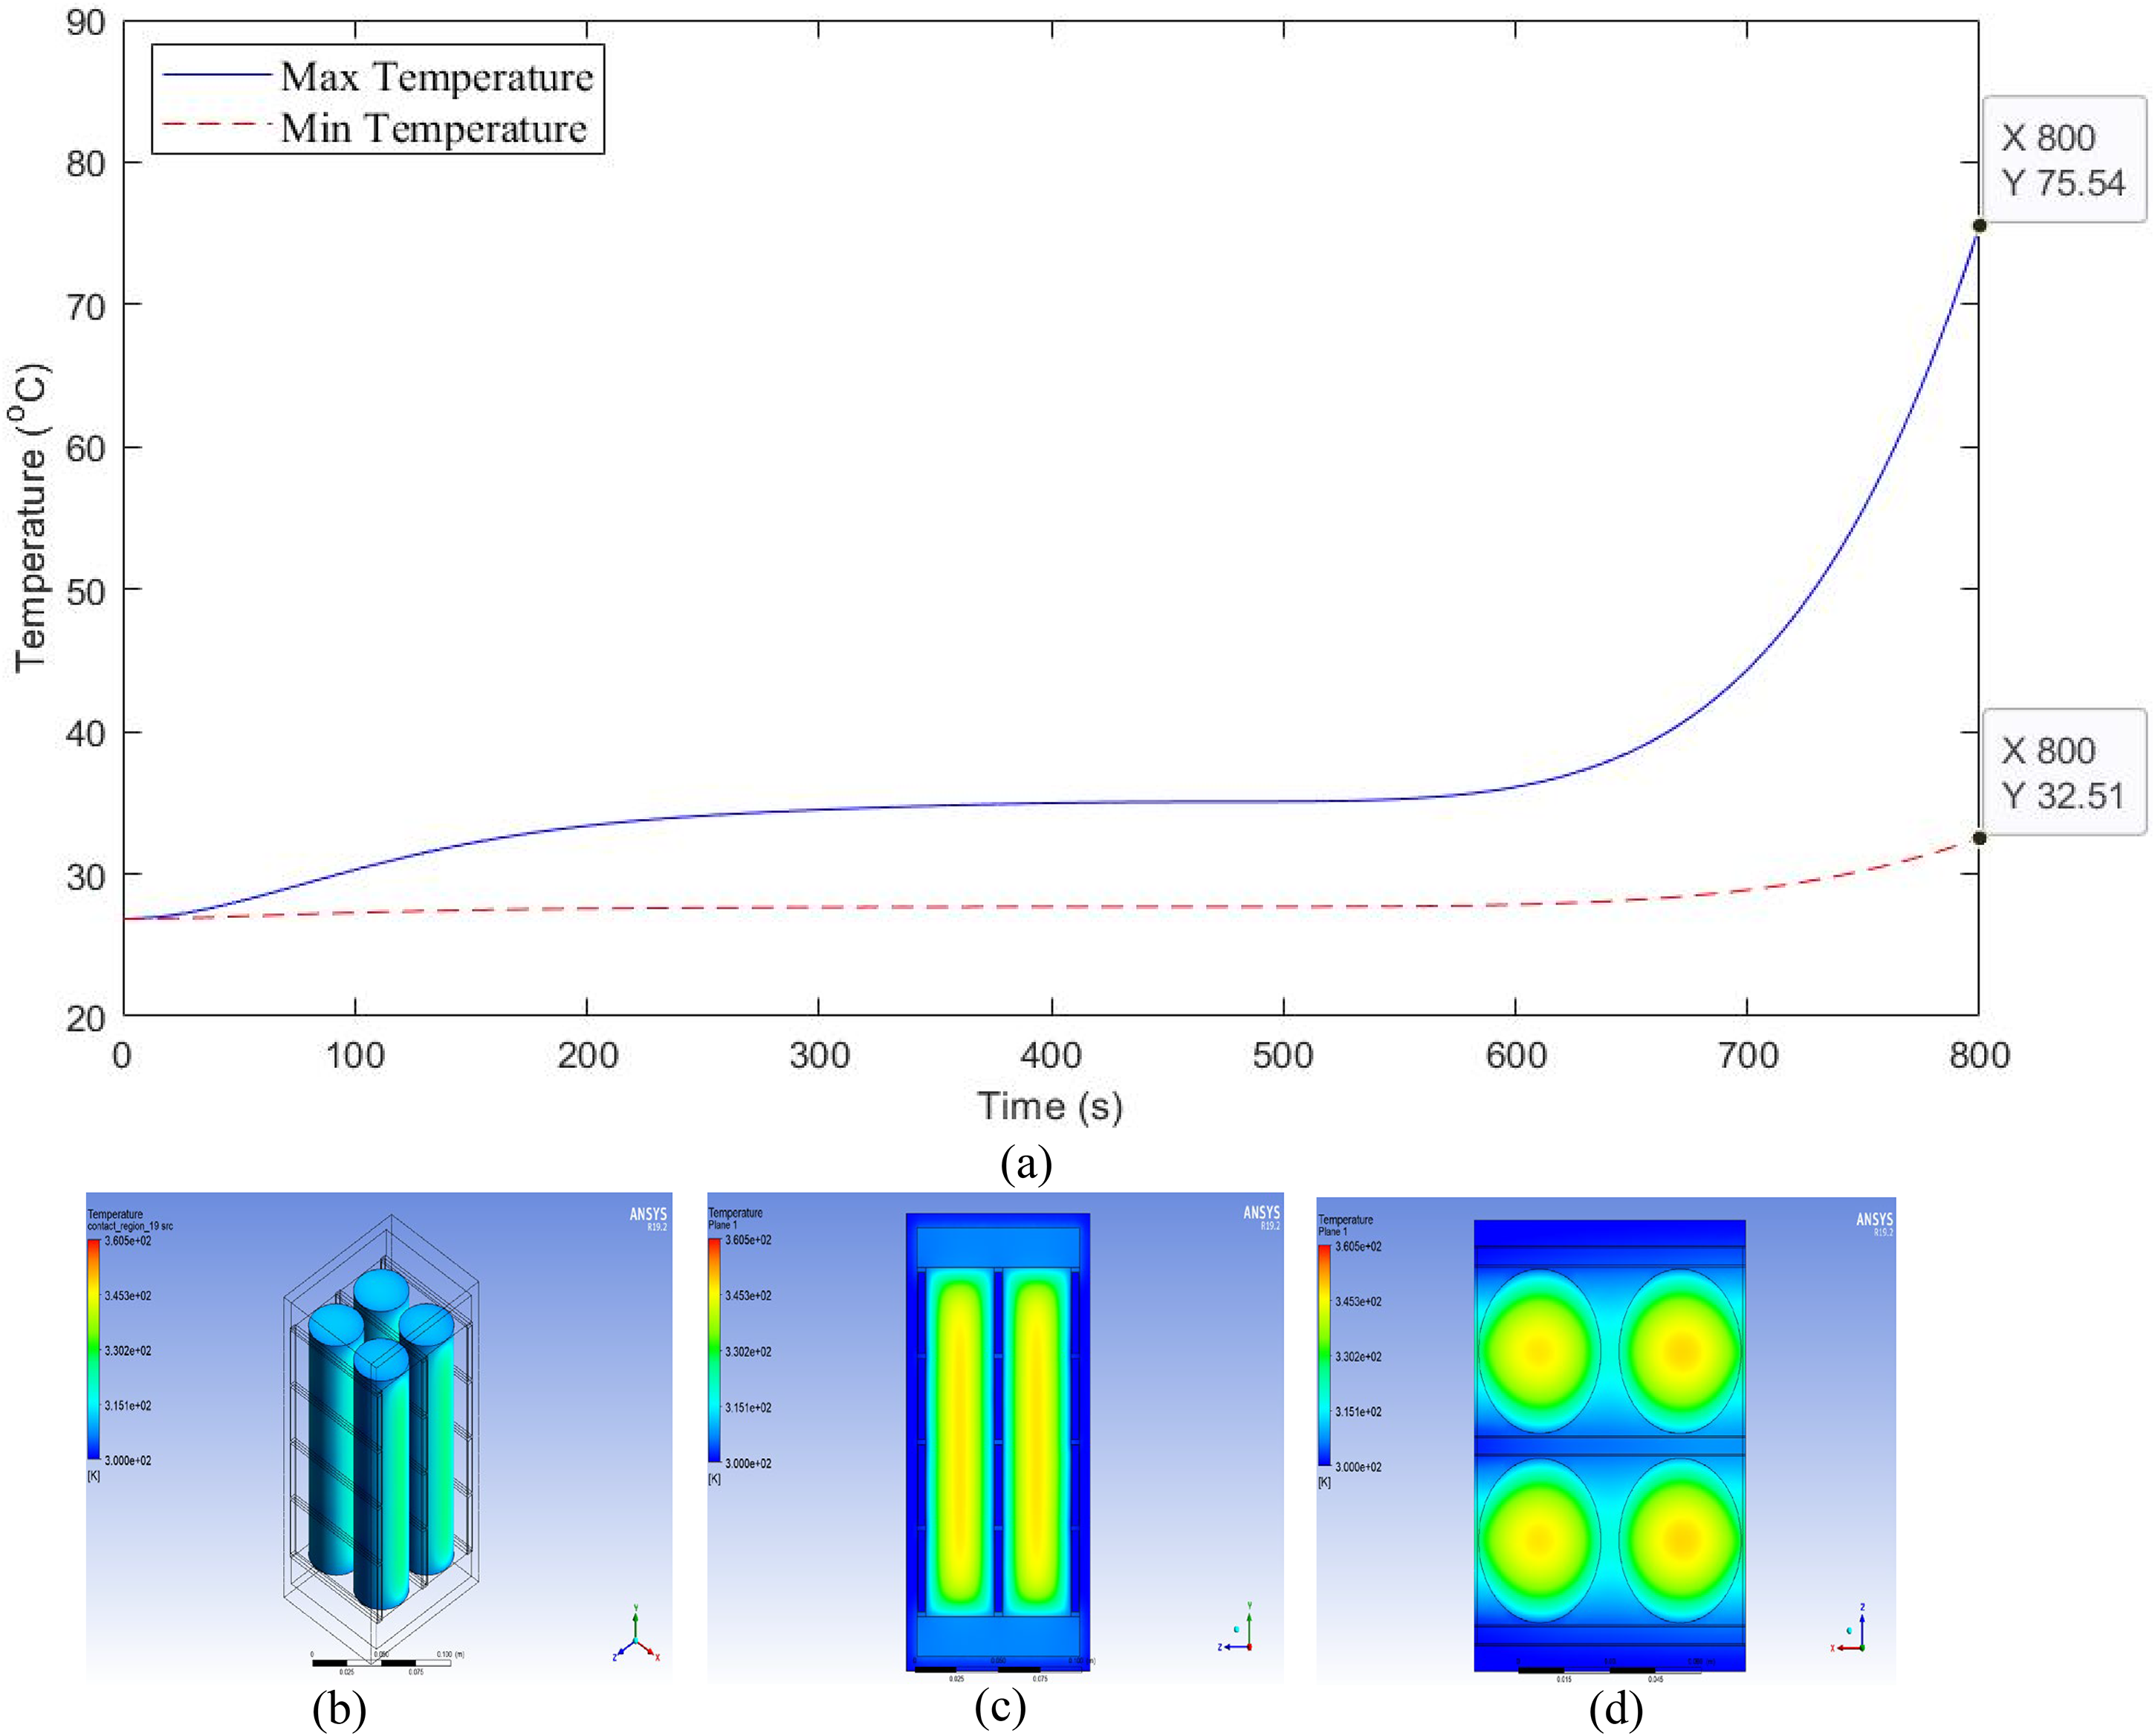
(a) Temperature profile of the battery, (b) temperature contours at the surface, (c) temperature contours in the center of the cells (front view), and (d) temperature contours in the center of the cells (top view).
Following that simulation, the single cold plate in the semipassive system was replaced with three plates equally separated from each other. The maximum and minimum temperatures obtained at 800 s are shown in Figure 9(a), the temperature contours of the battery cells’ surface at 800 s are shown in Figure 9(b). Here at 800 s, the maximum temperature is 74.22 °C and the minimum temperature is 30.54 °C. The temperature semiconstancy raises to 43.68 °C. Then a large variation occurs as the time increases as shown in Figure 9(a). As seen in Figure 9(c) and (d) that the maximum temperature appears in the center of each cell. Also, the manufacturer's design maximum temperature of cells is surpassed at 766 s.
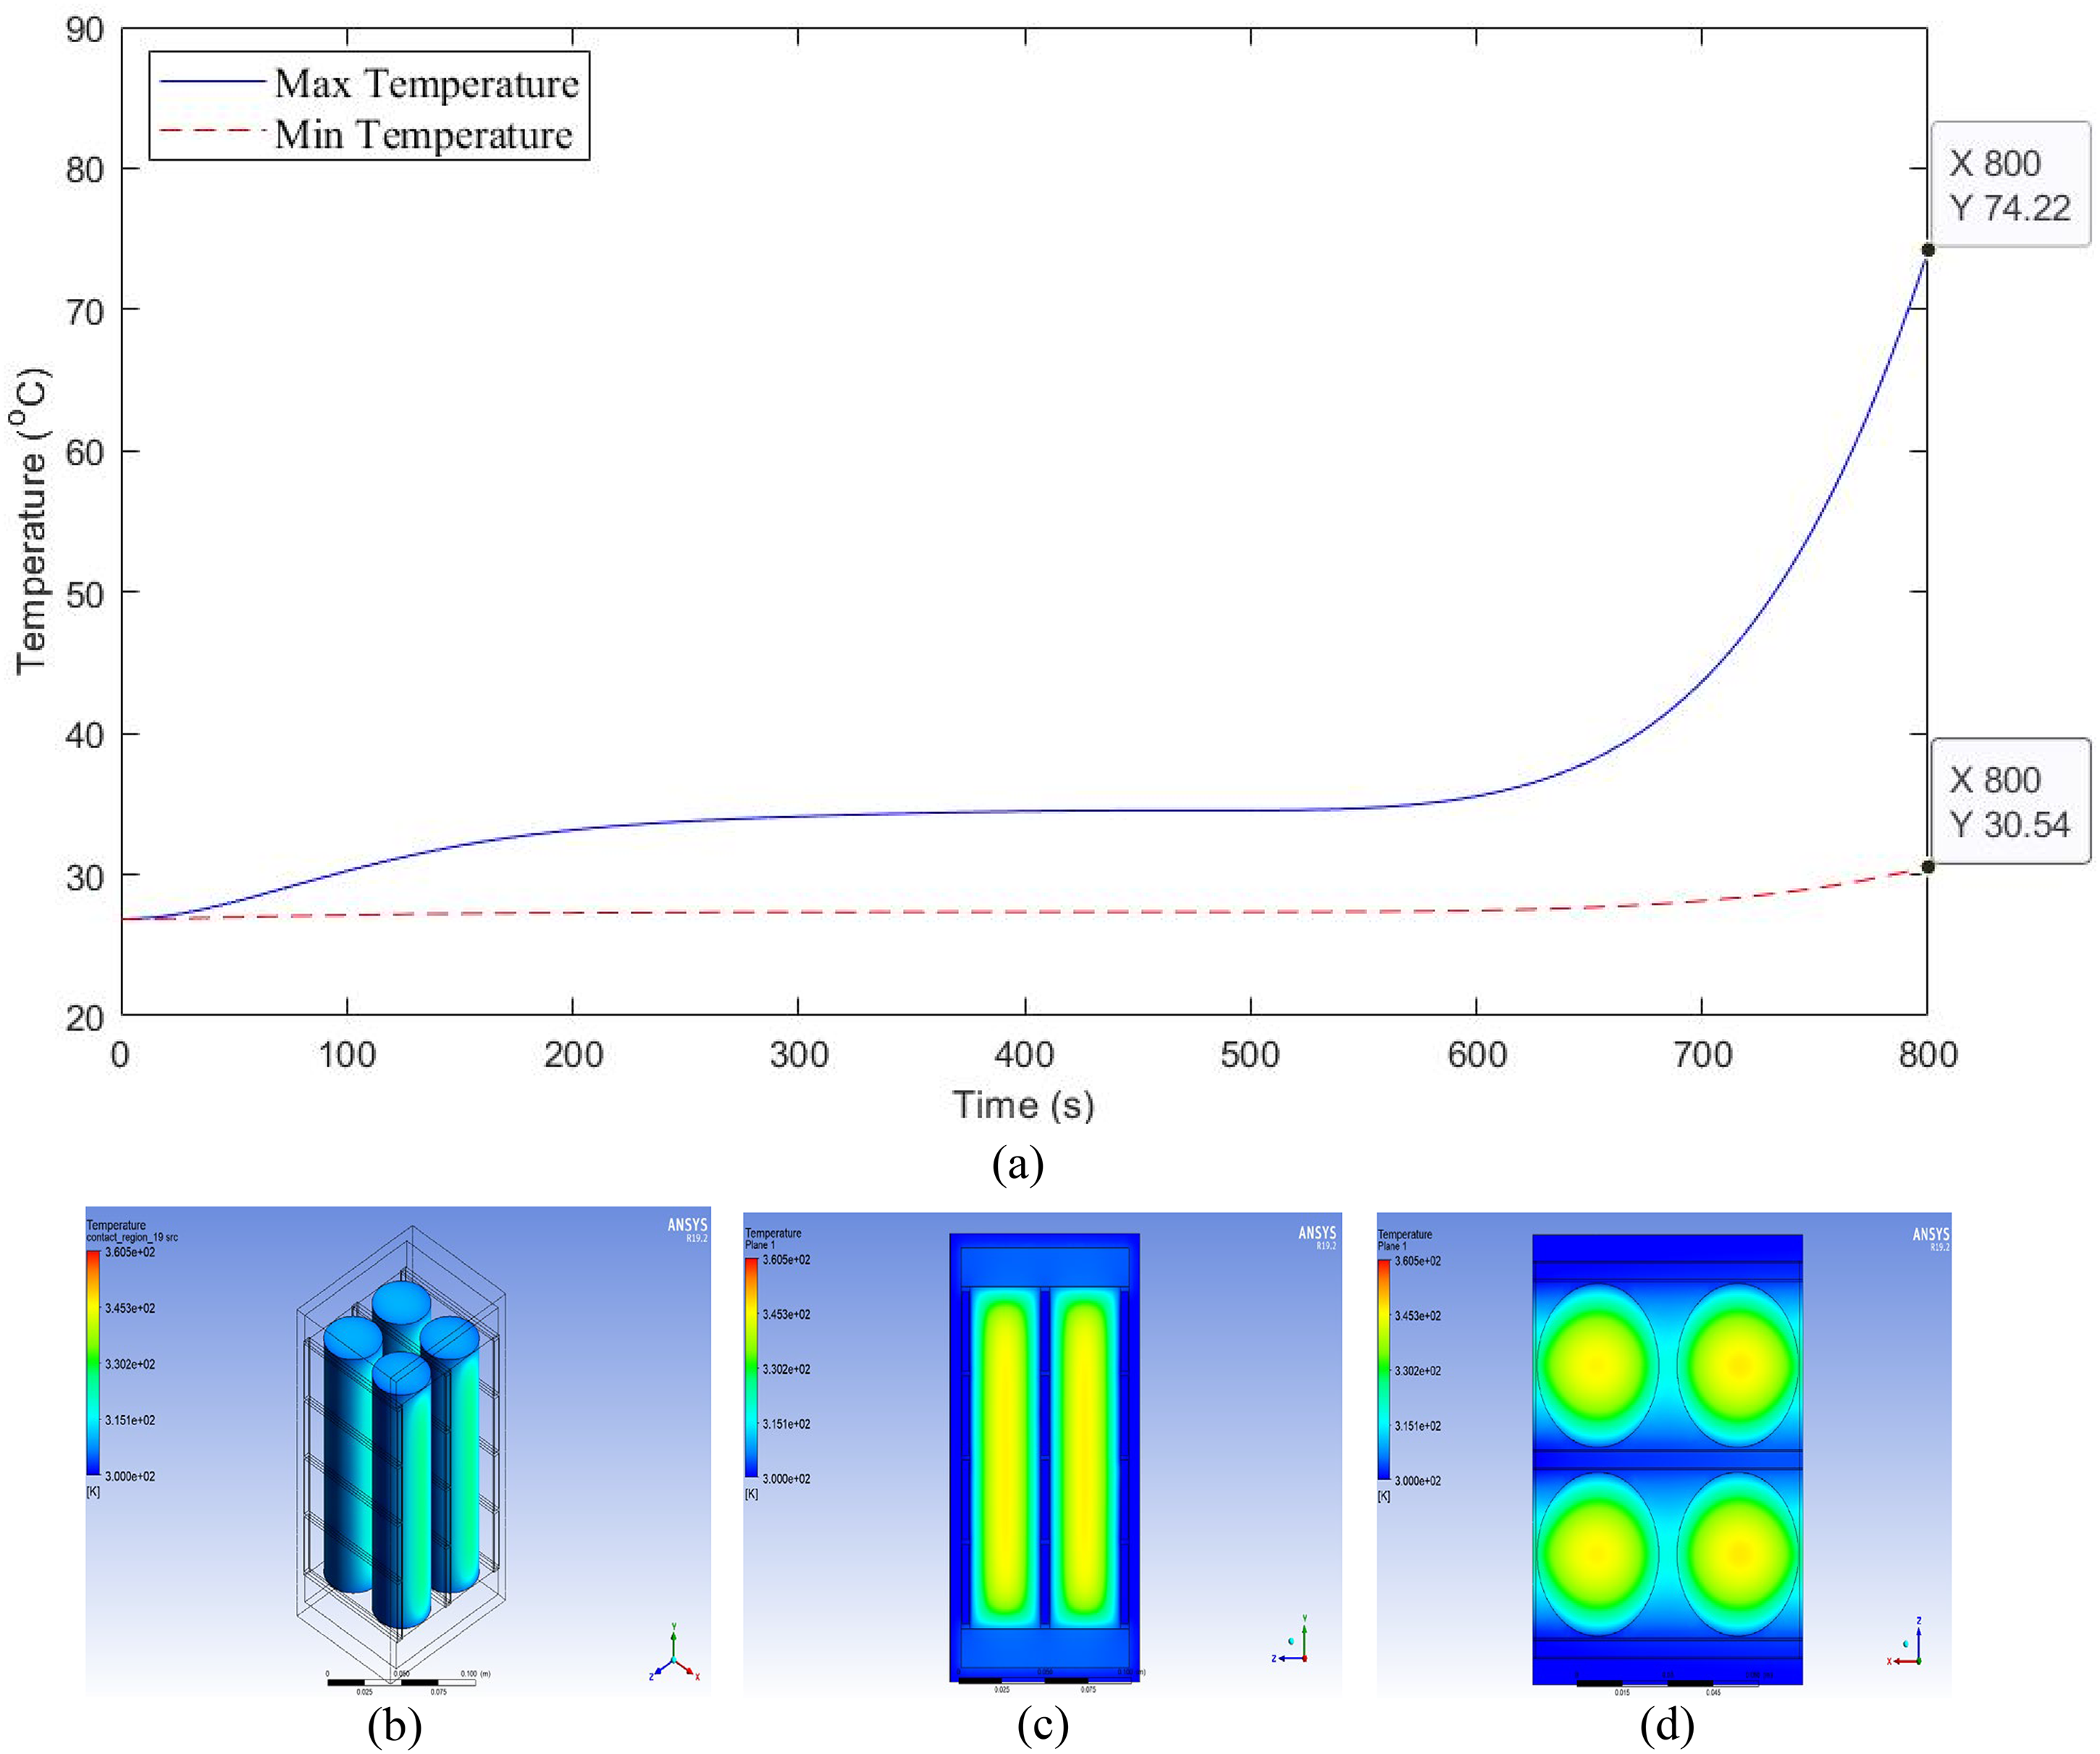
(a) Temperature profile of the battery, (b) temperature contours at the surface, (c) temperature contours in the center of the cells (front view), and (d) temperature contours in the center of the cells (top view).
For semipassive cooling using water with a complex plate configuration, the thermal performance at 800 seconds is depicted in Figure 10. Figure 10(a) shows the maximum and minimum temperatures over time, while Figure 10(b) illustrates the temperature contours on the battery cells’ surface at 800 seconds. At this moment, the maximum temperature is 74.45 °C, and the minimum temperature is 33.73 °C, resulting in a temperature gradient of 40.72 °C. This indicates a noticeable lack of thermal uniformity even with the semipassive cooling approach. The temperature disparity increases further with time, as seen in Figure 10(a). Figure 10(c) and (d) confirm that the maximum temperatures are located at the center of each cell, where heat is concentrated due to localized electrochemical activity and insufficient heat transfer efficiency. Despite the improved cooling capacity compared to the passive system, the manufacturer's specified maximum temperature limit of 60 °C is exceeded at approximately 766 seconds, highlighting the need for enhanced cooling strategies to maintains a battery operation under semipassive configurations.
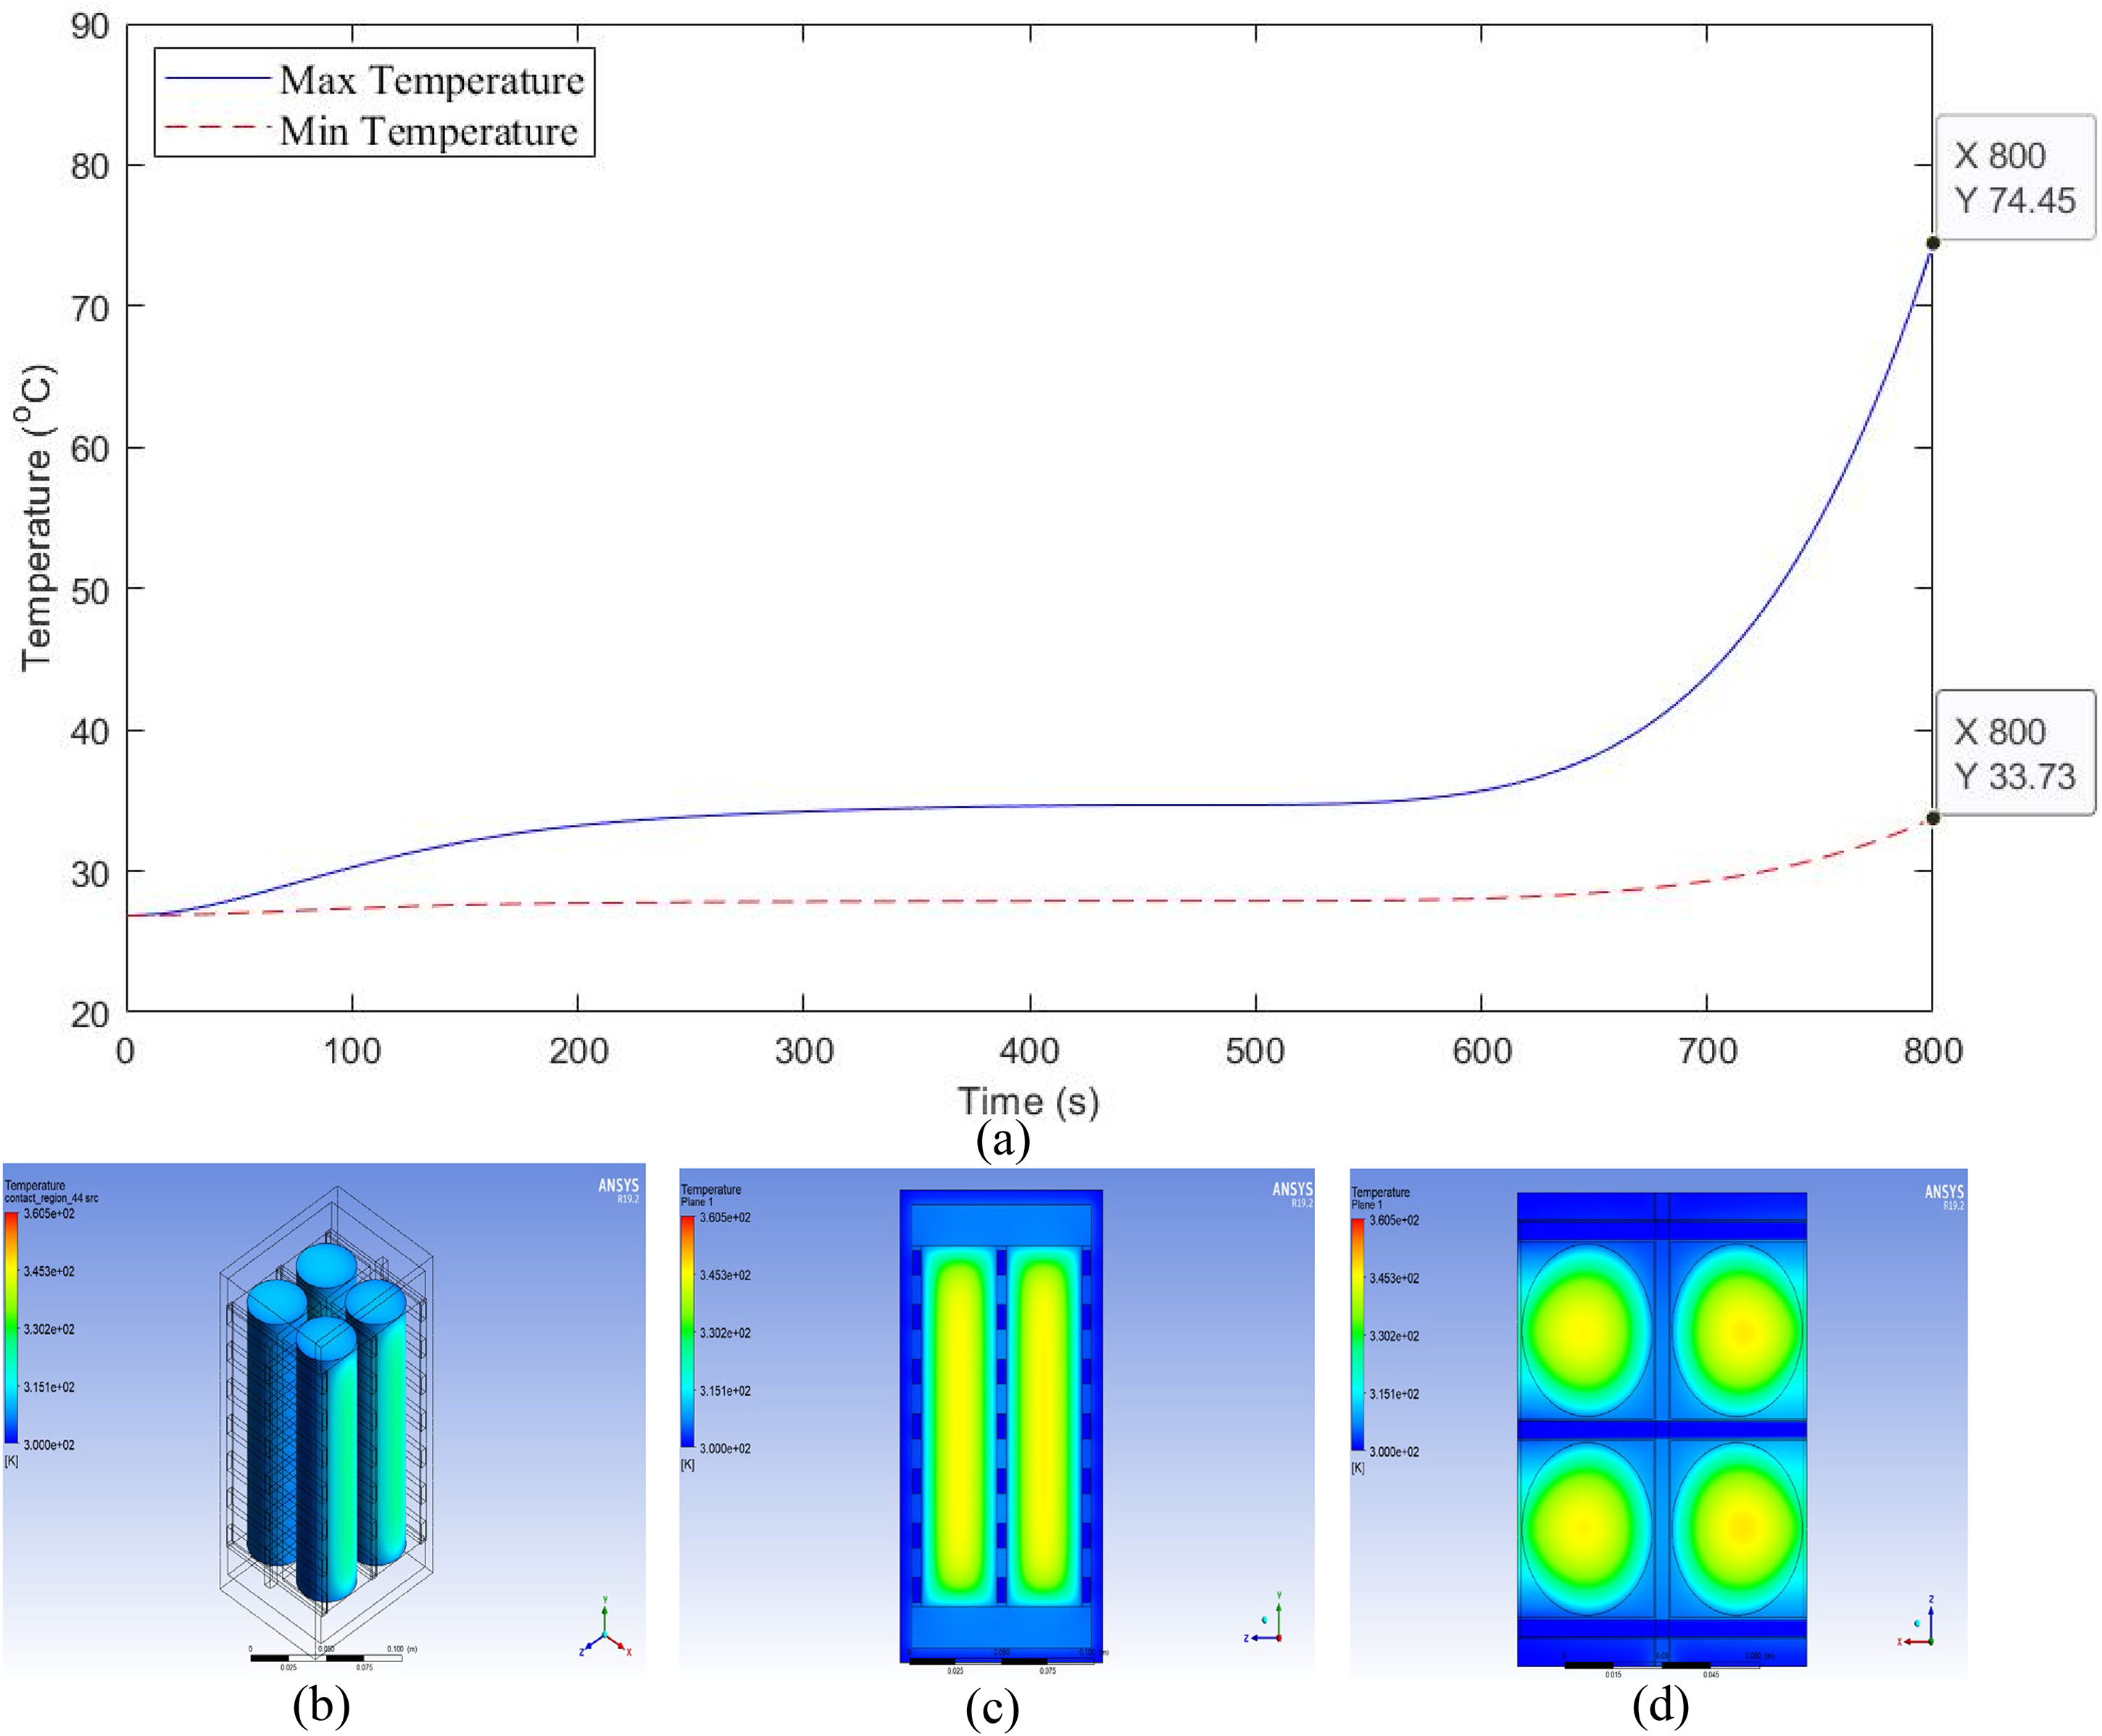
(a) Temperature profile of the battery, (b) temperature distribution contours at the surface, (c) temperature contours in the center of the cells (front view), and (d) temperature contours in the center of the cells (top view).
Finally, a cold plate was added instead of the three plates allowing the nanofluid to pass through the model in two dimensions. The resulting maximum and minimum temperatures at 800 s are shown in Figure 11(a), the temperature contours of the battery cells’ surface at 800 s are shown in Figure 11(b). Here at 800 s, the maximum temperature is 73.03 °C and the minimum temperature is 31.27 °C. The temperature semiconstancy raises to 41.76 °C. Then a large variation occurs as the time increases as shown in Figure 11(a). As seen in Figure 11(c) and (d) that the maximum temperature appears in the center of each cell. Also, the manufacturer's design maximum temperature of cells is surpassed at 768 s.
(a) Temperature profile of the battery, (b) temperature contours at the surface, (c) temperature contours in the center of the cells (front view), and (d) temperature contours in the center of the cells (top view).
The comparison between the results for different models is shown in Tables 4 to 7, and the comparison between the curves is shown in Figure 12(a). Also, the comparison between curves at zoomed at 800 s is viewed in Figure 12(b).
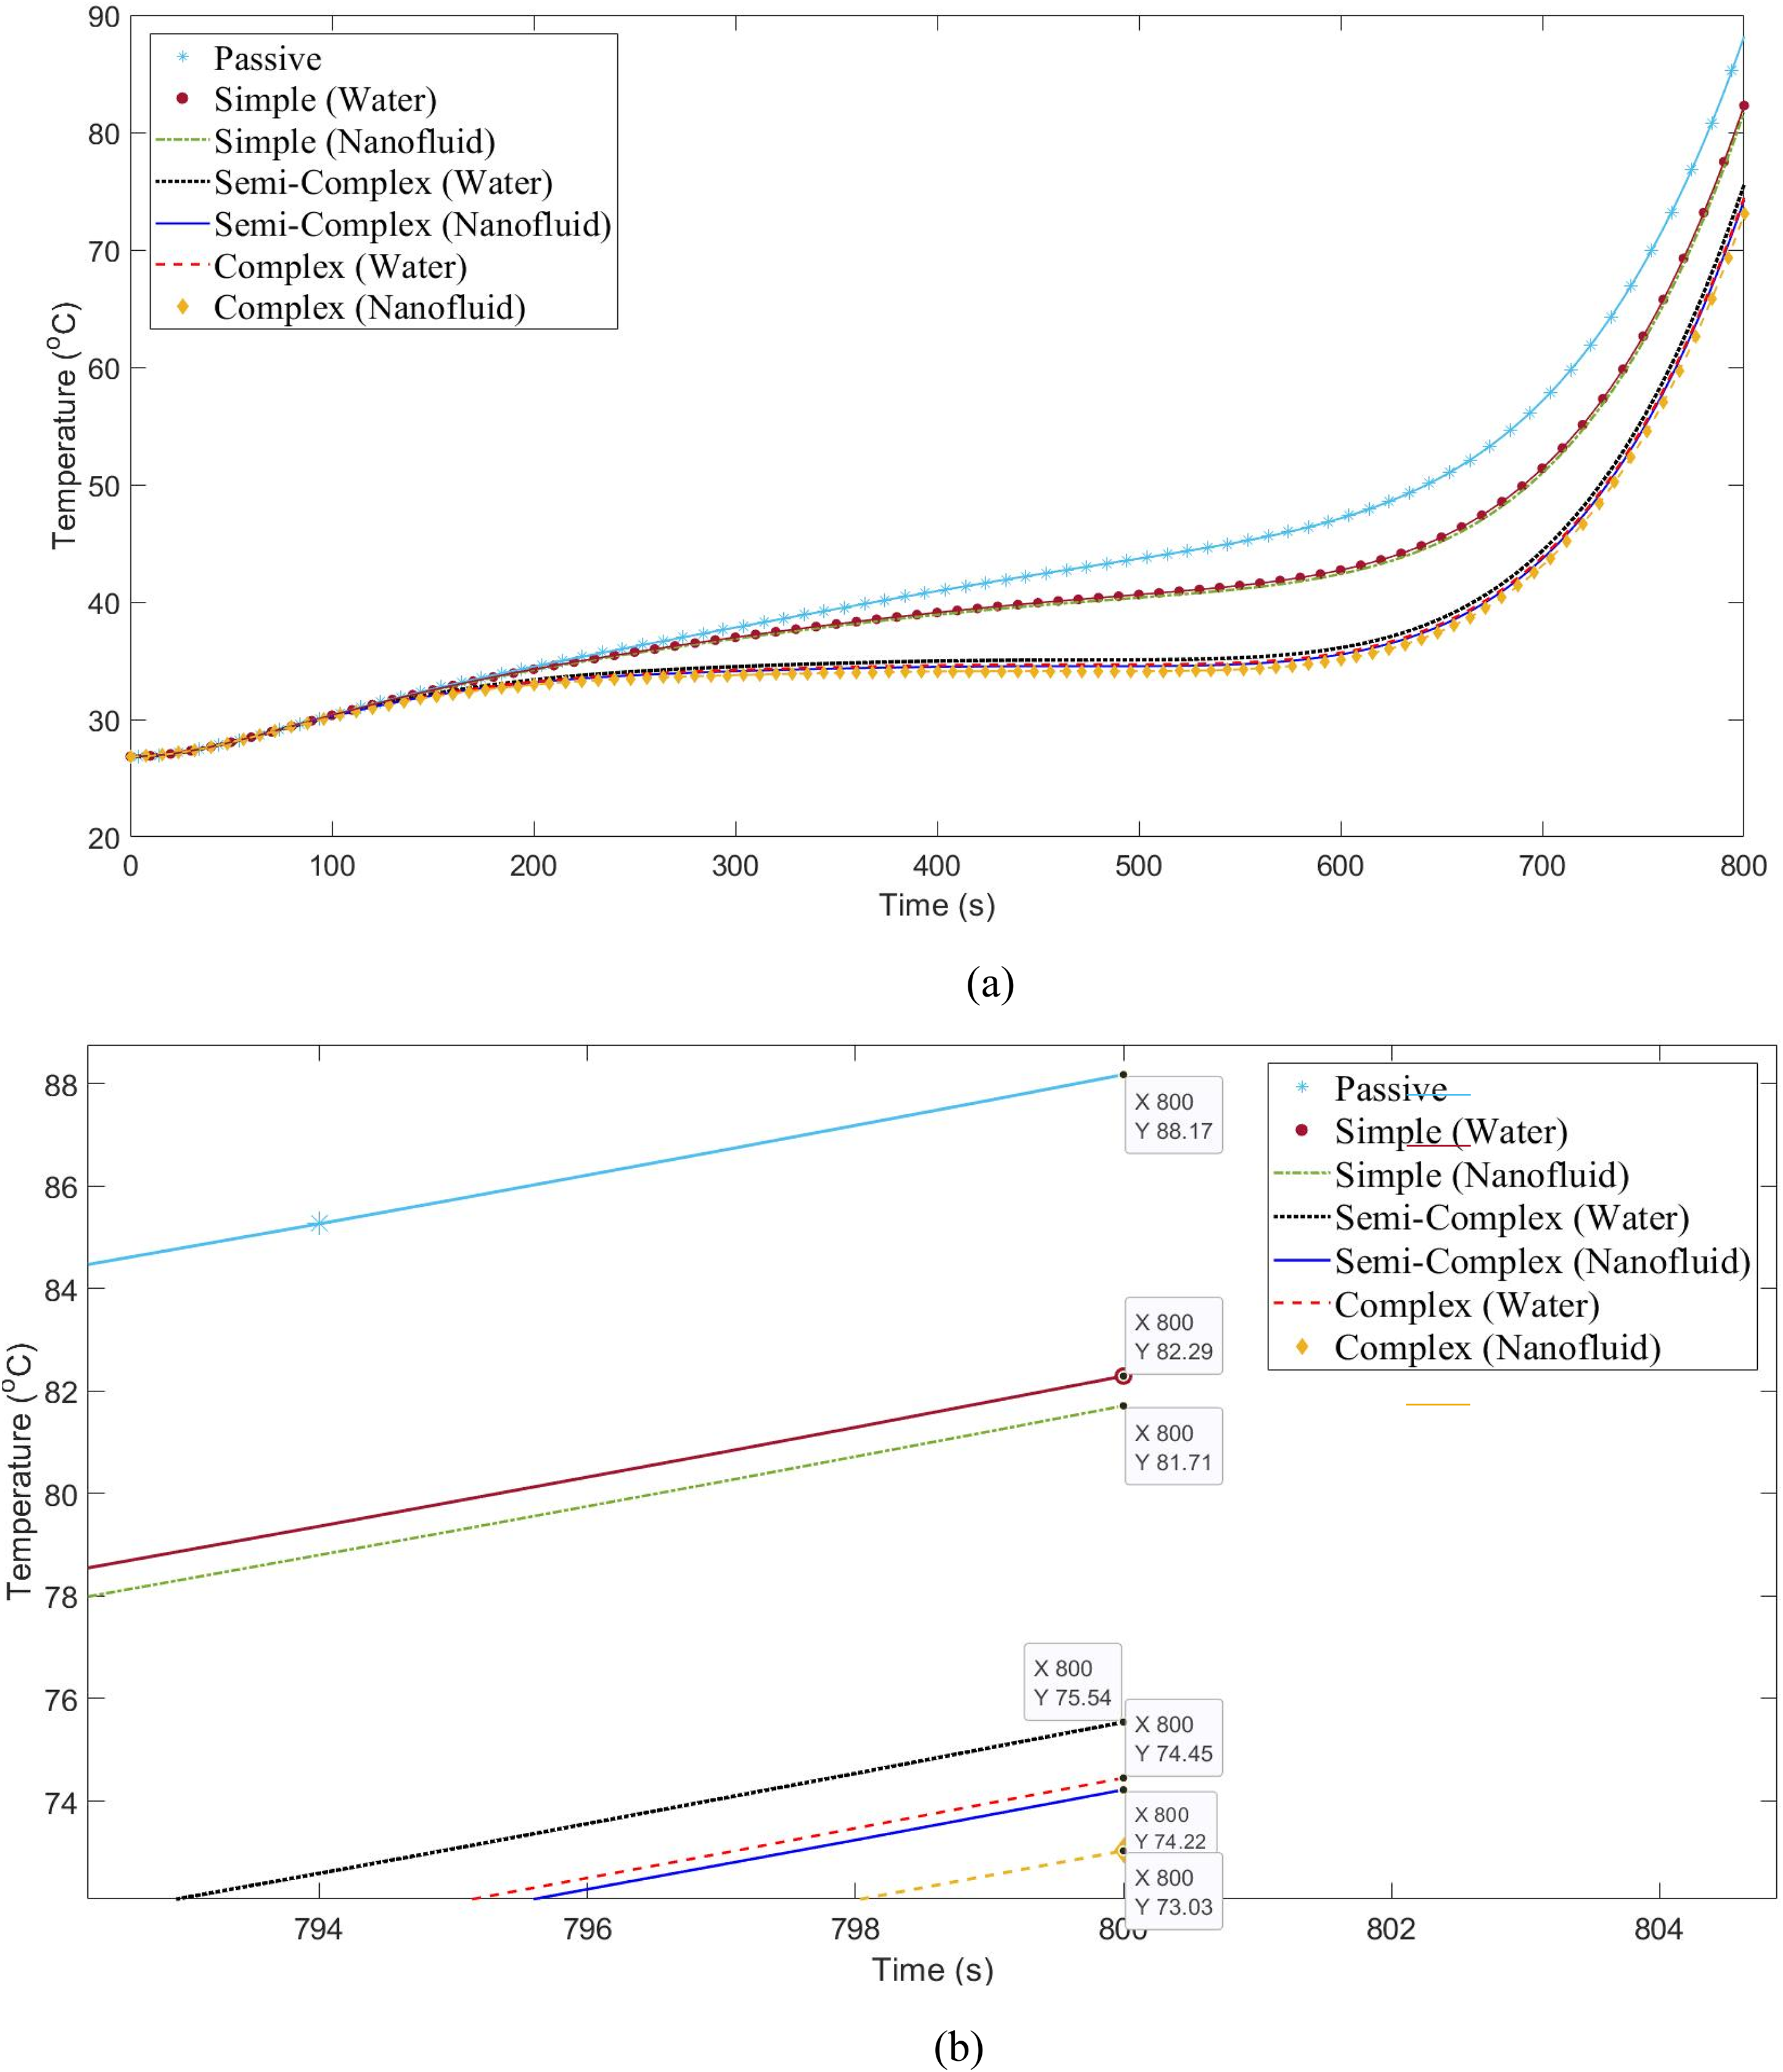
(a) Comparison between curves at 800 s maximum temperature and (b) comparison between curves at 800 s maximum temperature in zoomed view.
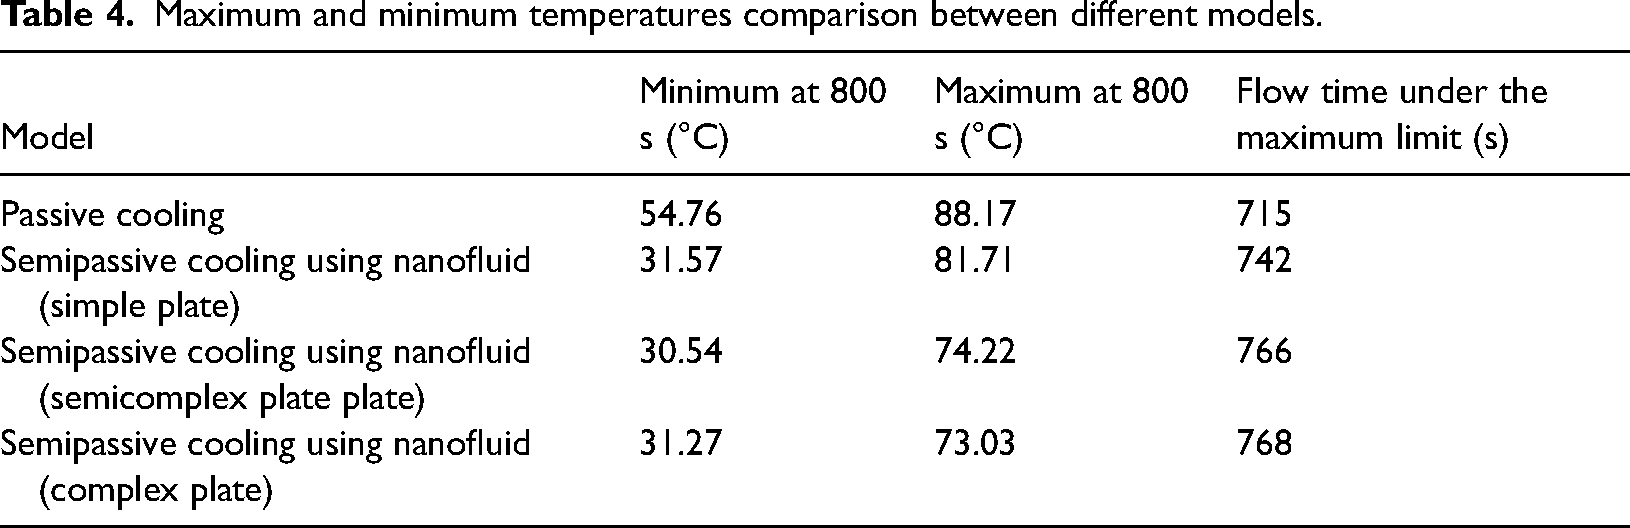
Maximum and minimum temperatures comparison between different models.
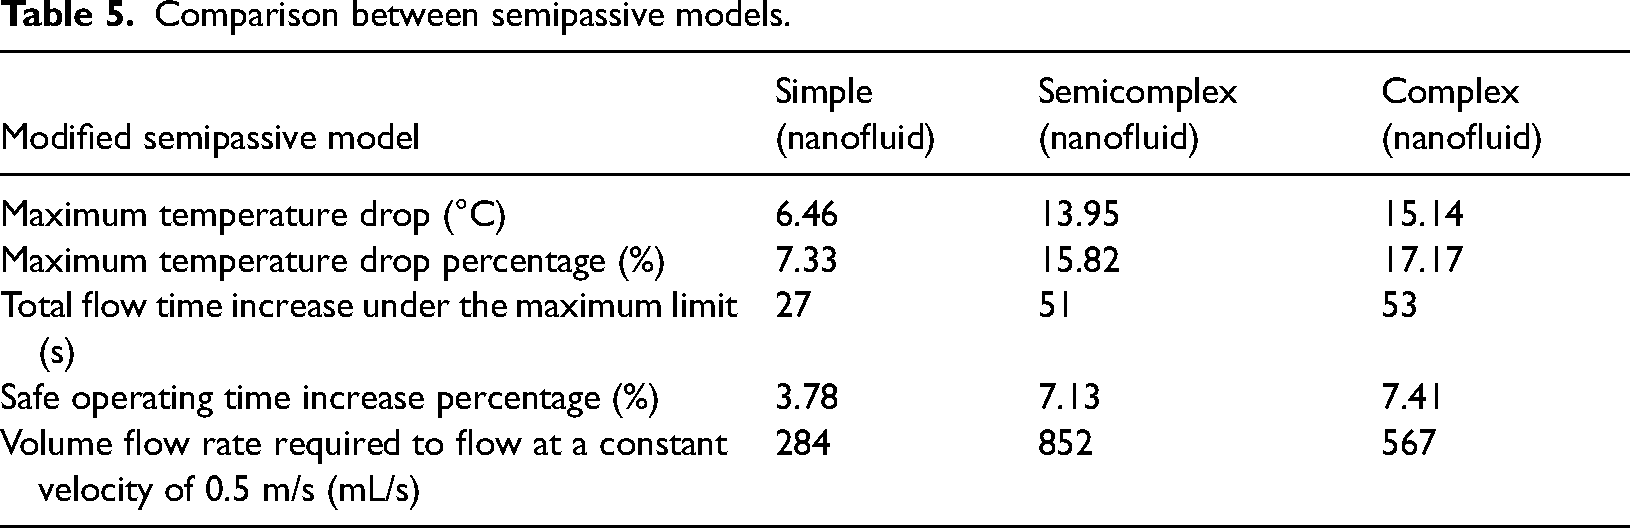
Comparison between semipassive models.
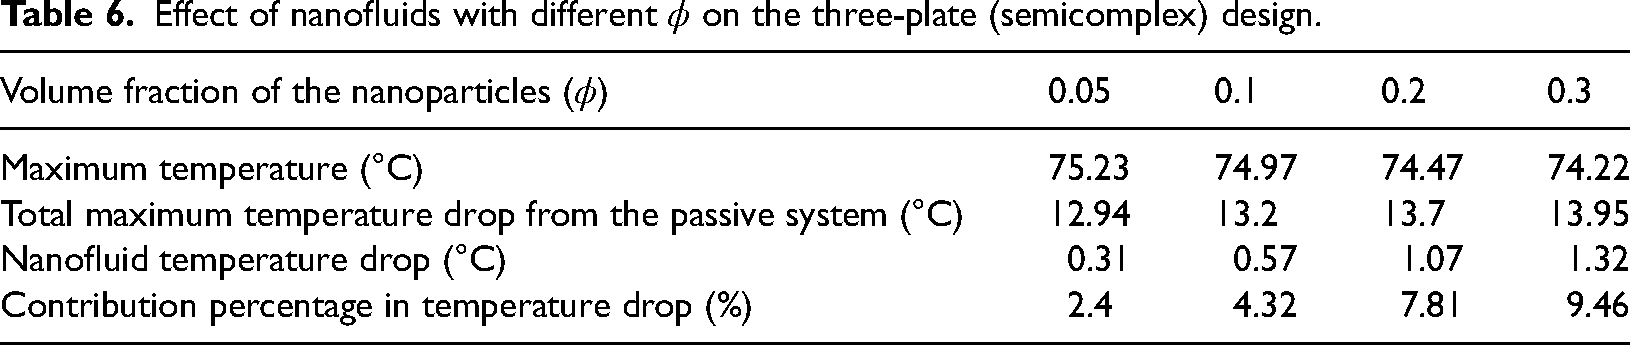
Effect of nanofluids with different ϕ on the three-plate (semicomplex) design.
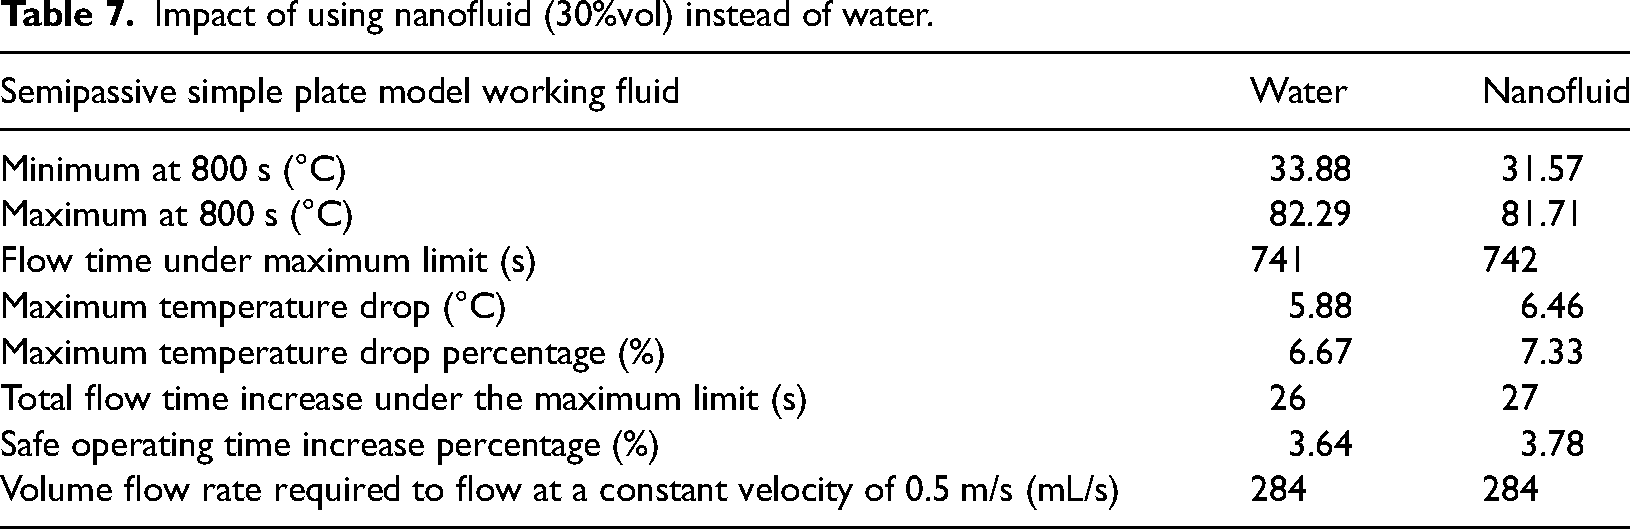
Impact of using nanofluid (30%vol) instead of water.
The Figures 5 to 11 above represent the results obtained after performing simulations using ANSYS Fluent for different thermal management models for batteries operating under the loading condition of 960 W. Each figure has a graph that has two lines that represent the change of maximum and minimum temperatures with time during the simulations. Also, each figure has three temperature contours of the final results with the same temperature range to easily compare them visually. The data from the graphs for each model was collected and inserted into Tables 4 to 7, and Figure 12 to facilitate the comparison and analysis. The passive system is used as reference to compare with the semipassive models.
Table 7 shows the effect of nanofluid concentrations of nanoparticles on the cooling performance in the three-plate (semicomplex) system, where nanoparticles of volume fractions of 5%, 10%, 20%, and 30% were taken. This system was specifically selected because it shows the best reaction to the nanofluid entry of 30% volume concentration, by evidence that the nanofluid in this system has the biggest contribution in affecting the maximum temperature with 9.46% in comparison to the other semipassive systems. The least significant contribution was done by the nanofluid with the lowest nanoparticle volume fraction (5%) with 2.4%. While, on the contrary, the best contribution of 9.46% was by the nanofluid of the highest ϕ.
The passive thermal management system acquired the highest minimum and maximum temperatures at 800 s where they equal 54.76°C and 88.17°C, respectively. The gap between the maximum and minimum temperatures is the smallest with a value of 33.41°C. Moreover, it is noticed from the contours that the red color, which represents the maximum temperature, is distributed widely from the center of each battery cell.
When adding a cold plate to the system and using a nanofluid as the working fluid, the minimum and maximum temperatures dropped from 54.76°C and 88.17°C to 31.57°C and 81.71°C, respectively, at 800 s. Taking the results at 800 s, the maximum temperature dropped 6.46°C which is about 7.33% drop of the passive case, and the gap between the maximum and minimum temperatures increased to 50.14°C.
Then, another simulation was made using water in order to study the improvement in the cooling efficiency when using the nanofluid. Using the later caused the minimum and maximum temperatures to drop slightly below the water-based result by a 2.31°C and 0.58°C drop, respectively, where it contributed with only 8.98% of the total maximum temperature drop from the passive system. Moreover, it is noticed from the contours that the red color has dimmed and has covered less area compared with the passive system results.
By incorporating two additional plates of the same geometry on either side of the single cold plate, the cooling performance significantly improved. At 800 seconds, the minimum and maximum temperatures were reduced to 30.54 °C and 74.22 °C, respectively. This corresponds to a 13.95 °C reduction in the maximum temperature compared to the passive system, representing a 15.82% improvement. Despite the enhancements, the temperature gradient between the maximum and minimum values widened slightly to 43.68 °C, indicating localized areas of higher temperature persist but are less severe overall.
The temperature contours reveal a substantial reduction in high-temperature regions, with the red zones almost entirely eliminated and yellow regions becoming predominant. This shift signifies improved heat dissipation across the battery cells, as the additional plates increase the surface area for heat exchange, enhancing the system's ability to manage thermal loads effectively.
Regarding fluid dynamics, the simulation showed that the total fluid volume inside the plates at any given moment is approximately 151.656 mL, requiring a flow rate of 852 mL/s to maintain a flow velocity of 0.5 m/s. This flow rate is three times higher than that required by the simple semipassive system, reflecting the increased complexity and demands of the multiplate configuration. The higher flow rate ensures adequate fluid velocity for efficient heat transfer, preventing hotspots, and maintaining thermal uniformity across the system.
This configuration demonstrates the potential for semipassive cooling systems to achieve significant thermal management improvements by optimizing the geometry and flow conditions. However, the increased fluid requirements highlight the need for robust pumping mechanisms and careful consideration of energy consumption associated with maintaining higher flow rates.
Finally, by replacing the single cold plate with a complex plate employing two-dimensional flow, the cooling performance was further optimized. At 800 seconds, the minimum and maximum temperatures decreased to 31.27 °C and 73.03 °C, respectively. This corresponds to a 15.14 °C reduction in the maximum temperature compared to the passive system, achieving a 17.17% improvement. The temperature gradient between the maximum and minimum values narrowed to 41.76 °C, indicating improved thermal uniformity compared to both the passive system and other semipassive configurations.
The temperature contours provide a clear visual representation of the enhanced performance. The red regions (indicating the highest temperatures) are almost entirely eliminated, while the yellow regions dominate the surface of the battery cells. This dominance of yellow indicates a more evenly distributed and lower temperature profile, similar to the three-plate configuration but with further improvements due to the complex plate's enhanced flow distribution.
The fluid dynamics reveal that the total volume of fluid inside the plates at any given instance during simulation is approximately 106.168 mL, requiring a flow rate of 576 mL/s to maintain a flow velocity of 0.5 m/s. This flow rate is lower than that of the three-plate system, highlighting the efficiency of the complex plate in utilizing a two-dimensional flow pattern to achieve superior thermal performance with reduced fluid demand.
The two-dimensional flow design allows for more uniform cooling by minimizing flow stagnation zones and enhancing heat transfer across the entire plate surface. This improvement underscores the potential of advanced plate geometries in achieving high-performance cooling with optimized resource utilization, making the complex plate configuration a promising solution for battery thermal management under high loading conditions.
Conclusions
This study evaluates different thermal management systems for battery cooling, revealing significant variations in performance. The passive system demonstrated the least effective cooling, with maximum and minimum temperatures significantly higher than other methods, and a safe operational limit of only 715 seconds. In contrast, the complex plate design with nanofluid as the working fluid achieved the most effective cooling, reducing the maximum temperature by 15.14 °C compared to the passive system and extending the safe operating time by 53 seconds (7.41%). Among semipassive systems, the modified complex plate design showed the highest improvement, achieving a 17.17% temperature reduction, while the three-plate system achieved a 15.82% reduction. However, the latter consumed more power due to increased flow demands, highlighting a tradeoff between thermal performance and energy efficiency.
This research introduces a novel approach by comparing advanced configurations, particularly emphasizing the impact of flow distribution on cooling efficiency over flow quantity. The results underline the importance of optimizing plate design and working fluid selection to balance performance and energy consumption.
Despite these promising findings, the study has limitations. The simulations focused on idealized conditions, and real-world factors such as manufacturing tolerances and environmental influences were not considered. Future work could involve experimental validation, incorporating dynamic battery cycling scenarios, and exploring alternative nanofluids to enhance cooling performance further. Overall, this study contributes valuable insights into the design of efficient battery thermal management systems, providing a foundation for developing more reliable and energy-efficient solutions.
Footnotes
Notation
Declaration of conflicting interests
The authors declared no potential conflicts of interest with respect to the research, authorship, and/or publication of this article.
Funding
The authors received no financial support for the research, authorship, and/or publication of this article.