
Abstract
This study provides a climatological assessment of wind resources in Chad using 100-m wind data from the ERA5 reanalysis. The results highlight spatio-temporal variations in wind potential, Enabling the identification of climate zones suitable for wind farm development. Wind speeds range from 1.5 to 11 m/s, with increasing gradients from south to north. Maximum wind speeds are observed between autumn and spring, particularly from October to April, while minimum speeds, below 5 m/s, occur during the wet season. A distinct diurnal cycle is noted, with nighttime wind speeds averaging 26% higher than daytime speeds. Winds predominantly blow in favorable directions, primarily toward the northeast. The study indicates that almost the entire northern region of Chad (north of 15°N latitude) is particularly favorable for wind farm installations, except for areas around the Tibesti mountain range, where wind speeds remain low due to the presence of a permanent anticyclone. Three zones are identified as particularly promising: the region around Faya, the far northeastern part of the country, and the area around Amjarass. Additionally, long-term analysis reveals a slight decrease in 100-m wind speeds, possibly linked to the increased frequency of La Niña events over the past decade. In conclusion, this study provides a comprehensive assessment of Chad's wind potential, emphasizing that the most suitable areas are located between the Saharan and Sahelian zones.
Introduction
The transition to renewable energy sources has become a crucial issue in addressing climate change and promoting sustainable development. In Africa, renewable energy resources, particularly wind power, are largely underutilized, despite favorable climatic conditions in many regions. Chad, although primarily an oil-producing country, is at a pivotal point where the gradual integration of renewable energy becomes a strategic necessity. This shift is essential for diversifying energy sources to address environmental challenges and, most importantly, to improve electricity access for the population. Although Chad exploits its fossil resources, electricity access remains limited for the population. Indeed, in 2022, the electrification rate in Chad is approximately 11.3% of the total population (Verhoeven and Pouget-Abadie, 2024). However, there is a significant disparity between urban and rural areas. In urban areas, approximately 33% of the population has access to electricity, while in rural areas, this figure drops to around 1.3% (Abdoulaye et al., 2024). According to a comparison of the Social Clean Energy Access Index (Social CEA) across 35 sub-Saharan African countries, Chad ranks the lowest (Casati et al., 2023).
The exploitation of oil resources contributes to greenhouse gas emissions and environmental degradation. In this context, the development of renewable energy sources, such as wind and solar, not only represents an opportunity to diversify energy sources but also becomes essential for reducing the country's carbon footprint and promoting more sustainable development (Mulopo, 2022). Meanwhile, Chad faces major challenges in electricity access, with one of the lowest electricity access rates globally (World Bank, 2021). This situation is particularly concerning in rural areas, where energy infrastructure is insufficient. The development of renewable energy, particularly wind power, could play a key role in enhancing electricity access by providing a sustainable and locally available solution to meet the growing energy needs of Chad population (Bishoge et al., 2020). Chad is characterized by significant climatic diversity, ranging from Sahelian zones to the desert regions of the Sahara. This climatic diversity across the country translates into varying wind characteristics by region. In southern Chad, climatic conditions are influenced by the Atlantic and seasonal rains, whereas the northern and northeastern areas experience more arid and desert-like conditions, where winds can reach higher speeds and exhibit significant seasonal variability (Medjo Nouadje et al., 2024; Washington et al., 2006). This variability presents unique opportunities for establishing wind farms in specific areas, thereby optimizing the use of the country's natural resources. Accurate wind resource assessment is essential for the effective planning and implementation of wind energy projects. The availability of high-resolution data, such as that from the ERA5 reanalysis, enables detailed analysis of wind conditions across different spatial and temporal scales. The ERA5 reanalysis, produced by the European Centre for Medium-Range Weather Forecasts (ECMWF), offers high-resolution reanalyzed climate data, providing a robust basis for evaluating wind resources in under-researched regions like Chad (ECMWF, 2017). Previous studies on wind energy in Sub-Saharan Africa have largely focused on coastal countries or regions with favorable climatic conditions, such as West and East Africa (Pan et al., 2023). However, landlocked countries like Chad, with its unique climatic features, have received less attention. For example, seasonal wind regimes in the northern desert regions of Chad offer significant wind potential despite the associated logistical and environmental challenges (Elsner, 2019; Pabame et al., 2018).
Chad has recently advanced in wind energy with the Amjarass Wind Farm project. Located in the northern part of the country, this project highlights the region's substantial wind potential, characterized by strong and consistent winds, and serves as a model for similar future initiatives (Didane et al., 2017; Sterl et al., 2022). Indeed, the Amjarass Wind Farm represents a significant advancement in harnessing wind resources and reflects a growing interest in renewable energy development (Medjo Nouadje et al., 2024).
The aim of this study is to enhance the documentation of wind resources in Chad by utilizing wind data at 100 m from the ERA5 reanalysis. This analysis will investigate variations in wind speeds and directions across different climatic zones and seasons. By providing a detailed assessment of wind resources, this research will address the existing information gap and support the strategic planning of wind energy development in the region, complementing the oil industry and electrification efforts (Lemoalle et al., 2012; Sterl et al., 2022). The findings will be crucial for policymakers, energy planners, and investors interested in renewable energy development in Chad. By identifying high-potential wind areas, this research will offer essential information for the country's sustainable development and improved electricity access, aligning with global goals for reducing greenhouse gas emissions (Akinsanola et al., 2021; Sawadogo et al., 2021).
Data and methods
Presentation of the study area
The study area focuses on the Republic of Chad, a country located in Central Africa. Chad is bordered by Libya to the north, Sudan to the east, the Central African Republic to the south, and Cameroon, Nigeria, and Niger to the west.
Figure 1 displays the map of Chad, which serves as the focus of our study. For this analysis, we have subdivided the country using two approaches. The first divides the country into two main zones (north and south) with a red line located around latitude 13.5°N. The second subdivision is more detailed and is based on the country's climatic zones (Saharan, Saharo-Sahelian, Sahelian, Sahelo-Sudanian, Sudanian, and Guinean), defined according to isohyets, allowing for a more precise analysis. In each of these climatic zones, several cities have been selected for the analysis, as shown in the figure. Among these cities are Wour, Faya-Largeau, Fada, Bardai, and Ounianga-Kébir in the Saharan zone; Koro Toro, Arada, and Salal in the Saharo-Sahelian zone; Amjarass, Mao, Abéché, Ati, and Ndjamena in the Sahelian zone; Mongo and Goz Beida in the Sahelo-Sudanian zone; Amtiman, Sarh, Moundou, and Pala in the Sudanian zone; and Goré and Mbaïboukoum in the Guinean zone.
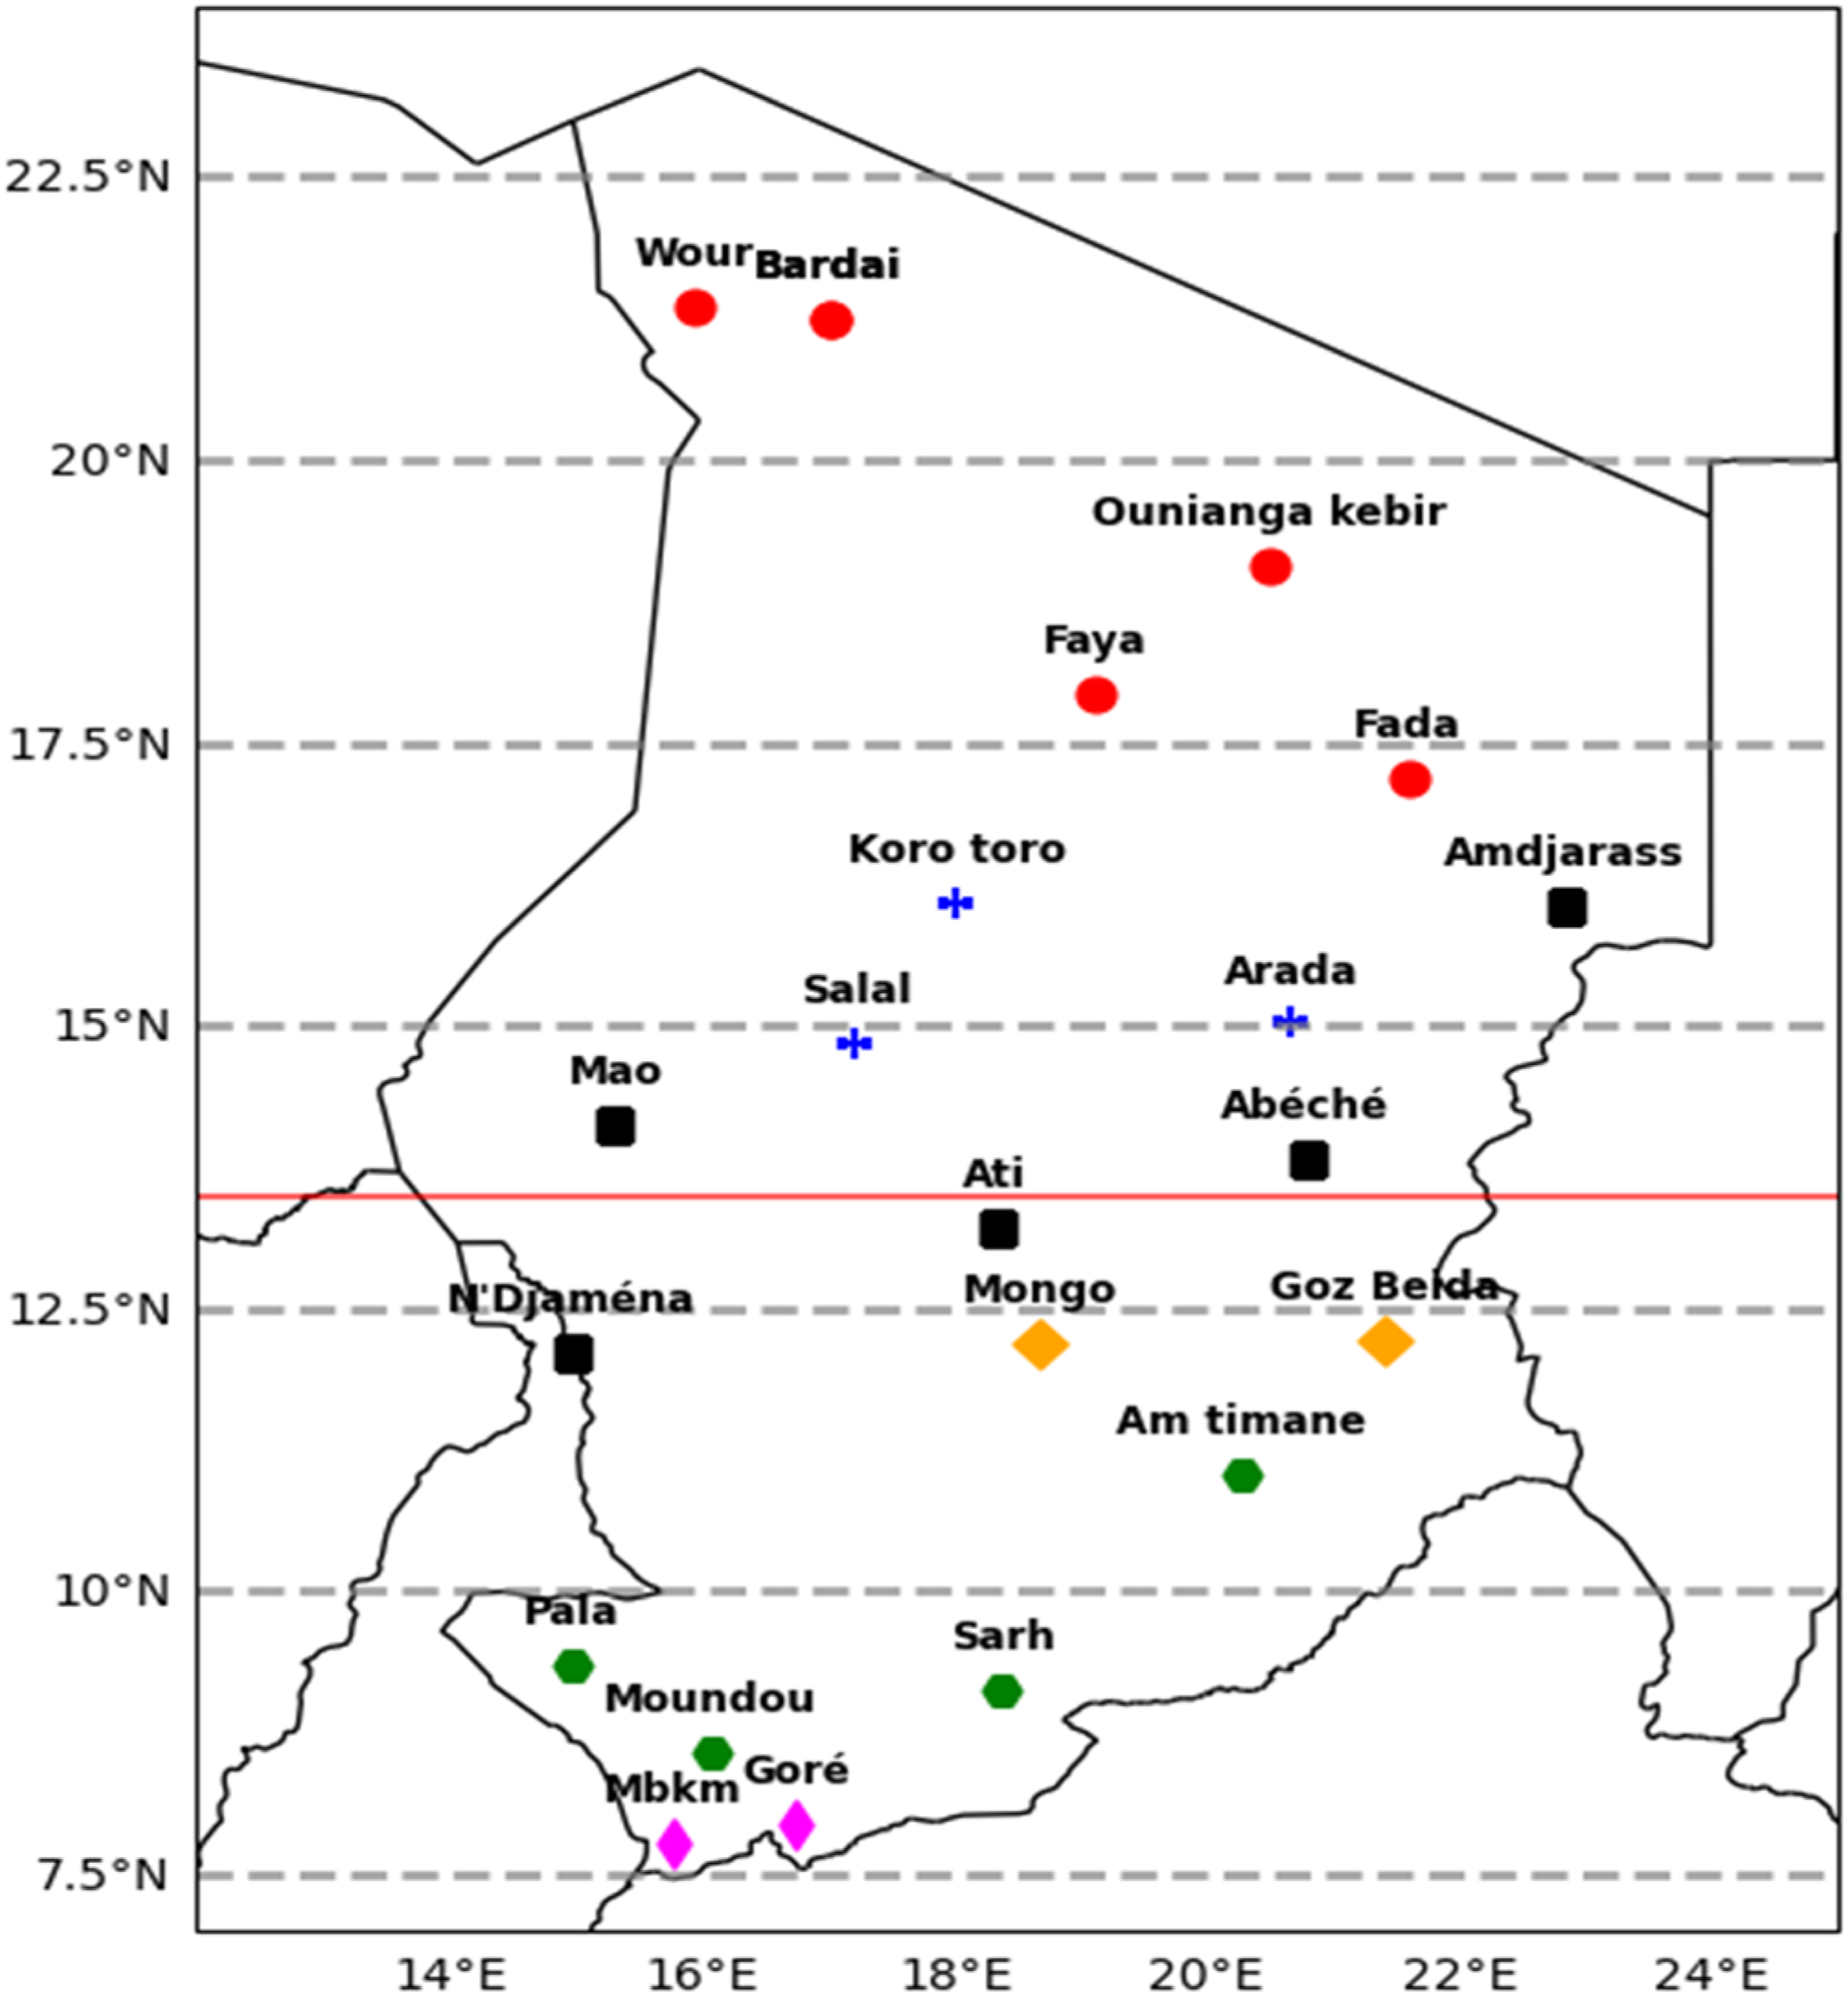
Chad highlighting the study area and the distribution of selected cities by climatic zones.
Chad, located in Central Africa, is characterized by significant geographical and climatic diversity. The country is divided into several distinct geographical regions: to the north, the Sahara Desert is characterized by expansive dunes, arid plateaus, and rugged mountain ranges; the central region is occupied by the Sahel, a semi-arid transitional zone; and to the south, the savannas provide fertile lands with dense vegetation. The topography of Chad is characterized by a high plateau in the north that gradually descends towards the central and southern regions. This gradient creates a diverse landscape that includes arid plateaus, semi-arid transitional zones, and fertile savannas (Leblanc et al., 2006). Lake Chad, located in the southwest, is a key feature of Chad's geography, although its surface area has significantly decreased due to climate change and overexploitation of water resources (Coe and Foley, 2001; Gbetkom et al., 2023). The country exhibits considerable climatic variability. The northern region, with its desert climate, is characterized by elevated temperatures and extremely low precipitation (Pattnayak et al., 2019). The central Sahel, in contrast, has a semi-arid climate with a short rainy season, typically from July to September, and a long dry season extending from September to June. The southern part of the country benefits from a tropical climate, featuring a longer rainy season from May to October and a dry season from November to April (Pyarimohan et al., 2018). Additionally, wind regimes play a crucial role in Chad's climate (Maharana et al., 2018). The Harmattan, a dry and dusty wind originating from the northeast, significantly influences the climate of the Sahel and northern regions of the country, particularly during the dry season. This wind contributes to increased dryness and dusty conditions from December to February (Anuforom, 2007). In contrast, the African monsoon, blowing from the southwest, brings essential precipitation during the rainy season and helps moderate temperatures. This wind regime has a particularly significant impact on the climate of the Sahel and southern Chad, supporting agriculture and local ecosystems (Gildor et al., 2014).
Presentation of data and methodology
ERA5 reanalysis
The 100-m wind data used in this study is sourced from the ERA5 reanalysis, developed by the European Centre for Medium-Range Weather Forecasts (ECMWF, 2017). ERA5 reanalysis provides a detailed spatiotemporal representation of atmospheric conditions, spanning from 1979 to the present day (Hersbach et al., 2020). This database is acknowledged for its reliability and high resolution, with a spatial resolution of 0.25°, enabling a precise characterization of wind regimes at the regional scale.
Each wind parameter is provided in three components: the meridional wind speed (u), the zonal wind speed (v), and the vertical component of the wind (w). For this study, we primarily utilized the wind speed at 100 m above the surface. This data is available at hourly intervals, thereby providing a detailed representation of the temporal variations in wind conditions.
The ERA5 reanalysis incorporates observations from multiple sources, including satellites, radars, ground-based weather stations, and radiosondes. These data are assimilated into a numerical weather prediction model, thereby generating a consistent and continuous representation of atmospheric fields. The combination of these features makes it a prime resource for the analysis of regional-scale wind resources.
Calculation of wind speed and direction
To characterize the wind resources in Senegal, we conducted calculations for wind speed and direction using data from the ERA5 reanalysis. To achieve this, we employed the horizontal wind components at 100 m, namely the meridional wind speed (u) and the zonal wind speed (v). These components allowed us to determine the resultant wind speed (V) as well as its direction (θ) at each point on the spatial grid (Grothe et al., 2022).
The wind speed (V) was calculated using the following formula:

This formula provided us with the total wind speed in meter per second (m/s) at 100 m above the surface.
The wind direction (θ) was calculated using the following equation.

By applying these calculations to the ERA5 reanalysis data, we were able to attain a detailed representation of wind conditions across the entirety of Senegal. This information serves as a fundamental foundation for assessing wind resources and strategically planning wind farms in the region.
Results and discussions
Topography of our study area
Figure 2 illustrates the topography of Chad, derived from the high-resolution Global 30 Arc-Second Elevation data, GTOPO30 (Danielson and Gesch, 2011). These geographical data provide detailed elevation information with a spatial resolution of approximately 1 km, making them suitable for regional-scale topographic analysis. The GTOPO30 dataset, developed by the US Geological Survey (USGS), is widely used for environmental modeling and geographic studies due to its global coverage and reliability. The results reveal that Chad's topography is generally flat, with elevations ranging from 0 to over 4000 m, showing a rising gradient toward the north and east. A significant portion of the Chadian territory lies between 300 and 600 m in elevation, while plains are mainly concentrated in the western part of the country, between latitudes 12°N and 17°N, around the regions of N'Djamena, Mao, and Salal. The highest elevations are found in the north and east, with altitudes exceeding 600 m. The highest point, Emi Koussi, is located in the Tibesti mountain range in the north of the country, between 20°N and 22°N.
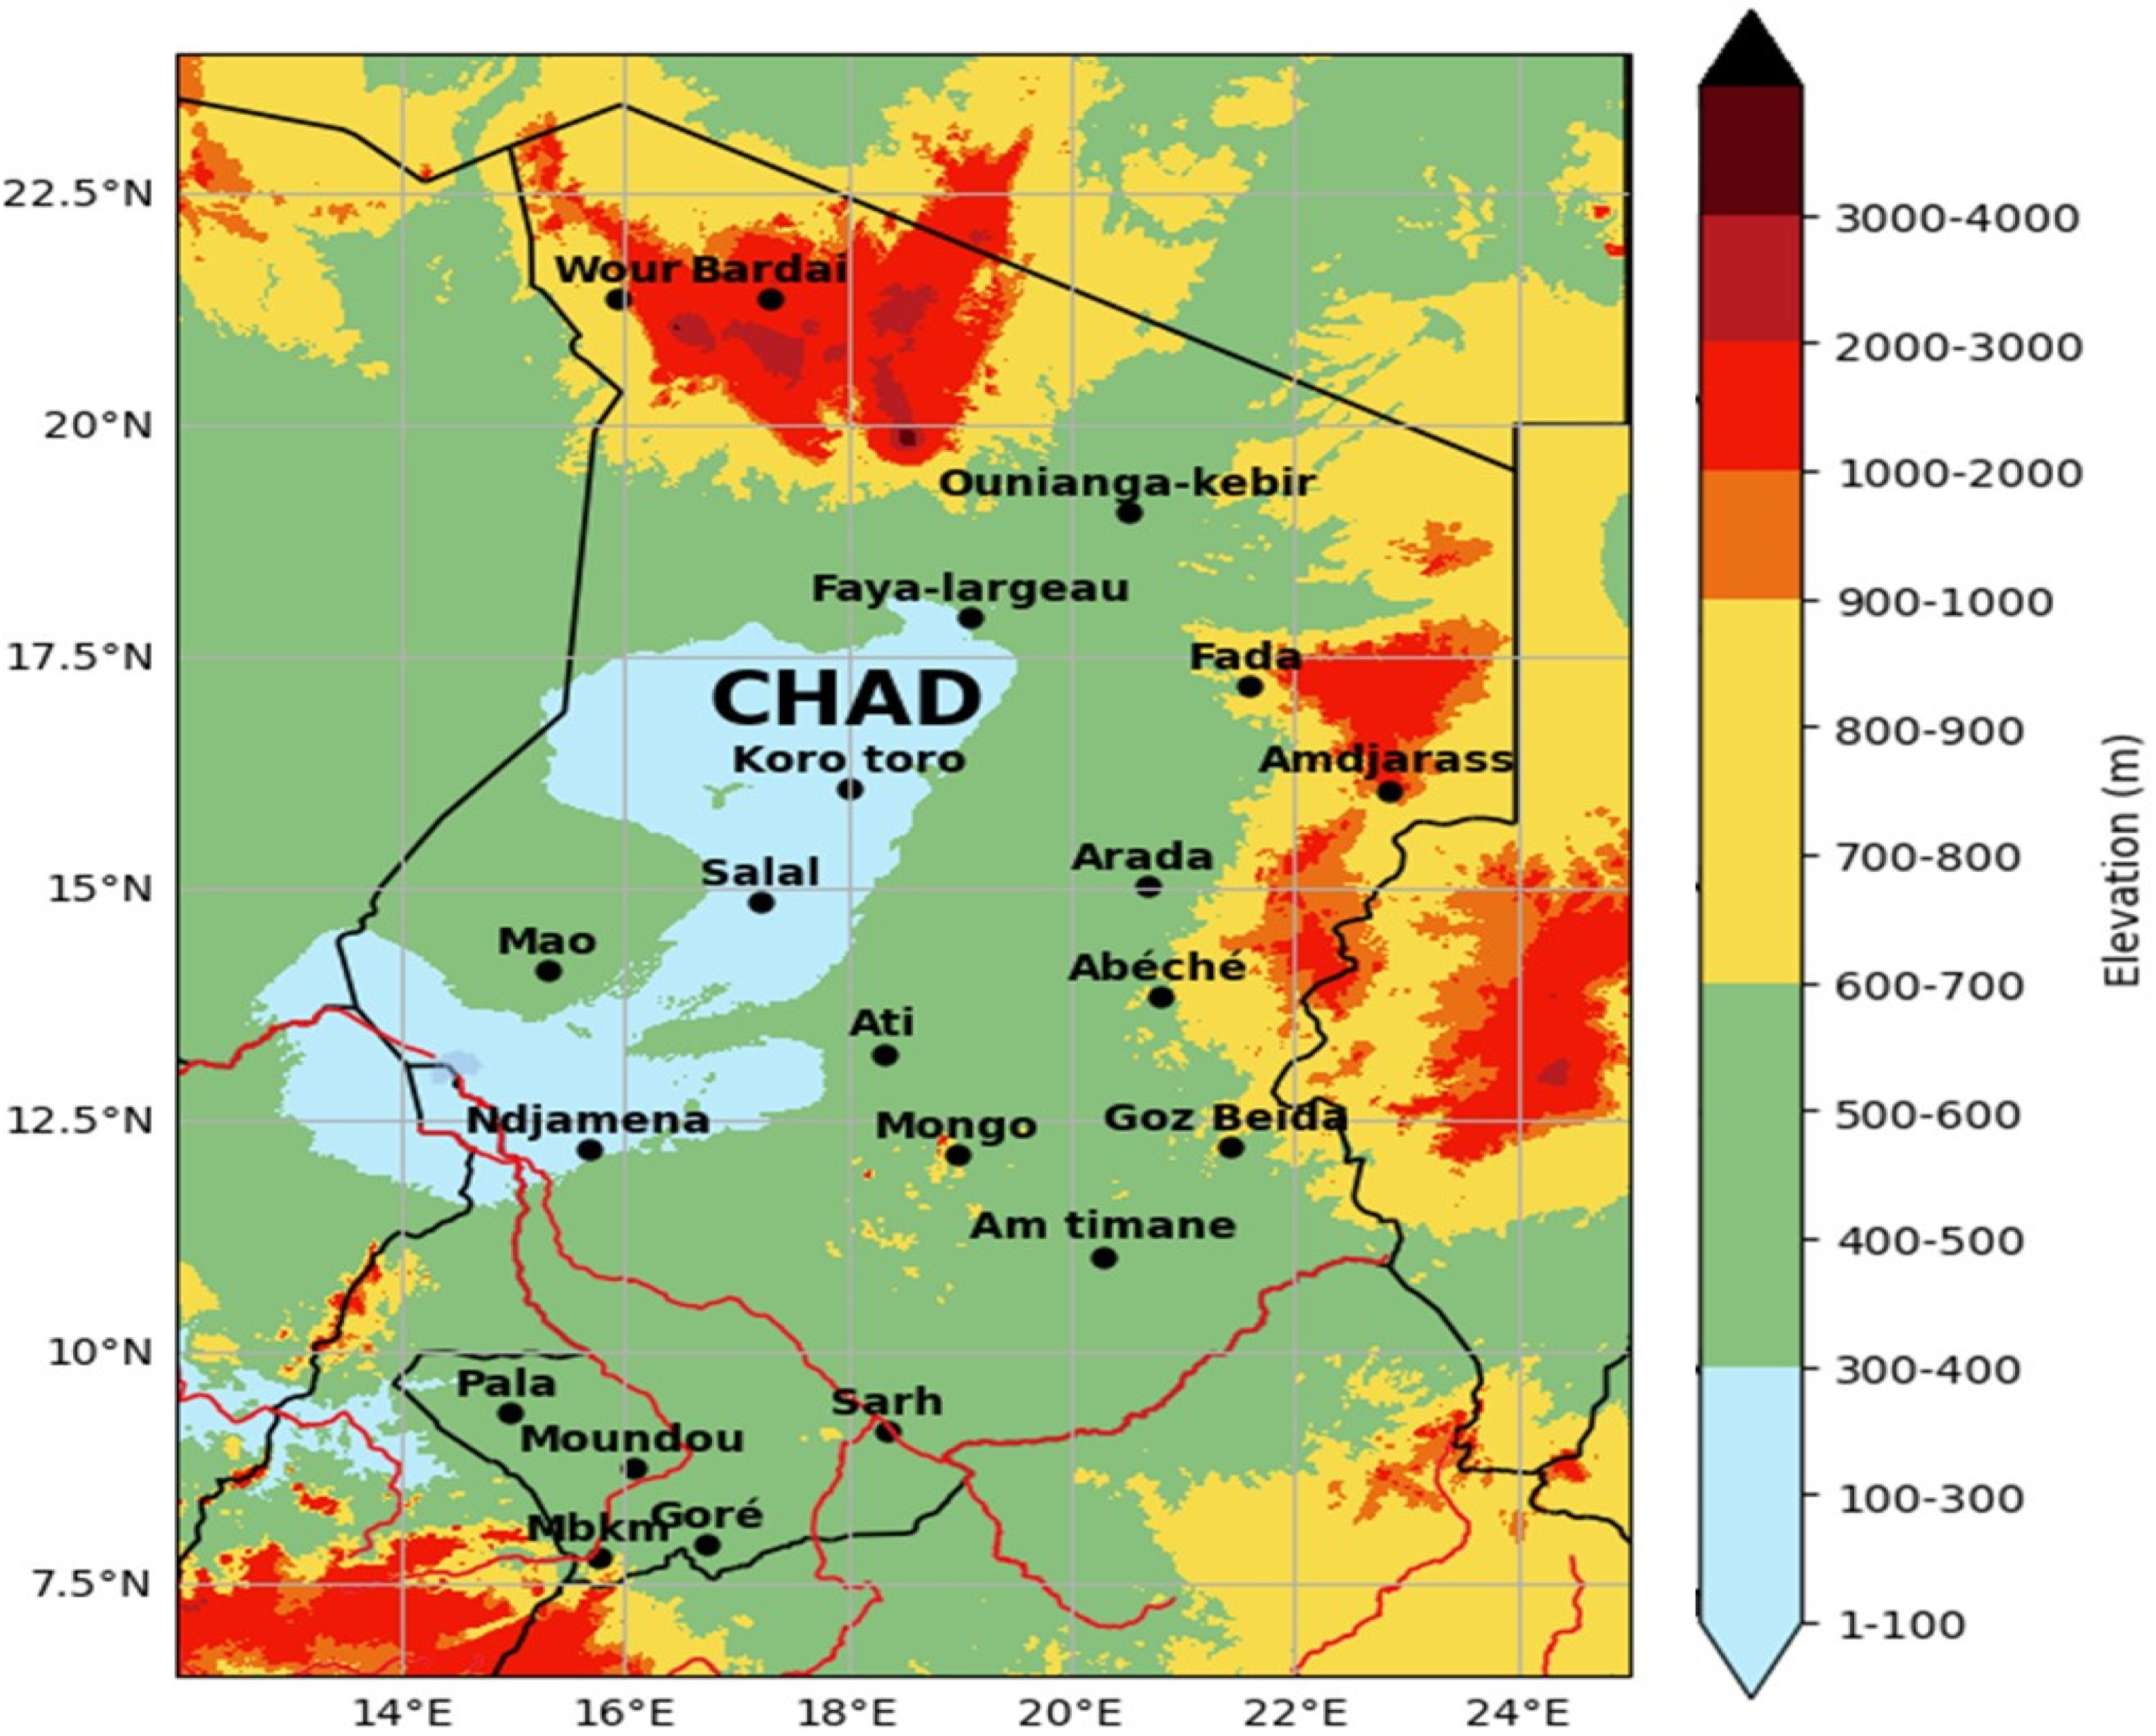
Topography of our study area.
Validation of ERA5 wind data at 10 m and 100 m at Faya-Largeau
In this study, we exclusively use 100 m wind data from the ERA5 reanalysis. Before starting the analyses, we perform a validation of these data for the period 1960–1978 in Faya-Largeau. Figure 3(a) and (b) respectively show the validation of the 10 m (left) and 100 m (right) wind data using Taylor diagrams for this period. The results indicate a strong agreement between the reanalysis and the observations, with a correlation coefficient close to 95% for the 10 m winds and over 97% for the 100 m winds. Additionally, the RMSE values remain low, around 0.44 for the 10 m winds and 0.55 for the 100 m winds. Moreover, several other studies (Medjo Nouadje et al., 2024; Soulouknga et al., 2018; Sparrow and LeGrand, 2023) have demonstrated that ERA5 data are reliable in regions similar to Chad and in the surrounding areas.
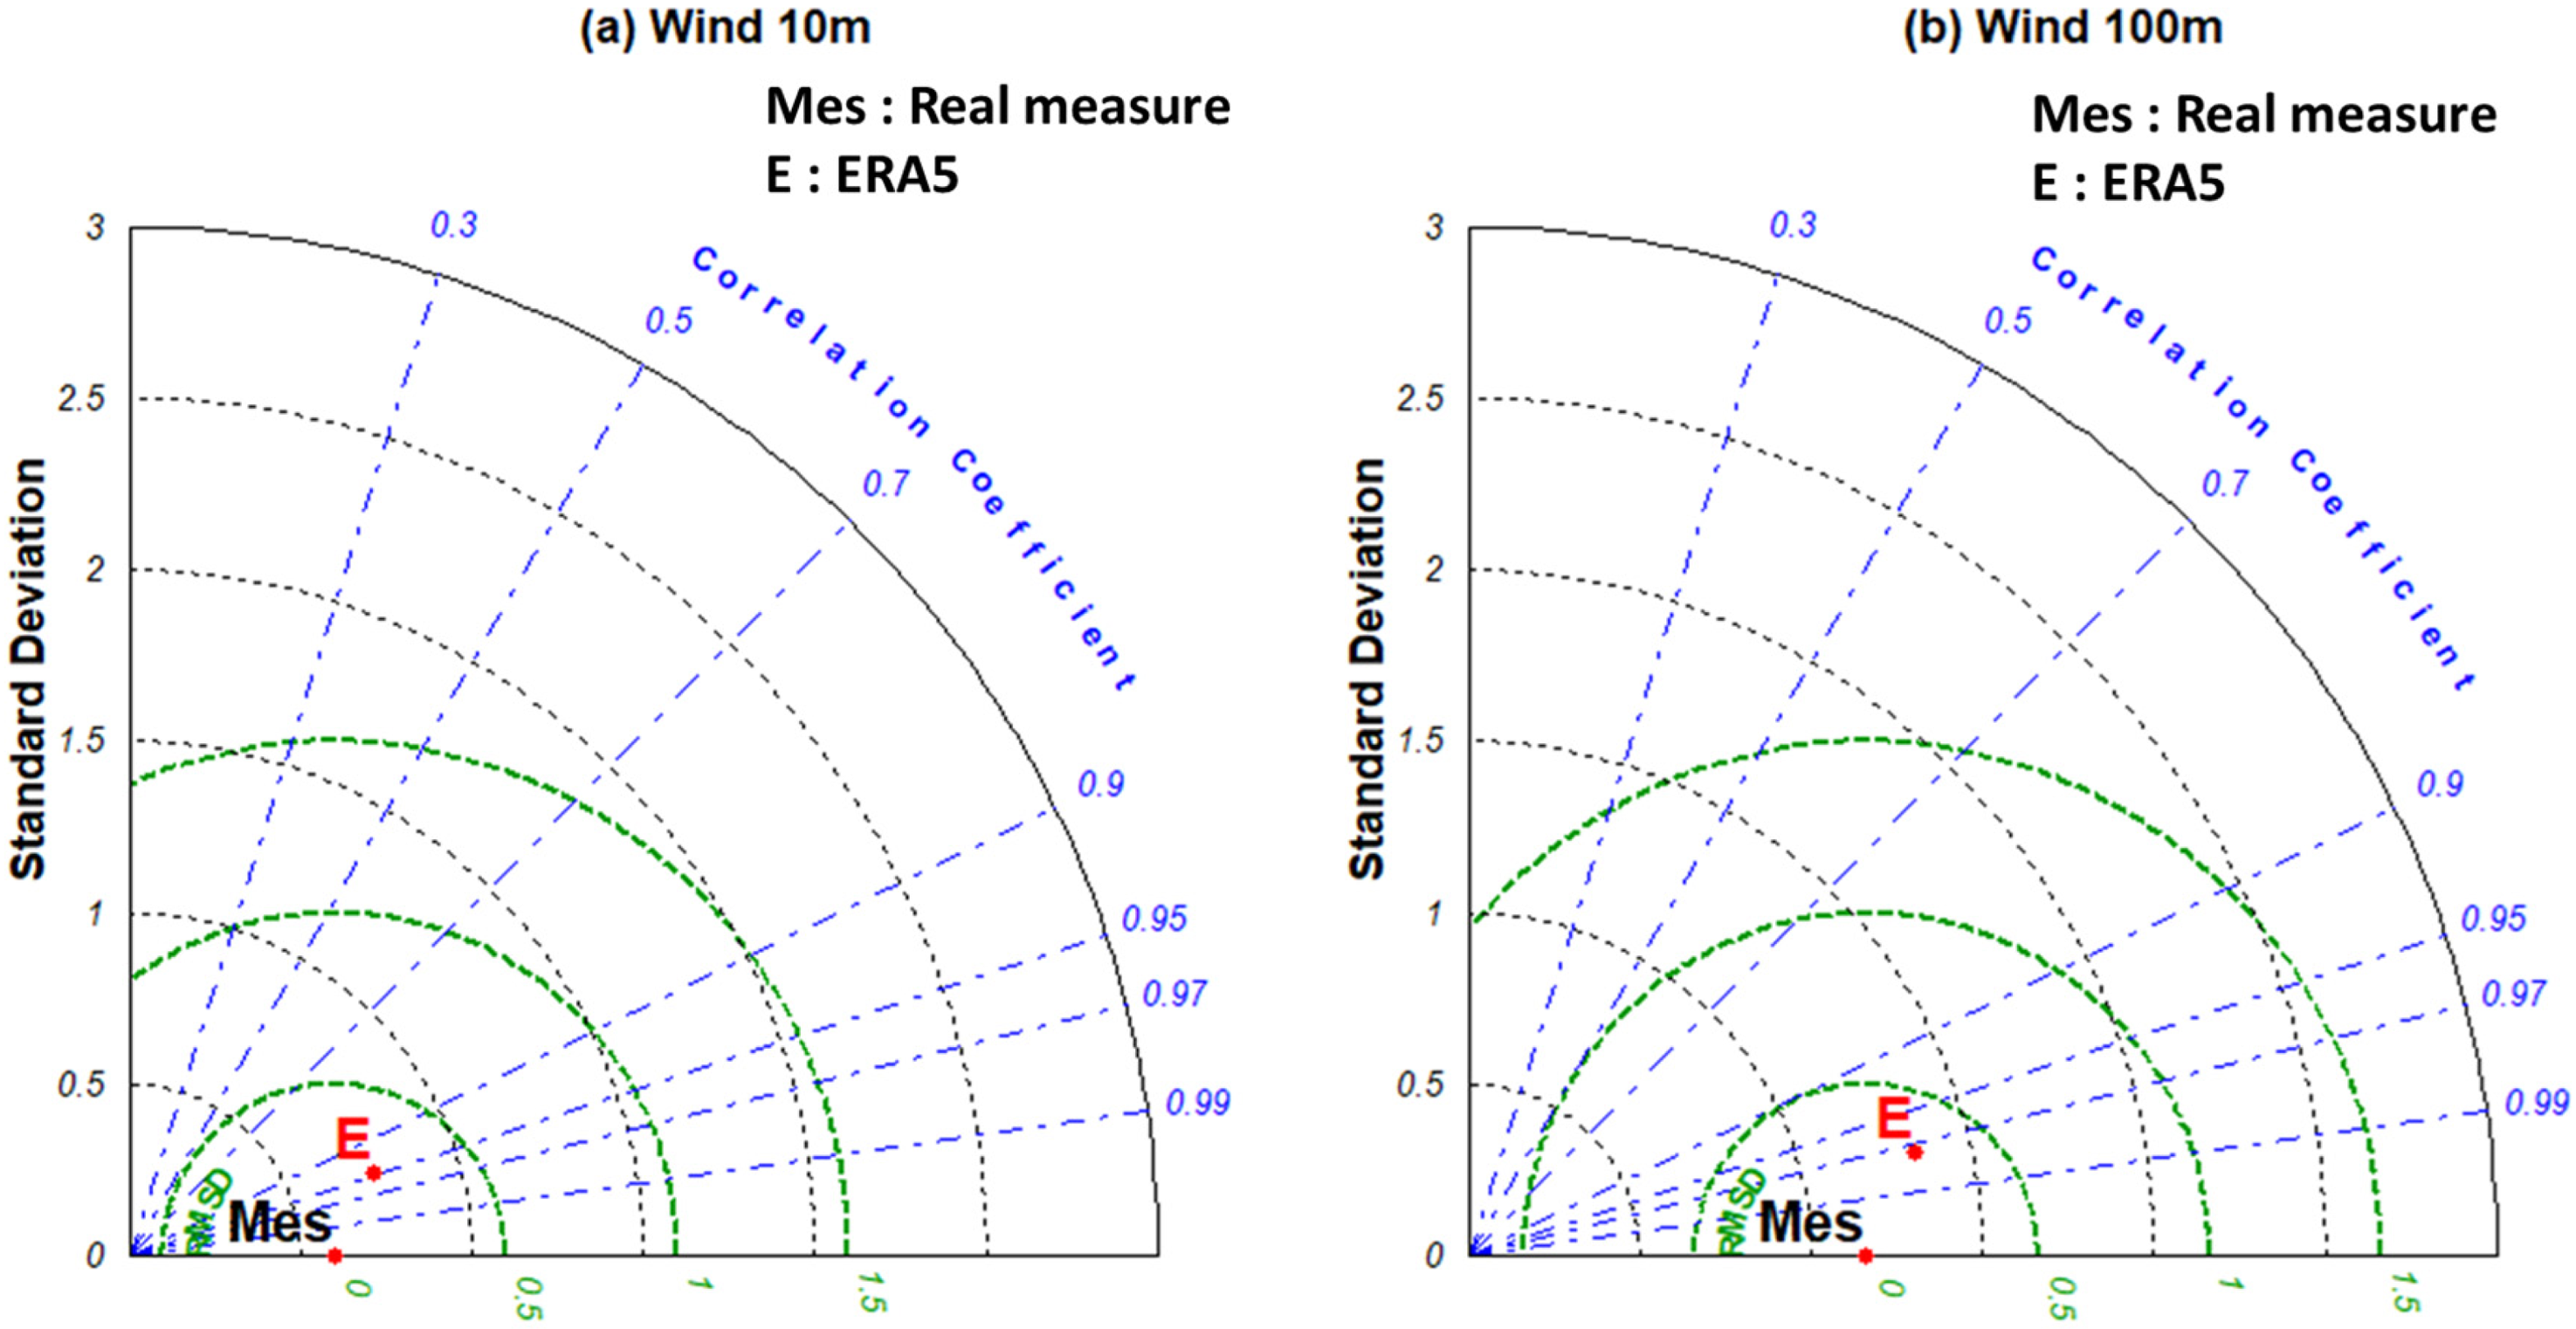
Taylor diagram showing three statistical estimates (standard deviation, correlation coefficient, and root mean square error) comparing ERA5 data with wind measurements at 10 m (a) and 100 m (b) at Fay-Largeau from 1960 to 1978.
Spatiotemporal variation of wind speed and direction
Figure 4 illustrates the wind potential (wind speed at 100 m) in Chad from 1993 to 2023. The black line on the map delineates the northern and southern parts of the country. On average, the wind potential is 6.7 m/s in Chad, a value that is favorable for wind farm installations. Wind speeds fluctuate between 1.5 and 11 m/s, with a discernible decreasing gradient from north to south. Specifically, wind potential ranges from 1.5 to 5 m/s in the southern part, while it varies between 5.5 and 10.5 m/s in the northern part. In the northern region, where the potential is highest, two areas of extreme potential are notable within the Saharan climatic zone: maximum values around Faya, between 17°N and 20°N, and lower values, even lower than those observed in the southern region, around Wour in the Tibesti, between 20°N and 22°N. In summary, the region around Faya, as well as the far northeastern part of the country and the area around Amjarass, where the country's only wind farm is located, are the most favorable for wind farm installations.
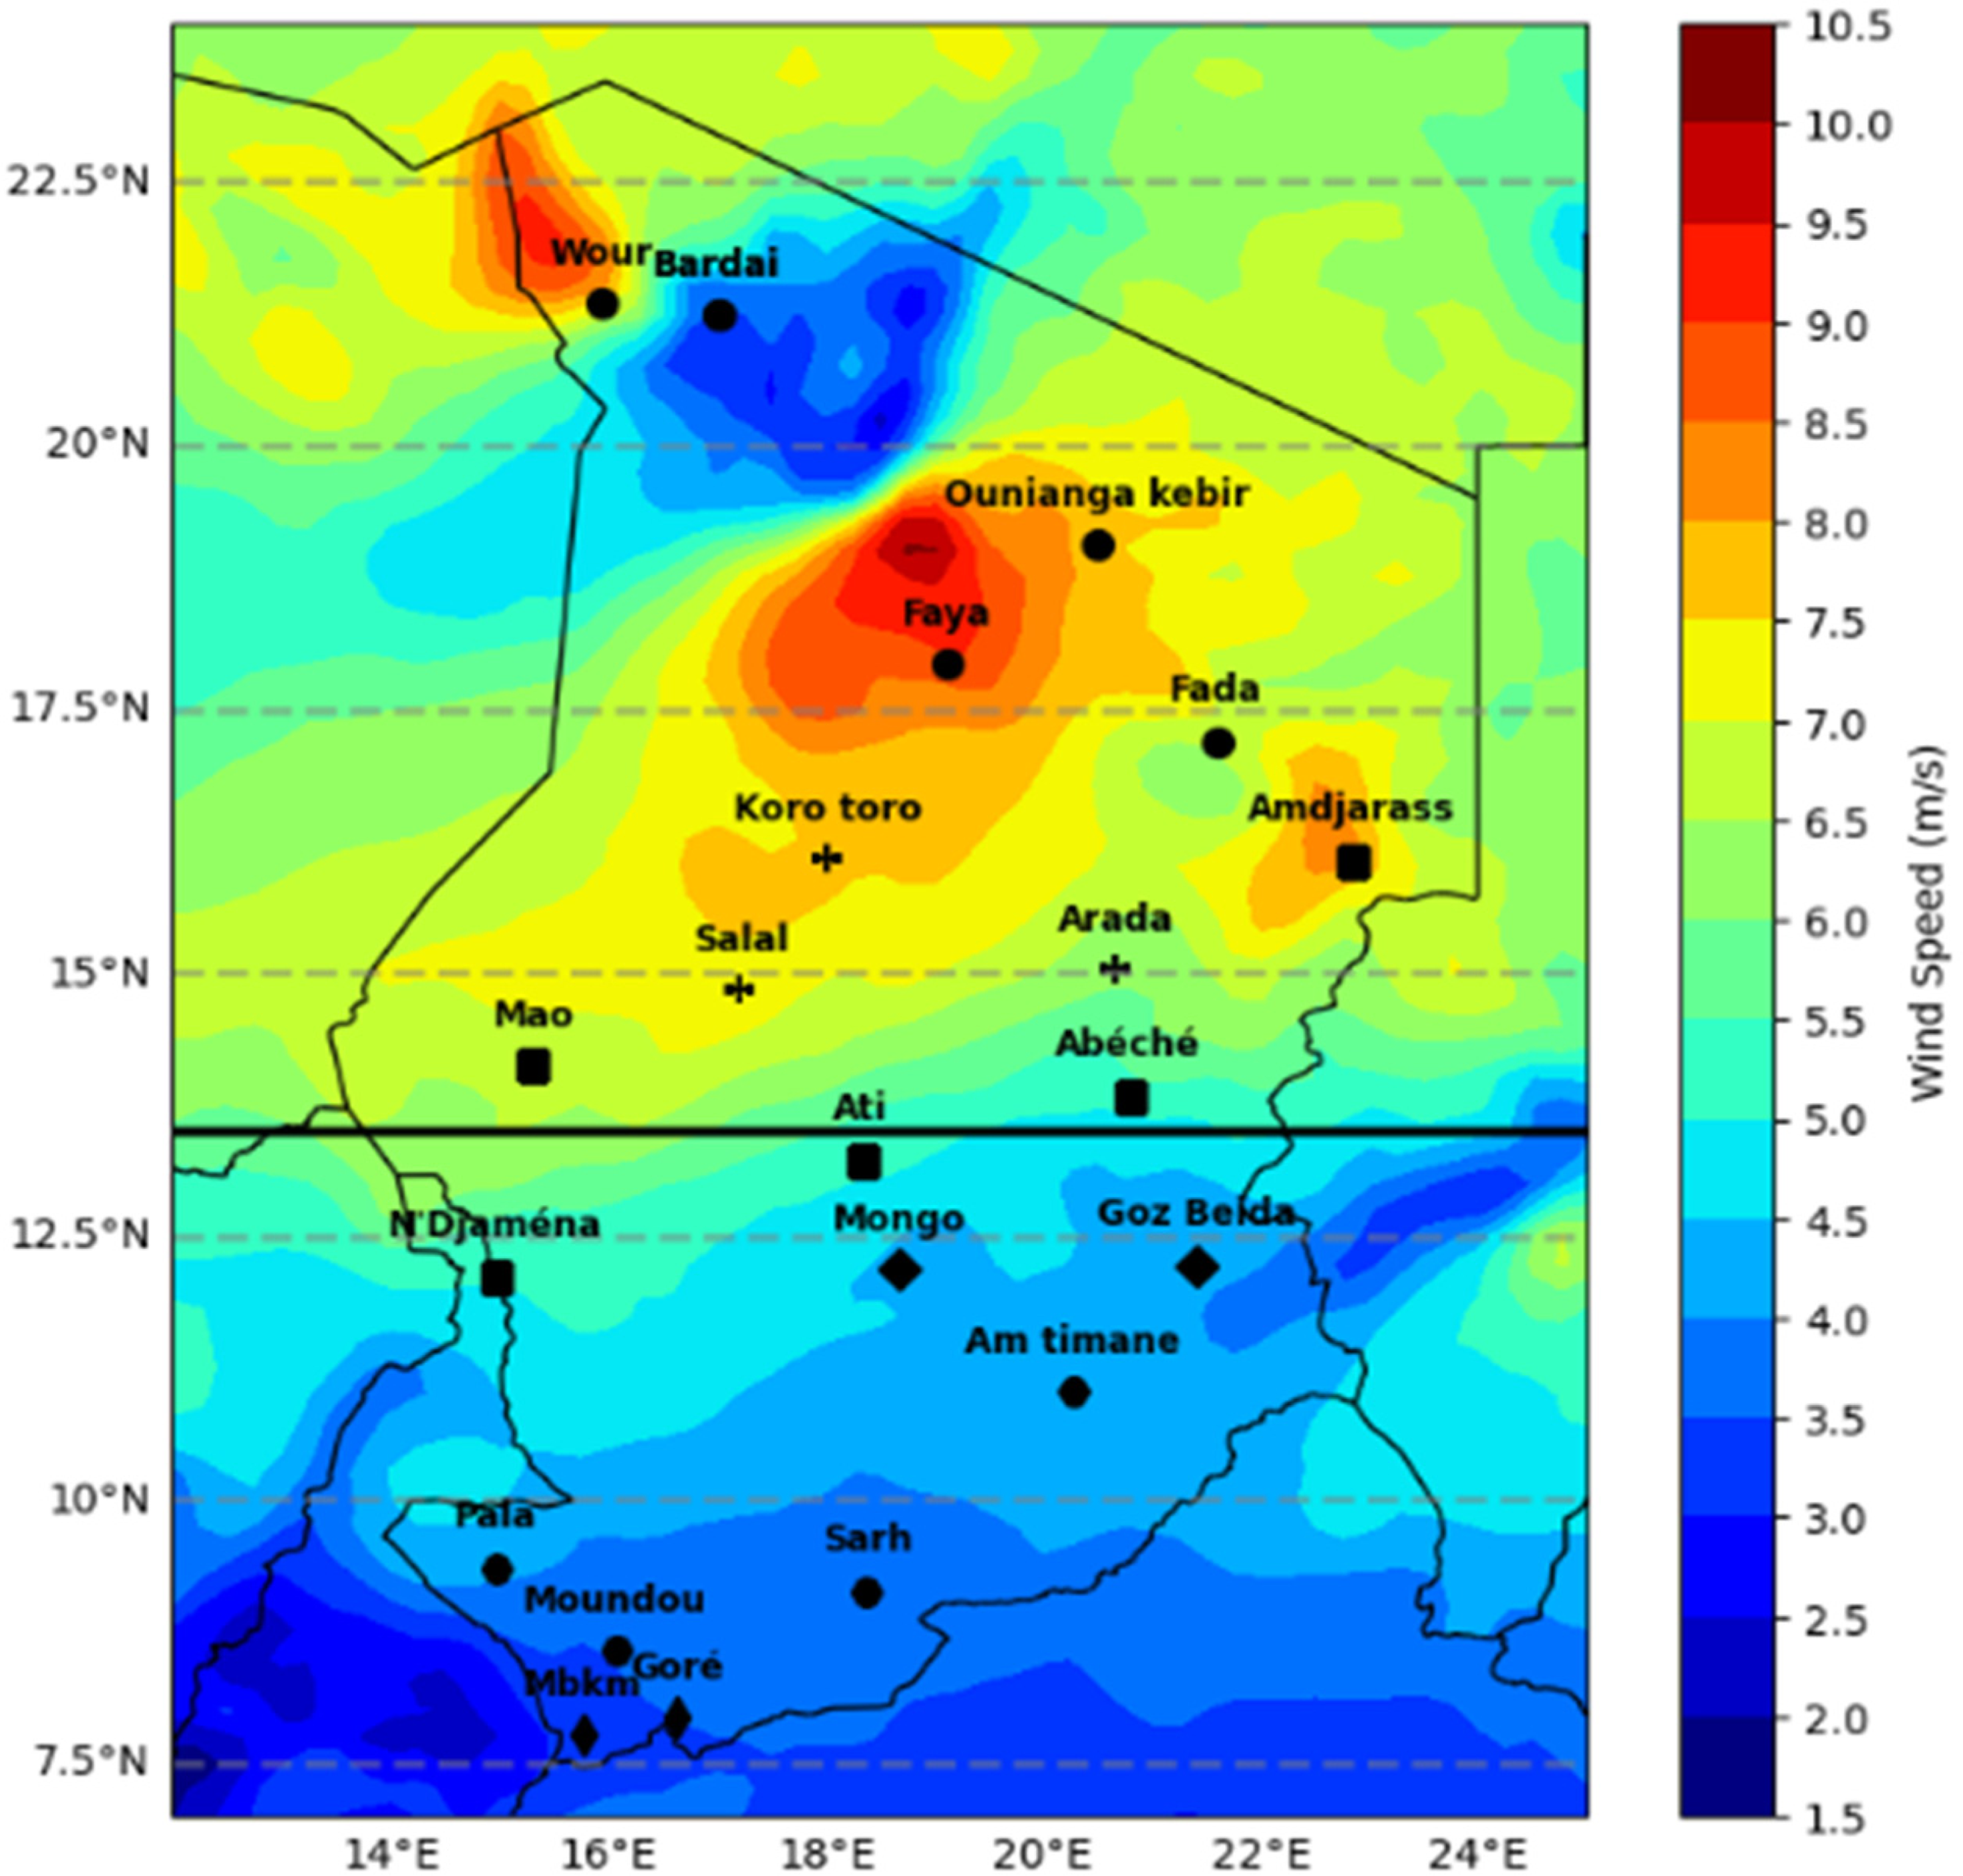
Spatial variation of 100-m wind speeds in Chad (1993–2023).
Figure 5 presents the wind rose, illustrating the main wind directions over the same period. It shows that the winds predominantly come from the northeast, where their intensity is also maximal. This analysis reveals that the majority of winds in Chad are harmattan.
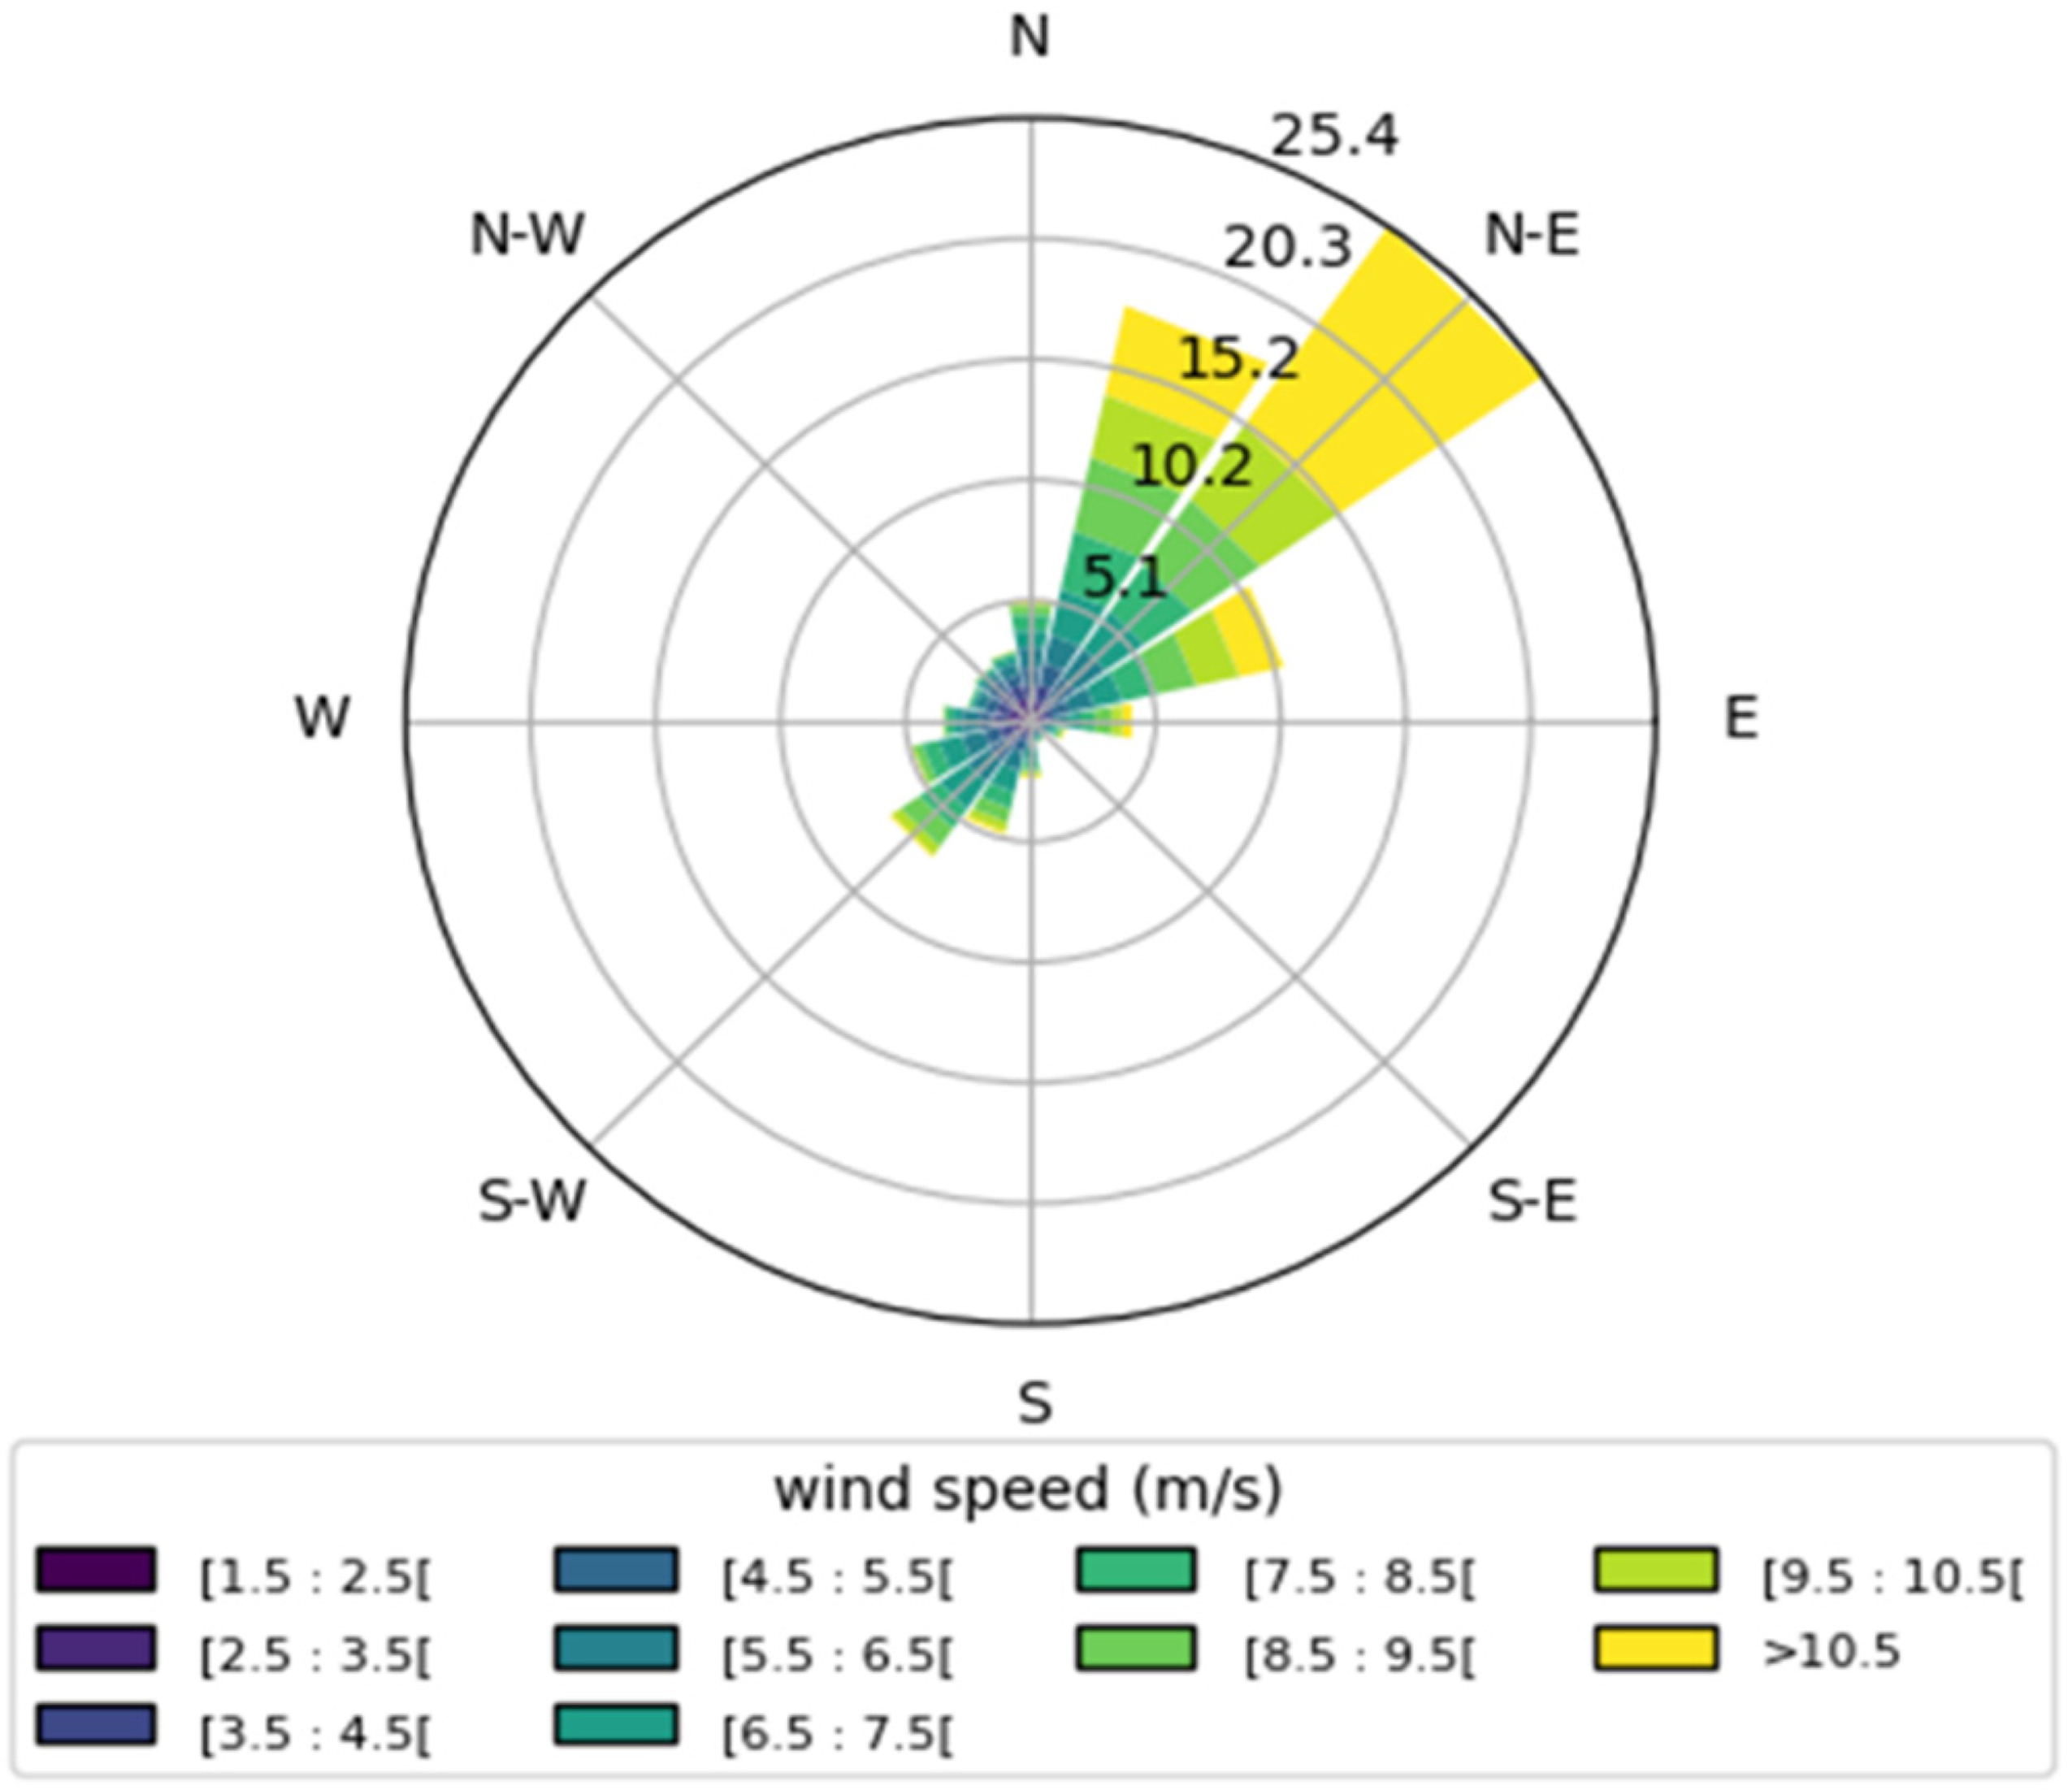
Wind direction patterns in Chad (1993–2023).
Figure 6 illustrates the monthly distribution of winds in Chad from 1993 to 2023. The blue histogram represents the national average, while the red curve shows the wind dynamics in the northern part of the country and the green curve in the southern part. It is observed that, on one hand, the northern region consistently records stronger winds than the southern region, and on the other hand, all curves follow a similar general trend. Examining the blue histogram for the entire country reveals a distinct trend in the monthly distribution of wind speeds, with peaks occurring during the dry season (October–April) and minima during the wet season (May–September).
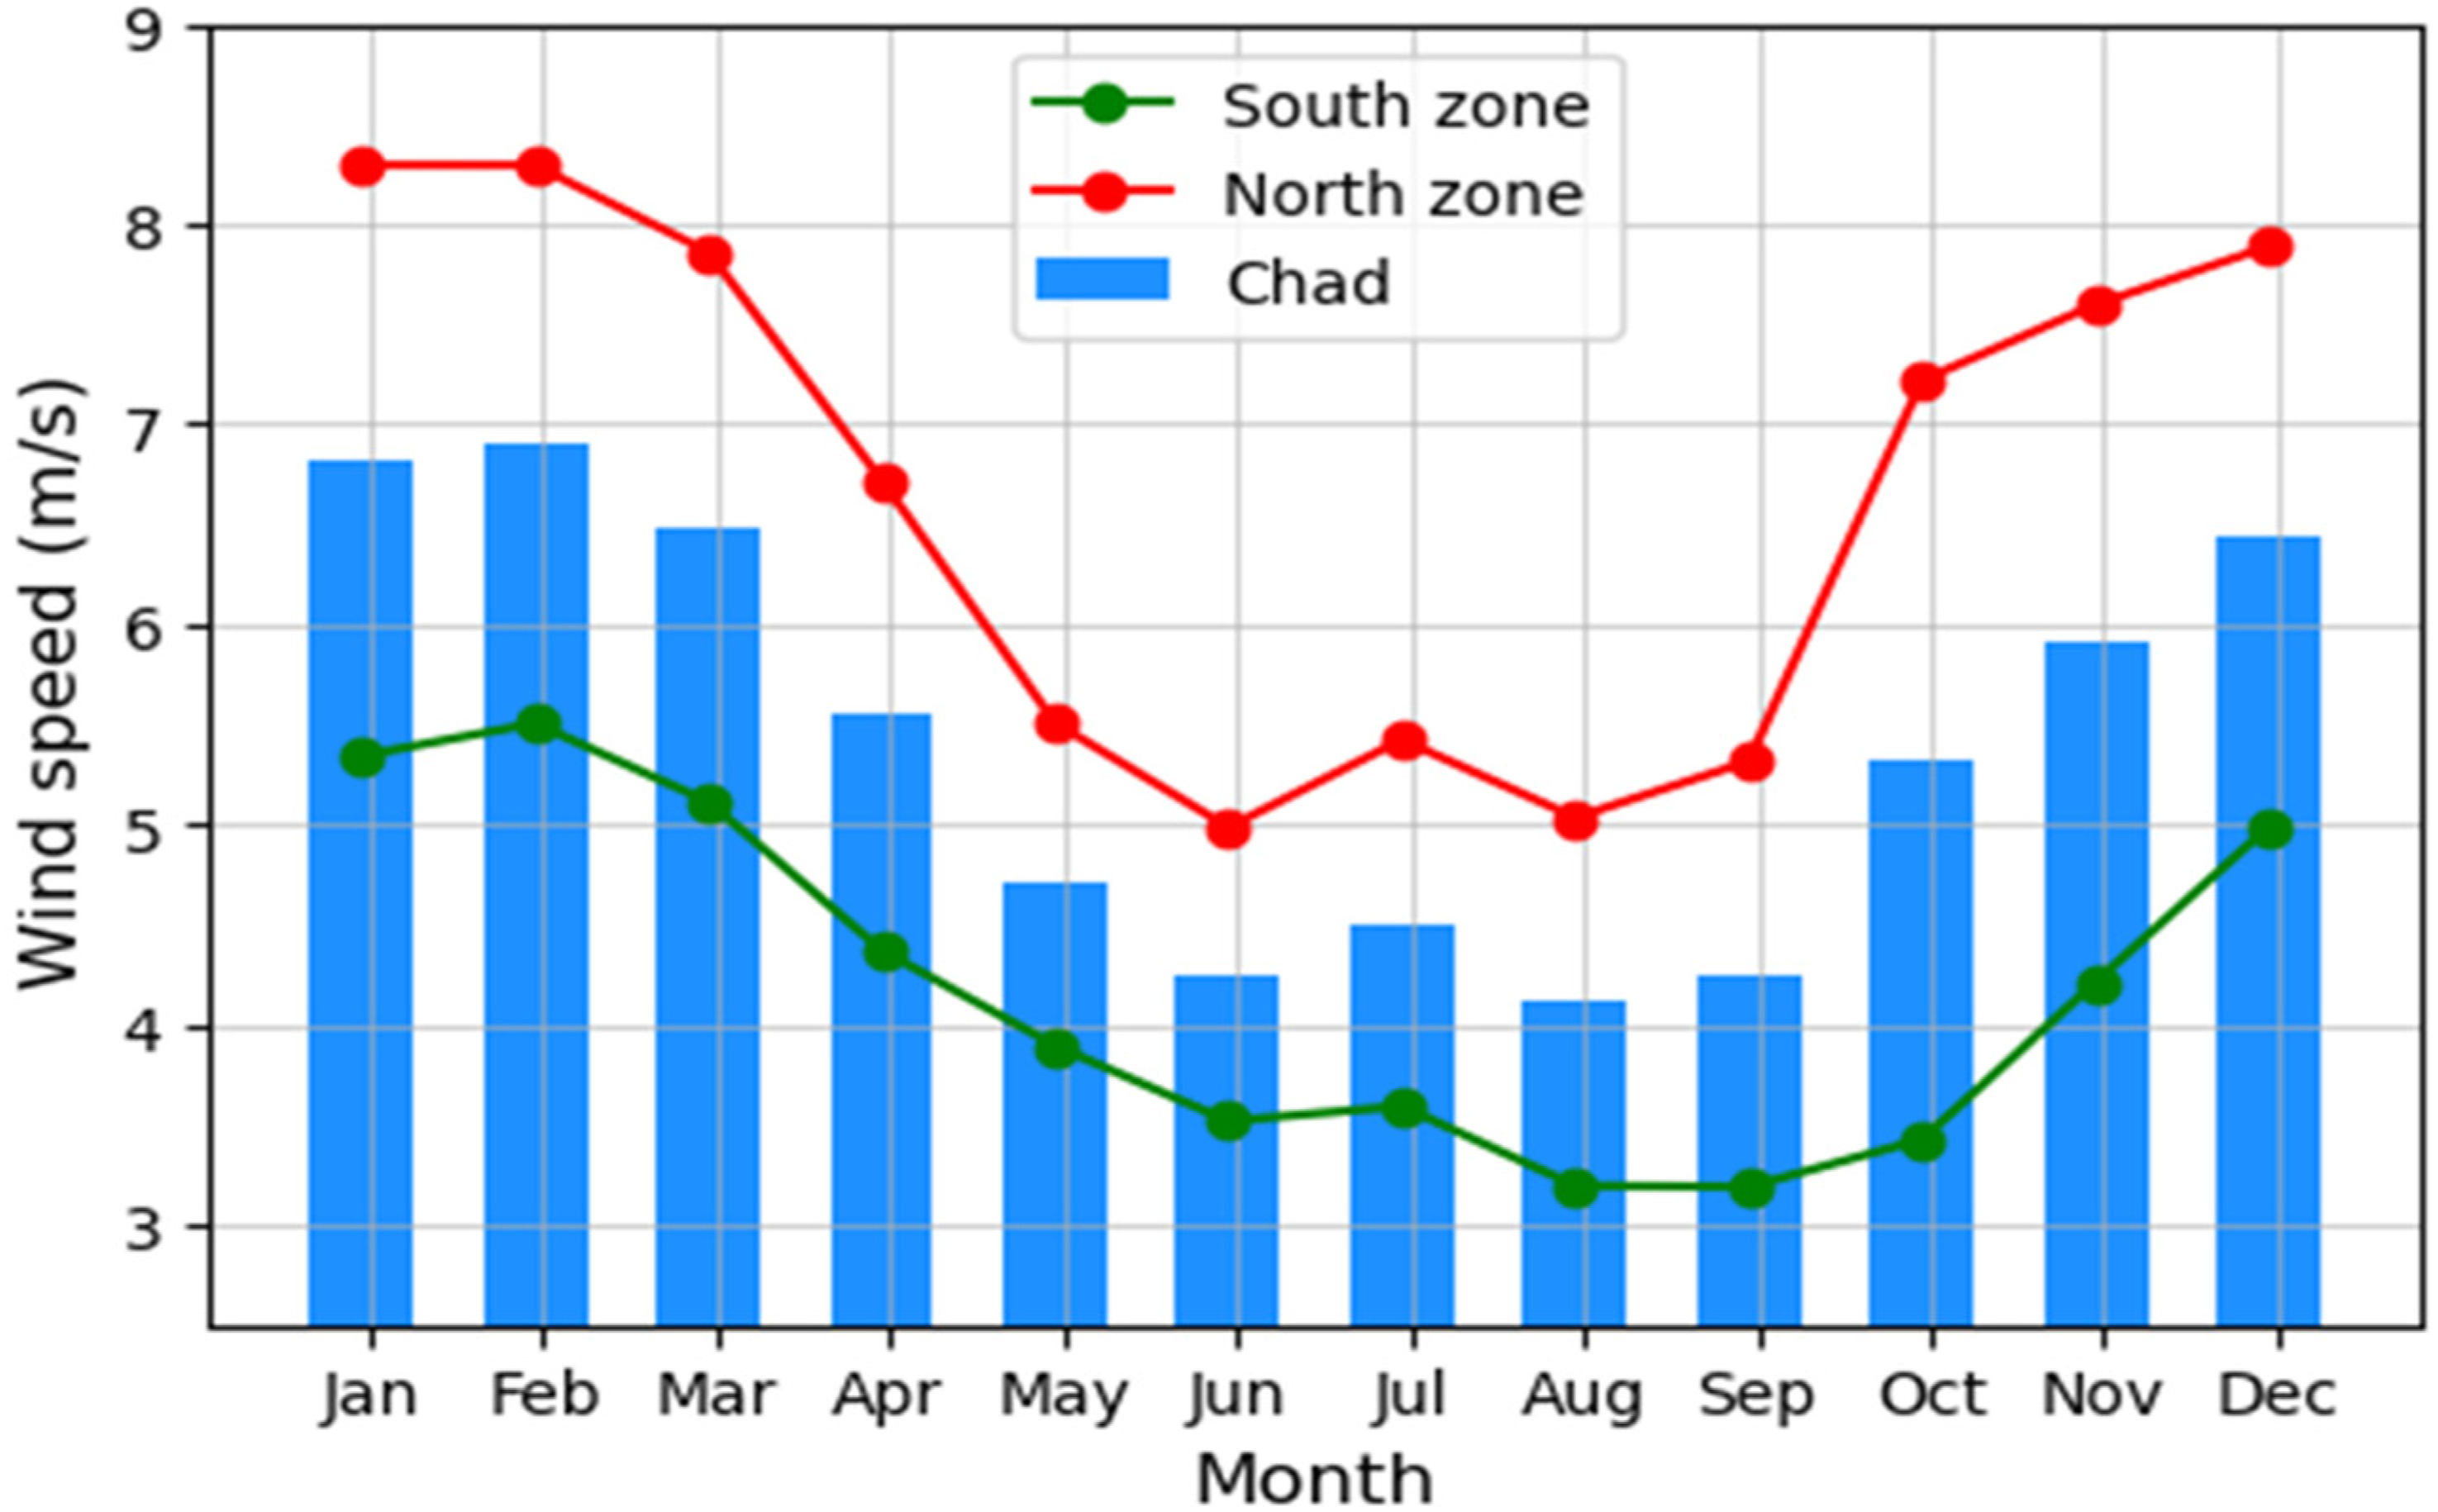
Monthly distribution of mean wind speed in Chad for the period 1993–2023.
To better understand these variations, Figure 7 illustrates the spatial distribution of monthly mean wind speeds from 1993 to 2023. As previously mentioned, the highest wind speeds are observed from December to May, while the lowest values occur during the wet season. Spatially, a distinct north–south gradient is evident, with particularly strong winds from October to April.
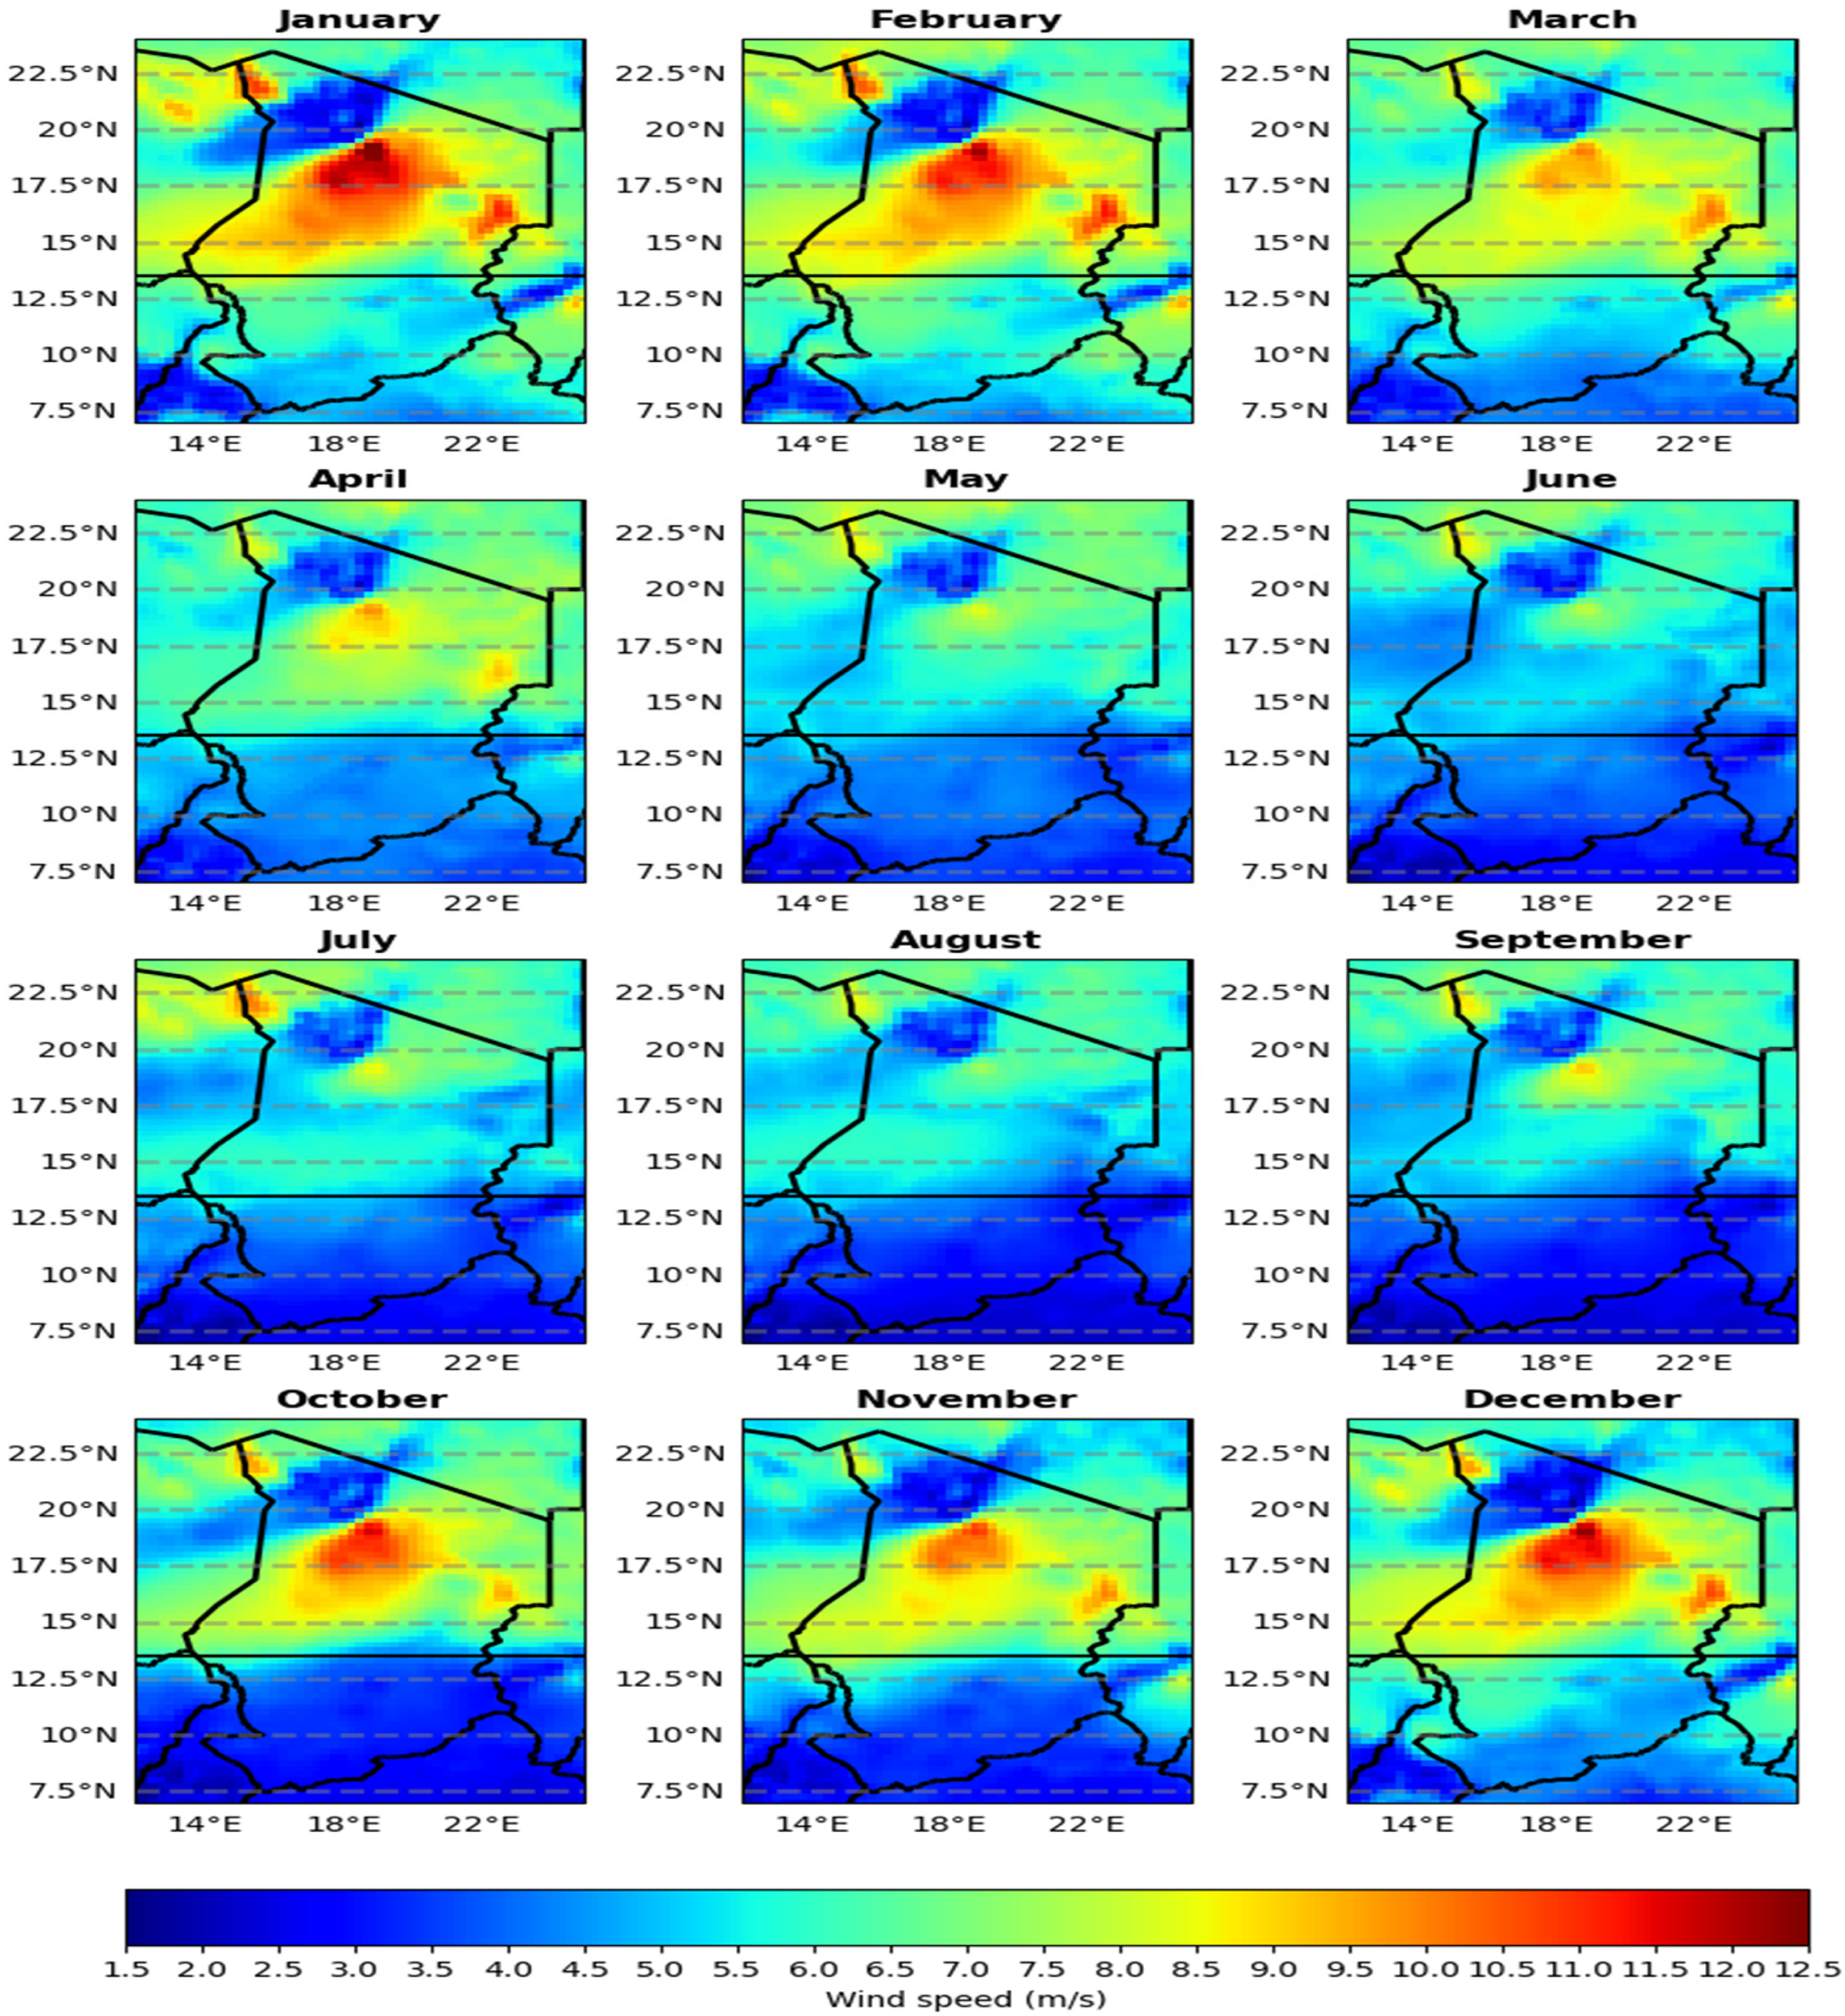
Spatial distribution of monthly mean wind speed in Chad (1993–2023).
Figure 8 provides a supplementary analysis of the temporal and spatial distributions of wind speeds, highlighting seasonal variability. The year is divided into four seasons based on temperature: winter (December–February), spring (March–May), summer (June–August), and autumn (September–November). The results reveal trends similar to those observed in the previous figures. Specifically, winter and autumn emerge as the windiest seasons. During winter, wind speeds exceed 12.5 m/s in the Faya region, between 15°N and 18°N. Conversely, the lowest wind speeds are recorded mainly in summer, with winds ranging from 1.5 to 6 m/s across much of Chad. Wind speeds in the Sahel region peak during spring and autumn due to pronounced transitions between high and low-pressure systems, resulting in substantial pressure gradients that enhance wind intensity. The onset of the rainy season in spring is marked by intensified atmospheric dynamics, influenced by the maritime trade winds and monsoon winds (Giannini et al., 2003). Furthermore, temperature variations between air masses, resulting from diurnal heating and nocturnal cooling, also contribute to the observed increases in wind speed. Additionally, anomalies in sea surface temperatures (SST), particularly in the Atlantic, significantly affect atmospheric circulation patterns, creating conditions that are conducive to stronger winds (Druyan et al., 2008; Losada et al., 2012; Wane et al., 2023).
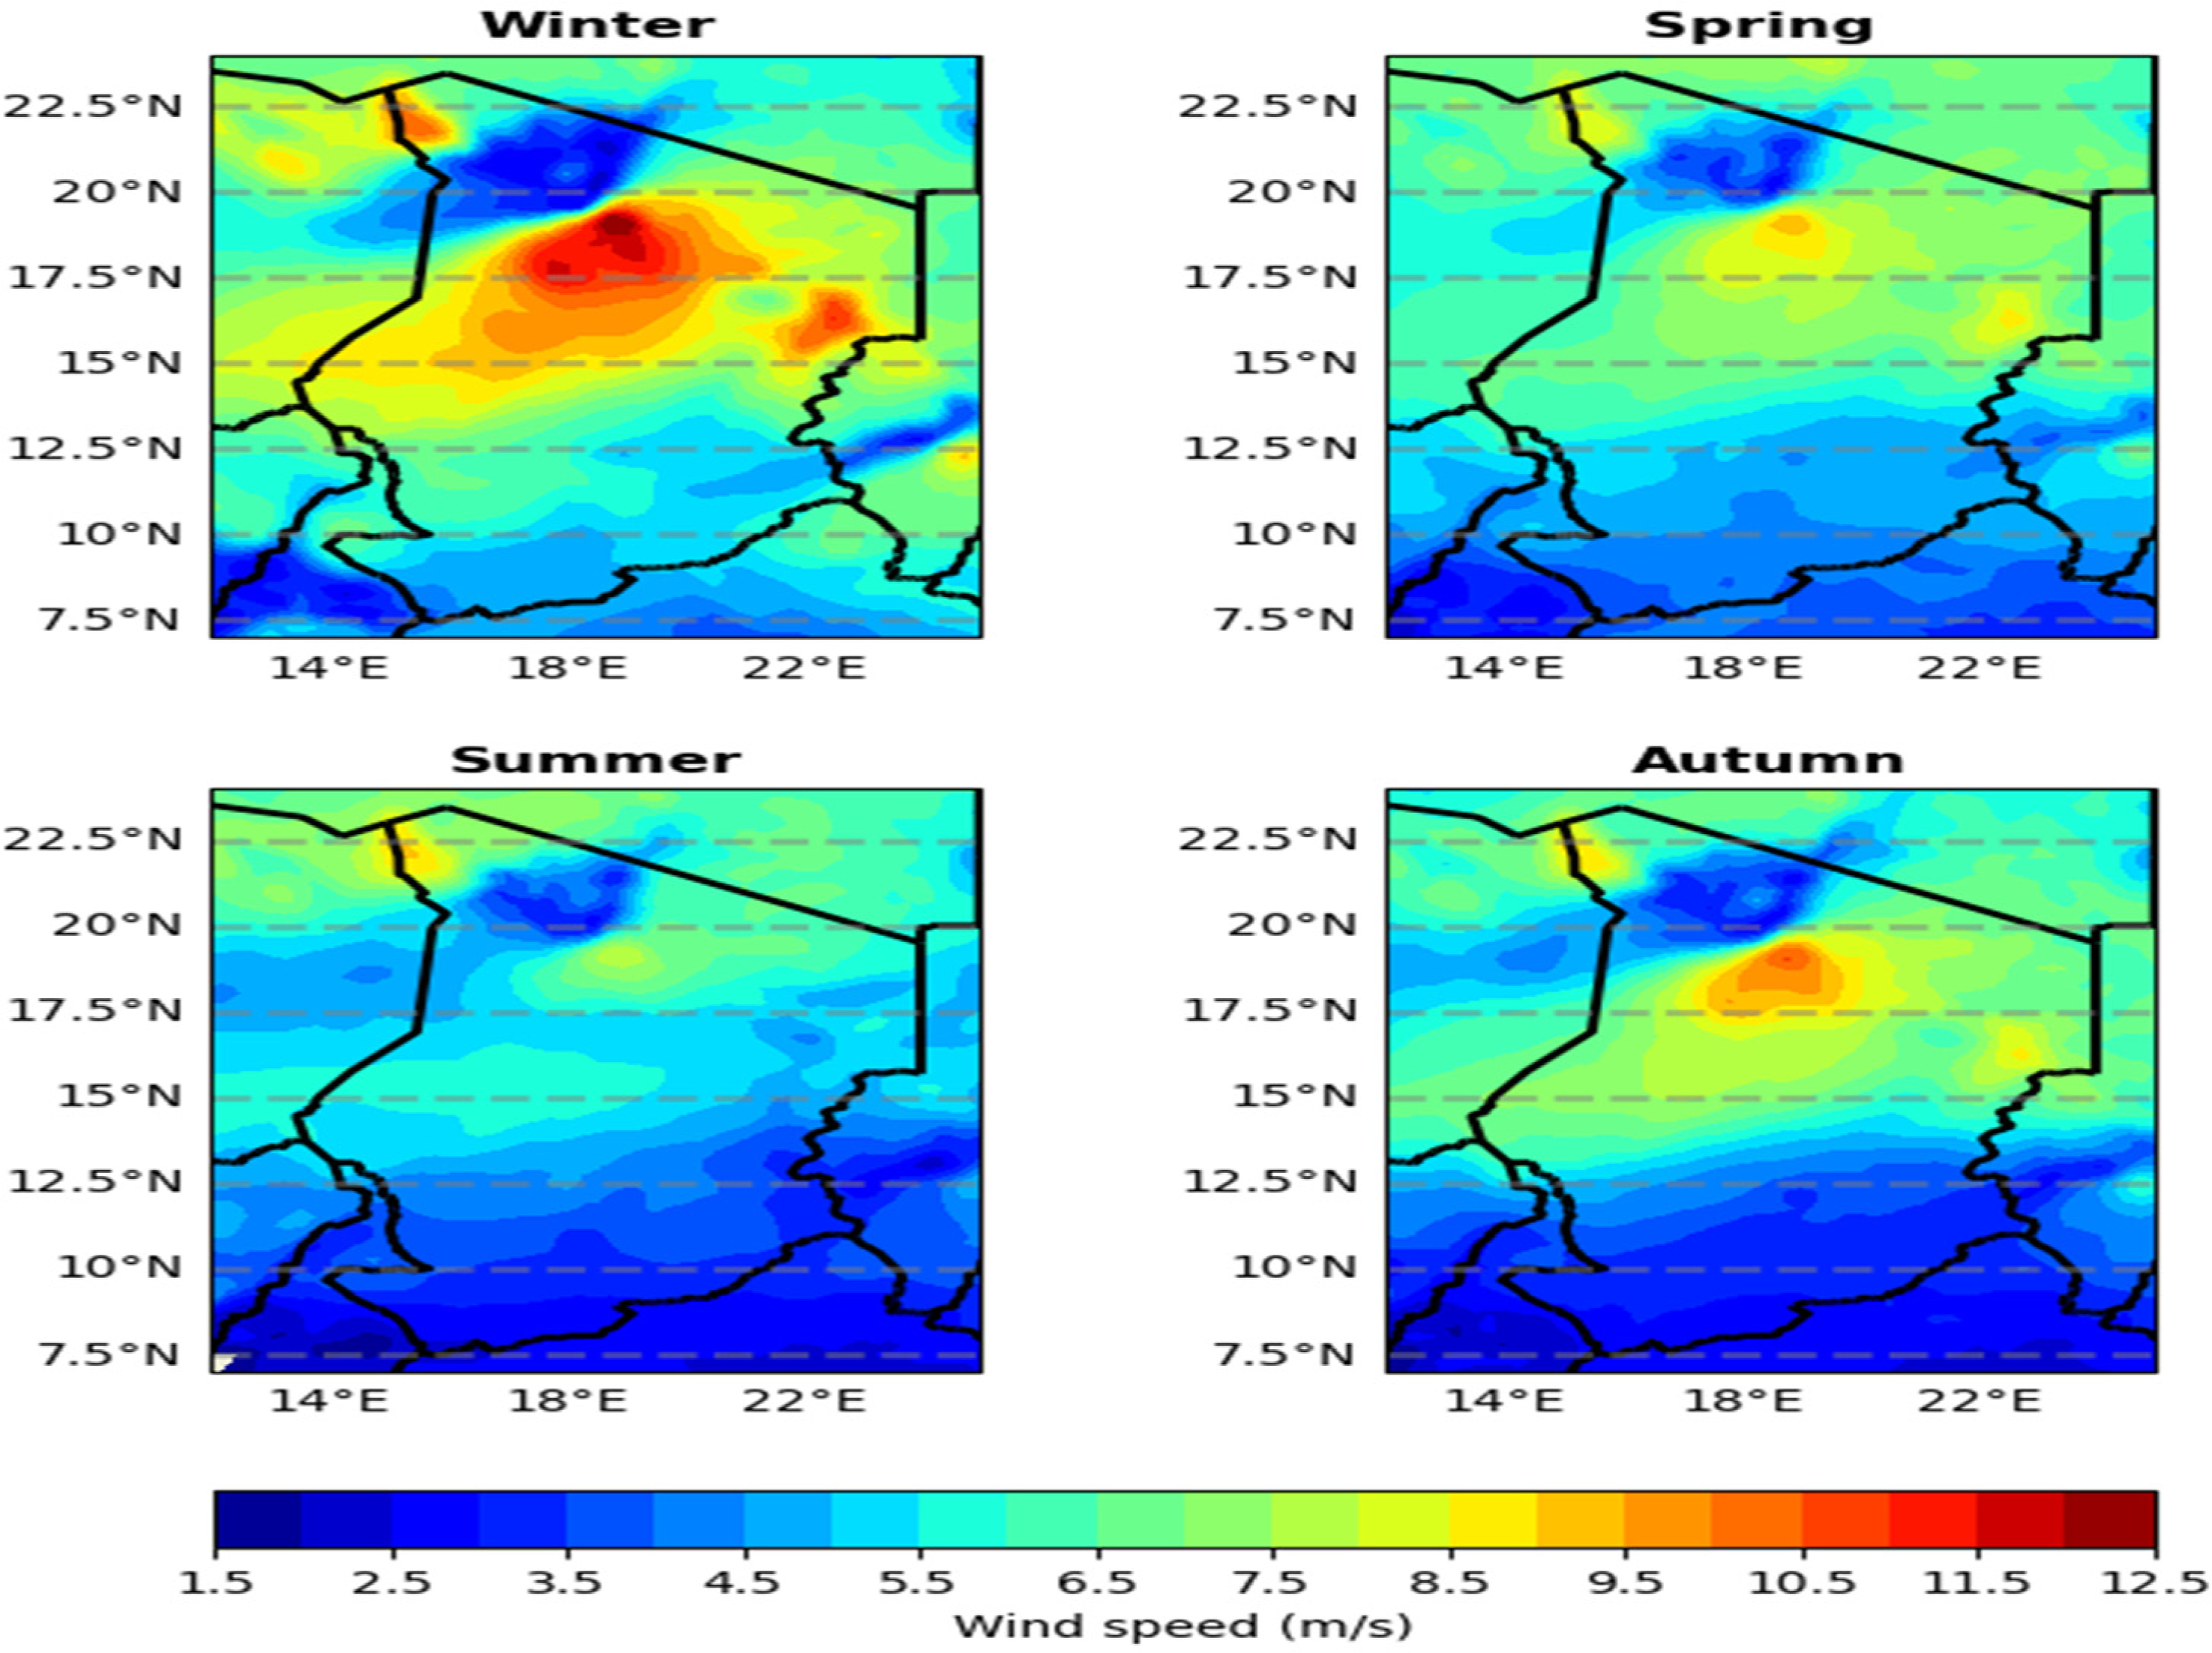
Seasonal variability of wind speed in Chad.
Figure 9 illustrates the wind direction components using wind roses for each of the four seasons. It shows that in autumn, winter, and spring, the wind predominantly comes from the northeast (harmattan), which also represents the strongest winds in the country. During these three seasons, the wind is dominated by a primary direction, which is favorable for wind energy. In contrast, during summer, the wind originates from the southwest with lower intensity, corresponding to the maritime trade winds (monsoon flow).
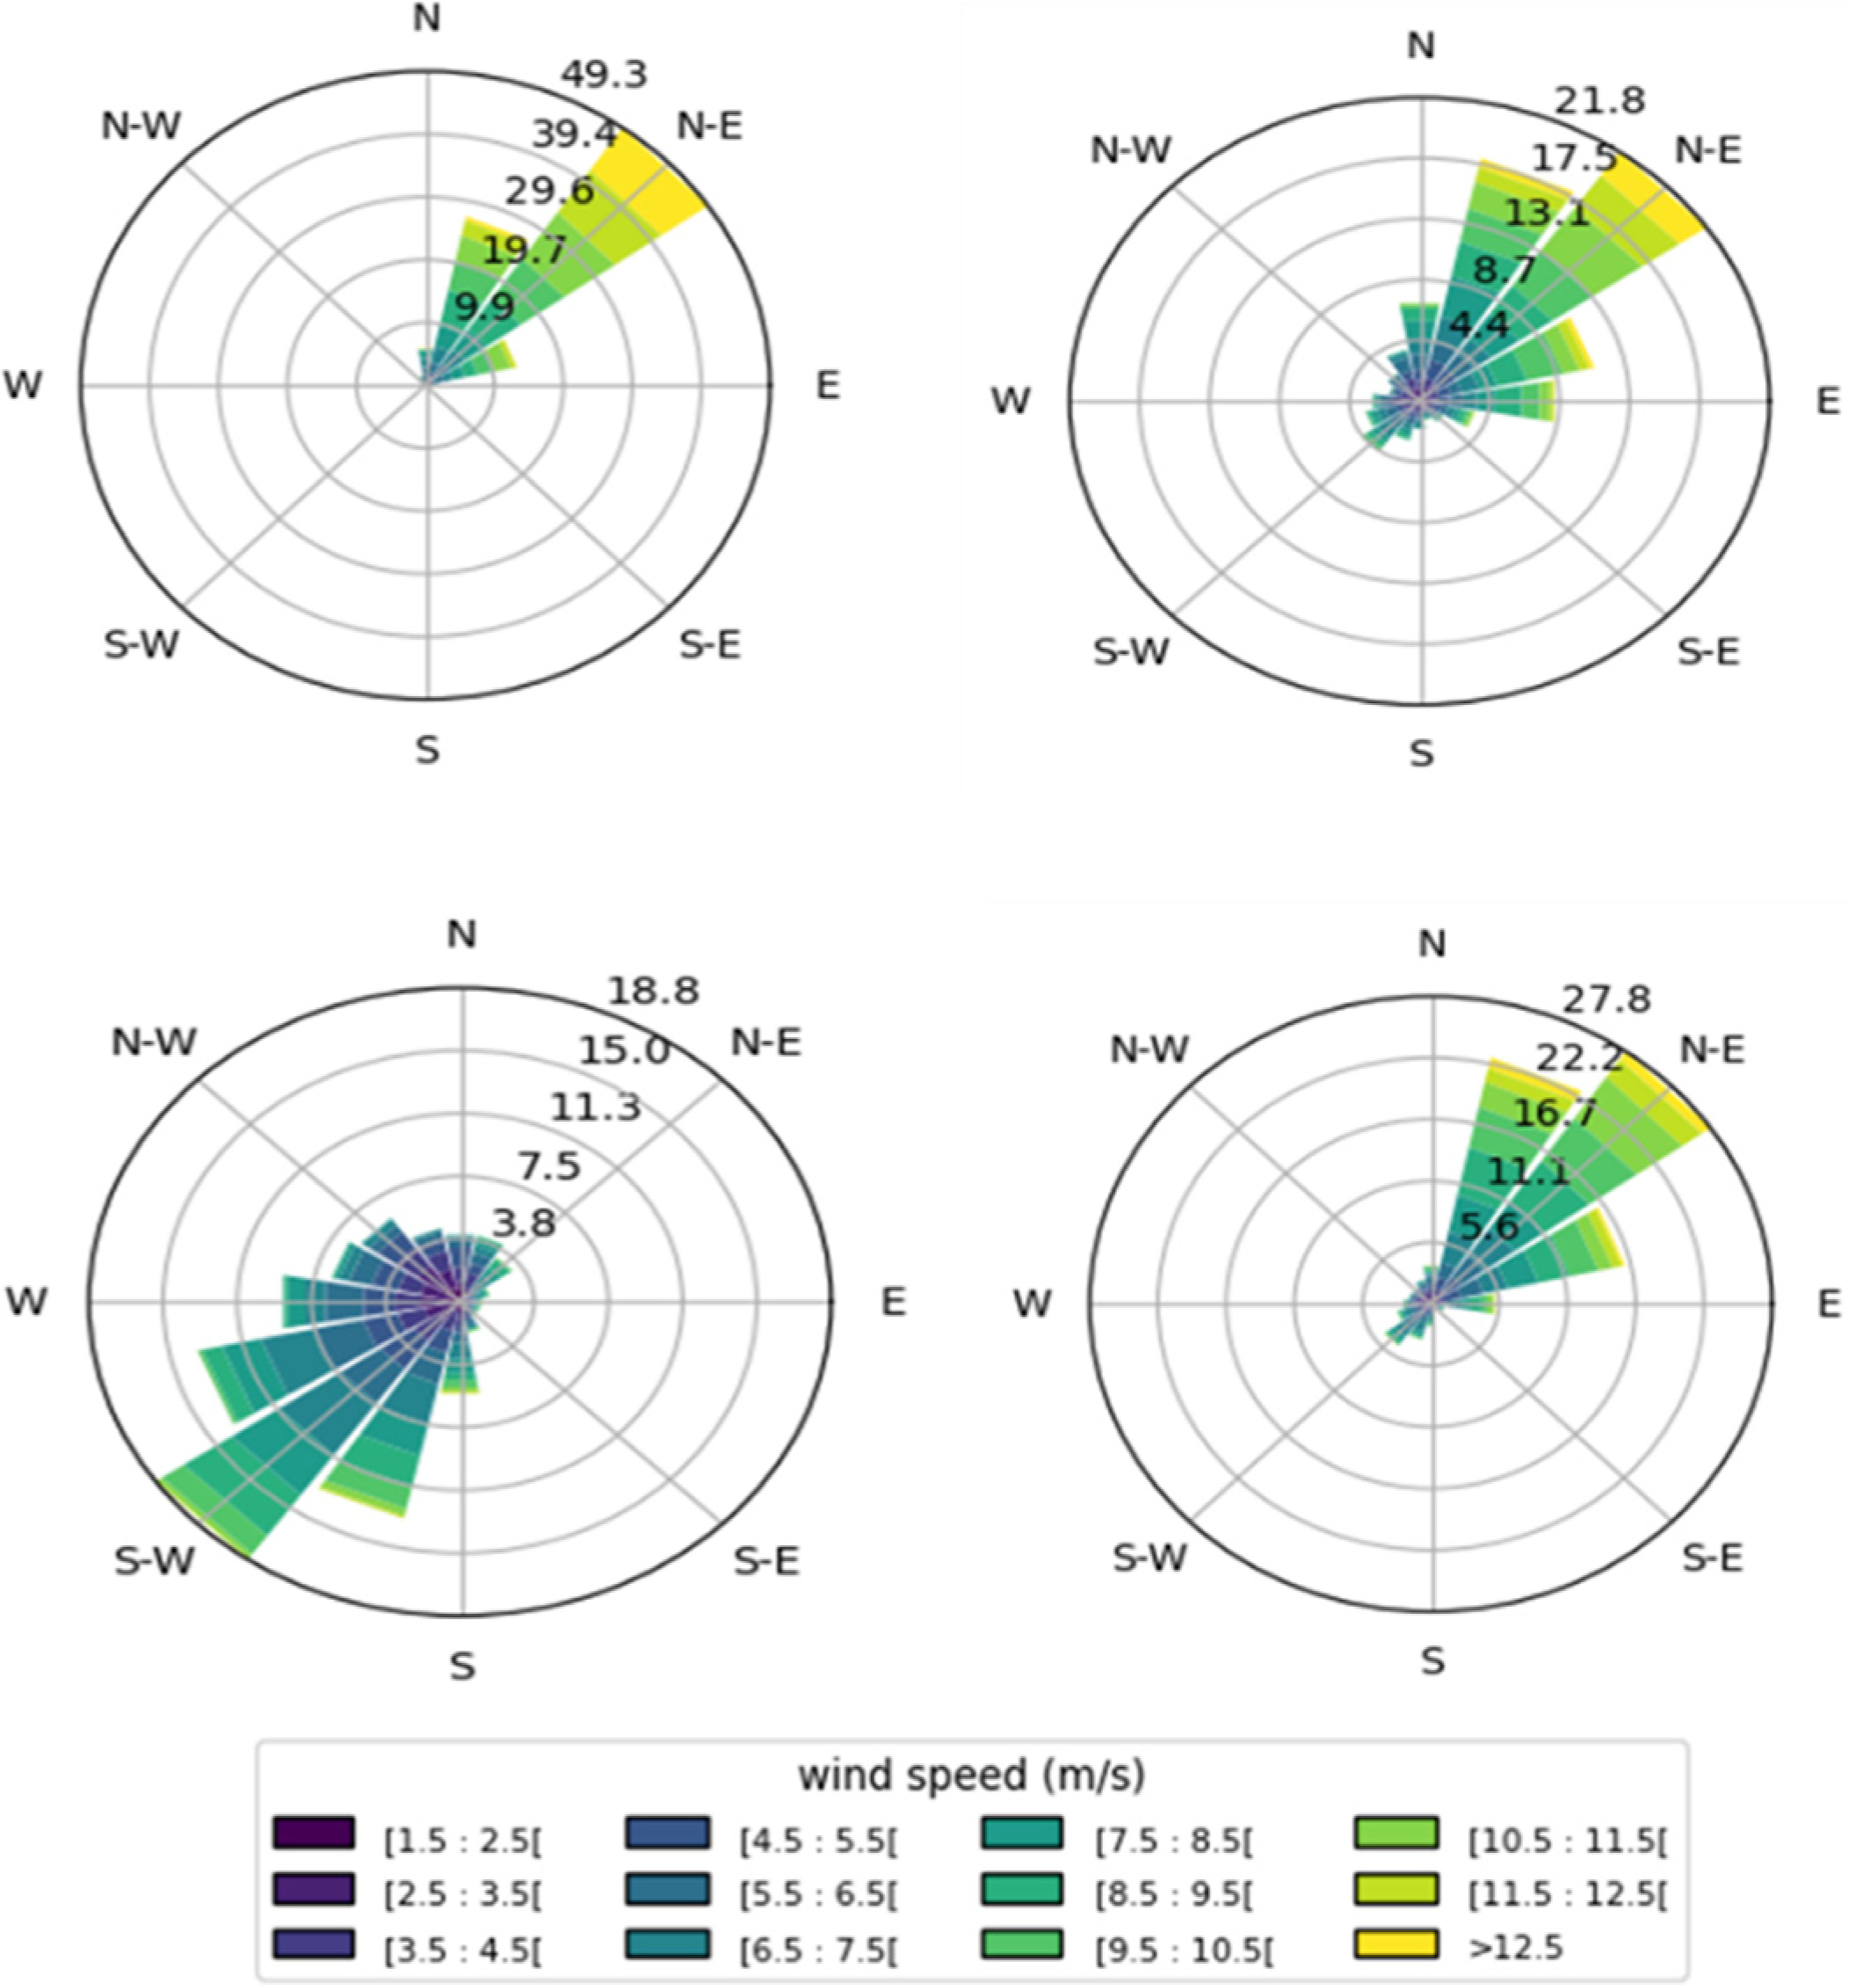
Wind direction variability in Chad by season.
To analyze seasonal wind patterns, we use streamlines (in blue) and vectors to represent wind dynamics across the four seasons. Figure 10(a)–(d) illustrates the streamlines of wind at 100 m for each season, while Figure 10(e)–(h) displays the corresponding wind vectors.
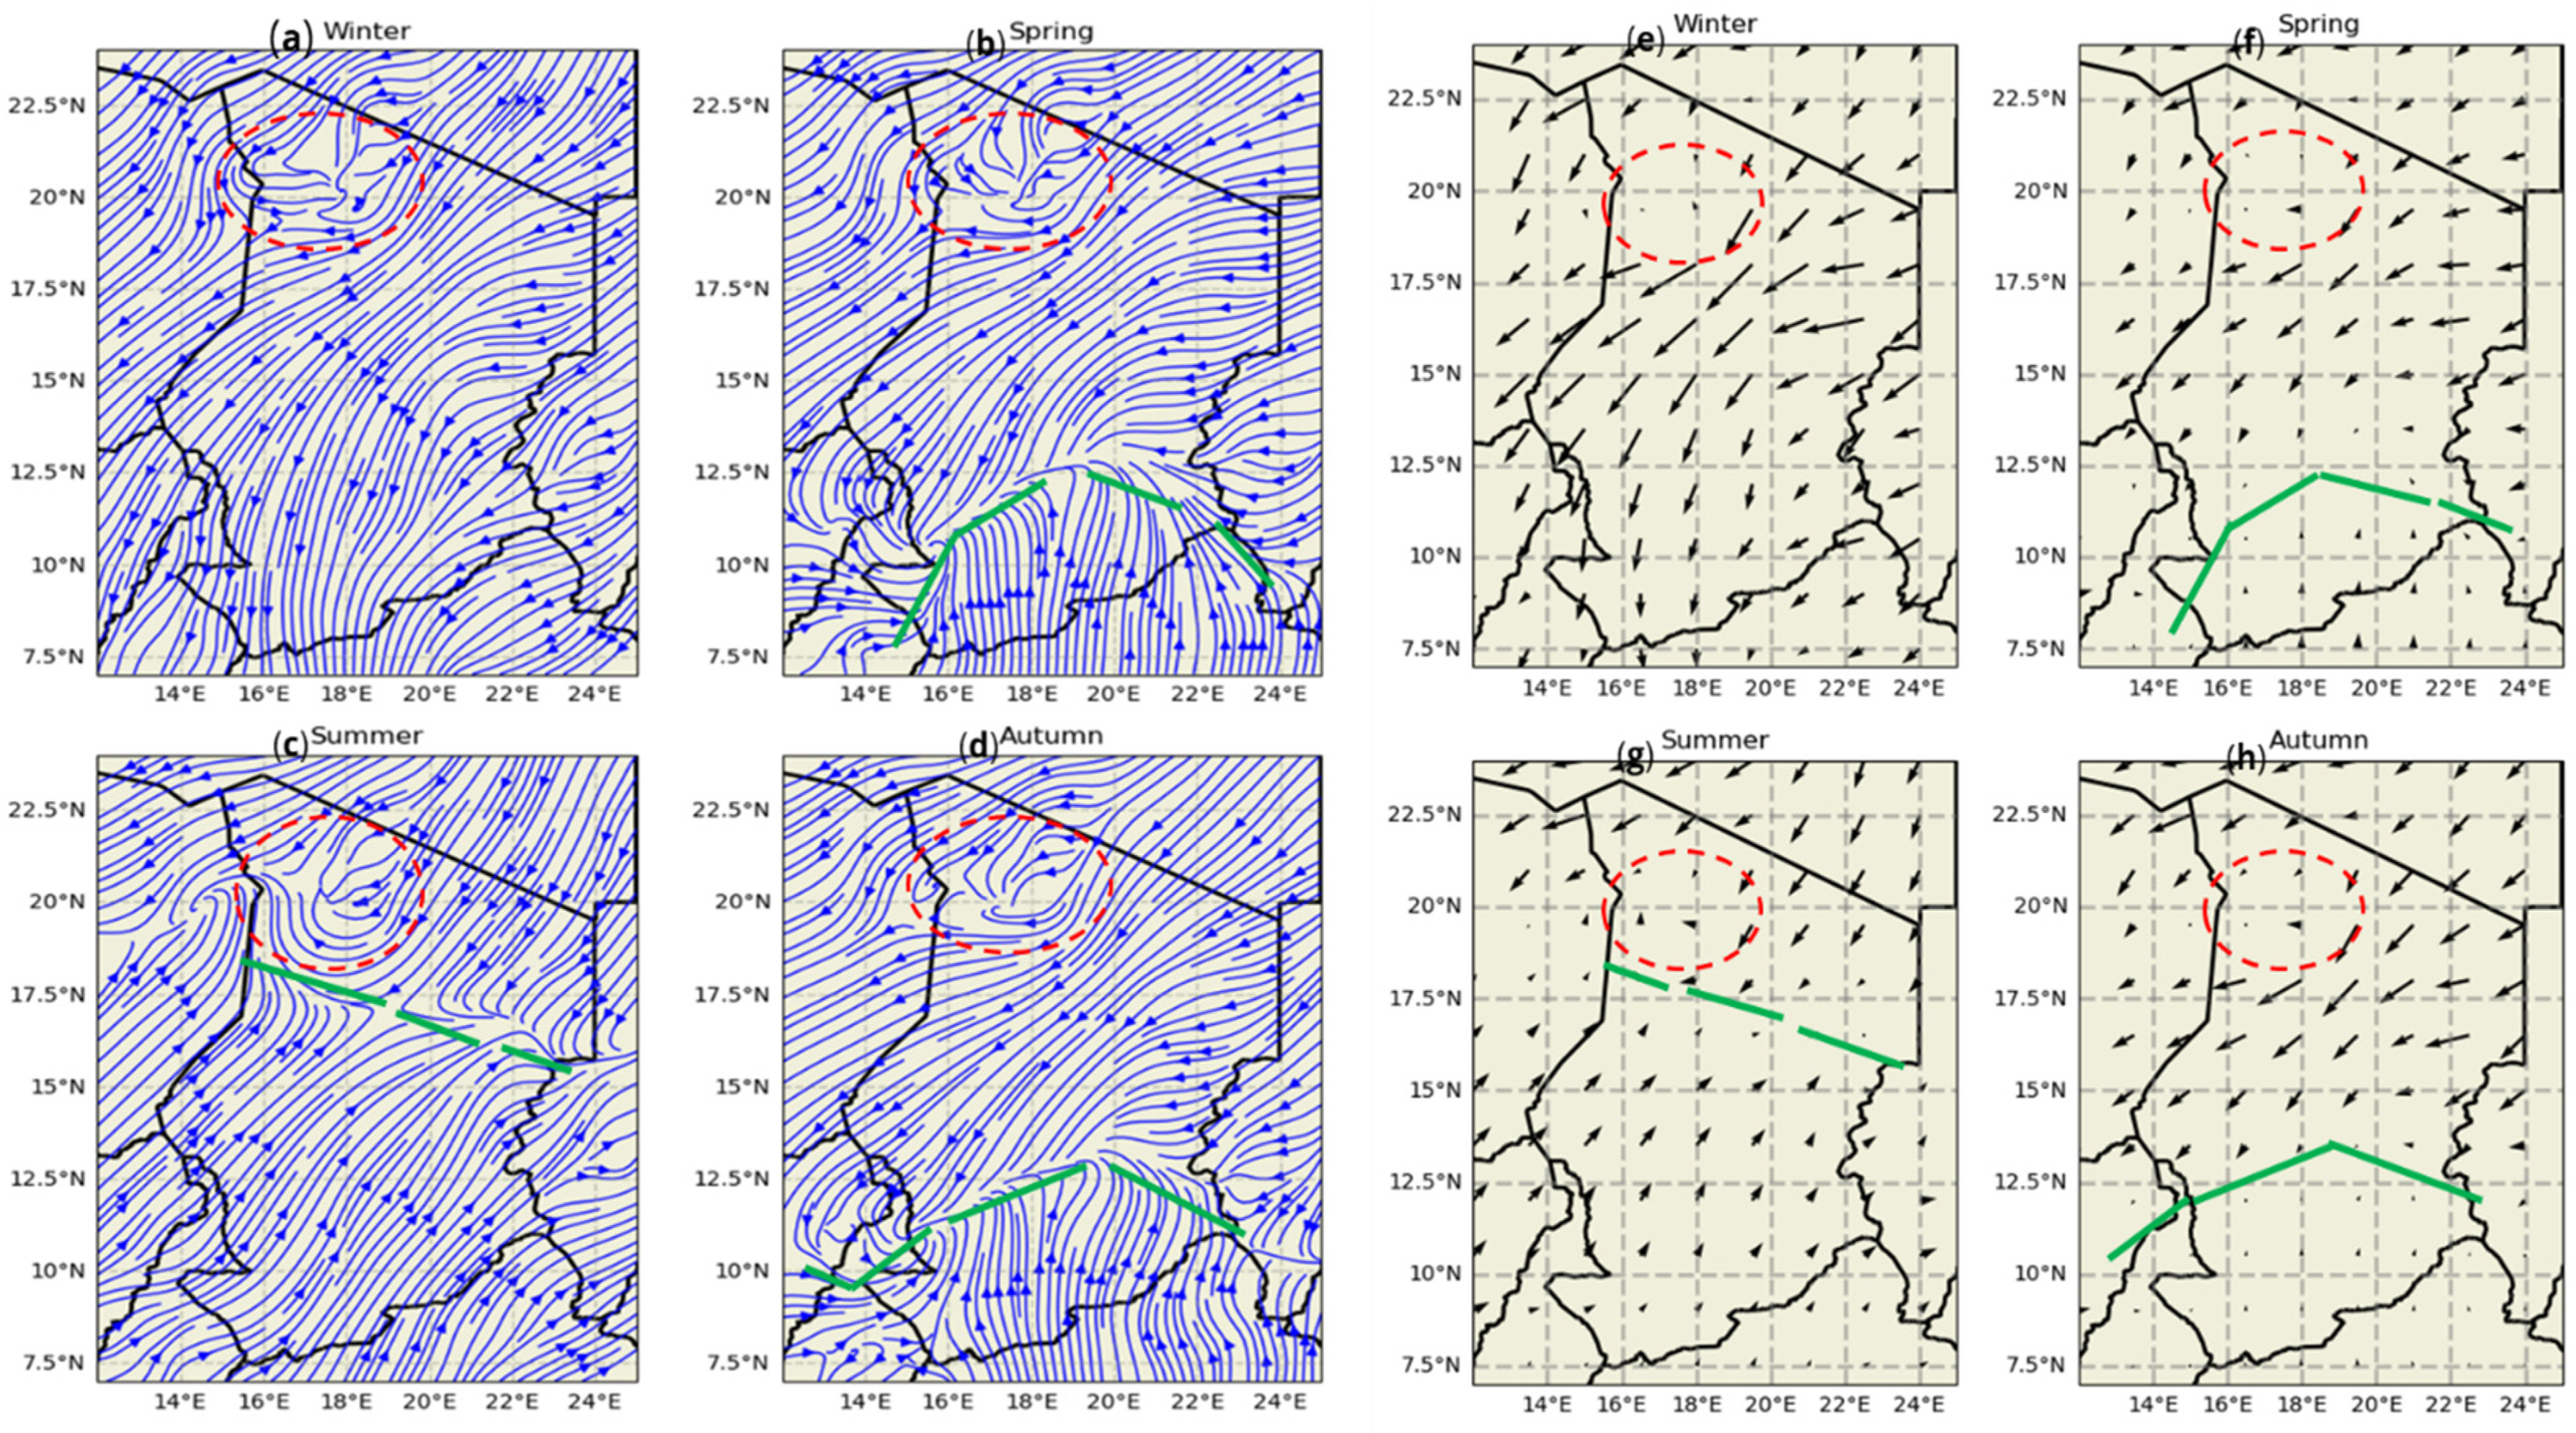
100-m wind streamlines (1993–2023): (a) Winter, (b) Spring, (c) Summer, (d) Autumn. 100-m Wind Vectors (1993–2023): (e) Winter, (f) Spring, (g) Summer, (h) Autumn.
The maps illustrate the presence of a permanent anticyclone, indicated by a red circle, situated in the extreme north of the country, between 18°N and 22°N, around the Tibesti mountain range, where wind speeds are very low. This topographic configuration in the Tibesti deflects and slows down the winds, resulting in particularly low wind speeds in this Saharan region. The green line denotes the position of the Intertropical Convergence Zone (ITCZ), marking the convergence between harmattan (northeast wind) and the monsoon flow (southwest wind). In winter (see Figure 8(a) and 8(e)), winds reach their maximum intensity, dominated by the northeast harmattan. This situation is associated with a decreasing north–south gradient. In spring, while most of the country continues to experience the influence of harmattan winds, the onset of the monsoon flow moving southward is observed. The ITCZ delineates the areas dominated by harmattan from those influenced by the monsoon. Figure 8(f) shows that the monsoon begins to establish itself in the south, bringing relatively weak winds. In summer, the monsoon (southwest wind) covers nearly the entire country, resulting in low wind speeds, while the ITCZ reaches its northernmost position around latitude 17°N. Figure 8(g) confirms this observation by showing that wind intensity is generally low south of the ITCZ. Finally, autumn marks the beginning of the monsoon's retreat, with the ITCZ moving south to around 11°N. Consequently, harmattan influence resumes over almost the entire country, as shown in Figure 8(h).
In summary, two main zones are observed regarding wind dynamics. The first zone, located between 7°N and 18°N, is primarily influenced by wind seasonality, including harmattan and the monsoon. The second zone, between 18°N and 22°N, is characterized by the exclusive presence of harmattan winds, where the influence of the permanent anticyclone is mainly attributed to topography, particularly the Tibesti mountain ranges. This observation is confirmed by Figure 2, which illustrates the presence of the Tibesti mountain ranges. Indeed, the humid air coming from the south of the country during the monsoon is blocked by this range. As a result, the area behind these mountains is characterized by harmattan winds, where the air descends, heats up, and dries out, resulting in high-pressure conditions. This phenomenon, combined with the influence on the stable atmosphere and surrounding pressure system, contributes to the persistence of the high-pressure area (anticyclone). Therefore, seasonal variations and topographic effects explain the marked differences observed in wind dynamics at 100 m in Chad.
Figure 11 compares daytime and nighttime winds by illustrating the diurnal wind cycle from 1993 to 2023, with the wind patterns for Chad shown in blue, the northern part in red, and the southern part in green. A pronounced diurnal cycle is observed, with similar trends across all regions. Focusing on the blue curve, it is evident that maximum wind speeds occur at night, between 18:00 and 06:00, while minimum values are recorded during the day, between 07:00 and 17:00. In conclusion, wind speeds are approximately 25.68% higher at night than during the day.
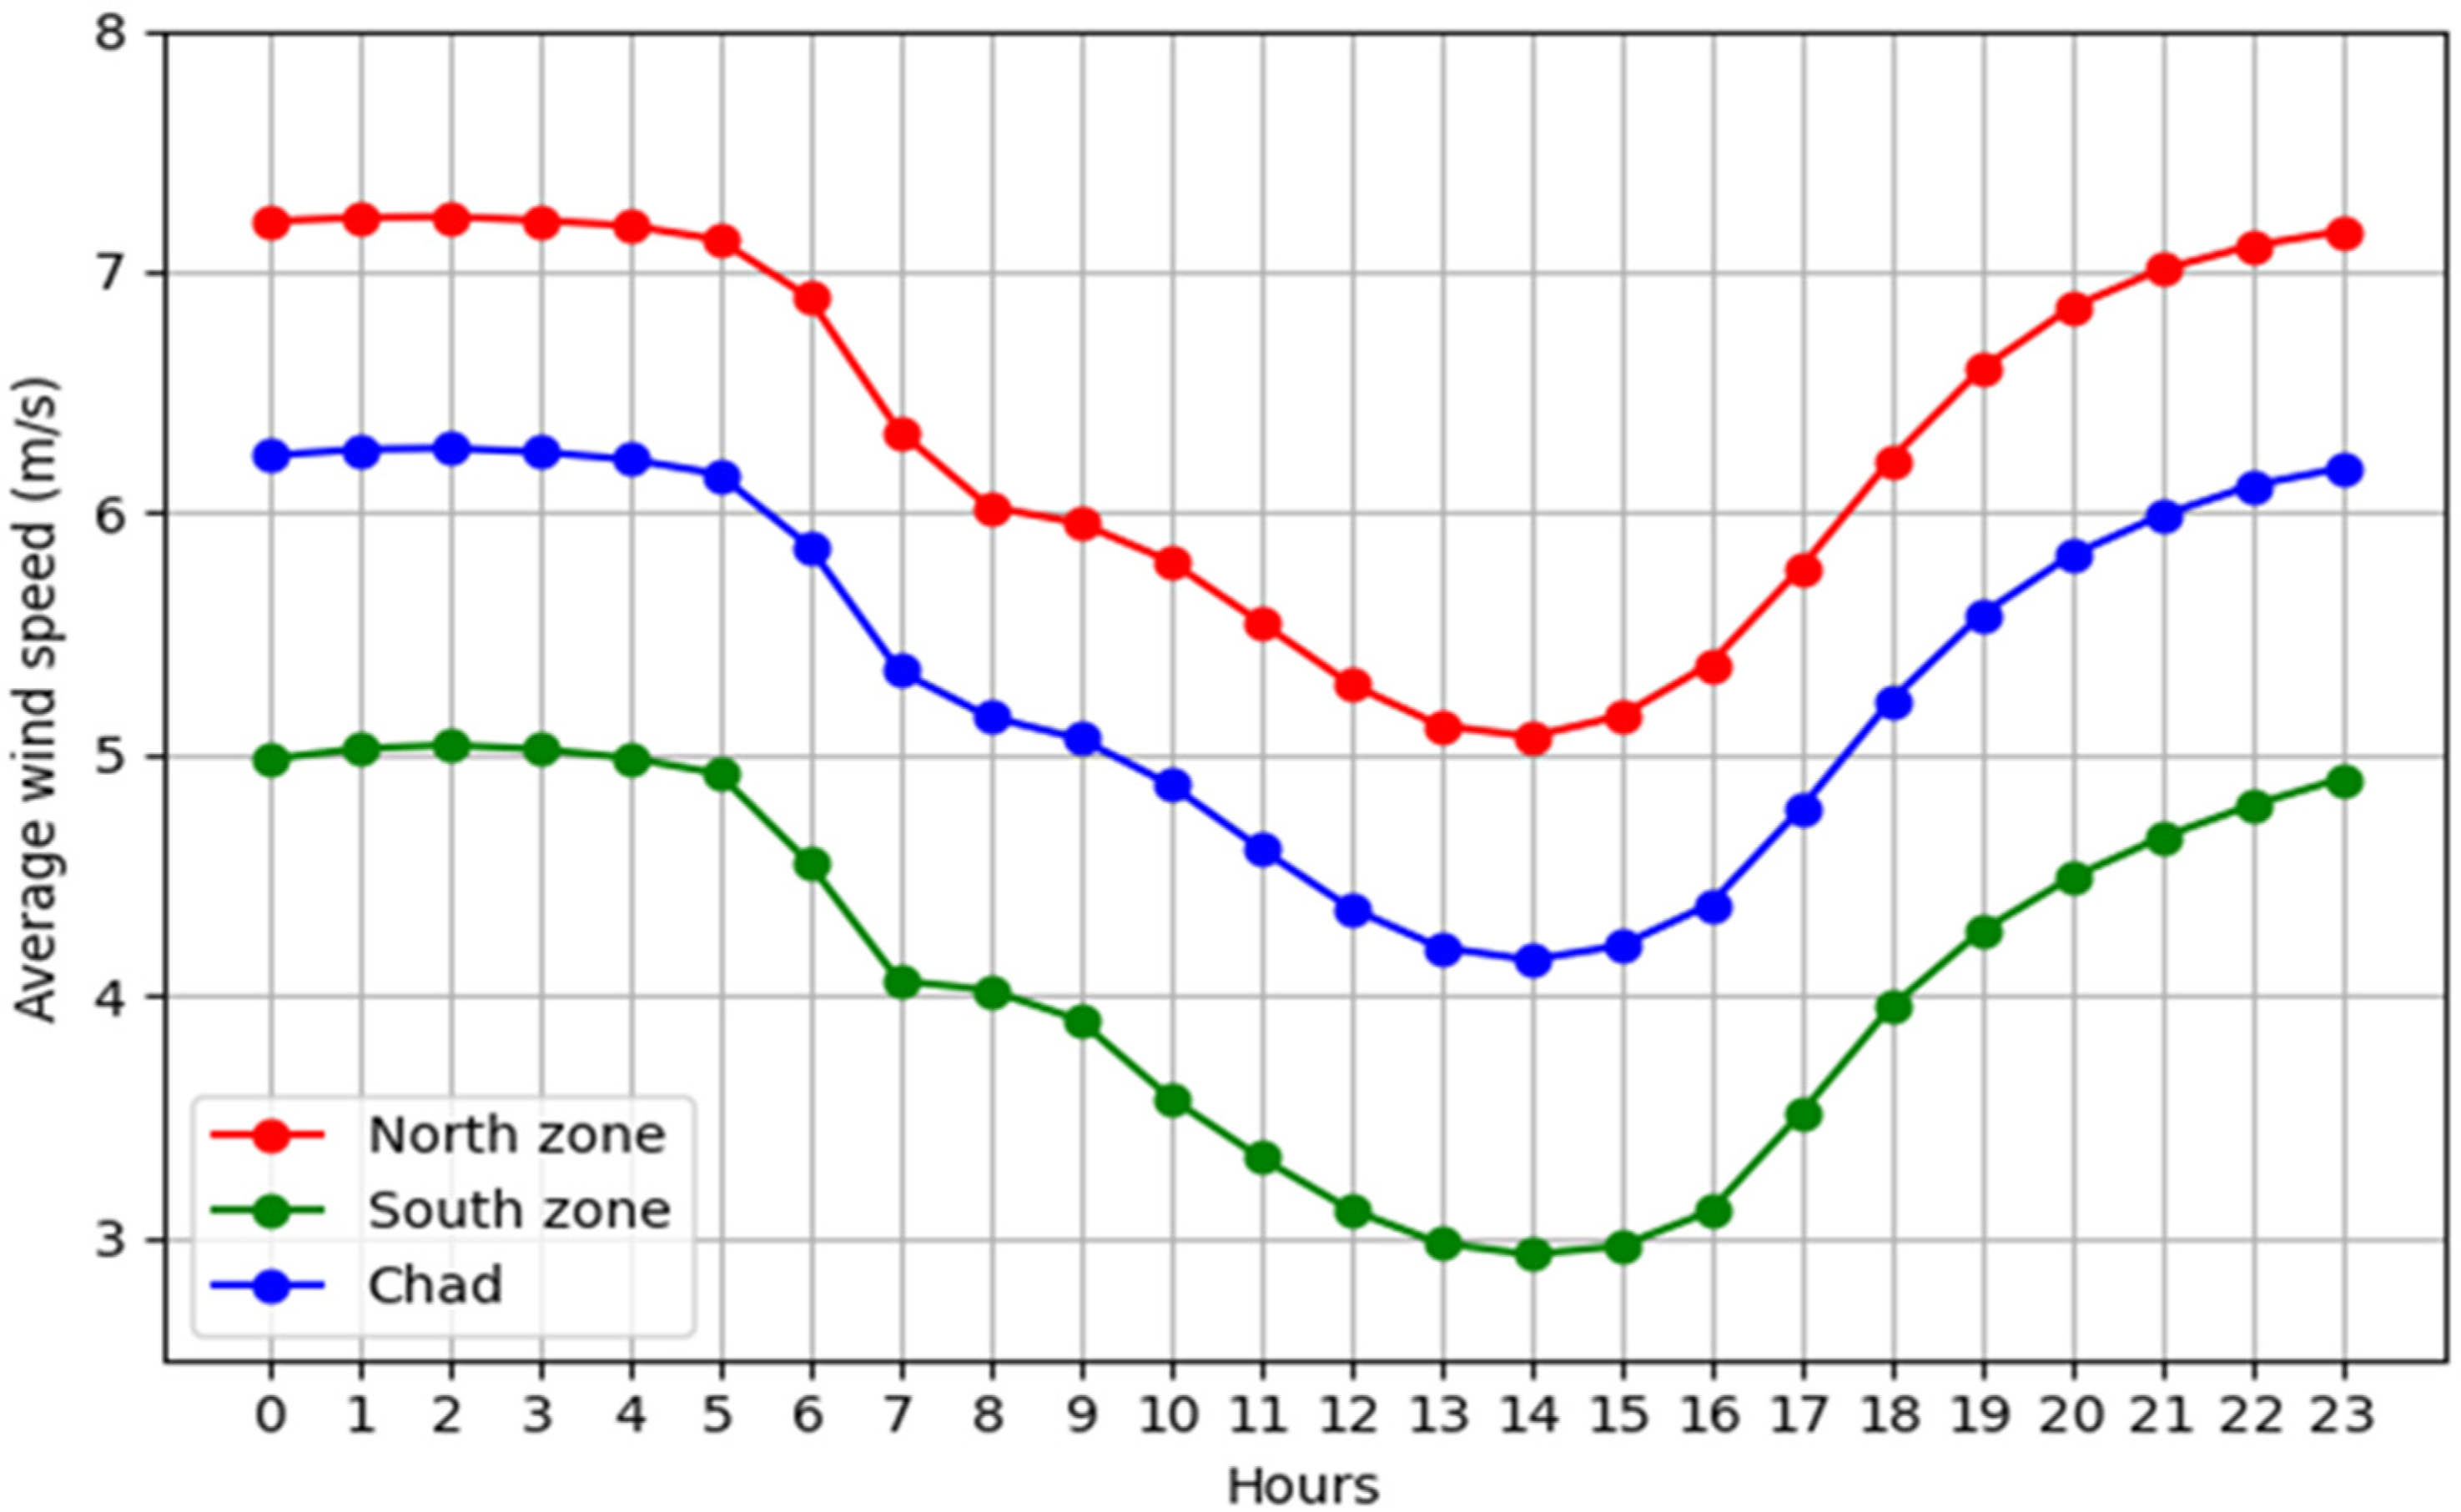
Diurnal wind speed cycle for the northern zone (red), the southern zone (green), and the entire country of Chad (blue) over the period 1993–2023.
Figure 12 provides a spatial visualization of this diurnal cycle across the country. It shows that winds intensify at night throughout the country (figure on right), except around the permanent anticyclone in the far north. On average, wind speeds reach 7.5 m/s during the day and 11 m/s at night in Chad. Overall, winds in Chad are approximately 26% stronger at night than during the day.
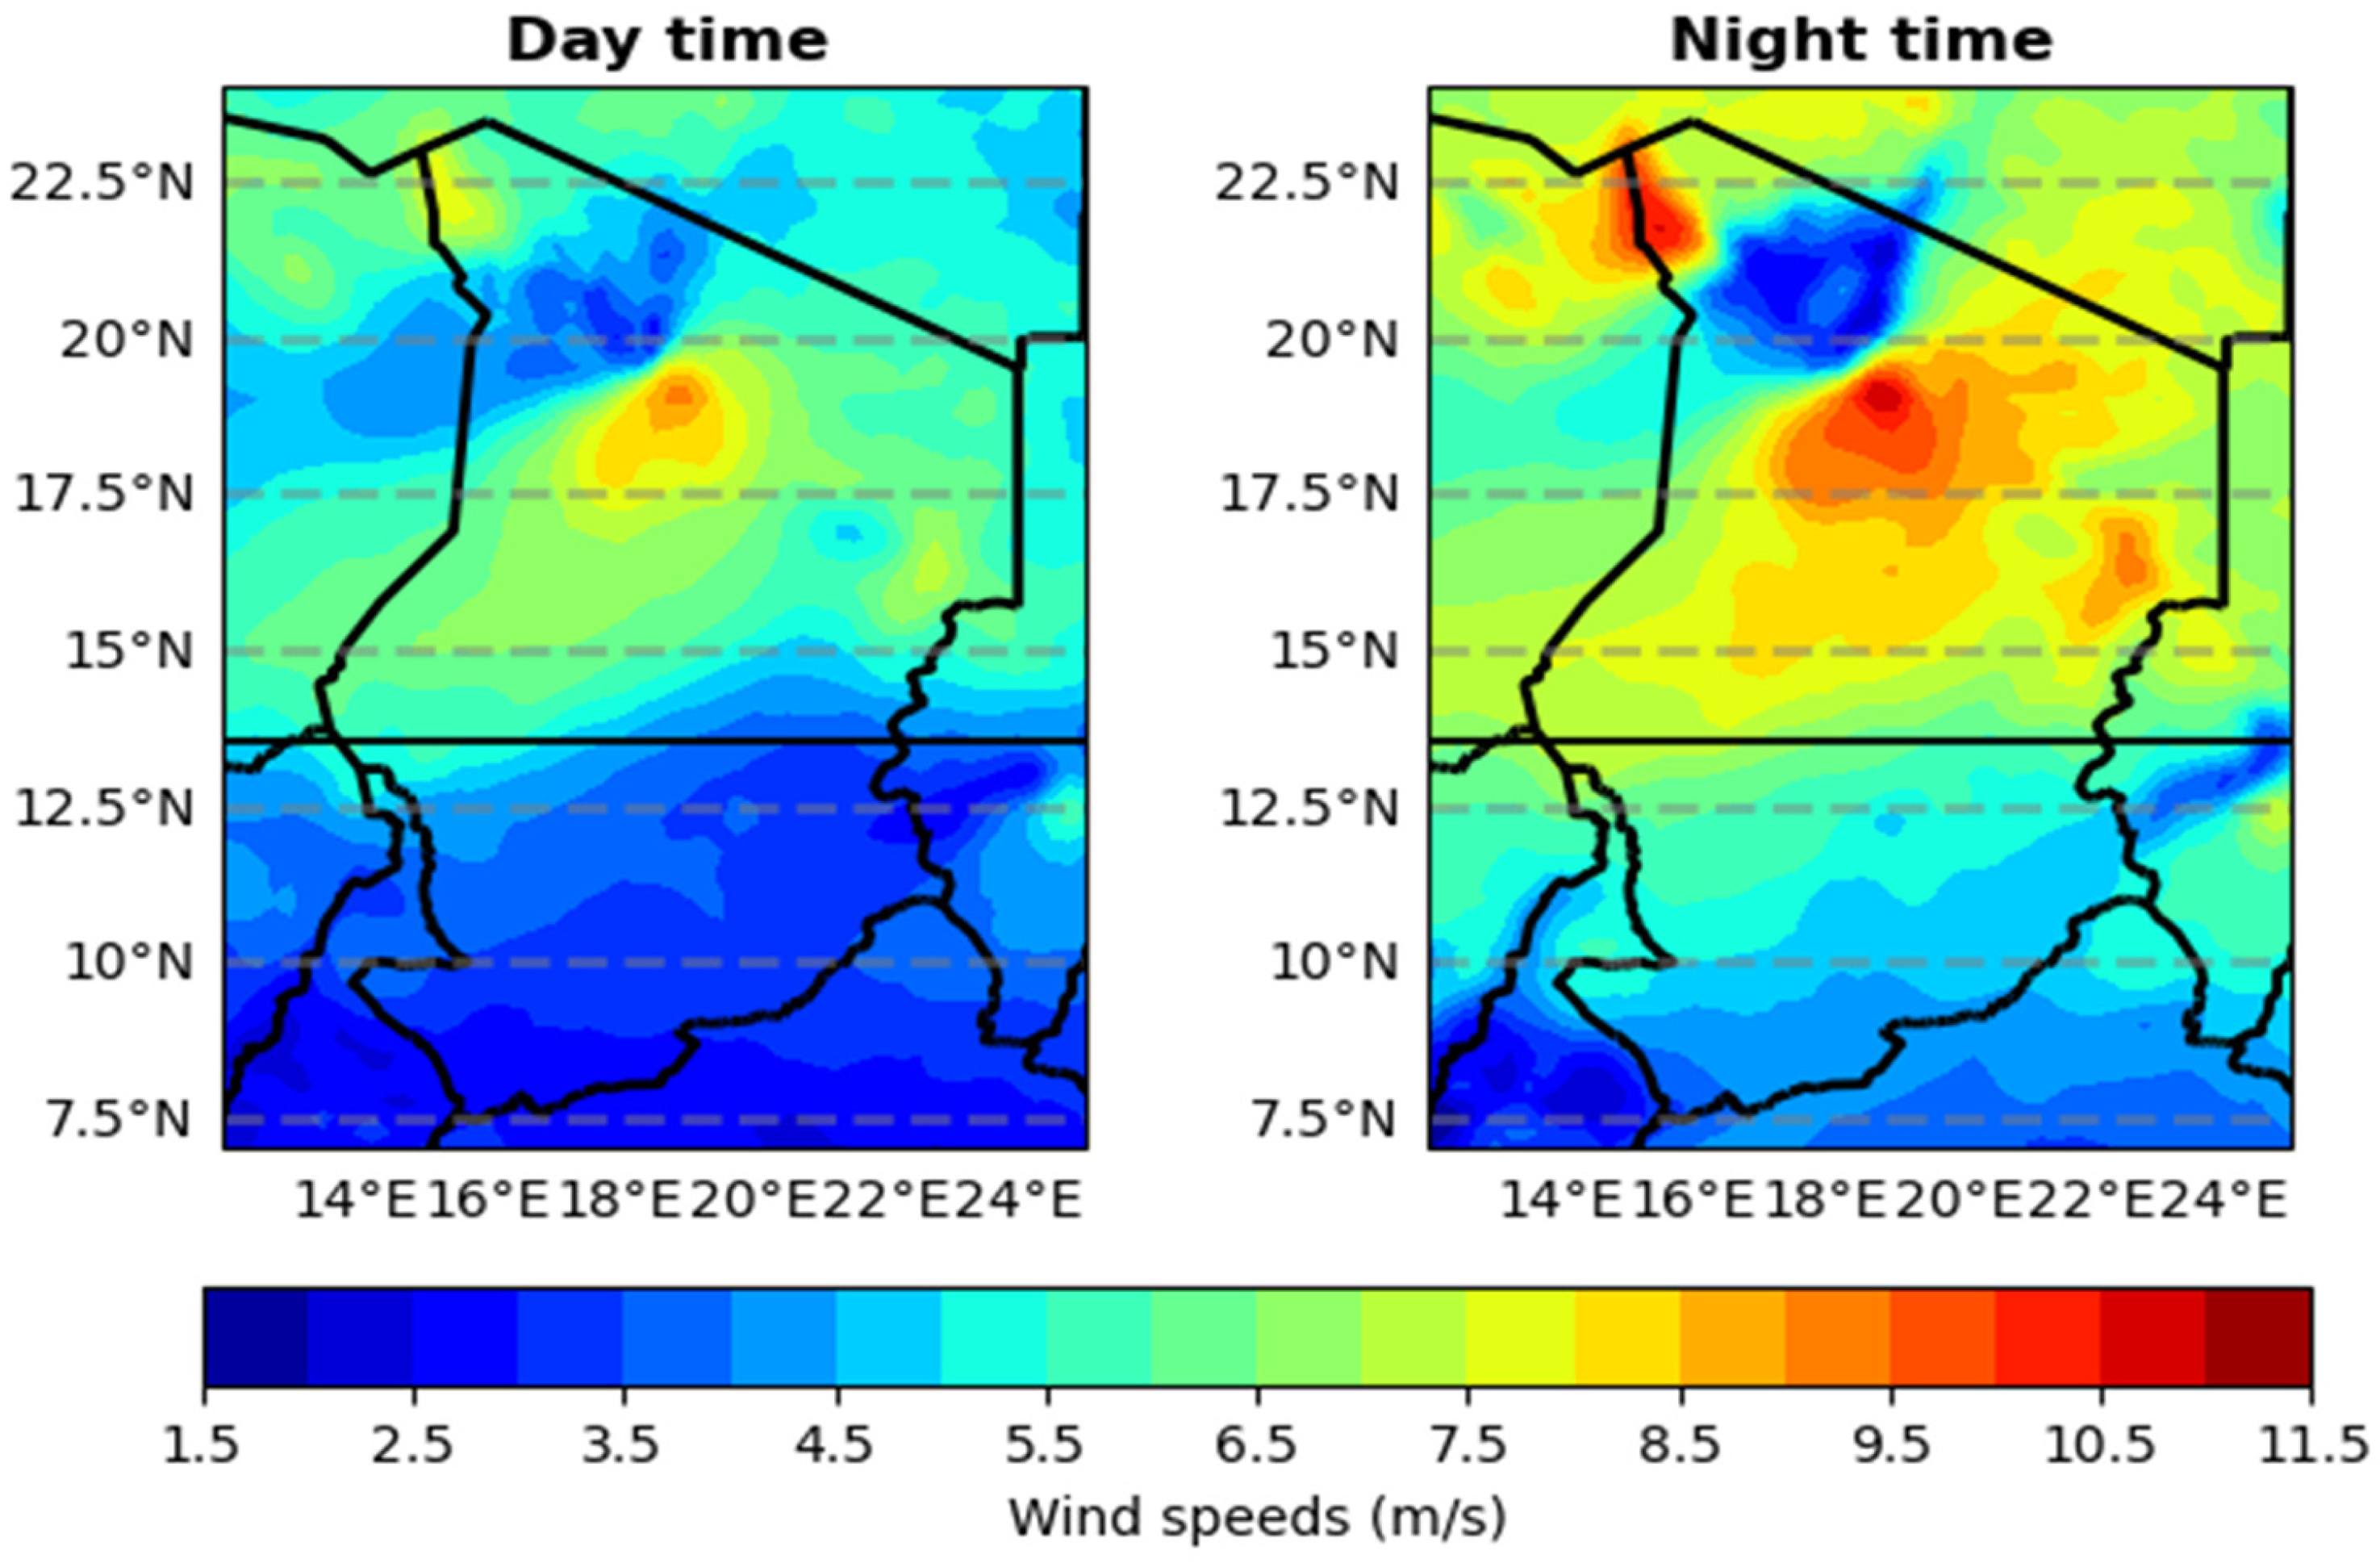
Spatial representation of diurnal wind cycle in Chad: daytime (left) and nighttime (right).
The diurnal cycle of wind speeds is primarily linked to nocturnal thermal inversion, a phenomenon common in arid climates. After sunset, the Earth's surface cools rapidly, creating a sharper temperature gradient that accelerates wind speeds (Madougou et al., 2013). Consequently, wind speeds are often higher at night at around 100 m altitude, mainly due to the formation of nocturnal jets and the associated atmospheric dynamics. During the day, solar heating generates turbulence, reducing wind speeds near the ground. In contrast, at night, the absence of solar radiation leads to a thermal inversion that stabilizes the atmosphere, promoting the formation of nocturnal jets at altitudes between 100 and 300 m (Whiteman, 2000; Yang et al., 2023). This dynamic is confirmed by reanalysis data from the ERA5 model, which highlights the impact of nocturnal jets on nighttime wind speeds, a crucial factor for assessing wind energy resources (Hersbach et al., 2020).
Identification of favorable areas for wind farm installation
To identify the most suitable areas for future wind farm installations, Figure 13 provides a wind climatology (latitude/time) covering the period from 1993 to 2023. The average wind speeds were calculated for a longitude range between 16°E and 20°E, where the highest wind speeds were observed, as shown in Figure 5.
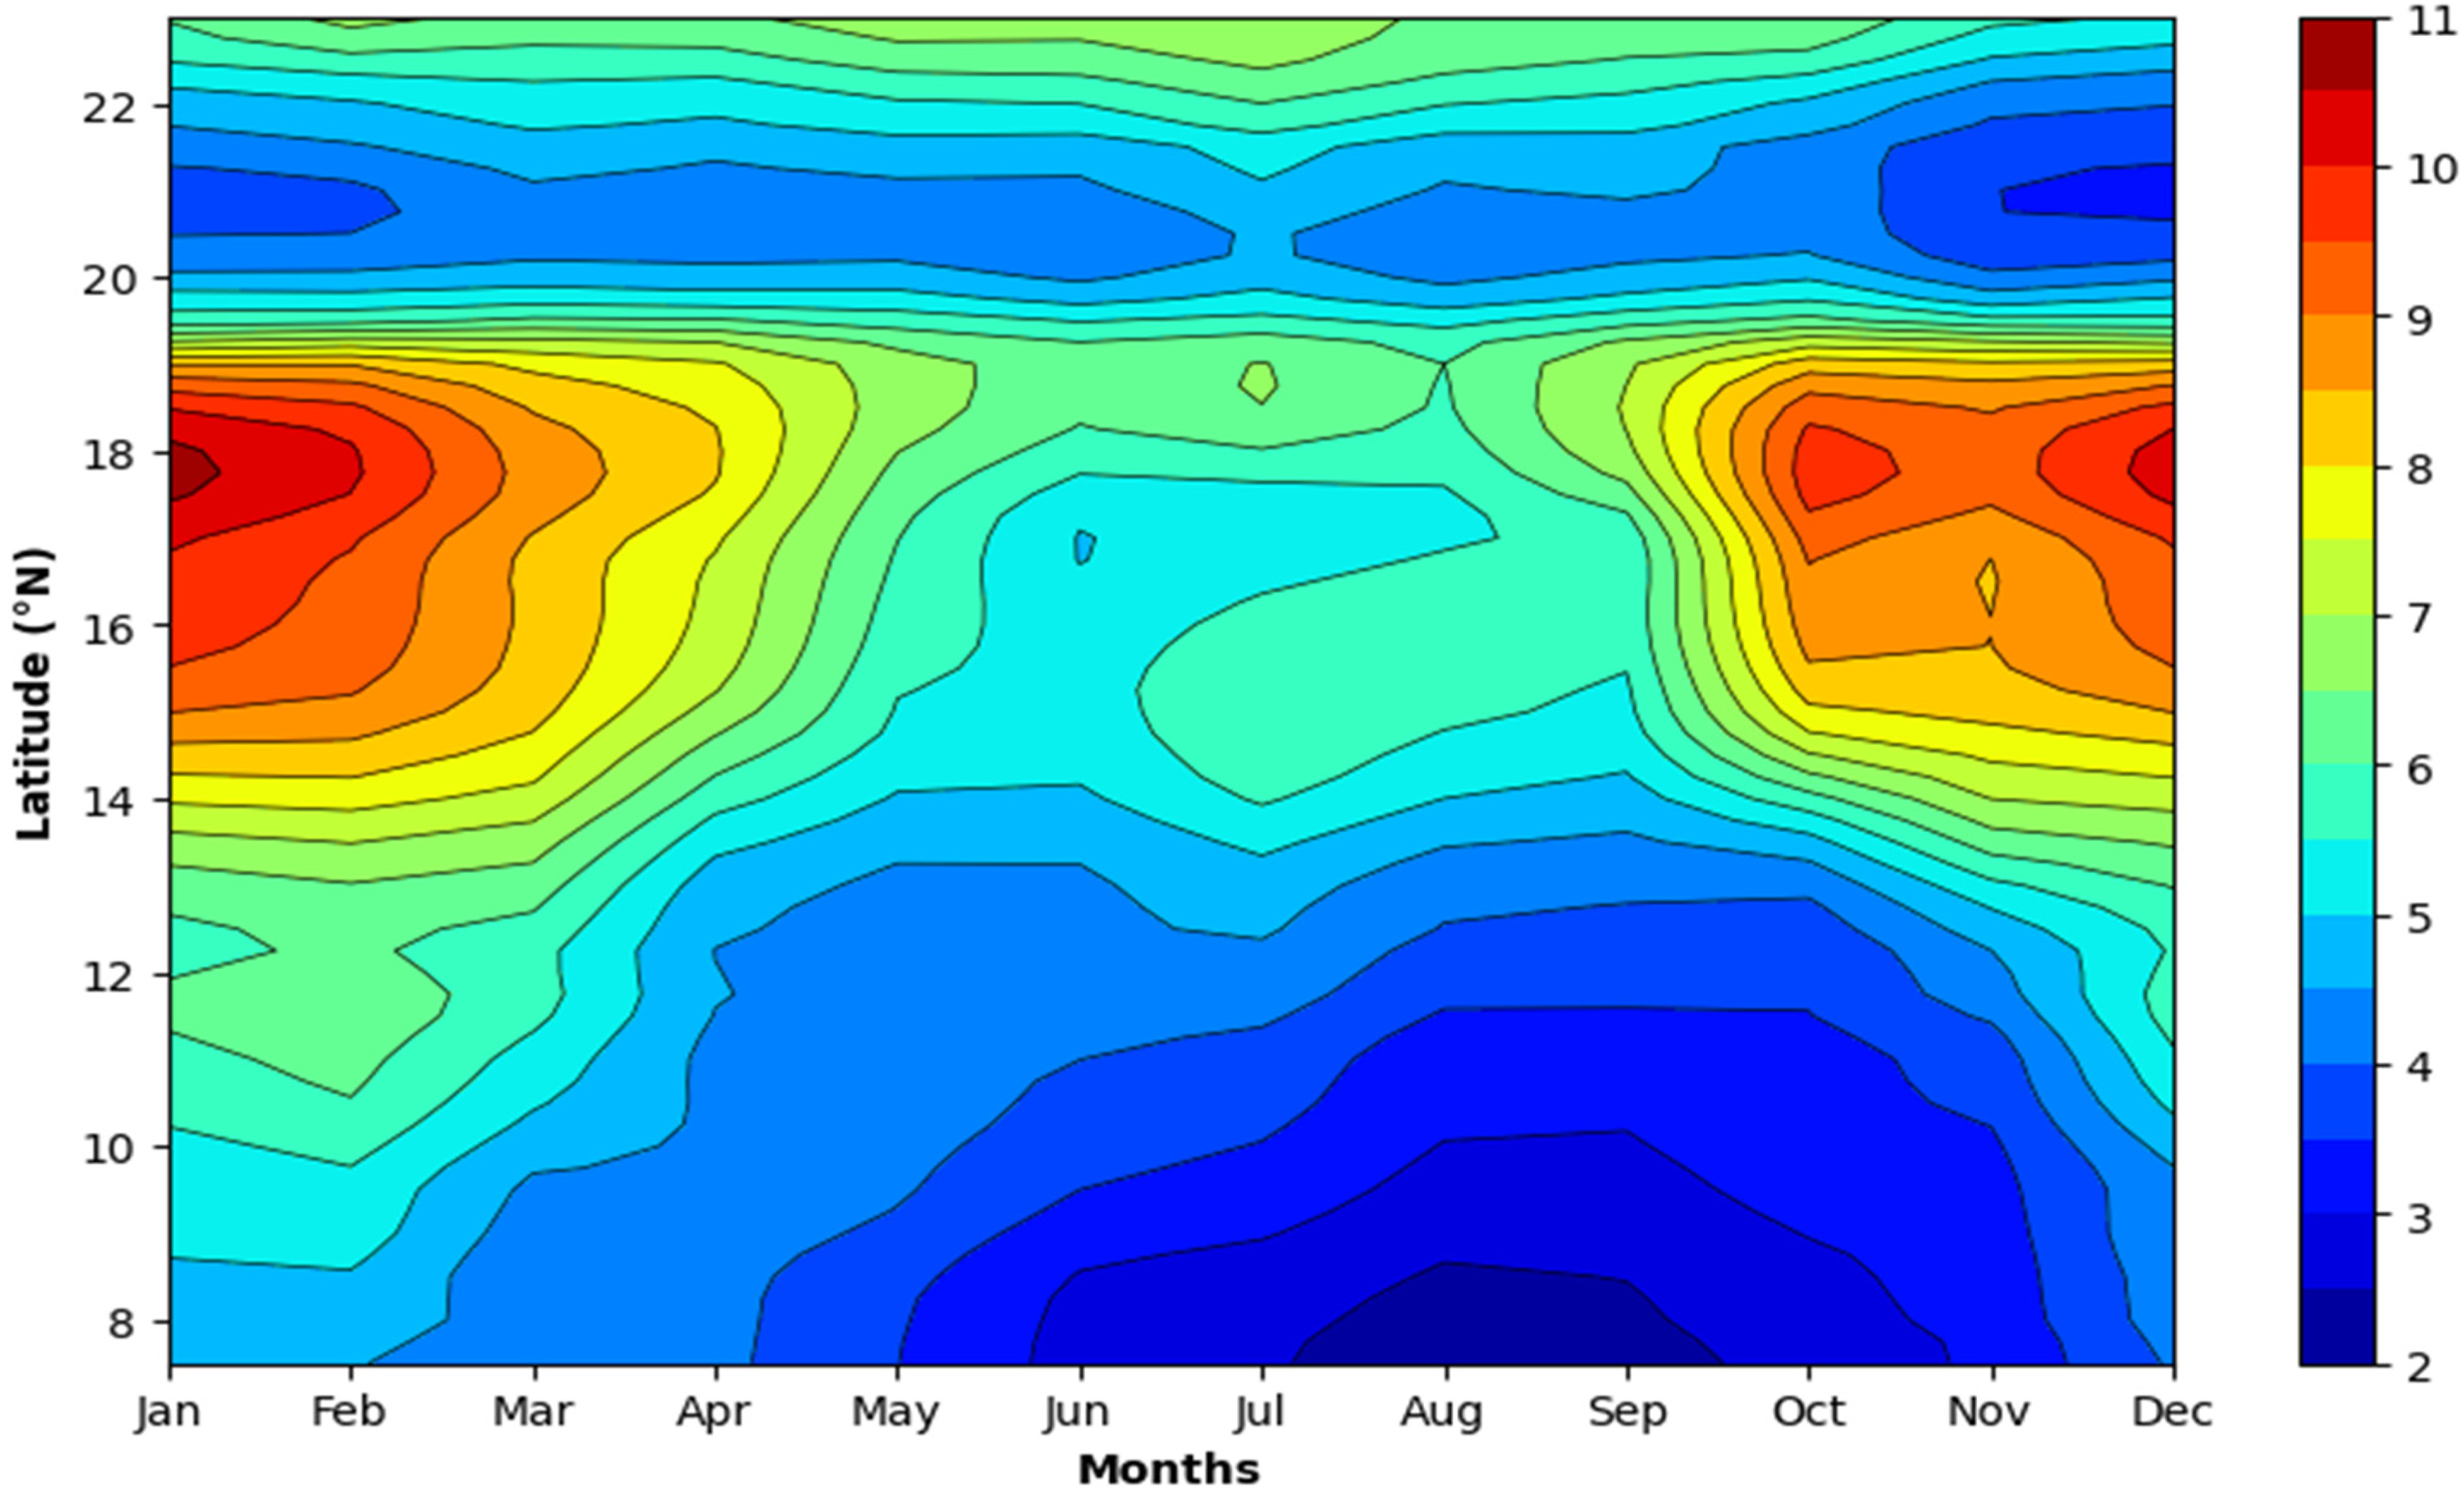
Wind climatology (latitude/time) at 100 m between 1993 and 2023 in Chad. Average calculated within the longitude range: 16°E to 20°E.
Firstly, an area of low wind potential is observed, characterized by wind speeds below 5 m/s, located primarily between 7.5°N and 12°N, encompassing the Guinean and Sudanian climatic zones. However, a seasonal cycle is observable, with lower wind speeds during the rainy season, which extends from May to November. Next, the figure reveals that the area of Chad, located between the Saharan and Sahelian zones and specifically between latitudes 12°N and 20°N, exhibits the highest wind potential, with wind speeds ranging from 7 to 11 m/s. A seasonal cycle is also observable, with peak wind speeds occurring from September to April. Finally, beyond 20°N, another area of low wind potential is observed. This arid region is characterized by the presence of a mountain range and the influence of a permanent anticyclone, which significantly reduces wind intensity.
Long-term analysis of wind trend evolution
To understand the evolution of wind speed trends at 100 m, Figure 14 presents the annual average wind speed from 1993 to 2023, along with a statistical regression line. Additionally, the ENSO index (El Niño–Southern Oscillation), which represents temperature anomalies (Huang et al., 2017), has also been overlaid on this figure. Interannual variations of wind range from 6.3 to 7.2 m/s. Overall trends indicate a slight decrease since 2015. It is observed that the interannual variability of wind speeds aligns with that of the ENSO index. In particular, years with maximum wind speeds correspond to El Niño events, which are associated with temperature anomalies greater than 0.5°C. In contrast, years with minimum wind speeds correspond to La Niña events, which are associated with anomalies less than −0.5°C. These findings for the Sahel are consistent with those of Okonkwo et al. (2014) and Armitage et al. (2015). Consequently, the interannual variability of wind speeds in Chad is primarily influenced by major climatic factors, particularly the El Niño Southern Oscillation (ENSO), which alters regional atmospheric patterns.
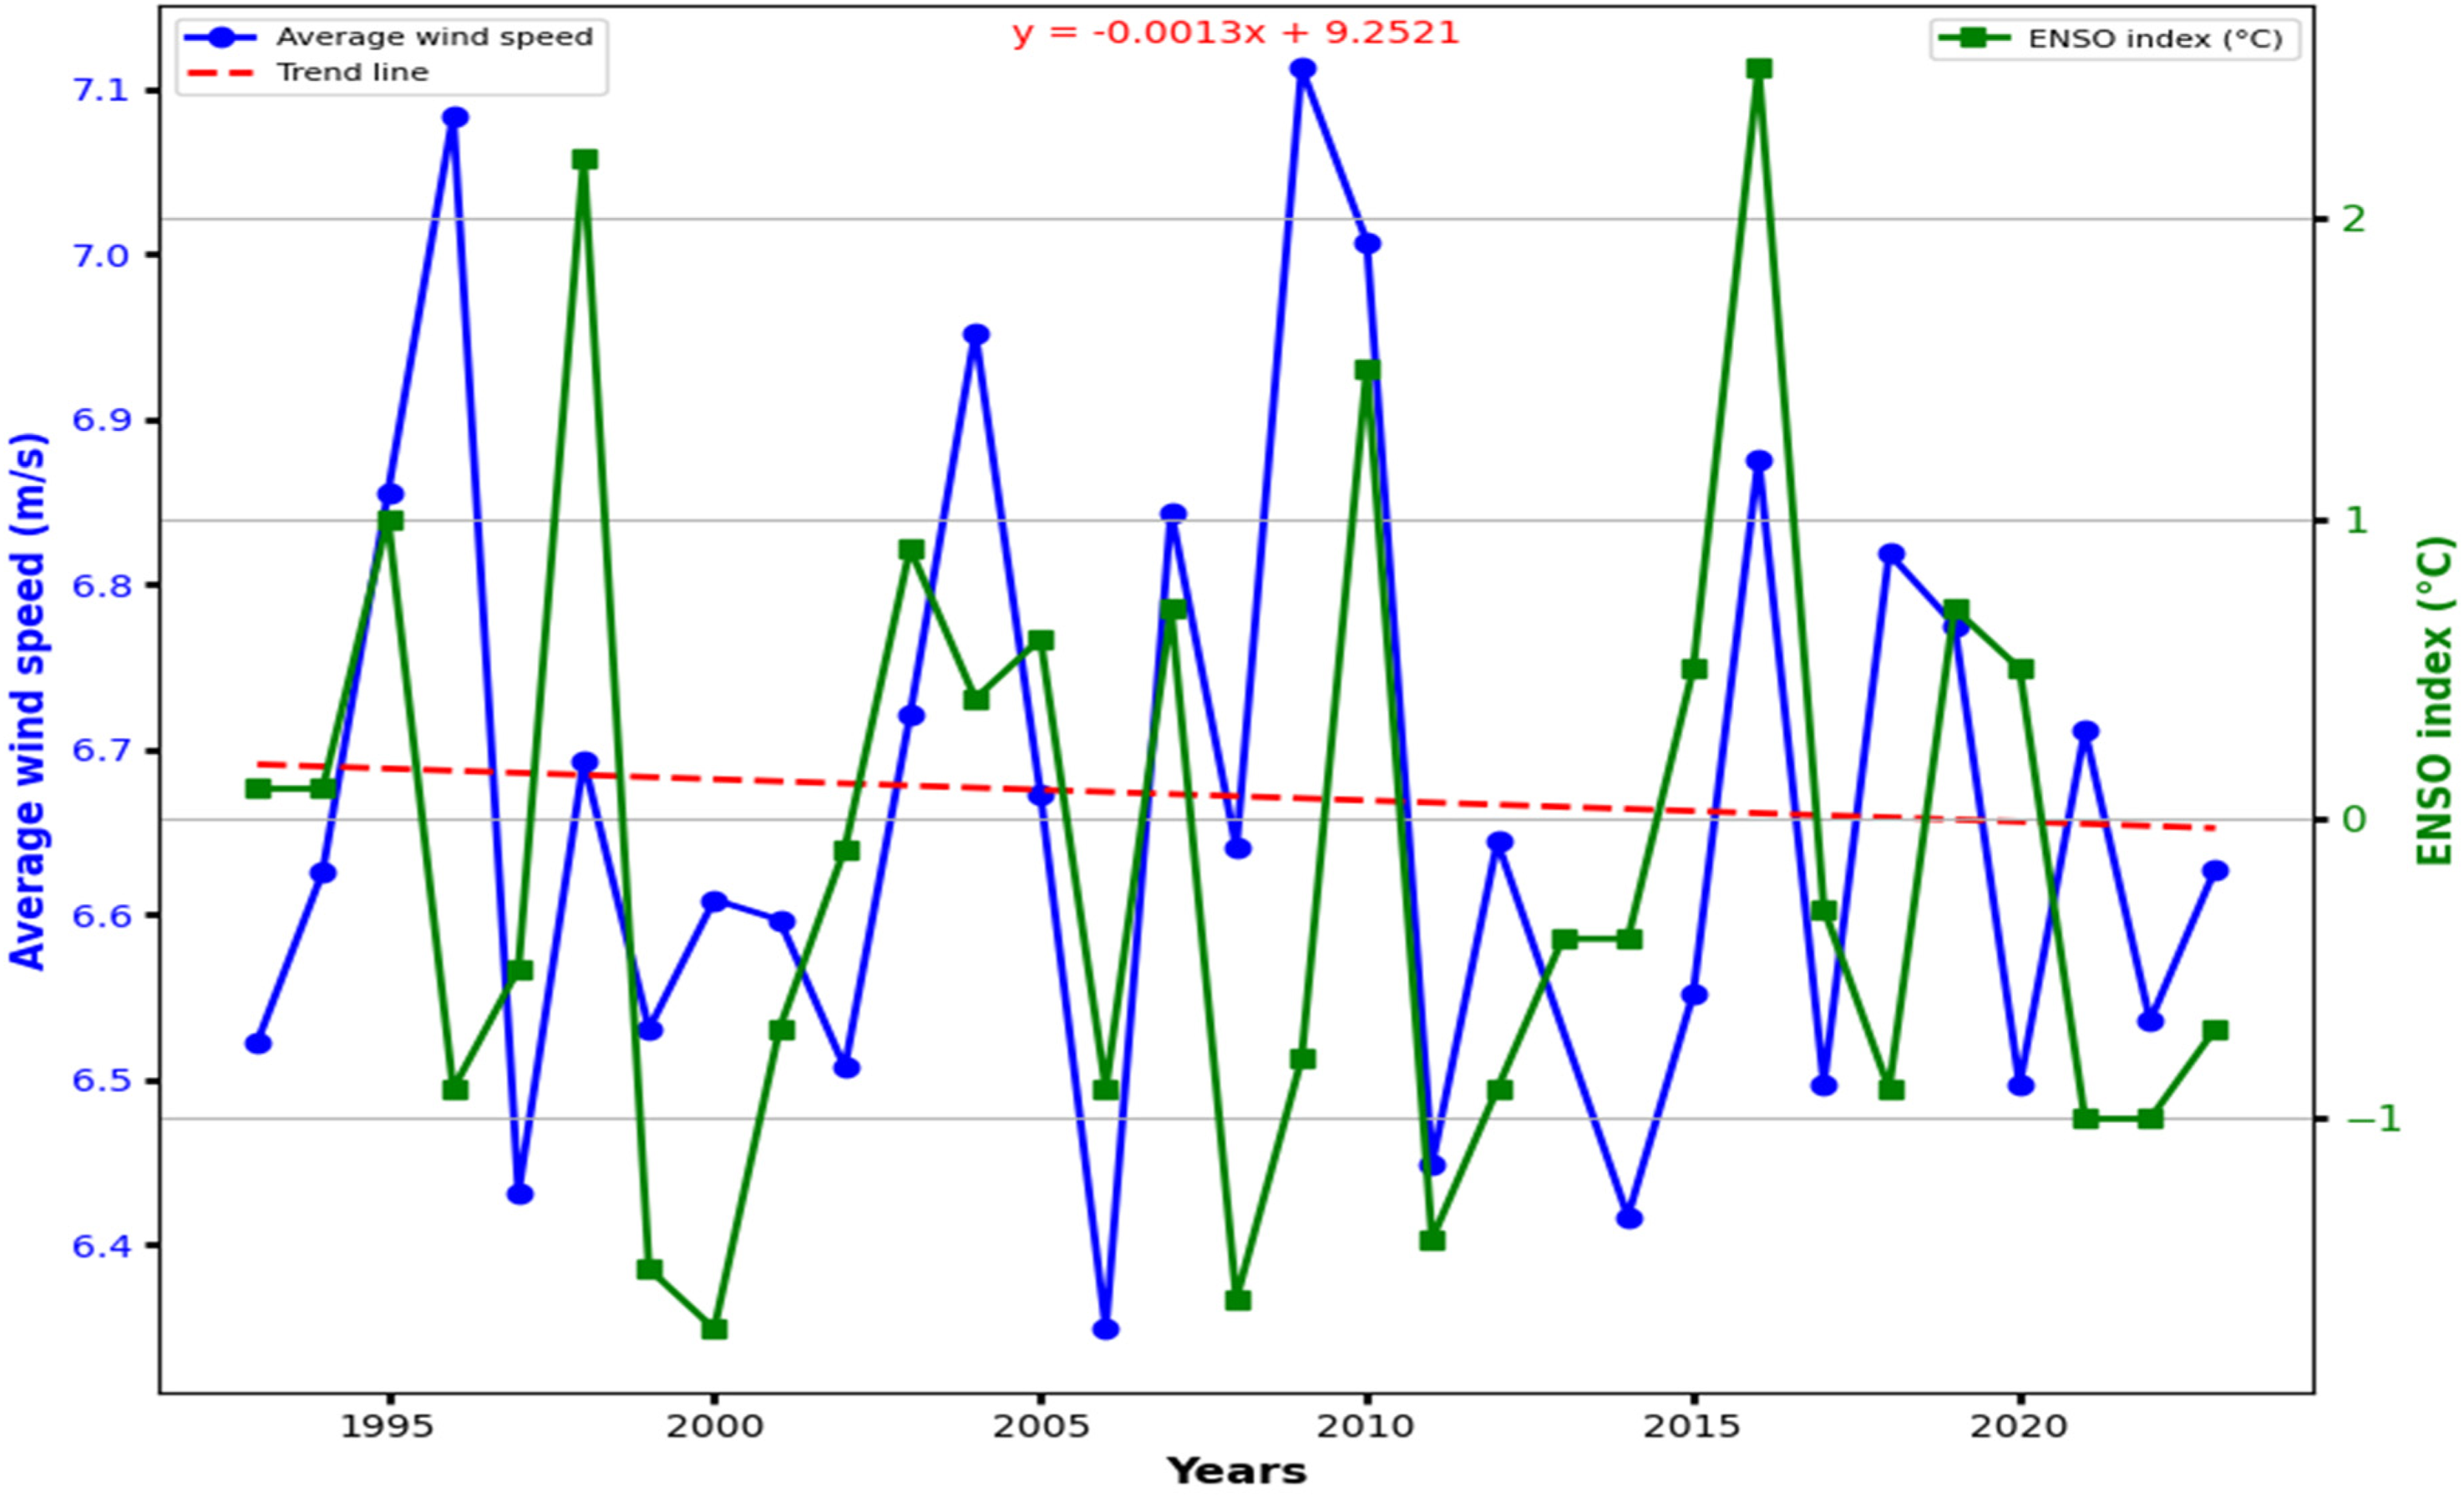
Interannual variability of 100-m wind (in blue) speed and El Niño–Southern Oscillation index (in green) between 1993 and 2023 in Chad. The red line (dashed) represents linear regression of wind speed.
Several studies have shown that climate change may increase the influence of ENSO on Central African climate, leading to changes in wind patterns (Chen et al., 2024a; 2024b). At the same time, changes in sea surface temperature anomalies in the Atlantic and Indian Oceans and Arctic sea ice cover also affect atmospheric circulation and wind patterns (Cai et al., 2024). Furthermore, analyses conducted in Niger have revealed significant variability in wind dynamics between 1950 and 2009, highlighting changes in wind direction and speed that are closely related to the Inter-Tropical Convergence Zone and tropical fronts (Dieppois et al., 2011; Hassane, 2013). Furthermore, other studies have highlighted that decadal variability is influenced by the Atlantic Multidecadal Oscillation (AMO), with wind speeds tending to decrease during the warm phase of the AMO, whereas wind speeds tend to increase during the cold phase (Zhang and Delworth, 2006, 2007). Finally, global climate change is altering temperature gradients and atmospheric circulation, affecting long-term wind patterns (Chen et al., 2024b; IPCC, 2021).
Conclusion
This study aims to provide a climatological analysis of wind resources in Chad using 100-m wind data from the ERA5 reanalysis. The findings reveal spatiotemporal variations in wind speeds and directions, highlighting regions that are most suitable for wind farm development. Wind speeds range from 1.5 to 11 m/s, with a notable gradient from north to south. The highest wind speeds are observed from December to May, during the winter and spring months. A distinct diurnal pattern is also evident, with wind speeds peaking at night and being lower during the day. On average, nighttime wind speeds are 26% higher than those observed during the day. The prevailing wind direction is generally from the northeast to the southwest. The study identifies three key areas as particularly promising for wind farm installation: the region around Faya, the far northeastern part of the country, and the area around Amjarass. Long-term analysis shows a general decline in wind speeds since 2015, potentially linked to increased precipitation following the Sahel drought years, with lower speeds often coinciding with La Niña events. In conclusion, this study offers a detailed assessment of Chad's wind resources, highlighting that the most favorable locations are predominantly in the northern part of the country, with a special focus on the Saharan region. One of the limitations of this study lies in the spatial resolution of the ERA5 data. Therefore, it would be advisable to use high-resolution models such as WRF (Weather Research and Forecasting) in the future to refine the results (Giannaros et al., 2017).
Footnotes
Declaration of conflicting interests
The authors declared no potential conflicts of interest with respect to the research, authorship, and/or publication of this article.
Funding
The authors received no financial support for the research, authorship, and/or publication of this article.