
Abstract
Developments in solar technologies are making it possible to effectively exploit solar resources in several regions of Earth, including urban areas and regions with low solar irradiation intensity. Since power and heat are fundamental necessities for all users, f users, photovoltaic/thermal (PVT) technology has emerged as a promising solution for sustainably-minded communities. Generally, the output electrical generation of a PVT system depends on the intermittent solar insolation, efficiency, and operating temperature of the photovoltaic (PV) cell. At the same time, thermal power also depends on collector thermal insulation and the temperature difference with the surroundings. Consequently, it is essential to predict and diagnose the PVT system's power to optimally utilize the collected solar energy. In recent years, intelligent techniques and approaches have been introduced to evaluate the performance of PVT systems. Artificial Intelligence (AI)-based methods have become prominent due to their capability of producing accurate predictions against the uncertainty and nonlinearity phenomena. This work presents an innovative application of AI for both the forecasting and the diagnostic of the performance of a PVT plant. The analyses performed are based on the experimental investigation conducted on the PVT system installed at the University of Catania campus. The outcomes of this study showed that the AI accurately predicted photovoltaic energy production and consequently, it can be used to detect periods of performance loss. From the test carried out in the real plant, it was seen that the use of the AI allows for prompt identification of malfunctioning in PVT plants can translate into avoid loss of over 5% of the electricity produced, and the total loss of thermal energy.
Introduction
Renewable energy has the potential to address the increasing energy demand limiting greenhouse gas (GHG) emissions and shrinking the ongoing climate change, in this regards photovoltaic (PV) has emerged as a powerful and effective solution to address the global energy demand while mitigating and protecting the environment from adverse climate effects (Jonynas et al., 2020). However, one constraint associated with PV systems is their relatively low efficiency, on average, only around 15–20% of the incoming solar irradiation is converted into electricity, while the remained part is lost as thermal waste. To enhance the capabilities of PV systems, researchers and engineers have developed photovoltaic thermal (PVT) collectors, which allow the cooling of the PV cells and exploit the thermal waste for space heating or DHW production (Margoum et al., 2023).
Since power and heat are fundamental necessities for all kinds of users, PVT technology has emerged as a promising solution for sustainably-minded communities, that intend to enhance energy efficiency and replace fossil fuel consumption with solar energy. The electrical and thermal behavior of PVT collectors is assessed through both the development of numerical models and experimental studies (El Fouas et al., 2020).
In addition to enhancing electrical and thermal performance, another significant research area in PVT systems is matching power generation to demand (Gagliano et al., 2021). However, the market penetration of PVT technology is still under development although it can provide indisputable benefits (Gagliano et al., 2019a).
Owing to the intermittent nature of solar energy, the available solar radiation, and its variation over the time, is a crucial factor for evaluating the potential yield of a solar system in a specific place.
Although several methods are often employed for the prediction of daily global solar irradiation within the literature, Artificial Intelligence (AI)-based methods have become prominent due to their capability of producing more accurate solutions against the uncertainty and nonlinearity phenomena of the prediction (Gao et al., 2022a, Sehrawat et al., 2023).
AI-based methods offer the advantage of efficiently establishing relationships between inputs and outputs. Artificial Intelligence (AI) algorithms are trained on historical weather data and other relevant factors (e.g., cloud cover, temperature, and humidity) to predict solar irradiation based on these input variables (Dorlo et al., 2002). The literature has often enhanced studies on solar radiation estimation for solar PV power plants (Mellit and Massi Pavan, 2010), demonstrating that artificial neural networks (ANN) are the most effective predictive model for solar energy forecasting (Ledmaoui et al., 2024). ANNs have been widely used in many fields, including the performance prediction of PVT plants, as the evaluation of the performance of PVT systems using conventional numerical methods is very time-consuming due to solving complex differential equations (El Fouas et al., 2020). In this regard, (Gharaee et al., 2024) suggest using machine learning (ML) systems to predict PVT efficiency more reliably and effectively, based on over 380 datasets extracted from the literature of water-based PVT plants. (Guo et al., 2022b) utilized a backpropagation neural network to evaluate the performance of a Hybrid Air-Based, building-integrated PVT system. A revolutionary AI approach, achieved by combining Sand Cat Swarm Optimization (SCSO) method with Deep Neural Network (DNN), has been used to optimize the cooling system of a PVT plant (Shaban et al., 2024). Other studies have used ANNs to simulate and predict the performance of PVT plants using silver oxide/water nanofluids (Margoum et al., 2024a, Margoum et al., 2024b), hexagonal boron Nitride/water (Büyükalaca et al., 2023), and aluminum oxide/water (Li et al., 2024) as working fluids. Furthermore, in (Al-Waeli et al., 2019) the performance of PVT also in the presence of phase change materials (PCM) has been analyzed. The potential of AI is not limited to the prediction of energy production alone, in fact the use of AI for the diagnostics of PV systems is gaining ground in the international scientific community (Islam et al., 2023, Sepúlveda-Oviedo et al., 2023). (Jalal et al. 2024) used machine learning techniques for the visual detection of photovoltaic failures (cracks, discoloration, and delamination) obtaining an accuracy greater than 90%. Artificial intelligence techniques have also been used for the identification of thermal anomalies in photovoltaic systems. In (Cipriani et al., 2021), thermographic images acquired by unmanned aerial vehicles equipped with a thermal camera were processed through AI, to identify malfunctions without interrupting the normal operation of the photovoltaic system. However, the various efforts in diagnosing solar system malfunctions are concentrated only on PV systems, and there are no applications regarding PVT systems. Unlike PV, PVT systems present additional complexities due to simultaneous electrical and thermal energy production. Thus, it is worth interest to evaluate the potentiality of AI to predict the main operating parameters (electrical and thermal) to identify any anomalies that reduce energy production.
This work aims to carry out an innovative application of AI for the prediction of the operative conditions of PVT systems, in such a way as to develop a tool that can be used for the monitoring and real-time diagnostics of these complex renewable energy systems. To achieve these objectives, the experimental data derived from the PVT system installed at the University of Catania campus have been used as a reference. In particular, the available experimental data have been primarily used for training artificial neural networks (ANN) for predicting the performance of a PVT system as a function of the specific features of the PVT plant and the real weather conditions. After this first phase, the energy production coming from the ANN prediction is compared with the real-time observed data. Such comparison allows us to instantaneously verify if the PVT is functioning as predictable under the actual weather and operative conditions or highlight any malfunction or underperformance conditions. Thereby, the proposed application of AI will help the owner of a PVT plant to have at their disposal an extremely useful tool for the monitoring and diagnostic of their PVT plant.
ANN applications in solar energy systems
Artificial neural networks (ANNs) have been widely used in many fields, including solar energy forecasting [9]. The multi-layer perceptron (MLP) is a neural network characterized by a feedforward algorithm constituted by input, output, and one or more hidden layers with many neurons stacked together. The MLP structure reproduces the human brain's action as it receives inputs, combines them, and produces final output results (https://towardsdatascience.com). Each layer provides the next one with the result of its computation until the output layer is reached. The input data are divided into training, validation, and test sets. Backpropagation is the learning mechanism that lets the MLP iteratively tune the weights in the network, to minimize the cost function. In this study, the Edge Impulse (https://edgeimpulse.com) development platform was used to perform a deep learning experiment.
Methodology
The Edge Impulse platform enables observed data collection, testing, and real-time signal processing. Like other ANN software, the first phase consists of learning raw data and cataloging it to “train the model”. The peculiarity of this tool lies in the ease of acquiring data from sensors, which can be numerical, images, sounds, and so on. Once a heterogeneous quantity of information (data) has been acquired, the algorithm that allows the best interpretation of the type of data to be examined is chosen, and then the model capable of automatically cataloging the subsequently acquired data is created. The effective model obtained can be used to classify the data in real-time.
The power generation from solar systems is linked to various environmental aspects, particularly by air temperature, fluid temperature and solar radiation. In fact, the generated electrical power (Pel) is directly proportional to the incident solar radiation (G) and the electrical efficiency (ηel), as expressed in Eq. 1:


However, in solar systems, sometimes the Pel can be highly influenced by factors internal to the system, such as anomalies or malfunctions and then continuous diagnostics of the system is essential to minimize production losses related to anomalies in the systems. In this regard, an ANN model, capable of predicting energy production of a pilot PVT plant under variable weather conditions, was formed.
The data used for the prediction (i.e., power production, temperature, and solar radiation) was initially checked to avoid measurement errors or anomalies, so as not to affect the analysis and training of the network. Once a sufficiently robust model was developed, it was used for the prediction of the power generation that should be expected under specific environmental conditions. Thus, the predicted power (Pel,pr) is compared in real-time with the real power observed (Pel,ob), to report any anomalies. Subsequently, to test the model, a malfunction was induced, that consists in a fault of the cooling circuit. This kind of fault determines the temperature rise of the photovoltaic cells and therefore reduces the plant's efficiency. The model was set to produce an alert when the error (Eq. 3) between the detected and the predicted one power, exceeds 5%.

Experimental PVT plant
The data used in this study was derived from the pilot PVT plant installed at the University of Catania (Gagliano et al., 2019b) (lat. 37.5256 N, long. 15.0746 E). This plant consists of two commercial unglazed and uninsulated PVT panels, namely WISC, installed with a tilt angle equal to 25° and azimuth equal to 0° (South-facing). The panel presents a gross area of 1.66 m2, an STC efficiency of 15.4%, a peak power of 250 W, and a temperature coefficient of 0.44%. As regards the thermal features, the panel presents an optical efficiency of 55% and the heat loss coefficient equal to 15.76 W/ (K m2).
The thermal energy produced is transferred to a solar tank, where it is stored and where a heat pump is used as a heat sink so as to simulate thermal sampling, or to fix the temperature of the fluid at the inlet of PVT panels. Furthermore, the management and monitoring of the PVT system are carried out in real-time, through the standard MODBUS TCP/IP protocol.
Figure 1 shows a picture of the main components of the experimental PVT plant.
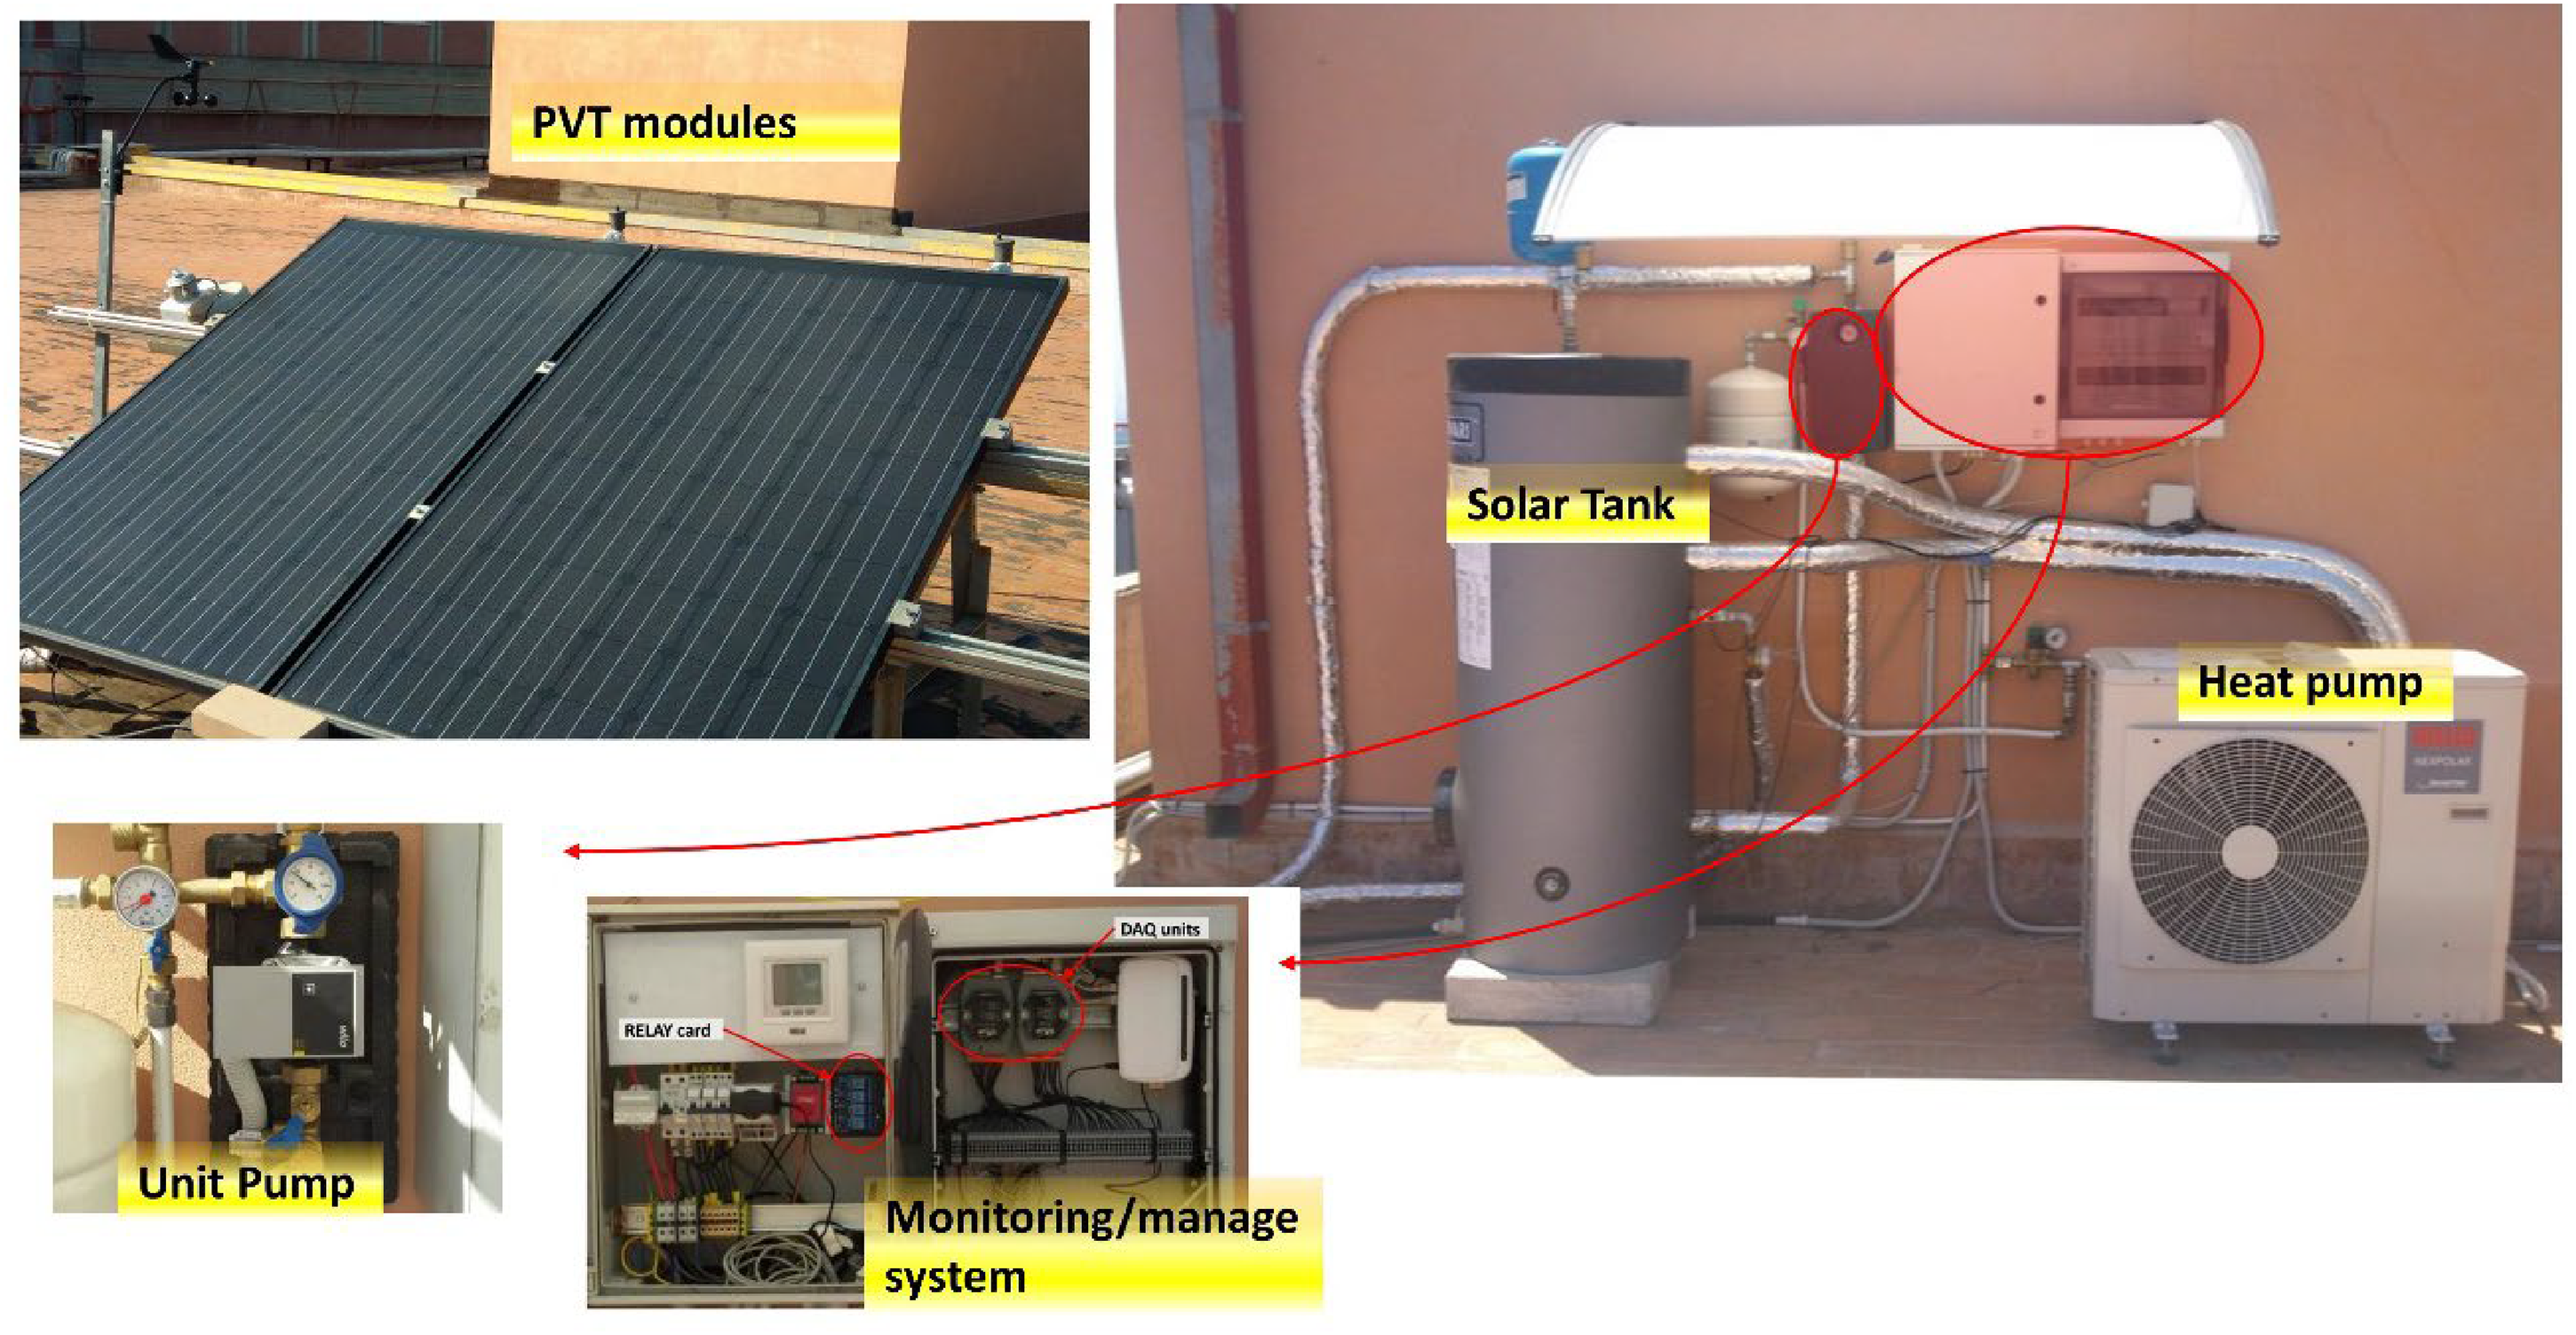
Experimental PVT plant.
The PVT plant comprises a closed-loop water circuit, in which the cooling fluid flows (Fs.c.) from the outlet of the PVT collector with an outlet temperature (Tout) and enters the lower heat exchanger of the solar tank, in this way the cooling fluid lessens its temperature and returns to the inlet of the PVT collector (Tin), where it is heated by the solar irradiation, as shown in the Figure 2.
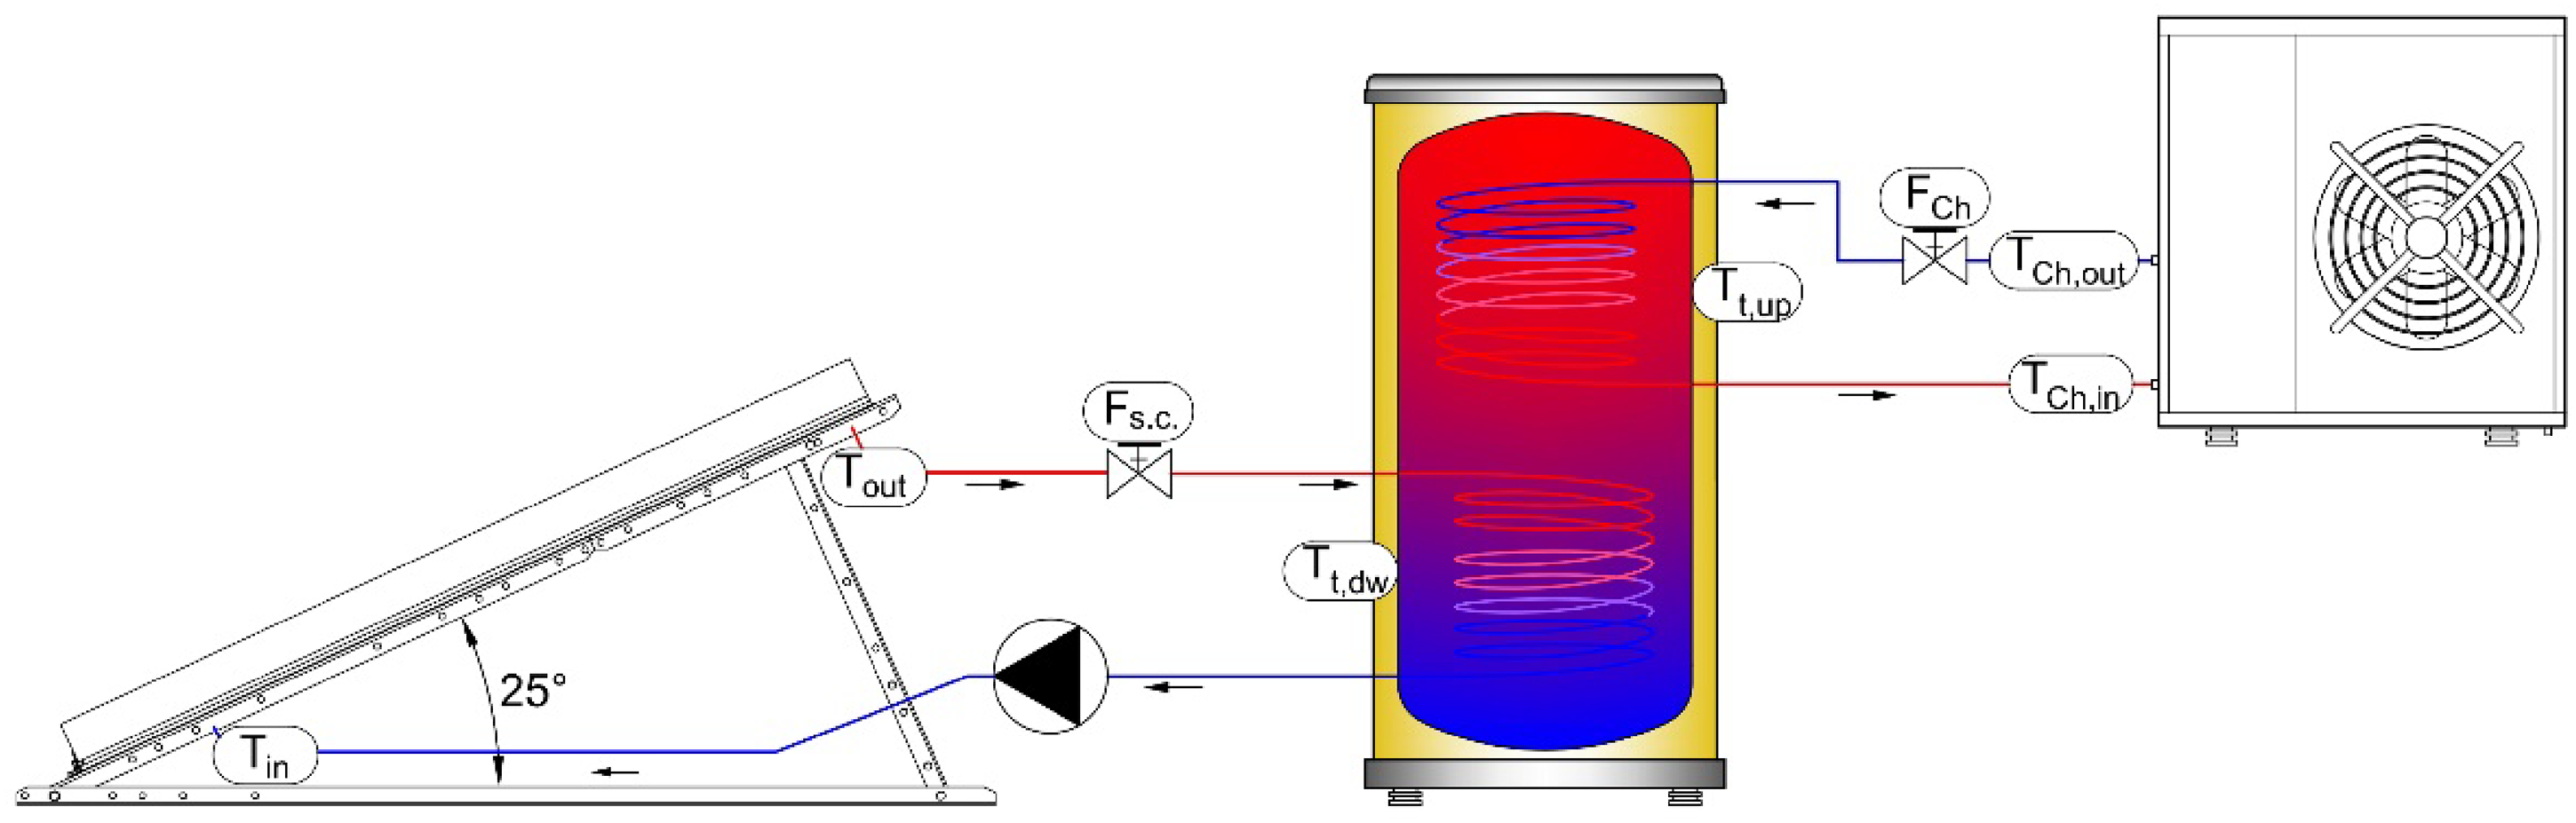
Layout of pilot PVT plant.
The PVT plant operating modes are supervised by monitoring the fluid volumetric flowrate, the temperatures of the cooling fluid (water) at the inlet/outlet of the PVT module, the thermal storage tank, temperatures of the water at the bottom/top within the solar tank. Moreover, the weather data are monitored through a weather station positioned close to the PVT plant. The monitored parameters, wind speed and direction, horizontal and diffuse solar irradiation, ambient temperature, relative humidity, and air pressure, are registered in a data logger and then transferred to the PC through Ethernet. Figure 3 shows the main sensors installed.
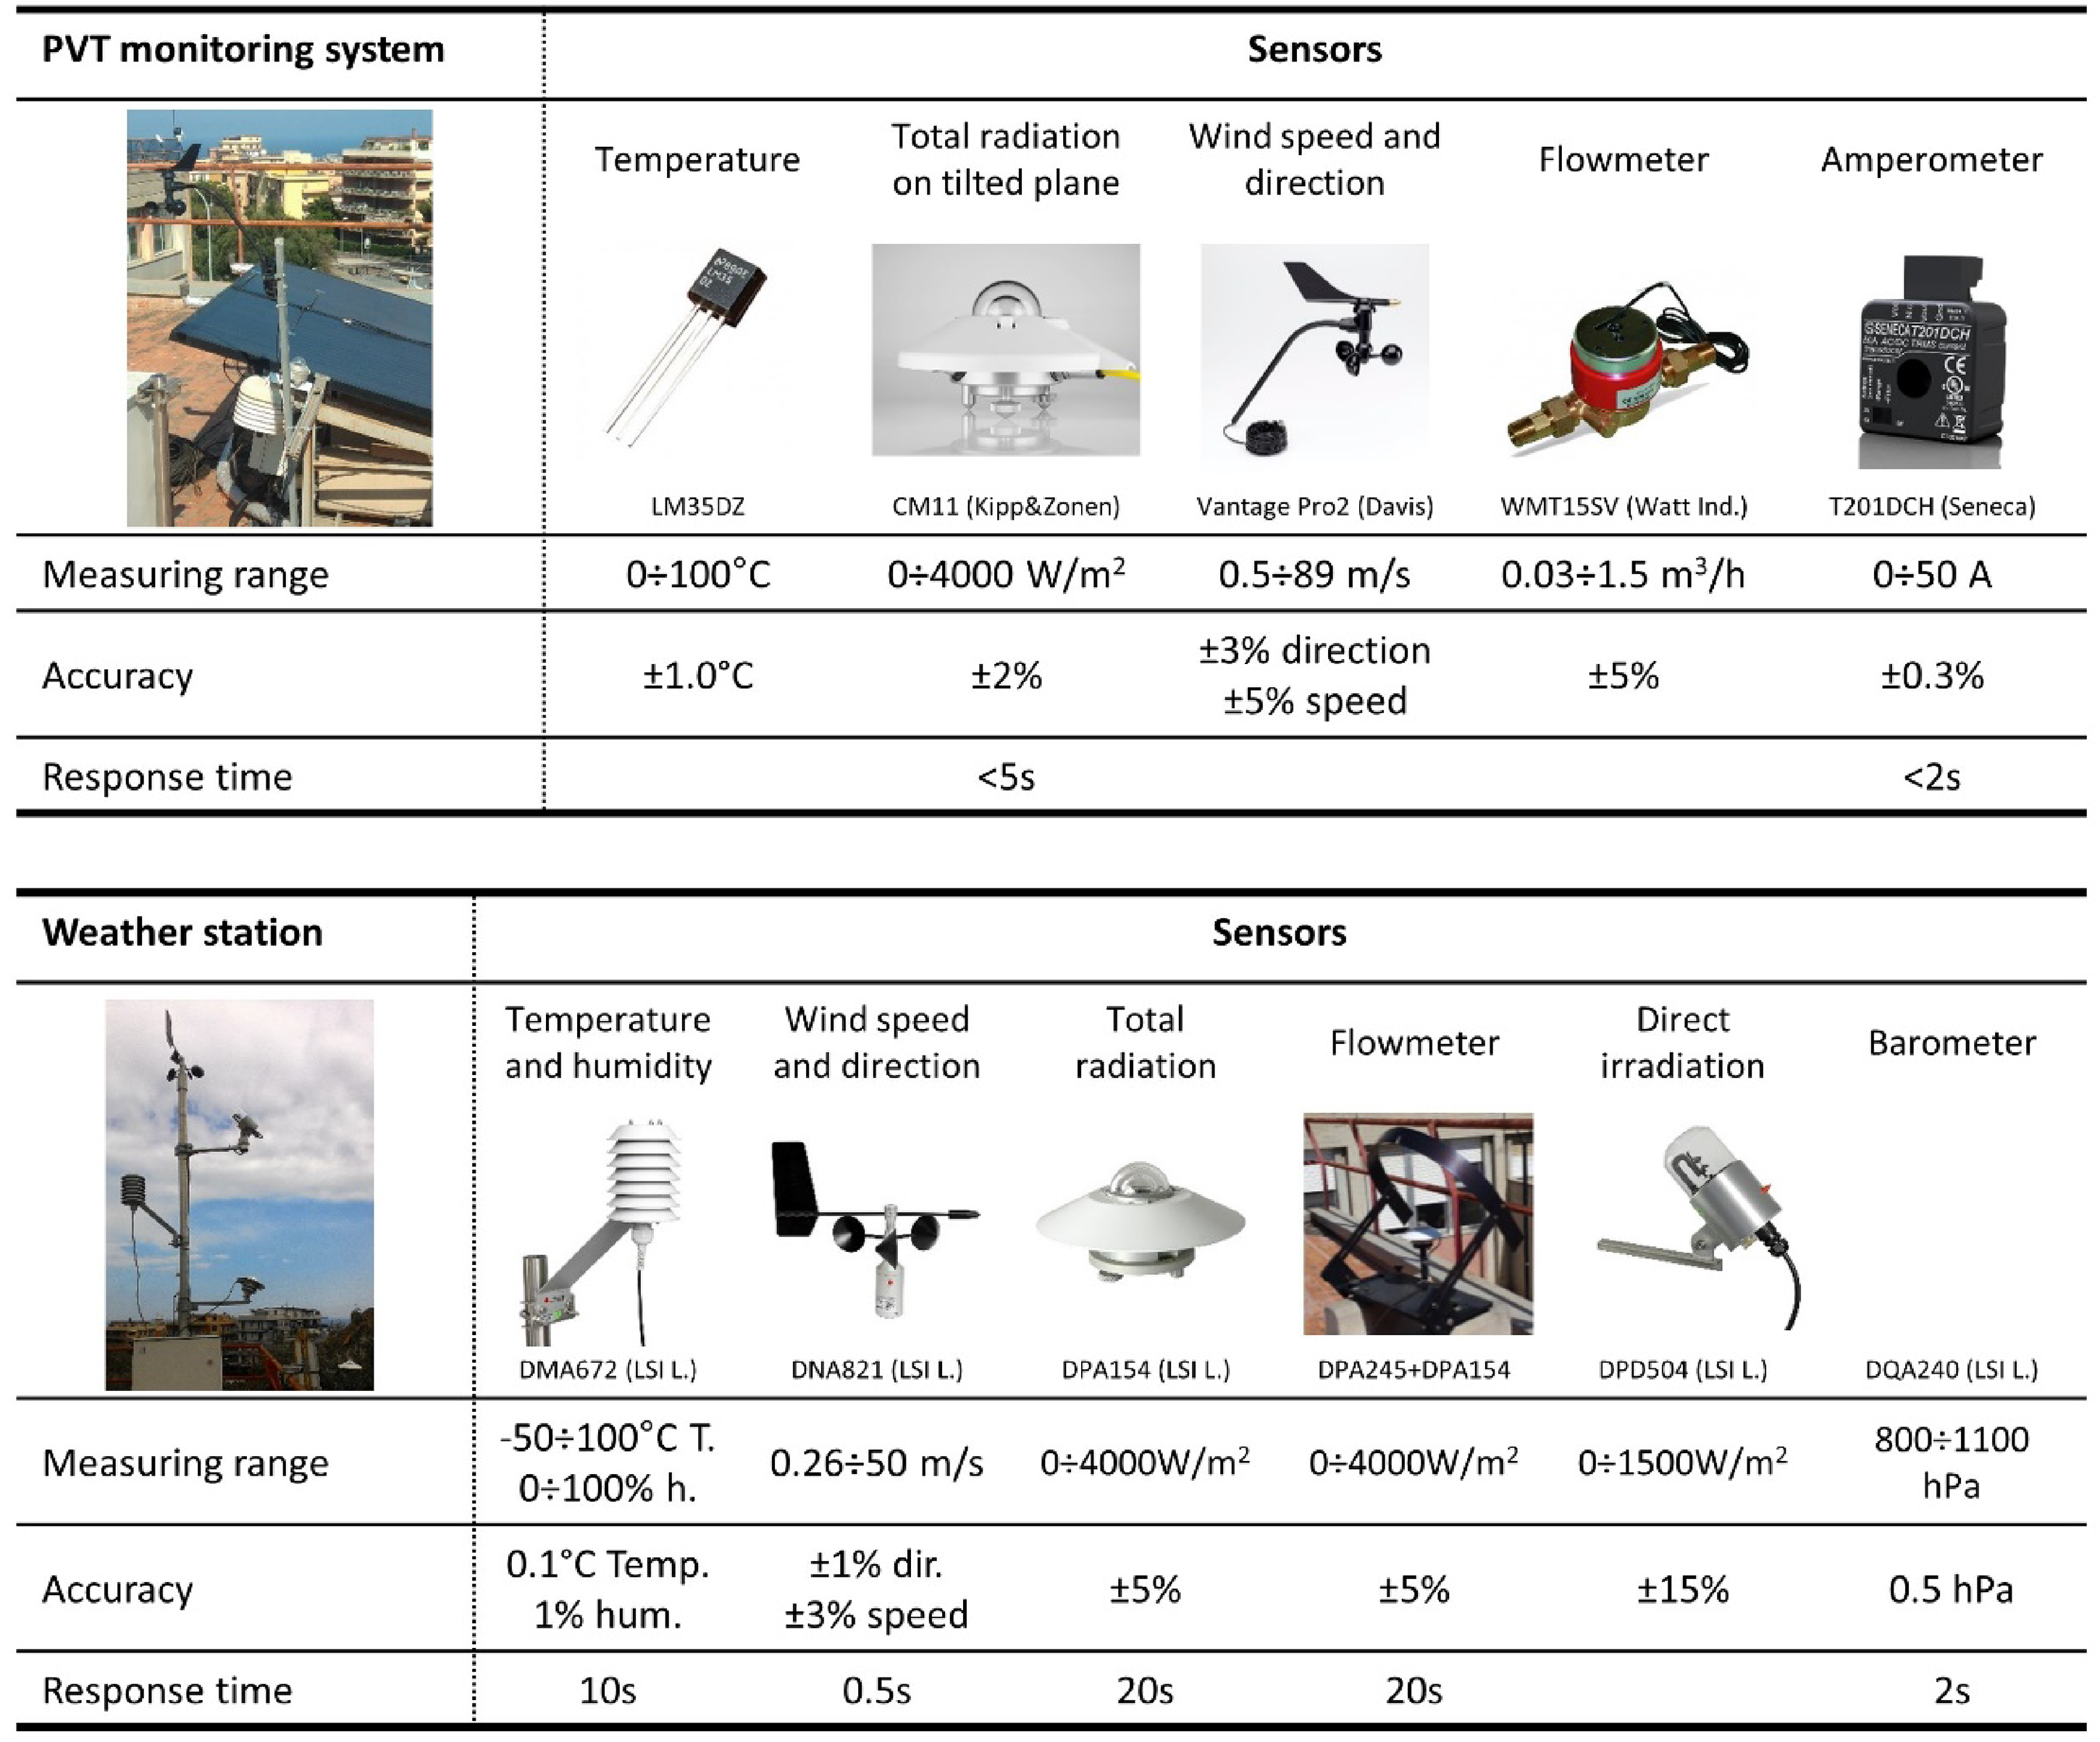
Features of the main sensors installed.
Experimental data set
In PVT plants, the operating temperature of the cooling fluid influences the temperature of PV cells. To obtain an ANN model that is as precise as possible, it is necessary to train the network with heterogeneous data. To this aim, the analysis concerns different periods of the year characterized by a huge variation in environmental data. To enhance the model's robustness, various operating temperatures were applied to assess their effects on efficiency.
Therefore, the PVT plant has been forced to operate with fixed set-point temperatures of the cooling fluid. To achieve these operating conditions, when the fixed set-point temperatures are reached in the thermal storage, the chiller cools the water within the tank maintaining almost constant set-point temperatures. Thus, a campaign of analyses has been carried out by choosing three distinct set point temperatures, that are 30, 40 and 50°C.
Figure 4 shows the monitored data, during days characterized by similar weather conditions, while different operating temperatures were set.
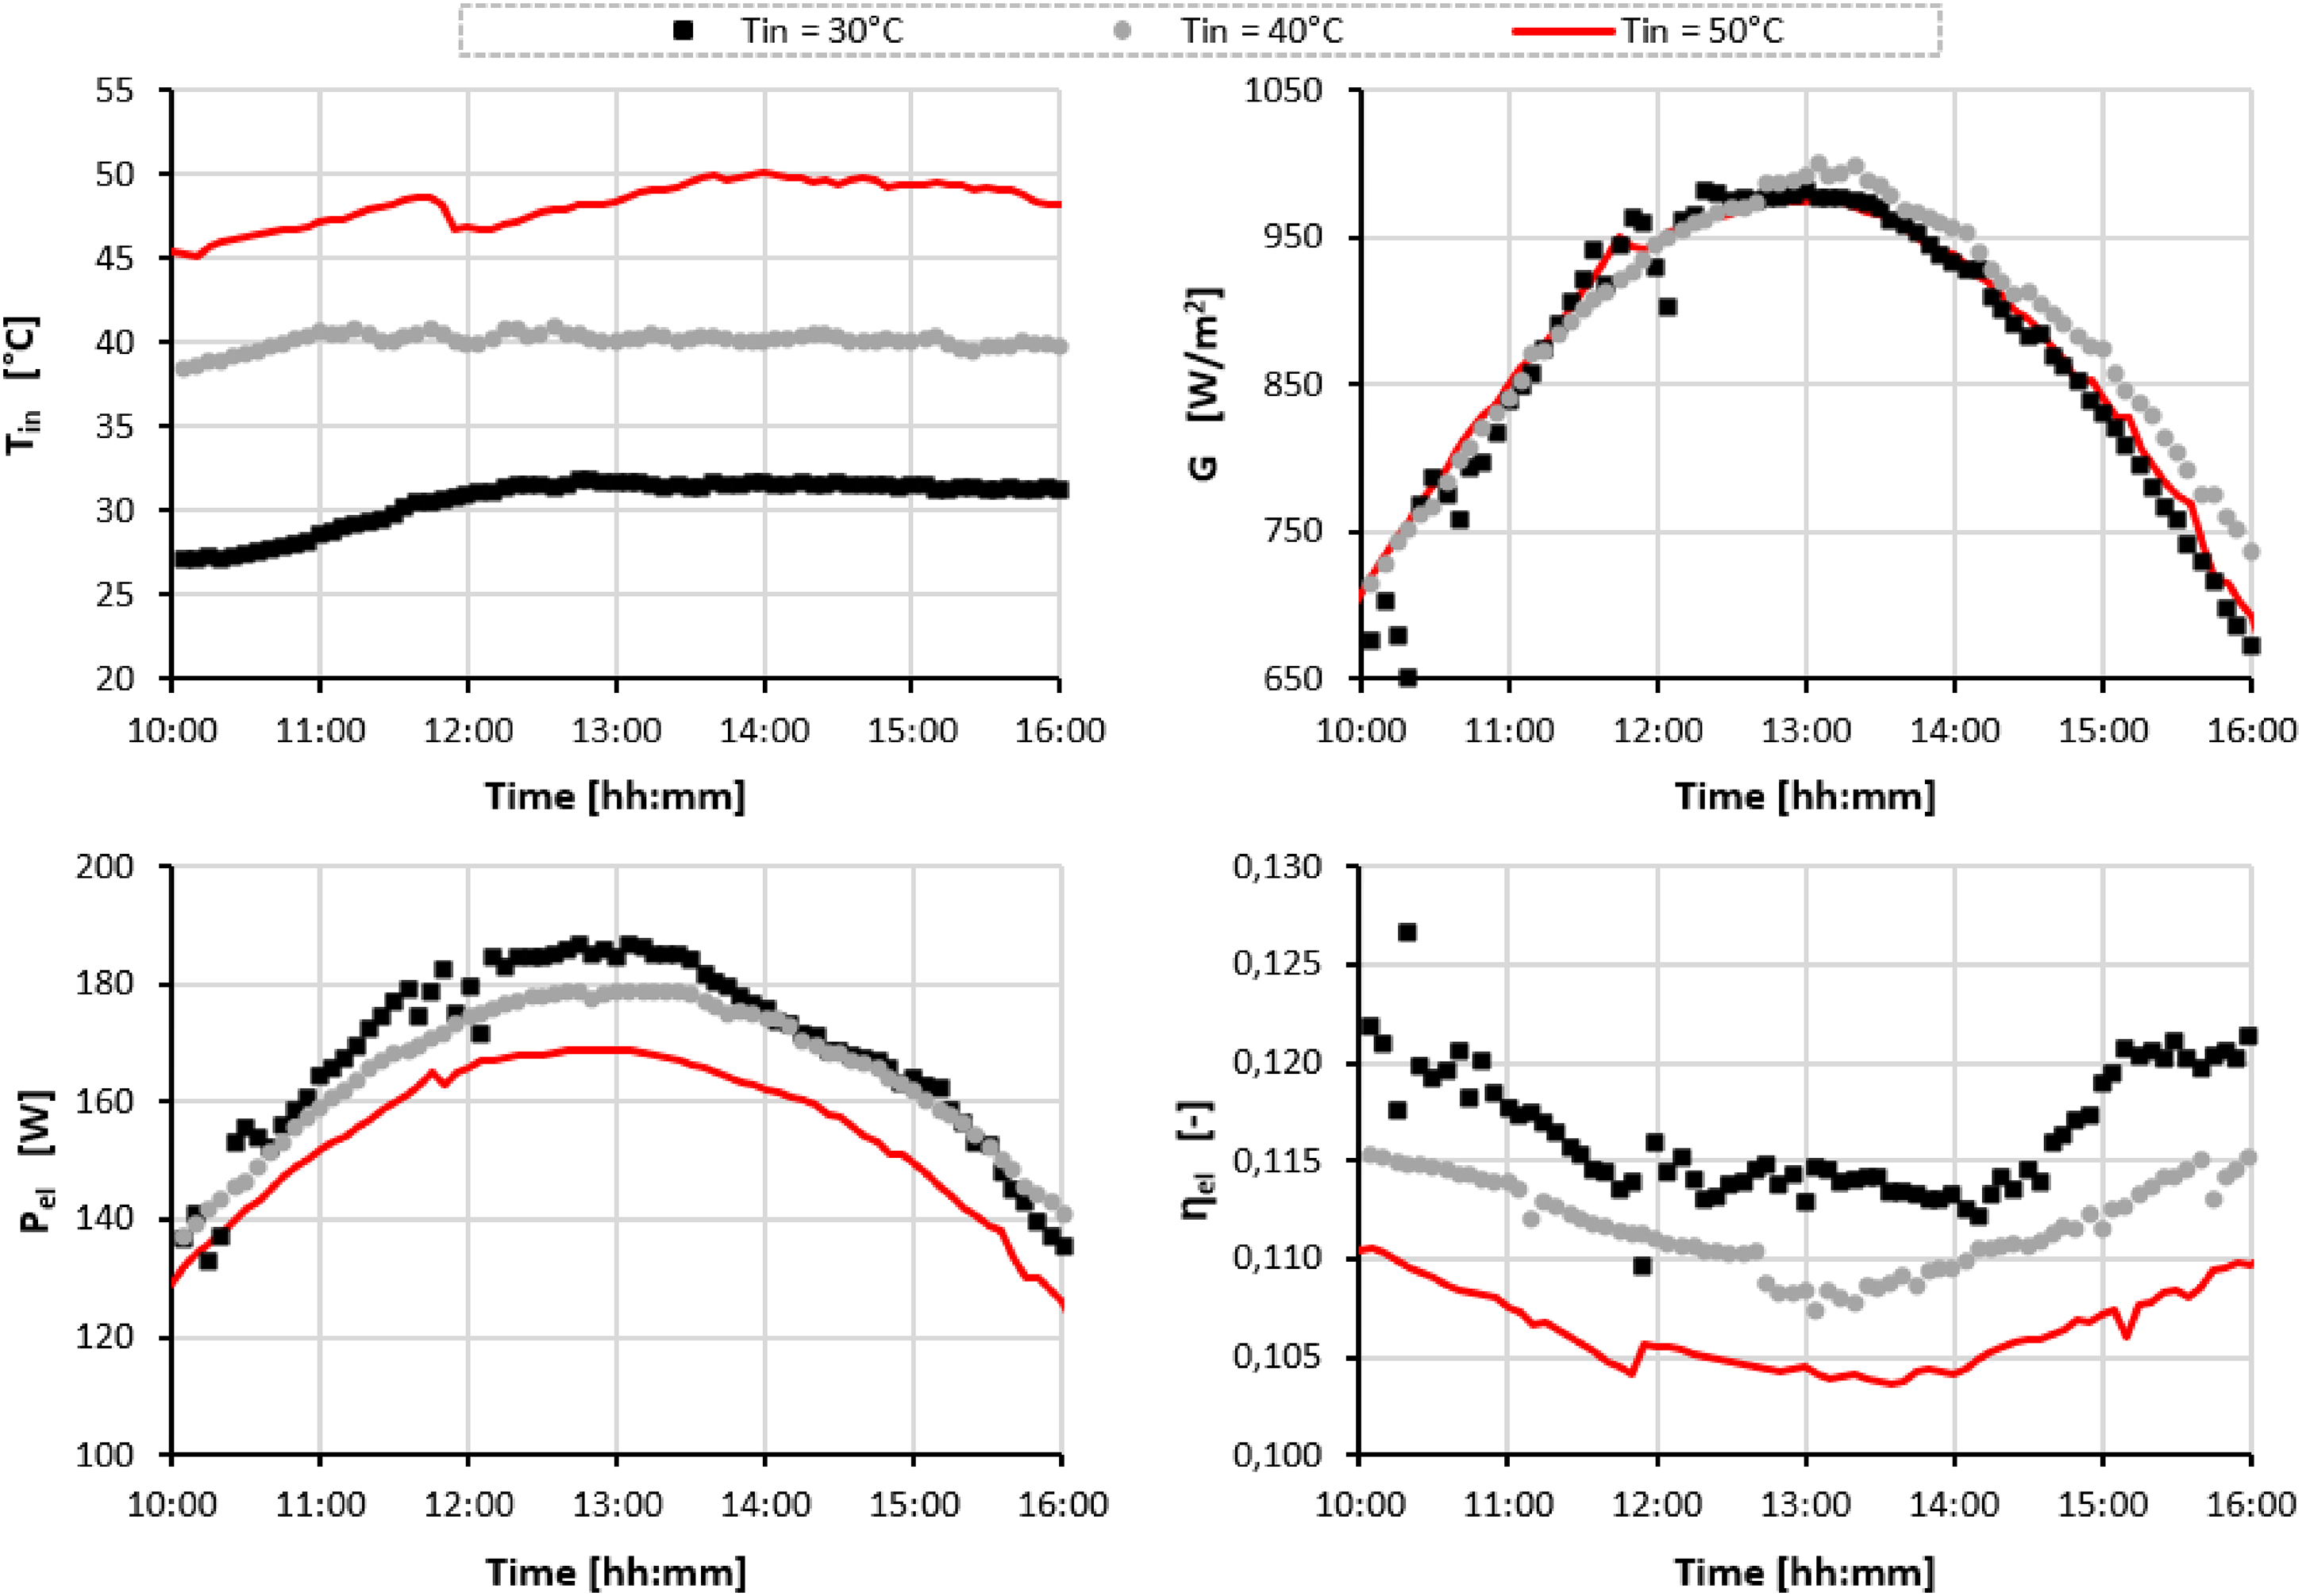
Experimental data of the PVT system obtained as the inlet temperature varies.
In this figure the following parameters are shown: the fluid inlet temperature in the PVT module (Tin), the solar irradiation on the plane of array (G), the electrical power (Pel); and the electrical efficiency (ηel).
It is important to note that these are just a part of the data used for training the ANN. It can be observed the direct relationship between temperature and efficiency, as the temperature surges the efficiency decreases.
Once the ANN was trained, further data collected over several days was catalogued, so as to test the model, with the result of an accuracy greater than 98%.
Results and discussion
In this study, the observed data arriving from the previously described survey have been used for developing an ANN model capable of highlighting anomalies in the operational conditions of the PVT plant.
Thus, the developed ANN allows us to predict the electrical efficiency and the power using as input the solar irradiation, ambient temperature, and tank temperature.
Intending to evaluate the efficiency of ANN models in the context of anomaly diagnostics, a malfunction of the plant was evaluated. Specifically, the malfunctioning concerned the stopping of the circulation pump and hence there will be no more flow of the cooling fluid in the hydronic circuit. This leads to an (unjustified) increase in the temperatures of the photovoltaic cells with a consequent reduction in electrical efficiency.
Figure 5 shows the power predicted (black curve), the real power observed (red curve), as well as the flow rate (green line), and the error between prediction and observation (blue line).
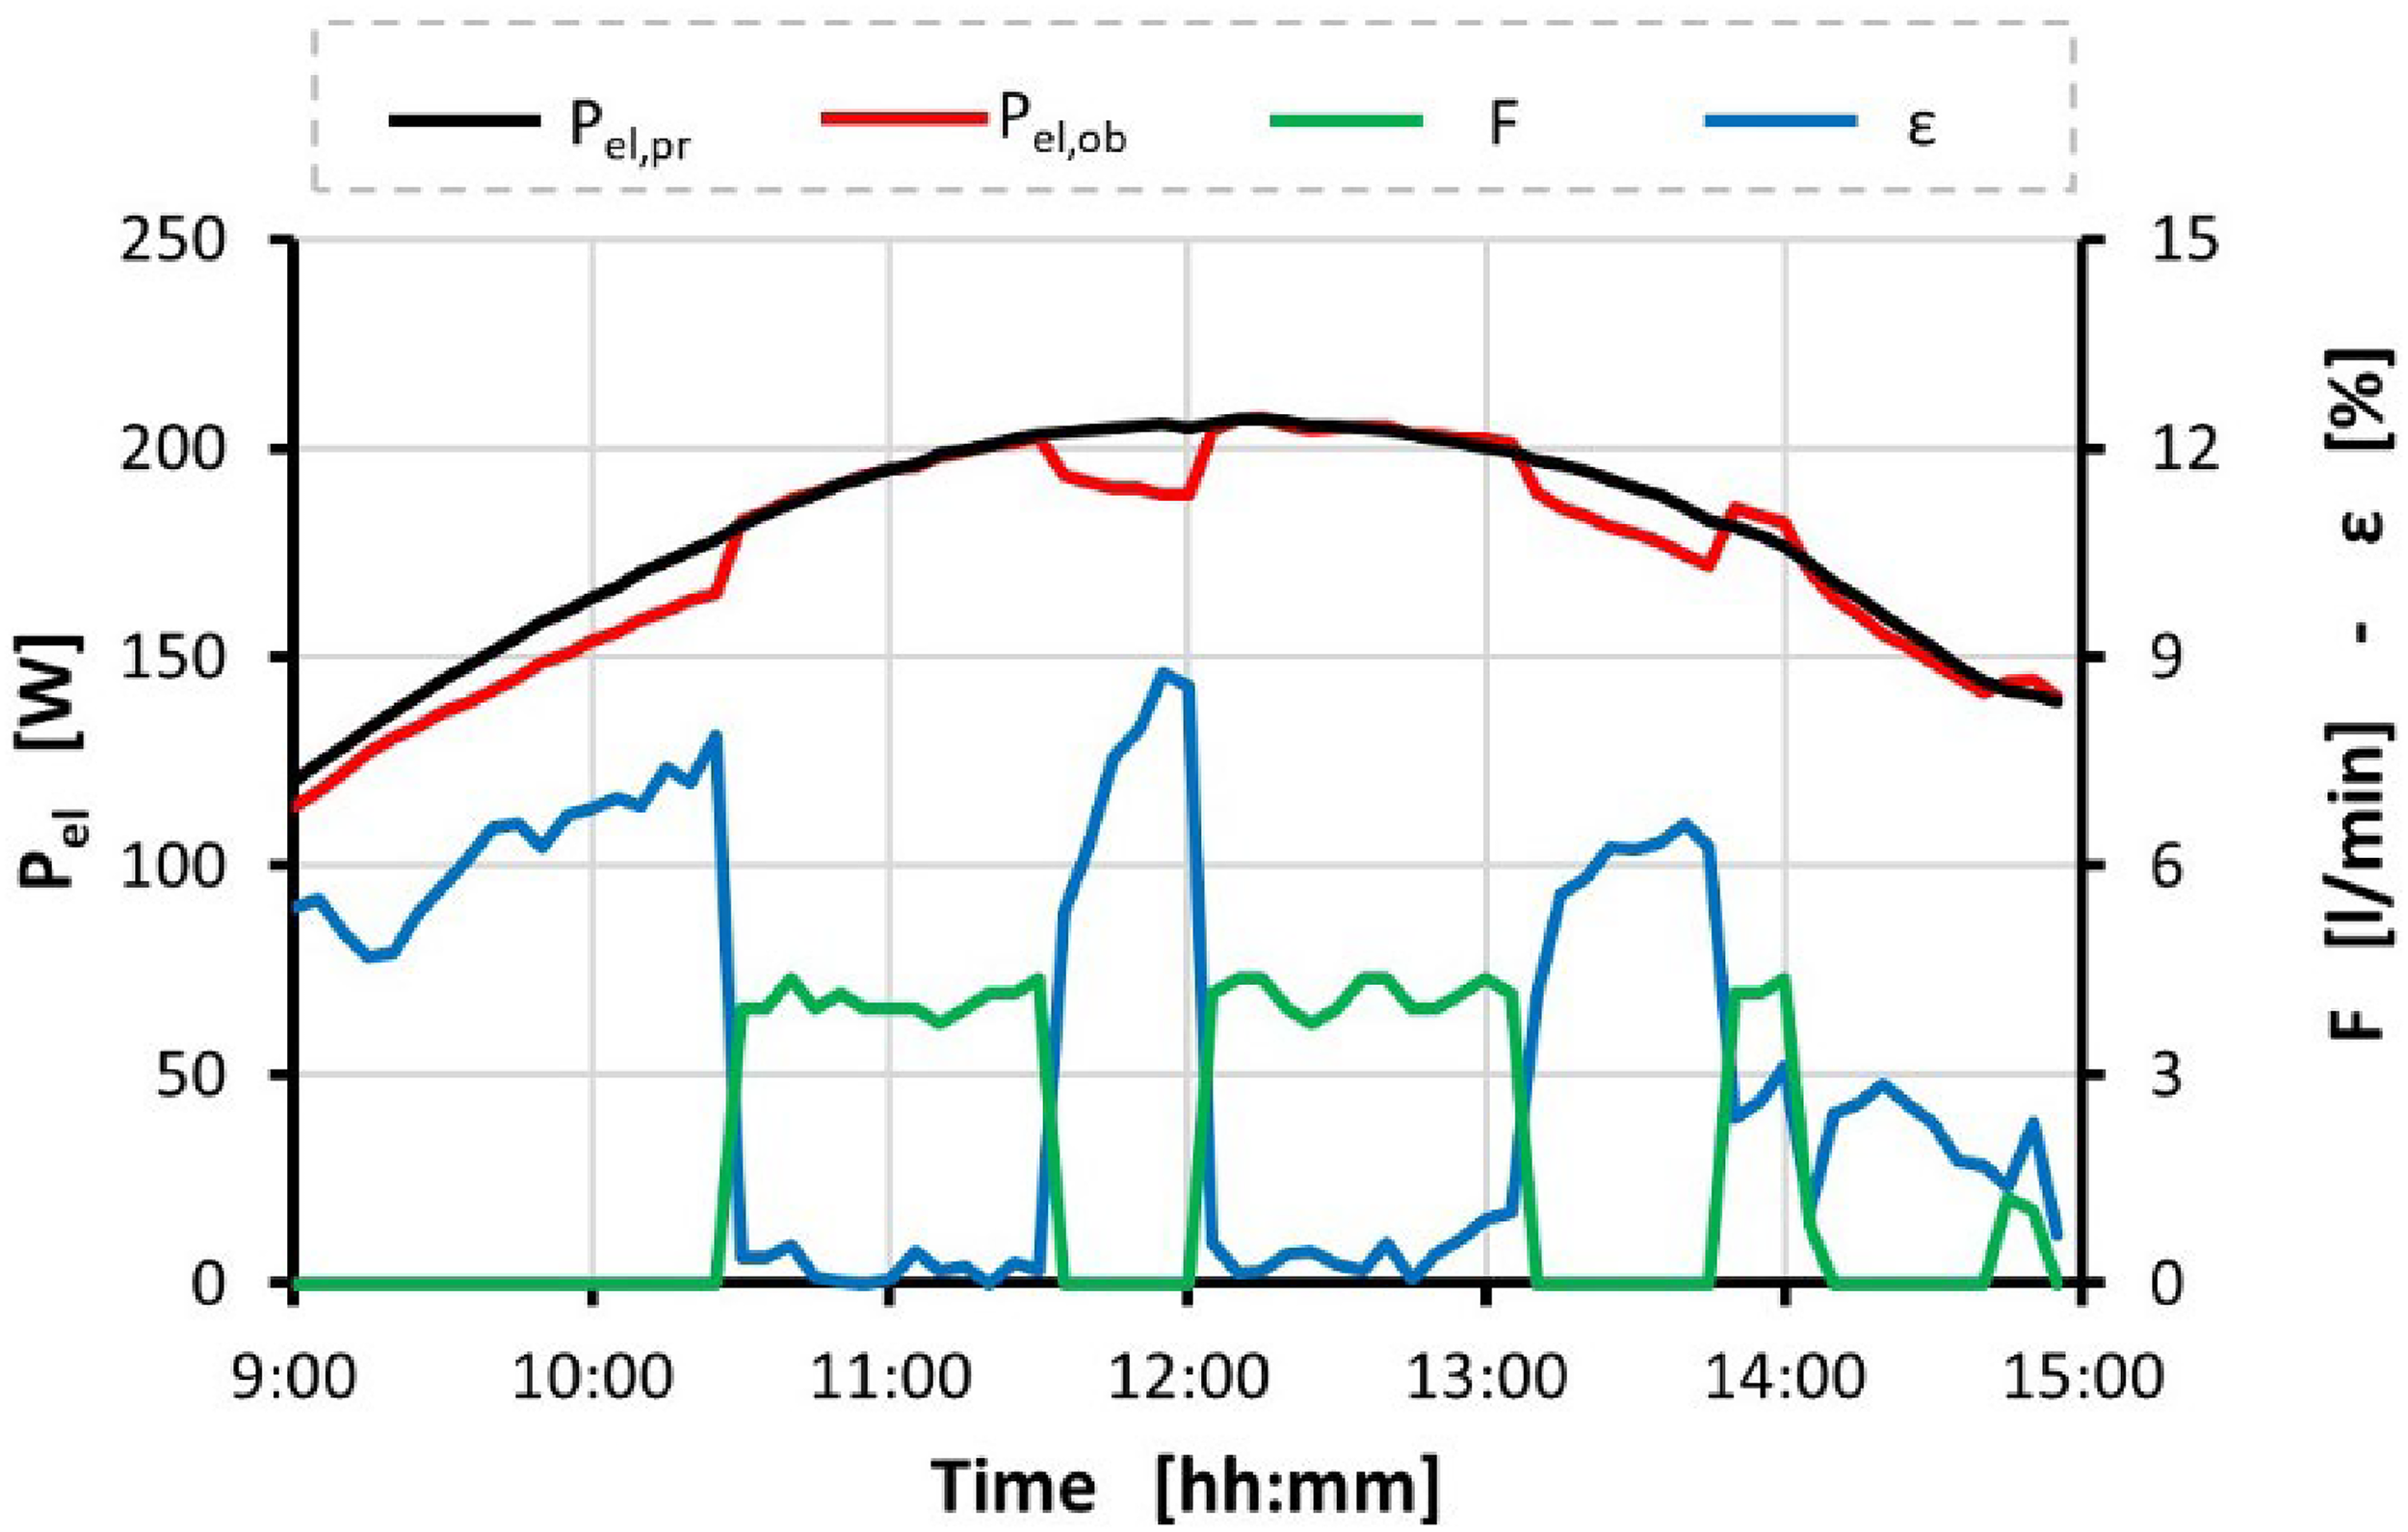
Comparison between predicted and observed electricity produced.
During periods of the fault of the fluid circulation pump (periods 9:00–10:30, 11:30–12:00, and 13:15–13:45) the power produced is lower compared to that predicted. In fact, stopping the pump generates an increase in the temperature of the photovoltaic cells, which therefore causes a reduction in efficiency. Therefore, the power observed results were less than the expected one (predicted by the model), and then the alarm was triggered, as the deviation between the expected and actual power exceeded 5%. Differently, when the plants operate under the expected setting, the observed power is remarkably similar to that predicted, thus demonstrating the strong viability of the developed model.
Figure 6 shows the details of two periods 9:15–10:15 and 10:30–11:30, respectively a period when the fault was induced and a period when the system works normally. In particular, the figure shows in the upper part the details of the cell's temperature predicted (black curve) and measured in the real plant (red curve) and in the lower part the comparison of the electricity produced.
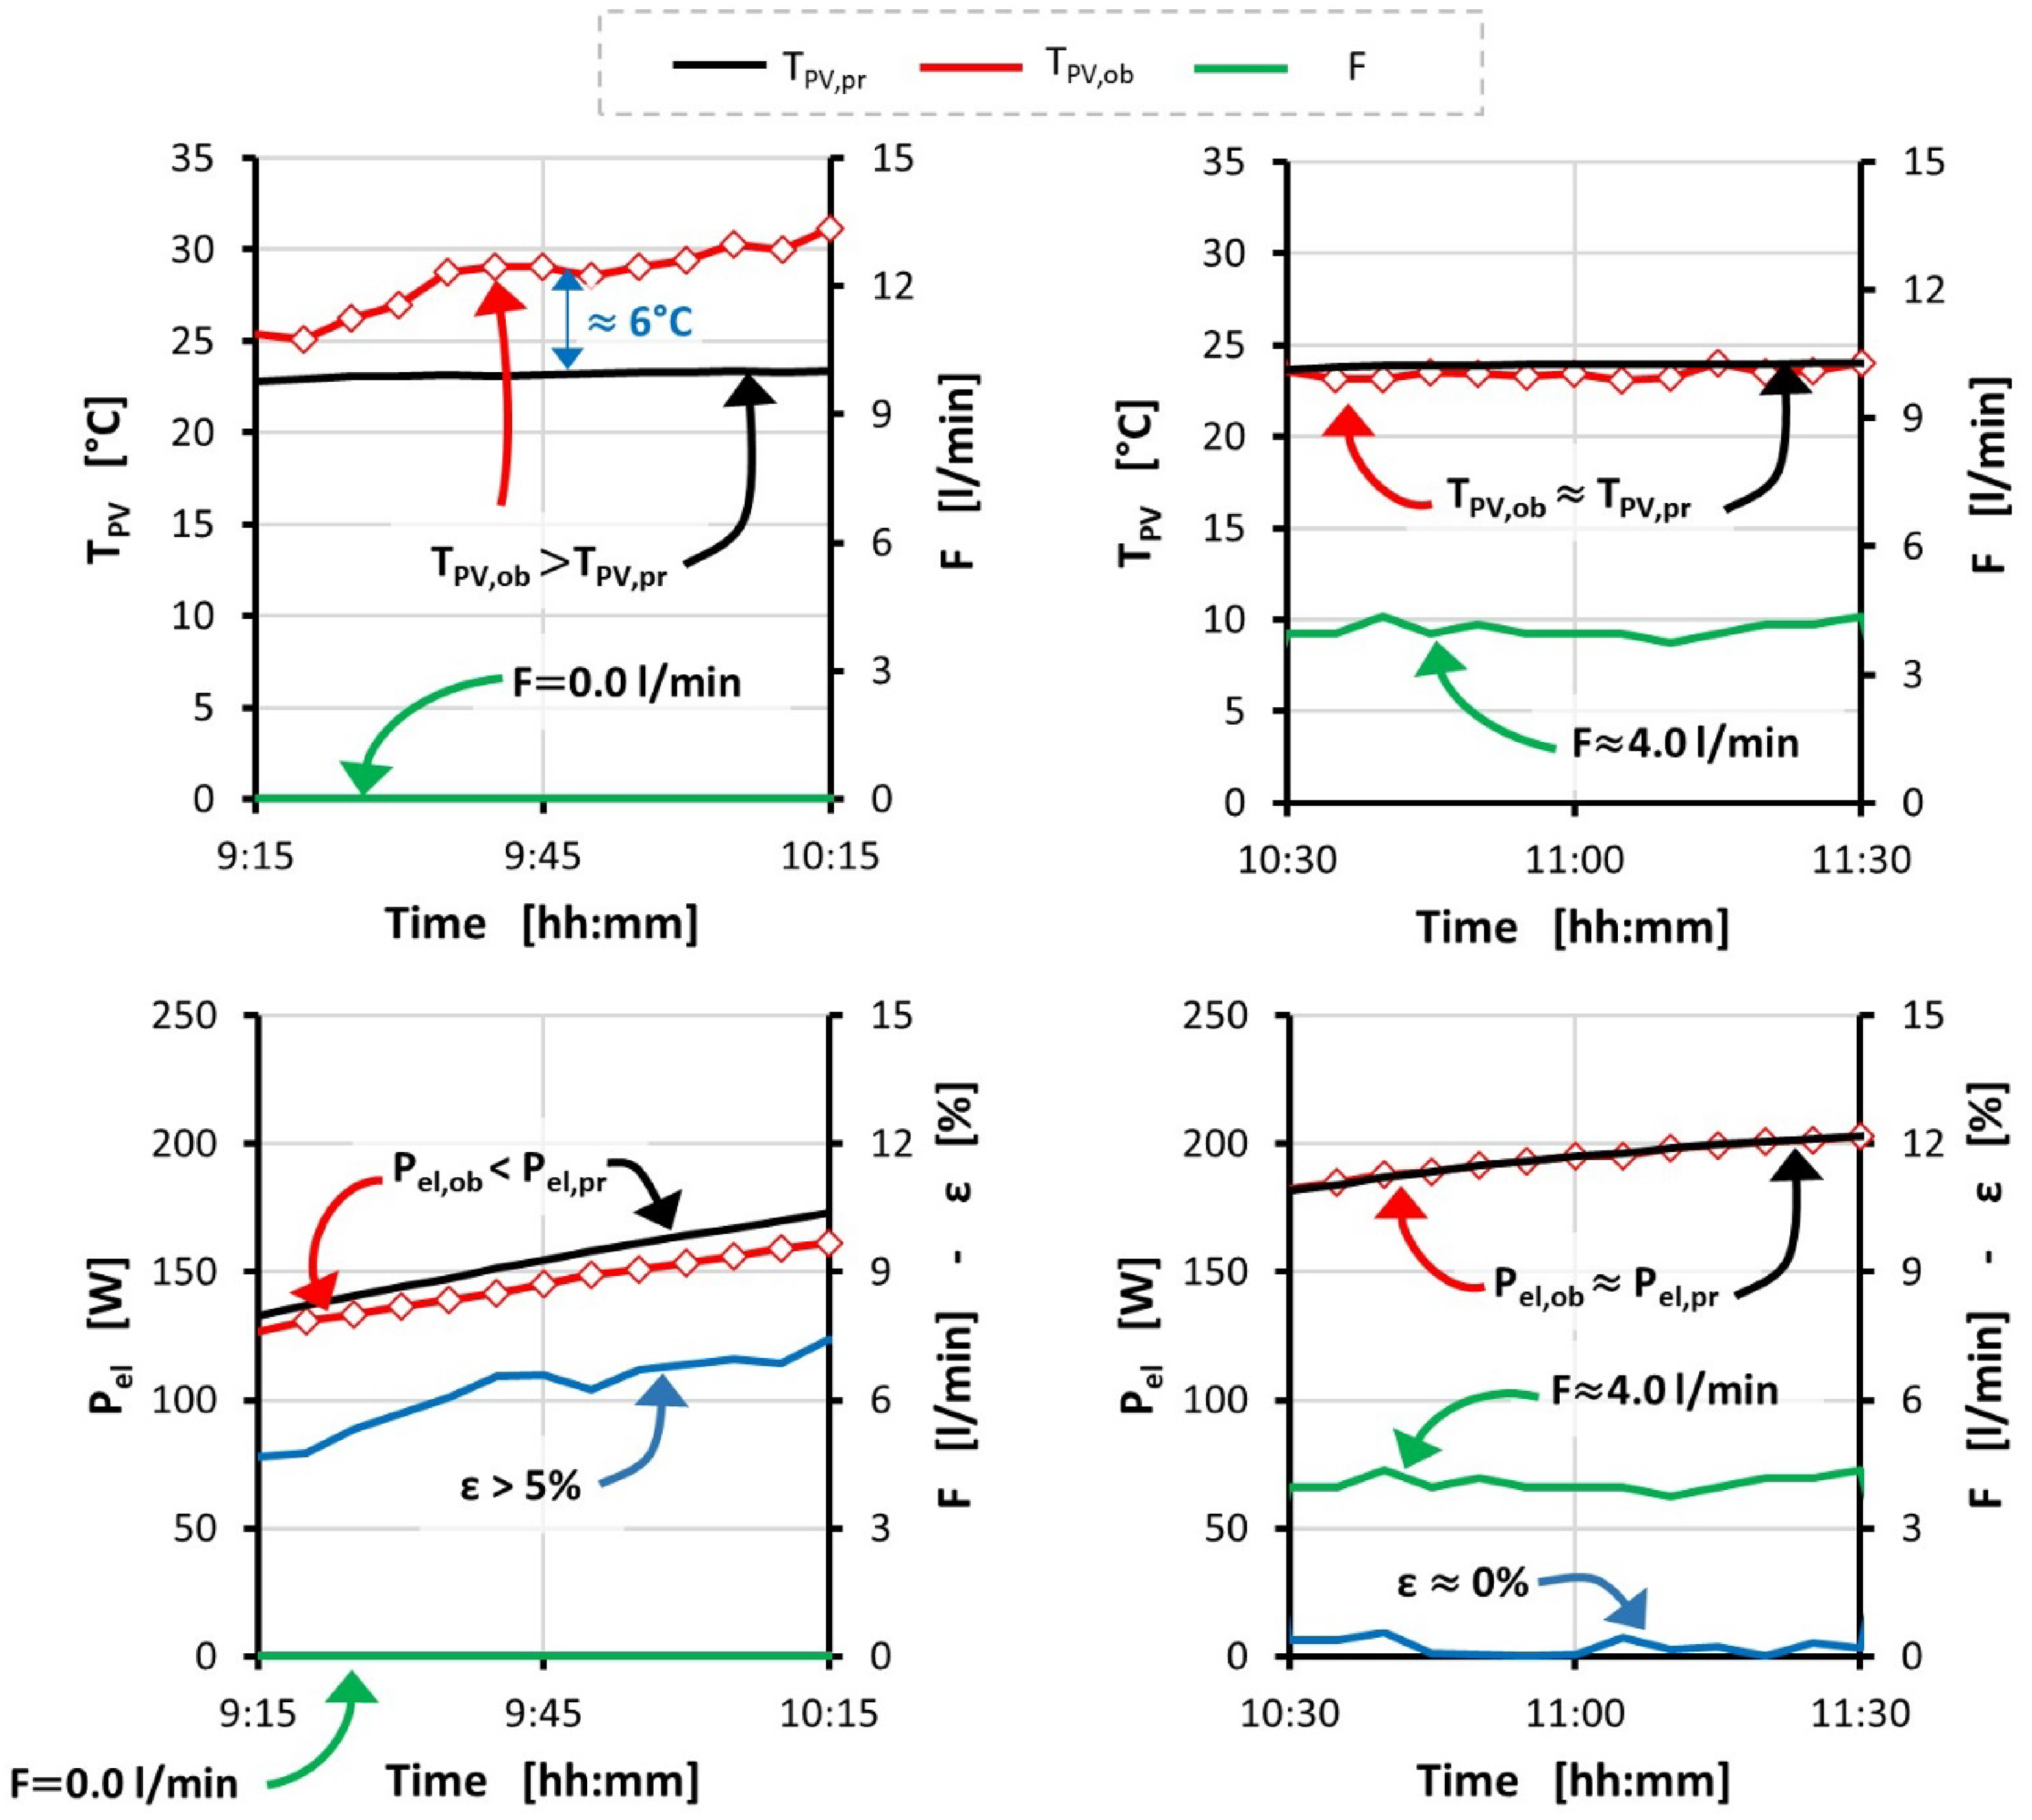
Comparison for two detailed periods: at left the period when the fault was induced and at right the period when the system works normally.
It can be observed that during the forced shutdown of the circulation pump, the measured photovoltaic cell temperatures increase by more than 6° compared to the predicted temperatures. This causes the reduction of the electricity produced with errors of more than 5%, a threshold that is considered to be an excellent indicator for reporting a possible failure. Differently, when the plant operates under the expected setting, the observed power is remarkably similar to that predicted one, thus demonstrating the strong viability of the developed model. This casuistic can have practical applications, such as highlighting unexpected shadows, hotspots that can cause similar behavior, or various malfunctions.
These results are remarkably interesting as they highlight that even a quite simple ANN, equipped with a limited number of sensors, so long as well trained, provides extremely useful tool that can be used for the diagnostic of a complex system such as a PVT plant.
In fact, the error calculated through Eq. 3 represents the loss of electrical energy production. This value will be more important the more we move towards the central periods of the day, with losses ranging from 5 to 9%. To these losses must be added the further loss of thermal energy, which in the case of the circulator stopping consists in the total loss in terms of thermal energy production.
Conclusions
This study is focused on AI for the monitoring and diagnosis of the PVT plant installed at the University of Catania campus.
In particular, the open-source development platform Edge Impulse has been used to build an ANN model that allows the prediction of the energy performance of the investigated PVT plant. The training of the ANN model was carried out using experimental data acquired under different settings, weather conditions, and operating temperatures. This data was initially checked to avoid possible reading errors or anomalies, so as not to affect the analysis and training of the network. Once a sufficiently robust model has been defined, it has been used for the continuous monitoring and diagnostics of the PVT plant.
The model created allows the prediction of the expected electrical power produced, which is compared in real-time with the actual power to report any anomalies. Some tests have been done to assess the model's effectiveness in highlighting malfunctions of the PVT plant under different operative settings.
It has been observed that, an anomaly such as the stop of the circulator in PVT systems, generates losses in terms of electrical production greater than 5% and total losses in terms of thermal energy, therefore the presence of ANN can report malfunctions in real time, allowing the user to act promptly and avoid substantial losses.
This approach can be extremely useful for improving the knowledge of the prosumer on the expected performance of solar systems in alternative or in synergy with more complex physical models.
Footnotes
Nomenclature
Acknowledgments
This research is supported by the Italian Minister of the University (MUR) - grant PRIN2020-HOTSPOT 2020LB9TBC.
Declaration of conflicting interests
The authors declared no potential conflicts of interest with respect to the research, authorship, and/or publication of this article.
Funding
The authors received no financial support for the research, authorship, and/or publication of this article.