
Abstract
Microbial fuel cells (MFCs) have potential in wastewater treatment, biogas production and clean energy generation. MFCs provide an interdisciplinary research approach incorporating engineering and natural sciences. This study explores MFCs’ capabilities to produce electricity and biogas from wastewater and field soil substrates with different compositions. A two-chamber MFC system was operated anaerobically. Household sewage water used as the organic substrate with different soil amounts. Six different process feed compositions, labeled MFC-1–6, were investigated. MFC-1 exhibited the highest biogas generation volume of 245 cm³ and 42 mW/cm² power density. MFC-5 and −6 yielded 100 cm³ and 130 cm³, respectively. Wastewater treatment was effective on day 20, with pH, conductivity, turbidity, and total dissolved solids decreased to 7.3, 2.6 mS, 326 NTUs, and 1114 mg/L, respectively. Since, MFC-1 autonomously generated −800 mV, an external battery supplied an additional 600 mV to meet the methane generation voltage requirements. MFCs’ effectiveness in addressing wastewater treatment and renewable energy production was highlighted.
Introduction
Rapid industrialization has caused environmental degradation and health challenges for both humans and ecosystems. This has raised global concerns about the need to develop energy-efficient solutions to address climate change and energy insecurity (Javan et al., 2023). As part of the pursuit of renewable energy, bioenergy has emerged as a vital component, offering numerous possibilities for sustainable energy solutions (Mandley et al., 2020). Bioenergy generation from various renewable feedstocks and waste streams, including animal waste, industrial gases, agricultural leftovers, wastewater, and municipal solid waste has emerged as a promising avenue amid the ongoing energy crisis (Wilson, 2023).
Wastewater contains a substantial amount of energy that can be effectively harnessed as a viable energy source (Ding et al., 2021). The integration of bioenergy generation with wastewater treatment not only promises clean energy production but also facilitates environmental restoration, creating a symbiotic relationship between the two processes (Lee et al., 2023). Several biological methods are utilized to generate bio-energy. Among them, microbial fuel cells (MFCs) have attracted attention as an environmentally friendly alternative to fossil fuels due to their ability to generate electricity while treating wastewater (Li et al., 2023). Initially proposed in the late 20th century for wastewater treatment, MFC technology has since seen significant advancements in both efficacy and efficiency (Kumar et al., 2019). MFCs have been considered as bioreactors because they convert chemical energy into electricity through the biocatalysis of microorganisms (Saran et al., 2023). Electroactive bacteria are utilized in MFCs to produce power and treat wastewater simultaneously (Yu et al., 2021). Additionally, MFCs hold potential for important applications such as carbon sequestration, bioremediation, biohydrogen production, and desalination (Kumar and Jujjavarappu, 2023). This versatile technology provides engineers and scientists with new opportunities to explore sustainable environmental solutions.
Paddy fields are flooded artificial wetlands characterized by abundant light, seasonal dynamics, and artificial disturbances (Natuhara, 2013). Although methane is a key component of combustible fuels, its low concentration in paddy fields makes it difficult to use. Moreover, a considerable amount of methane produced by methanogenic microorganisms in paddy fields is rapidly consumed by methanotrophic bacteria before it can be released into the atmosphere (Malyan et al., 2021). As a result, methane cannot be practically used as an energy source. Substrates are crucial for biofilm formation, and biofilms in MFCs can be influenced by adjusting the substrate nutrition; various substrates have been employed for this purpose (Xu et al., 2020). Paddy field soil as an MFC substrate serves as a natural source of microorganisms that thrive in anaerobic conditions. MFCs tap into the unexplored energy potential of paddy fields by converting various organic molecules into electricity using live microbes on electrodes as catalysts (Kumar et al., 2015). MFCs efficiently transform a wide range of organic substrates into electricity, using naturally occurring microbial communities as electrode catalysts (Prathiba et al., 2022). Numerous studies have investigated the use of MFCs as bioreactors for treating wastewater and recovering energy from organic waste (Munoz-Cupa et al., 2021).
However, despite these advances, the low energy generation efficiency of MFCs remains a significant barrier to their widespread use in environmental applications. Although numerous studies have explored the impact of methane production on electricity generation in MFCs, most have employed electricity-generating substrates consisting of simple organic matter or easily degradable compounds such as acetate, sodium acetate, glucose, and cellulose. In stark contrast, the organic matter present in sewage sludge is predominantly microbial in nature and is intricately compartmentalized within microbial cell membranes. The hydrolysis of cell envelopes is a prerequisite for the utilization of most organic matter in sludge by various microorganisms. This process includes challenges such as the absence of anaerobic sludge as an inoculum, low methane production in MFCs without methanogenesis suppression, and a lack of control tests with methanogenesis suppression. Moreover, the complex relationship between electricity and methane production in sludge-fed MFCs remains unclear. Particularly, those with anaerobic sludge seeds remain poorly understood and require further investigation to gain a comprehensive understanding of these complex interactions.
The present study aims to concurrently produce electricity and methane by harnessing the potential of bacterial consortia present in paddy field soil. This study focused on increasing methane production through the development of self-sustaining MFCs, while concurrently treating wastewater. Various parameters, including open-circuit voltage (OCV), current intensity, current density, power density, chemical oxygen demand (COD) removal, Columbic efficiency (CE), and methane production were scrutinized within bioelectrochemical systems. The substrate employed was a combination of paddy field soil and sewage water, which were selected because of their high total solid, volatile solid, and organic matter contents.
Material and methods
MFC design and fabrication
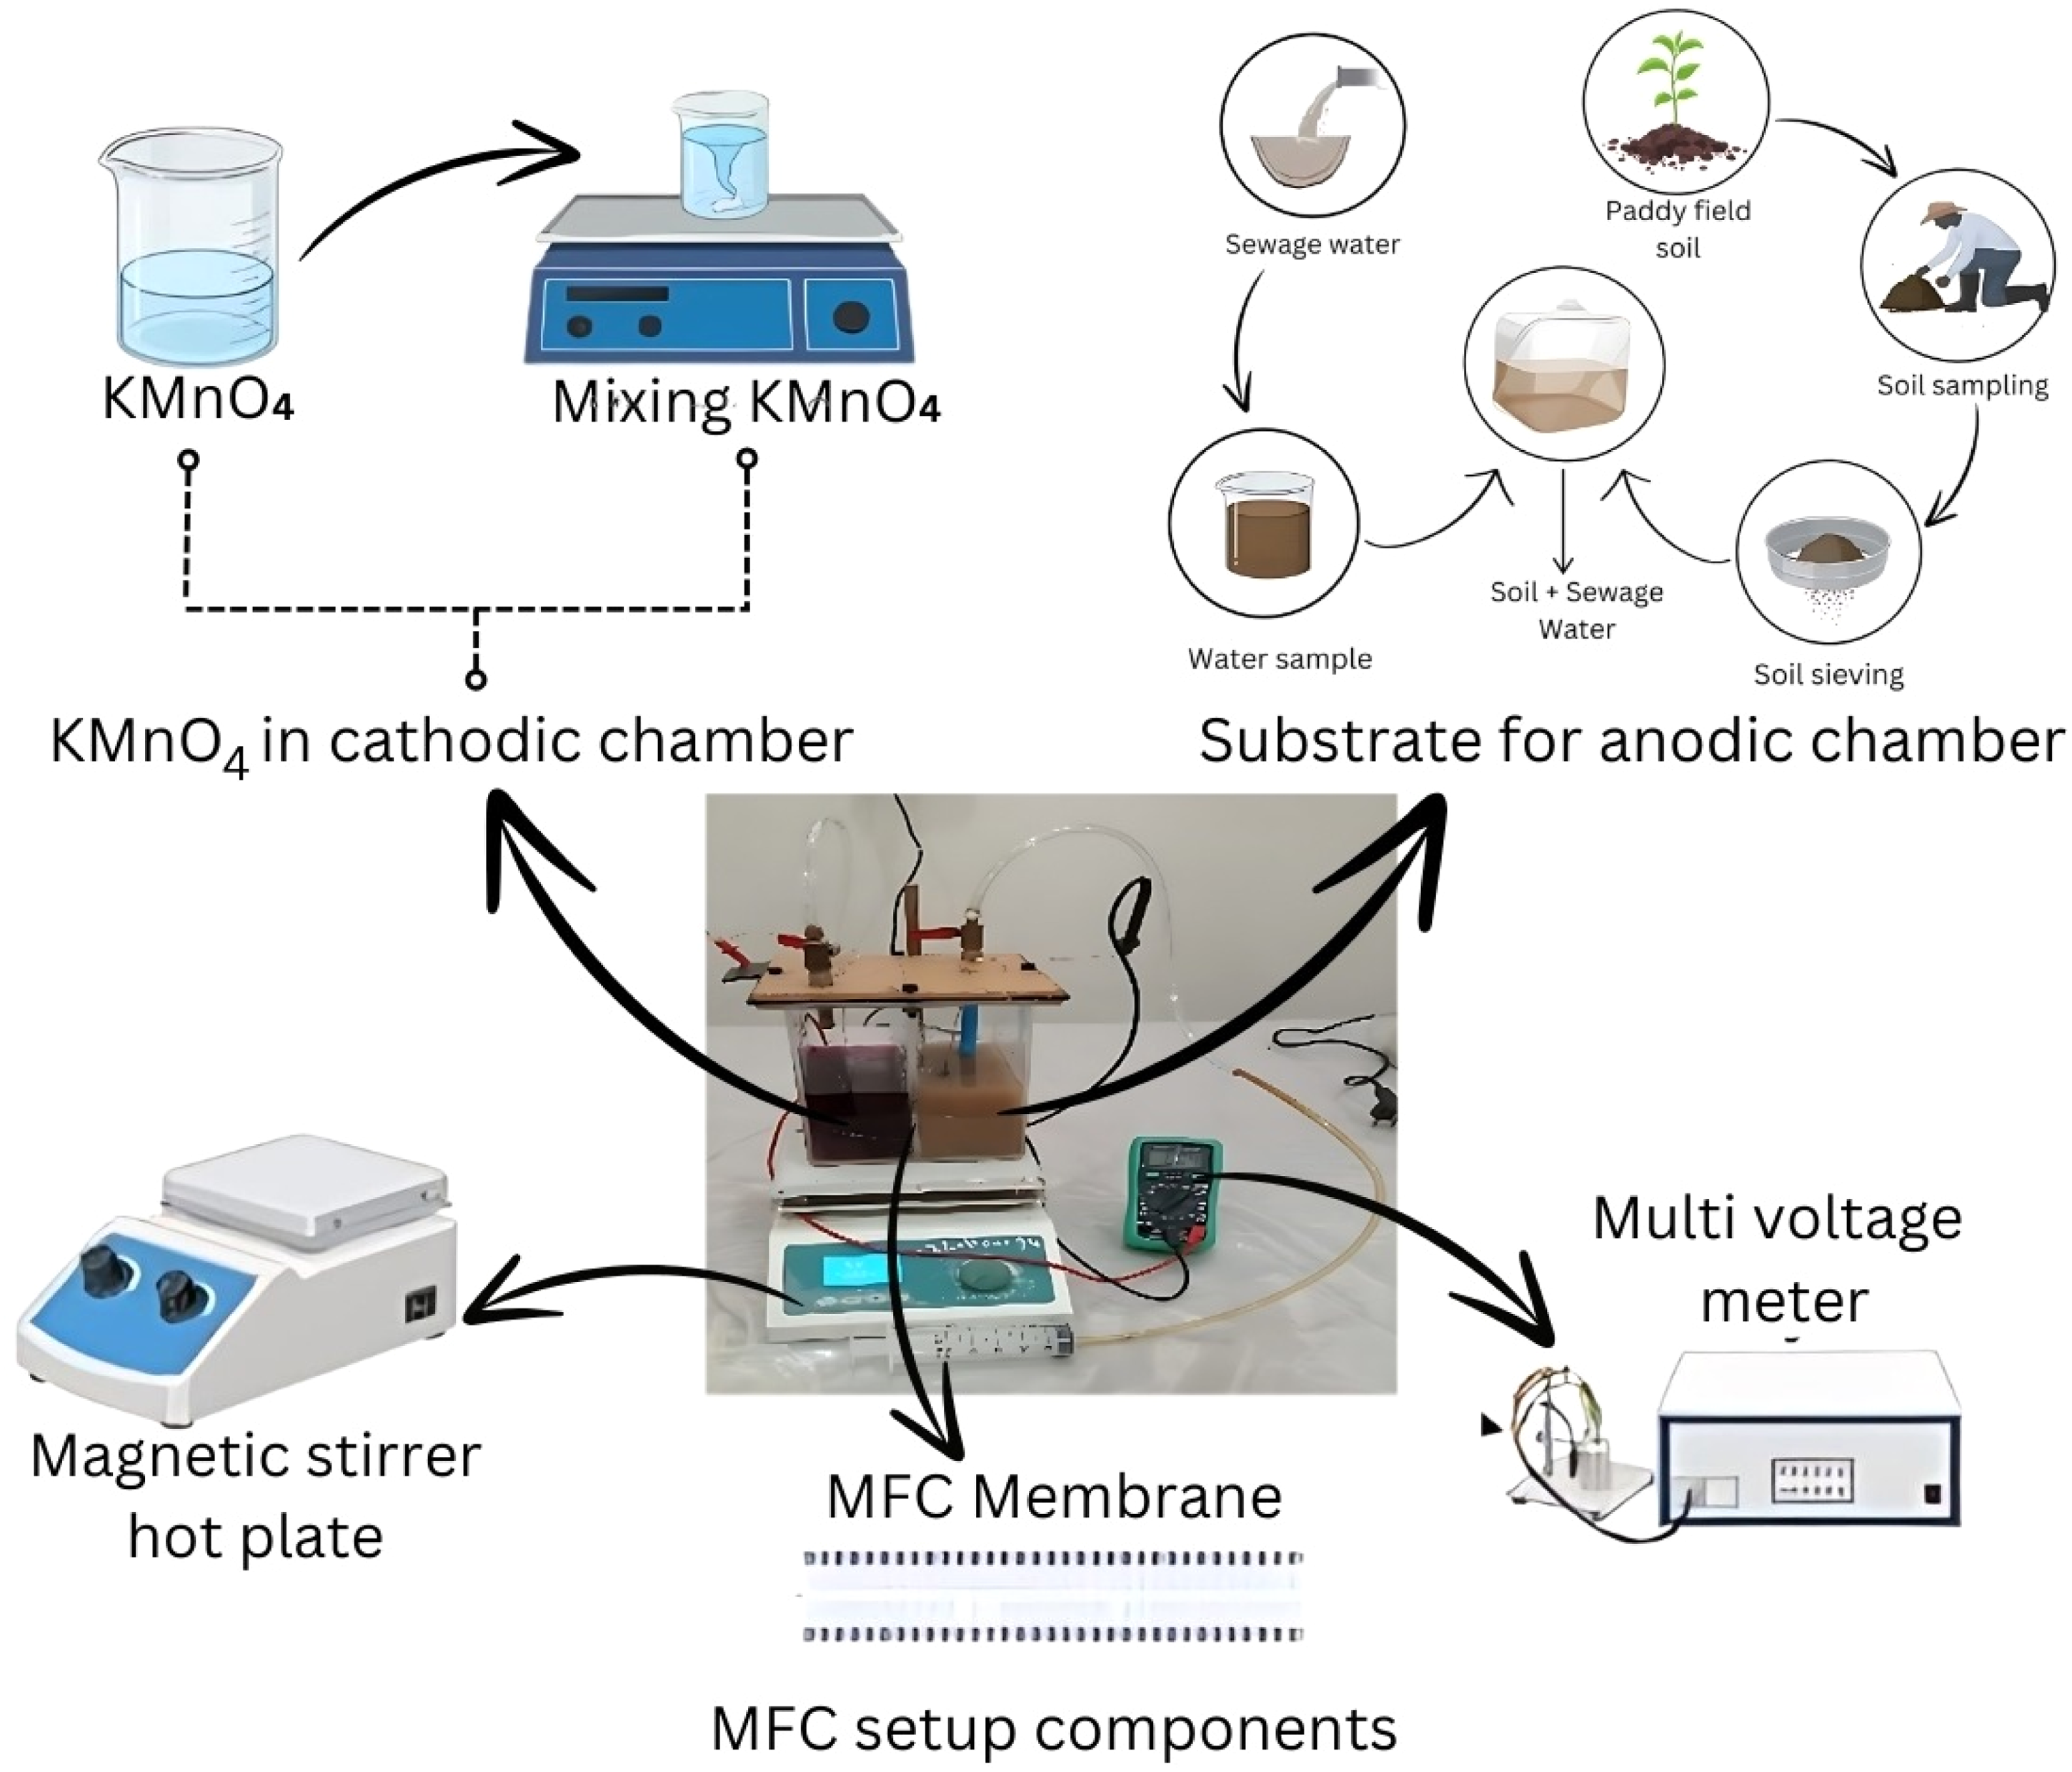
A dual-chamber MFC was developed to facilitate anaerobic biodegradation. The cubical MFC was fabricated using an acrylic sheet with a thickness of 0.5 cm. The MFC had two chambers divided by a proton exchange membrane (NafionTM 117). The MFC had a total volume of 3680 cm3, a height of 17.5 cm, width and height 14.5 cm. It was sealed with silicone rubber and secured using rubber sealing materials. The volume capacity of each MFC chamber was 1840 cm3. The MFC's lid had two groups of drilled ports. Moreover, it had two rotary-flow stoppers (D = 0.8 cm) in the pairs of ports. One port was used to allow methane to escape from the top of the MFC and into the gas collector bag. This port was positioned at the top of the MFC to ensure efficient collection of methane gas produced during the treatment process. The other port was used to take process feed sample periodically for characterization. An additional set of ports was utilized to suspend the electrode pair, which had a diameter of 0.6 cm. The anode and cathode were constructed using a titanium dioxide sheet. These sheets had dimensions of 4 × 5 × 0.2 cm and were connected to a copper wire through a resistor (Elakkiya and Matheswaran, 2013). The electrodes were positioned equidistantly 3.8 cm from the membrane. A schematic of the MFC setup is shown in Figure 1.
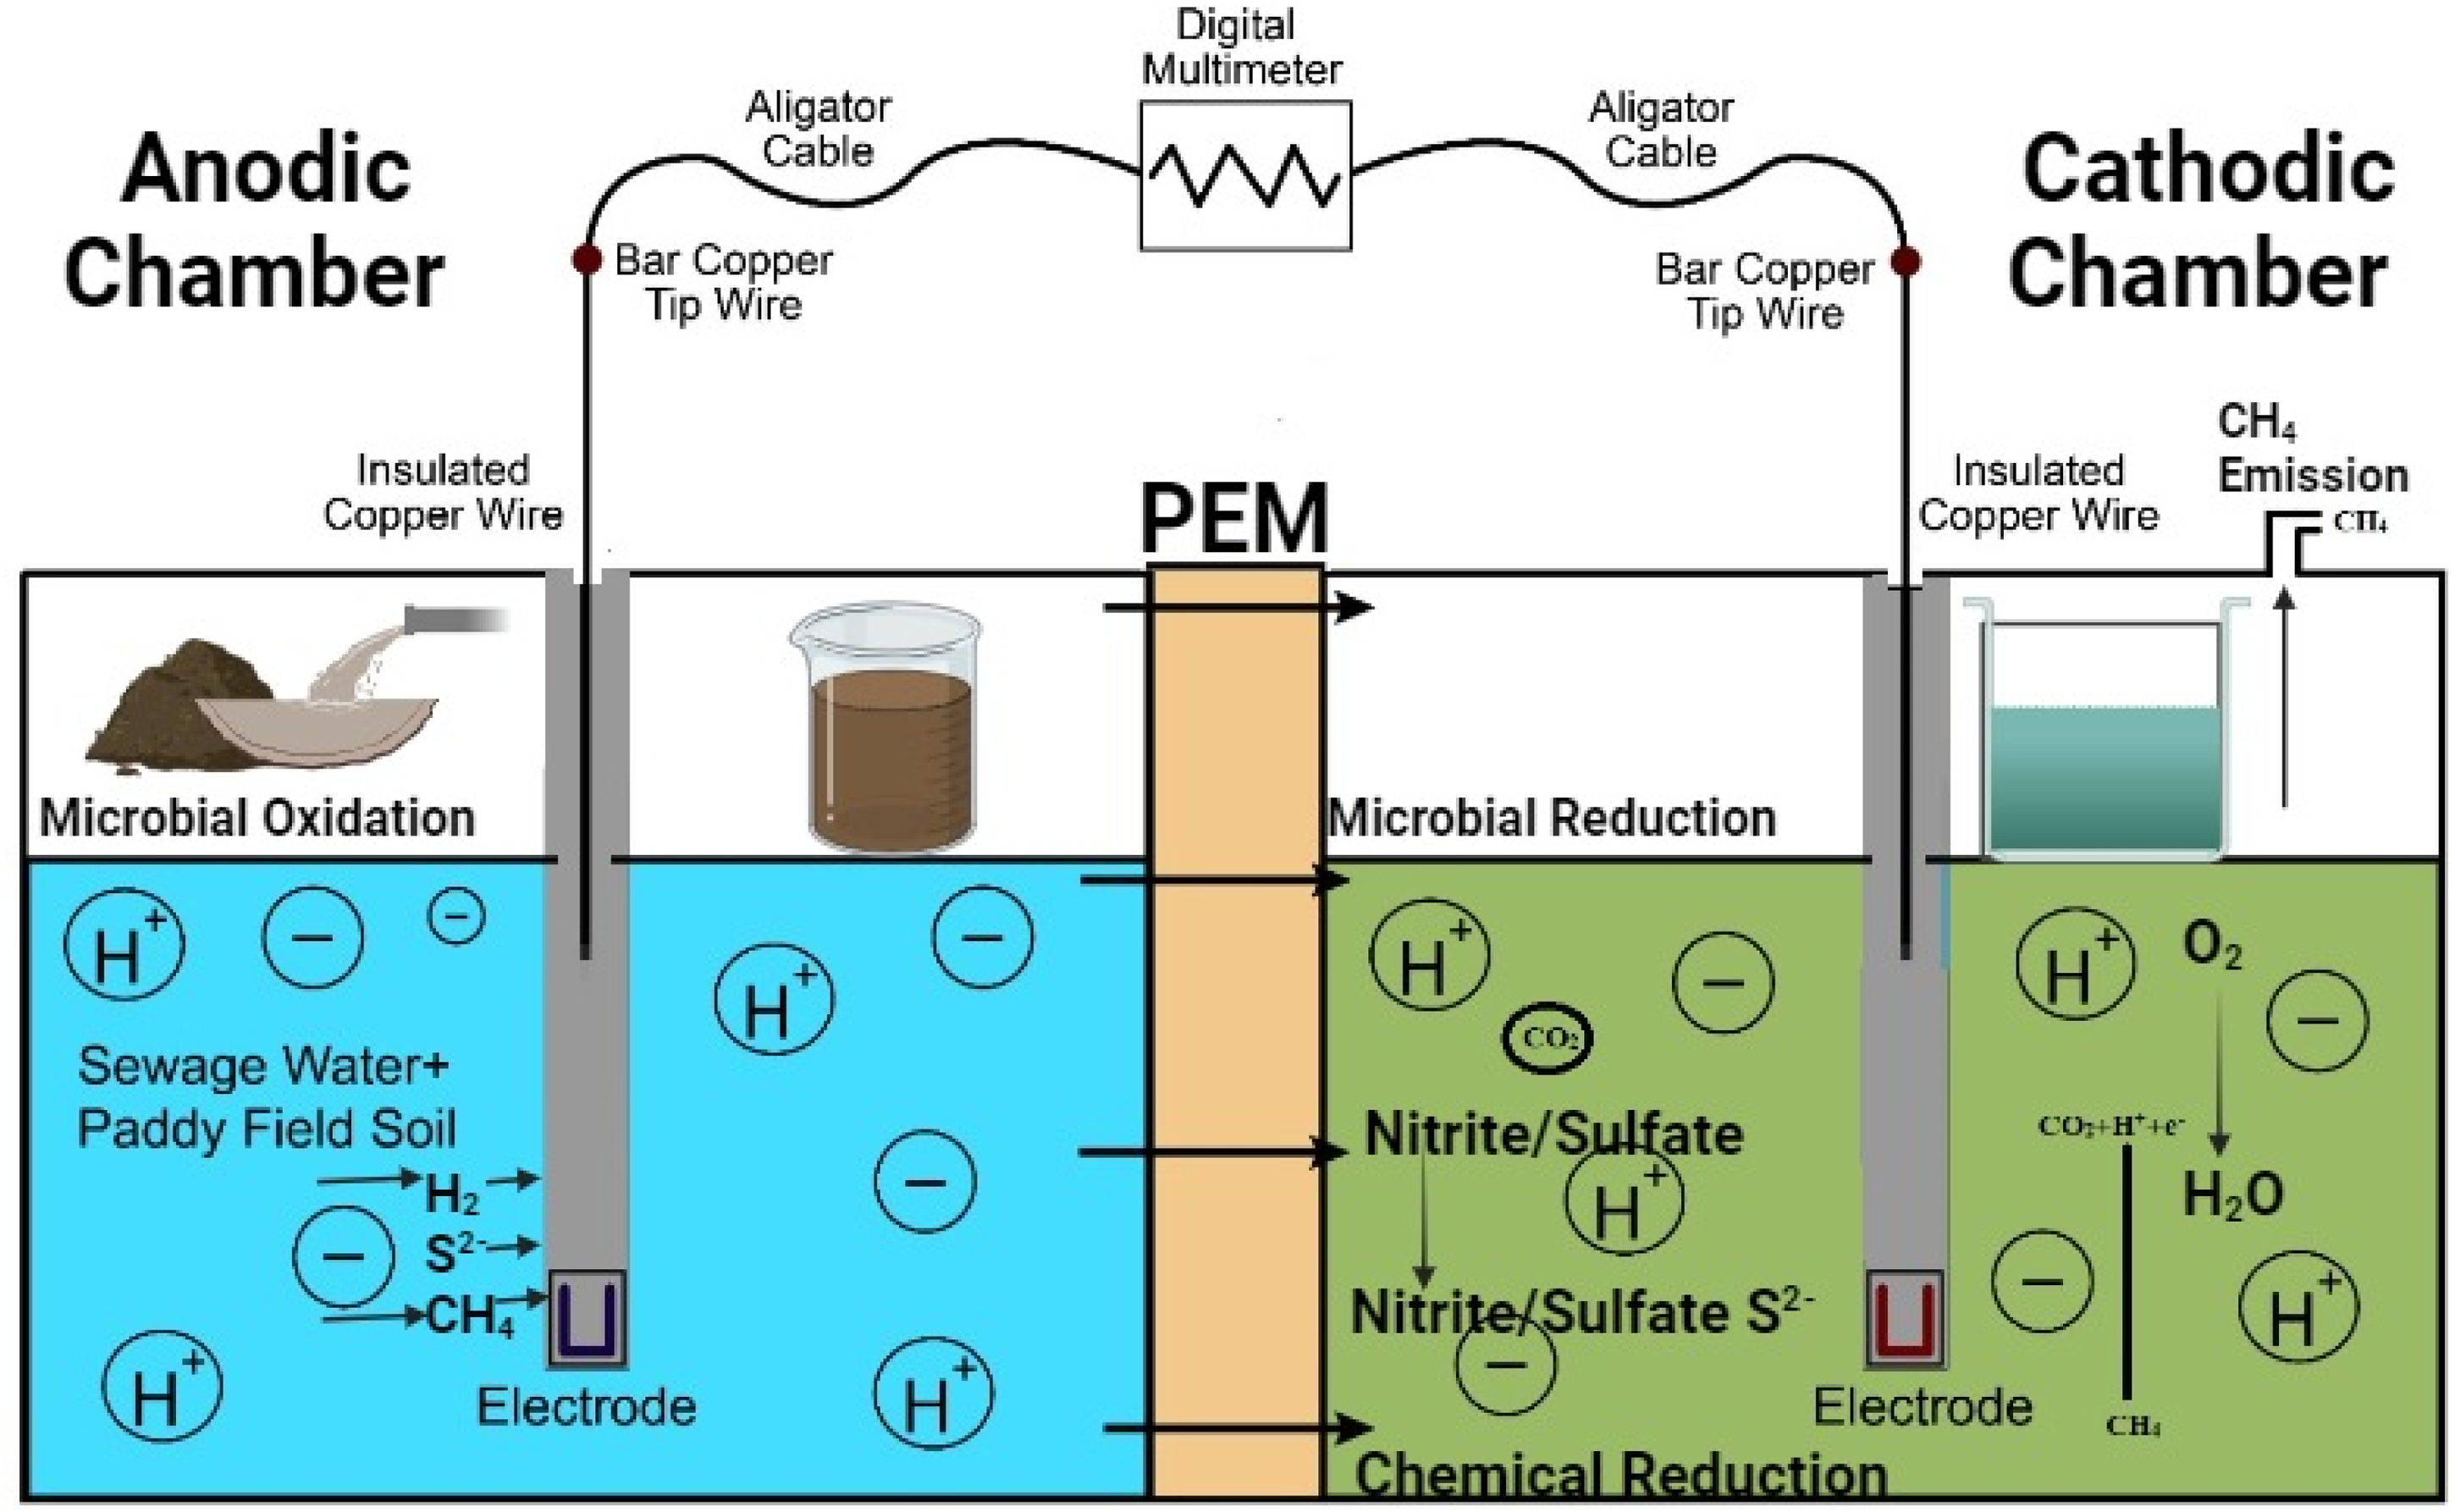
Schematic diagram of MFC setup.
Substrate collection and preparation
Paddy field soil was collected from a paddy field adjacent to the Khwaja Fareed University of Engineering and Information Technology, Pakistan, using a soil auger. The sampling depth was 15–30 cm for taking soil samples from the root zone of the rice plant. After collection, soil samples were stored under aseptic conditions to minimize microbial contamination. Sewage sludge was collected from a sewage water line in Rahim Yar Khan, Pakistan. After the sewage water was collected in a sanitary container, it was transferred to a laboratory for further examination. The initial characteristics, such as pH, total dissolved solids (TDS), and electrical conductivity, were determined using prescribed protocols. The initial characteristics of Sewage water and paddy field soil is mention in Tables 1 and 2.
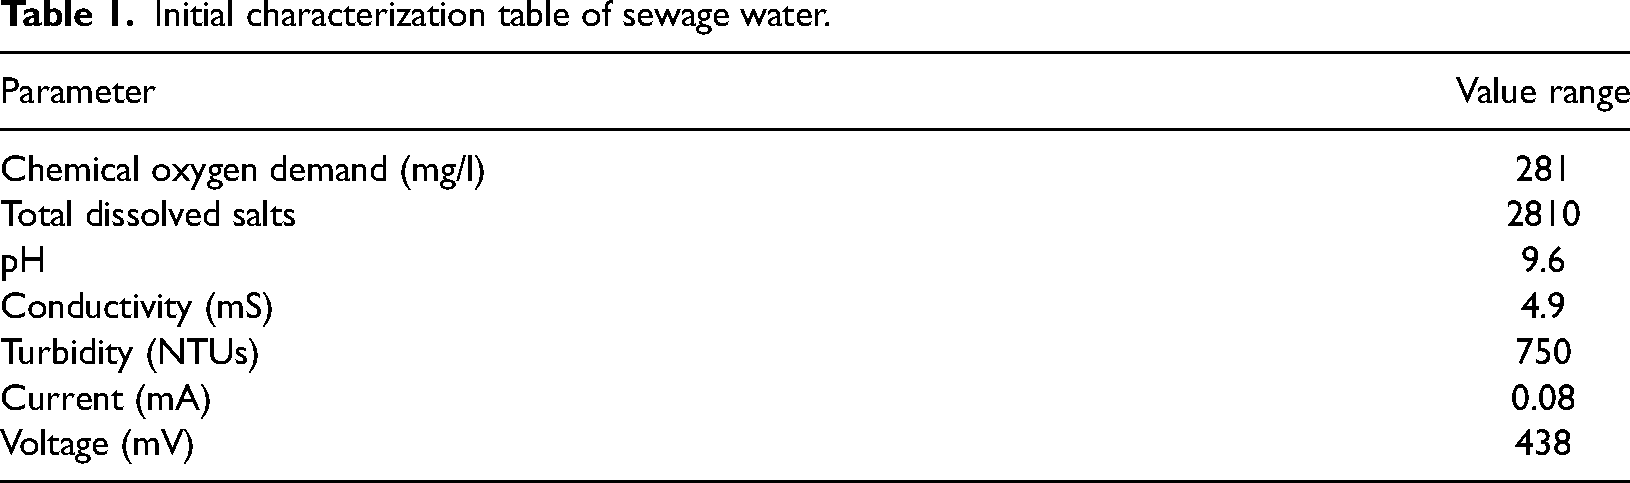
Initial characterization table of sewage water.
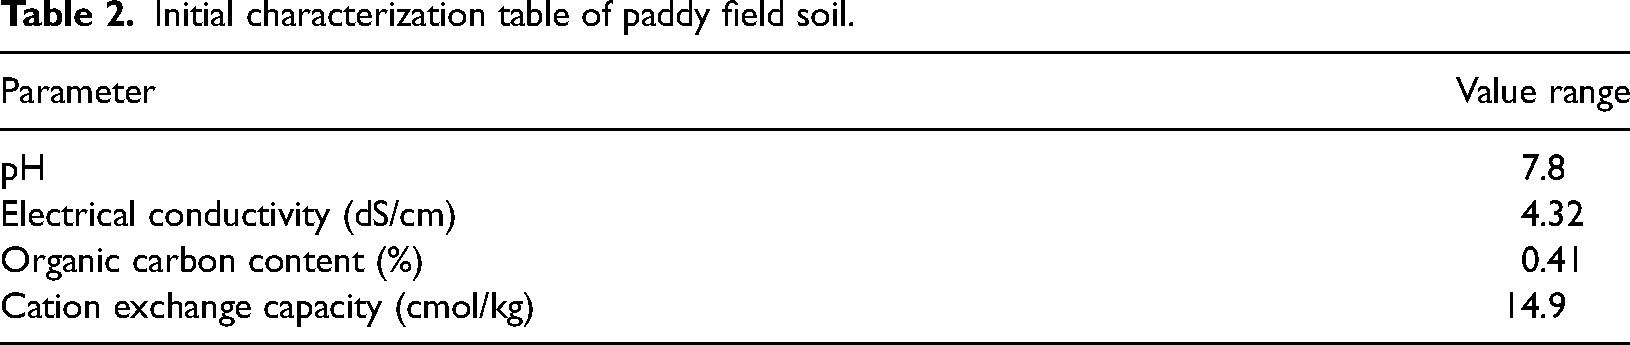
Initial characterization table of paddy field soil.
MFC setup and analysis
MFCs were operated in batch mode using six different setups with two different concentrations of substrates in the anodic region as the anolyte in MFC-1 (200 g paddy field soil added to 800 ml of concentrated sewage water), MFC-2 (100 g paddy field soil added to 800 ml of concentrated sewage water), MFC-3 (200 g paddy field soil added to 800 ml of [50% diluted] sewage water), and MFC-4 (100 g paddy field soil added to 800 ml of [50% diluted] sewage water). MFCs with different compositions were used to determine the effect of substrates on electricity and biogas production compared to controls, that is MFC-5 (200 g paddy field soil and 800 ml distilled water) and MFC-6 (200 g paddy field soil and 800 ml tap water). A KMnO4 catholyte (0.5 g/L) was used as the electron acceptor in the cathode chamber because of its greater redox potential than oxygen (Rikame et al., 2012). A 0.6-V external voltage was applied using an external power source that had a constant resistance of 50 Ω. Regular stirring was performed to maintain the homogeneity of the MFC anodic chamber. A hydraulic retention time (HRT) of 20 d at 35°C under anaerobic conditions was applied to the MFCs. The MFCs were subjected to threshold voltages in the range −1400–1800 mV to increase its bioelectrochemical activity (Guo et al., 2013). To simultaneously produce biogas, the maximum voltage produced from the MFCs under specific experimental settings is known as the remaining OCV. The OCV was supplied to the MFCs via a battery. A photograph of the experimental MFC setup is shown in Figure 2.
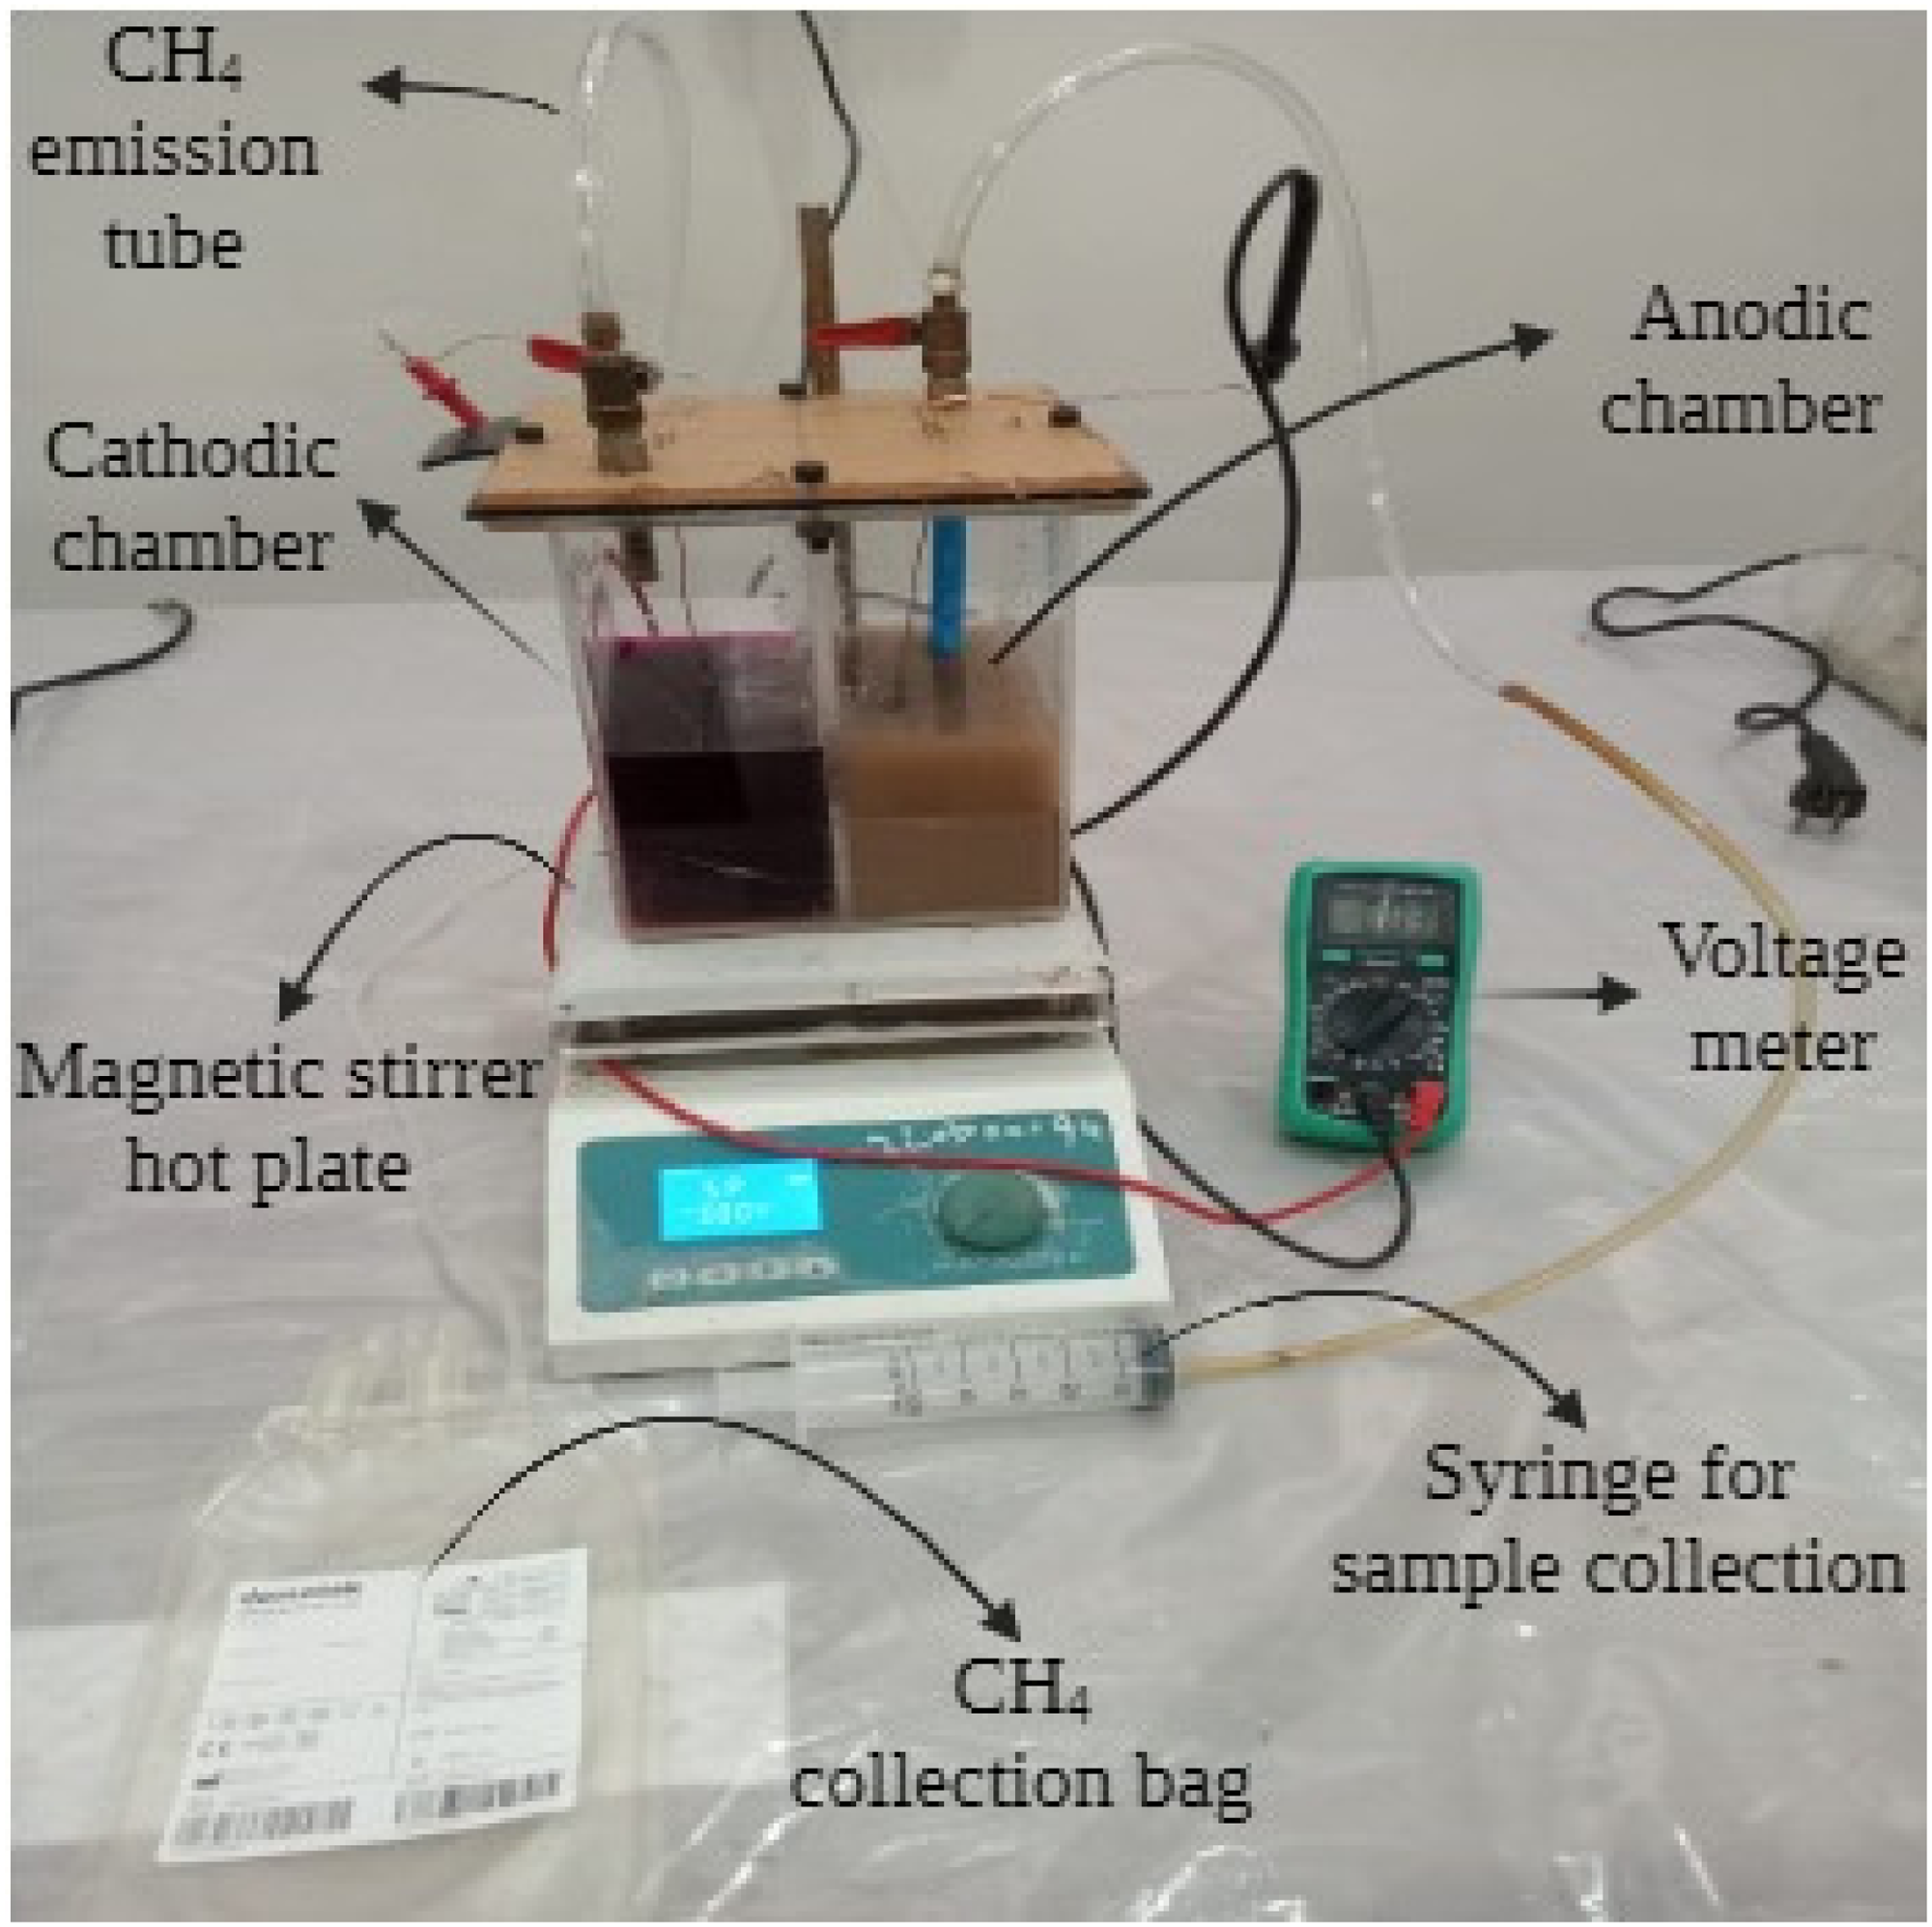
Photograph of experimental MFC setup.
Prior to the experiment, the substrate in the MFCs was physically and chemically characterized. After 24 h, the OCV and current were measured using a potentiostat. Based on the literature, OCV was measured using electrochemical analytical techniques such as cyclic voltammetry. The CE, power density, current density, and current intensity are stated by (Martins et al., 2014). The precise values of the current density (i) and power density (P) were determined using equations (1) and (2), respectively (Baranitharan et al., 2015; Logan, 2006).

where I represents the intensity of the current and V represents the OCV. The predicted surface area of the anode was A. A pH meter was used to monitor the effluent pH. The COD analysis was performed using the standard dichromate method as described in Rice (2012). This method involves the oxidation of organic matter in the sample by a strong chemical oxidant (potassium dichromate) in an acidic medium, followed by titration to determine the amount of oxidant consumed (Adowei and Abia, 2016).
Cyclic voltammetry analysis was conducted using a chronopotentiometric approach. During cyclic voltammetry analysis, a glass cell with a capacity of 50 mL and ZRA model 3000 potentiostat/galvanostat were utilized using the standard three-electrode arrangement. A reference electrode was employed as a saturated calomel electrode, and its potential difference from the standard hydrogen electrode was +0.241 V. A CE of 5% was determined using equation (3) (Koók et al., 2019):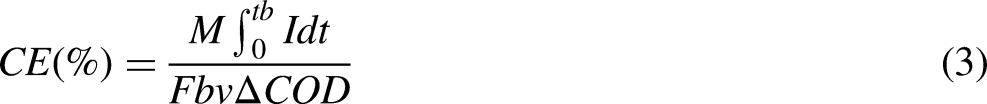
Methane gas collection method
Daily measurements of the biogas volume were conducted using a gas collection pneumatic syringe (Mahmoodi et al., 2018). Biogas was accumulated within a gas collection bag and thereafter linked to the rotational flow stopper of the MFC. The gas collector bag outlet was connected to a pneumatic syringe to measure the biogas volume. Following the collection process, a flame test was conducted to verify the efficacy of biogas production in each MFC. A Bunsen burner was linked to a gas syringe and positioned in the dark to observe a distinct flame (Ilminnafik et al., 2018). A detailed flowsheet of the MFC setup is shown in Figure 3.
Flow sheet diagram for MFC setup.
Results and discussion
MFC performance analysis on substrate physicochemical properties
The pH levels in the MFCs containing sewage water (MFC-1, MFC-2, MFC-3, and MFC-4) decreased consistently over time, as shown in Figure 4(a). Notably, MFCs with higher sewage water concentrations (MFC-1 and MFC-2) displayed lower pH levels by the 20th day than those with lower concentrations (MFC-3 and MFC-4). Specifically, the MFC-1 exhibited a significant decline in pH. The pH started 9.8 on day 2 and reached 7.2 by day 20, suggesting a steady acidification trend indicative of efficient organic matter degradation. Moreover, the difference in pH between the MFCs containing sewage water and the control MFCs (MFC-5 and MFC-6) was more pronounced in MFCs with higher sewage water concentrations (MFC-1 and MFC-2). Conversely, MFC-5 (distilled water, 100 g of soil) and MFC-6 (tap water, 100 g of soil) exhibited minimal pH variations over time. Notably, MFC-5 displayed an irregular trend with an increase in pH from 7.02 on the day 2 to a peak of 7.6 on day 16 before decreasing again by the day 20. This potentially indicates issues such as insufficient microbial activity and limitations in the current configuration. The MFC experienced inconsistent pH variations when distilled water was used. This was most likely due to the absence of appropriate microbial activity. However, the observed pH decline in MFCs containing sewage water over time suggests alterations in the microbial community composition and effective decomposition of organic waste. This is consistent with prior studies (Sevda et al., 2013), which demonstrated the efficacy of MFCs in treating wastewater with high concentrations and generating bioelectricity. The decline in pH observed in the MFCs exposed to sewage water suggests the presence of a diverse microbial community capable of decomposing organic materials. The alteration in microbial composition is crucial as it reflects the adaptation and succession of microbial communities to optimize the degradation of organic matter and enhance electron transfer processes (Uria et al., 2017).
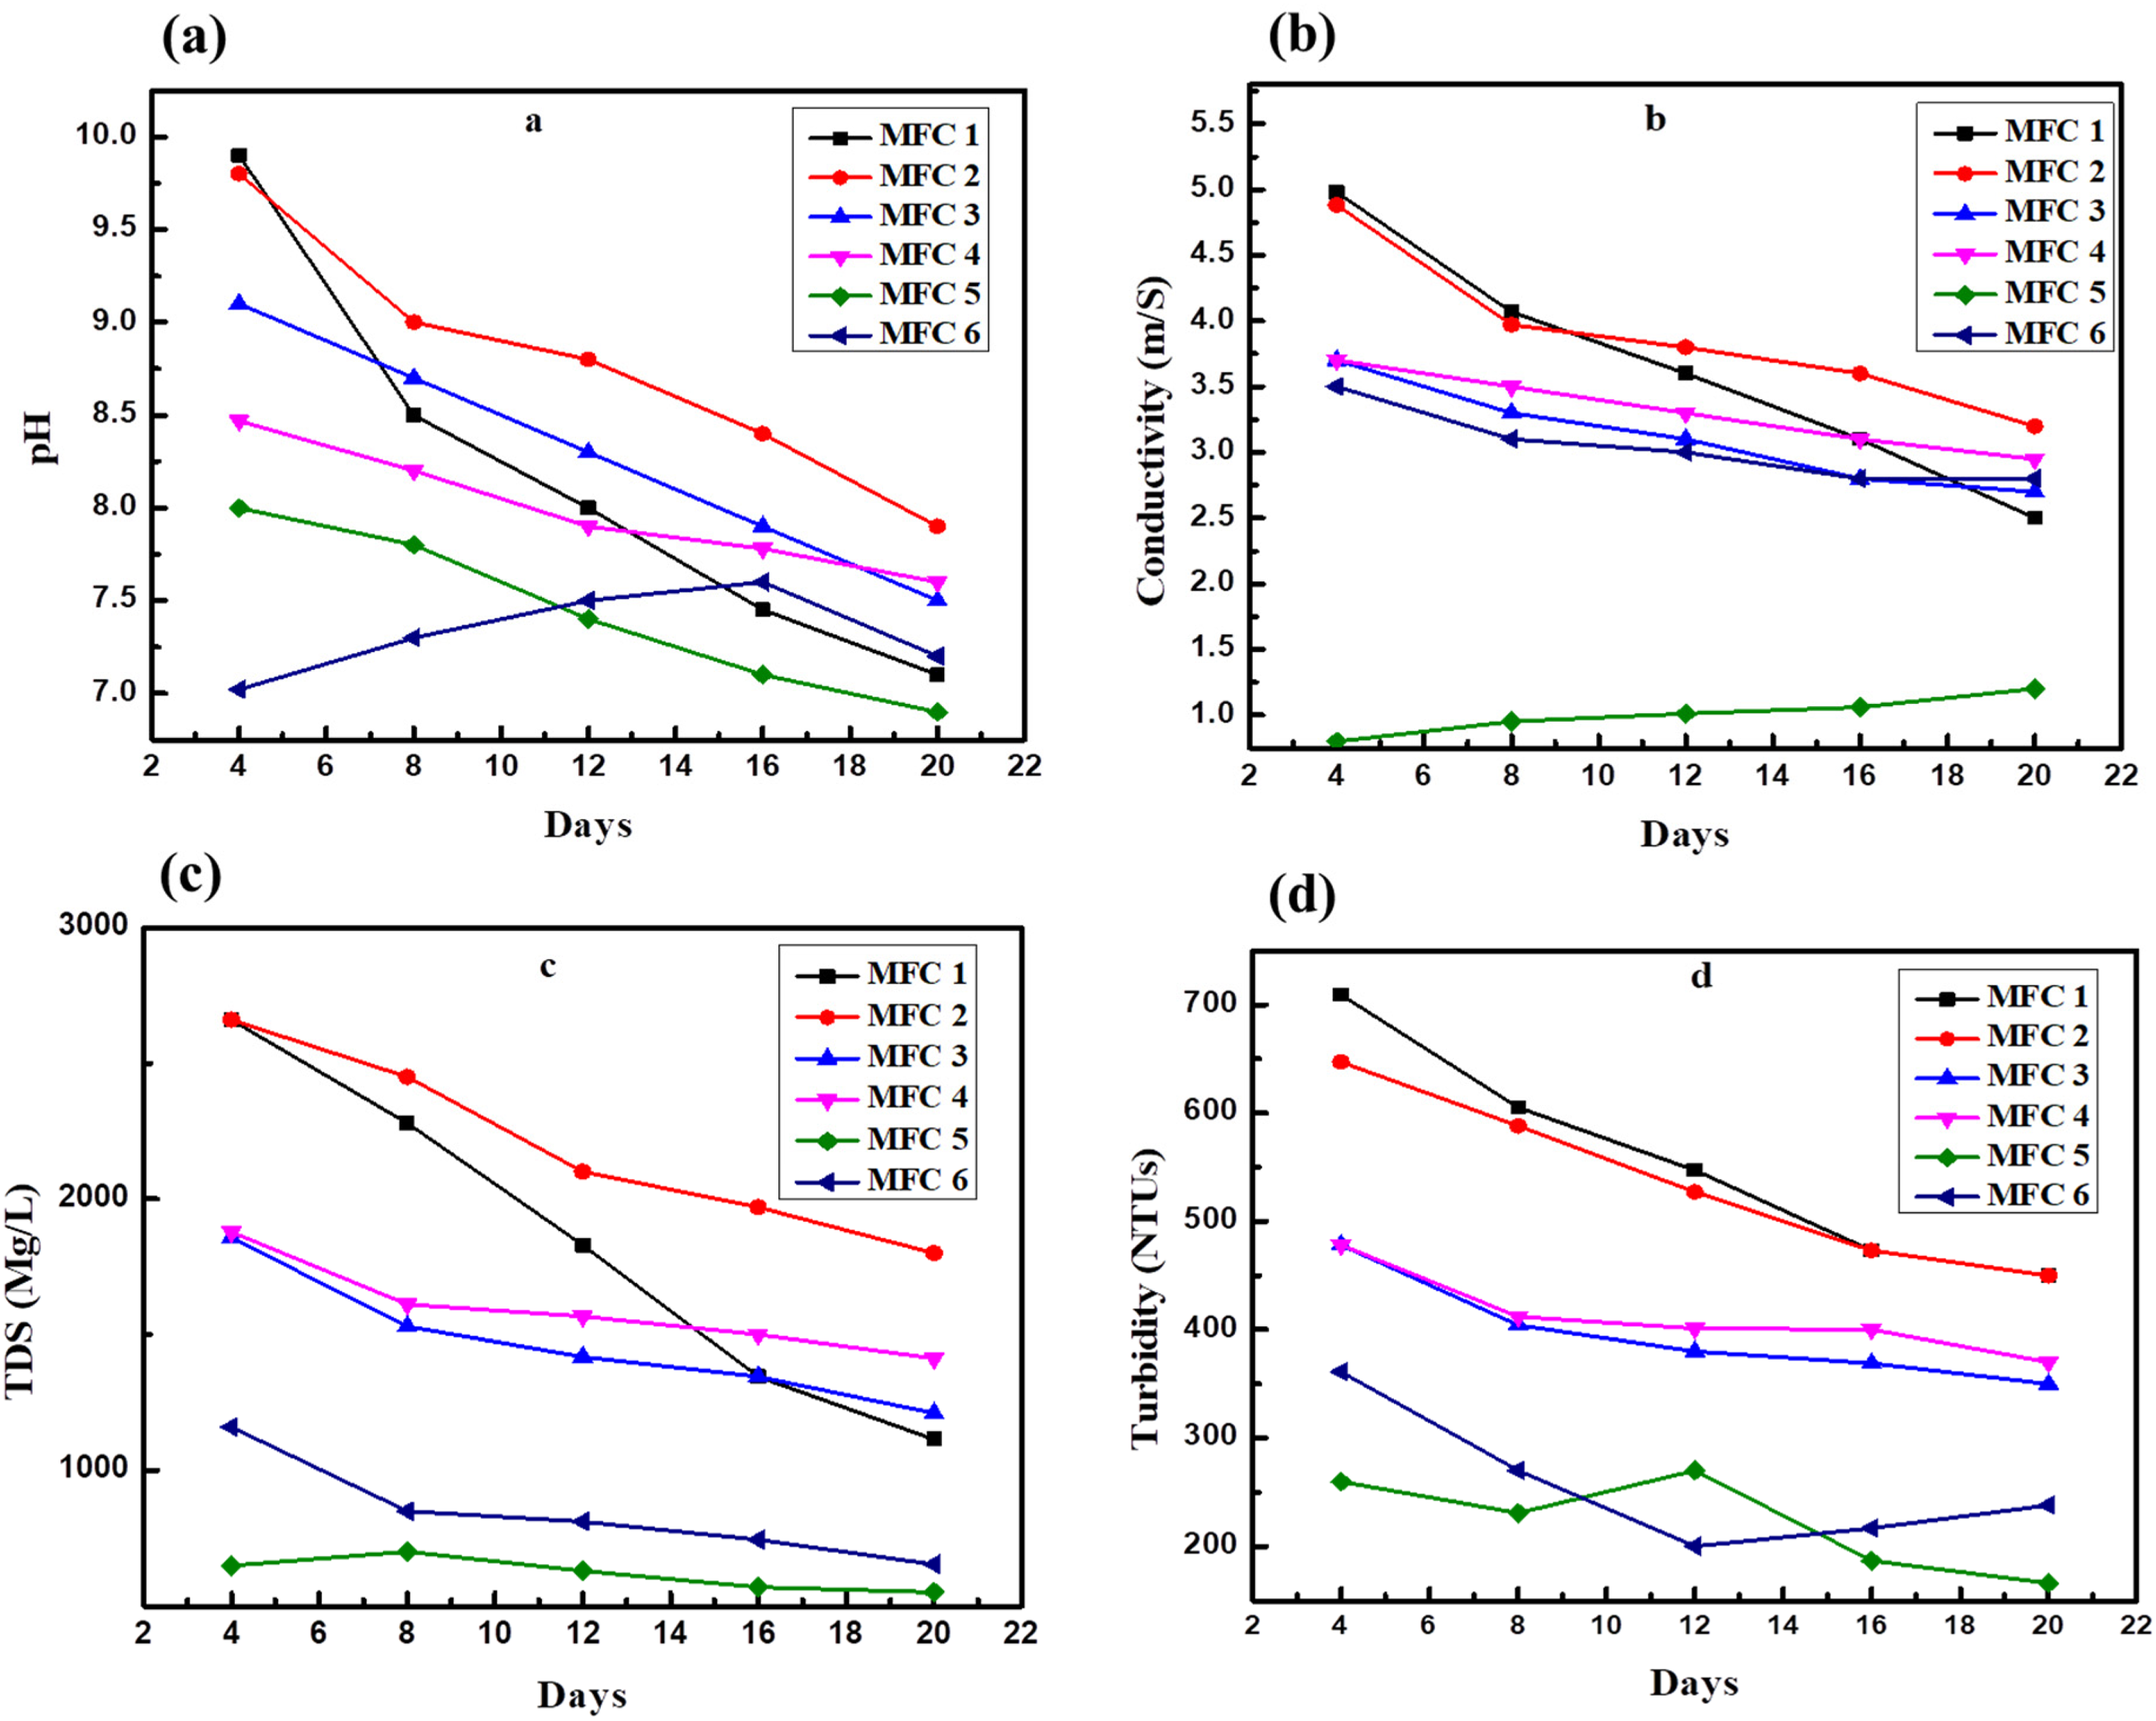
MFC performance analysis results on factors that influence substrate physicochemical properties: (a) pH, (b) electrical conductivity, (c) turbidity, and (d) TDS variations in MFCs over time.
All MFCs, except for MFC-5 (D.W + 200 g), exhibited a decreasing trend in conductivity over time. Finally, the activity reaches its peak by the 20th day of incubation, as shown in Figure 4(b). Notably, the conductivity of MFC-5 increased linearly throughout the experimental period. Initially, MFC-1 displayed the highest conductivity among all the MFCs. However, it experienced a relatively faster rate of decrease, reaching its lowest value by the 20th day of incubation. These findings align with those of Santoro et al., who reported a decrease in solution conductivity as organic substrates were degraded. Specifically, MFC-1 initially exhibited high conductivity, which decreased over time (Santoro et al., 2013). Conversely, MFC-6 (T.W + 200 g) showed a slight decrease in conductivity on day 8, followed by an increasing trend by day 20. Hence, the conductivity reached 2.85 m/s. Several factors, including temperature, pH, salinity, and the electron acceptor in the cathodic chamber, have the potential to influence the conductivity and overall performance of MFCs. The microorganisms and the type of substrate present in MFC can affect the performance and conductivity of MFCs. Borole et al. suggested that variations in anode, cathode, and solution/membrane impedances may account for such fluctuations in conductivity (Borole et al., 2010).
The TDS content of all the MFCs exhibited a decreasing trend over the course of the experiment. Notably, significant decreases were observed in the TDS content of MFC-1 and MFC-2, whereas MFC-3 and MFC-4 showed only slight changes, as shown in Figure 4(c). Conversely, MFC-6 displayed an increase in TDS content by the 4th day of incubation, with a continued rise observed by the 20th day. Specifically, in MFC-1, the TDS content decreased from 2660 mg/L on the 4th day to 1114 mg/L by the 20th day, while in MFC-2, it decreased from 2660 mg/L on the 4th day to 1800 mg/L by the end of the experiment. Conversely, MFC-6 exhibited an irregular trend, as the TDS content increased from 649 mg/L on the 2nd day to a peak of 701 mg/L on the 8th day before decreasing again by the 20th day. These findings are consistent with Borole et al., who demonstrated that the performance of a two-chamber MFC decreased as the cathodic dissolved oxygen levels dropped. Consequently, the TDS levels were reduced. The TDS content can be affected by alterations in the electrolyte composition. Over time, the TDS concentration decreased because of reactions occurring within the MFC cells. These reactions can result in the removal or transformation of dissolved solids. Additionally, the microorganisms present within the MFC may play a role in decreasing the TDS concentration of microbes. Moreover, they are responsible for the metabolism of organic materials and the breakdown of chemicals, which may result in a reduction in TDS levels. Similarly, Lozano et al. observed a decrease of more than 97% in TDS concentration in wastewater treated at a treatment plant, indicating the efficacy of MFCs in reducing TDS levels (Lozano et al., 2013).
The turbidity levels varied over time in all MFCs, although they exhibited distinct patterns, as shown in Figure 4(d). Initially, MFC-1 exhibited the highest turbidity. However, this changed rapidly as the solution became significantly clearer on day 20 of incubation. A significant sudden decrease in turbidity was observed in MFC-1 from 709 NTUs on day 4 to 326 NTUs by day 20. The addition of salt can affect the gelation behavior of methylcellulose, which then reduces turbidity. Similarly, MFC-2 showed a higher concentration of sewage water and exhibited a significant decrease in turbidity from 674 NTUs on day 2 to 450 NTUs by day 20. Conversely, the MFC with 50% sewage water exhibited a linear decrease in turbidity from day 4 until the end of the incubation period. In contrast, the control treatment displayed an irregular trend compared to higher concentration of sewage water, with turbidity peaking at 361 NTUs on the 2nd day and decreasing to 200 NTUs by the 20th day. Turbidity increased to 270 NTUs on the 12th day before gradually decreasing to 166 NTUs by the 20th day. Turbidity can be caused by suspended particulate matter in the sewage water. An abrupt increase in turbidity can result from these particles being discharged into the bulk solution owing to changes in the flow rate or mixing patterns. In some situations, microbes tend to flocculate, thereby increasing turbidity. However, they might scatter (deflocculate) under certain circumstances, resulting in a reduction in turbidity. This may be affected by variables such as pH, the presence of certain polymers, and ionic strength.
Bioelectrochemical activity and performance of MFCs
The performance of the MFCs was evaluated by measuring the OCV between the anode and cathode as biofilms formed on them. An increase in OCV was observed after the 4th day of substrate incubation. In particular, MFC-1 demonstrated a potential of approximately −800 mV on the 12th day of continuous operation, achieving a maximum power density of 42 mW/cm2. However, the performance of MFC-1 decreased after the 12th day of operation. Figure 5 shows the changes in the OCV and power density over time. The findings are consistent with previous studies, which reported OCV ranges of −200 to −800 mV for fuel cell setups (Logan, 2010). Higher concentrations of oxidized electron carriers in wastewater have been predicted to enhance bacterial oxidation. Anode fouling occurs because high organic concentrations contribute to power generation. Throughout the operation, the OCV fluctuated between −200 ± 5 mV and −800 ± 5 mV for approximately 20 days. Maximum open-OCV and power density in MFC-1 were recorded at approximately −800 ± 5 mV and 43 ± 0.5 mW/cm2, respectively. The decrease in voltage after the 12th day could be attributed to membrane fouling or restrictions in the cathodic solution. Similarly, MFC-2 exhibited an increase in OCV and peaked at −750 ± 5 mV and 28 ± 0.5 mW/cm2 on days 12 and 16, respectively. However, the MFC-3 and MFC-4 systems generated lower OCVs because of the restricted COD or reduced methanogen activity resulting from the use of 50% diluted sewage water. The bioelectrochemical activities and performances of the MFCs are shown in Figure 5(a), (c), and (e). The OCV (V) variations in the MFCs over time are discussed (see 1, 3, and 5). MFC-5 and MFC-6 exhibits declining trend, with the OCV ranging from −150 to −106 mV on day 20 and −102 to −100 mV in MFC-6, respectively. The maximum power densities were 3.5 mW/cm2 and 8 mW/cm2, respectively. The microbial populations in the MFCs increased after adaptation and use of more wastewater and field soil substrates. This enhanced biological activity promoted electron transport to the anode. It also increased the potential and OCV. The MFCs’ microbial populations presumably progressed to breaking down complex organic molecules in the sewage and paddy field soil. In addition, achieving both high power densities and low effluent COD concentrations in MFCs under batch flow conditions is highly challenging (Kim et al., 2015). As complex molecules break down, they become readily available in organic matter and improve electron transport to the anode. Furthermore, they increase the OCV and power generation. Because MFC microorganisms actively utilized the substrates, they are likely to have developed a dense biofilm on the anode. An efficient electrochemical active layer and the biofilm transferred electrons from the bacteria to the anode material upon increasing the OCV and power density. Figure 5(b), (d), and (f) illustrate the power density (P) variations in the MFCs (see 2, 4, and 6) over time.
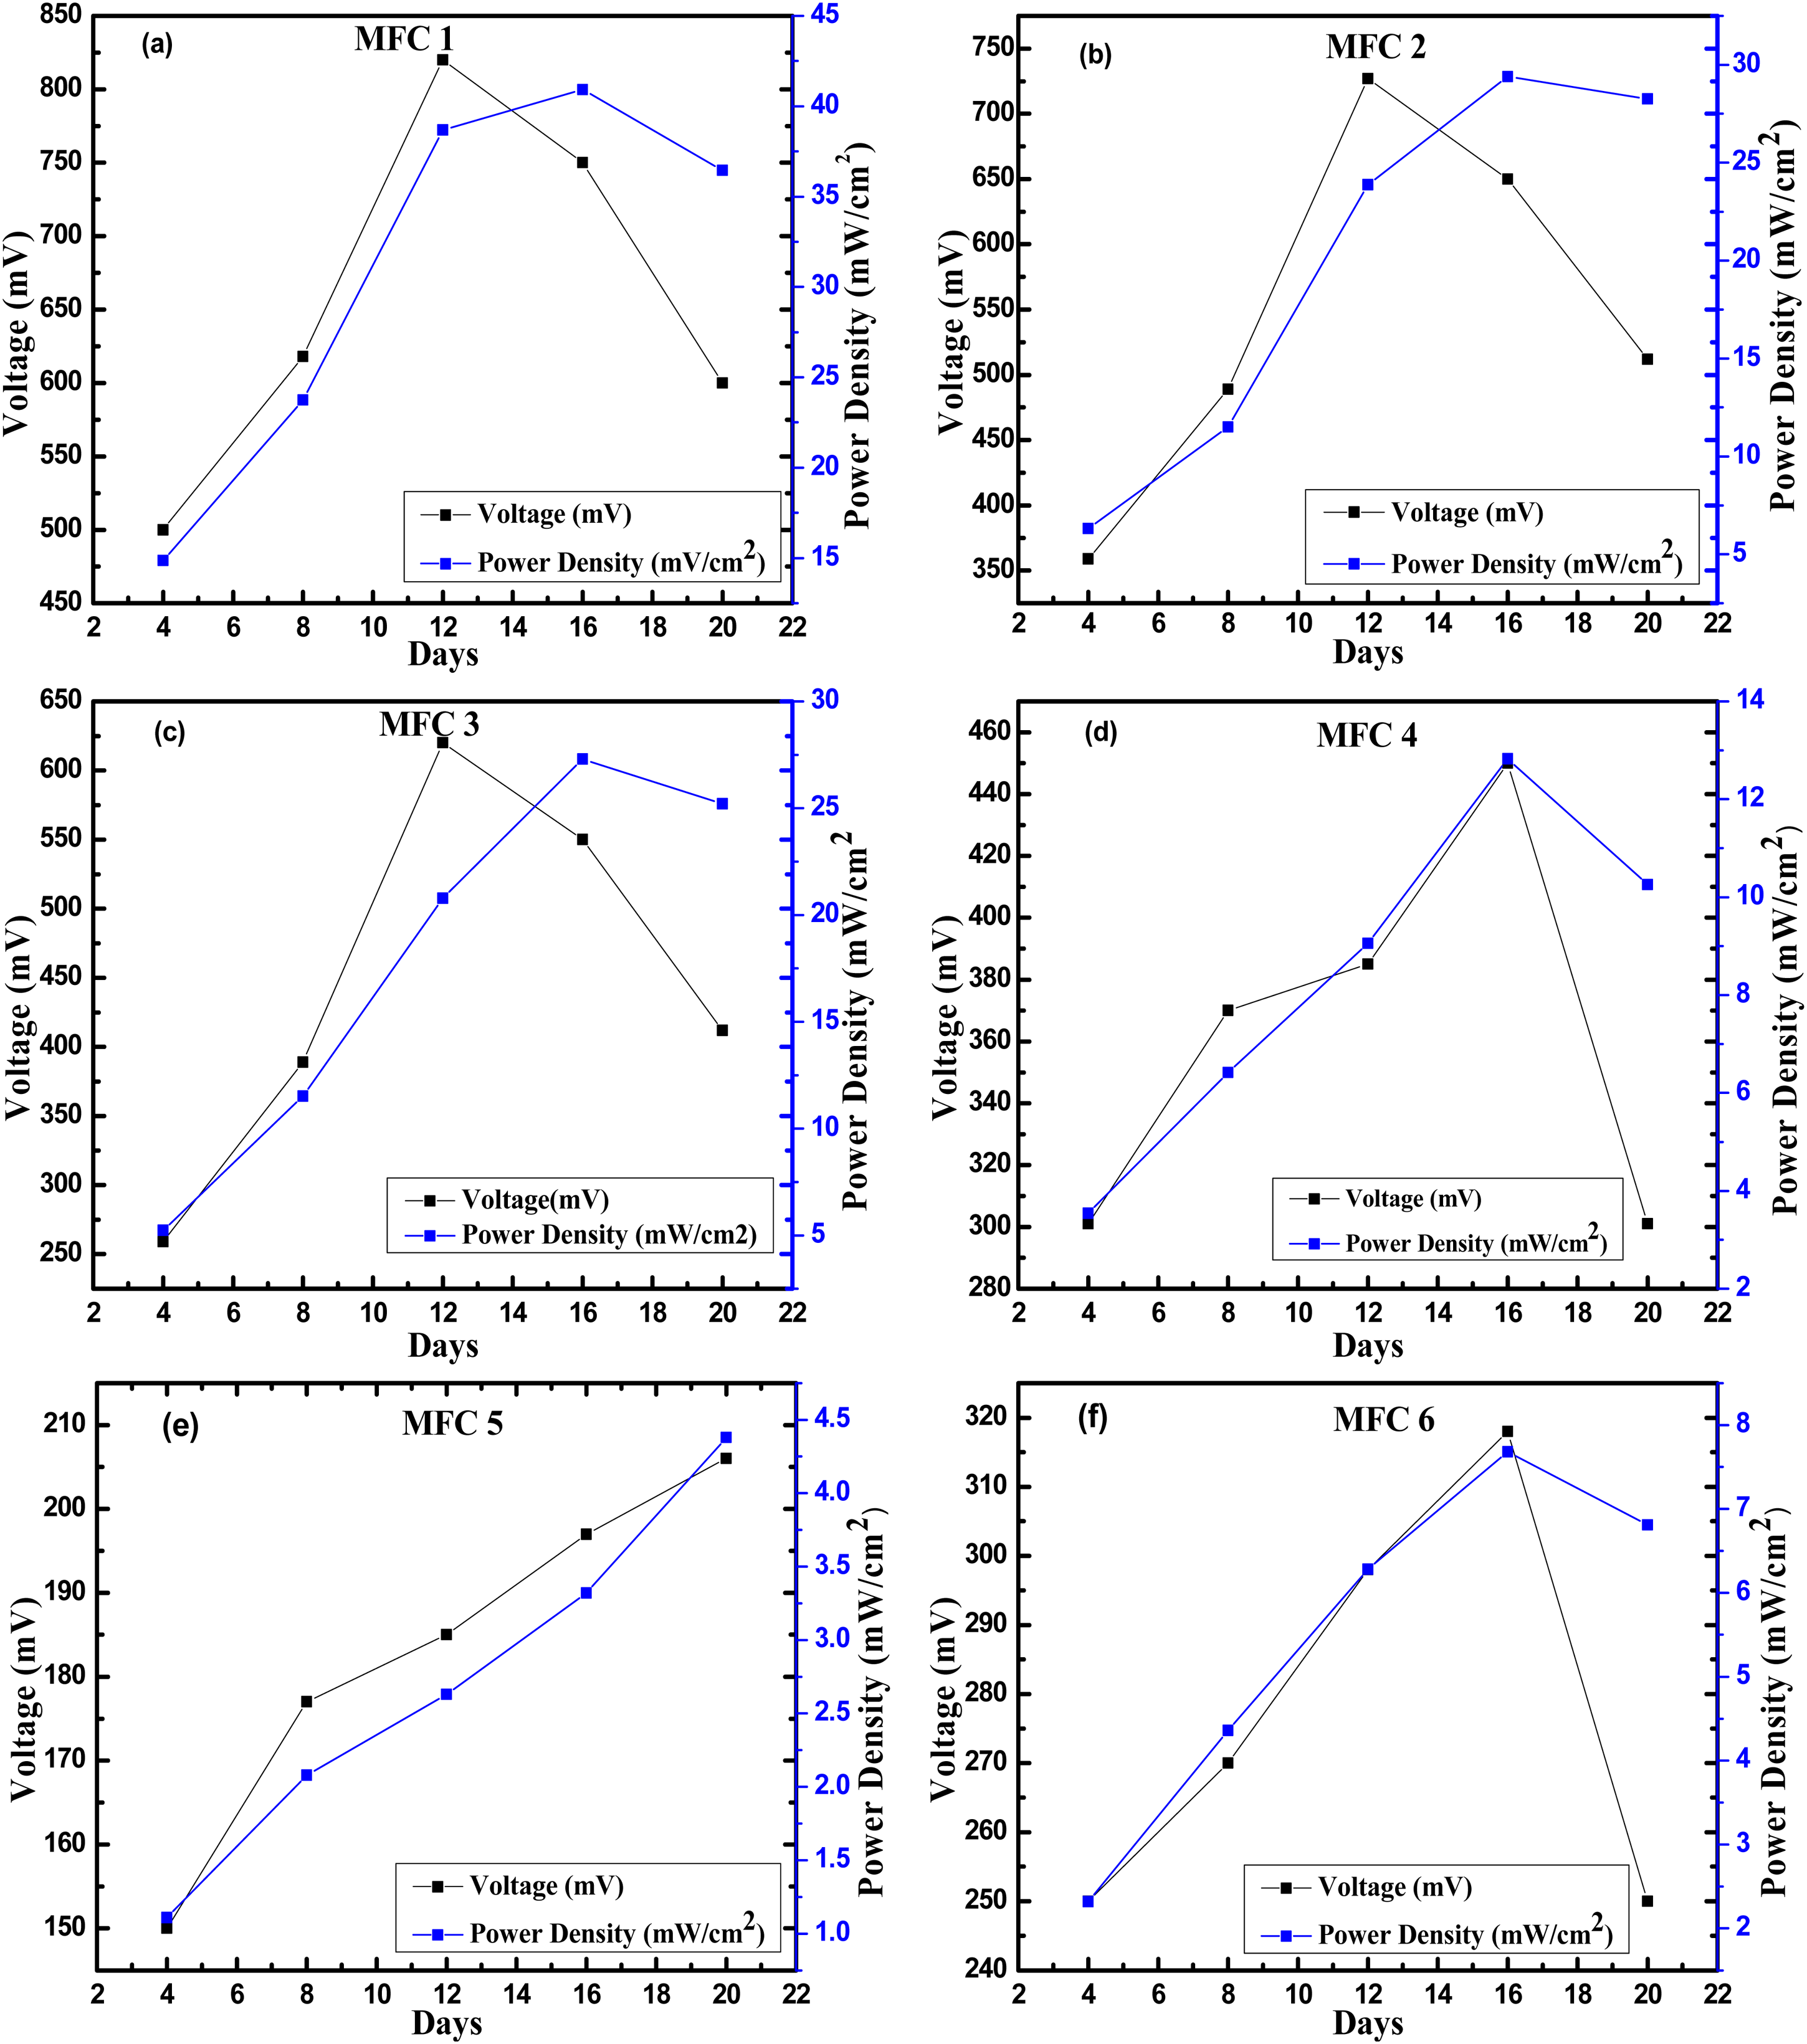
Bioelectrochemical activity and performance analysis of MFCs: (a, c, and e) Open circuit voltage (V) variations in MFCs (see 1, 3, and 5) over time and (b, d, and f) power density (P) variations in MFCs (see 2, 4, and 6) over time.
Figure 6 shows that all MFC setups utilizing sewage water generated more current than the control setups using distilled water. During substrate decomposition, electron flow through the circuit was notably faster in MFC-1 (current of 0.18 ± 0.02 mA) and MFC-2 (current of 0.13 ± 0.02 mA) than in the MFC-3 and MFC-4 setups. However, it utilized 50% concentrated sewage water as a substrate (current of 0.13 and 0.12 ± 0.02 mA, respectively) on the 12th day of the experiment. The lowest current was recorded in the MFC-5 and MFC-6 setups, with the values of 0.05 and 0.06 mA, respectively. This could be attributed to the absence of electrogenic bacteria. Therefore, distilled and tap water were used as controls for both setups. This suggests that the sewage water provided a more conducive environment for the microbial culture, which was responsible for current generation. Interestingly, the MFC setups with higher sewage water concentrations (MFC-1 and MFC-2) generated slightly more current than those with lower concentrations (MFC-3 and MFC-4). This implies a potential positive effect of sewage water concentration on current generation.
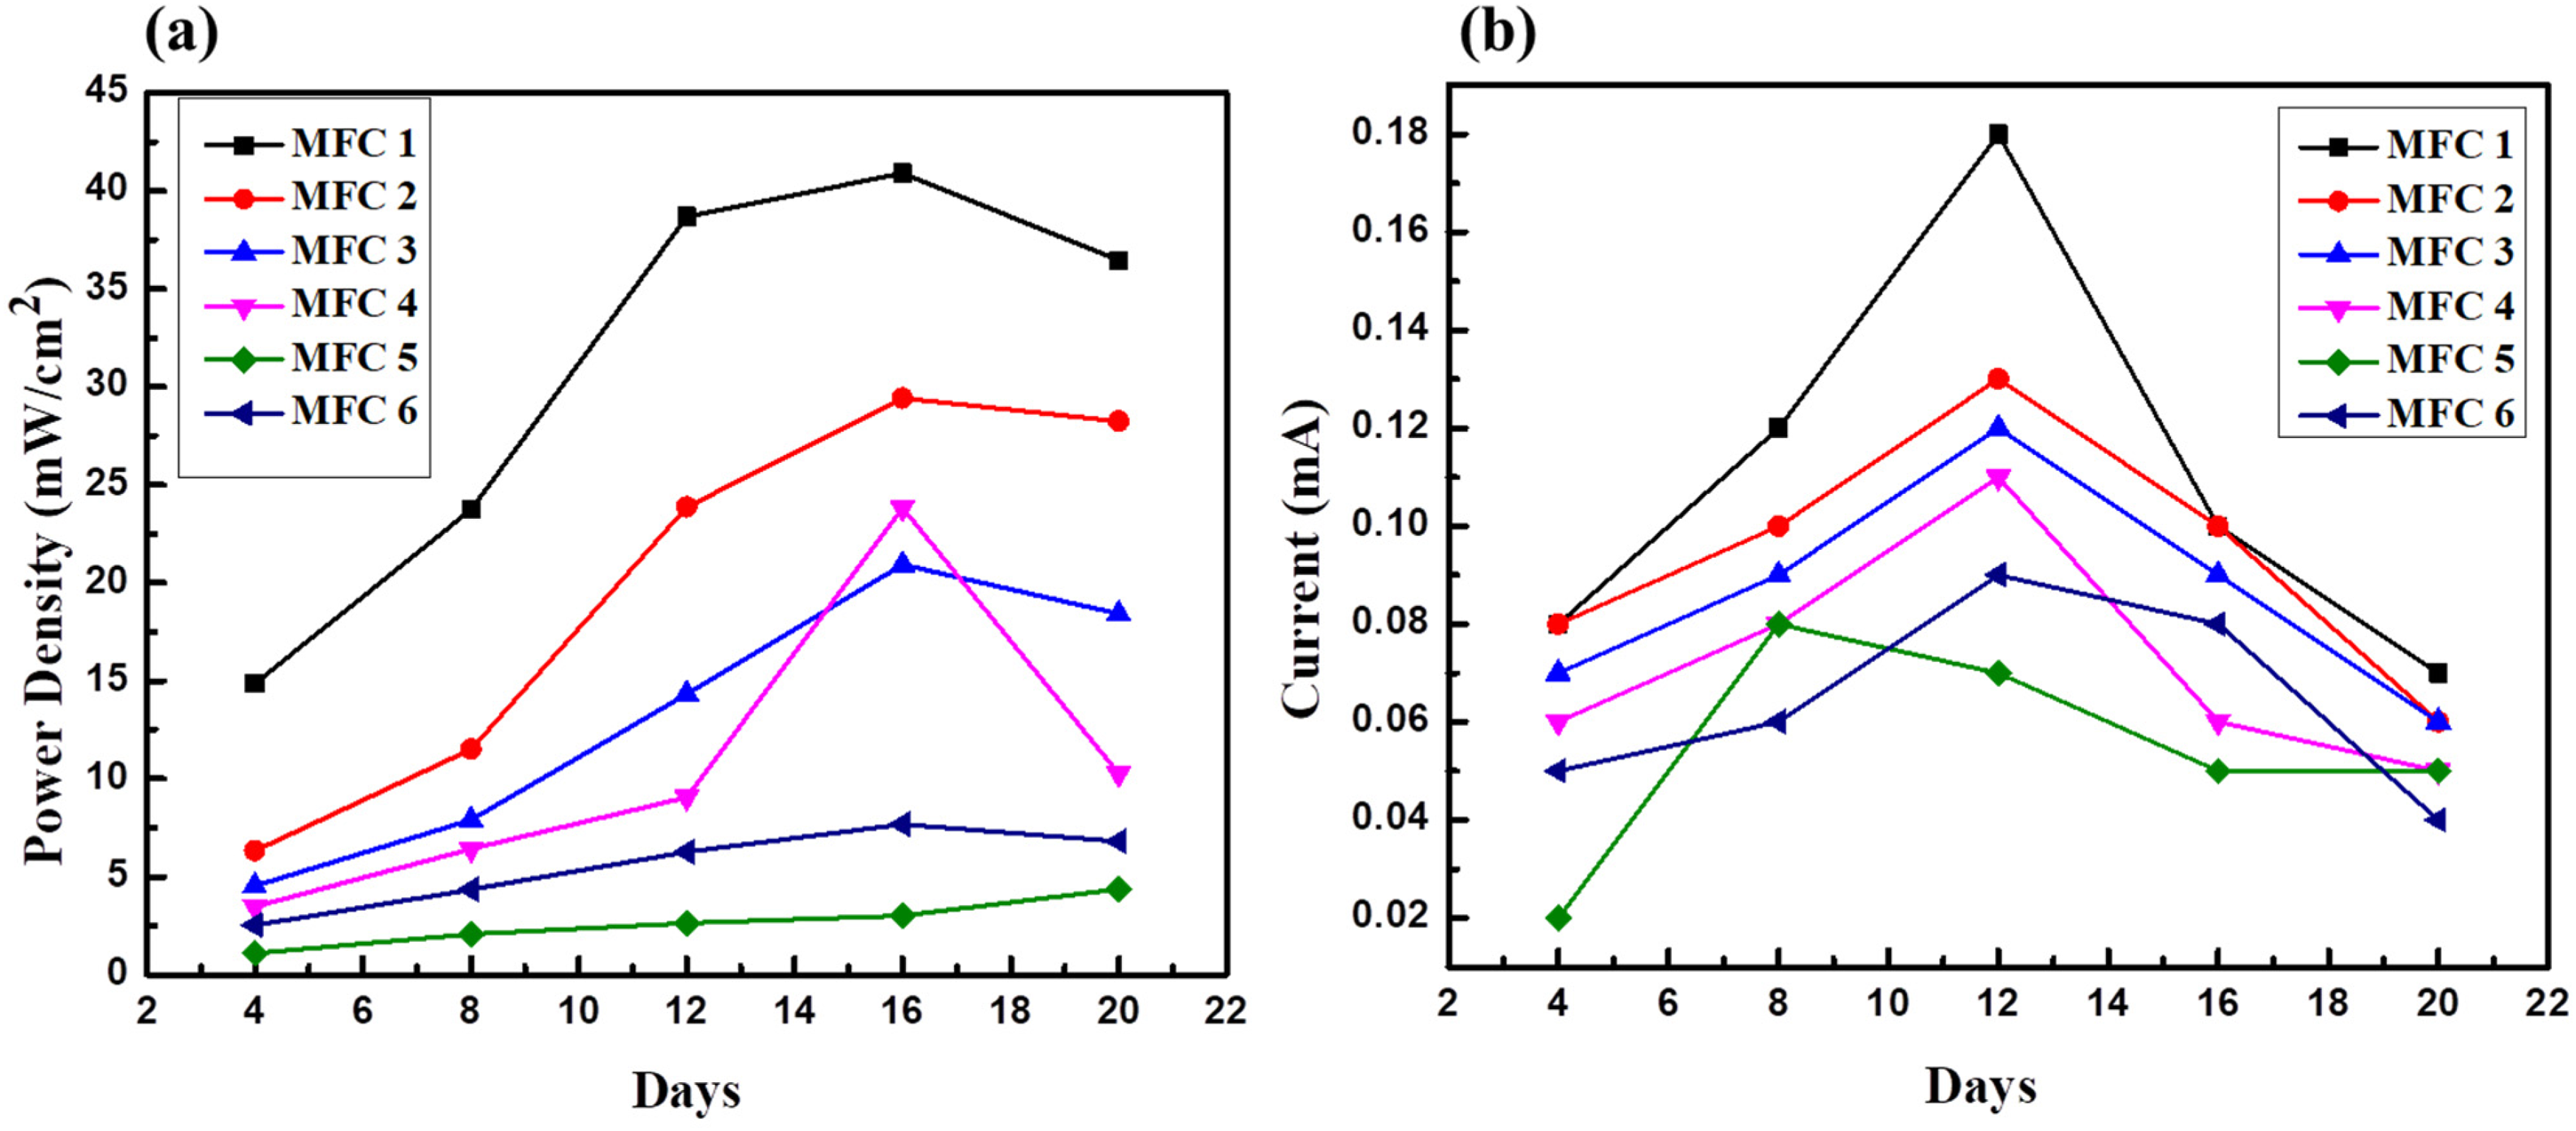
MFC setups utilizing sewage water, which generates more current compared to control setups: (a) Power density variations in MFCs over time and (b) current variations over time.
During the processes in MFC-1 and MFC-2, the highest power densities relative to the electrode area were approximately 42 ± 0.5 mW/cm² and 27 ± 0.5 mW/cm², respectively. The varied organic content of the sewage water supports the presence of numerous microbial populations. In particular, electrogenic bacteria can transmit electrons from the decomposition of a substrate to the MFC anode and increase the current flow. Notably, the power density decreased by approximately 17 ± 0.5 mW/cm² and 9 ± 0.5 mW/cm² when the substrate composition was changed from 100% to 50% concentrated sewage water in MFC-3 and MFC-4. In our experiment, the control treatments in MFC-5 and MFC-6 exhibited the most significant decrease in power density, ranging from 2.5 to 6 mW/cm². The control setups utilizing distilled or tap water showed little microbial activity because of the lack of organic debris. Thus, fewer electrons could be transferred to the anode, resulting in a far lower current than that in sewage water systems. It is possible that bacterial activity decreased because of the low COD content in the influent. Relatively low amounts of intermediate products occurred in the anodic chamber of the cell. The findings suggested that substrates with higher concentrations of sewage water yielded higher power densities than those with lower concentrations over the operation period, as concluded by other researchers. However, it's evident from Figure 6(a) that the power densities were not sustained and began to decline. This discrepancy may have arisen from ohmic losses resulting from the electrolyte resistance of the wastewater, membrane resistance, and bacterial activities (Faria et al., 2017). The absence of initial power densities may indicate that activation losses are the cause of this phenomenon. The substrate concentration appeared to have a beneficial effect on the power generation capacity of the system. The study suggested that selecting a substrate with high organic and nutrient contents could further enhance power generation. Figure 6(b) displays the current variation over time.
Wastewater removal efficiency
MFCs are effective in degrading organic materials by reducing COD. Within 20 days, the highest COD removal efficiency was approximately 75.6% in MFC-1, as shown in Figure 7(a). The COD removal rate increased until the 16th day in all MFC setups with concentrated (MFC-1 and MFC-2) and diluted (MFC-3 and MFC-4) sewage water treatments but subsequently decreased. The decrease in bacterial growth after the 16th day was caused by the low concentration of COD substrates in all wastewater MFC setups. This resulted in the initiation of the death phase in the bacteria (Rolfe et al., 2012). Hence, distilled and tap water were used instead of MFC-5 and MFC-6 in these experiments. The COD reductions achieved in this study are in line with those in previous research on MFCs (Elakkiya and Matheswaran, 2013; Mohan et al., 2010). The highest COD elimination achieved by the MFCs was 745.6%, which is consistent with the range of 55–95% obtained and discussed in prior MFC investigations (Faria et al., 2017).
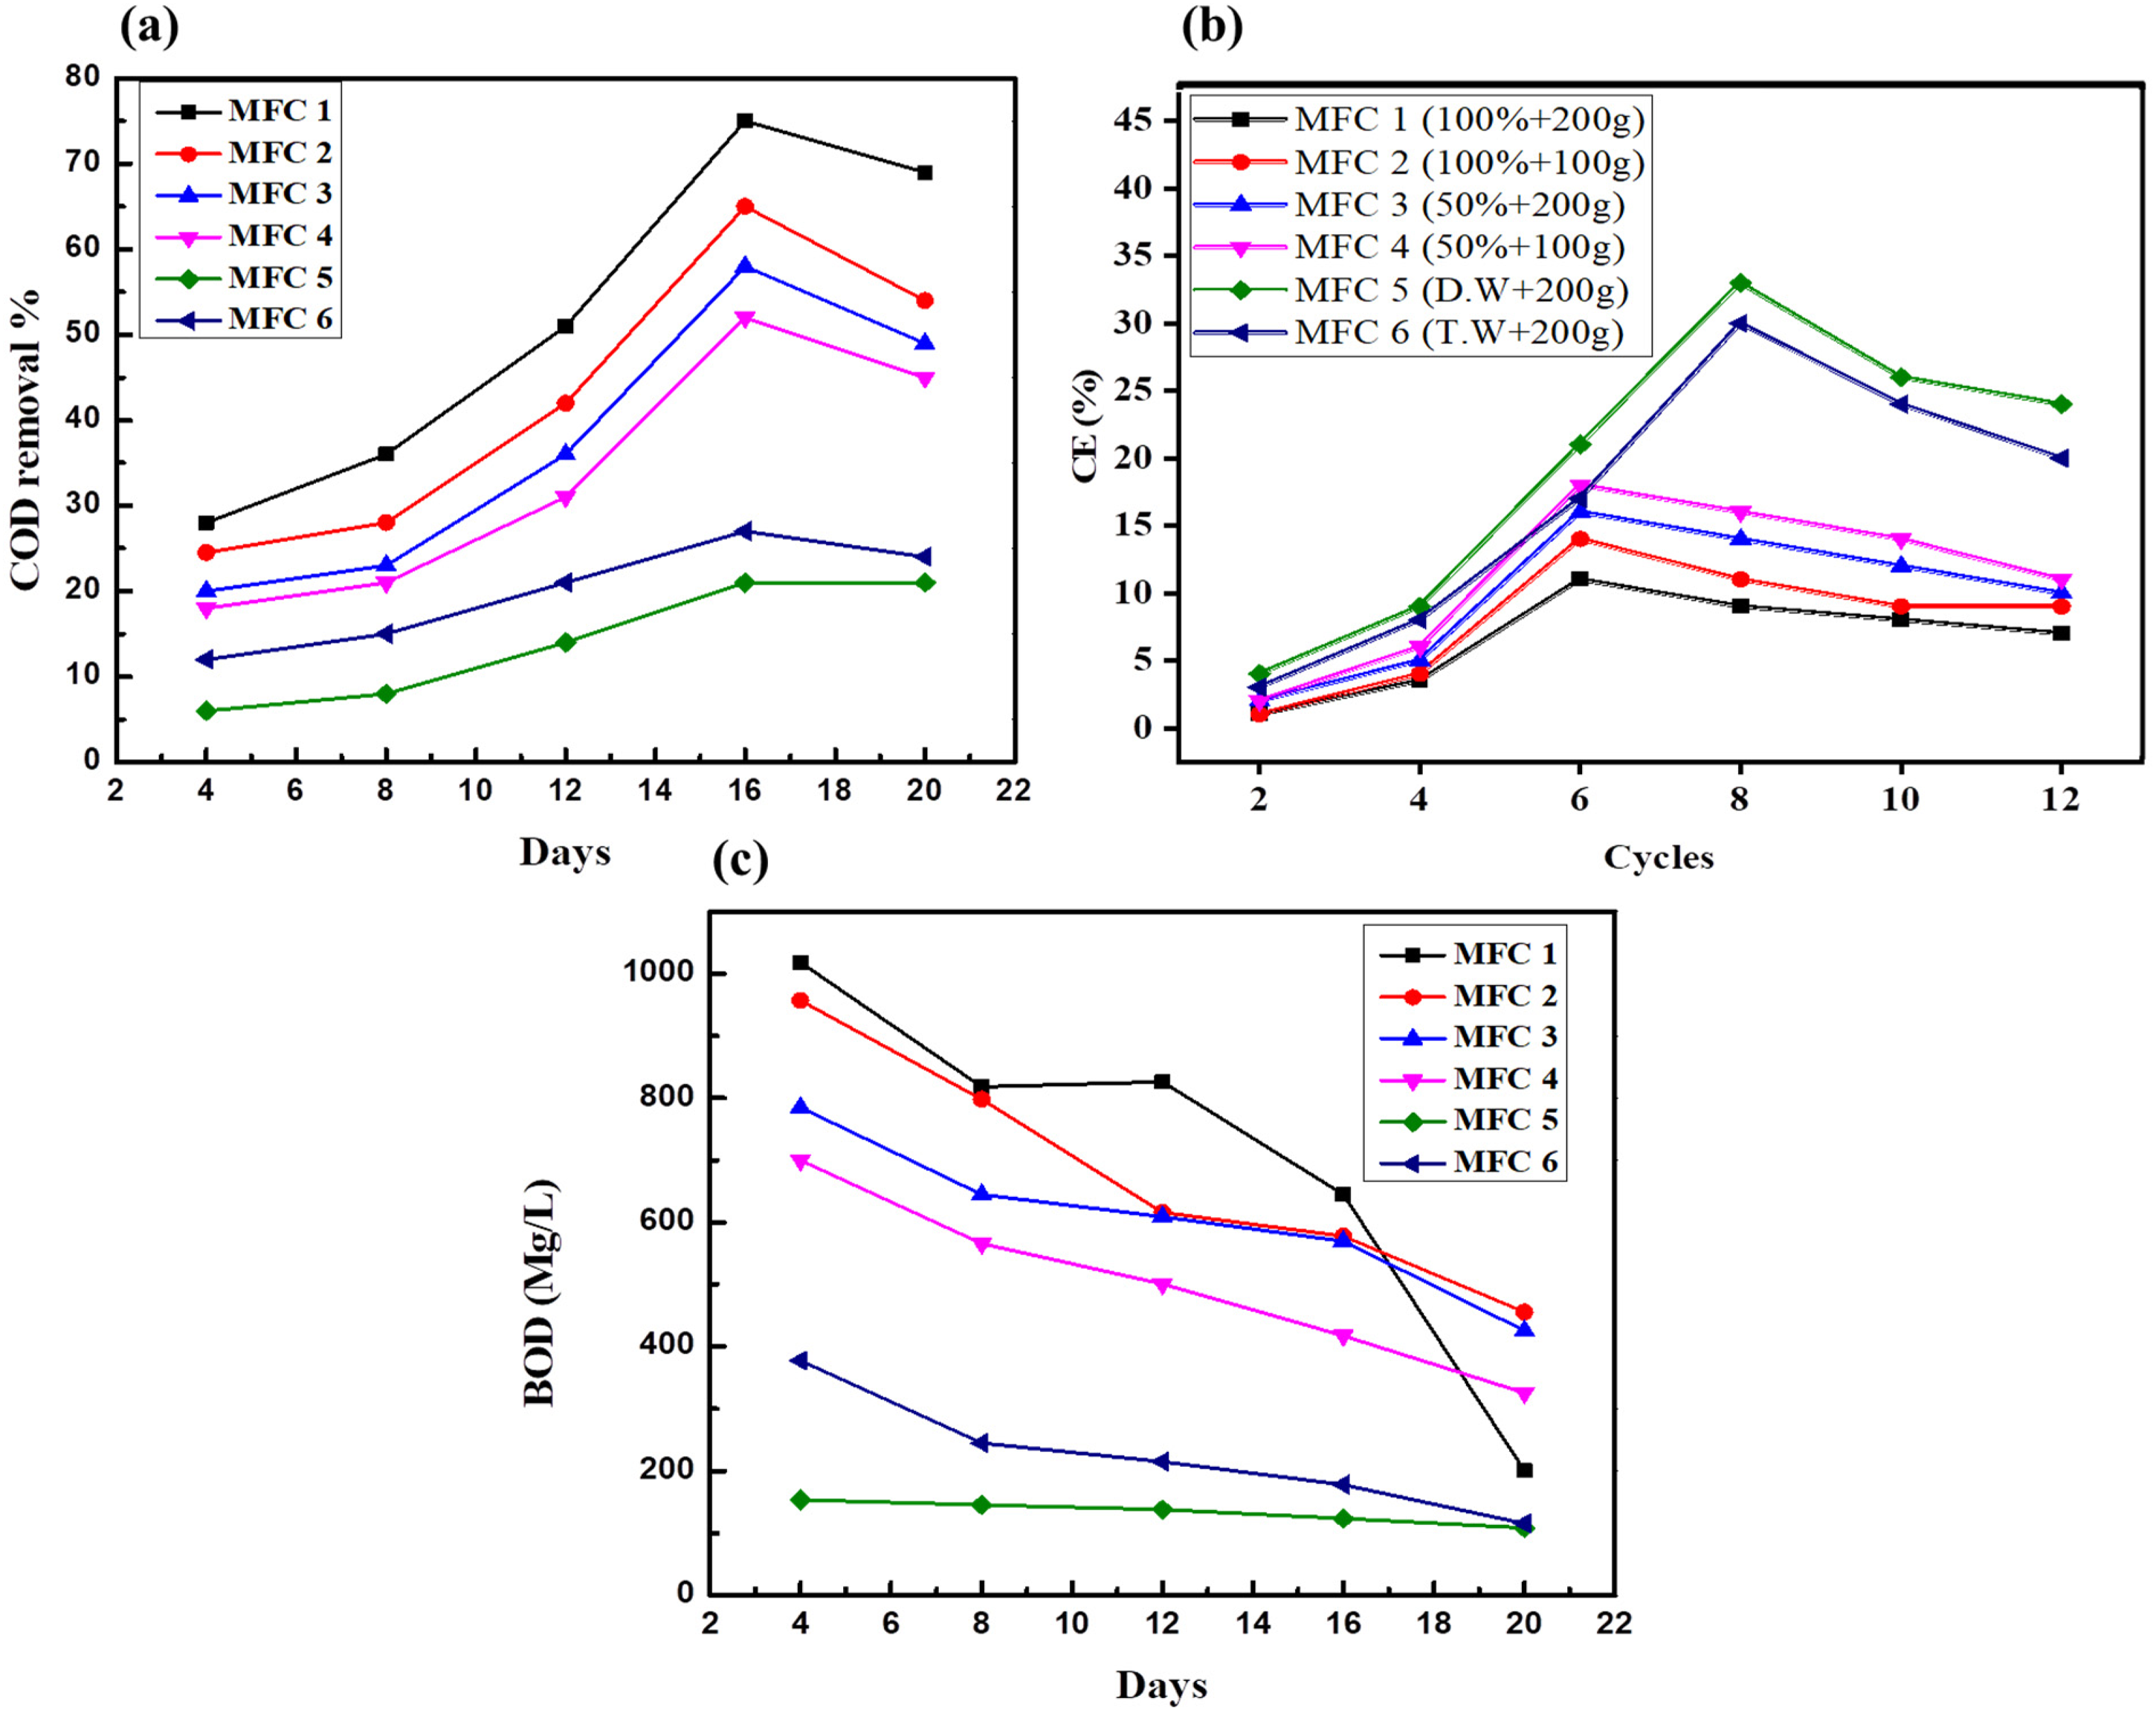
Wastewater removal efficiency analysis: (a) COD removal by MFCs, (b) CE of MFCs as a function of COD removal, and (c) BOD of MFC.
CE is used to explain the conversion of COD into electrons for biogas production. Substrate concentration affected the correlation between COD elimination and CE. Similarly, MFC-5 had the highest CE of 33.5%, followed by MFC-6, which had a CE of 27.2%, as shown in Figure 7(b). The high CE in MFC-6 and MFC-5 was attributed to fluctuations in the substrate concentration. In contrast, the lower COD removal in MFC-5 and MFC-6 led to a greater CE, indicating an inverse correlation between COD removal and CE. These results align with those of previous studies, which indicated that a higher CE occurred at low substrate concentrations. An increased abundance of organic substrates at the commencement of the process resulted in a lower CE in all MFCs with different concentrations of wastewater. This reduction is attributed to the enhanced decomposition of organic waste by a diverse community of bacteria. While specific bacterial species were not identified in this study, it is likely that a variety of methanogen bacteria, which are commonly found in paddy filed, played a significant role. These bacteria are known for their ability to break down complex organic compounds into simpler molecules, thereby influencing the overall efficiency of the MFCs. The most effective treatment for domestic wastewater was achieved by the MFCs with sewage water obtained from a domestic wastewater facility and mixed with paddy field soil. Therefore, this investigation emphasizes the importance of selecting an inoculum (source of methanogen bacteria). In this study, we used paddy field soil because it is a rich source of methanogen bacteria as our one of the main objective was to determine the efficacy of different feed composition of paddy filed soil and sewage for methane production. The CE values in this study were similar to those found in prior research, indicating that MFCs are suitable for effective wastewater treatment and have potential for reuse in applications such as agricultural irrigation, especially in water-scarce regions such as the Mediterranean area. MFCs can produce sufficient electricity for low-energy applications, such as real-time environmental monitoring.
The quantity of dissolved oxygen used by microorganisms during the aerobic biological degradation of organic matter is represented by the biochemical oxygen demand (BOD) in a water sample. Nutrient concentration, temperature, and the availability of microbial enzymes all affect BOD. BOD is measured as the amount of oxygen required for all organic compounds to be completely oxidized into carbon dioxide and water through respiration, microbial growth, and cell death. The initial BOD values of the six MFC setups were 1018 mg/L, 917 mg/L, 778 mg/L, 680 mg/L, 108 mg/L, and 387 mg/L for MFC-1 to MFC-6, respectively (Figure 7(c)). The highest BOD was observed in the 100% concentrated MFC-1 wastewater. Furthermore, all the MFCs showed a decreasing trend over time. The lowest BOD value was observed in the MFC-5 configuration with 200 g of distilled water in the paddy field soil. Evidently, the MFCs used BOD to generate energy from the organic matter in the wastewater using the metabolic activity of bacteria and the subsequent movement of electrons in an external circuit. This indicates the rate at which the organic matter in the wastewater was oxidized and became available for microbial growth. This method is ecologically friendly, sustainable, and advantageous because it treats wastewater and produces electricity.
Biogas production
The amount of biogas produced by anaerobic digestion of the substrates was measured using a gas collection bottle from individual MFC setups; as shown in Figure 8. The potential for methanogen growth to directly absorb electrons from the electrode influences the quantity and properties of biogas generated. During the initial 4 days of biogas generation across all MFC setups, a lag phase occurred in the methanogen cultures. During this phase, methanogens likely underwent metamorphic development. Furthermore, they consumed the methane substrates produced from the initial activity, which might indicate adaptation of the inoculum to a new environment (Malayil et al.; Nakayama et al., 2019). All treatments exhibited a significant increasing trend in biogas production over time. MFC-1 and MFC-2 produced larger volumes of gas at higher sewage water concentrations, measured at 245 and 210 cm³, respectively, and attributed to the presence of larger organic substrates in the 100% concentrated sewage water. Similarly, the biogas volume increased in MFC-3 and MFC-4, which utilized 50% concentrated sewage water at volumes of 175 and 160 cm³, respectively. In contrast, the control group exhibited a slightly different trend. MFC-5 (D.W + 200 g) experienced a slight increase in gas volume from days 4 to 20, ranging from 10 to 110 cm³. Similar trends have been observed in previous studies, which highlighted the use of cosubstrates to increase biogas yields in anaerobic MFCs owing to positive synergism in the substrate medium. Another possible reason for the lack of nutrients is increased methanogen activity (Callaghan et al., 2002; Rozendal et al., 2008).
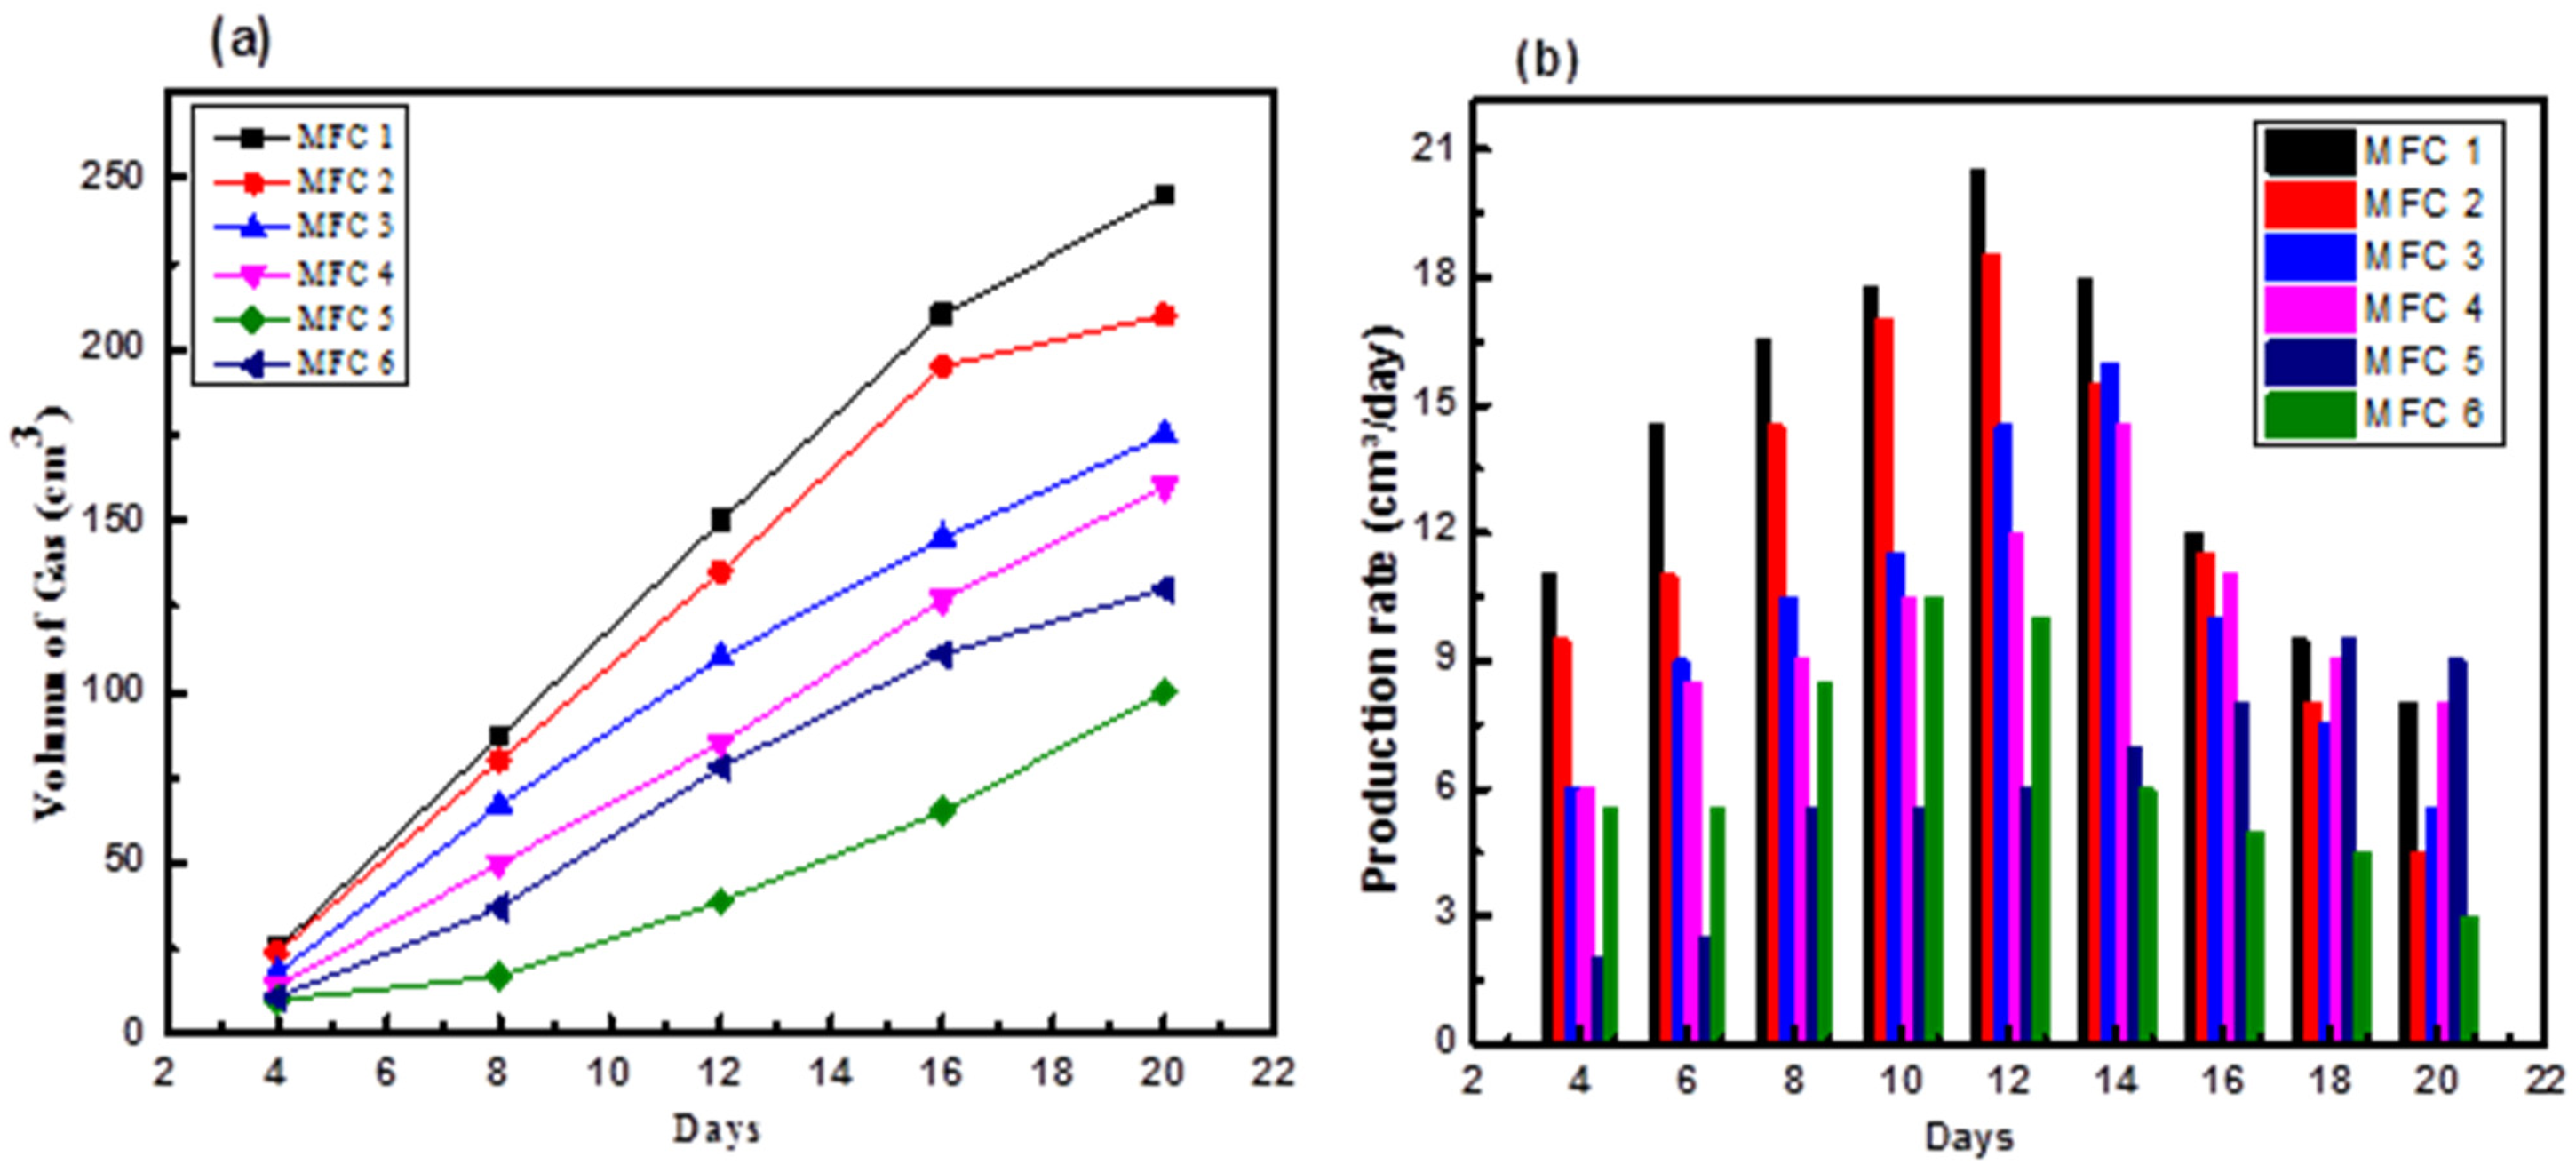
Biogas production rate for MFCs over time (a) volume of gas (b) production rate.
The production rate exhibited an initial slow start, followed by a subsequent increase over time for all MFCs. The gas production rate was the highest for MFC-1 and MFC-2. The rate of biogas production in MFC-1 increased to 20.5 cm3/day by the 12th day, while that in MFC-2 reached 18.5 cm3/day. In MFC-3 and MFC-4, the highest biogas production was achieved on day 14th, which was 16 and 14.5 cm3/day, respectively (Figure 8(b)). However, contrasting results were obtained for MFC-5, which showed the highest production rate of 9.5 cm3/day on day 18th. For MFC-6, the maximum 10.5 cm3/day biogas production was achieved on day 10th of the setup. The biogas production rates showed significant differences. Subsequently, the rate of biogas production decreased because of the reduced substrate concentration. This reduction led to a decreased electron availability and carbon content, which hindered the conversion of CO2 into biogas. Meanwhile, the rate of biogas production in MFCs is determined by several factors, including the efficiency of the MFC system, organic substrates, CE, and COD removal efficiency (Mansoorian et al., 2013). Figure 8(a) shows the production of the gas volume over time.
Conclusions
In this study, the anodic camber in MFCs is comprised a blend of sewage water, distilled water and tap water with the addition of paddy field soil. Biogas was produced at the cathode through the reduction of electrons, hydrogen ions (H+) and carbon dioxide (CO2). This was facilitated by a methanogen culture derived from paddy field soil that acted as a catalyst. In this experiment, the designed MFC reached a potential of −800 mV which was a significant value. Optimization of the COD removal revealed a direct correlation between both biogas volume and power density and HRT. Among the various MFC configuration testation, MFC-1 outperformed the others in terms of biogas volume, electric current, OCV, current density and power density. This superiority was particularly evident when compared to configurations using only sewage water or control setups. The COD and BOD removal efficiencies were similar to those of MFC-1, consistently demonstrating the highest removal efficiencies. This underscores the effectiveness of MFC-1 in wastewater treatment. MFCs capitalize on BOD to generate electricity by harnessing the metabolic activity of microorganisms. By leveraging the catabolic abilities of microbes to break down organic matter such as wastewater, MFCs release electrons that are then transported to an external circuit. Finally, electricity is generated through this process.
Future recommendation
This technology is efficient, advantageous, and simple. Furthermore, they can be widely applied for large-scale electricity generation. This study makes the following recommendations for future research.
Footnotes
Author's note
Zeshan Abbas is also affilited with Faculty of Intelligent Manufacturing Engineering, Guizhou Industry Polytechnic College, Guiyang, China and Ali Ahmad is also affiliated with School of Mechanical Engineering, Shandong University of Technology, Zibo, China.
Acknowledgments
We thank the higher-education commission of Pakistan (HEC) for the National Research Program for Universities (NRPU) Project No. (14840). All the authors are thankful to the United Arab Emirates University, Al-Ain, UAE, for their support.
Author contributions
Zeshan Abbas: writing—review and editing, conceptualization, formal analysis, and supervision; Hafiza Yousra Bibi: methodology, investigation, and writing—original draft; Usman Khalid: data curation and investigation; Saad Saleem Khan: project administration, funding acquisition, and investigation; Stephen Larkin: project administration and funding acquisition; Ali Ahmad and Muther Mansoor Qaisrani: data curation and investigation; Hussain Shareef: supervision, review and editing, and investigation; Naeem Akhtar Qaisrani: supervision, review and editing, and investigation.
Declaration of conflicting interests
The authors declared no potential conflicts of interest with respect to the research, authorship, and/or publication of this article.
Ethical approval
This article foe not contains studies with human or animal participants.
Funding
The authors disclosed receipt of the following financial support for the research authorship, and/or publication of this article. This work was supported by the Fund of Africa New Energies Limited, United Kingdom (Grant No. ANE0053).