
Abstract
The bio-electron-Fenton system integrates microbial fuel cell and Fenton process into a single system to destroy the organic and bio-refractory contaminants in wastewater. Its performance is closely dependent on the sufficient electron supplement by the oxidation process in anode chamber and the reduction process in cathode chamber. This article presents a novel cathode of a bio-electron-Fenton system which can simultaneously achieve good electron supplement and the wastewater treatment in cathode chamber. The cathode consists of indium-tin-oxide conductive glass on which layers of graphene-poly(vinyl alcohol) composite are sprayed by electrospinning. The material characterization is verified by Fourier transform infrared spectroscopy, scanning electron microscopy, and transmission electron microscopy. The voltage, current, and power density of the system are verified by cyclic voltammetry. The wastewater treatment is verified by dye decolorization. With the addition ratio of 4 wt% graphene, the system achieves the optimal power density of 74.1 mW/m2, open-circuit voltage of 0.42 V, and the decolorization of reactive black 5 of 60.25%. By constant-resistance discharge testing within three-cycle, the system can stably supply a maximum voltage of 0.41 V or above. Hence, the proposed electrospun graphene-poly(vinyl alcohol) composite cathode electrode can not only improve the power-supply efficiency but also enhance the efficiency of wastewater treatment.
Introduction
A microbial fuel cell (MFC) operates on the following principle: When organic substances are decomposed by the bacteria in an anolyte, hydrogen ions and electrons form, which are then transferred to the cathode of the MFC system for use in the reduction reaction, 1,2 as shown in Figure 1. 3 The hydrogen ions reach the cathode chamber through the proton exchange membrane, while the electrons move via the external circuit. Apart from electricity generation, the cathode chamber can also simultaneously degrade wastewater during the cell reaction.
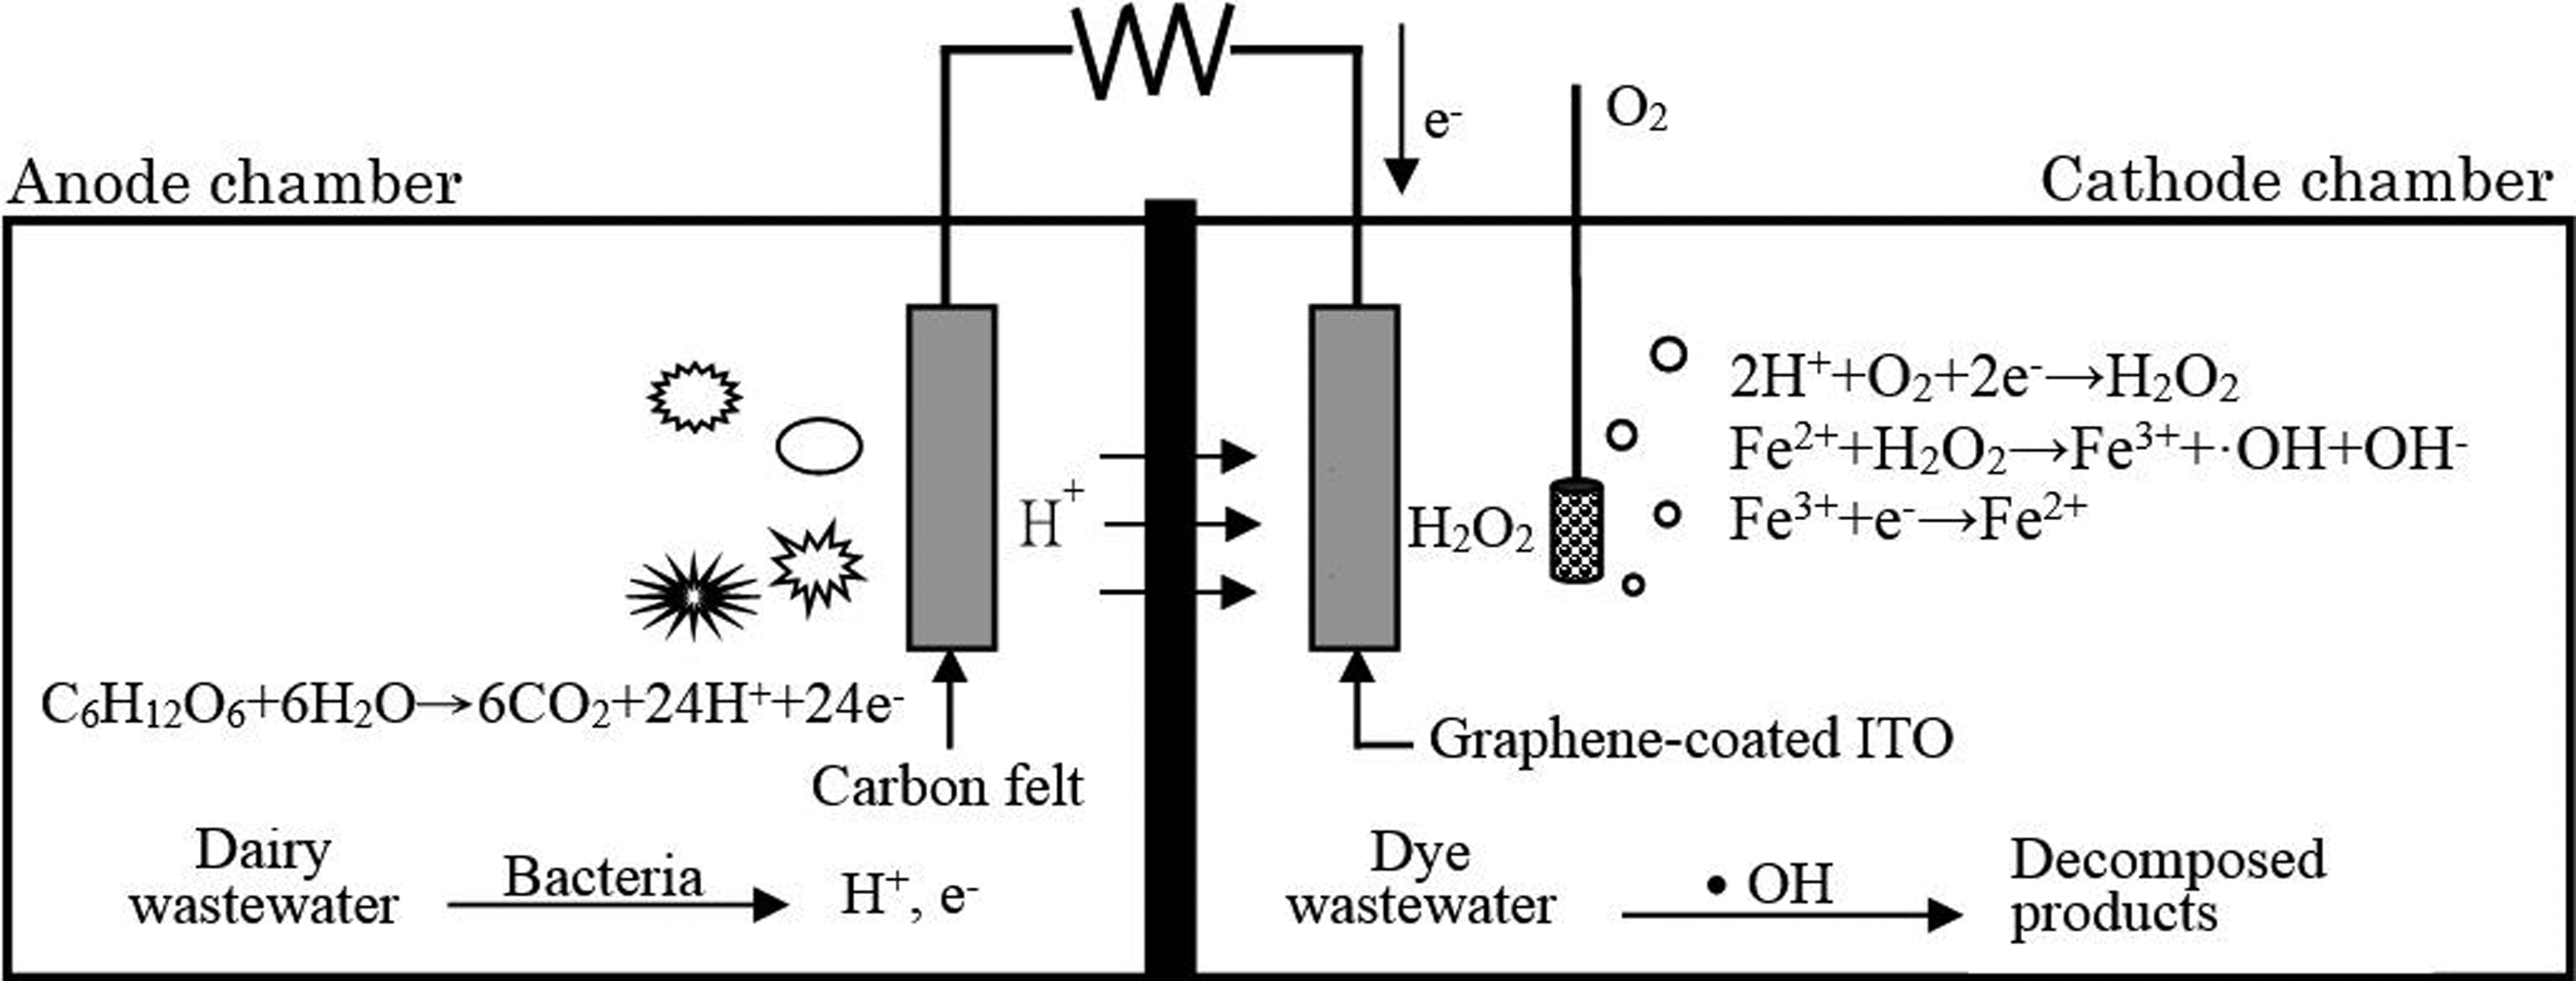
Diagram of the MFC. MFC: microbial fuel cell.
An electro-Fenton (EF) system is capable of initiating an electrochemical Fenton reaction in an acidic environment. It involves continuous electro-generation of H2O2 at the cathode supplied with O2, using an iron catalyst to produce hydroxyl radicals (·OH) by Fenton reaction. Note that the continuous electro-generation of H2O2 requires an external electric source. 4 During the EF reaction, the oxygen gas present in the electrolyte is reduced electrochemically, generating H2O2 in the cathode. When an iron source is added to the Fenton reaction medium (the Fenton’s reagent), Fe3+ reduces to Fe2+, and Fenton reaction occurs between Fe2+ and H2O2 to produce ·OH. As long as oxygen gas and iron sources are available in the system, the Fenton reaction will proceed.
During the entire bio-electro-Fenton MFC (BEFMFC) reaction process, electrons and hydrogen ions required for producing H2O2 are provided by the MFC; thus, no external electric source is required in BEFMFC. The product, ·OH, of the Fenton reaction in the cathode chamber can be used to degrade wastewater. 5 Specifically, anode bacteria decompose organic substances to generate hydrogen ions and electrons (as indicated by formula (1)). The hydrogen ions and electrons react with oxygen gas to generate hydrogen peroxide in the cathode chamber (as indicated by formula (2)). The hydrogen peroxide reacts with ferrous ions to generate ferric ions, hydroxyls, and hydroxyl radicals. The reaction products can be used as metal ions or for dye degradation (as indicated by formula (3)); subsequently, ferric ions conjugate with electrons to generate ferrous ions (as indicated by formula (4)). The reactions indicated by formulas (2) and (3) occur repeatedly, generating a self-sustaining morphology. 6


Electrode materials with the following requirements are suitable for BEFMFC: 7 –10 good conductivity, good corrosion resistance, high specific surface area and porosity, hydrophilicity of the electrode/electrolyte interface, and high surface roughness. Apart from the aforesaid physical and chemical properties, the anode electrode should also have an affinity for microbial strains. 7 –10 Regardless of the site environment, the cathode plate should be able to conjugate with an appropriate catalyst, so as to improve system performance.
Graphene is a good electrode material due to its superior electrical conductivity and high electrochemical stability. Additionally, it can be three-dimensionally textured; thus, it can provide a favorable specific surface area for fabricating a composite with other materials and it can be also used as a catalyst for biochemical reactions. The favorable specific surface area of graphene can also enhance the absorption of hydrogen ions in a fuel cell system by the mass transfer effect. 11 Reduced graphene oxide (r-GO), a kind of graphene, can eliminate most functional groups (including surface epoxy groups C = O; hydroxyl groups, C–OH; and carbonyl groups, C–O), and improve electrical conductivity and hydrophilicity. Therefore, the authors used r-GO as the graphene material in this work because it is suitable for use as an electrode catalyst and for making composite with other materials.
Electrospinning is a method to produce fibers. It uses electric force to spray charged polymer solutions as fibers of diameters in the order of several tens to hundred nanometers. Furthermore, it can be used to produce micro-porous fibers with a high specific surface area as well as a catalytic composite nanofiber by either adding a catalyst into the electrospinning solution or by externally mixing the solution with a catalyst. 12 The cathode plate of the BEFMFC used in the present study is made of indium-tin-oxide (ITO) conductive glass on which layers of the graphene-poly(vinyl alcohol) (PVA) and r-GO composite are sprayed by electrospinning. The electrospinning solution comprises an aqueous solution of PVA, r-GO, and sodium dodecyl sulfate (SDS). SDS is used as a surfactant that prevents the reunion of r-GO. Several different solutions with different weight percentages of r-GO (0, 2, 4, 6, and 8 wt%) are prepared. This article is the first to report the application of electrospinning technology on the bio-electro-Fenton system. Additionally, this study investigates the overall electricity production efficiency of the BEFMFC system and the effect of wastewater decolorization on the azo dyes in cathode chamber.
Materials and methods
Materials
We used PVA (Mw: 85,000–124,000; purity: 99%; Sigma-Aldrich Ltd., St. Louis, Missouri, USA) as the polymer material, with SDS (Sigma-Aldrich Ltd.) as the active agent of the electrospinning solution and r-GO (Yancheng Zengcai Technology Co., Ltd., Jiangsu Province, China) as a composite additive for electrospinning. The particle size of the r-GO powder was 2–5 μm. The r-GO powder was prepared by grinding a commercially available 10-layered r-GO texture sheet with the particle size of about 25 μm. The 10-layered r-GO texture sheet was manufactured by sintering polyimide sheets at 3000°C in a vacuum environment for 10 h. The ITO-coated conductive film glass (Anatech Co., Ltd., Taipei, Taiwan) was used as the substrate of the cathode electrode.
A dual-chamber batch-type MFC system was used. The anode chamber accommodated the dairy wastewater (mixed bacteria; Mao-Shu Jhong, No. 16 of Lane 90, Sin-Cheng Road 1, Suao Town, Ilan, Taiwan; local laboratory). Specifically, different dairy products (including yogurt, milk, and lactic acid bacteria) were mixed and cultured in an anaerobic environment for 6 months prior to using then as the electrogenic bacteria of the anode; the cathode chamber accommodated the electrolyte solution, which was made by mixing FeSO4·7H2O (Nihon Shiyaku Industries Ltd., Japan) and distilled water, and was used as the iron source required for the EF reaction. The proton exchange membrane was DuPont™ Nafion® PFSA N-117 (DuPont Limited, Wilmington, Delaware, USA), which was used for the mass transfer reaction in the MFC. The proton exchange membrane was sulfonated by sulfuric acid and hydrogen peroxide (Nihon Shiyaku Industries Ltd., Japan). The azo dye used at the cathode of the MFC system was reactive black 5 (RB5; Sigma-Aldrich Ltd.), and the anode plate was made of graphite felt (CeTech Co., Ltd., Taichung, Taiwan).
Preparation of the electrospinning solution and the manufacturing process
The electrospinning devices included a high-voltage power supply, syringe pump, metal needle-generating Taylor cone, and collector. Because the PVA solution was pulled by an electric charge force field, spraying trickles were generated which dropped to the grounded collector, which leads to the formation of nanofibers. 13 By referring Wang’s methods, 14 the electrospinning solution was prepared by first adding 1.6 g of PVA to 18.4 mL of distilled water (which was used as the solvent), and then adding 40 mg of SDS as the surfactant. The solution was stirred for 2 h at 90°C to dissolve SDS and PVA evenly. The r-GO and linear low-density polyethylene in a varying proportion were added to the electrospinning solution; the r-GO with varying weight percentages (0, 2, 4, 6, and 8 wt%) was added to the electrospinning solution, and then the electrospinning solution was oscillated by ultrasonic waves for 1 h, to evenly distribute the r-GO in the polymer solution. 15
Subsequently, the electrospinning solution was placed in a 10-mL syringe cylinder (inner diameter: 15.79 mm), and a Teflon conduit and a connector were attached to the syringe cylinder. A 21G model syringe needle (inner diameter: 0.52 mm) was fixed at the position where a high bias voltage was applied. An electrospinning tester (FES-COL; Foxconn Technology Co., Ltd., New Taipei City, Taiwan) was used. The ITO was grounded to deposit the electrospinning solution on its surface. 16 The electrospinning time was set to 1 h, the electrospinning distance (between the needle end and the collection plate) was set to 150 mm, the electrospinning voltage was set to 20 kV, and the feeding speed was set to 0.6 mL/h. 17 The electrospinning solution was deposited on only one side of the ITO glass, and then the deposited electrospun composite electrode was removed for further use.
Pre-experiment treatment and establishment of field domain
The carbon felt was pretreated first; specifically, it was soaked in a 200 cm3 solution (prepared by adding deionized water and hydrogen peroxide in a proportion of 9:1), and it was then heated to 90°C and boiled for 3 h to improve its hydrophilicity. The proton exchange membrane was pretreated in 950 cm3 deionized water and was boiled in a 50 cm3 hydrogen peroxide solution at 75°C for 1 h to eliminate the organic impurities. Then, 947 cm3 of deionized water and 52 cm3 of sulfuric acid were prepared and heated to 75°C, and the proton exchange membrane was boiled at 75°C for 1 h. In this way, the proton exchange membrane was sulfonated, so as to remove its metal ions and improve the performance of mass transfer. Then, the proton exchange membrane was placed in deionized water for further use.
Figure 2 shows the setup of the dual-chamber MFC system. A CNC machine tool (TM-1068, KFM, Taichung, Taiwan) was used to cut the acrylic chamber body. The chamber body had the dimensions of 80 mm × 85 mm × 50 mm (length × width × height, respectively). In the anode chamber, 250 mL of dairy wastewater was added for use as the electrogenic microbial strain and substrate material. In the cathode chamber, a mixed solution of distilled water and ferrous sulfate (concentration: 0.3 M; volume: 250 mL) provided the iron source required for the Fenton reaction; the pH value was 2.97.

Setup of the dual-chamber MFC. MFC: microbial fuel cell.
The pretreated carbon felt was placed into the anode chamber for use as the working electrode (length × width: 40 mm × 25 mm), which was connected to an external circuit. The r-GO-PVA composite electrode (length × width: 40 mm × 25 mm) was placed into the cathode chamber; it then underwent a self-discharge reaction for 3 to 5 days, so as to acclimate the MFC system. After the MFC system became stable, the electrolyte solution in the cathode chamber was replaced with a 250-mL mixed solution of RB5 (concentration: 10 ppm) and ferrous sulfate (concentration: 0.3 M), to measure the power density and the polarization curve.
Morphological observation for nanofiber lamination
We fixed a sample of electrospun laminated nanofibers on the aluminium carrier. The sample surface was first platinized, and then the morphology and diameter of electrospun nanofibers were observed and measured via scanning electron microscopy (SEM, Hitachi S-4800). The SEM randomly samples 100 nanofibers from the picture and calculates the average diameter of the nanofibers. To determine whether the r-GO conjugates with PVA, transmission electron microscopy (TEM, Hitachi H-7100) was performed to observe and compare the appearances of r-GO powders. The inner structure of the PVA/r-GO was analyzed by high-resolution transmission electron microscopy (HR-TEM; JEOL, JEM-2000 FXII). Before the observation, the r-GO sample was soaked in ethyl alcohol and oscillated by ultrasonic waves, so that the r-GO powders were evenly distributed. Then, the sample was dripped onto a copper foil and subsequently observed using TEM.
Analysis of electrochemical properties
We used a three-pole constant-potential cyclic voltammetry scanning method to measure the electrochemical properties of the composite electrode with different r-GO contents (0–8 wt%). The scanned potential ranged from 1 V to –1 V, the scanning rate was 0.1 V/s, a Pt plate was used as the auxiliary electrode, Ag/AgCl was used as the reference electrode, and a ferrous sulfate solution (concentration: 0.3 M) served as the electrolyte solution. Finally, we measured the composite electrode with different r-GO contents.
Polarization curve and power density
The polarization curve and power density were measured by an electrochemical measuring instrument along with a software package (Zive SM, Wonatech, Korea) after the MFC was acclimated for 3 to 5 days. The anode and cathode of the MFC were interconnected to the electrochemical workstation, to measure the voltage, current, and polarization curve of the MFC.
Decolorization ratio of RB5
RB5 is an azo dye used to determine whether any decolorization or degradation effect occurred during the EF reaction. A 250-mL electrolyte solution was added to the cathode chamber to prepare the RB5 (concentration: 10 ppm) and ferrous sulfate (concentration: 0.3 M) for use as the indexes of the EF reaction. We sampled a 1.5-mL electrolyte solution from the cathode chamber and mixed it with 1.5 mL of distilled water in the proportion of 1:1. Then, we measured the absorbance using a spectrophotometer (SH-U880; Shishin Technology Co., Ltd., Taiwan). The sampling interval was 1 h, and the absorbance was measured continuously for 12 h.
The colors of RB5 is dependent on the distinctive nitrogen–nitrogen double bonds (N=N). The double bonds can be destroyed by the EF reaction, causing a decline in the dye’s chromaticity and producing a decolorization effect. This verifies that the EF reaction is occurring. The decolorization ratio (D) can be measured by formula (5)

where A 0 is the initial absorbance value and An is the final absorbance value.
The cyclic voltammetry curve, polarization curve, and decolorization efficiency electrochemical experimental sample rate are 1 data/mV, 1 data/mV, and 1 data/h, respectively. The error bars of experimental value are ±5% made with a software package (KaleidaGraph, K-graph, Synergy, USA).
Results and discussion
The sheet resistances of PVA/r-GO composite
To verify the conductance of the PVA/r-GO composite by electrospinning, a four-point probe station (SRS4000 Jiehan, Taiwan) is adopted to measure its sheet resistance. The sheet resistance decreases with increasing r-GO concentration (Table 1). However, it should be mentioned here that the total performance of a BEFMFC system is not dependent only on the conductance of the PVA/r-GO composite electrode. The most important performance of a BEFMFC system features on the capabilities of the power generation of anode chamber and the wastewater decompose of cathode chamber. The case of 4 wt% r-GO concentration is the best for the total performance of a BEFMFC system though its conductance is not the best. This will be shown in the later subsections about the performances of the BEFMFC system.
The sheet resistances of the PVA/r-GO composites with different addition ratios of r-GO.

PVA: poly(vinyl alcohol); r-GO: reduced graphene oxide.
Fourier transform infrared measurement
As shown in Figure 3, a transmittance peak was observed between the wave numbers 3300 and 3500 cm–1, which represented the hydroxyl group of r-GO, 4 wt% r-GO/PVA, and PVA, respectively; 18 the peak between the wave numbers 2900 and 3000 cm–1 represented the C–H bending of PVA and 4 wt% r-GO/PVA; 19 and the peak between the wave numbers 1700 and 1750 cm–1 represented the carbonyl group of the combination of r-GO. 20 On the other hand, the absorption bands of graphene appeared at 3462, 1710, and 1066 cm−1 attributed to the skeletal vibration of O–H, O=C, and C–O bonds, respectively. 21,22 Thus, the results show Fourier transform infrared (FTIR) spectrum of the PVA nanofiber and r-GO, respectively. In summary, the FTIR measurement shows that the electrospun fiber was indeed the composite of PVA and r-GO.
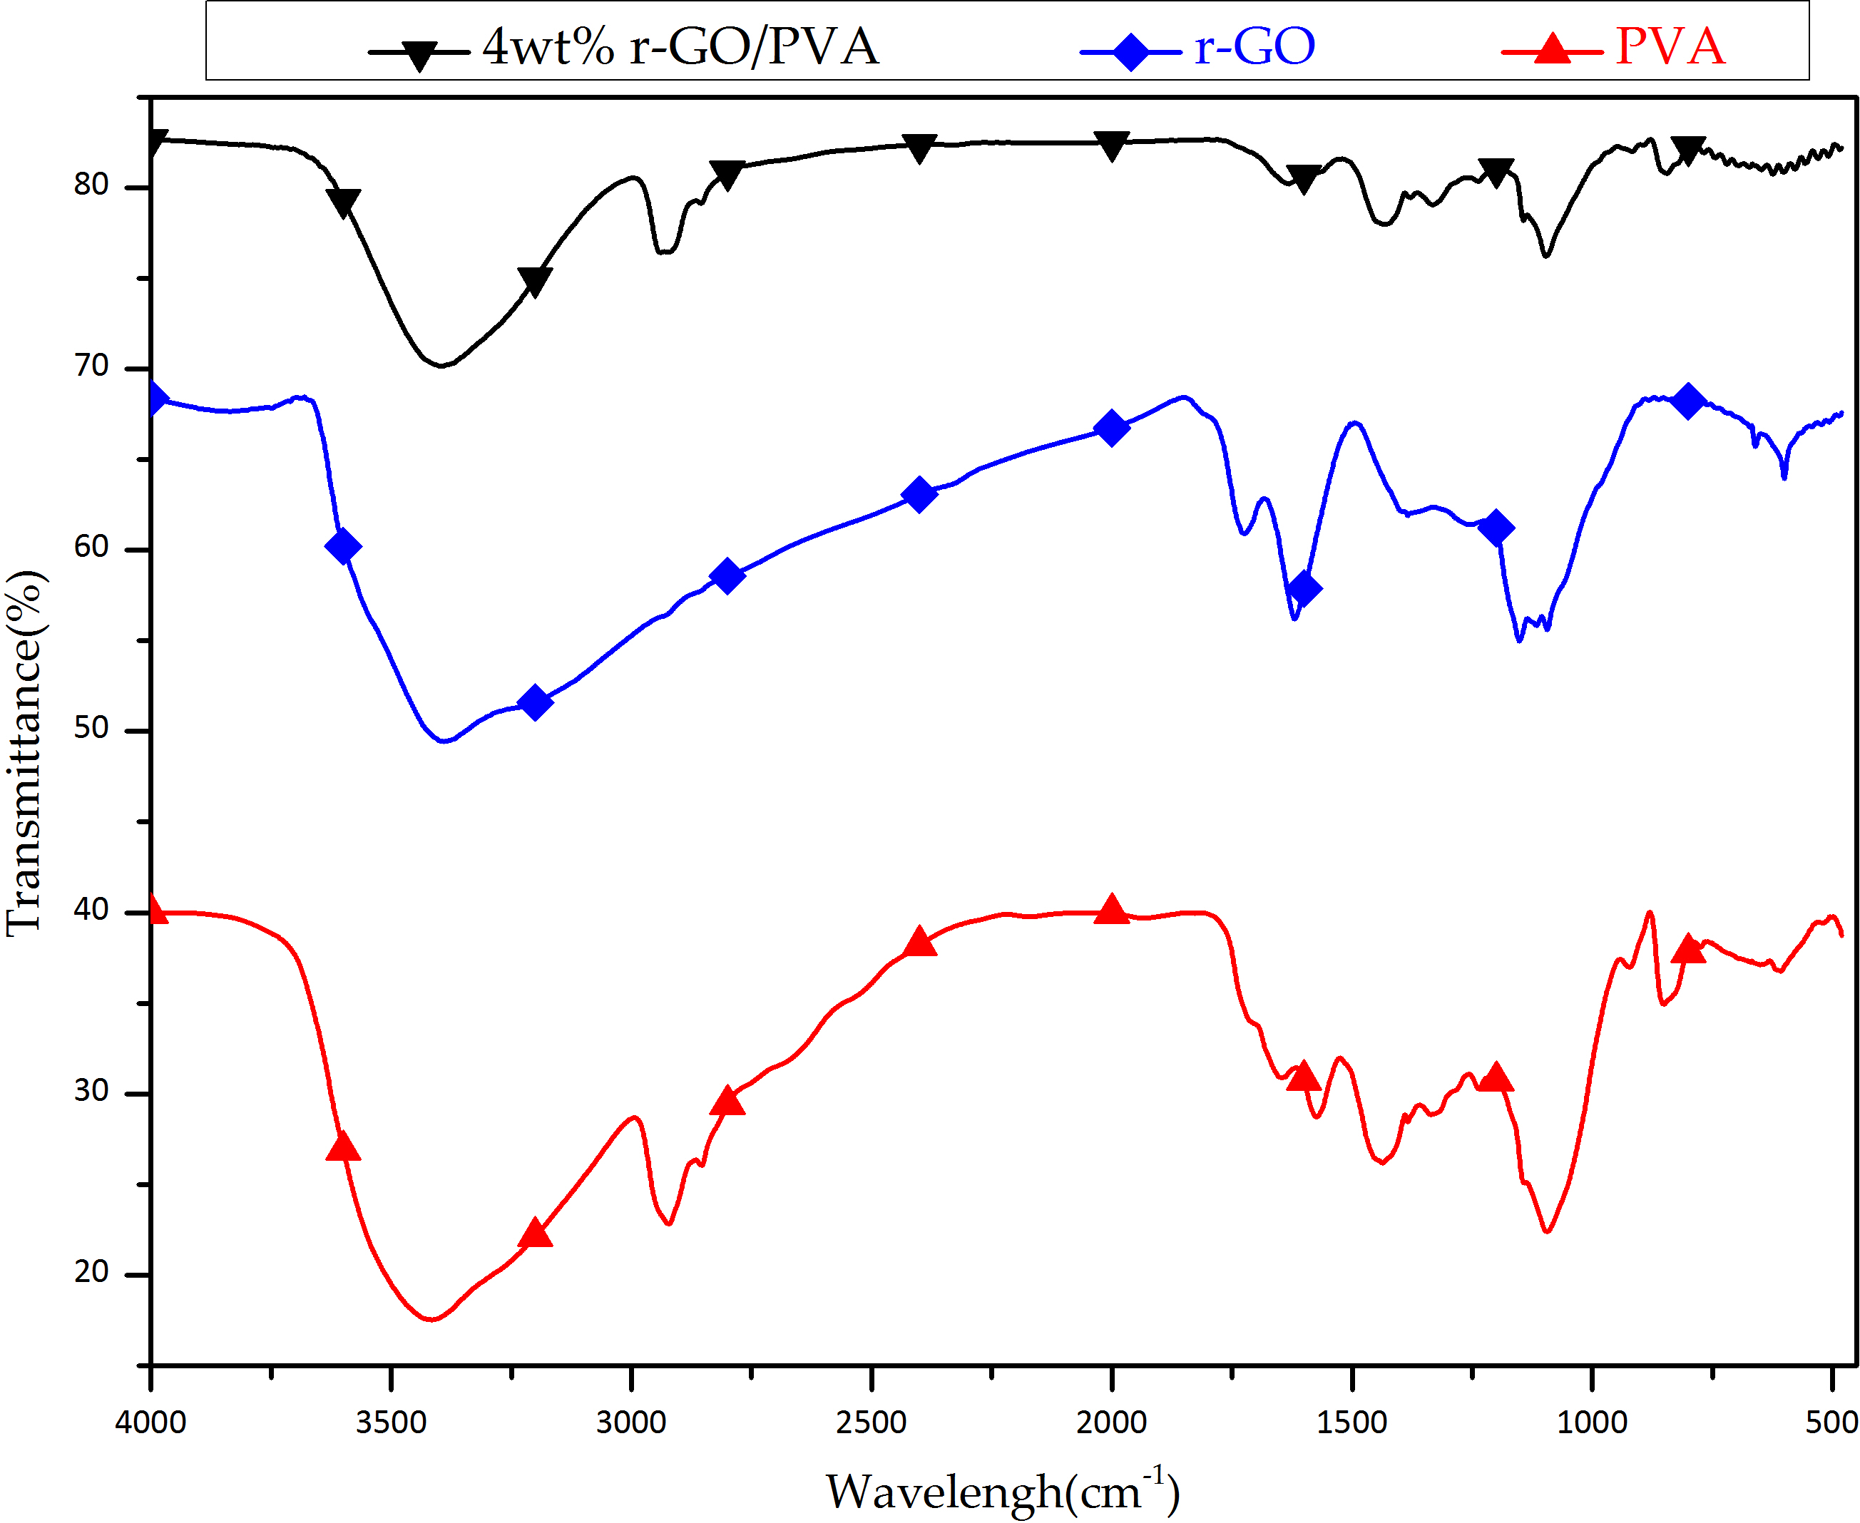
FT-IR spectrum of the composite of PVA with 4 wt% r-GO additive, r-GO and PVA. FTIR: Fourier transform infrared PVA: poly(vinyl alcohol); r-GO: reduced graphene oxide.
Morphological observation of nanofiber lamination
The morphology of the electrospun composite nanofibers was observed by SEM with amplification ratios of 500 and 30,000. Figure 4(a1) to (e1) shows the morphologies of the composite PVA nanofibers with different r-GO contents (0, 2, 4, 6, and 8 wt%) and an amplification ratio of 500. The nanofibers prepared in the experiment assumed an irregular morphology. Figure 4(a2) shows the morphology of the composite PVA nanofibers with an amplification ratio of 30,000; the average measured diameter is ∼123.73 nm. Phachamud et al. measured the fiber diameter of the PVA nanofibers with different electrospinning parameters. 23 According to the measurement results of the present work, the fiber diameter of the PVA nanofibers ranged from 100 nm to 200 nm under the following conditions: (1) PVA concentration, 8 wt%; (2) working distance, 150 mm; and (3) electrospinning voltage, 20 kV. The diameter of the composite nanofibers determined in the present research is consistent with the measured result. The particle size of the r-GO ranged from 2 μm to 5 μm, as observed by TEM.

Composite electrospun PVA nanofibers with varying addition weight percentage of r-GO: (a) 0 wt%, (b) 2 wt%, (c) 4 wt%, (d) 6 wt%, and (e) 8 wt%; (1) amplification ratio: 500, (2) amplification ratio: 30,000. PVA: poly(vinyl alcohol).
Figure 4(b1) shows the morphology of the composite nanofibers with addition weight percentage of 2 wt% r-GO and an amplification ratio of 500. By this time, the graphene was successfully inlaid into the PVA nanofibers, and the measured average diameter of the nanofibers was 119.85 nm, as shown in Figure 4(b2). This diameter of the PVA nanofibers is smaller than that without any r-GO, as shown in Figure 4(a2).
Barzegar et al. attempted to add graphene to electrospun PVA nanofibers and probe the characteristic differences of the PVA nanofibers. 24 When graphene was added to the PVA nanofibers, their fiber diameters reduced from the range 238–302 nm to the range 130–230 nm. A primary reason for this is that the electrical conductivity of the polymer solution improved when graphene was added to the electrospinning solution; when a high bias voltage was applied, the polymer solution separated, which increased the ejection speed of the nanofibers and shortened the fiber diameter of the nanofibers.
Figure 4(c1) shows the morphology of the composite nanofibers with addition weight percentage of 4 wt% r-GO, observed with an amplification ratio of 500. At this time, the distribution area of the r-GO on the PVA nanofibers is obviously larger than that with an addition weight percentage of 2 wt% r-GO shown in Figure 4(b1). This indicates an increase in the r-GO content brought about by electrospinning the polymer solution under the electrical field. The composite electrospun nanofibers with addition weight percentage of 4 wt% r-GO and observed with an amplification ratio of 30,000 have a smaller average diameter (110.64 nm) than that with addition weight percentage of 2 wt% r-GO, as shown in Figure 4(b2).
Figures 4(d1) and 6(e1) show the morphology of the electrospun PVA nanofibers with addition weight percentage of 6 and 8 wt% r-GO, respectively, observed with an amplification ratio of 500. At this time, the r-GO on the PVA nanofibers is distributed unevenly and is partially concentrated as compared with the distribution of the r-GO on the PVA nanofibers with addition weight percentage of 4 wt% r-GO shown in Figure 4(c1). As shown in Figure 4(d2) to (e2), the average measured fiber diameter of the PVA nanofibers reduced to 106.18 and 103.74 nm, respectively. In this case, however, the graphene will exert an effect similar to that obtained with a gas barrier on the PVA texture, thus reducing the penetrability of the PVA nanofibers. 25 If such an effect is applied to a cathode chamber environment, it will become difficult for the hydrogen ions to react with the graphene on the surface of the nanofibers, creating an electron transfer barrier. This will reduce the electrogenic capacity of the MFC and the degradation effect of the bio-electro-Fenton reaction. As the increase of r-GO dosage on PVA, the fiber was easier to breakout. Furthermore, the pores production of 6 and 8 wt% r-GO were bigger than that of 4 wt% r-GO. Simultaneously, the observations of SEM accord with the results that the power density, OCV, and current density decreased with increasing addition weight percentage of r-GO.
The HR-TEM picture (Figure 5) clearly illustrates the flake-like shape of r-GO (as shown in red circles) with wrinkles which is well consistent with many literatures. 26 –29

HR-TEM pictures of the composite of PVA with 4 wt% r-GO additive and r-GO with wrinkles in the red circles. HR-TEM: high-resolution transmission electron microscopy; PVA: poly (vinyl alcohol); r-GO: reduced graphene oxide.
Analysis of electrochemical properties
Figure 6 shows the current versus voltage scan of the composite electrode prepared by depositing the PVA nanofibers onto the ITO. At –0.7 V, a characteristic reduction peak was observed due to the reduction potential generated by the PVA and Ag/Cl. When the scanned potential was in the range of –0.83 V to –1 V, a very obvious reduction peak occurred. It is speculated that an effect similar to chelation is created between the PVA and ITO surface; specifically, the PVA conjugates with the ITO interface to generate a bridge. 30
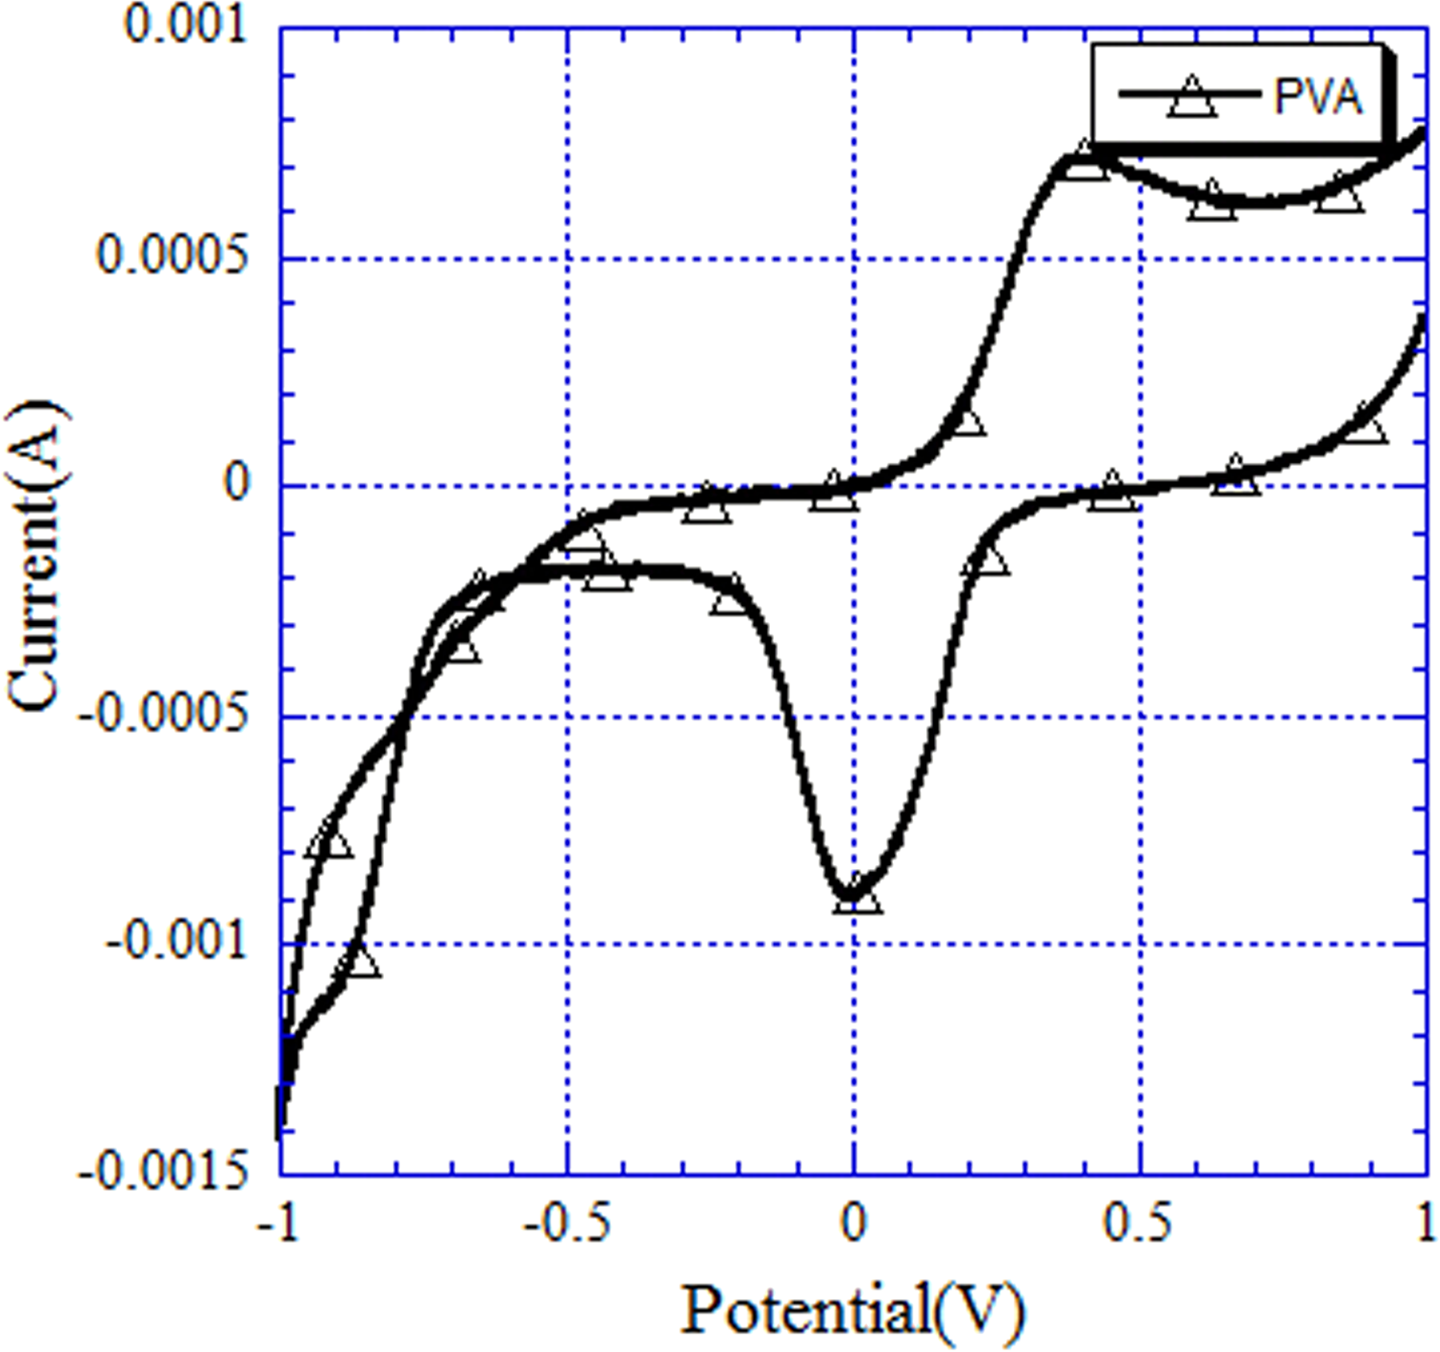
Current and voltage scan of the composite electrode prepared by laminating the PVA nanofibers onto the ITO. ITO: indium-tin-oxide; PVA: poly(vinyl alcohol).
When the scanned cyclic volt–ampere potential was at 0 V, a reduction peak was observed due to the redox reaction of the composite PVA nanofiber electrode. When the electrode prepared by depositing the PVA nanofibers onto the ITO was placed in an electrolyte solution of ferrous sulfate (concentration: 0.3 M), a redox reaction effect was observed. 31,32 For the PVA nanofibers, the reduction capacity was slightly better than the oxidizing capacity, and the cathode of the BEFMFC was easily reduced.
Figure 7 shows the cyclic voltammetry curve with the current and voltage generated when PVA nanofibers with varying r-GO contents were deposited onto the ITO electrode. Aleshin et al. prepared a composite film using poly(9-vinylcarbazole) and 1–3 wt% GO and investigated the redox properties of the composite film. 33 On increasing the addition weight percentage of GO, the electrical conductivity of the composite was sharply enhanced. According to the cyclic voltammetry scanning results, the increase in the addition weight percentage of GO enhanced the charge capture capability, thus improving the electrical conductivity of the film during the redox process.

Cyclic voltammetry curve showing the current and voltage generated by the ITO electrode with the laminated PVA nanofibers on varying the addition weight percentage of r-GO. ITO: indium-tin-oxide; PVA: poly(vinyl alcohol); r-GO: reduced graphene oxide.
In our research, the intensity of the characteristic reduction peak at 0.13 V obviously increased when the addition weight percentage of r-GO was increased from 2 wt% to 4 wt%. This trend, also shown by Aleshin et al. 33 and Zheng et al., 34 indicates that the increase in the addition weight percentage of graphene can slightly enhance the reduction capacity. When the addition weight percentage of r-GO reached 6 wt%, the characteristic reduction peak became deeper and wider than that attained when the addition weight percentage of r-GO was 2 wt%, and the characteristic peak began to diminish. When the addition weight percentage of r-GO was 8 wt%, the reduction peak became smaller than that attained at 2 wt%. In summary, (1) when the addition weight percentage of r-GO reached 4 wt%, the maximum charge capture capability was attained. (2) When the addition weight percentage of r-GO exceeded 4 wt%, the charge capture capability decreased the reduction capacity due to poor r-GO texture.
Formula (6) indicates how to calculate the area of the region of the cyclic voltammetry scanning curve

Q (unit: coulomb (C)) refers to the quantity of electric charge and is equivalent to the quantity of the charge captured by the composite electrode prepared in the present research. I refers to a single-point peak current in the cyclic voltammetry. T (unit: s) refers to the time required for scanning the complete cyclic voltammetry curve. The captured charge quantity of each composite electrode plate can be determined by multiplying the single-point peak current in the scanning curve by the scanning time of the point, as described in Table 2. When the addition weight percentage of r-GO was 4 wt%, the optimal quantity of electric charge was 0.032 C and the quantity of electric charge on the ITO electrode with deposited PVA nanofibers was as low as 0.012 C. This indicates that the composite electrode plate attained the maximum charge capture capacity when the addition weight percentage of r-GO was 4 wt%.
Electric charge of the PVA with different r-GO contents, determined by cyclic voltammetry.

PVA: poly(vinyl alcohol); r-GO: reduced graphene oxide.
Polarization curve and power density
Figure 8 shows the polarization curve using the voltage, current density, and power density obtained when the electrospun PVA nanofibers with different r-GO contents were applied to the MFC. For the composite electrode prepared by the electrospun PVA nanofibers, the generated OCV was 0.168 V, the generated current density was 72.23 mA/m2, and the generated power density was 2.51 mW/m2.

Polarization curve showing the voltage, current density, and power density when the composite PVA electrode plate with varying addition weight percentage of r-GO was applied to the BEFMFC. BEFMFC: bio-electro-Fenton MFC; PVA: poly(vinyl alcohol); r-GO: reduced graphene oxide.
When the addition weight percentage of r-GO in the composite PVA nanofibers was increased to 2 wt%, the OCV rose to 0.293 V, the current density rose to 208.98 mA/m2, and the power density was 14.61 mW/m2. Obviously, the addition of r-GO to the PVA raised the OCV and current density, thus enhancing the power density generated by the MFC. When the addition weight percentage of r-GO in the composite PVA nanofibers increased to 4 wt%, the OCV rose to 0.423 V, the current density rose to 712.35 mA/m2, and the power density rose to 74.10 mW/m2. All of them reached the optimal level.
When the addition weight percentage of r-GO in the composite PVA nanofibers increased to 4 wt%, the OCV and power density generated by the BEFMFC were compared with the OCV (0.83 V) and power density (26.1 mW/m2) generated by a solid polymer electrolyte fuel cell (SPEFC) when a cathode electrode prepared by graphene and a polymer was applied to the SPEFC. 35 The OCV measured in the present research was lower than that specified in the aforesaid SPEFC, but the power density measured in this research was higher than the electrogenic effect specified in the aforesaid SPEFC. This shows that the composite ITO electrode prepared by graphene and electrospun PVA has a certain redox capability.
When the addition weight percentage of r-GO in the composite PVA nanofibers was increased to 6 wt%, the OCV was 0.192 V, the current density rose to 288.85 mA/m2, and the power density was 15.29 mW/m2. Overall, all values decreased. When the addition weight percentage of r-GO in the composite PVA nanofibers was increased to 8 wt%, the OCV was 0.127 V, the current density declined to 115.70 mA/m2, and the power density reduced to 15.29 mW/m2. With increasing addition weight percentage, all values continued to decline.
When the addition weight percentages of r-GO are 6 and 8 wt%, the average fiber diameters reduced to 106.18 and 103.74 nm, respectively, resulting in many big pores owing to the rupture of fibers. The pores result in a barrier on the electrode and block the ability of hydrogen ions to bind to electrons. As a result, the performance of the bio-electron-Fenton reaction becomes poor. Figure 4 shows that both the cases of 6 and 8 wt% produce r-GO produce pores of similar size but much bigger than that obtained when the r-GO was 4 wt%. Therefore, the power densities observed with 6 and 8 wt% r-GO are similar but obviously lower than that with 4 wt% r-GO. Furthermore, the results also correspond with the observations of SEM.
The polarization curve can be briefly divided into three phases: the activation polarization, Ohmic polarization, and concentration polarization. During the activation polarization phase, the performance is limited by the absorption, reaction, and desorption of the reactants. During the Ohmic polarization phase, the performance is limited by the internal resistance of the fuel cell, which arises from the proton exchange membrane, electrode, and external load. The internal resistance will affect the mobility of both electrons and ions. During the concentration polarization phase, the performance is limited by the concentration of electrolyte, reactive ions, and electrons. The main effect of r-GO concentration is on the first two phases, namely activation and Ohmic polarizations. As previously mentioned, 6 and 8 wt% r-GO will result in pores owing to the rupture of fibers phenomenon, deteriorating the overall performance of BEFMFC. This is why the case of 4 wt% r-GO shows a flatter slope of the polarization curve, which means that the overall performance is better than that observed with other cases.
For the composite ITO electrode prepared by electrospun PVA nanofibers, the generated power density was 2.51 mW/m2, as shown in Figure 9. When the addition weight percentage of r-GO was 2 wt%, the power density of the MFC rose to 14.61 mW/m2. According to the polarization curve, there exists a favorable electron/proton transfer reaction when the composite ITO electrode is applied to the cathode of the MFC. When r-GO and PVA are conjugated, the composite PVA nanofibers become capable of serving as conductive film nanofibers.

Polarization curve showing the voltage, current density, and power density when the composite PVA electrode plate with different r-GO contents (0, 2, 6, and 8 wt%) was applied to the BEFMFC. BEFMFC: bio-electro-Fenton MFC; PVA: poly(vinyl alcohol); r-GO: reduced graphene oxide.
Wu et al. added varying amounts of graphene (0, 5, 10, 20, and 40 ppm) to the electrospun nanofibers of PVA and glucose, in order to investigate the immobilization and activation of glucose. 36 Wu also investigated the ampere response by electrochemical analysis. When the addition amount of graphene was increased to 20 ppm, the composite nanofibers showed the shortest response time (9.90 s) and sensitivity of 38.70 μA/mM. This indicates that this addition amount brought about the optimal electrical conductivity. When the addition amount of graphene was increased to 40 ppm, the sensitivity somewhat improved to 28.50 μA/mM, and the response time was 23.80 s, which was longer than that attained when no graphene was added. Therefore, when the addition amount of graphene exceeded a certain level, the laminated stack structure became a barrier to electron transfer.
When the addition weight percentage of r-GO in PVA nanofibers was 6 wt%, the power density generated by the composite nanofiber electrode was 15.29 mW/m2 (slightly higher than that generated when the addition weight percentage of r-GO in PVA nanofibers was 2 wt%), but the OCV generated by the composite nanofiber electrode was lower than that generated when the addition weight percentage of r-GO in PVA nanofibers was 2 wt%. According to the polarization curve, the activation and polarization effect gradually improved on increasing the addition amount of r-GO from 0 wt% to 4 wt%; they then began to decline when the addition amount of r-GO was increased to 6 wt%. Therefore, using excessive addition amount of r-GO gave rise to a barrier on the surface of the composite electrode plate, thus weakening the conjugation capability between electrons and hydrogen ions and the mass transfer capability.
To sum up: (1) when the addition weight percentage of r-GO was 6 wt%, the power density of the MFC began to decline (at this time, the generated power density was 15.29 mW/m2, far lower than the maximum power density of 74.10 mW/m2 generated at 4 wt%); (2) when the addition weight percentage of r-GO was 8 wt%, the power density of the MFC sharply declined to 2.78 mW/m2, indicating that the mass transfer and proton transfer in the electrochemical reaction of the cathode plate of the MFC may also have been affected by the electronic barrier generated by the excessive addition amount of r-GO.
When the composite ITO electrode prepared herein was applied to the cathode environment of the BEFMFC, it withstood the reaction in an acidic electrolyte. In addition, adding an appropriate amount of r-GO to the electrospun PVA nanofibers increased the specific area of the contact surface of the electrode plate, thus enhancing the power density of the MFC system. When the addition weight percentage of r-GO was 4 wt%, the MFC showed the optimal electrogenic capacity. Hence, the addition weight percentage of r-GO should be within the bearing capacity of the electrospun PVA nanofibers.
Constant resistance discharge
As shown in Figure 10, the composite electrode was measured under the optimal power density when the addition weight percentage of r-GO was 4 wt%. The electrode plate was positioned into the chamber to stabilize the self-discharge reaction for one day, and the system resistance was calculated using the power density peak method (power density = power ÷ (surface area of the electrode); unit: mW/m2). A 510-Ω resistor was mounted as an external load between the measuring end and the cell end, to conduct a long-time constant-resistance discharge experiment. For the electrode prepared under this parameter, the BEFMFC system acquired the optimal voltage (0.435 V) on the fourth day of the self-discharge reaction. To confirm the discharge stability of the present bio-electro-Fenton MFC, we turned it off at the end of each cycle and replaced the solutions of both chambers. Then, the discharging status of the cell was observed within three cycles. The maximum voltage of the BEFMFC system was lowered slightly, but the BEFMFC system still acquired a voltage as high as 0.42 V. Experimental results show that the ITO electrode with laminated electrospun PVA nanofibers can be used as an electrode plate to maintain the electrogenic capacity of the BEFMFC.

Time-varying voltage diagram by constant-resistance discharge when the composite PVA electrode with an addition weight percentage of 4 wt% r-GO was applied to the MFC. MFC: microbial fuel cell; PVA: poly(vinyl alcohol); r-GO: reduced graphene oxide.
Decolorization ratio of RB5
The decolorization effect of the BEFMFC on RB5 was also affected by the pH value of the catholyte. In order to support the optimal startup condition of the BEF system, the pH value of the prepared ferrous sulfate solution was set to 2.97, which is approximately equal to the favorable pH-value environment specified by Ifelebuegu et al. 37 In addition, the rate of the EF reaction was affected by the electrogenic efficiency of the MFC. An improvement in the electrogenic capacity of the BEFMFC system will accelerate the EF reaction.
Figure 11 shows the time-varying decolorization efficiency diagram when the composite electrodes with different r-GO contents were applied to the cathode chamber of the BEFMFC. A visible light spectrophotometer was used to measure the ITO electrode with the laminated electrospun PVA nanofibers with an addition weight percentage of 0 wt% r-GO. The initial absorbance was 0.646, which increased to 0.482 after 12 h of the decolorization reaction. Table 3 lists the absorbance and decolorization ratio values of RB5 obtained by varying the amount of r-GO added to the PVA.

Time-varying decolorization efficiency diagram when the composite electrode with varying addition weight percentage of r-GO was placed into the cathode chamber of the BEFMFC. BEFMFC: bio-electro-Fenton MFC; r-GO: reduced graphene oxide.
Changes in the absorbance and decolorization ratio when a varying ratio of graphene is added to the PVA.

PVA: poly(vinyl alcohol); r-GO: reduced graphene oxide.
Under the same experimental period used in the present work, the decolorization ratio of RB5 reached 60.25% when the addition weight percentage of r-GO was 4 wt%. This indicates that 4 wt% r-GO brought about the optimal EF reaction rate. As recorded by Hong et al., 38 the methyl red dye wastewater was treated by the EF reaction driven by an MFC. When the graphene was applied to a carbon paper, the decolorization ratio was only 51%, which is about 10% lower than the optimal decolorization effect attained in the present research. It is speculated that there are two reasons for this: (1) the conjugation of the ITO and composite electrospun PVA nanofibers with added graphene improved the decolorization effect and (2) the high specific surface area of the electrospun PVA nanofibers strongly favors the surface modification of the ITO electrode.
When the addition weight percentages of r-GO in the electrospun PVA nanofibers were 2 and 6 wt%, the attained decolorization ratios were 47.06% and 48.87%, respectively. The former case describes the decolorization ratio due to the EF reaction when the addition weight percentage of r-GO gradually increased. The latter one describes the measured degradation ratio when excessive r-GO was added to the PVA (at this time, a pore owing to the rupture of fibers effect was formed, which slowed down the EF reaction and lowered the decolorization ratio). When the addition weight percentage of r-GO was 8 wt%, the decolorization ratio was only 31.83%, which is slightly higher than that (25.39%) obtained by the electrospun PVA nanofibers. However, 8 wt% is not an ideal addition weight percentage of r-GO.
Conclusions
In the present research, an r-GO-PVA composite was deposited onto an ITO electrode by electrospinning, and then the composite ITO electrode was applied to the BEFMFC. Based on the observations, we can draw the following conclusions: Observing the nanofiber morphology by SEM after the r-GO was conjugated to the PVA: The average fiber diameter of electrospun PVA nanofibers was 123.73 nm; the fiber diameter of PVA nanofibers decreased gradually on increasing the addition amount of r-GO, eventually reaching the minimum level of 103.74 nm when the addition weight percentage of r-GO was 8 wt%. When the addition weight percentage of r-GO was 4 wt%, the conjugate of r-GO and PVA was evenly distributed. When the addition weight percentages of r-GO were 6 wt% or 8 wt%, a portion of the graphene became concentrated, hindering the oxygen reaction and the electron transfer on the surface of the cathode electrode of the MFC, thereby degrading its performance. Measuring the voltage, current density and power density, and polarization curve: When the addition weight percentage of r-GO was 4 wt%, the composite electrode attained the maximum OCV of 0.42 V and a power density of 74.1 mW/m2. When the addition weight percentage of r-GO was increased from 0 wt% to 4 wt%, both the OCV and the power density increased gradually. When the addition weight percentage of r-GO increased to 6 wt%, however, both the OCV and power density began to decline. Once 8 wt% was reached, the electrical properties were severely degraded. Therefore, the MFC acquired the optimal electrogenic capacity when the addition weight percentage of r-GO was 4 wt%. The addition weight percentage of r-GO should be within the bearing capacity of the electrospun PVA nanofibers. Measuring the efficiency of the bio-electro-Fenton reaction in terms of the decolorization ratio of RB5: When the addition weight percentage of r-GO was increased, the efficiency of the bio-electro-Fenton reaction continuously improved. At an addition weight percentage of r-GO of 0 wt%, the decolorization ratio was only 25.39%. Once the addition weight percentage reached 4 wt%, the decolorization ratio reached the maximum level of 60.25%. When the addition weight percentage was 6 wt%, the decolorization ratio declined to 48.87%; that is, the efficiency of the bio-electro-Fenton reaction decreased. At the addition weight percentage of 8 wt%, the decolorization ratio was as low as 31.83%. In summary, the composite PVA electrode showed the maximum efficiency for the bio-electro-Fenton reaction when the addition weight percentage of r-GO was 4 wt%. Measuring the stability of the electrode plate in the MFC by constant-resistance discharge within three cycles when the addition weight percentage of r-GO is 4 wt%: The maximum OCV of the electrode plate was at least 0.41 V, indicating that the composite electrode prepared in this research was very stable. When the addition weight percentage of r-GO was increased, however, the electrical properties of the MFC did not linearly increase; due to the agglomeration of r-GO and a pores owing to rupture of fibers effect, the electrochemical properties (including the electrogenic capacity) degraded.
Footnotes
Author note
Yi-Ta Wang conceived the study, designed the experiments, analyzed the data, and wrote the article; Yuan-Kuo Wang performed the experiments.
Declaration of conflicting interests
The author(s) declared no potential conflicts of interest with respect to the research, authorship, and/or publication of this article.
Funding
The author(s) disclosed receipt of the following financial support for the research, authorship, and/or publication of this article: The authors sincerely appreciate the financial support from the Ministry of Science and Technology, R.O.C., under the Grant MOST 105-2221-E-197-016.