
Abstract
The distribution of proppant during hydraulic fracturing may directly contribute to the flow conductivity of the proppant fracture, so research on the migration and sedimentation of proppant in the fracture and the final distribution pattern is of great relevance. The mass conservation equations of proppant solids and fracturing fluid were adopted to describe the distribution of proppant migration and sedimentation in the fracture, improving the additional gravity coefficient by utilizing the density difference between proppant and fracturing fluid and the concentration of proppant, together with the proppant sedimentation velocity at different Reynolds numbers in this study. The flow coefficients were obtained by discretizing the system of equations through the finite volume method combined with the harmonic mean method and the upstream weight method. The concentration additional pressure gradient term was computed by using the Superbee format innovatively to improve the solution convergence of the model. Numerical simulations with identical parameters were compared with indoor test results, which fully verified the correctness of the model and the accuracy of the discrete solution based on the finite volume method. The effects of flow rate of fracturing fluid, ratio of injected sand, viscosity of fracturing fluid, grain size of proppant and density of proppant on proppant migration and sedimentation based on three elliptical fracture morphologies: even-wide, top-wide and bottom-narrow as well as top-narrow and bottom-wide were investigated and analyzed through comparing the rate of proppant front movement, the level of sweeping range and the degree of inhomogeneity in the range under different conditions. Findings of this study suggest that: (1) top-wide and bottom-narrow fractures are more preferable for homogenous sanding in the early stage of proppant injection, and top-narrow and bottom-wide fractures are best for sanding in the later stage; (2) the viscosity of fracturing fluid is the most influential factor on proppant migration and sedimentation, which increases in the range of 100 mPa.s to enhance the sweeping range and homogeneity of proppant sanding and therefore achieve a better fracturing effect.
Keywords
Introduction
As off-shore oil fields progress to deeper reservoirs, hydraulic fracturing, a key technology for the development of low-porosity and low-permeability oil and gas accumulation, is expected to find its further application. To achieve better fracturing performance, the transport and distribution pattern of proppant during fracturing should be explored.
The distribution of proppant during hydraulic fracturing directly affects the outcome of hydraulic fracturing, so the investigation of proppant migration and sedimentation in fractures and the final distribution pattern has great significance. As such, indoor tests and numerical simulations have been conducted both domestically and internationally. Wen et al. (2015) designed a series of experiments with different fracture angles and branching fractures under different injection parameters, and obtained the influence of multiple fracture angles on proppant distribution. The parameters of different types of inlets (eg. Perforating (Hu et al., 2023; Roostaei et al., 2018; Singh et al., 2022; Suri et al., 2020a; Zhang et al., 2021), horn-shaped (Singh et al., 2022) and whole-surfaced (Roostaei et al., 2018; Shi, 2016; Tong and Mohanty, 2016), etc.), different proppant types (grain size (Sahai and Moghanloo, 2019), sphericity (Zhang, 2017), density (Hao, 2018; Li, 2018)), different carrying fluid viscosities (Anschutz et al., 2023; Zhang et al., 2021), different injection flow rates (Liang et al., 2018; Liu et al., 2019; Zhang et al., 2023b), different fracture types (eg. even-wide fractures (Liang et al., 2018), elliptical shape fractures (Zhu et al., 2023) or complex fractures (Li et al., 2024; Qu et al., 2023; Xiang and Li, 2023)) were also investigated in the indoor tests to obtain the proppant accumulation distribution under various conditions, which then served as a reference for optimization of the parameters of the hydraulic fracturing in the field, Bai and Li (2023) and Zhou et al. (2023) did research on the friction and settling characteristics by indoor tests to provide parameters for numerical model. However, the model equipment of indoor tests during hydraulic fracturing does not fully simulate the actual situation of a fracture morphology in the subsurface. The parameters of the proppant and fluid, on the other hand, are more ideal, and the results of indoor tests are therefore of limited significance as a guide to the on-site situation.
Meanwhile, numerical simulations of proppant migration and sedimentation in fractures have been conducted at home and abroad. Kong et al. (2015) proposed a three-dimensional coupled model in combination with fracture morphology, and it is capable of calculating the proppant distribution under specific fracture morphology. Gadde et al. (2004) introduced a pseudothree-dimensional solid-liquid coupled model based on the Euler method. Mao et al. (2023) proposed an efficient Eulerian-Lagrangian proppant transport model with fractures. Roostaei et al. (2018) put forward a solution method as per a established three-dimensional model in the Longacurta difference format and verified the accuracy of the solution method using COMSOL. Yin et al. (2023) improve a method to generate fractures with rough surfaces was proposed according to the fractal interpolation theory. Considering the particle-particle, particle-wall and particle-fluid interactions by CFD-DEM. Hang et al. (2023) reproduced the proppant transport in large-scale rough fracture geometries, which combines the multiphases Eulerian framework and lattice Boltzmann method. Aguirre and Xiao (2023) proposed a three-dimensional hybrid CFD model combined with the kinetic theory of granular flow (KTGF) to investigate the effect of complex fractures in the transport and placement of proppant. Wen et al. (2023) presented two modes of proppant diversion at intersection of complex fractures. Yang et al. (2023) and Guo et al. (2023) used BEM-FVM to simulate the coupling of fracturing fluid, proppants and fractures to optimize fracturing parameters. Huang et al. (2021) proposed a continuum model for simulating proppant transport and fluid flow in hydraulic fractures. Isaev et al. (2023) proposed adaptive seeding/reseeding methods with exact integration of particles trajectories and local time step refinement in the vicinity of injection zones In these studies, equations describing the migration and sedimentation of proppant were derived based on the solid-liquid coupling relationship and sedimentation law during proppant flow (Hu et al., 2023; Li et al., 2023; Shi, 2016), and most of them were simulated with CFD-DEM (Gong et al., 2023; Liu et al., 2019; Lv et al., 2023; Shi, 2016; Tong and Mohanty, 2016; Xiang and Li, 2023; Zhang et al., 2022, 2023a; Zhu et al., 2023) or CFD-XFEM software (Brannon et al., 2005; Qu et al., 2022, 2023; Zhang et al., 2023b) such as fluent for two-dimensional and pseudo three-dimensional model. Through numerical simulations of parameters (Hang et al., 2023; Suri et al., 2019, 2020b) based on different fracturing fluids and proppant morphologies, the velocity, concentration and pressure distribution of the proppant within the fracture were obtained, and proppant migration and sedimentation patterns were also derived for different fracture morphology parameters and proppant and fluid parameters.
However, the current numerical models available in the literature involve more factors, suffer from complexity and poor convergence, they are usually too computationally intensive to be applied to large-scale problems, and are therefore of little utility to rapidly simulate the indoor experiments or even actual proppants conditions underground for hydraulic fracturing. In this study, a three-dimensional model for proppant migration and sedimentation was proposed and discretized in superbee format, and the convergence of the solution process was improved by using harmonic averaging and upstream weighting methods, this model can easily match with crack generation and extension models described by BEM, XFEM, etc., thereby overcoming the shortcomings of traditional DEM models with large computational complexity and difficulty in matching with cracks. The simulation results of the numerical model were compared with the results of indoor tests to verify the accuracy of the numerical model, and the model was then applied to analyze the sensitivity of fracturing fluid viscosity and other parameters under non-homogeneous fracture conditions, which can provide references for the design of indoor tests and the optimization of process parameters in the field.
Research methods
Numerical modeling
The solid-liquid coupled fluid flow equation serves to describe the flow relationship between the fracturing fluid and proppant during migration, and is usually composed of the momentum equation and the continuity equation. The controlling equations and their contents include (Hu et al., 2023; Suri et al., 2020c; Xu, 2016):
The mass conservation equation for the injected fluid (fracturing fluid), which determines the pressure distribution across the flow field; The mass conservation equation for solids, which describes the proppant concentration distribution at any point in the flow field; The momentum equation, which describes the relationship between the pressure gradient between the plates and the fluid velocity; Proppant settling velocity, which describes the final settling velocity of proppant grain within the fracture and affects the sedimentation concentration of the proppant.
During the migration and sedimentation of proppant, temperature-dependent flow can be neglected, and the transport equations for proppant and fracturing fluid are (Hou, 2018; Liu and Sharma, 2005; Tian, 2018; Wen et al., 2015; Yin et al., 2023):
The mass continuity equation of proppant is as follows:


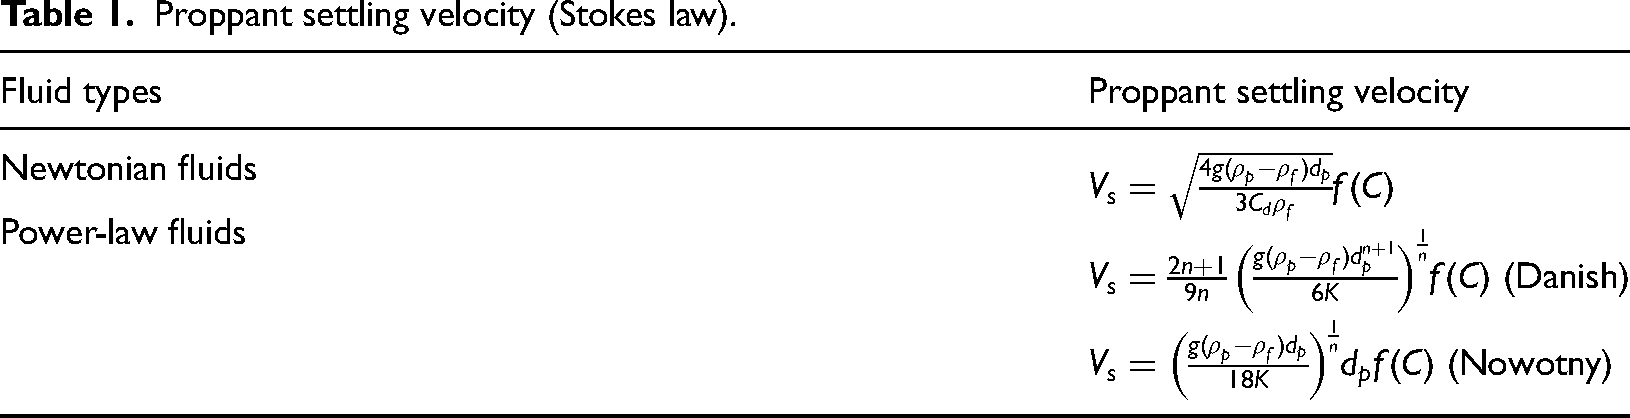
The proppant settling velocity is given by (Bai and Li, 2023; Kong et al., 2015; Li et al., 2024; Pan et al., 2018; Roostaei, 2017; Sahai and Moghanloo, 2019; Singh et al., 2022) (Table 1):
where the relationship between Galilean number and Reynolds number can be expressed through Figure 1 (Chen et al., 2022; Huang et al., 2017; Mouedden et al., 2023; Roostaei et al., 2018):
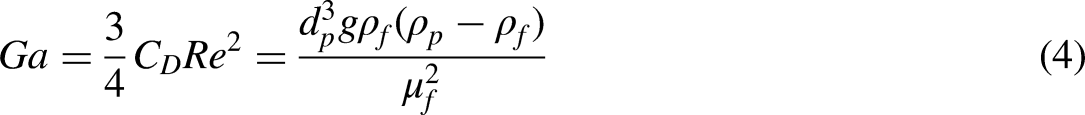
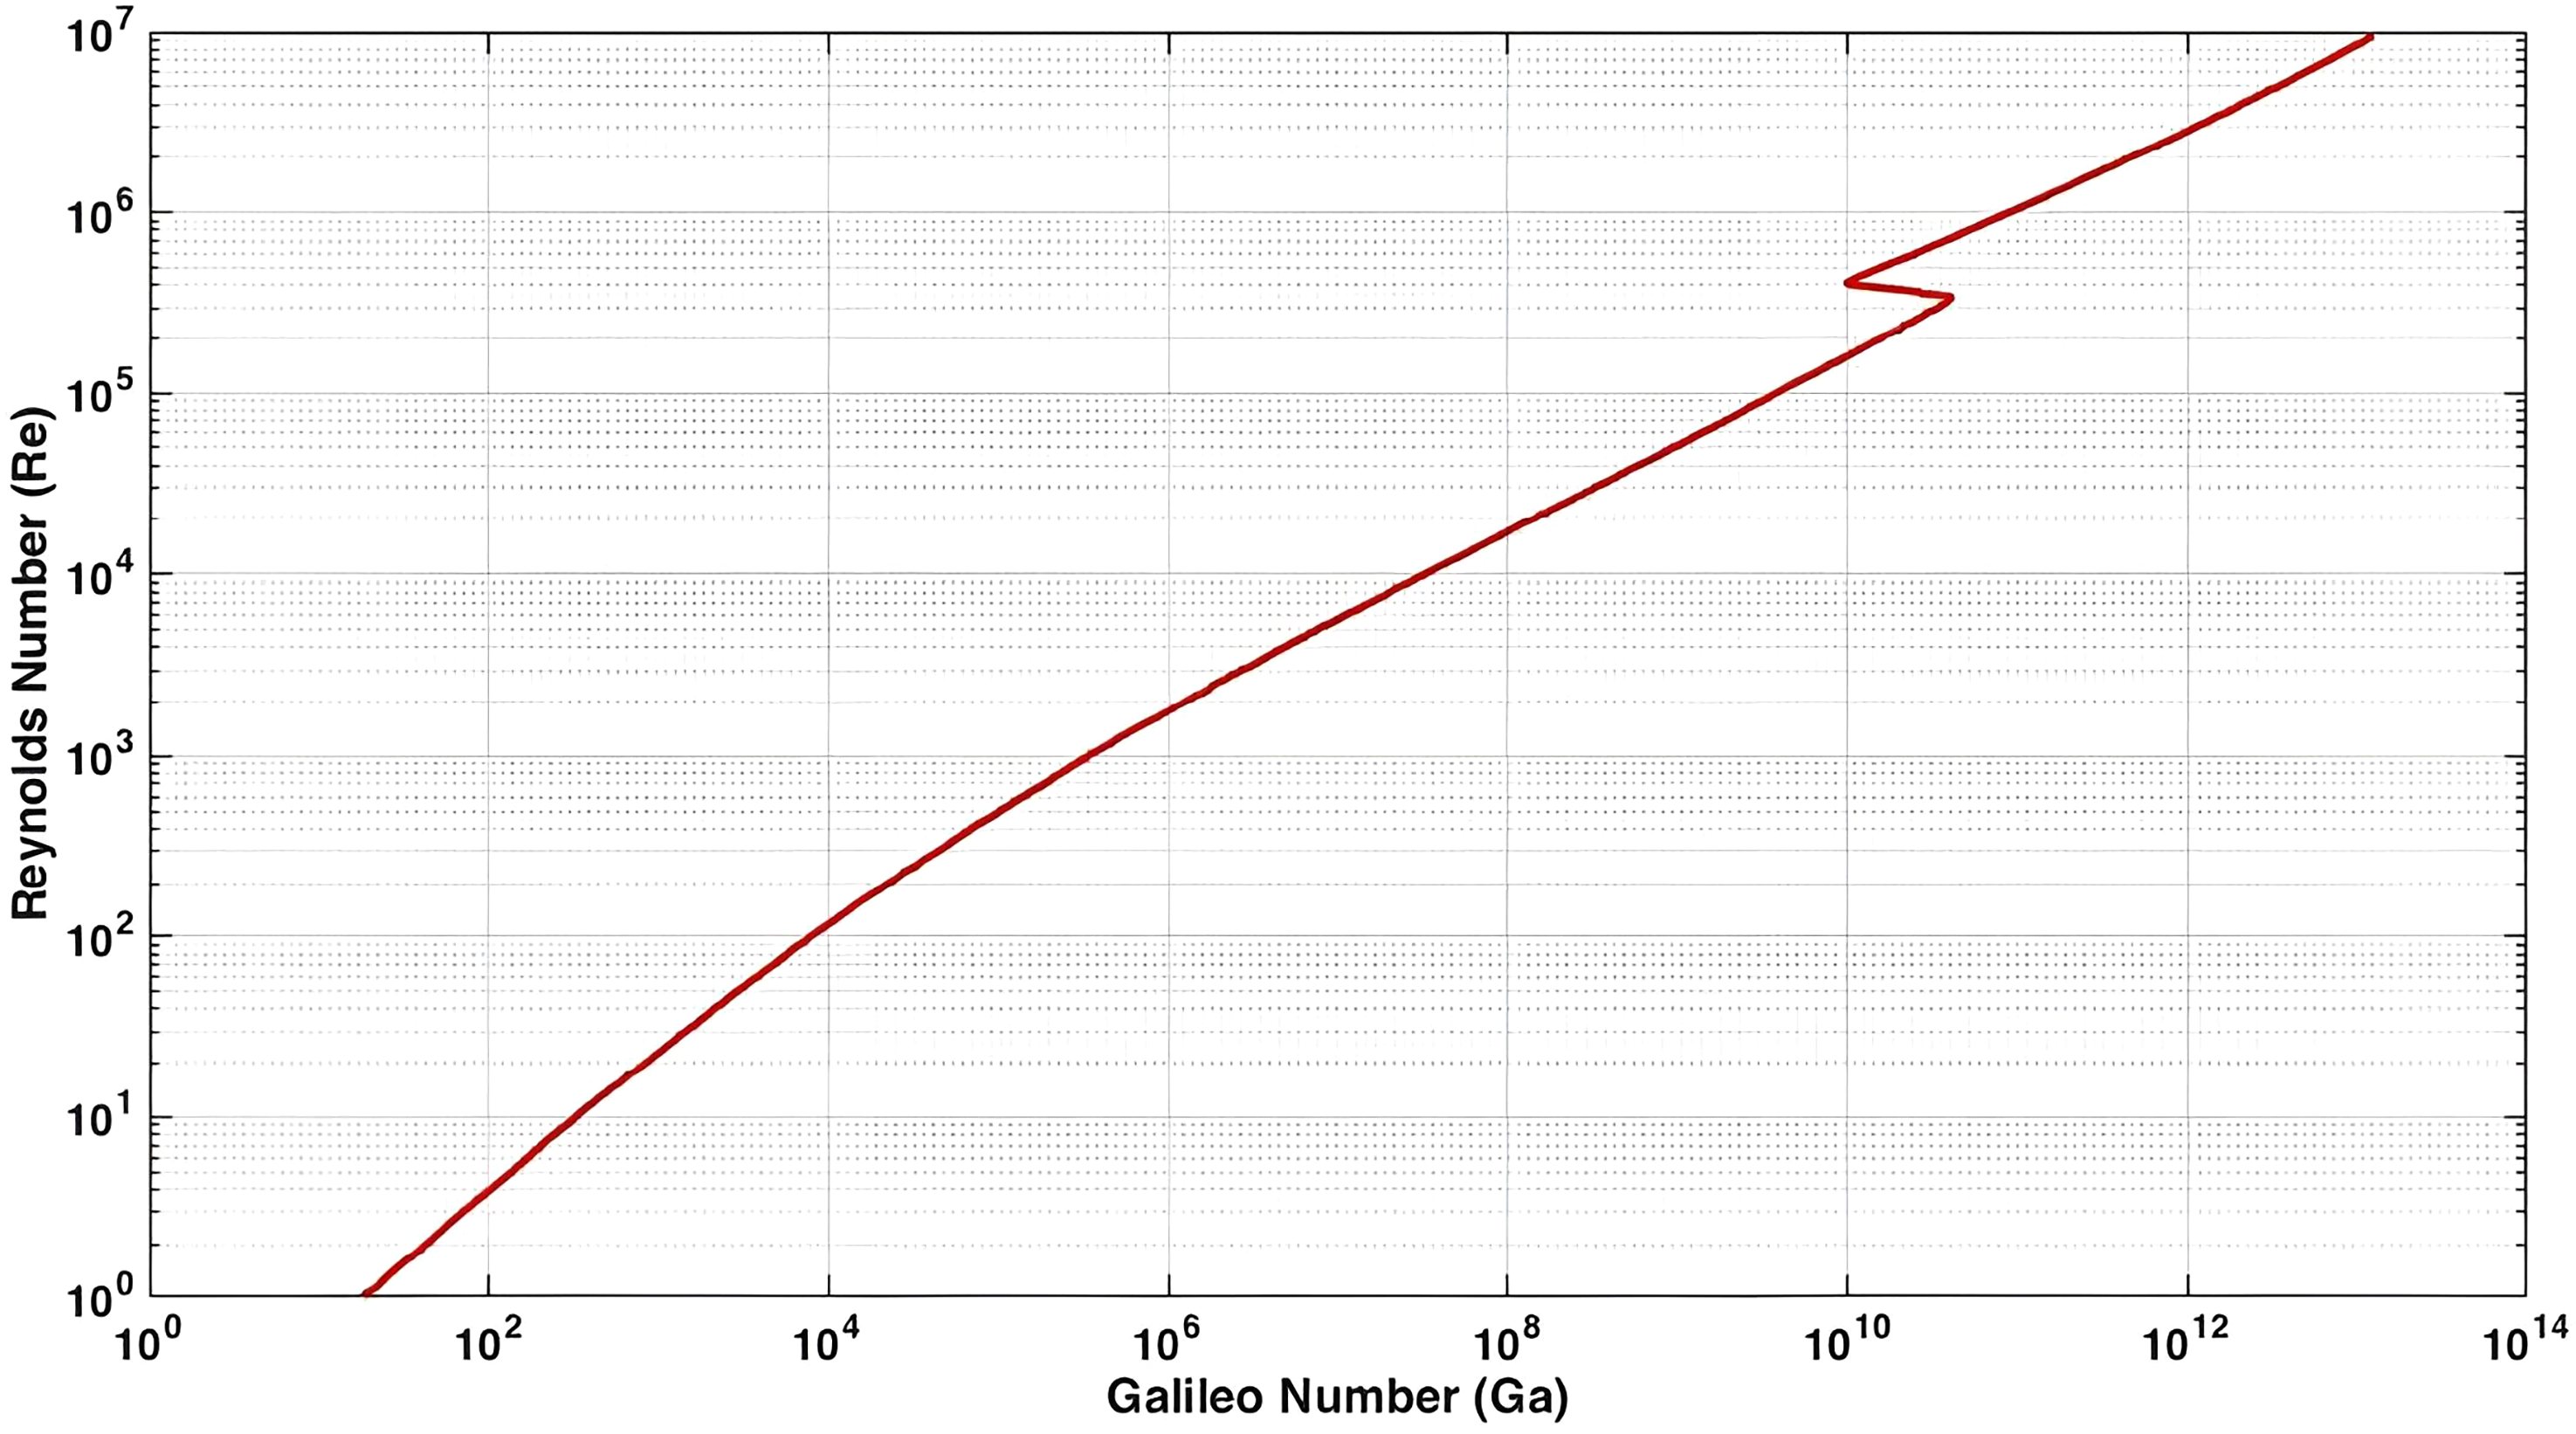
Relationship between reynolds number and galilean number.
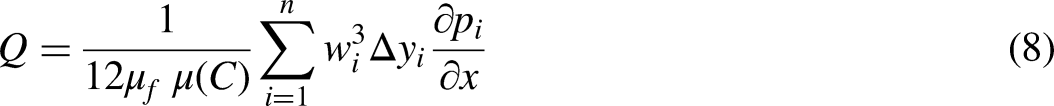
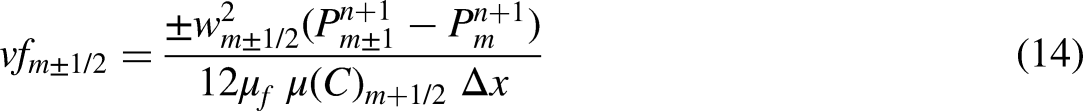
Proppant migration and sedimentation during hydraulic fracturing is given by the flow equation for the fracturing fluid and the flow equation for the proppant mentioned above:


Discretization and solution of the model
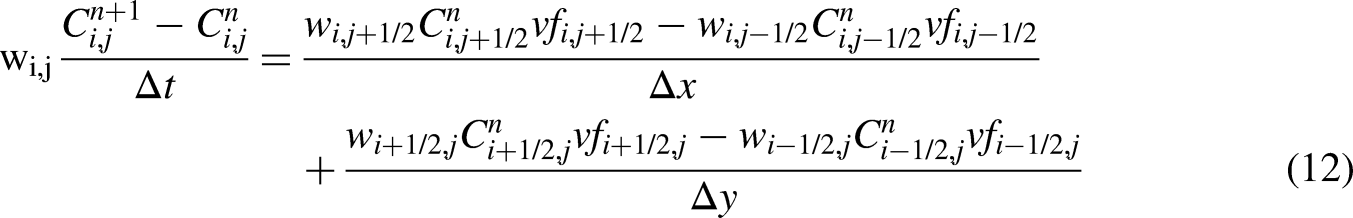
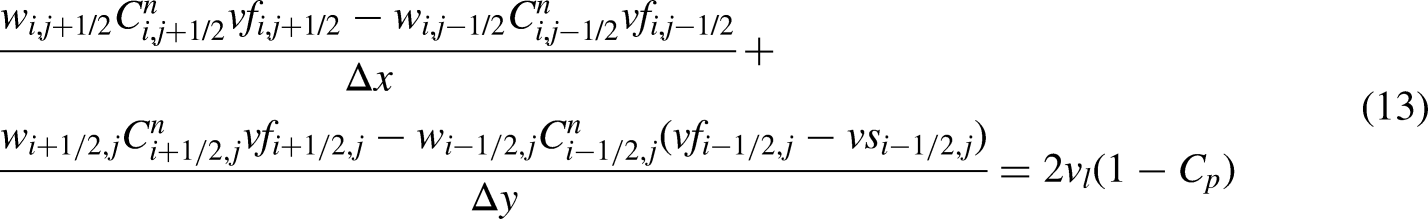
The model was discretized using the finite volume method (FVM) and the flow coefficients were obtained with harmonic averaging and upstream weighting. As the fracture width is constant throughout the process, which is independent of time but can be spatially dependent, the equations can be written (10) and (11):


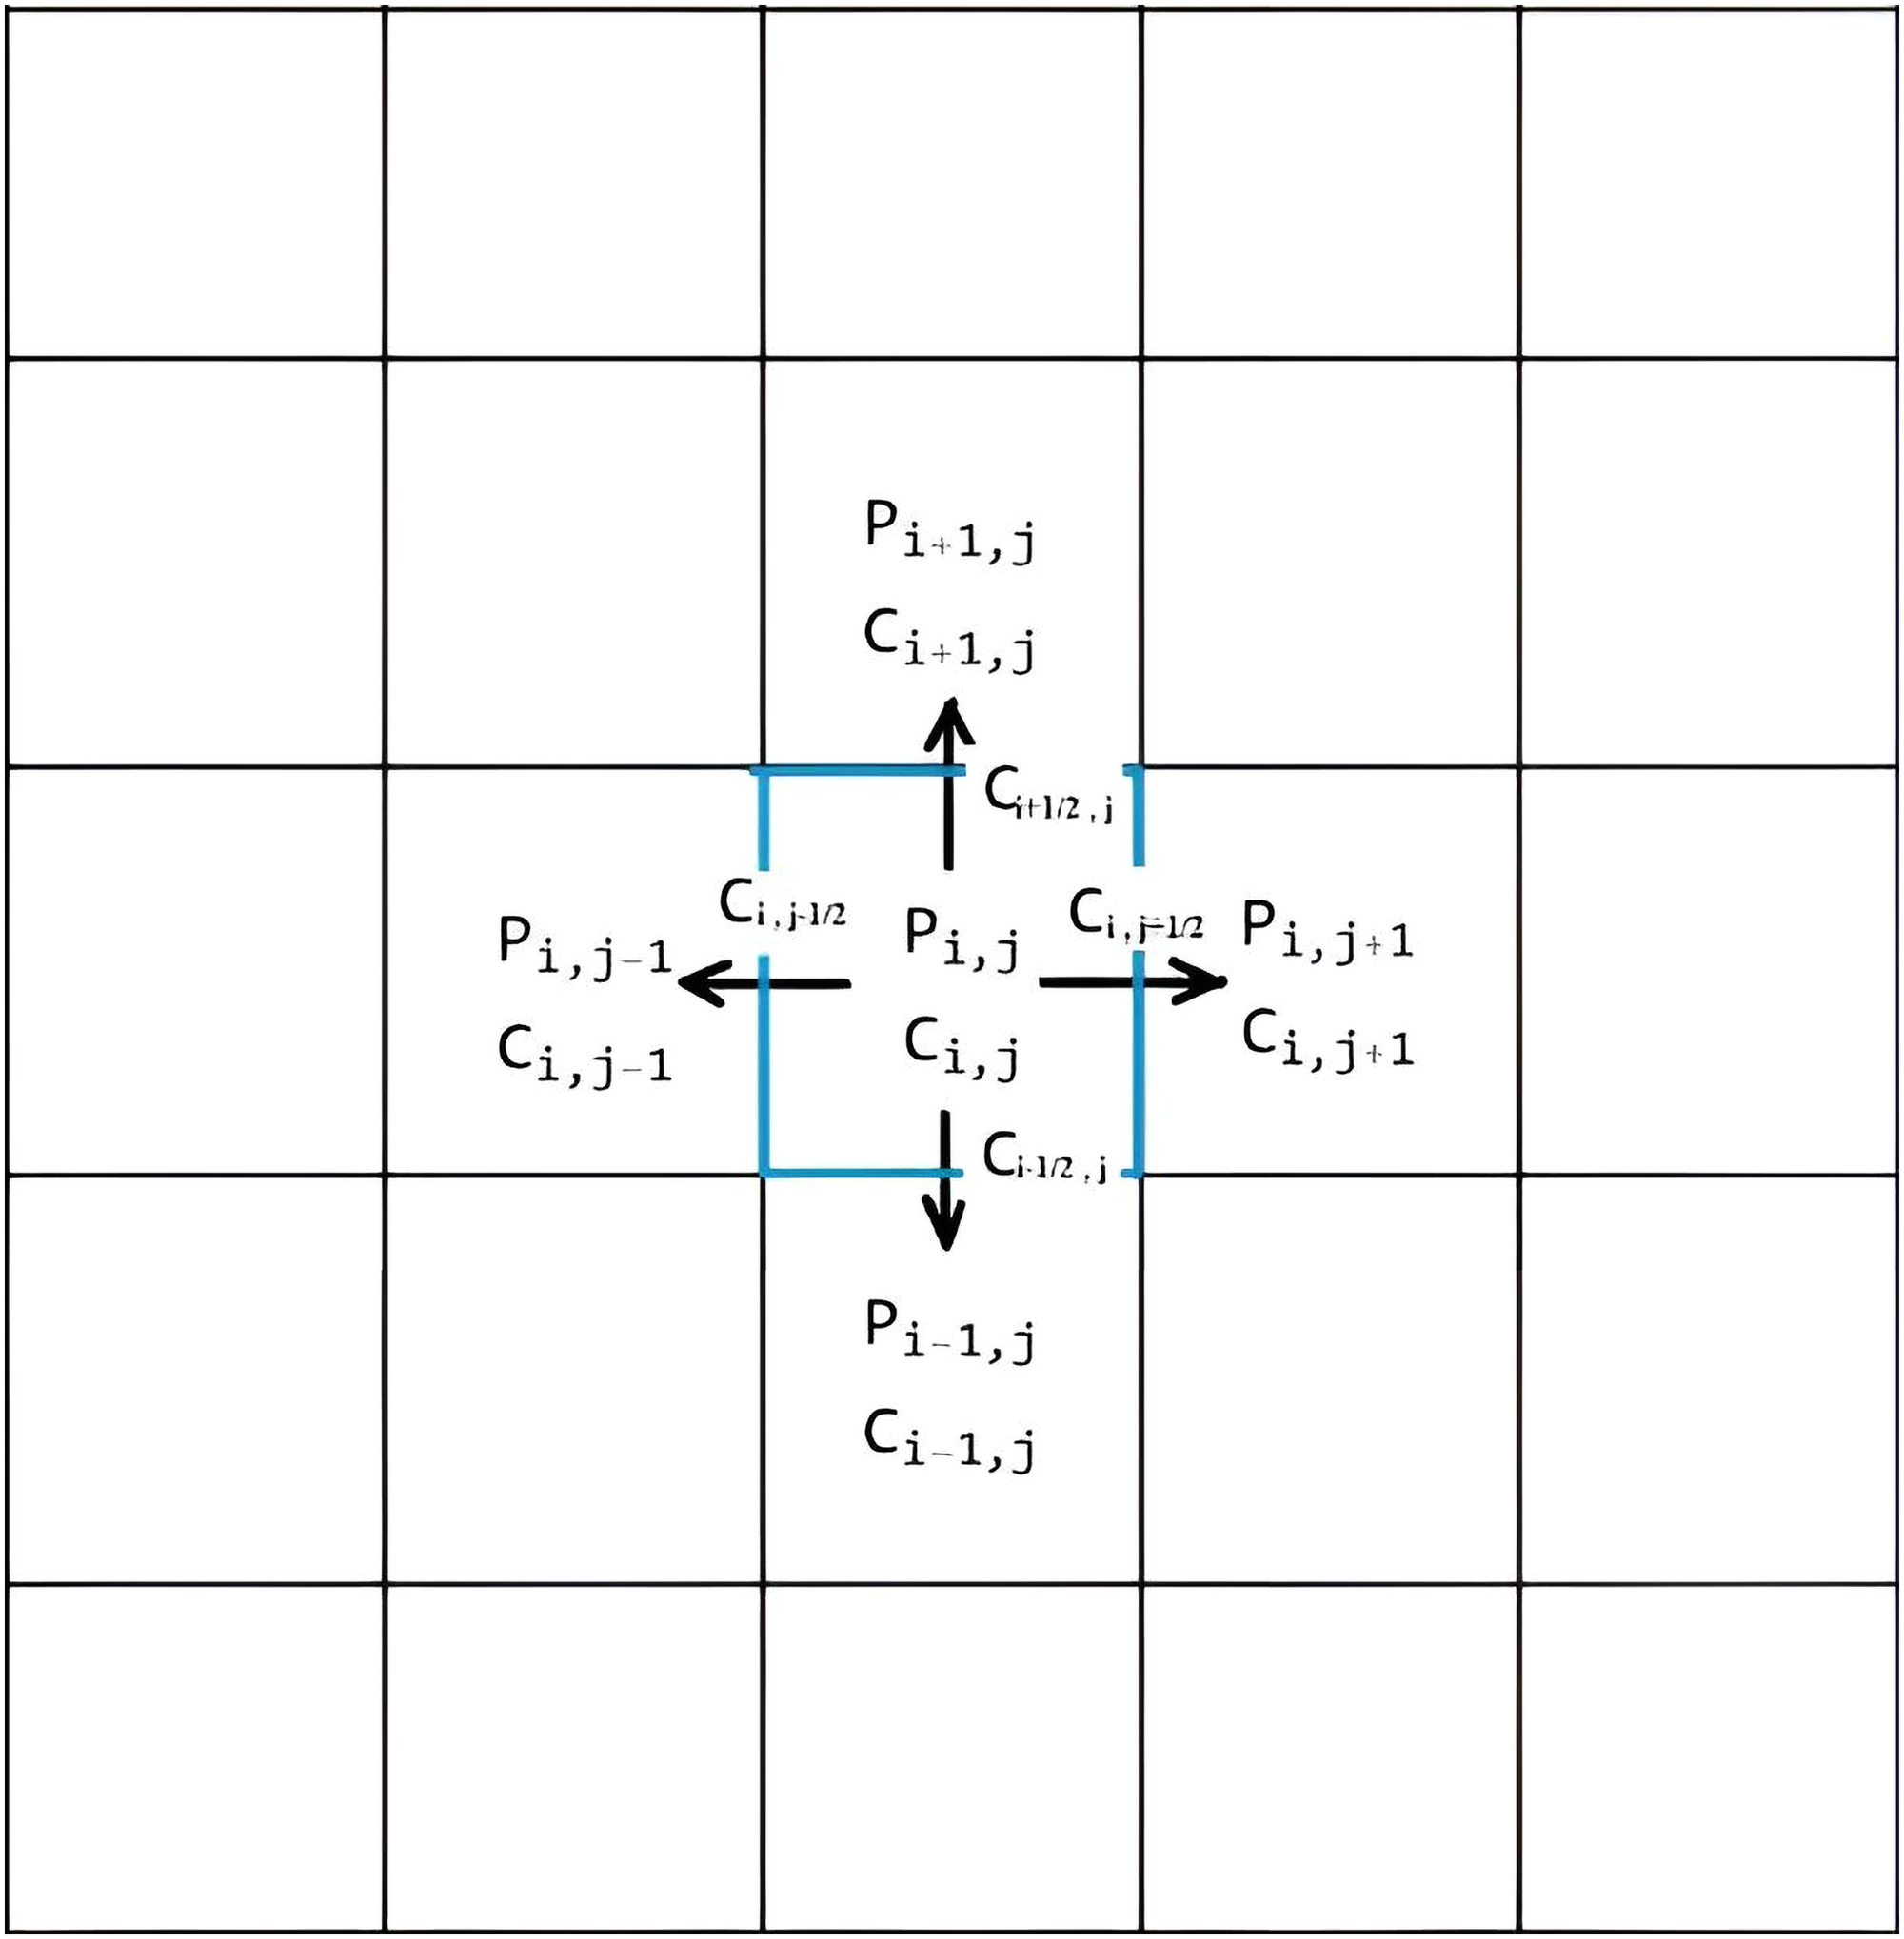
Structured discrete grid of the block center.
Likewise, this gives discretization of the fracturing fluid mass continuity equation as:


Proppant settling velocity (Stokes law).
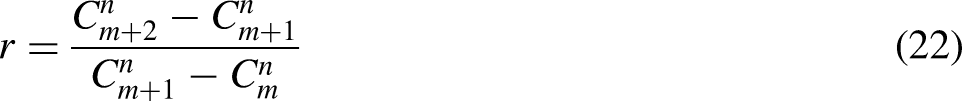
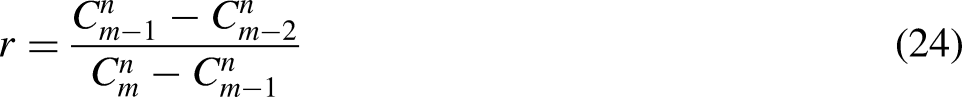
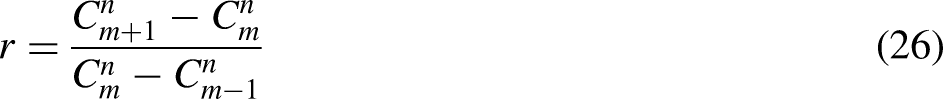
To increase the convergence of individual time steps, different coefficients were calculated with varying weights as per the significance of each coefficient. The permeability coefficients were calculated using a reconciliation and averaging method, that is: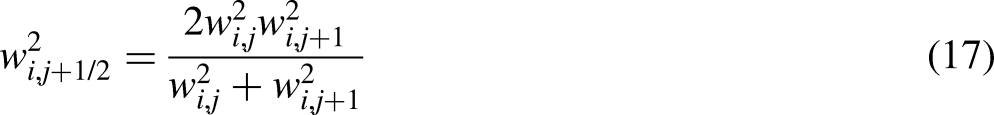


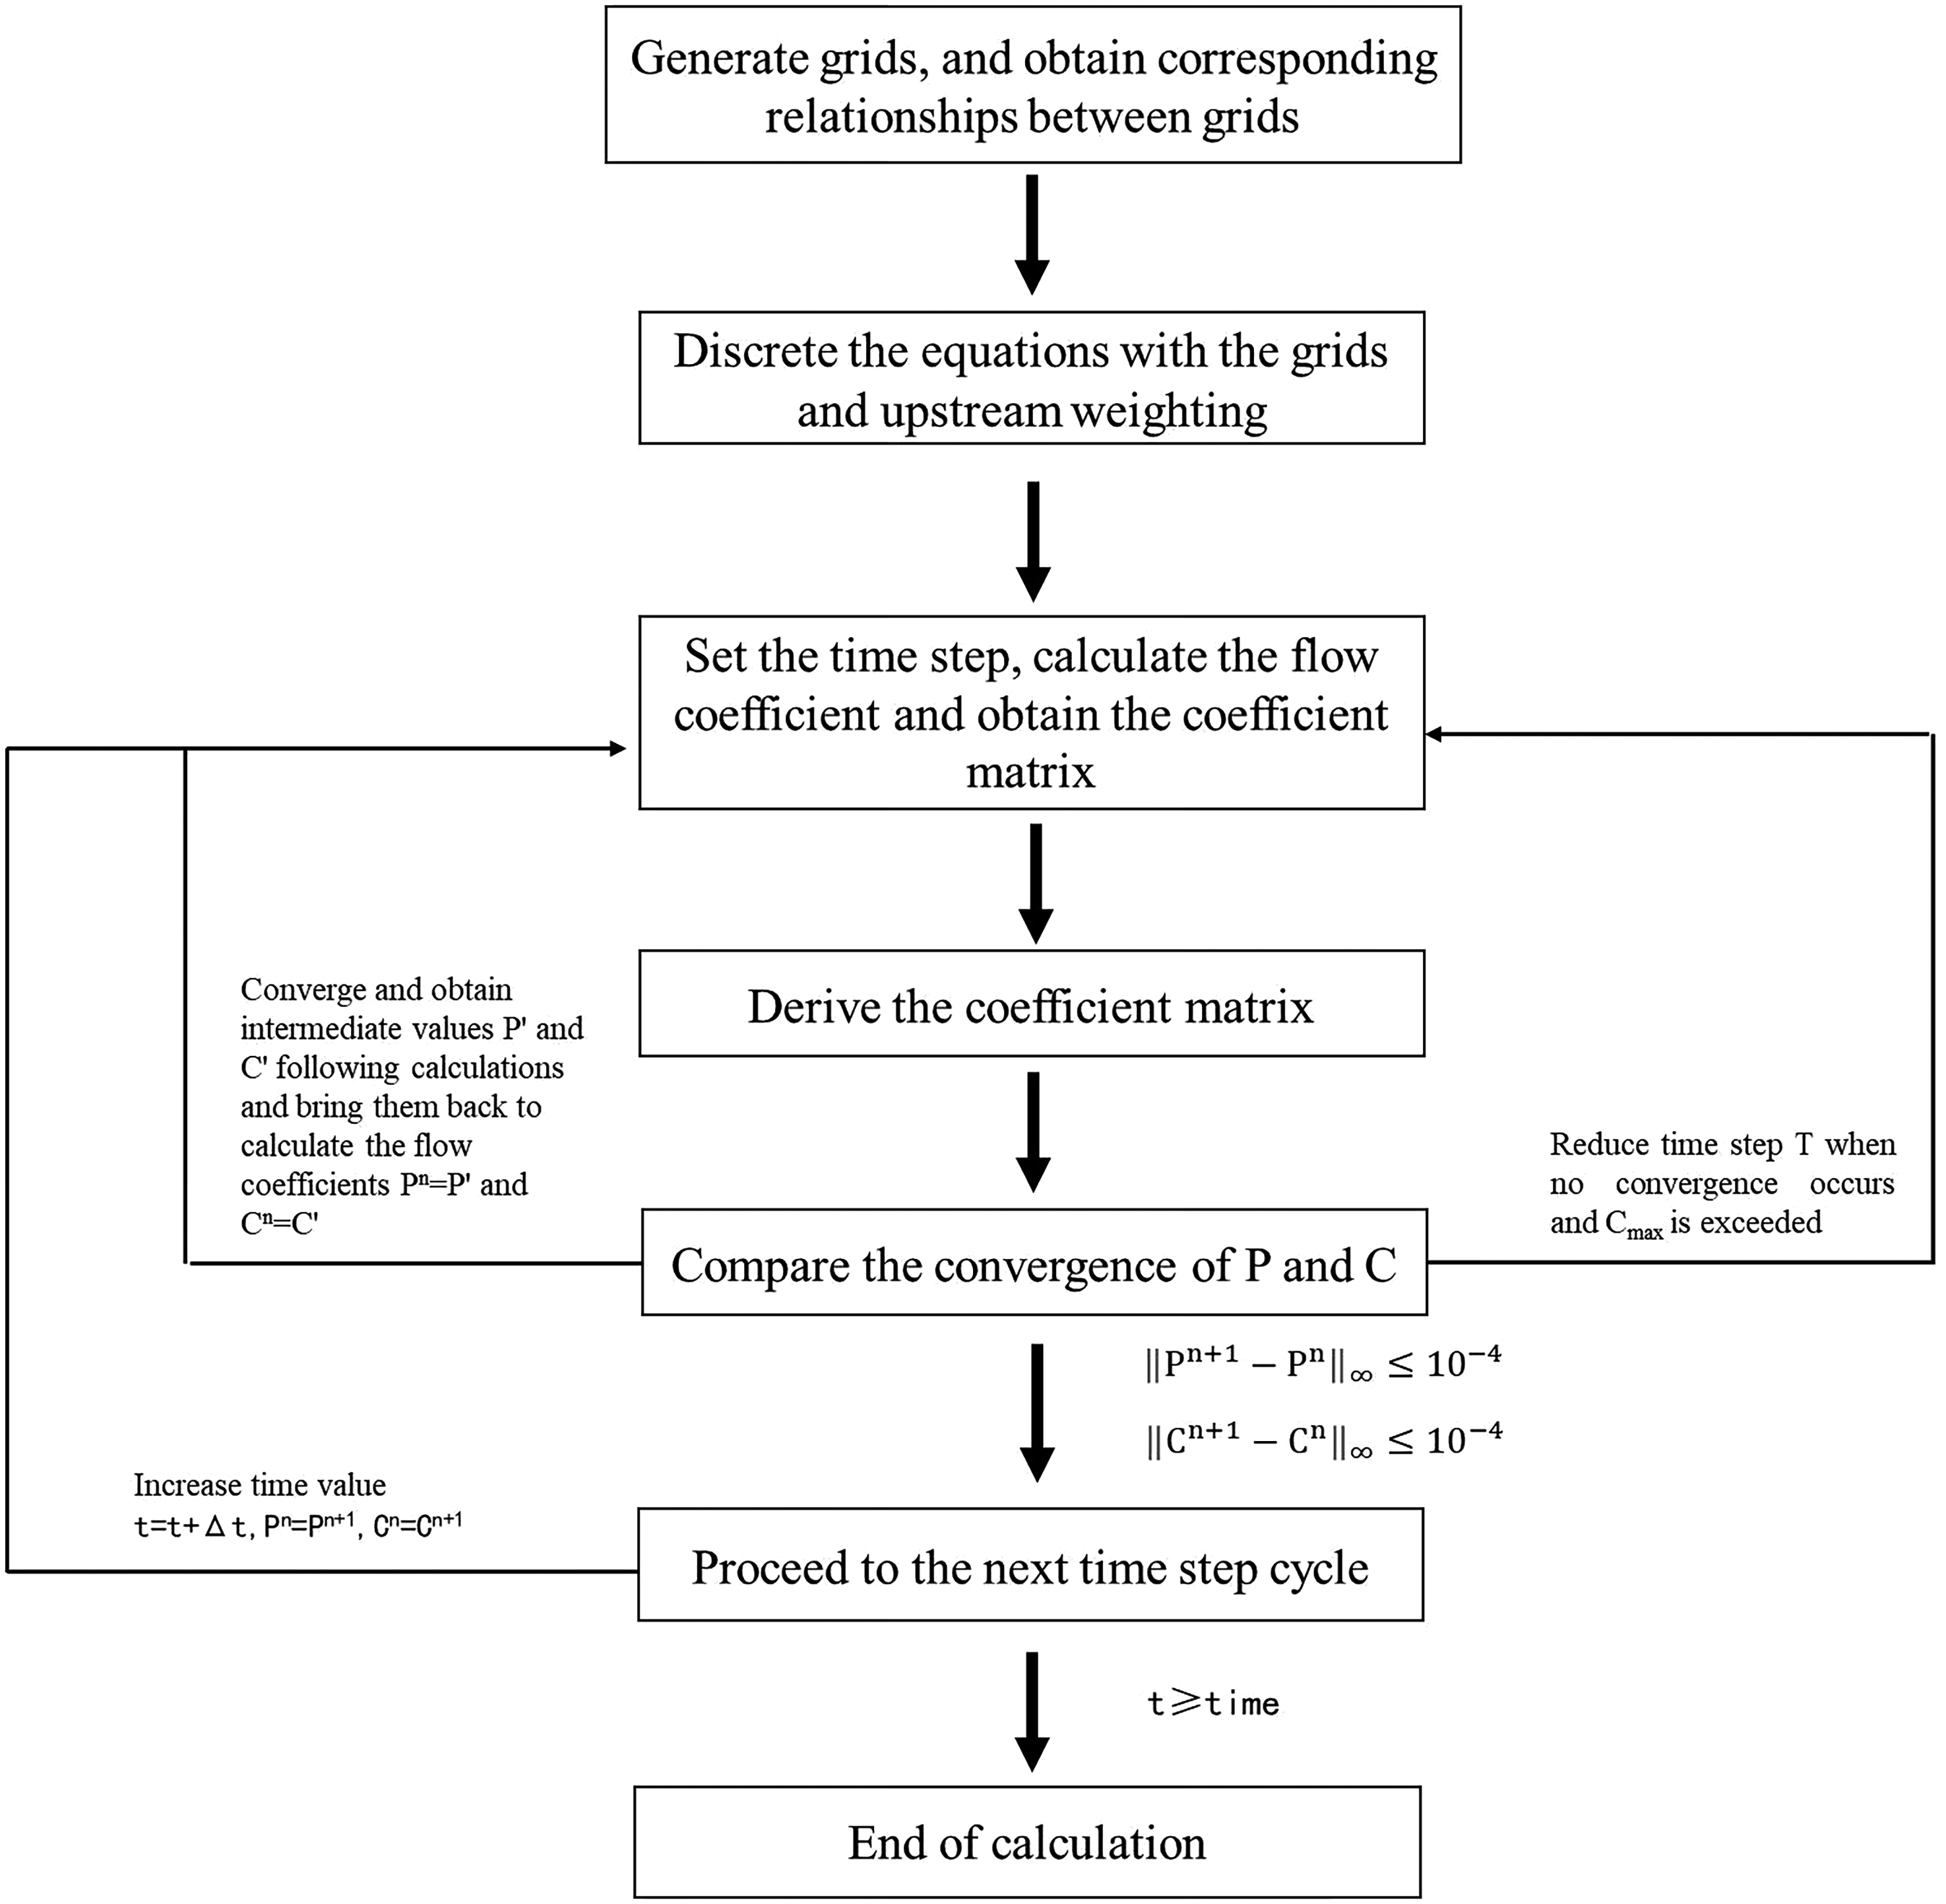
Iterative calculation process.
Results
The hydrodynamic and mechanical dynamic performance of proppant in fractures is affected by multiple factors (Brannon et al., 2005). The migration and sedimentation of proppant on plate fractures were simulated under different inlet and outlet conditions, different proppant parameters, different fracturing fluid parameters (viscosity) and different fracture morphologies (single fracture and branch fracture) as well as the final equilibrium height. The model was subjected to numerical simulations that adopted the parameters in physical model tests to verify its accuracy. The results of the simulation were compared with those of the physical model tests. The parameters in physical model tests are shown in Figure 4 (Brannon et al., 2005), where the fracture is a rectangular homogeneous one with a horn-shaped entrance and the injection is whole-surfaced.
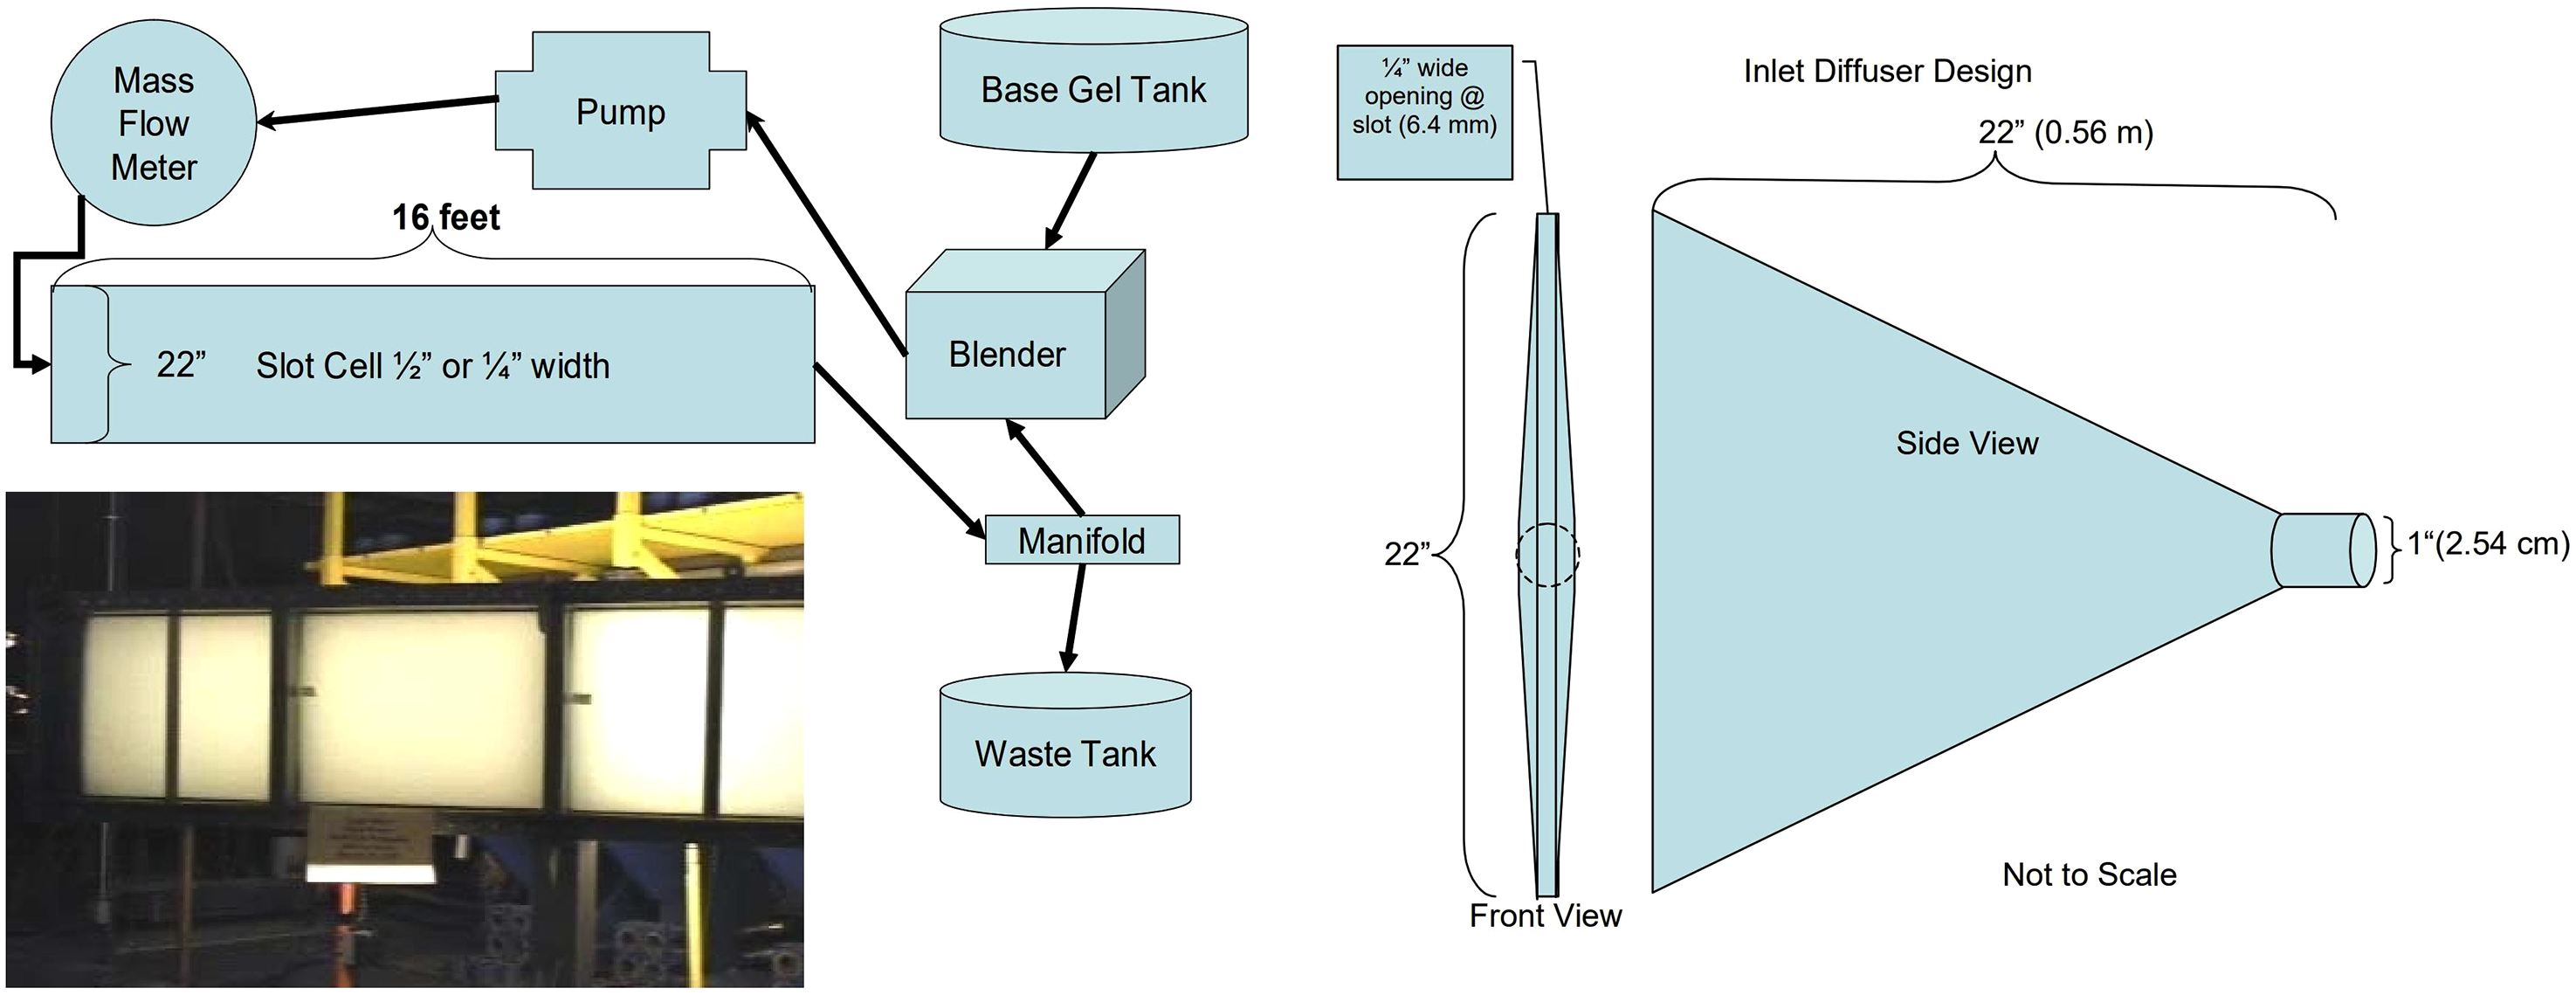
Indoor test devices.
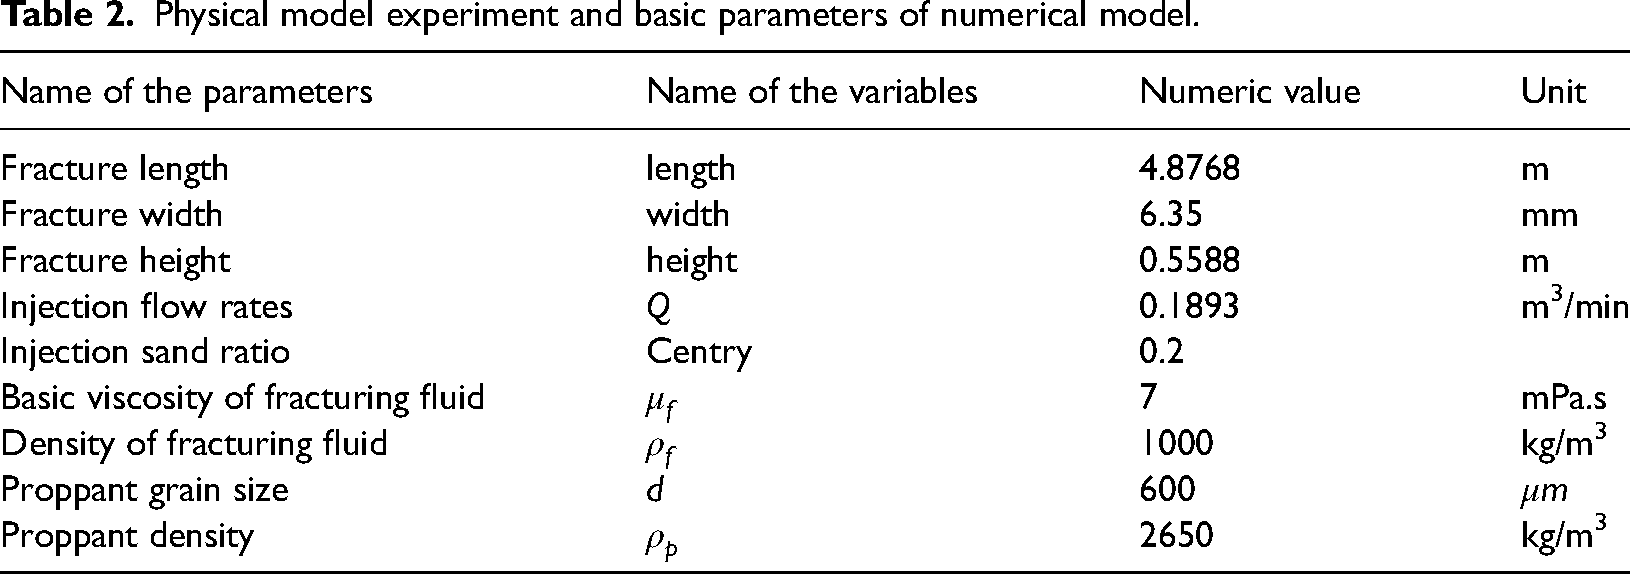
The parameters underlying the physical and numerical simulations are presented in Table 2 (Brannon et al., 2005):
Physical model experiment and basic parameters of numerical model.
The outlet end of the physical model test is the upper right outlet and, as shown in Figure 5, the sand dike has the following accumulation pattern as indicated by the test results.
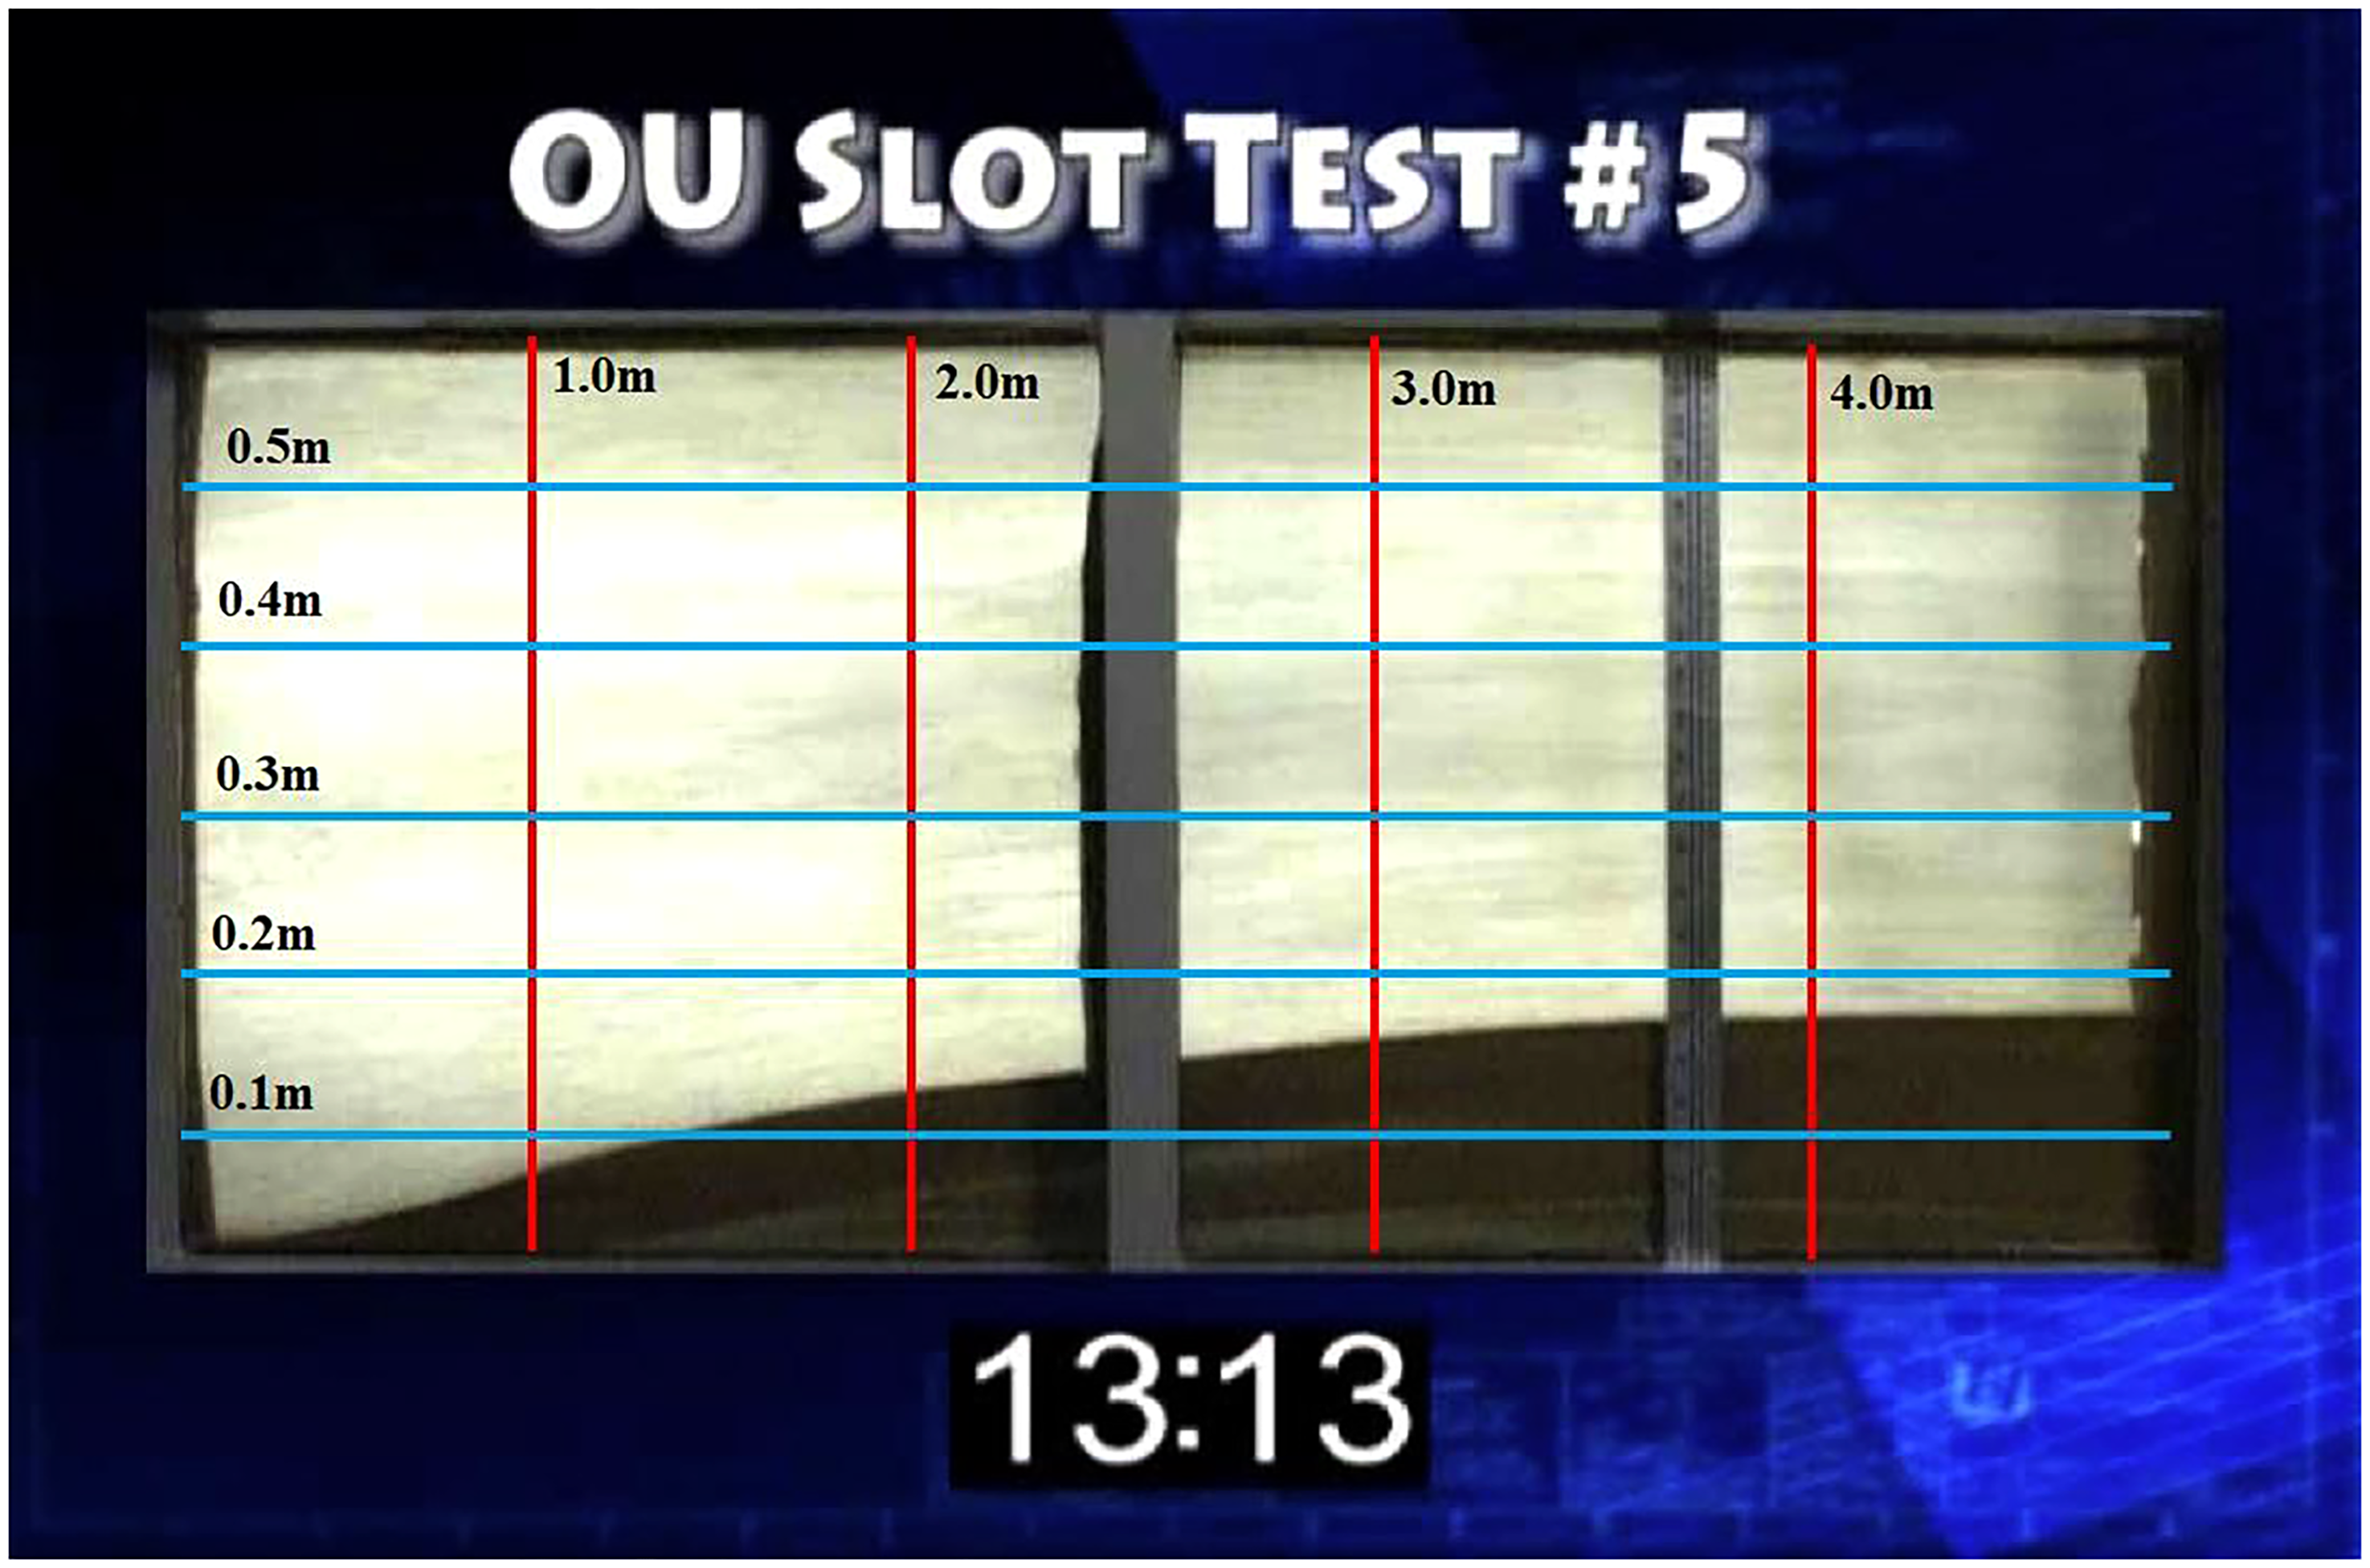
Height and shape of sand dike in physical model test.
The parameters of the numerical simulation model were set at the same conditions as those of the physical model tests and computed, as shown in Figure 6. As a result, the accumulation pattern of the proppant sand dike within the plate fracture at different time points could be obtained.
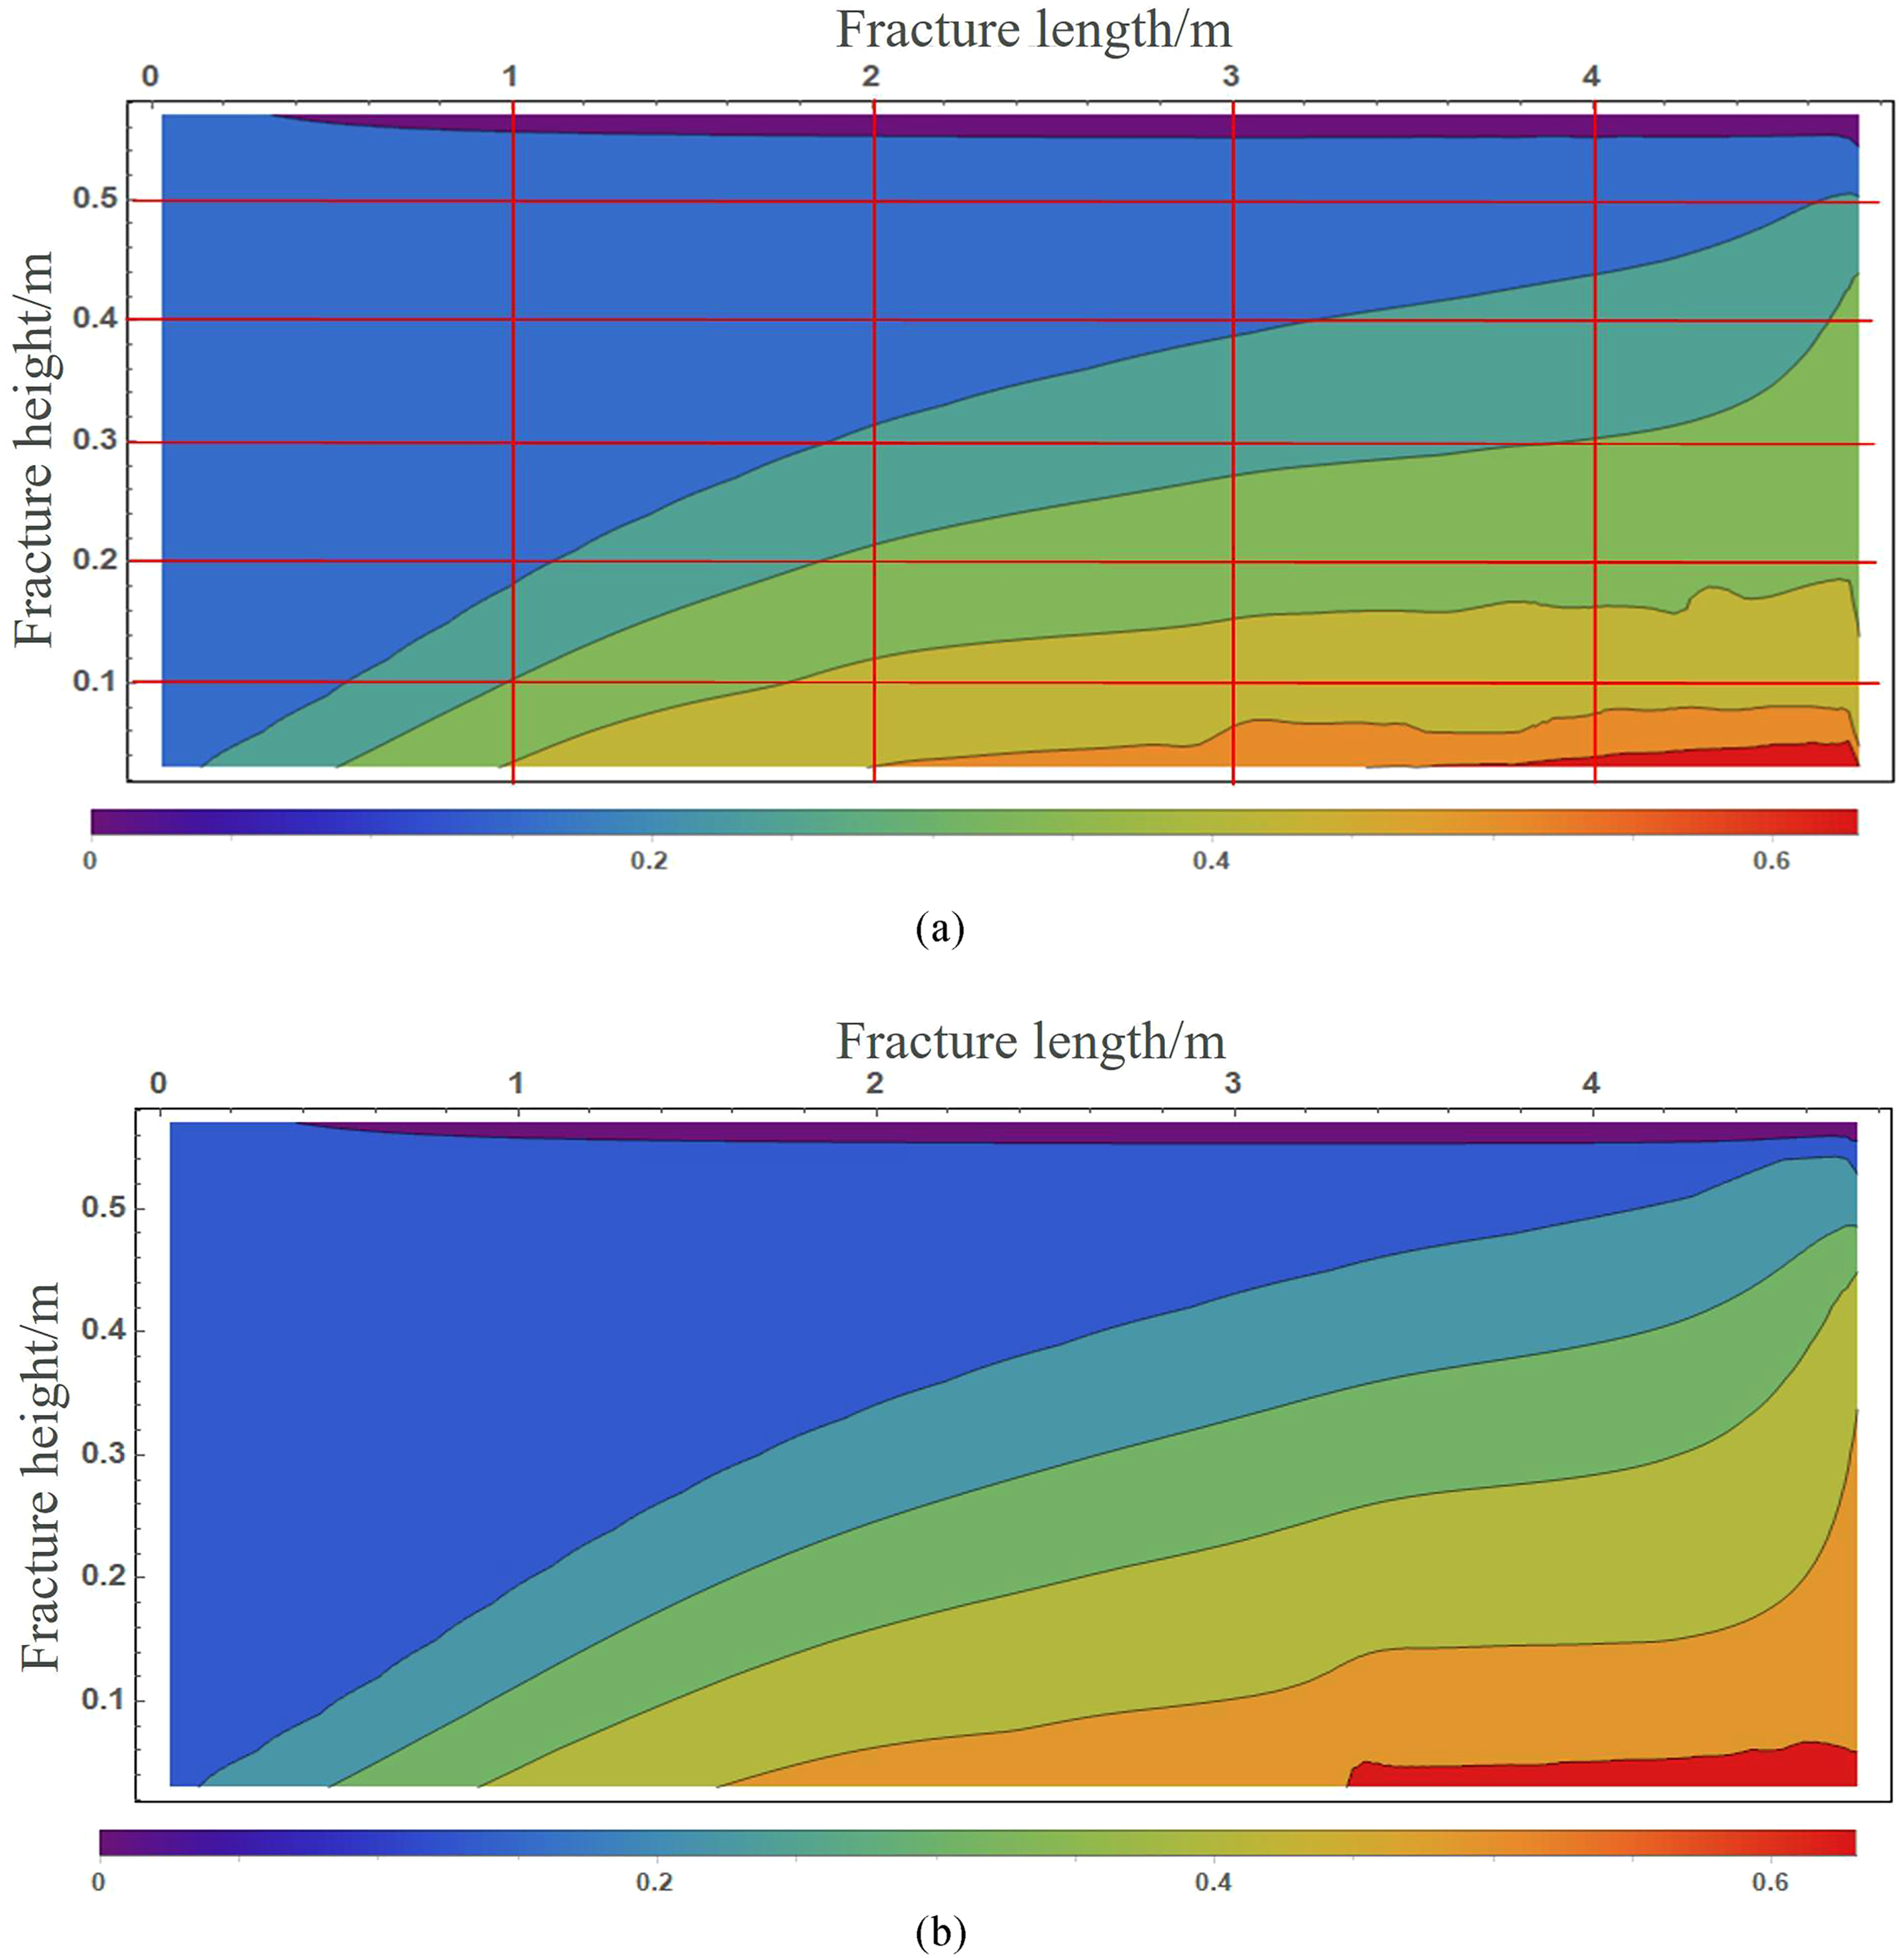
Numerical simulation of sand dike height and shape under the same parameters. (a) Intermediate morphology of sand dike accumulation. (b) Equilibrium morphology of sand dike accumulation.
By filling the foreground and background of the proppant placement area and non placement area, feature parameters are extracted to calculate the proppant coverage rate (Huang et al., 2021; Yin et al., 2023) (referring to the ratio of the proppant placement plane area to the crack plane area). In numerical simulation, the foreground color scale of the proppant filling part accounts for 18.10%, which means that the proppant coverage rate in the crack is 18.10%. The error between the physical experiment and the numerical model simulation result under the same conditions is 7.63% (Figure 7).
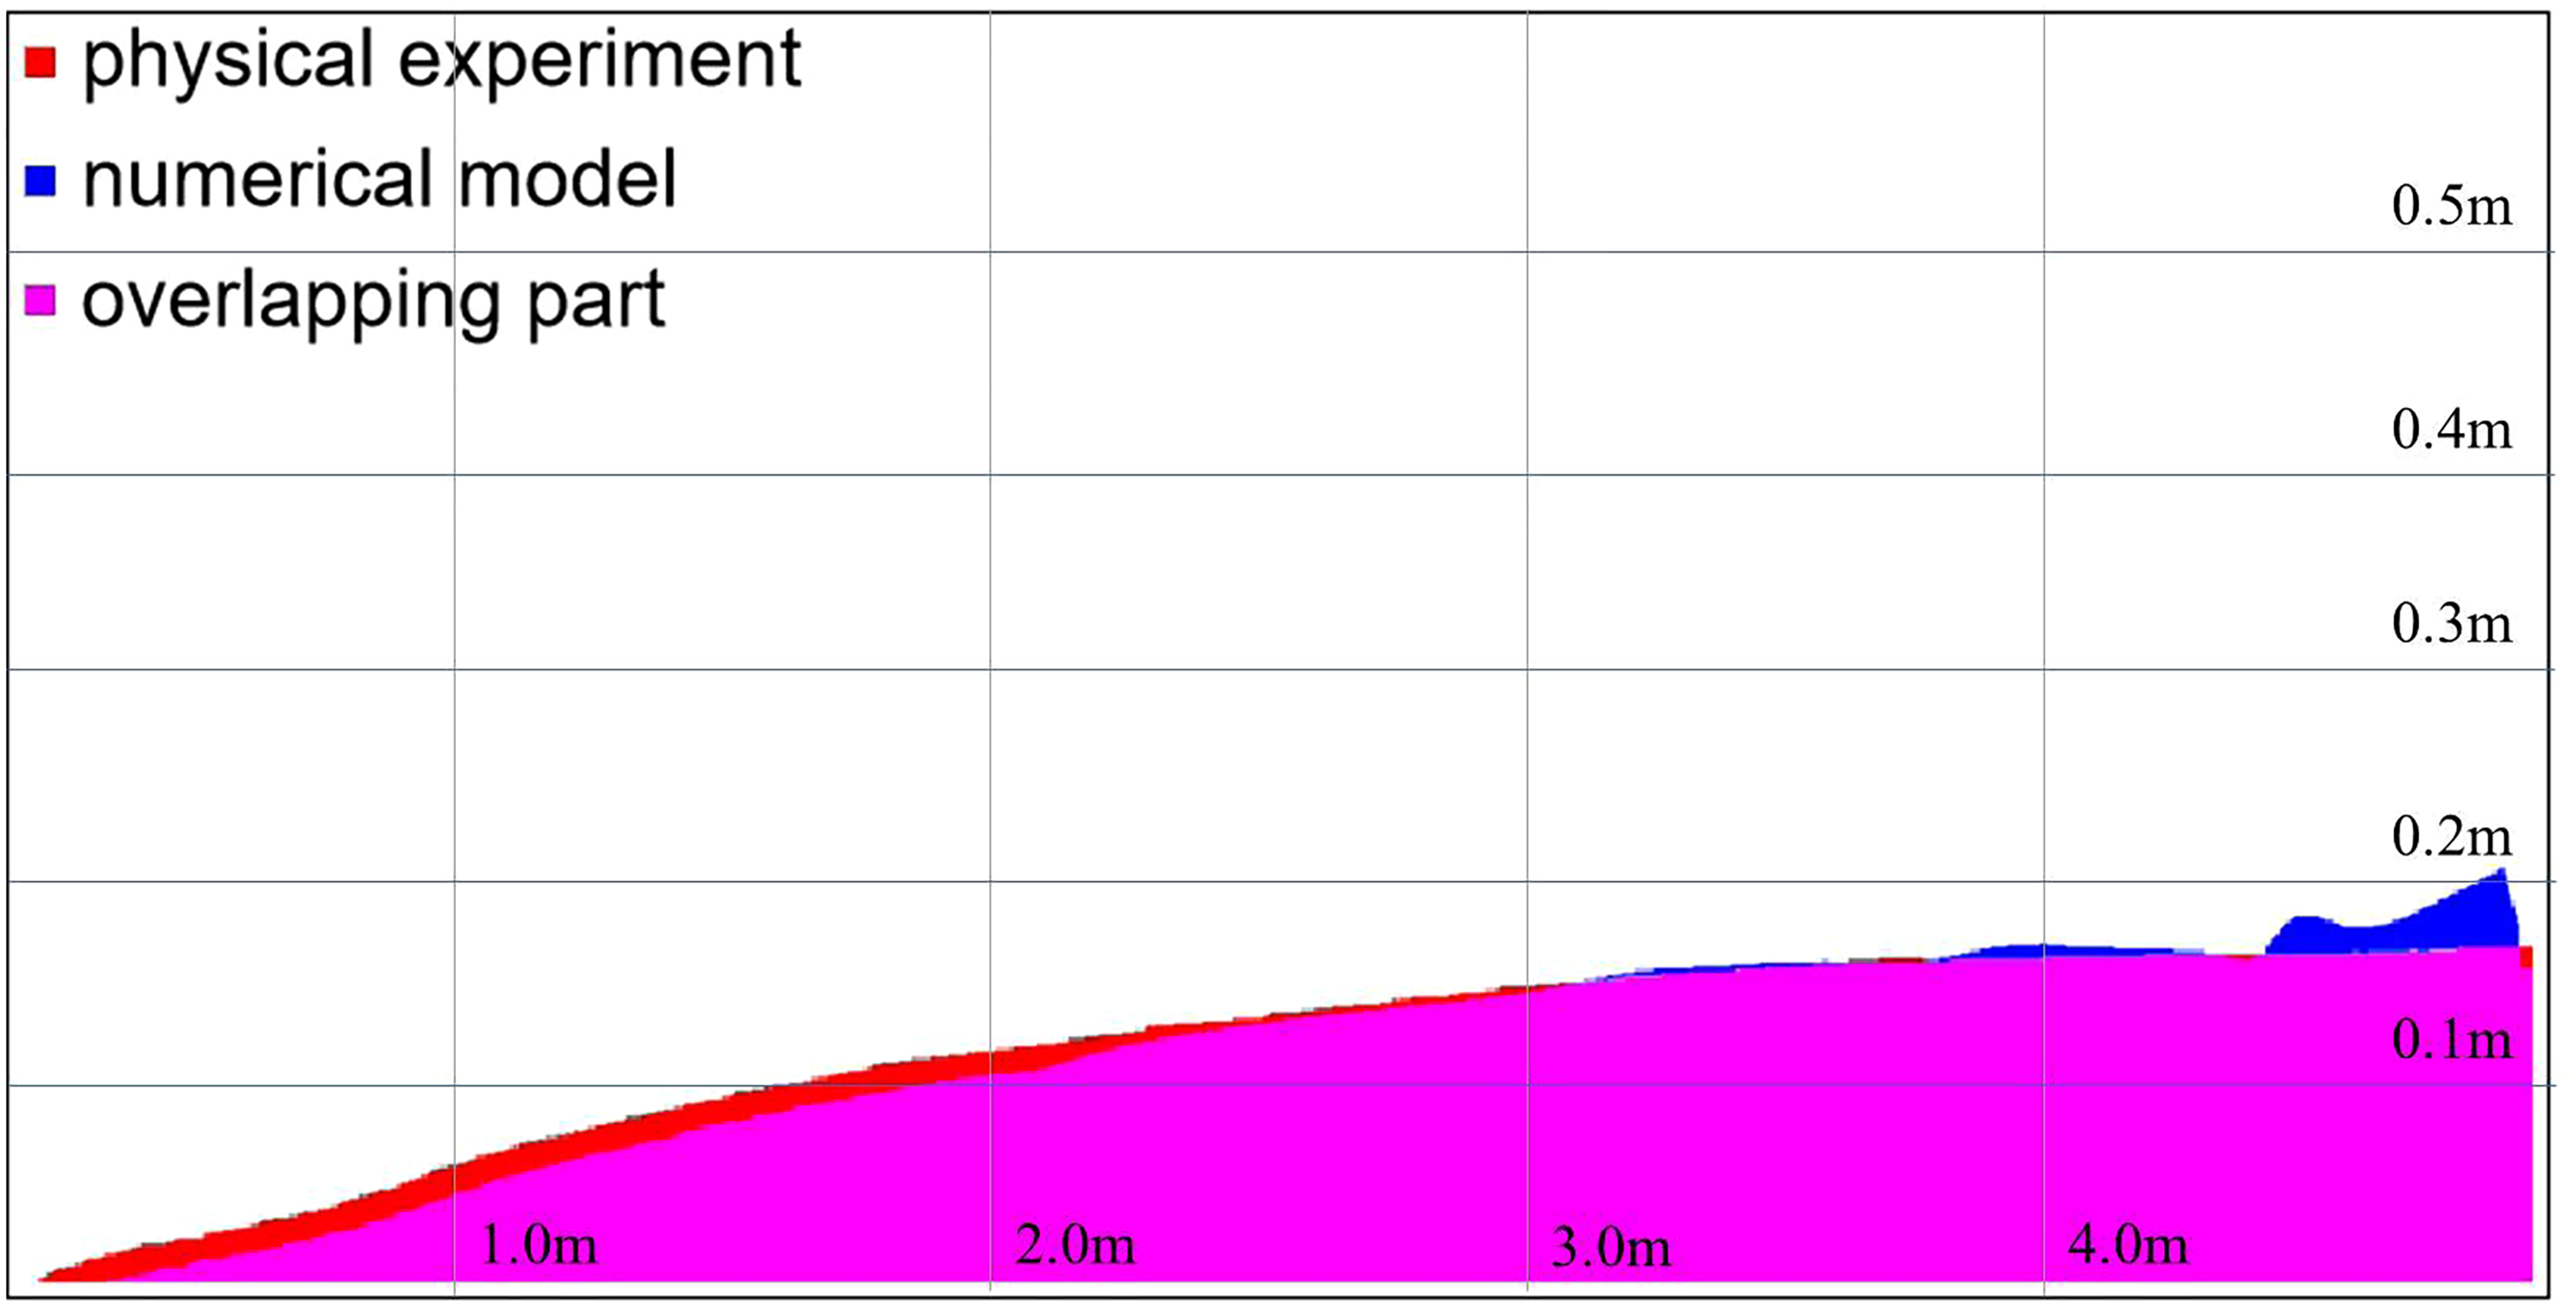
Comparison between physical experiment and numerical model simulation result.
An analysis of the physical and numerical models reveals that the sand dikes at the inlet are scoured by the inflowing fracturing fluid and will tend to accumulate at the distal end of the fracture. The outlet is at the upper end of the plate fracture and the lower end of the outlet flows more slowly and tends to produce a buildup of proppant deposits. The sand dike progressively builds up from the distal end of the fracture towards the inlet, so the change in deposit elevation is subdued below the inlet, while more significant at the inlet. The results of this model match well with the test results of the physical model when it comes to the accumulation morphology of the sand dike, which fully verifies the accuracy of the model and the correctness of the discrete solution method based on the FVM. The results achieved by the model fit well with those of the physical model tests on the sand dike accumulation pattern, and this gives a strong indication of the accuracy of the model and the correctness of the discrete solution method based on FVM.
Discussion
During hydraulic fracturing, the cross-sectional shape of vertical fractures in the well is not of even width, but rather elliptical in shape. As such, areas with larger fracture widths have higher permeability, faster flow of fracturing fluid and better sand-laden effect. The fracture shape is therefore a significant factor the distribution of proppant migration and sedimentation in the fracture.
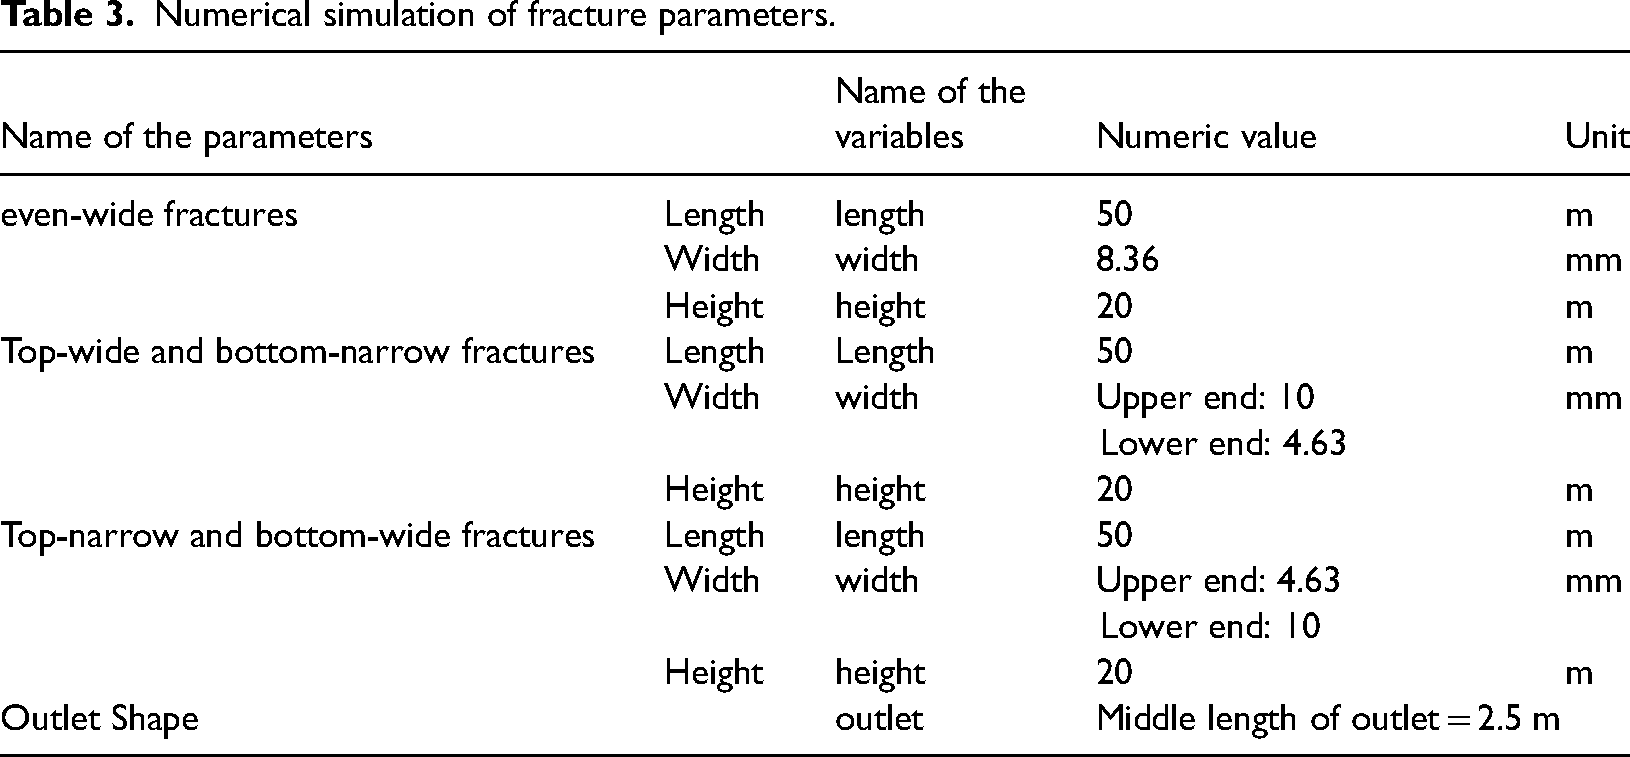
The fracture scale, injection parameters and fracture morphology of the actual well were applied to establish a numerical model of the fracture and the associated proppant and injection parameters as shown in Table 3, Figure 8 and Table 4. This was followed by an analysis of how different fracture morphologies, together with different injection flow rates, fracturing fluid viscosities, proppant densities, proppant grain sizes and injection sand ratios, affected proppant migration and sedimentation.
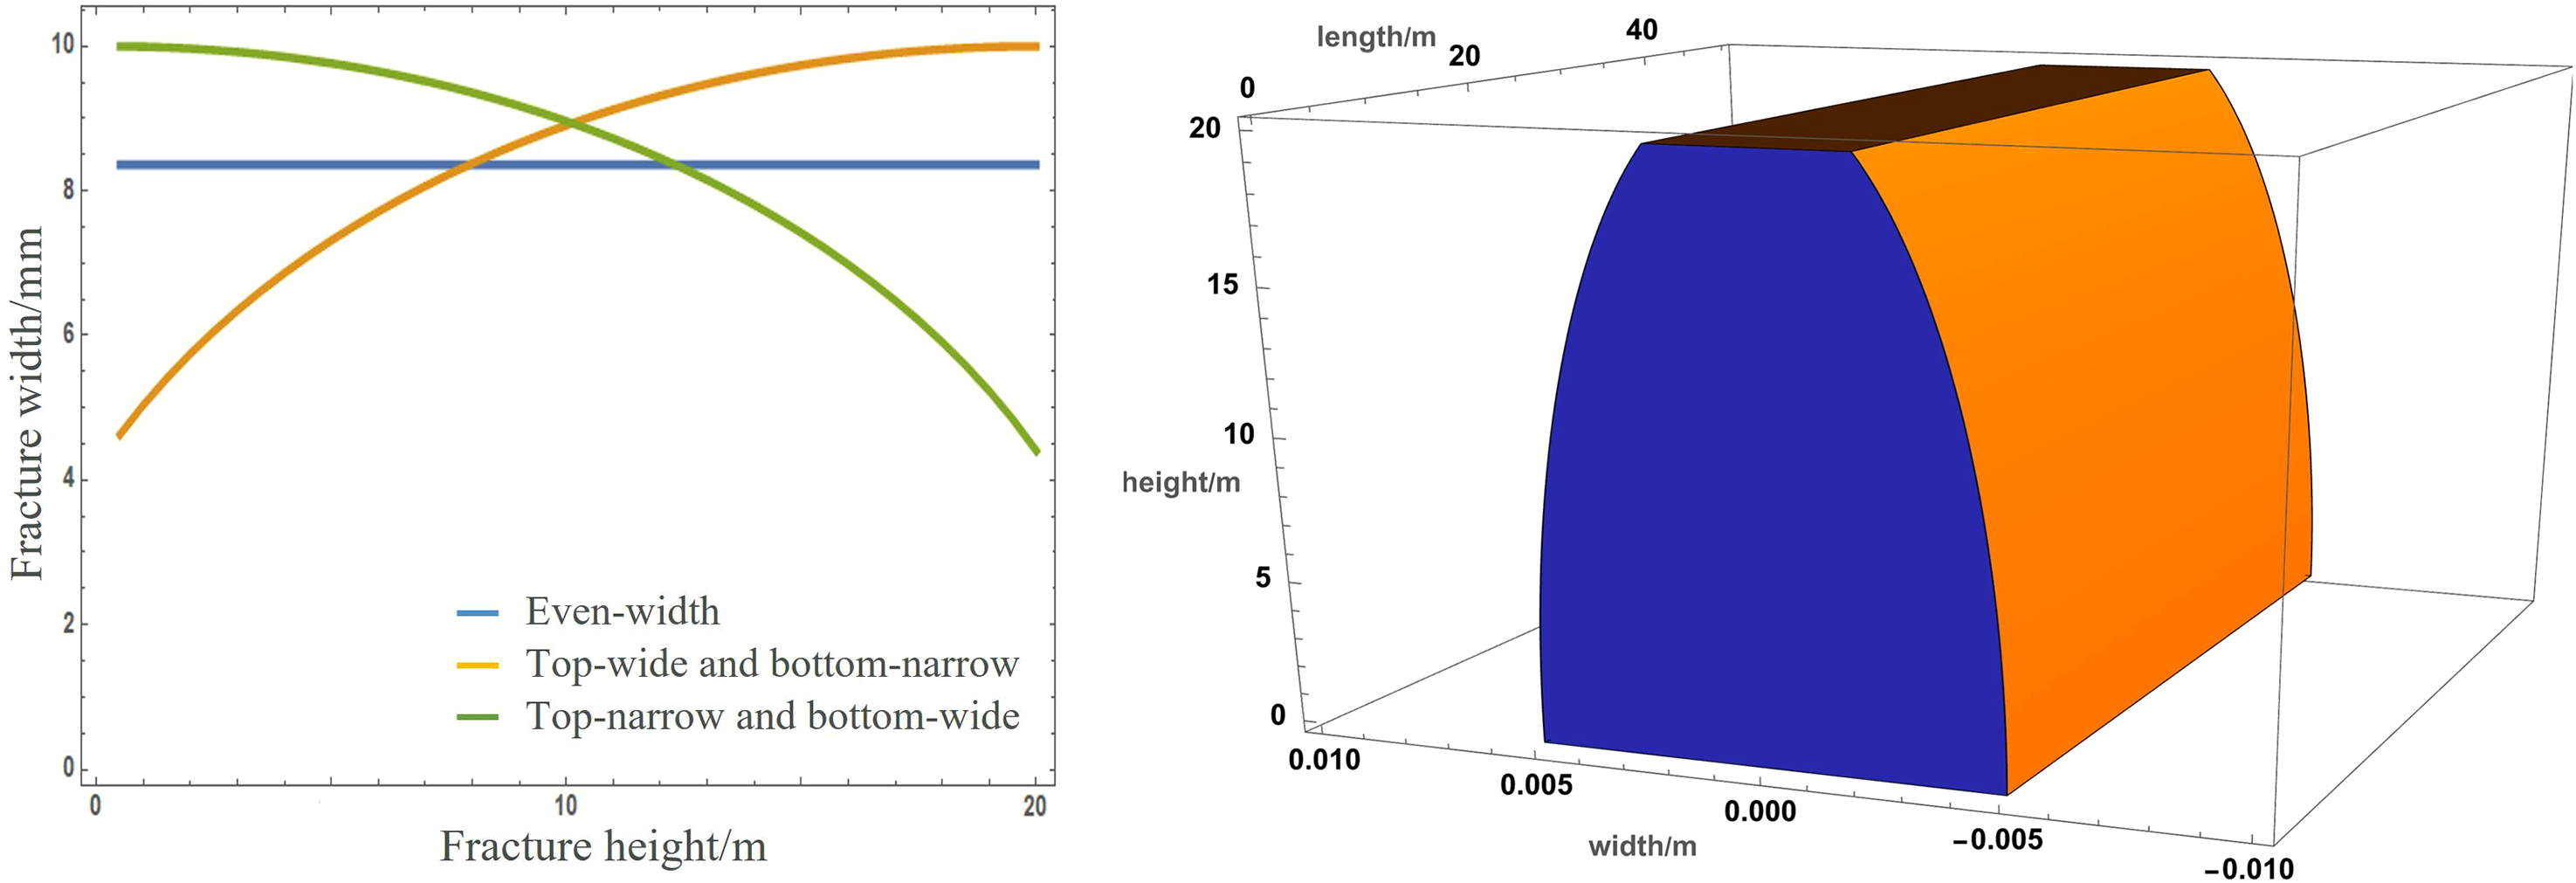
Schematic diagram of fracture width distribution.
Numerical simulation of fracture parameters.
Basic parameters of numerical simulations.
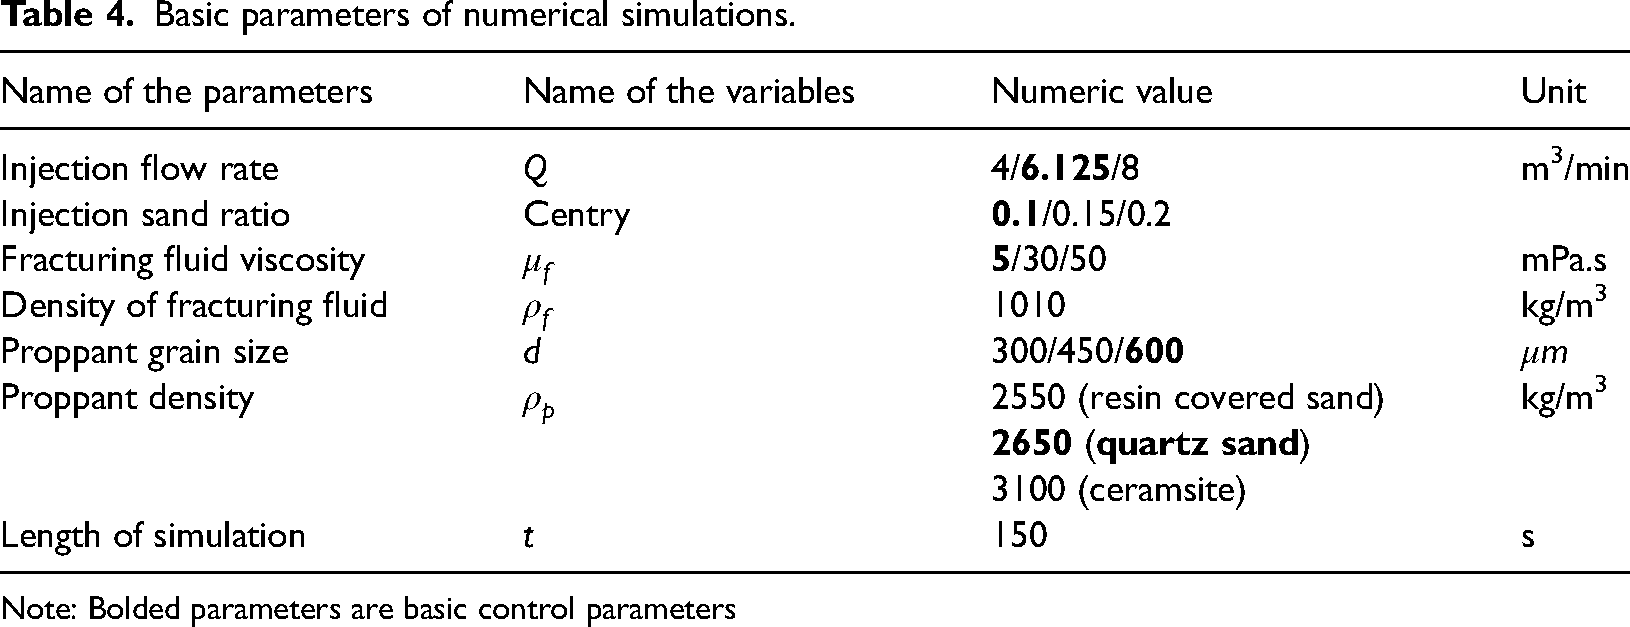
Note: Bolded parameters are basic control parameters
Three valid values for each of the injection flow rate, injection sand ratio, fracturing fluid viscosity, proppant grain size and proppant density factors were designed, followed by subsequent comparison and analysis, as shown in Table 4.
Comparisons and analyses were made by simulating the effects of different parameters, mainly the forward position, the effective sweeping range of the suspended load (Singh et al., 2022) and homogeneity within the range (concentration variance within the effective sweeping range of the suspended load) on proppant migration and sedimentation.

Fracture morphology
The morphology of the fracture has a relatively significant effect on the transport and distribution of proppant (Figure 9). The proppant displacement front of the wide fracture appears to advance in a straight line, with a more uniform overall distribution. The proppant builds up from the inlet to the outlet from the bottom.
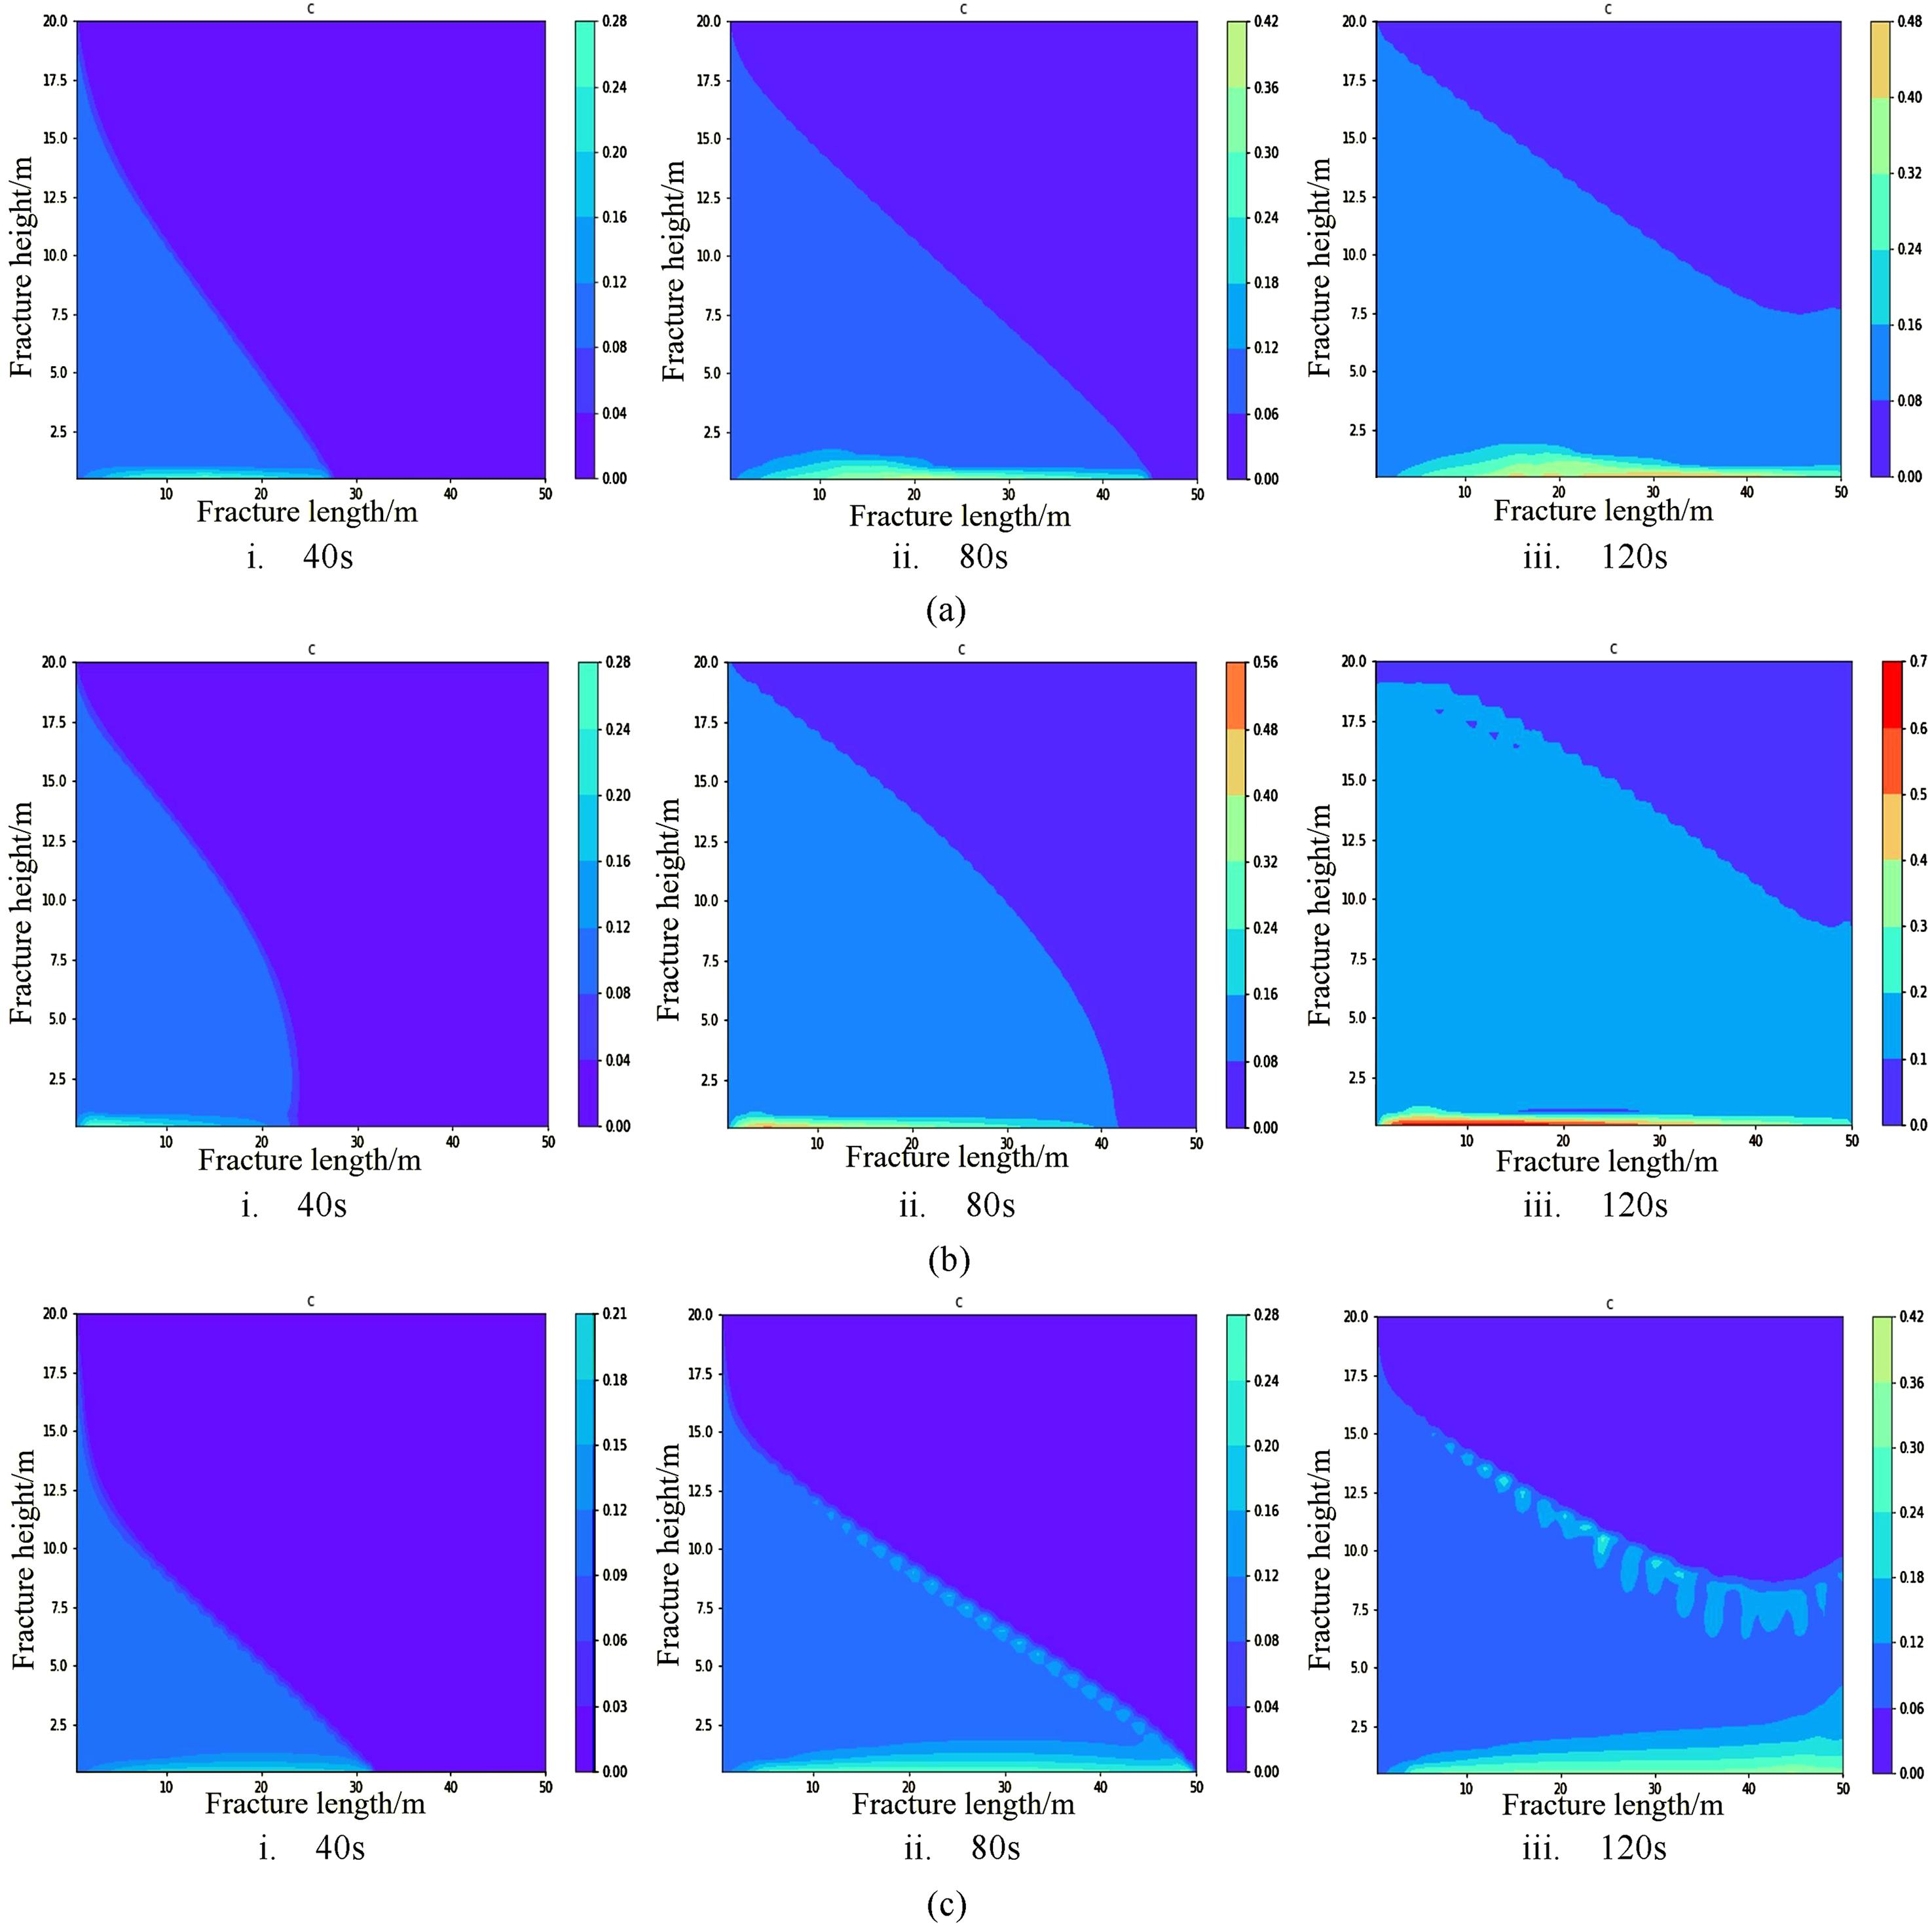
Proppant concentration distribution in different fracture forms at different times. (a) Distribution of proppant concentration in even-wide fractures at various times. i. 40 s. ii. 80 s. iii. 120 s. (b) Distribution of proppant concentration in the top-wide and bottom-narrow fractures at various times. i. 40 s. ii. 80 s. iii. 120 s. (c) Distribution of proppant concentration in top-narrow and bottom-wide fractures at various times. i. 40 s. ii. 80 s. iii. 120 s.
Permeability is greater in the upper part of the fracture and smaller in the lower part, so the proppant displacement front advances faster than the lower part of the fracture at the same flow rate. The proppant front advances more slowly in the early stage, and the proppant accumulation at the inlet is more obvious, with greater maximum concentration and more significant deposition effect. In the later stage, due to the supplemental effect of proppant deposition from above, advance speed of the front is consistent with the even-wide fracture, and the shape and angle of advance of the displacement front slowly approaches that of the even-wide fracture.
The top-narrow and bottom-wide fractures exert greater influence on the migration and distribution of proppant. As the high-permeability area is distributed in the lower part of the fracture, the amount of proppant entering the upper part of the fracture is relatively low.
The high permeability area is located in the lower part of the fracture, so the upper part of the fracture has less proppant entry and a faster migration velocity can be observed at the lower front.
Driven by greater transport and carry-over effect, the proppant is not deposited in the upper part, but accumulates at the front of the repulsion, so the effective sweeping range of suspended load becomes smaller.
It can be concluded from Figures 9 and 10 that the proppant front moves fastest in top-wide and bottom-narrow fractures, with the inhomogeneity degree of suspended load for the proppant being higher in the early stage and lower in the later stage. This is attributed to a lower fracture permeability in the lower part. During the early stage of injection, gravity at the lower part and the fracture permeability work together to slow down the proppant migration, resulting in a high degree of inhomogeneity of the suspended load. In the later stages, out of greater gravity in the lower part, the proppant is suspended in the upper part. As such, the top-wide and bottom-narrow fractures are preferred when it comes to the extent of suspended load.
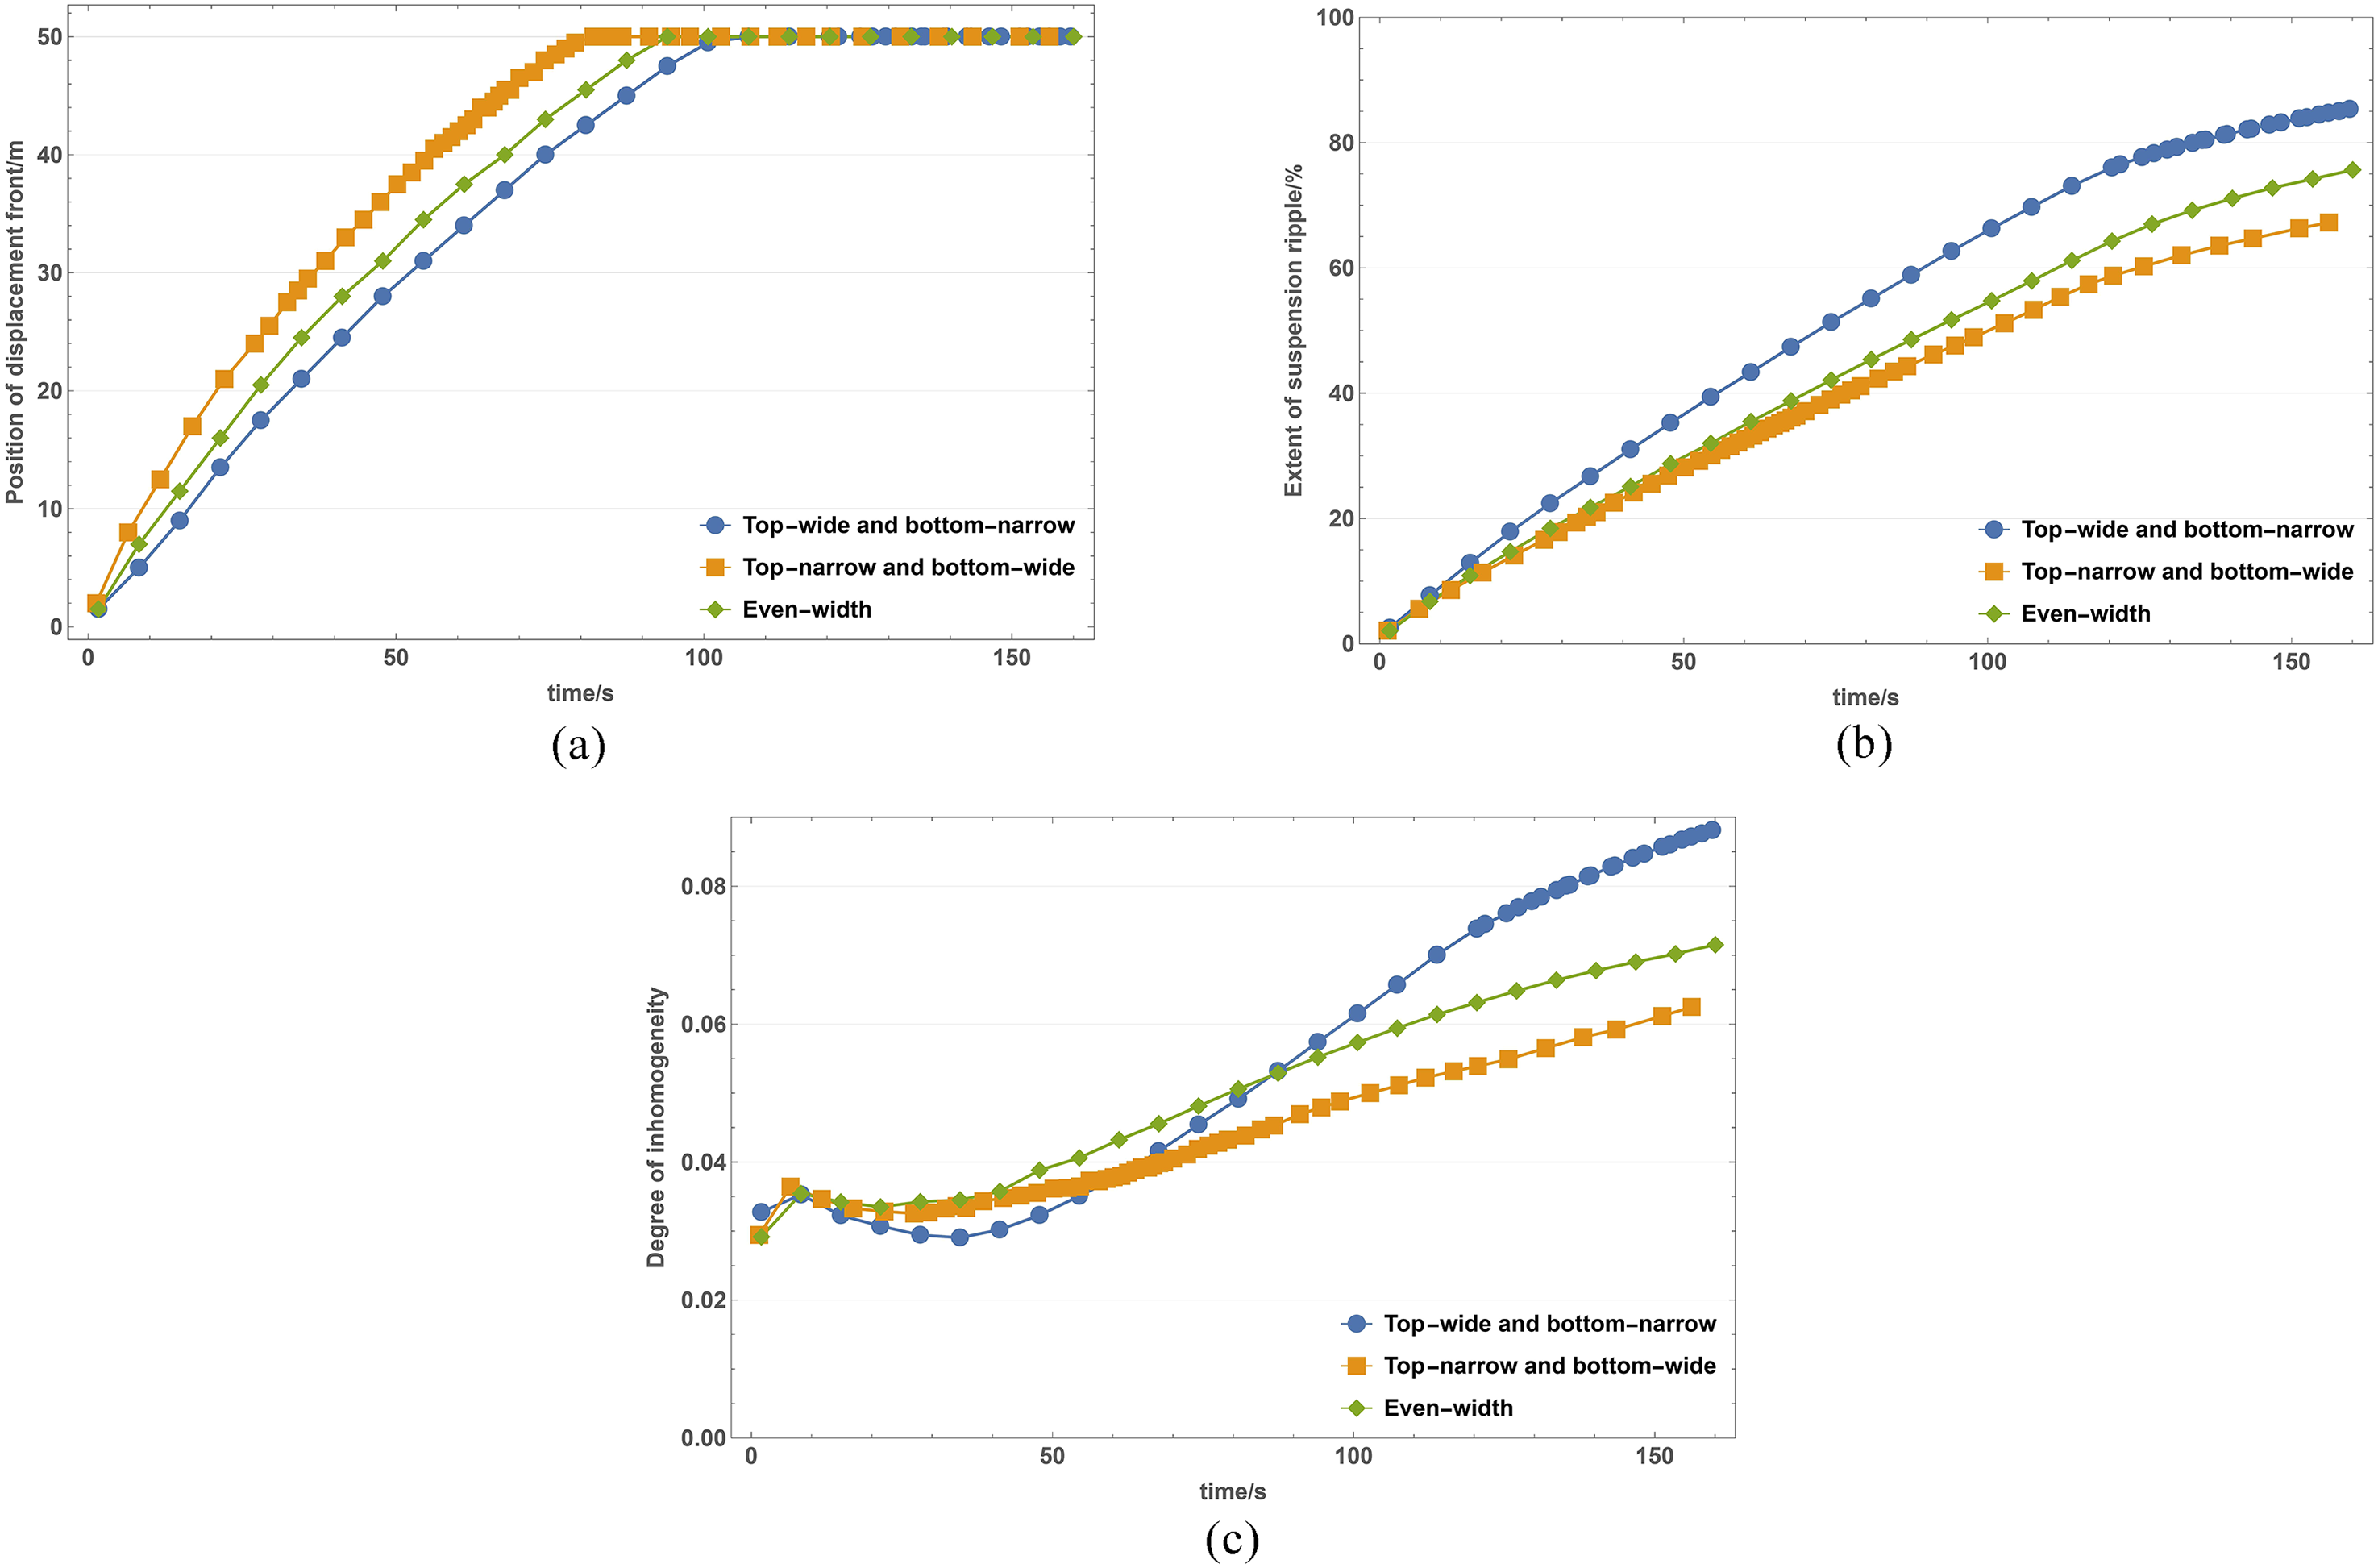
Influence of fracture morphology on proppant parameters. (a) Location of the displacement front. (b) Range at which suspended load sweeps. (c) Level of inhomogeneity in the sweeping range.
Fracturing fluid displacement
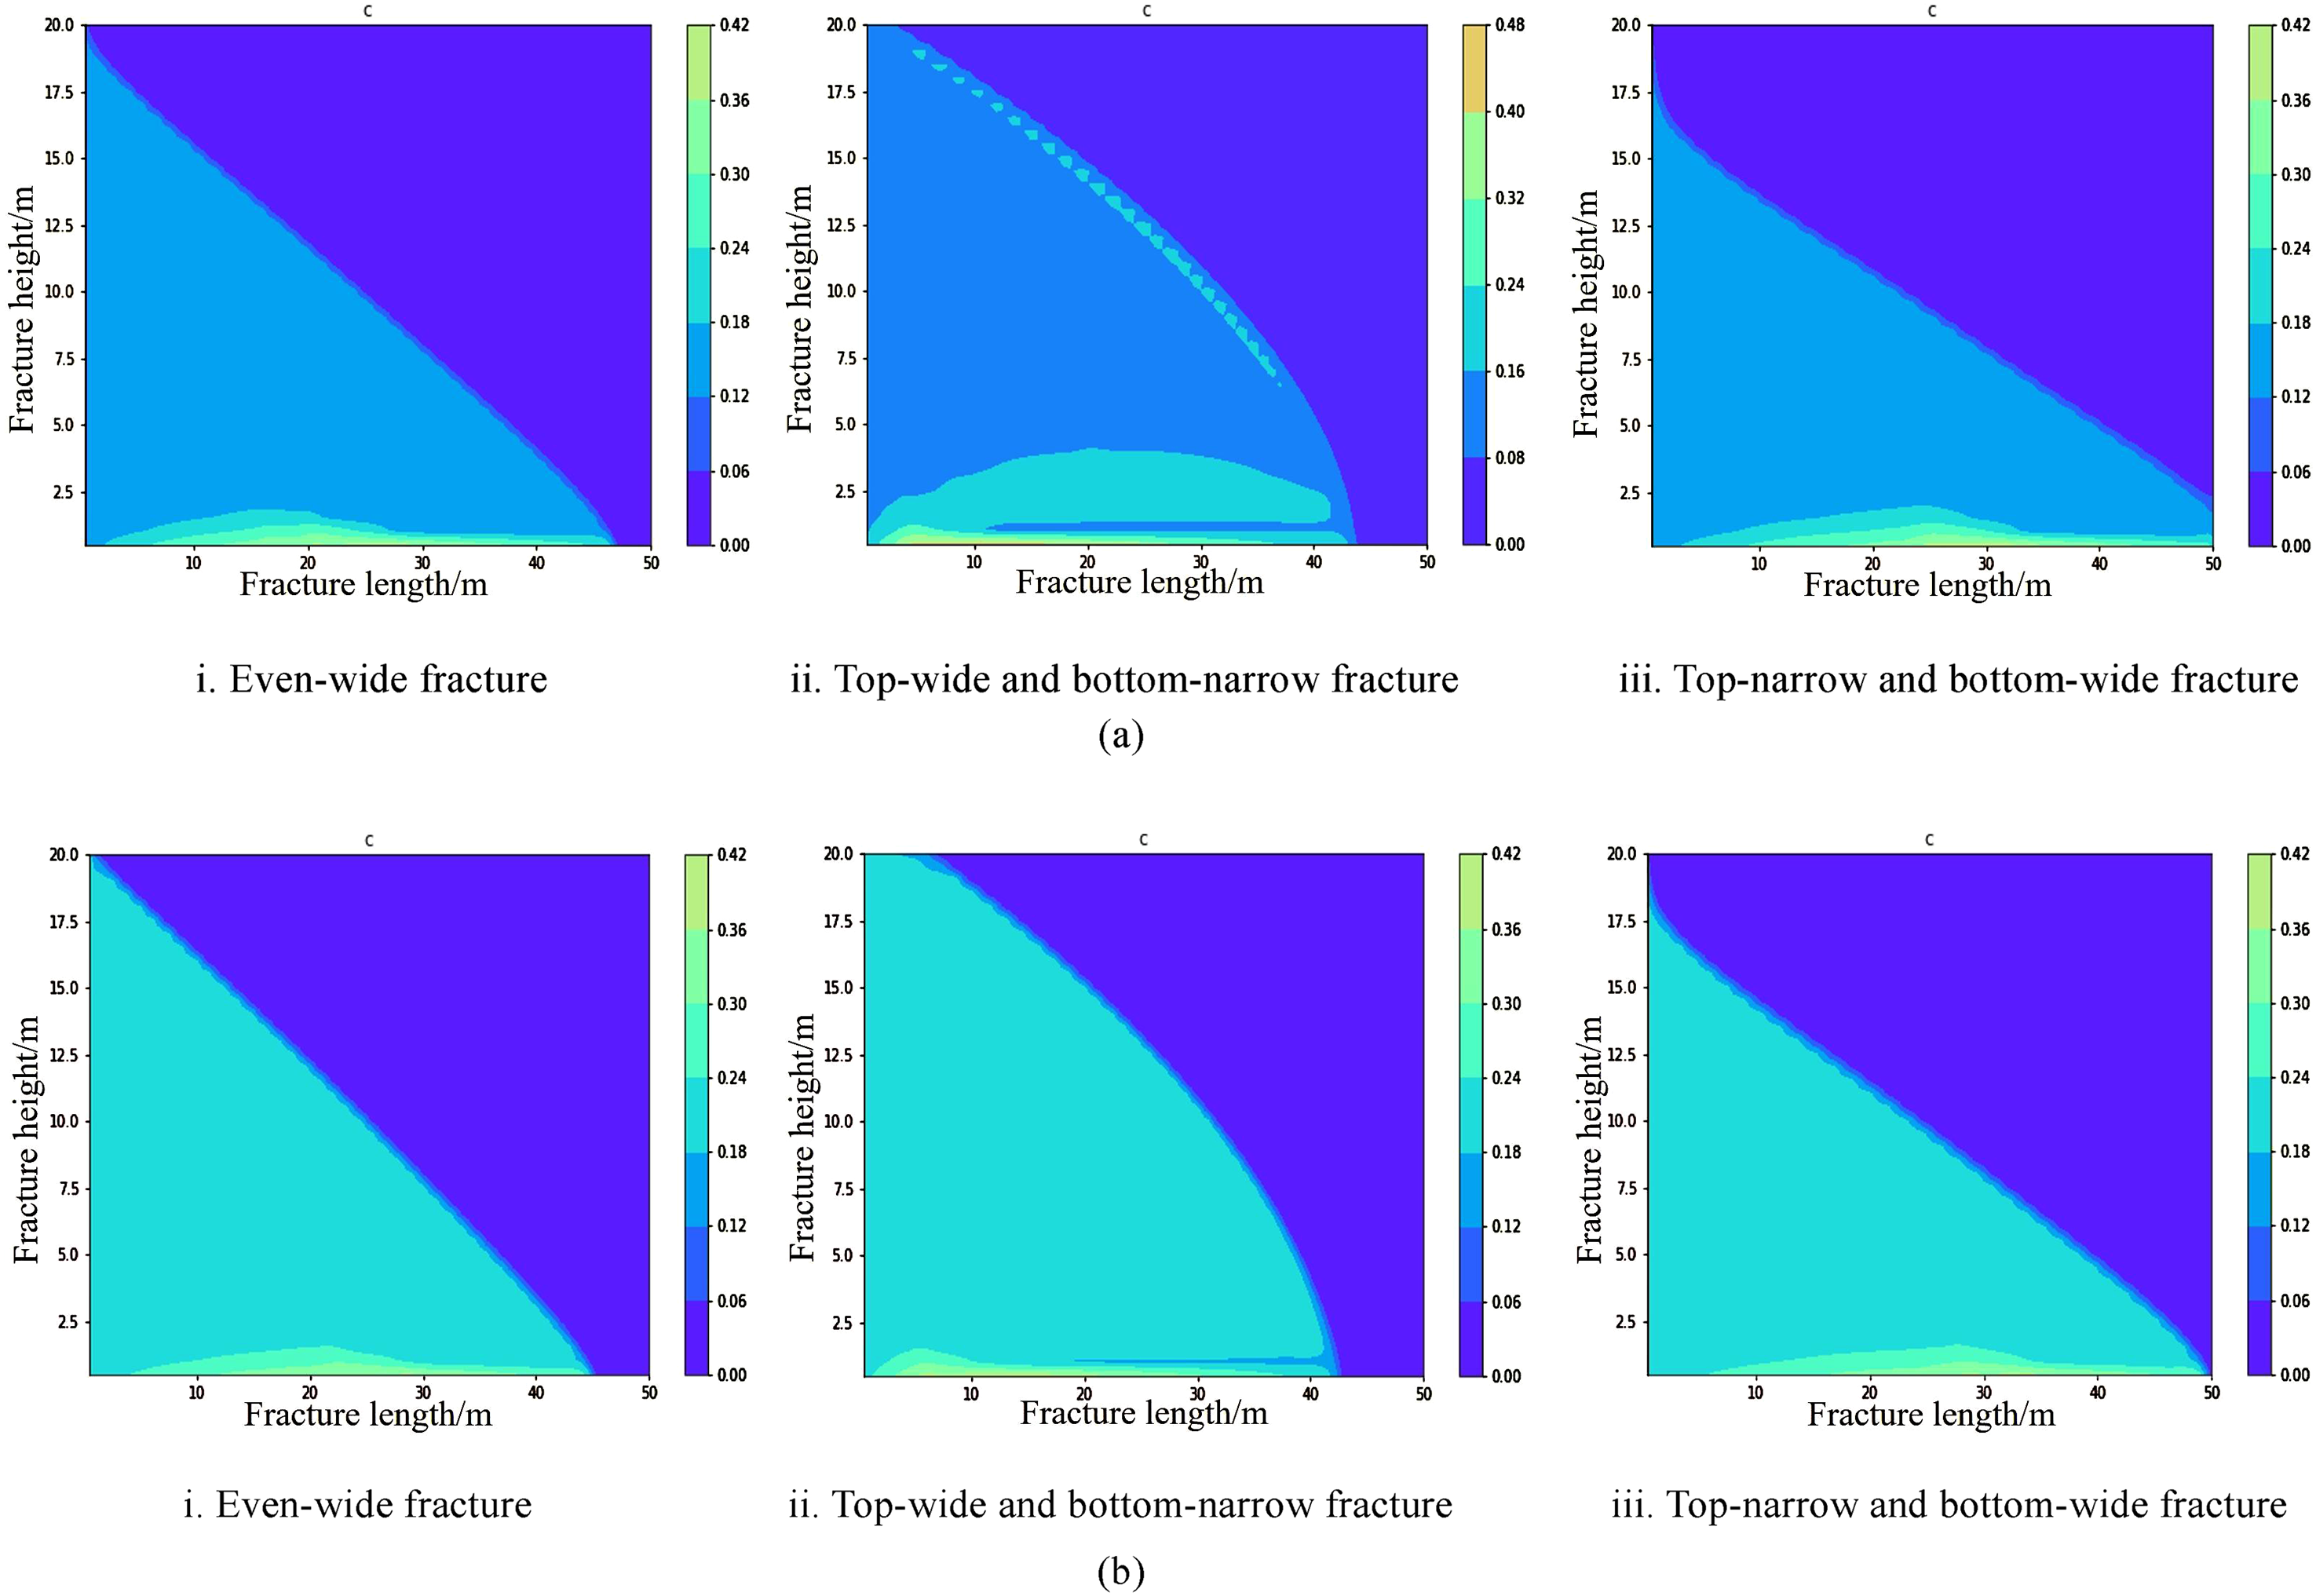
The pattern of proppant migration and sedimentation is influenced by the flow rate, with the displacement front moving faster in the top-narrow and bottom-wide and even-wide fractures, and slower in the top-wide and bottom-narrow fractures. In this case, deposition is more distinct in the top-wide and bottom-narrow fractures with low flow rates as opposed to high flow rates. Overall, the lower the flow, the more significant the accumulation at the inlet and the greater the maximum deposition concentration values (Figure 11).
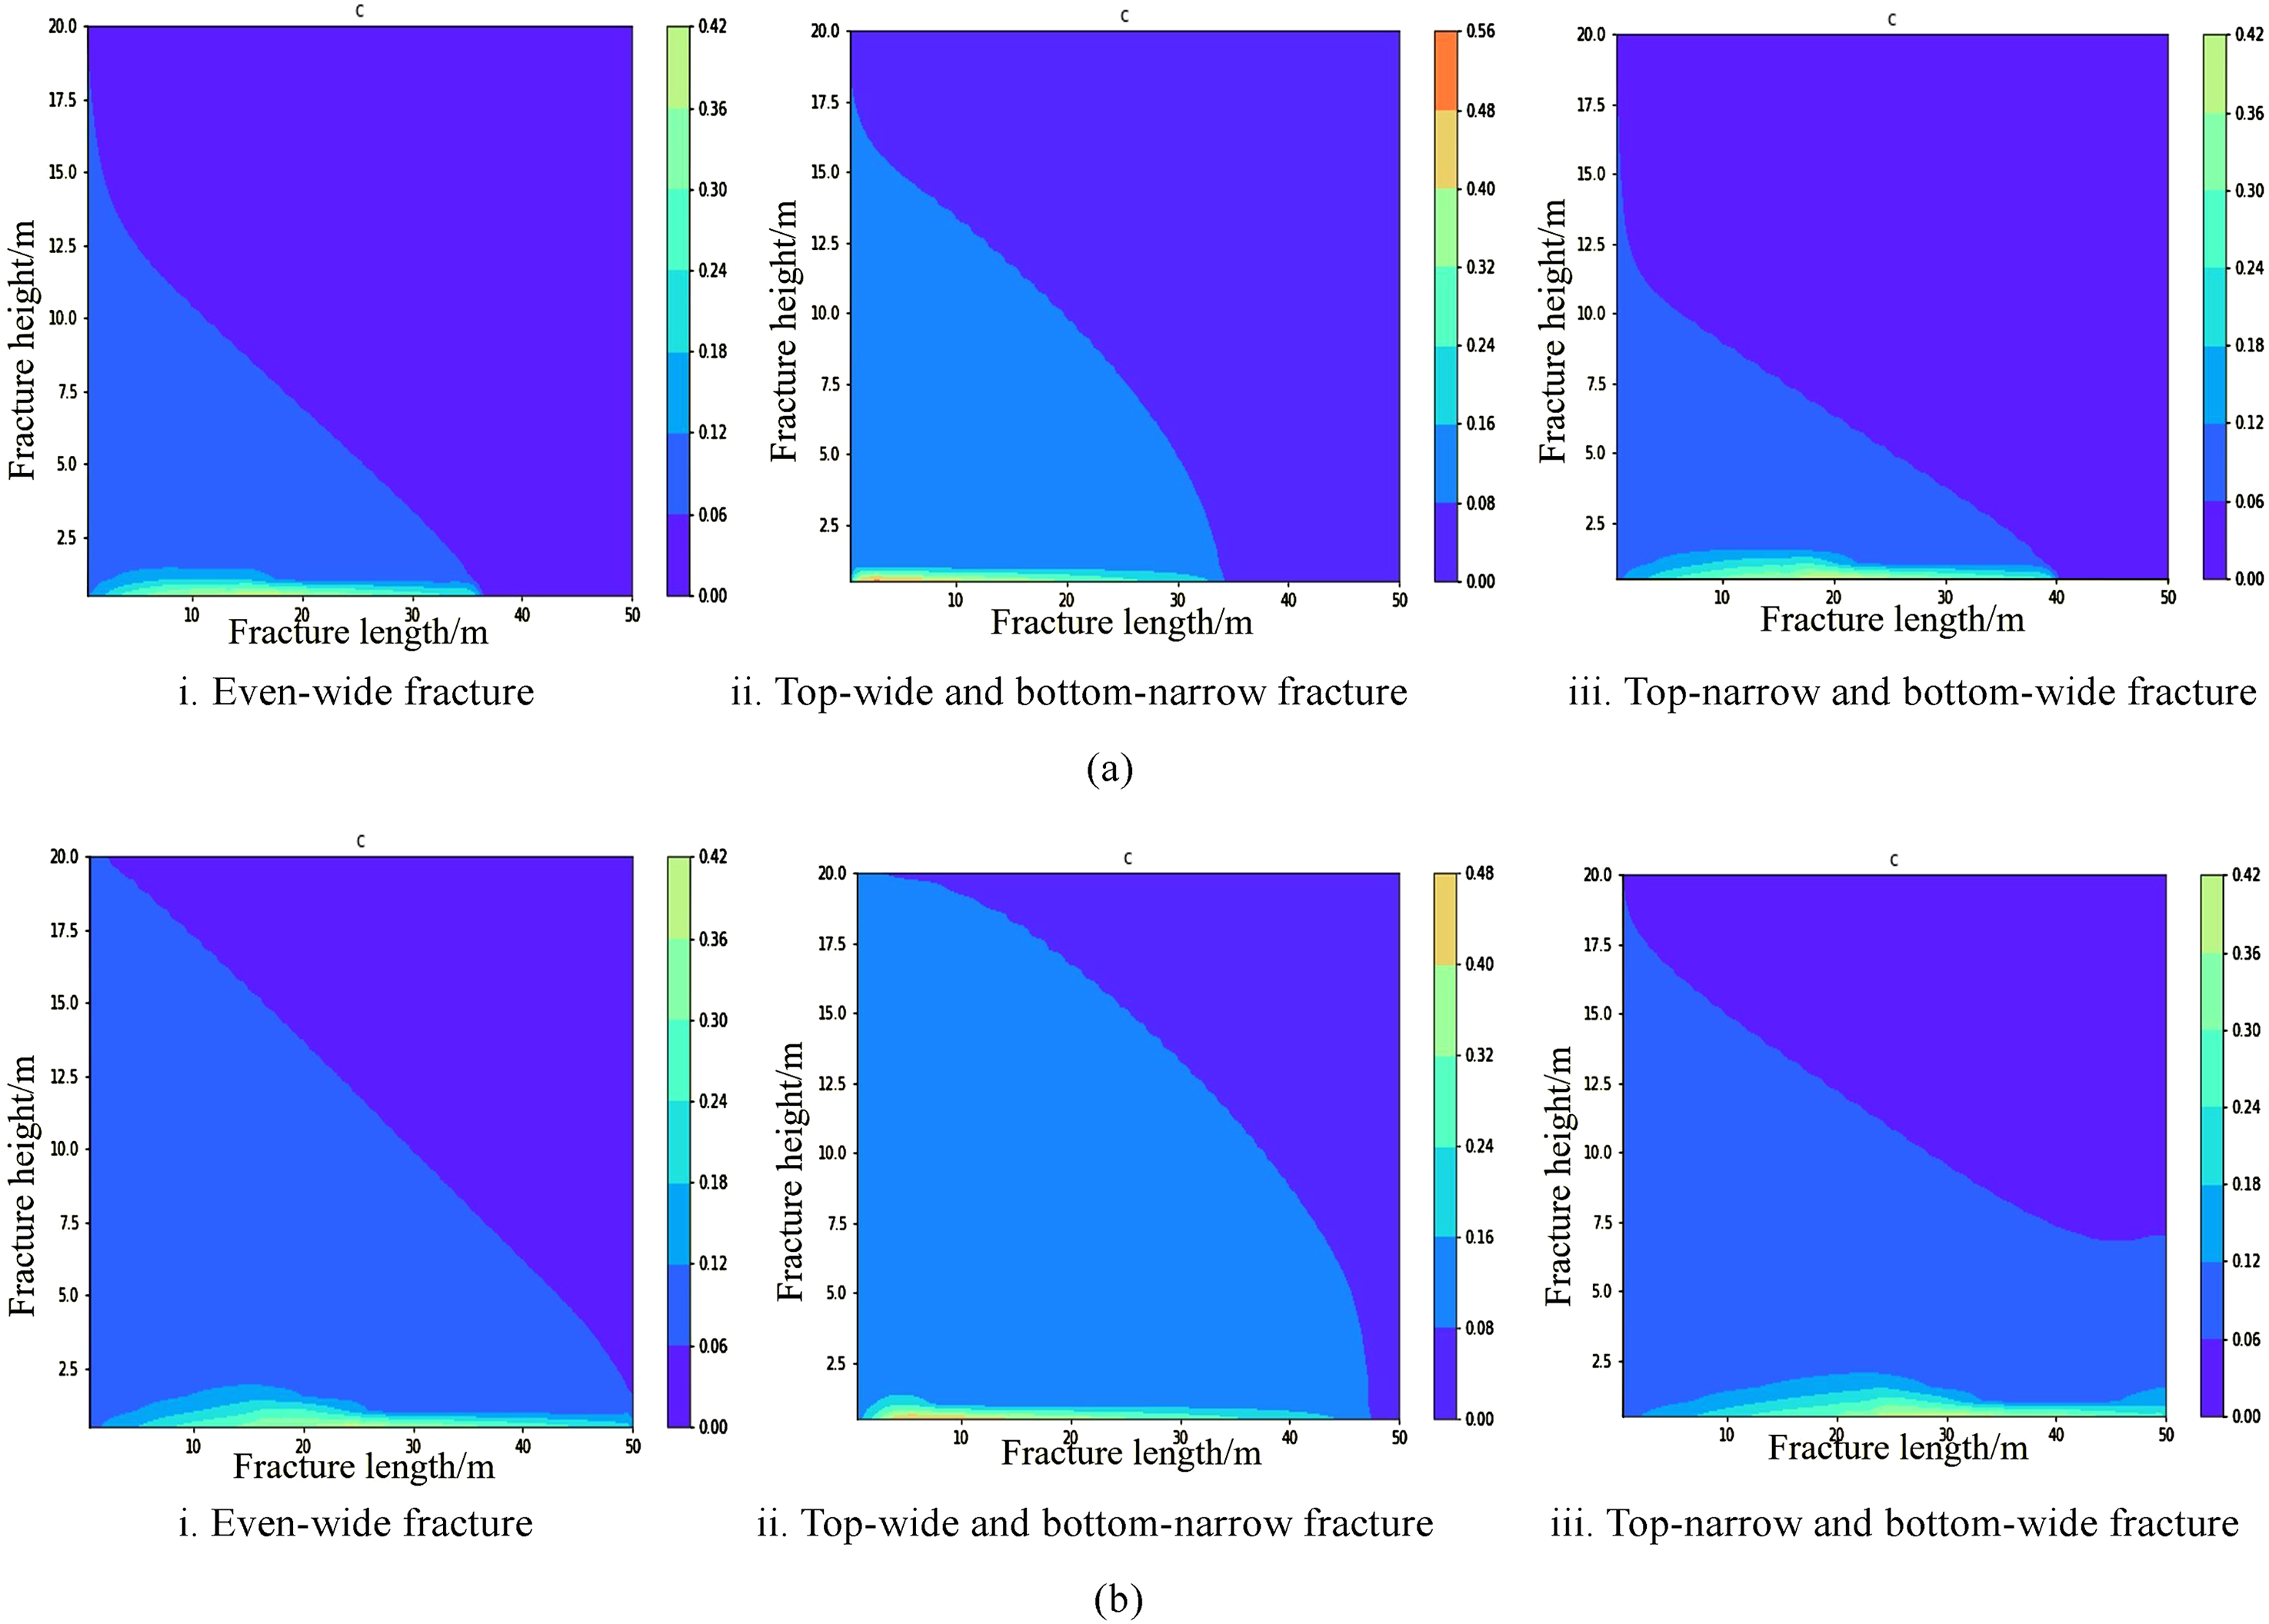
Distribution of proppant for uniform width fracture under different displacement. (a) Proppant distribution at a flow rate of 4 m3/min (80 s). i Even-wide fracture. ii. Top-wide and bottom-narrow fracture. iii. Top-narrow and bottom-wide fracture. (b) Proppant distribution in Even-wide fracture at a flow rate of 8 m3/min (80 s). i. Even-wide fracture. ii. Top-wide and bottom-narrow fracture. iii. Top-narrow and bottom-wide fracture.
As shown in Figure 12, under both small (4 m3/min) and large (8 m3/min) displacement conditions, the displacement front moves fastest in the top-narrow and bottom-wide fractures, followed by the even-wide fractures, and the larger the displacement, the faster the overall movement speed. The top-wide and bottom-narrow fractures have a greater influence than the even-wide fractures and the top-narrow and bottom-wide fractures. However, the inhomogenity of proppant distribution in the top-wide and bottom-narrow fractures first decreases and then increases significantly. The non-uniformity of this fracture is smaller than the other two in the early stage and rises rapidly over the other two in the later stage. The minimum values of inhomogeneity for all three appear at around 30 s. The size of the flow rate has less influence on the variation pattern of the proppant distribution homogeneity.
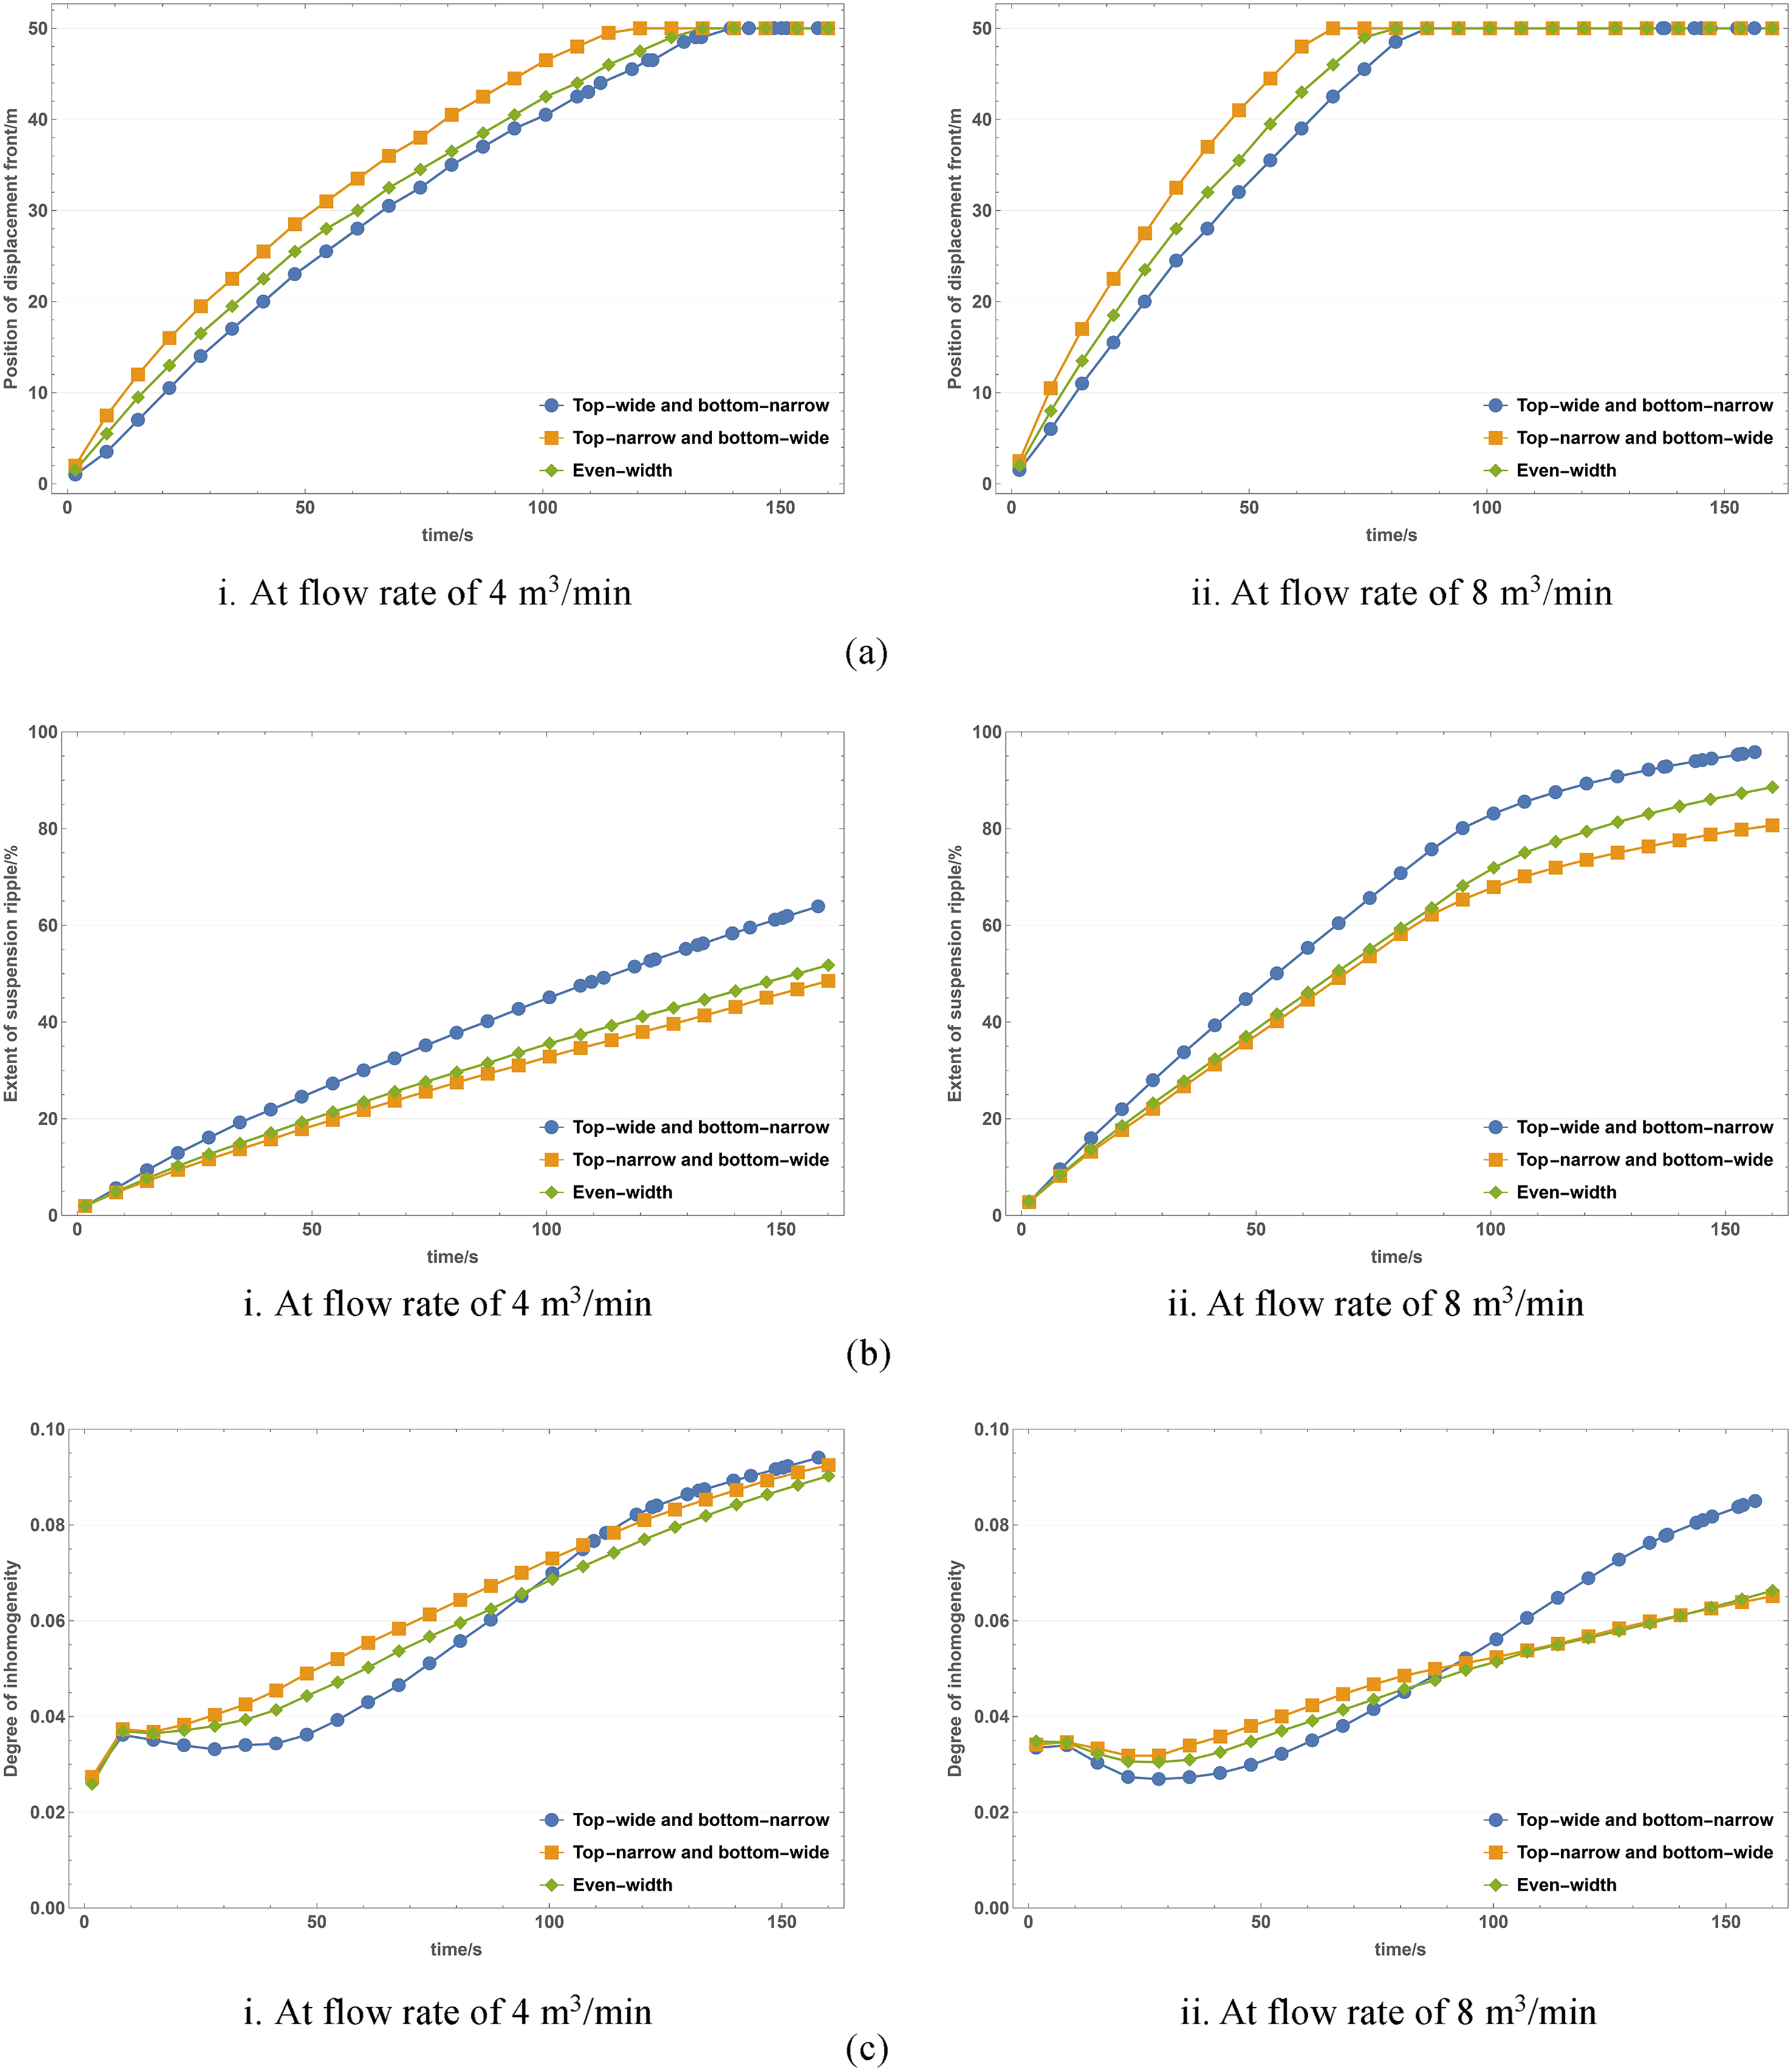
Effect of proppant parameters under different displacement conditions. (a) Displacement front movement at different flow rates. i. At flow rate of 4 m3/min. ii. At flow rate of 8 m3/min. (b) Range at which suspended load sweeps at different flow rates. i. At flow rate of 4 m3/min. ii. At flow rate of 8 m3/min. (c) Level of inhomogeneity in the range within which the suspended mass sweeps at different injection flow rates. i. At flow rate of 4 m3/min. ii. At flow rate of 8 m3/min.
Sand injection ratio
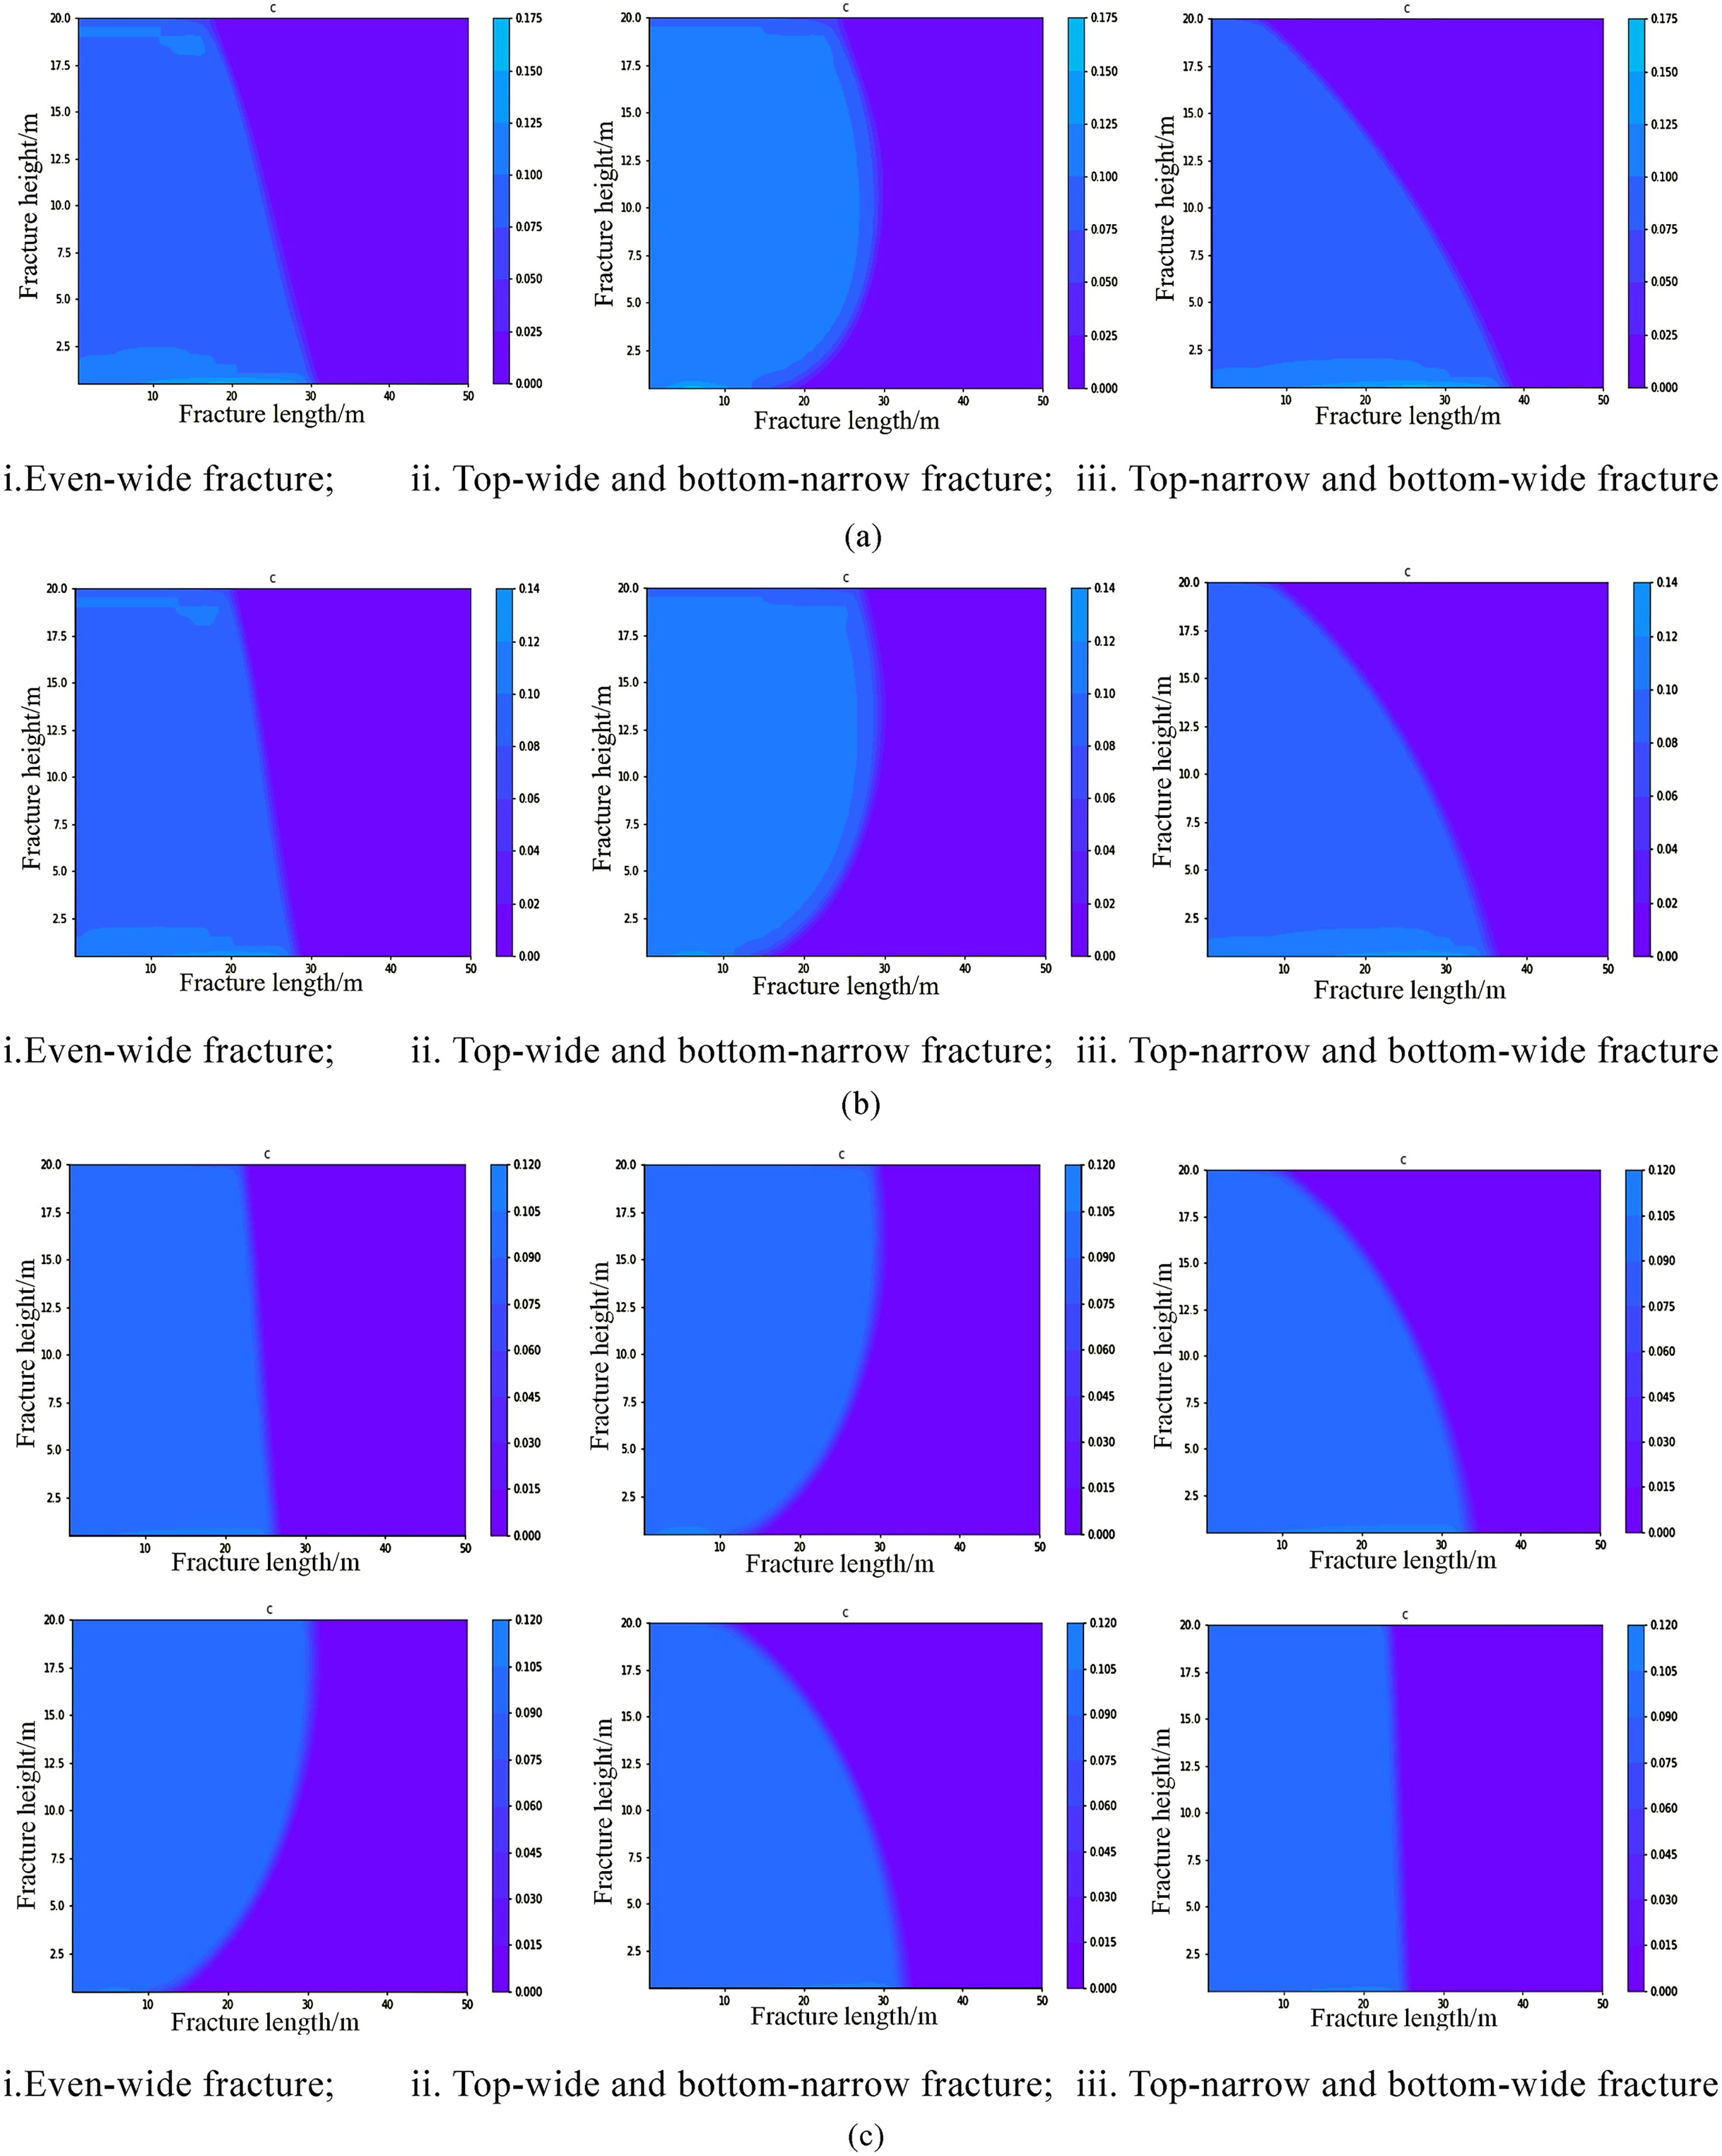
The greater the sand injection ratio, the greater the overall concentration and the greater the viscosity of the mixture, and the slower the mixture will migrate and settle (Figure 13).
Proppant distribution under different injection sand ratio conditions. (a) Proppant distribution at an injection sand ratio of 0.15 (80 s). i. Even-wide fracture. ii. Top-wide and bottom-narrow fracture. iii. Top-narrow and bottom-wide fracture. (b) Proppant distribution at an injection sand ratio of 0.20 (80 s). i. Even-wide fracture. ii. Top-wide and bottom-narrow fracture. iii. Top-narrow and bottom-wide fracture.
An increase in the sand injection ratio affects the rate of displacement front migration slightly; the higher the sand injection ratio, the greater the overall viscosity, the slower the displacement front migration and the slightly slower the expansion of the spreading area. However, an increase in the sand injection ratio will result in a reduction in the overall inhomogenity of the sanding concentration and will contribute to homogeneous sand distribution (Figure 14).
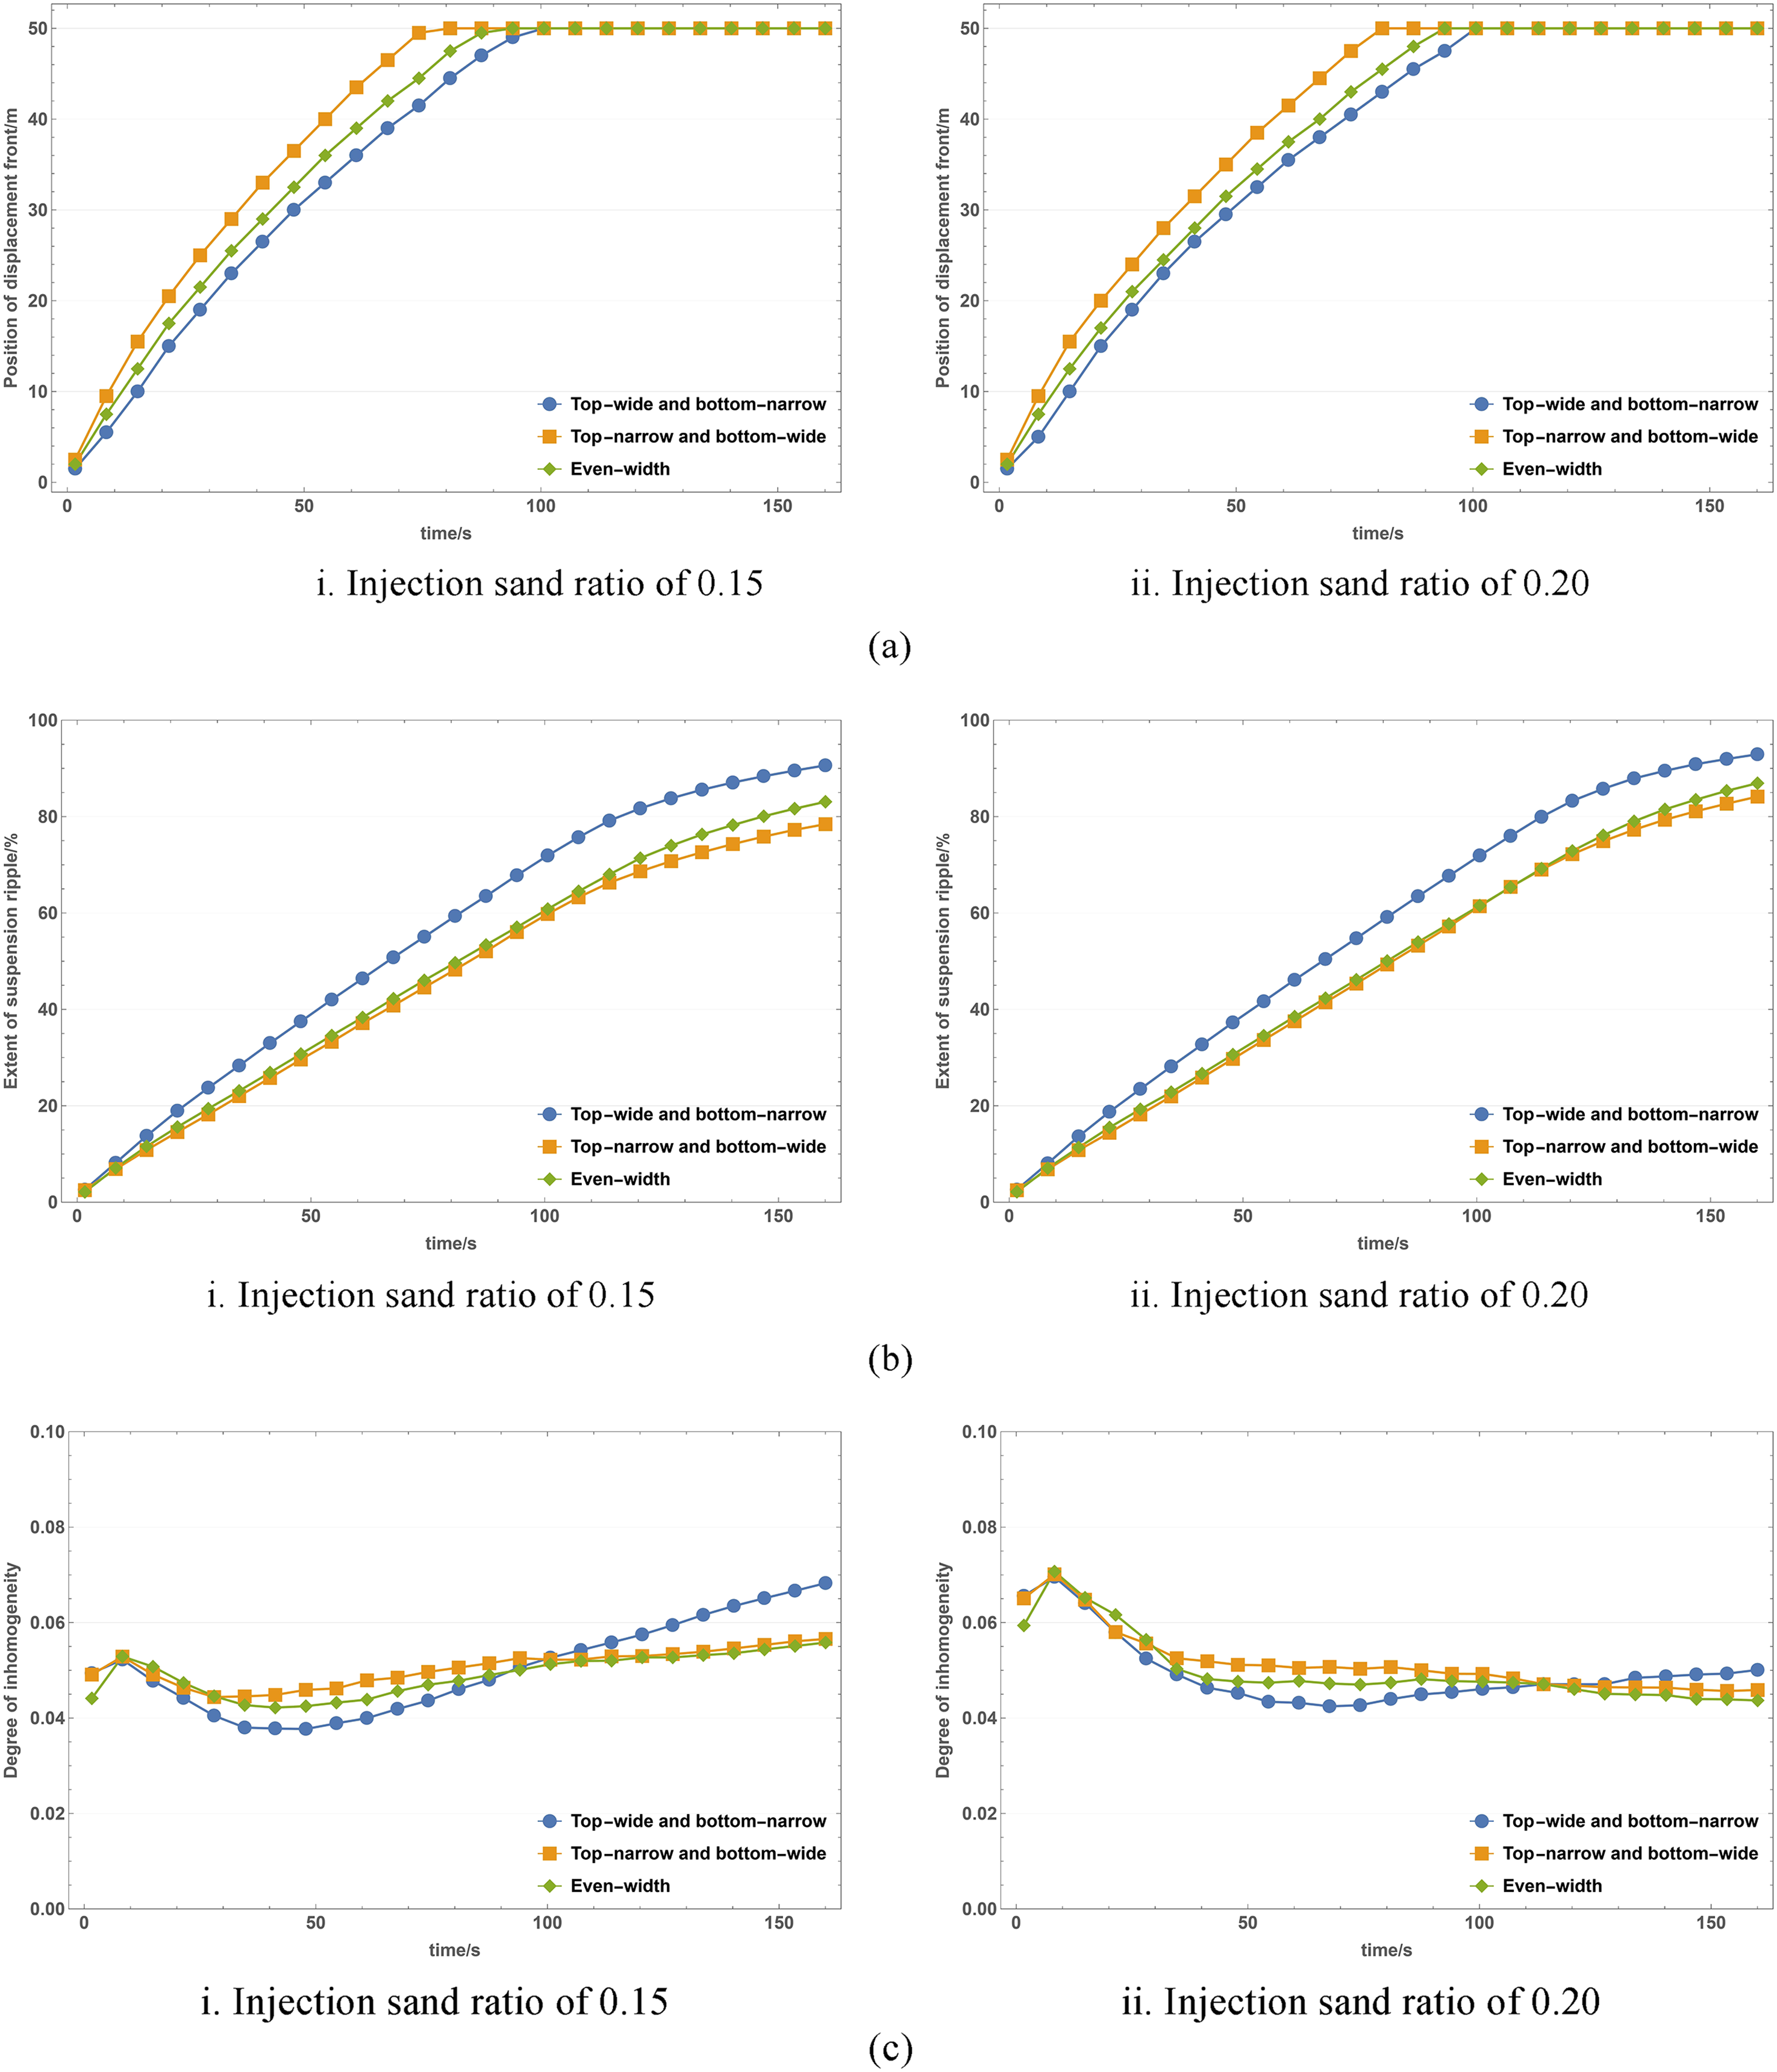
Influence of proppant parameters under different sand injection ratios. (a) Displacement front migration at different sand injection ratios. i. Injection sand ratio of 0.15. ii. Injection sand ratio of 0.20. (b) Range at which suspended load sweeps at different sand injection ratios. i. Injection sand ratio of 0.15. ii. Injection sand ratio of 0.20. (c) Levels of inhomogeneity in the suspended load sweeping range at different sand injection ratios. i. Injection sand ratio of 0.15. ii. Injection sand ratio of 0.20.
Fracturing fluid viscosity
An increase in fracturing fluid viscosity will enhance the sand-laden capacity of the fracturing fluid and reduce the settling effect of the proppant. The more significant the whole surface advance effect, the slower the advance of the replacement front and the more uniform distribution of the proppant (Wen et al., 2023) (Figure 15).
Proppant distribution under different basic viscosity conditions of fracturing fluid. (a) Proppant distribution at 30 mPa.s fracturing fluid viscosity (80 s). i. Even-wide fracture; ii. Top-wide and bottom-narrow fracture; iii. Top-narrow and bottom-wide fracture. (b) Proppant distribution at 50 mPa.s fracturing fluid viscosity (80 s). i. Even-wide fracture. ii. Top-wide and bottom-narrow fracture. iii. Top-narrow and bottom-wide fracture. (c) Proppant distribution at 100 mPa.s fracturing fluid viscosity (80 s). i. Even-wide fracture. ii. Top-wide and bottom-narrow fracture. iii. Top-narrow and bottom-wide fracture. (d) Proppant distribution at 200 mPa.s fracturing fluid viscosity (80 s). i. Even-wide fracture. ii. Top-wide and bottom-narrow fracture. iii. Top-narrow and bottom-wide fracture.
The variation in fracturing fluid viscosity affects the migration velocity of the displacement front, specifically, as the viscosity increases, the migration velocity of the displacement front decreases. When the viscosity increases, the inhomogeneity of the suspended load in the three types of fractures tends to decrease with the increase of the sweeping range, indicating that the increase of the fracturing fluid viscosity positively changes the homogenity of the sand-laden and sanding of the proppant.
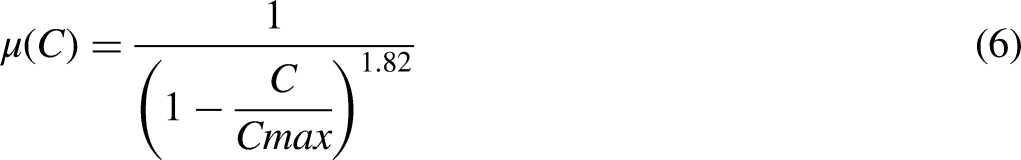
As shown in Figure 16, the sand carrying capacity of the fracturing fluid increases, the FV value decreases, and the proppant is more evenly distributed in the three fracture forms. The viscosity fracturing fluids with 100 mPa.s and 200 mPa.s is relatively close to that of FR, FP, and FV parameters over time, and even the key feature points in the result are almost consistent. This indicates that when the viscosity of the fracturing fluid exceeds 100 mPa.s, the effect of improving FR, FP, and FV parameters by increasing the viscosity of the fracturing fluid is not significant.
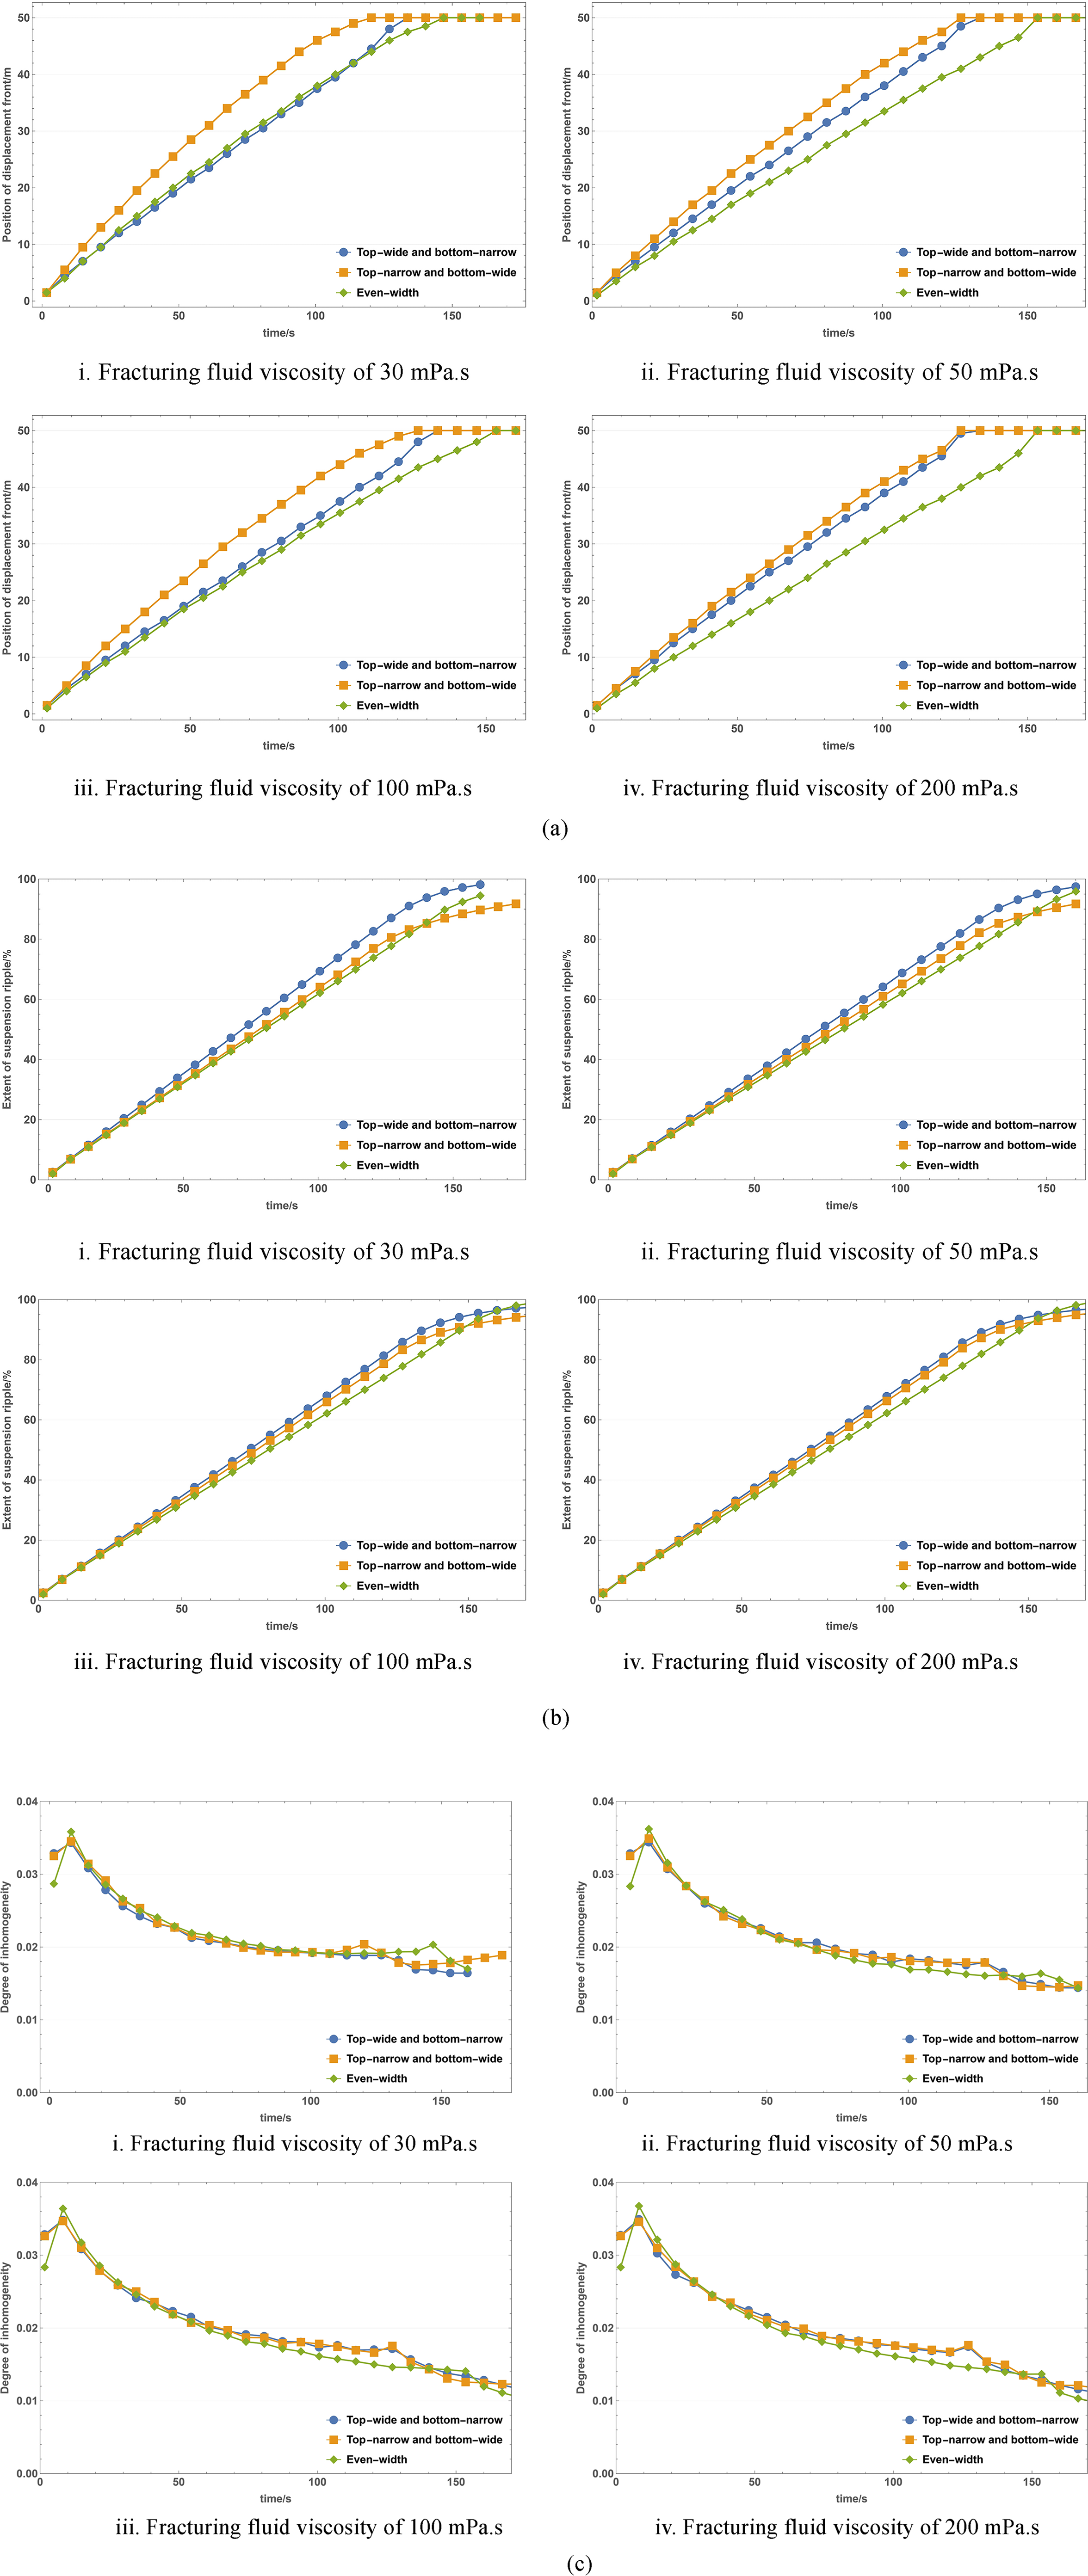
Effect of proppant parameters on different basic viscosity of fracturing fluid. (a) Displacement front migration at different fracturing fluid viscosities. i. Fracturing fluid viscosity of 30 mPa.s. ii. Fracturing fluid viscosity of 50 mPa.s. iii. Fracturing fluid viscosity of 100 mPa.s. iv. Fracturing fluid viscosity of 200 mPa.s. (b) Range of suspended load sweeping at different fracturing fluid viscosities. i. Fracturing fluid viscosity of 30 mPa.s. ii. Fracturing fluid viscosity of 50 mPa.s. iii. Fracturing fluid viscosity of 100 mPa.s. iv. Fracturing fluid viscosity of 200 mPa.s. (c) Level of inhomogeneity in the sweeping range of suspended load at different fracturing fluid base viscosities. i. Fracturing fluid viscosity of 30 mPa.s. ii. Fracturing fluid viscosity of 50 mPa.s. iii. Fracturing fluid viscosity of 100 mPa.s. iv. Fracturing fluid viscosity of 200 mPa.s.
However, it should be noted that the flow and pressure of the fluid in the model studied in this article are characteristic of Newtonian fluid flow, but fluids with high viscosity have more non Newtonian fluid flow characteristics, from numerical point of view, the flow of power-law fluids inside fracture follows the general form of cubic law (Roostaei et al., 2018):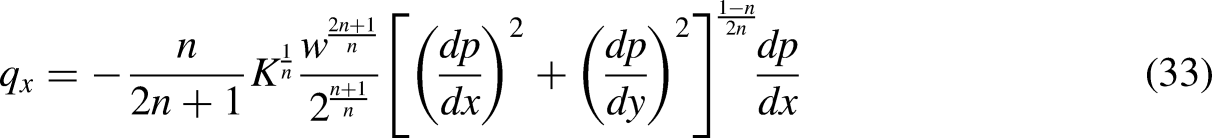
Proppant grain size
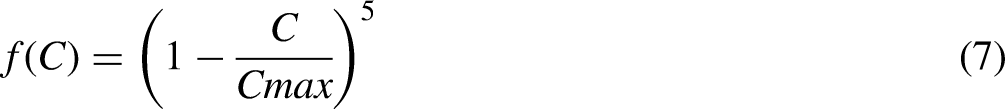
The smaller the grain size of the proppant, the more significant the properties of suspension, the poorer the deposition effect and the more significant the transport effect. However, the effect of the above conditions is not significant for the top-wide and bottom-narrow fractures. According to the expression of proppant deposition velocity Vs, the proppant deposition velocity is proportional to the square of the grain size, and the calculation results are consistent with the theory (Figure 17).
Proppant distribution under different proppant grain size conditions. (a) Proppant distribution at proppant grain size of 300 (80 s). i. Even-wide fracture. ii. Top-wide and bottom-narrow fracture. iii. Top-narrow and bottom-wide fracture. (b) Proppant distribution at proppant grain size of 450 (80 s). i. Even-wide fracture; ii. Top-wide and bottom-narrow fracture; iii. Top-narrow and bottom-wide fracture.
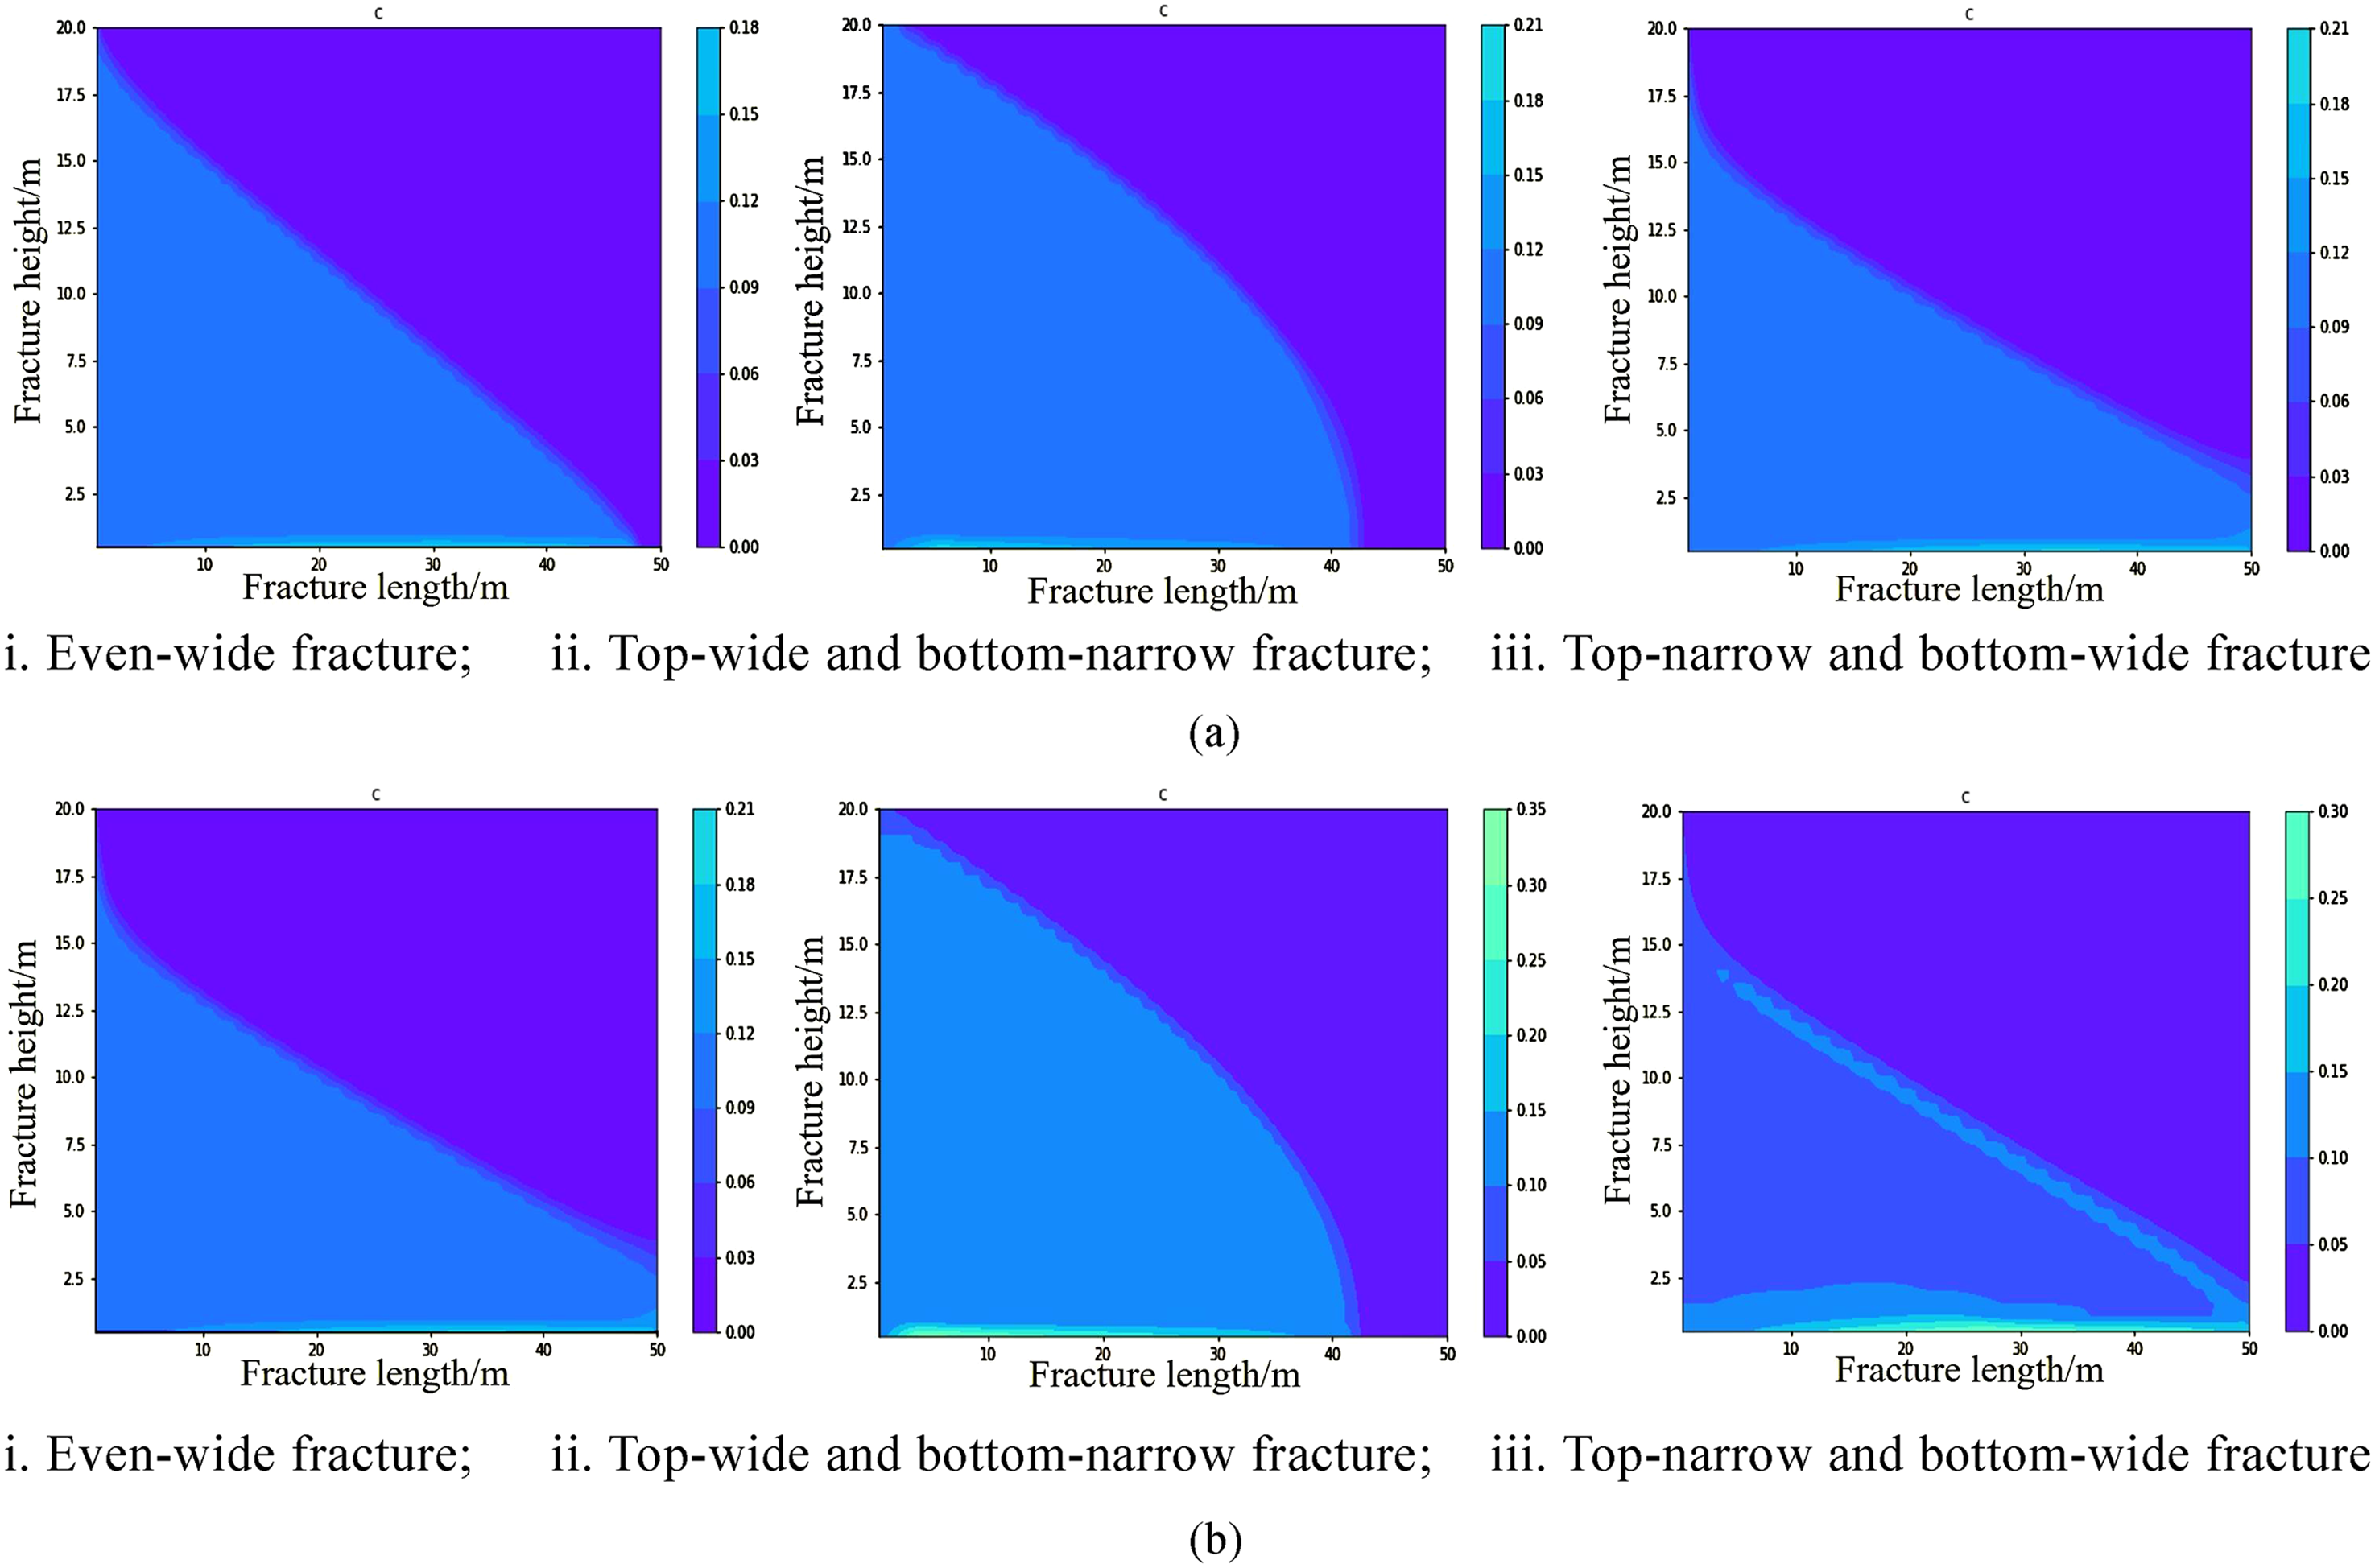
As can be seen from Figure 18, the grain size of the proppant has less influence on the flow rate of the displacement front and the sweeping range of the suspended load. However, when it comes to the inhomogeneity of the sweeping range of the suspended load, the smaller the grain size, the smaller the deposition effect and the lower the inhomogeneity, and this is favorable to sand-laden and homogeneous sanding of the fracturing fluid.
Effect of proppant distribution parameters on different proppant grain sizes. (a) Displacement front migration at different proppant grain sizes. i. Proppant grain size of 300. ii. Proppant grain size of 450. (b) Sweeping range of suspended load at different proppant grain sizes. i. Proppant grain size of 300. ii. Proppant grain size of 450. i. Proppant grain size of 300. ii. Proppant grain size of 450.
Proppant density
As shown in Figure 19, the greater the proppant density, the greater the density difference with the fracturing fluid, the more significant the deposition effect and the faster the lower displacement proppant front moves.
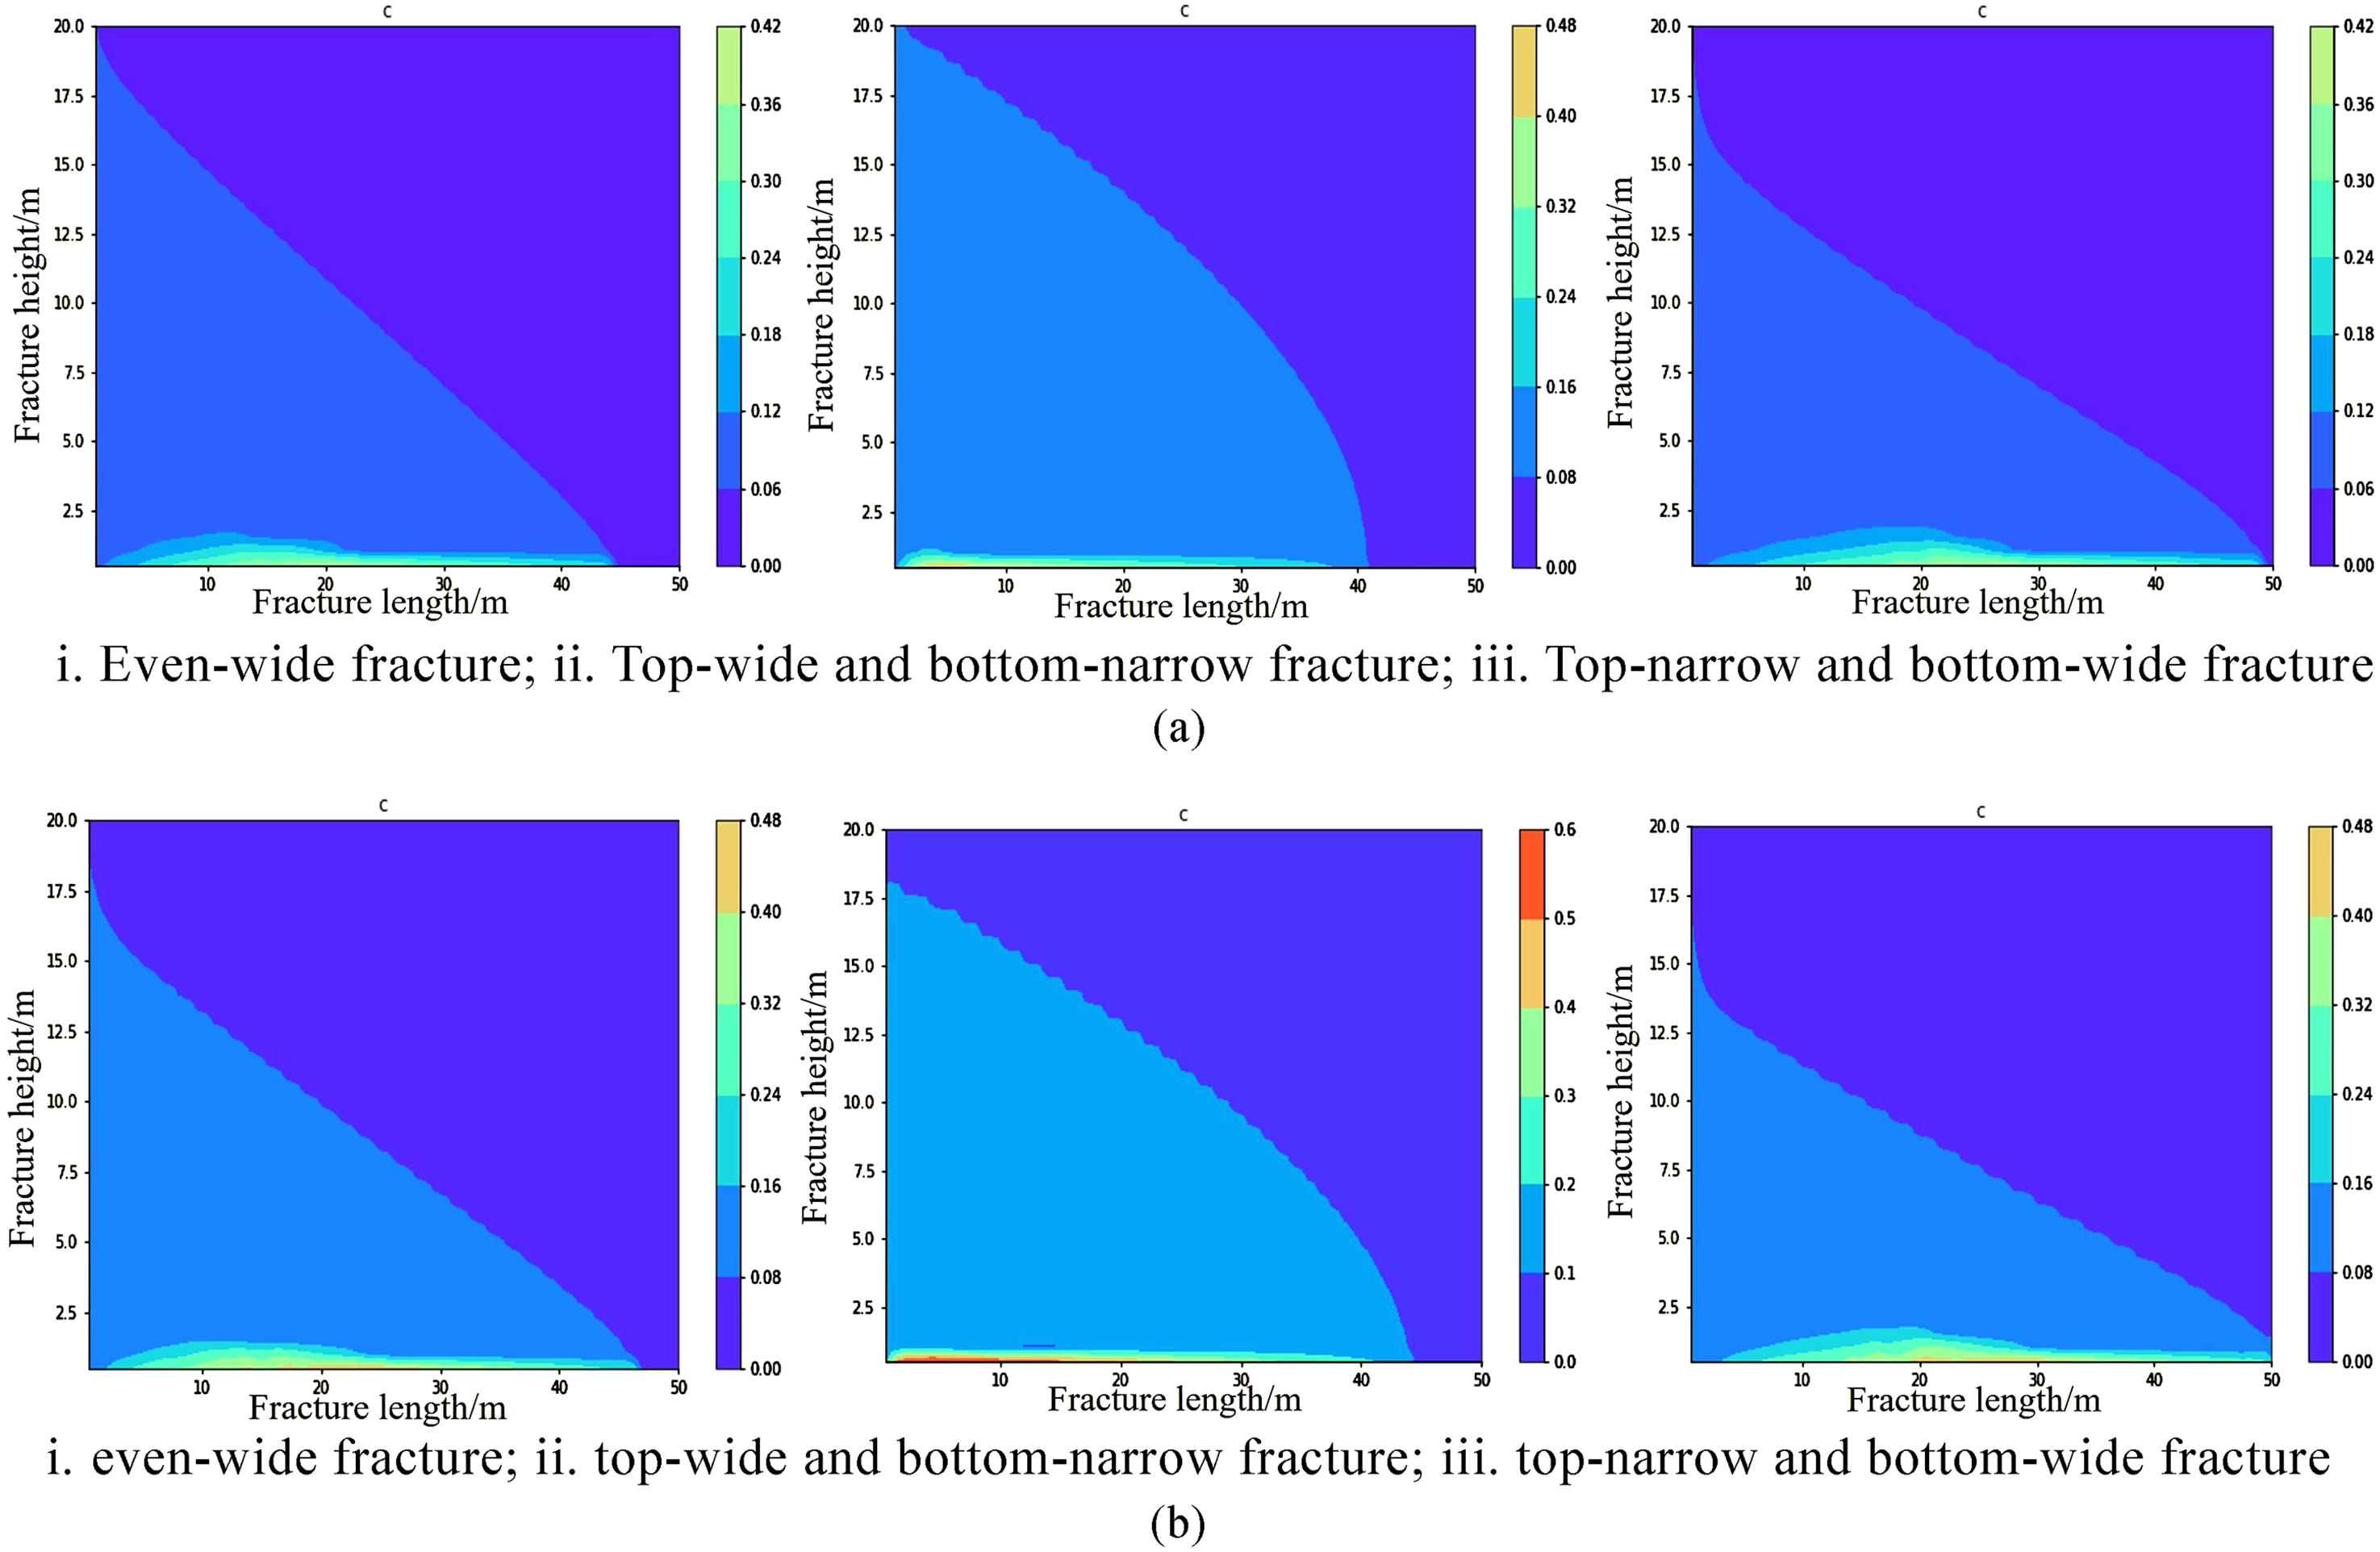
Proppant distribution under different proppant densities. (a) Proppant distribution (80 s) at a proppant density of 2550 kg/m3 (resin covered sand). i. Even-wide fracture. ii. Top-wide and bottom-narrow fracture. iii. Top-narrow and bottom-wide fracture. (b) Proppant distribution (80 s) at a proppant density of 3100 kg/m3 (ceramsite). i. even-wide fracture; ii. top-wide and bottom-narrow fracture; iii. top-narrow and bottom-wide fracture.
The proppant density affects less the velocity of the proppant displacement front and the sweeping range of the suspended load, and has a definite effect on the inhomogeneity of the suspended load within the sweeping range; the higher the proppant density, the greater the inhomogeneity within the sweeping range, which adversely affects the homogeneous sanding (Figure 20).
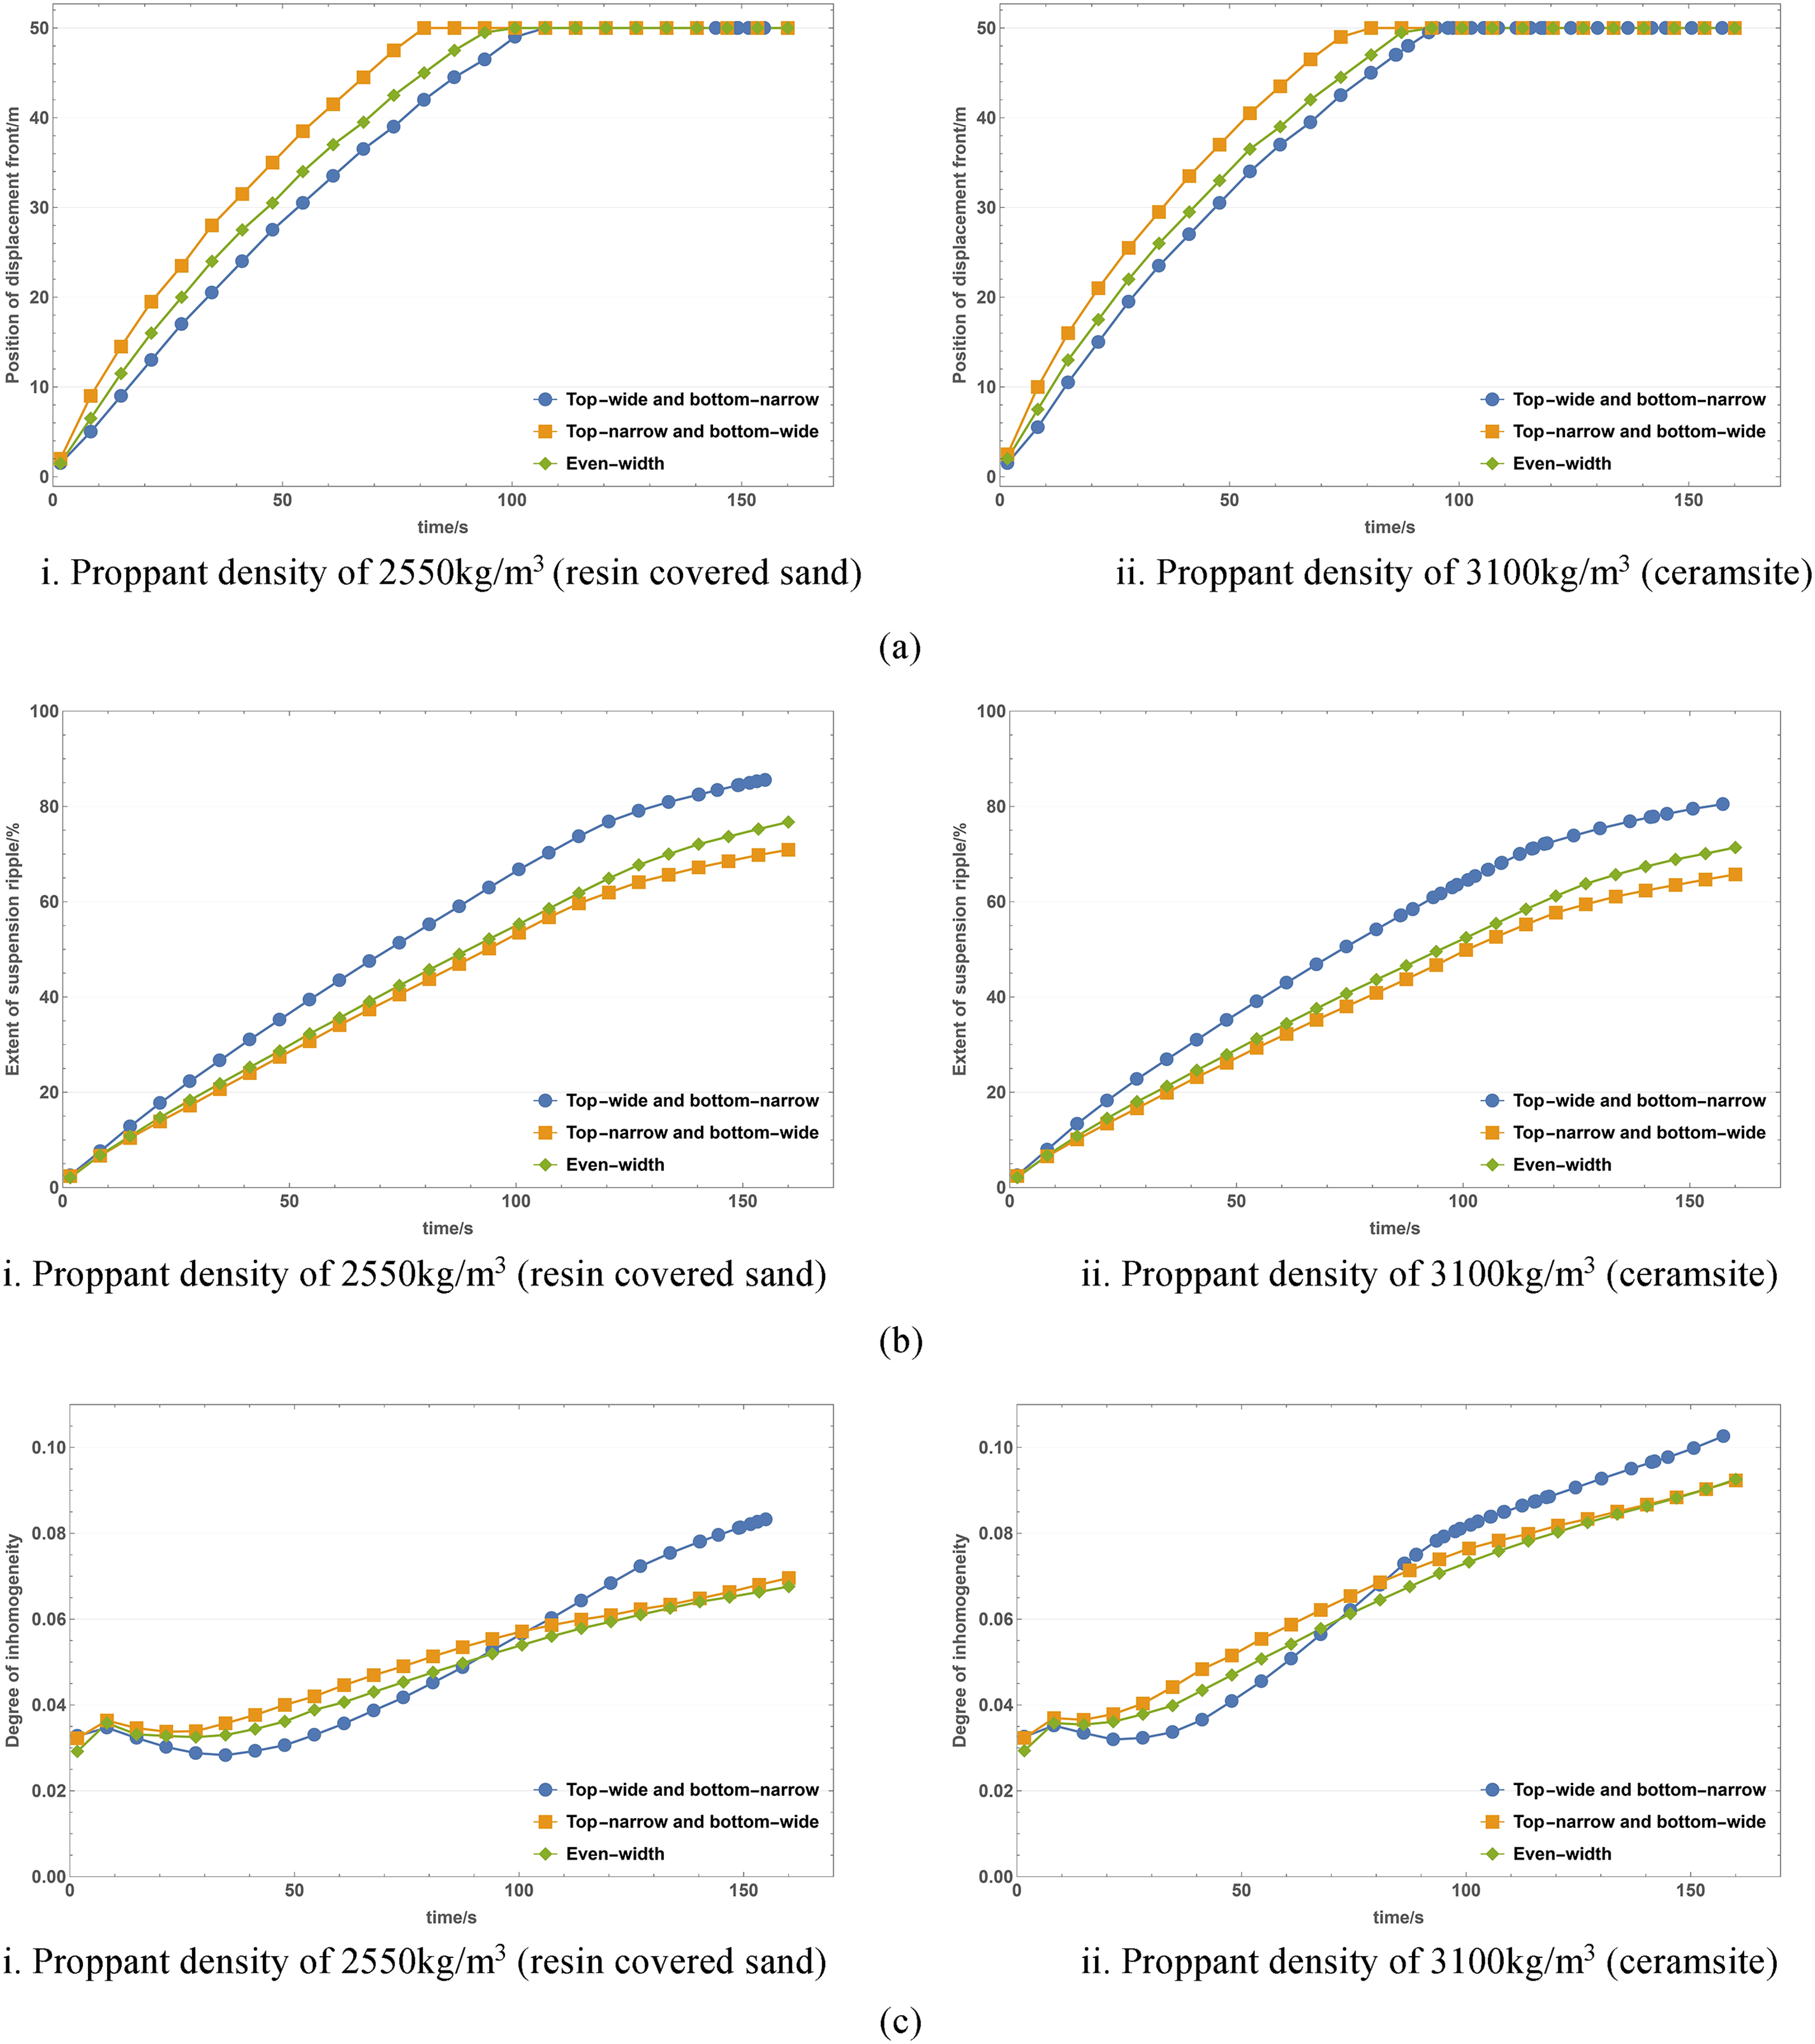
Effect of Proppant Distribution Parameters under Different Proppant Density. (a) Displacement front migration at different proppant densities. i. Proppant density of 2550 kg/m3 (resin covered sand). ii. Proppant density of 3100 kg/m3 (ceramsite). (b) Sweeping range of suspended load at different proppant densities. i. Proppant density of 2550 kg/m3 (resin covered sand). ii. Proppant density of 3100 kg/m3 (ceramsite). (c) Level of inhomogeneity in the sweeping range of suspended loads at different proppant densities. i. Proppant density of 2550 kg/m3 (resin covered sand). ii. Proppant density of 3100 kg/m3 (ceramsite).
Conclusions
The model is discretized by the finite volume method, and the flow coefficients are taken in Superbee format and upstream weighting for better convergence than direct summation and averaging.
The model fits well with the results of indoor plate fracture tests and good accuracy of the model and solution method has been achieved.
The proppant front moves fastest in the top-narrow and bottom-wide fracture, with a smaller sweeping range of suspended load. The homogeneity of proppant distribution is optimal in the top-wide and bottom-narrow fractures in the early stage of proppant injection, and the homogeneity of proppant distribution is optimal in the top-narrow and bottom-wide fracture in the later stage.
The size of the flow rate has less influence on the pattern of change in proppant distribution homogeneity, with higher sand ratios being injected, the overall proppant distribution homogeneity appears to improve in the later stages of the fracture.
The factor that exerts the greatest influence on the proppant distribution is the fracturing fluid viscosity, which changes the overall pattern of proppant sedimentation and transport as a result of fracture morphology and reduces the difference in proppant distribution induced by fracture morphology. Increasing the viscosity of the fracturing fluid in a range of 100 mPa.s helps to improve the sweeping range and homogeneity of the proppant sanding and therefore achieve better fracturing results, meanwhile continue to increase the viscosity of the fracturing fluid without significant changes in FP, FR, and FA parameters.
Footnotes
Declaration of conflicting interests
The authors declared no potential conflicts of interest with respect to the research, authorship, and/or publication of this article.
Funding
The author(s) disclosed receipt of the following financial support for the research, authorship, and/or publication of this article: Key Technologies for Shale Gas Exploration and Development project of the National Science and Technology Major Project (2016ZX05058, 2016ZX05058-003);(2)Major Project of the CNOOC Energy Technology & Services Limited (HFZXKT-GJ2022).
Nomenclature
actual proppant flow velocity (m/s) proppant volume concentration fracture fluid pressure Reynolds number fracture width (m) flow velocity of the fracturing fluid (m/s) proppant settling velocity (m/s) combined volume fraction of the proppant grai n fluid loss velocity of the wall (m/s) fracturing fluid density (kg/m3) proppant density (kg/m3) fracturing fluid viscosity (mPa.s) fracturing fluid viscosity coefficien t gravitational acceleration (m/s2) proppant settling velocity (m/s) proppant grain diameter (m) concentration effect factor for settling velocity concentratio n flow behavior index consistency coefficient of a power-law fluid as it flows through the fracture, Pa.sn maximum proppant sedimentation concentratio n stepsize of horizontal direction stepsize of vertical directio n flow rate along x direction under non Newtonian fluids