
Abstract
In this study, the influence of different functional groups (carbonyl, ether, carboxyl, and hydroxyl) on microporous development and competitive adsorption for CO2-CH4 was investigated using Connolly potential theory, molecular mechanics, molecular dynamics, and grand canonical Monte Carlo based on the macromolecular representation of coal vitrinite (CV). Results indicated that microporous diameter induced from the carboxyl (COOH) and hydroxyl (OH) was more sensitive to increasing temperature than carbonyl (CO) and ether (C2O). The COOH and OH could induce more micropores than the other functional groups. The adsorption capacities of OH-CV and COOH-CV were significantly higher than C2O-CV, CO-CV, and C-CV (coal vitrinite purified by carbon atoms) and they all decrease with the decreasing temperature. Both the calculation results of Locate- and Isotherm task suggested that OH and COOH have a significantly higher adsorption amount than other coal macromolecules and the others have a close adsorption amount. The adsorption selectivities of CO2 over CH4 (SA/B) for all the functional groups were higher than 1 here, indicating the adsorption preference of CO2 over CH4. For the pressure dependence, the SA/B first decreases significantly for the pressure of < 4 MPa and then slightly for the pressures of >4 MPa with the increasing pressure, indicating that high pressure was not conductive to the replacement of CH4 by CO2. For almost all the pressures here, the SA/B follows the order of COOH-CV > OH-CV≈C2O-CV≈Ori-CV≈CO-CV≈C-CV, indicating the highest adsorption preference of CO2 over CH4 for COOH, and OH-CV.
Keywords
Introduction
The reduction of CO2 emissions could minimize these environmental problems. The CO2 capture and sequestration (CCS) could provide a bridging strategy to the development of carbon-free energy systems (Zheng et al., 2017). Among the existing CCS technologies, the CO2-enhanced coalbed methane (CO2-ECBM) has dual advantages of not only reducing the CO2 emissions but also enhancing the coalbed methane (CBM) recovery (He et al., 2017; Liu and Wilcox, 2012; Middleton et al., 2012). Recent investigations have demonstrated that coal macromolecule was consisted of three-dimensional cross-linked structure which was composed of aromatic clusters, oxygen functional groups, and aliphatic structures (Mathews and Chaffee, 2012; Mathews et al., 2011). The different oxygen function groups in coal macromolecules possessed adsorption abilities for methane, which should be attributed to their varying microporous size distribution (Song et al., 2017a, 2017b). Thus, the investigations on the effects of surface functional groups on microporous distribution and CO2-CH4 adsorption in coal macromolecules were of significance for the theory and engineering of enhancing CBM recovery.
Recent years have witnessed great advancements in highlighting the size distribution and heterogeneity of nanopores via experiments and molecular simulations. The experimental characterizations include the liquid injections, gas adsorption methods, and micrograph analysis, where the former was composed of the high-pressure mercury intrusion (HPMI) (Fu et al., 2021; Huang et al., 2019; Wang et al., 2014). The HPMI was conducted based on the capillarity theory and could detect the size distribution of microfractures and the macropores intuitively (>50 nm) (Li et al., 2020; Zhou et al., 2017). However, the mercury injection amounts at higher pressures (>20 MPa) were composed of two parts, that is, matrix compression and effective pore volume (Cai et al., 2018). Thus, the pore size distribution from HPMI results should be corrected especially at high pressures and the compression coefficient can be calculated. The gas adsorption method mainly includes the low temperature CO2 (LTCO2GA) and liquid nitrogen adsorption (LTN2GA). The LTN2GA which was based on the adsorption and condensation theory could detect the size distribution and morphology of mesopores (2–50 nm) and larger nanopores (Song et al., 2020). The pore size distribution, pore volume, and specific surface area could be calculated via physical models such as Brunauer-Emmett-Teller model, Barrett-Joyner-Halenda model, and Density-Function-Theory (DFT) model (Bardestani et al., 2019; Li et al., 2016; Wei et al., 2016). In addition, the pore morphology could also be inferred by the hysteresis loop shapes, as well as its corresponding pore diameter (Song et al., 2017a, 2017b). The LTCO2GA method was efficient for characterizing the microporous size distribution and also the heterogeneity properties with the help from DFT model, volume fractal model, and surface fractal model (Gao et al., 2022). It has been successfully utilized to depict the structural properties of micropores in coal, shale and other geological materials (Hui et al., 2019; Mastalerz et al., 2017). The micrograph analysis method mainly includes the scanning electron microscope, optical microscope, and neutron scattering and could visually detect the development characters of microfractures and mesopores in coal (Gupta et al., 1998; Nie et al., 2015).
The nanoporous size distribution was critical for highlighting the adsorption microscopic mechanism of CO2-CH4, where the molecular simulation could provide more microscopic insights than the experimental characterizations (Mosher et al., 2013; Xiang et al., 2014; Zhang et al., 2015). Different functional groups could possess different adsorption energy and affinity for CO2, CH4, and H2O (Song et al., 2017a, 2017b). This could be attributed to their varying electronic interactions, the microporous size distribution, and van der Waals force. Among the molecular simulation methods, the Grand Canonical Monte Carlo (GCMC) and molecular dynamics (MD) were effective to calculating the adsorption amounts and adsorption configurations and have been successfully utilized to depict the adsorption process under geological conditions (Zhang et al., 2015). The GCMC was conducted in the Adsorption module of Materials studio 2017 software and usually utilized the Deriding force field to characterize the interaction energy between coal macromolecule and adsorbates such as CO2, CH4, and H2O (Ekramipooya et al., 2021; Yang et al., 2021). Liu et al. investigated the control effects of micropore evolution in coal vitrinite (CV) during coalification based on molecular simulation and proposed that micropore volume decreases with decreasing aliphatic structures (Liu et al., 2016). Then, he used the density functional theory to investigate the effects of chemical composition, disorder degree, and crystallite structure of coal nanopores (0.4–150 nm), clarifying that 2 to 150 nm pores are formed in the space between different basic structural units. Liu and Wilcox (2012) combined the MD and experiment to highlight the control effects of micropores on adsorption capacity and proposed that the adsorption affinity of methane was determined by the larger inaccessible microporosity.
International scholars have clarified that different surface functional groups have various adsorption affinity for CO2 and CH4, which should be attributed to the induced microporous size distributions. However, the contributions of different surface functional groups to the microporous development were still unclear, as well as their influences on the competitive adsorption of CO2 and CH4. Only through the GCMC, MM (molecular mechanics), and MD can reveal the microscopic mechanism of microporous development and adsorption process. Thus, based on the Connolly potential theory and MD, the macromolecular representation was used to calculate the microporous size distribution considering the occurrence of carboxyl, hydroxyl, carbonyl, and ether bond. Then, the microscopic mechanism of CO2 and CH4 competitive adsorption was investigated using GCMC and MD, as well as the influences from different surface functional groups. The outcomes of this study were of significance for the CO2-enhancing CBM recovery and also the carbon capture, utilization, and storage.
Models and calculation methods
Coal macromolecular models
Coal macromolecule was consisted of aromatic clusters, aliphatic chains, oxygen functional groups, and heteroatom groups (Given et al., 1986; Liu et al., 2019). After entering the 21st century, the research of coal molecular geochemistry has achieved fruitful results combined with the further development of computer-aided molecular design especially the development and progress of 13C nuclear magnetic resonance (NMR), Fourier transform infrared spectroscopy (FTIR), X-ray photoelectron spectroscopy and high-resolution transmission electron microscopy, providing the basis for the simulation of gas behaviors and coal geology (Song et al., 2021). The coal macromolecular representation used here was created via elemental analysis, 13C NMR, FTIR, and high-resolution transmission electron microscope from Song et al. (2019), whose predicted 13C NMR spectrum was in line with the experimental results. This indicates the rationality of the representation and has been successfully used to calculate and simulate the adsorption, diffusion, and the induced swelling deformation of gas molecules in coal (Song et al., 2017a, 2017b). The plane representations of the coal macromolecule of different functional groups were depicted in Figure 1(a)–(f), respectively.
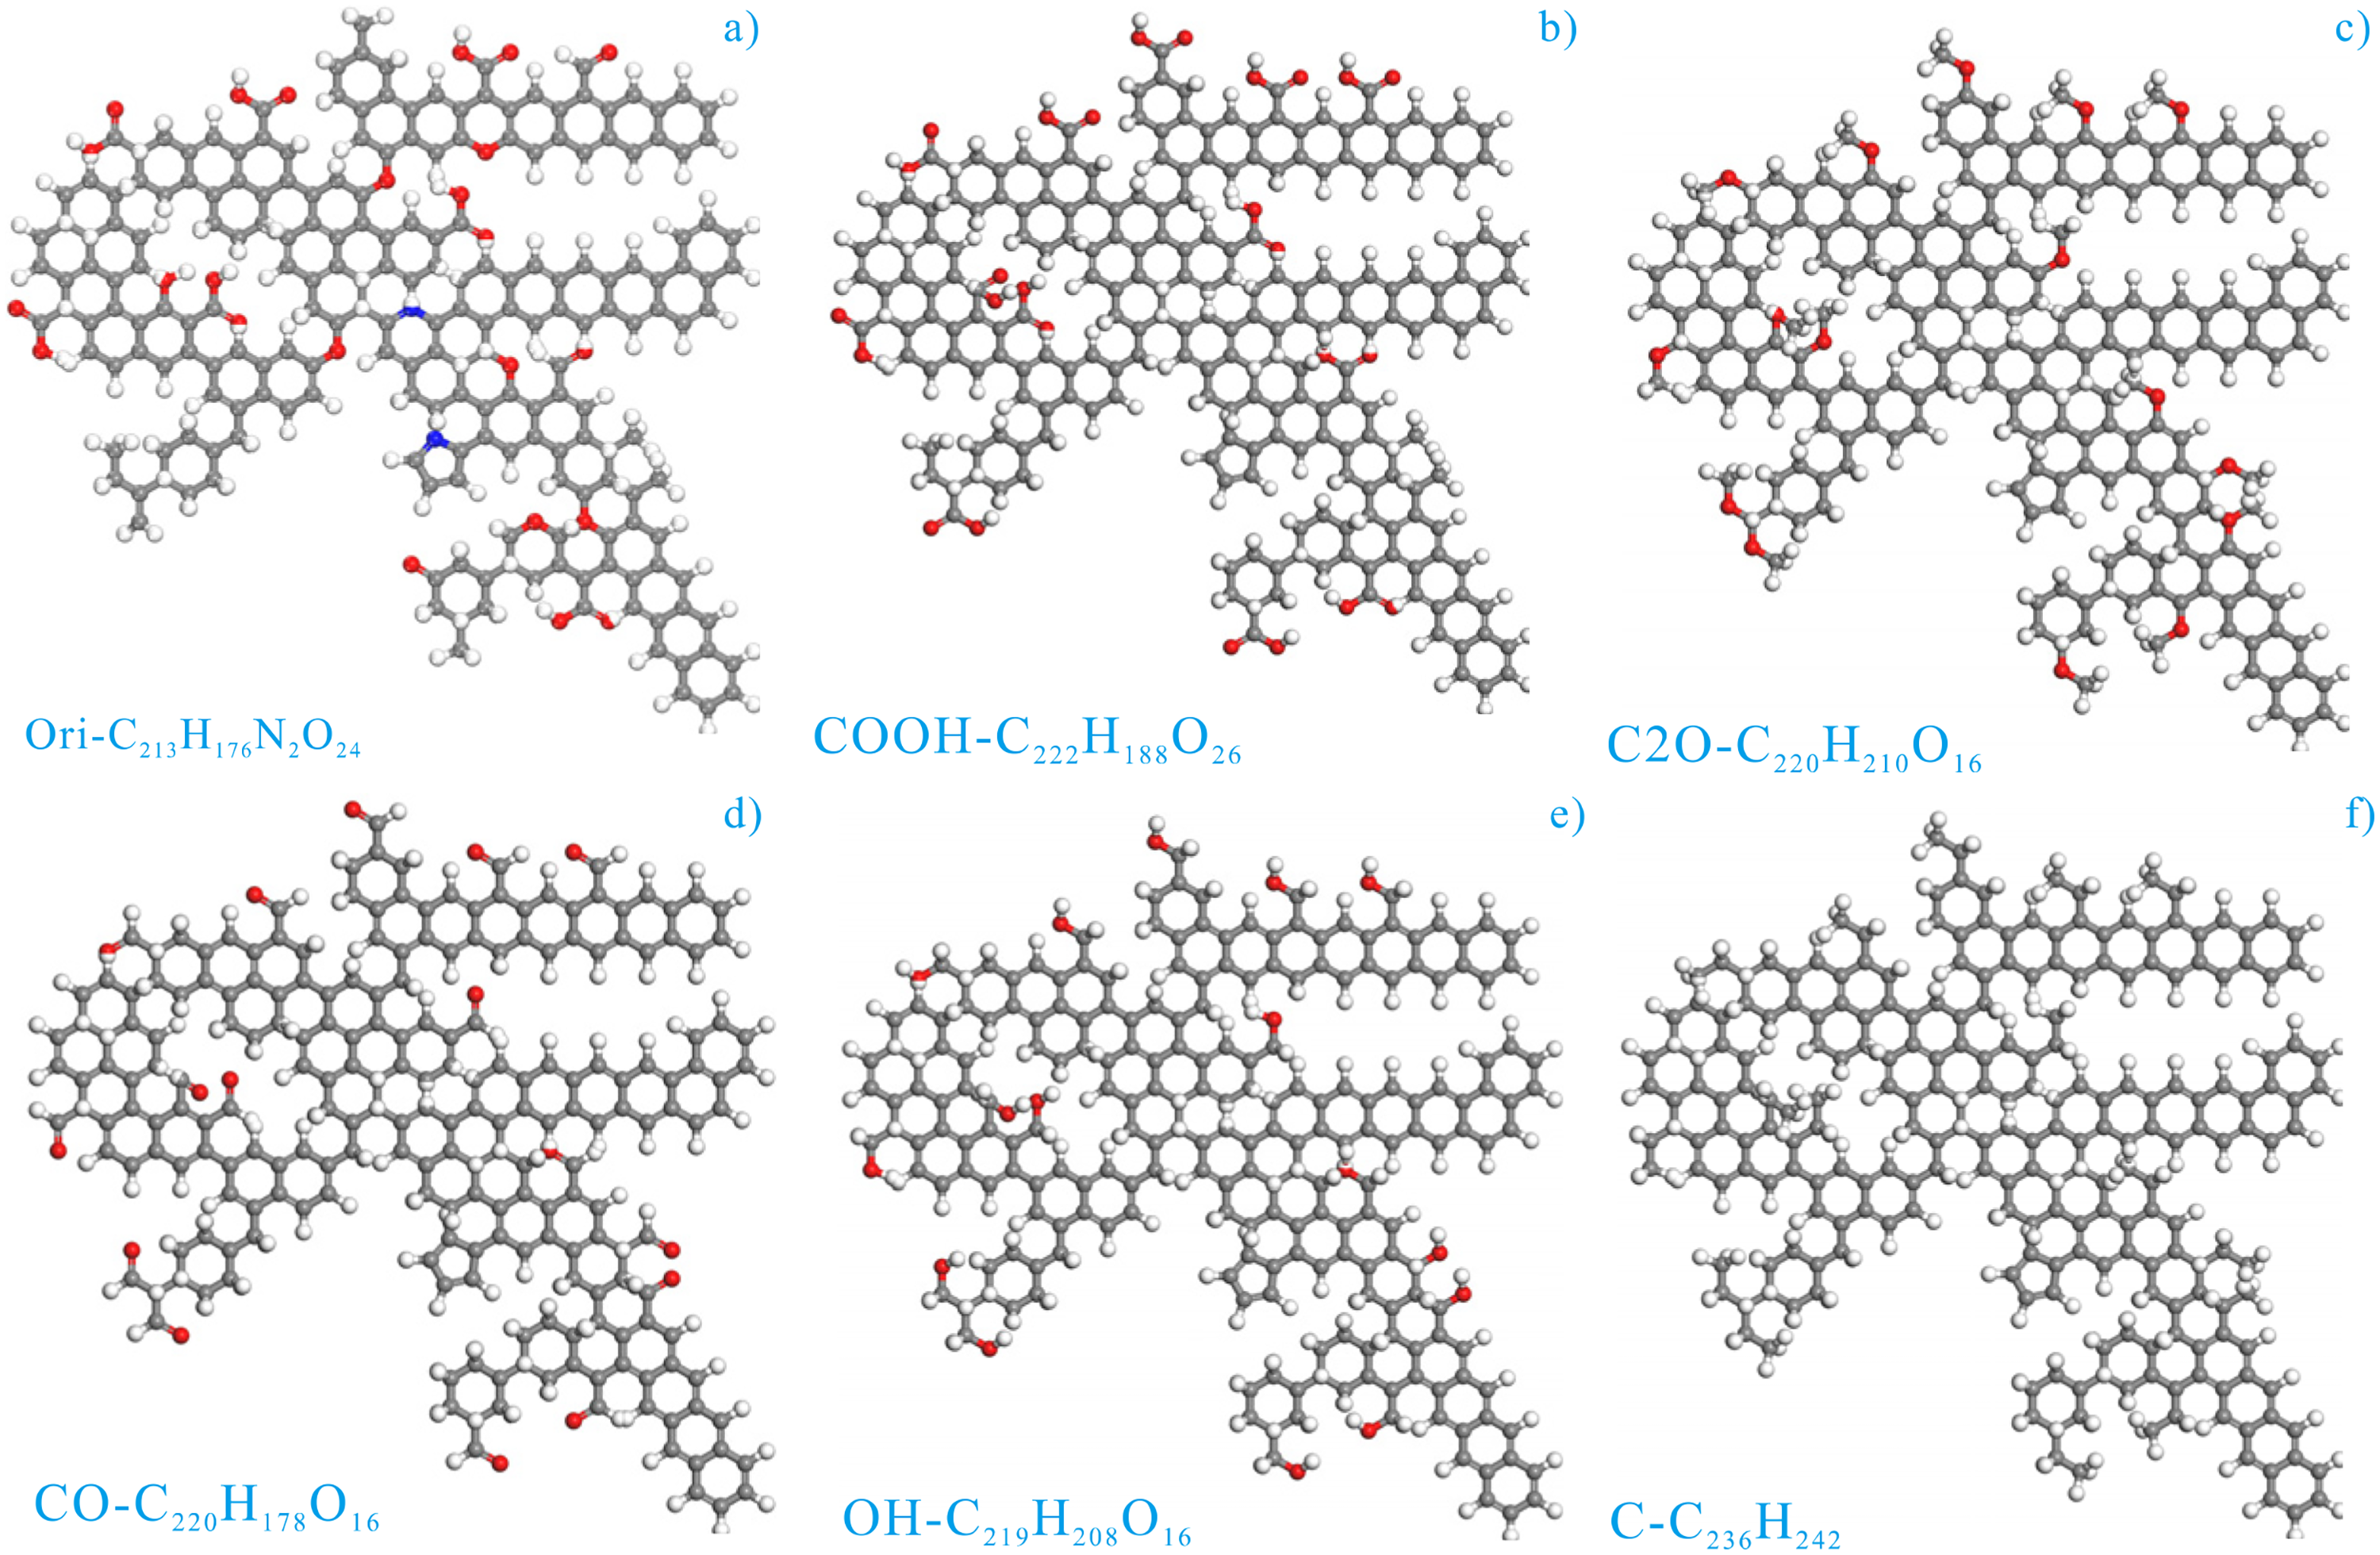
The plane representation of the coal macromolecule of different functional groups: (a) origin representation; (b) coal representation purified by COOH; (c) coal representation purified by ether bond; (d) coal representation purified by carbonyl; (e) coal representation purified by hydroxyl; and (f) coal representation purified by carbon (modified from Song et al., 2019).
The origin coal macromolecule (C215H176N2O24) was depicted in Figure 1(a), which was composed of the oxygen functional groups such as 6 ethers, 1 hydroxyl, 7 carboxyl and 3 carbonyl, as well as 1 pyrrole groups and 1 pyridine groups. To clarify the influence of different oxygen functional groups on the microporous size distribution and gas adsorption behaviors, the origin coal macromolecule was purified by COOH, C2O (ether bond), C = O (simplified by CO, carbonyl), OH, and C (pure carbon atoms), resulting in the different coal macromolecule of different functional groups, which has the chemical formula of C222H188O26, C220H210O16, C220H178O16, C219H208O16, and C216H242, respectively (Song et al., 2019). These coal representations were created to reveal the effects of the specific oxygen functional groups on the microporous size distribution and gas adsorption behaviors, which is attributed to the fact that the quantities and locations of the COOH, C2O, CO, OH, and C are basically identified. Thus, the difference in microporous size distribution and gas adsorption behaviors were induced from the types of various functional groups. Here, they were abbreviated as Ori-CV, COOH-CV, C2O-CV, CO-CV, OH-CV, and C-CV, whose plane configurations were depicted in Figure 1(b)–(f), respectively.
GCMC and MD simulation
The plane configurations in Figure 1 were first hydrogenation saturated and then both the MD and MM were conducted to search the optimized configurations. The MD was conducted in Forcite module using Smart Minimizer as the structural optimization method. After each cycle, MM calculation is performed for the output configuration to ensure the low-energy state. The density simulation in this study was conducted using the Amorphous Cell (AC) module based on the configurations obtained via MM and MD. In combination with the characteristics of the simulation software, the parameter settings are re-corrected. Using the construction task, the medium level was selected as the quality where the density value should be calculated in this module. Then, the molecular structures were imported into the composition.
A number of previous studies on coal and its products have employed the Dreiding force field (Carlson, 1992; Nakamura, 1993; Rogel and Carbognani, 2003), which is a very general force field that can be used for a large number of atom types. It allows calculation of the total energy of a molecular structure as a sum of bonding interactions (EAn = angel, EBo = bond, ETor = torsion, and EIn = inversion) and nonbonding interactions (EVan = van der Waals, Eelec = electrostatic, and Ehy = hydrogen bonds). On the other hand, the physical structural parameter such as density and porosity calculated via Dreiding force field were more close to the experimental values than the other types of force field. Thus, the Dreiding fore field was used with the charge calculation method of (charge equilibrium) QEq method. In the AC module, put the structure model into a periodic boundary condition, where the cell size can be automatically adjusted according to the size of the structure model or manually input. The density value calculated by simulation in this study is 0.4–1.6 g/cm3, and the interval is 0.1 g/cm3. The structural model of the calculated results is optimized by MM and MD until the energy value converges. The variations of the total energy and the corresponding configuration during the density simulation were depicted in Figure 2. The total potential energy first decreases and then increases with the increasing density, also exhibiting a significant concussion phenomenon with density >1.2 g/cm3. Since the actual macromolecular structure is not in the lowest energy state due to relaxation caused by tectonic stress and solvent swelling action, thus, 1.24 g/cm3, the density corresponding to local minimum value total potential energy after 1.2 g/cm3 was selected as the true density, producing its corresponding configuration for the latter calculation (Song et al., 2017a, 2017b).
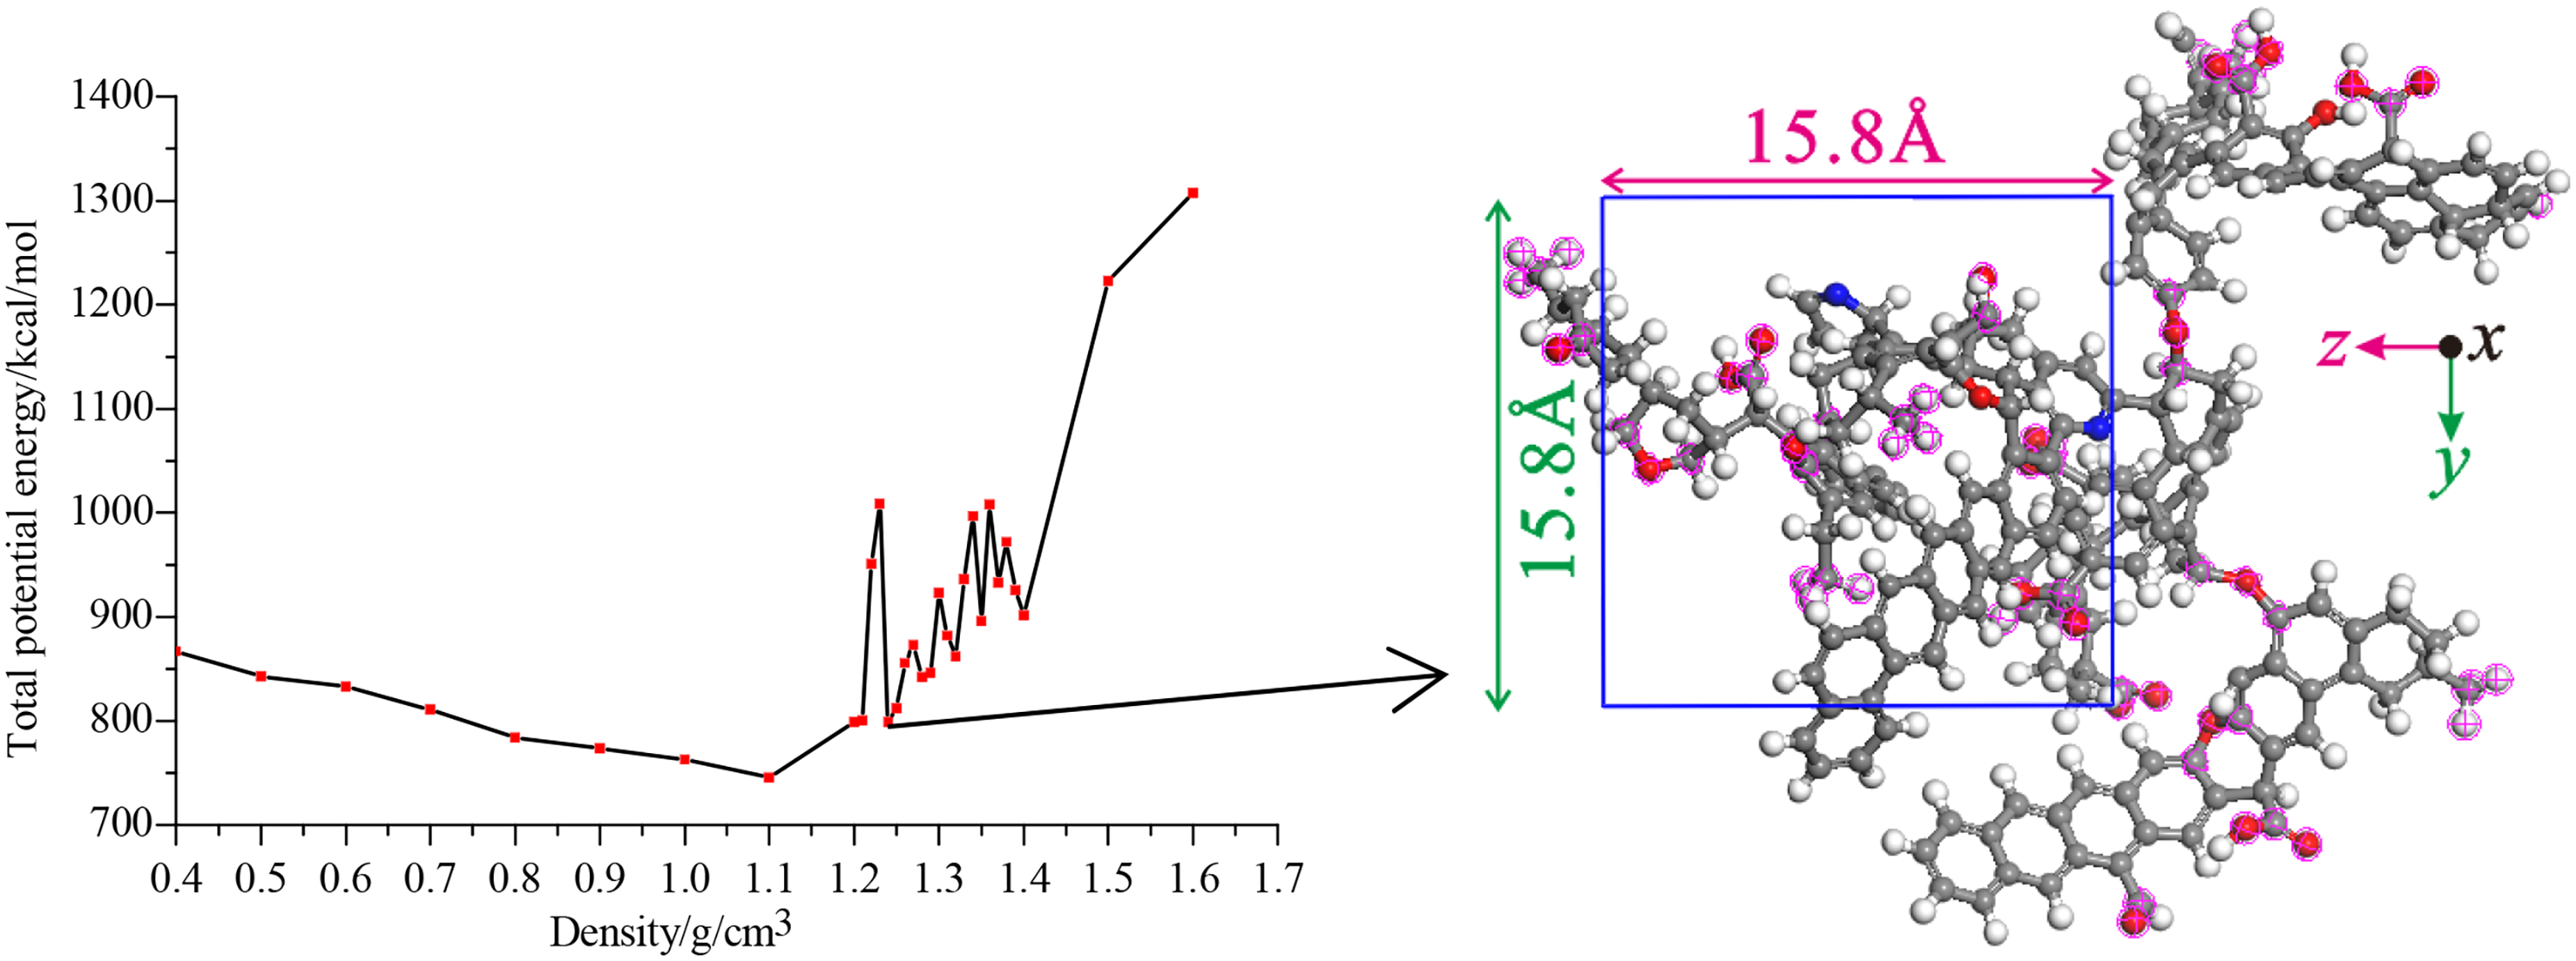
The variation of the total potential energy and the corresponding configuration during the density simulation (Song et al., 2017a, 2017b).
The microporous morphology and size distribution for the coal macromolecule were obtained through the Atom Volumes & Surface tool in the Materials studio 2017 software. The Connolly surfaces and the Solvent surfaces were both calculated using the ultra-fine grid resolution with a vdW scale factor of 1.0000. The maximum solvent radius and Connolly radius were set as 2.0000 Å and 1.0000 Å, respectively. The occupied volume of aromatic skeleton (VoF) and free volume (pore volume, VF) can be obtained in the output interface. Then, the microporous size distribution can be calculated by gradually enhancing the diameter of the molecular probe (Connolly, 1983; Zhao et al., 2016). Finally, the median pore size was obtained using the normal distribution function to fit the microporous size distribution. The pore size distribution within coal macromolecule was depicted in Figure 3(a)–(f) for different coal macromolecular representations, where the gray zone and blue zone were depicted as occupied and free volume, respectively. The following parameters to characterize the microporous development were used: (1) the median pore size (DM), (2) occupied volume of aromatic skeleton (VoF), and (3) free volume (pore volume, VF).
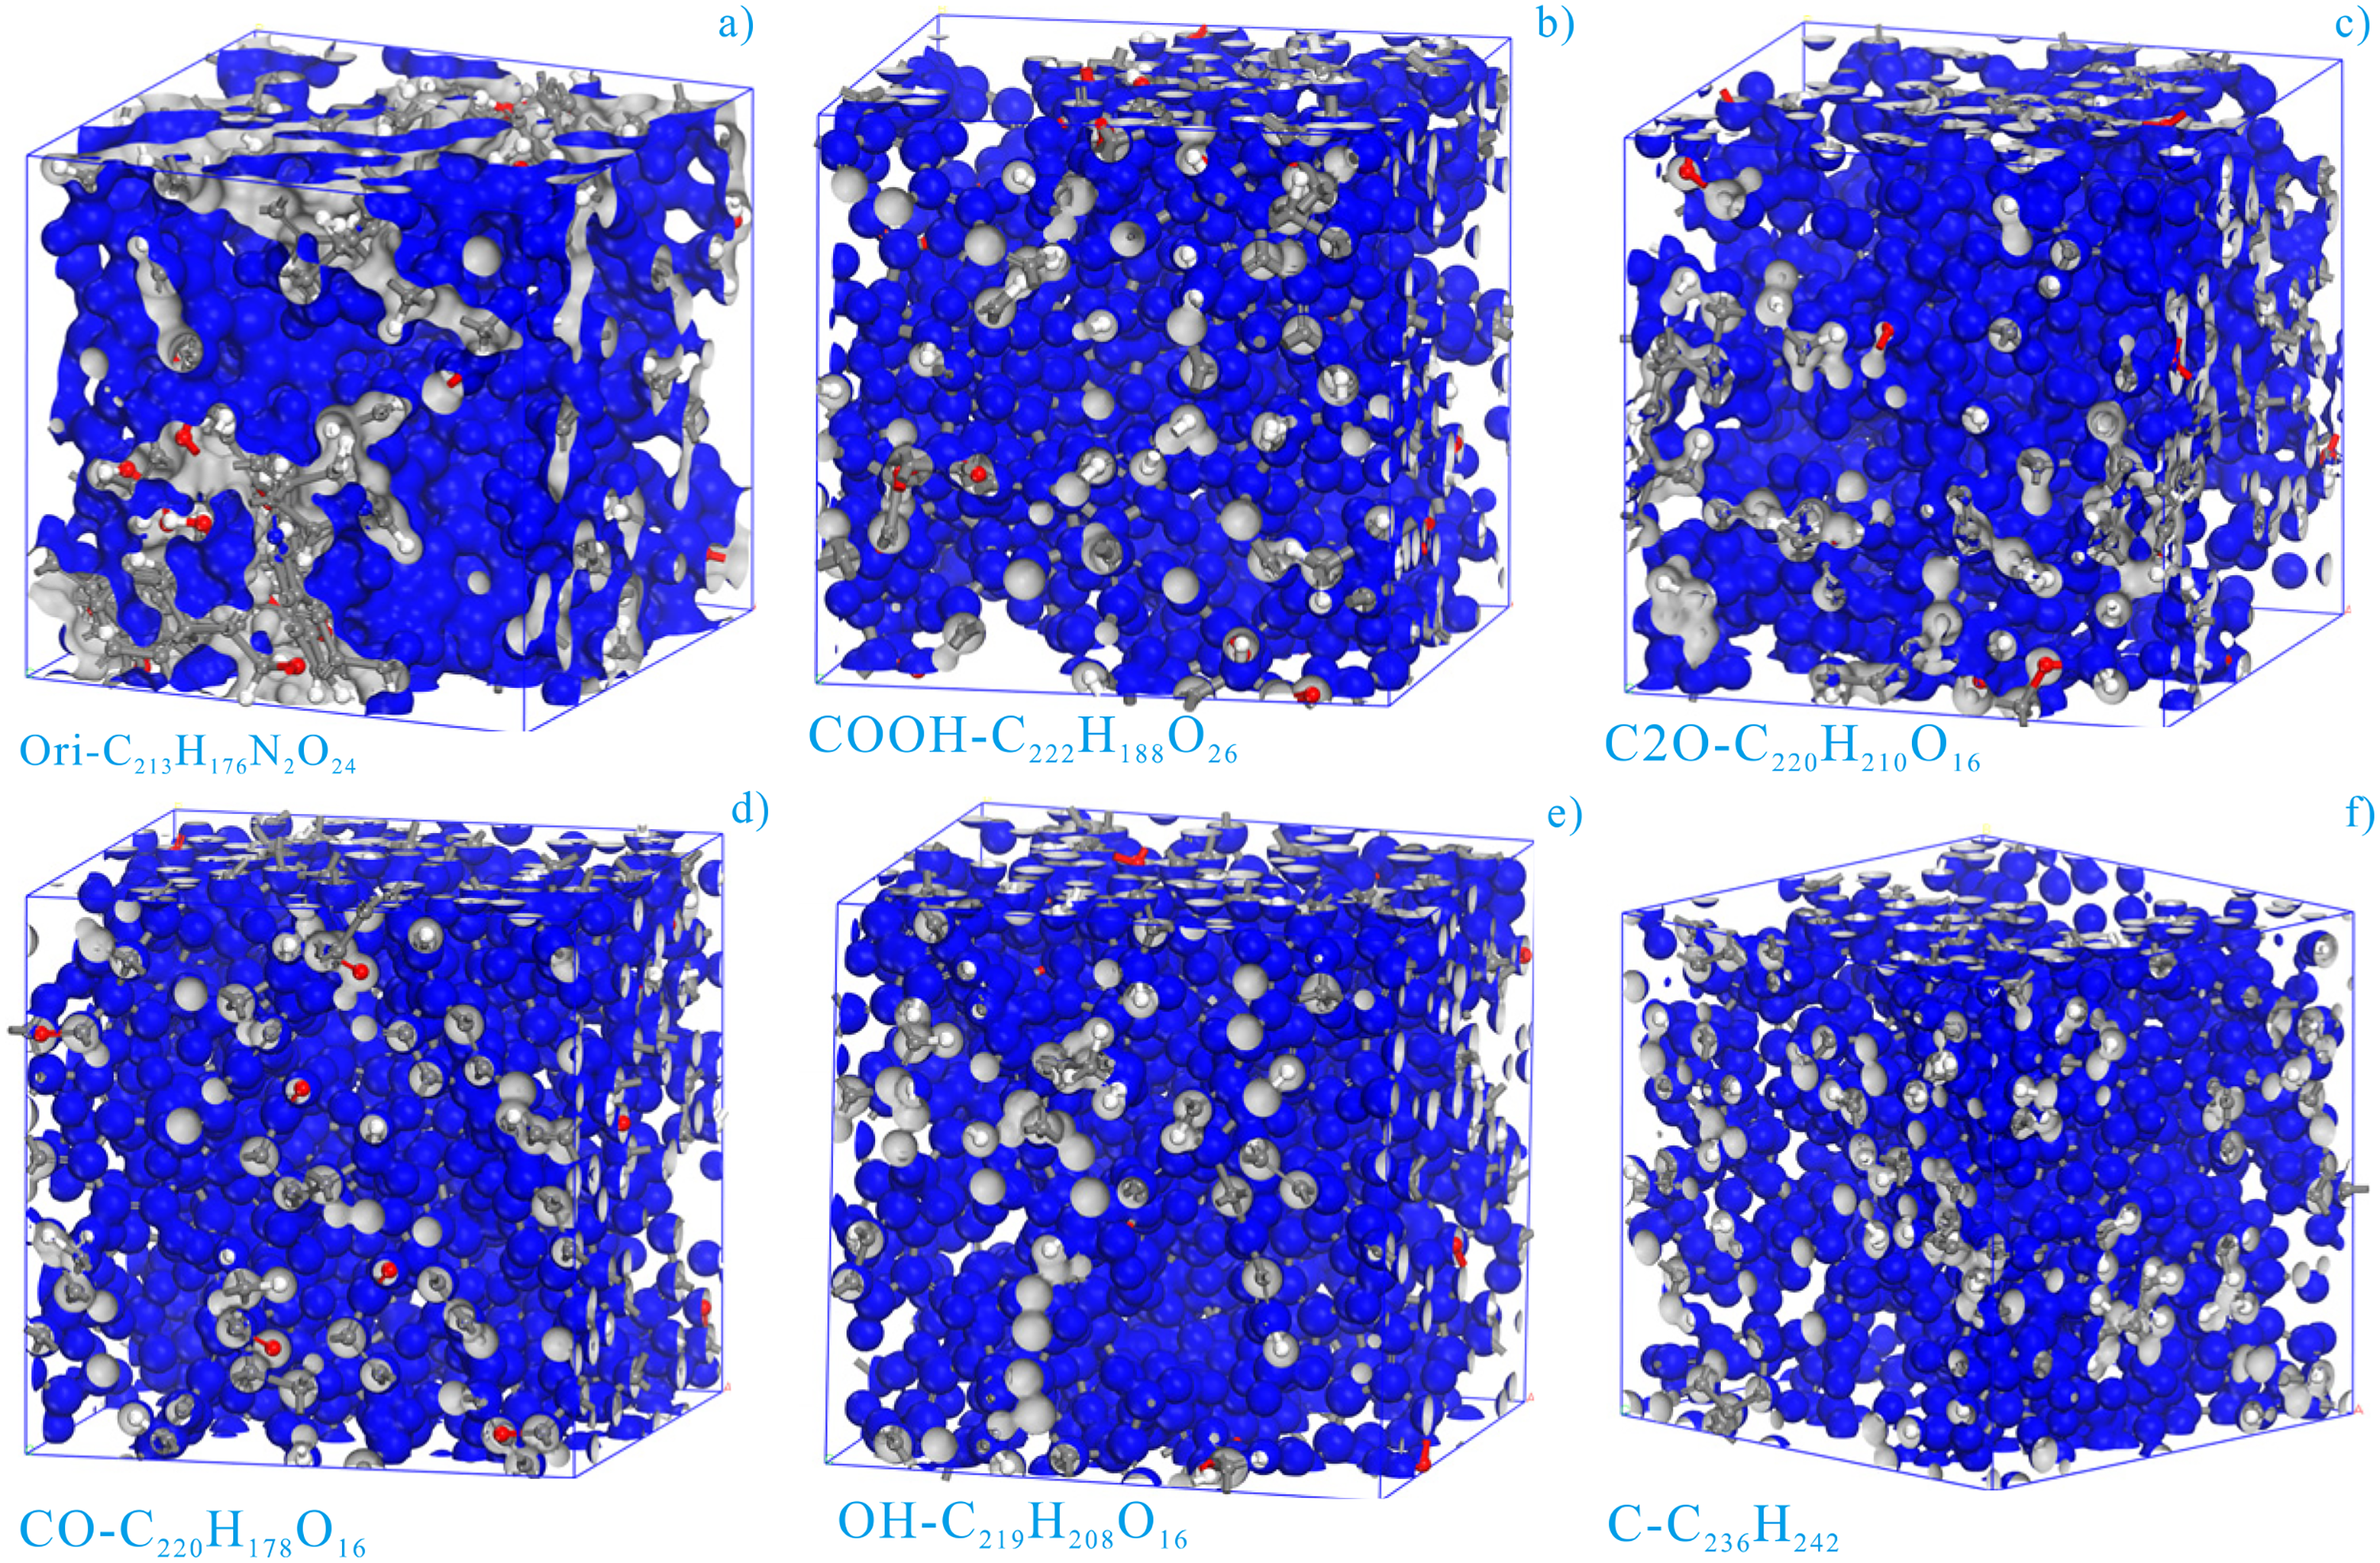
The pore size distribution of different coal macromolecular representations (the gray zone and blue zone were depicted as occupied and free volume, respectively): (a) origin representation; (b) coal representation purified by COOH; (c) coal representation purified by ether bond; (d) coal representation purified by carbonyl; (e) coal representation purified by hydroxyl; and (f) coal representation purified by carbon.
Monte Carlo simulation is based on statistical sampling method which uses the random number, sampling, or simulation of random variable statistics to obtain the digital characteristics of a variable. The GCMC refers to the Monte Carlo simulation of constant temperature, volume, and chemical potential conducted in the Grand Canonical Ensemble (Cheng et al., 2004). The adsorption configuration can be obtained using the Local task (Cheng et al., 2004) and the sampling method is based on the Metropolis rule (Metropolis et al., 1953). Specifically, the probability of exchange being accepted is 39%, the probability of conformational isomer being accepted is 20%, the probability of rotation being accepted is 20%, the probability of translation being accepted is 20%, and the probability of Regrow growth being accepted is 1%, which reduces the energy of the system and forms a new configuration. The calculation quality was set as “Medium” and the number of maximum loading steps was 100,000 with a production step of 100,000 as well. The temperature cycle was 4 for the annealing simulation.
Results and discussion
Microporous size distribution
The variations of DM and VO at different temperatures were depicted in Figure 4(a) and (b). The median pore size reflected the median value of the pore diameter within the coal macromolecules. It can be found that the DM of the different coal macromolecules all decrease with the decreasing temperature. At 298 K, the DM follows the order of COOH-CV > OH-CV > CO-CV > C2O > Ori-CV > C-CV, indicating that the COOH and OH could induce much more larger micropores than other oxygen functional groups and origin coal macromolecule, as well as the carbon-purified coal macromolecule. The DM of CO-CV, C2O, Ori-CV, and C-CV was basically the same at this temperature. Then, the DM of COOH-CV, OH-CV, CO-CV, and C2O decreases with the increase of the temperature and the reduce rate of the former two was significantly higher than the latter two, suggesting that the diameter of micropores induced from the COOH and OH was more sensitive than the CO and C2O. And at the temperature of 358 K, the DM of the oxygen functional groups still follows the order of COOH-CV > OH-CV > CO-CV > C2O. However, that of Ori-CV and C-CV keeps the stable with the increase of the temperature (Figure 4(a)), suggesting that they are insensitive to the variations of the temperature for Ori-CV and C-CV. It should be noted that the DM of Ori-CV and C-CV was higher than that of the OH-CV, CO-CV, and C2O.
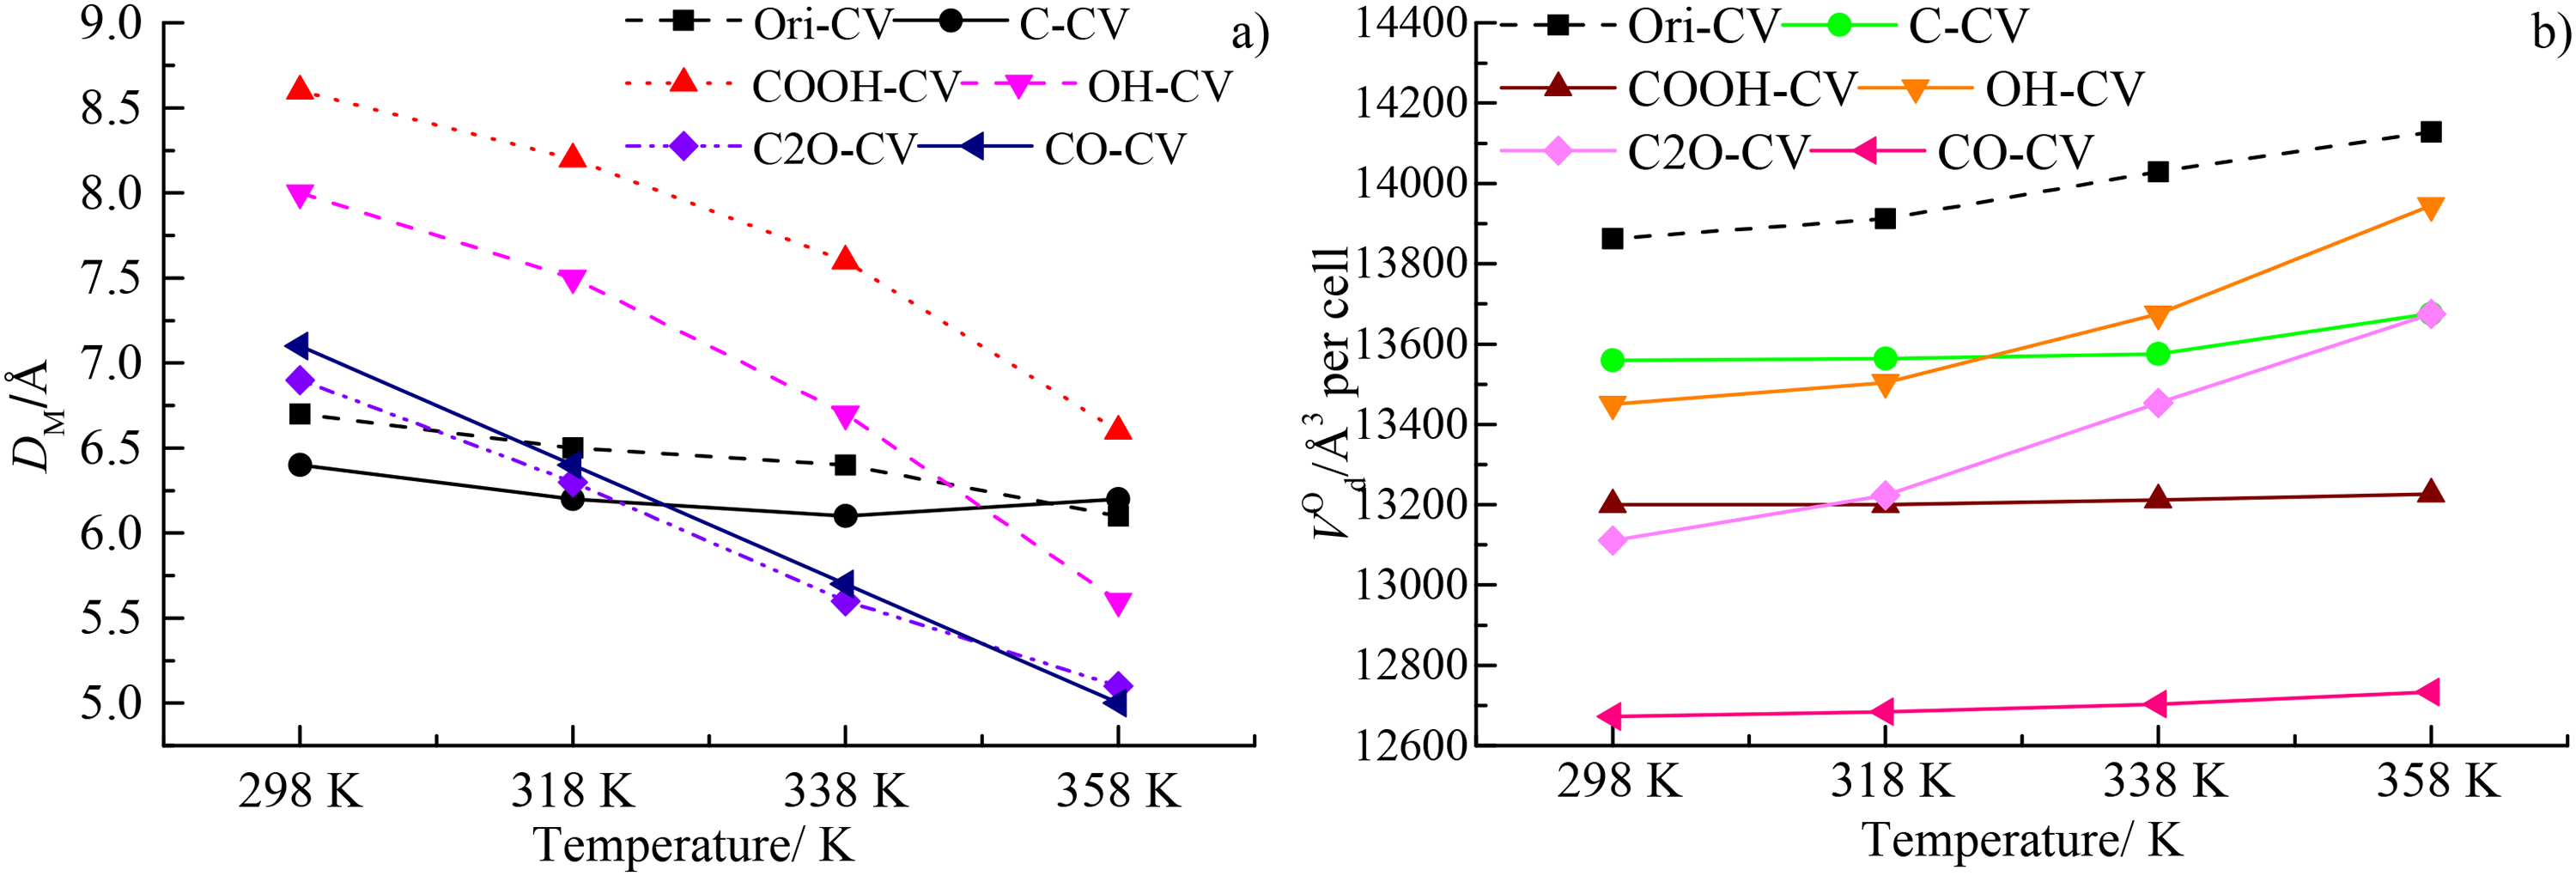
The variations of (a) the median pore size (DM) and (b) solid phase which is occupied by aromatic skeleton (VO) under different temperatures.
The variations of the VO at different temperatures were depicted in Figure 4(b). Unlike the DM, the VO follows the order of Ori-CV > C-CV > OH-CV > COOH-CV > C2O-CV > CO-CV at 298 K, suggesting that the occupied volume of the Ori-CV and C-CV was the highest compared with the coal macromolecule purified by different oxygen functional groups. The inclusions of the oxygen functional groups reduces the occupied volume of coal macromolecule, which should be attributed the variations of the van der Waals force within the coal macromolecules. Then, the occupied volume of the Ori-CV, OH-CV, and C2O increases gradually with the increasing temperature, however, that of the other coal macromolecule such as the C-CV, COOH-CV, and CO-CV change slightly with the increasing temperature, suggesting that the inclusion of the oxygen functional groups enhances the heat sensibility of the occupied volume. At the temperature of 338 K and 358 K, the occupied volume follows the order of Ori-CV > OH-CV > C-CV > C2O-CV > COOH-CV > CO-CV, also indicating the oxygen functional groups could induced from more occupied volume than the pure carbon atoms. Compared with the variations of the DM and VO, it could be concluded that the DM and VO have the opposite change trend with the increasing temperature. The increasing VO for the coal macromolecule should be attributed to the enhancement of the thermoplasticity of the organic molecules. At the highest temperature of 358 K considered here, the VO follows the order of Ori-CV > OH-CV > C-CV≈COOH-CV > C2O-CV > CO-CV, which is basically contrary to the variation of DM.
The variations of free volume (VF) and accessible surface area (SA) under different temperatures were depicted in Figure 5(a) and (b), respectively. Here the unit of the VF and SA were Å3 and Å2, respectively, they can be converted into cm3/g and m2/g using the cell size (15.8 Å × 15.8 Å × 15.8 Å) and density (1.24 g/cm2) as mentioned above. The conversion equation was 1 Å3 per cell = 1/(15.83 × 1.24) cm3/g and 1 Å2 per cell = (1 × 10⁴)/(15.83 × 1.24) m2/g, respectively. Since the influence of different functional groups will be discussed here, the microscopic unit (Å3 and Å2) were still utilized here to analyze the microporous development in this study. At 298 K, the VF follows the order of OH-CV > Ori-CV≈CO-CV≈COOH-CV > C2O-CV > C-CV, indicating that the inclusion of OH could increase more free volume than the pure carbon atoms. The induced effects of carbonyl and carboxyl functional groups were basically the same and the pure carbon atoms have the negative influence for the development of the free volume of the micropores within coal macromolecule. The free volume (VF) gradually increases with the increasing temperature, especially for the OH-CV and COOH-CV. The increase rate of the C-CV, Ori-CV, and CO-CV was lower compared with the OH-CV and COOH-CV, indicating the insensitivity of the C-CV, Ori-CV, and CO-CV in response to the increasing temperature. Compared with the variation of the DM, the COOH and OH could induce higher micropore than the other functional groups such as CO and C2O. The pure carbon atoms have a negative effect on the microporous development. The ether bond has the lowest development among these functional groups. The synergistic effect of the OH, COOH, CO, and C2O results in the higher VF of the Ori-CV than C-CV (Figure 5(a)), also indicating the induced effects of the OH and COOH for microporous development.
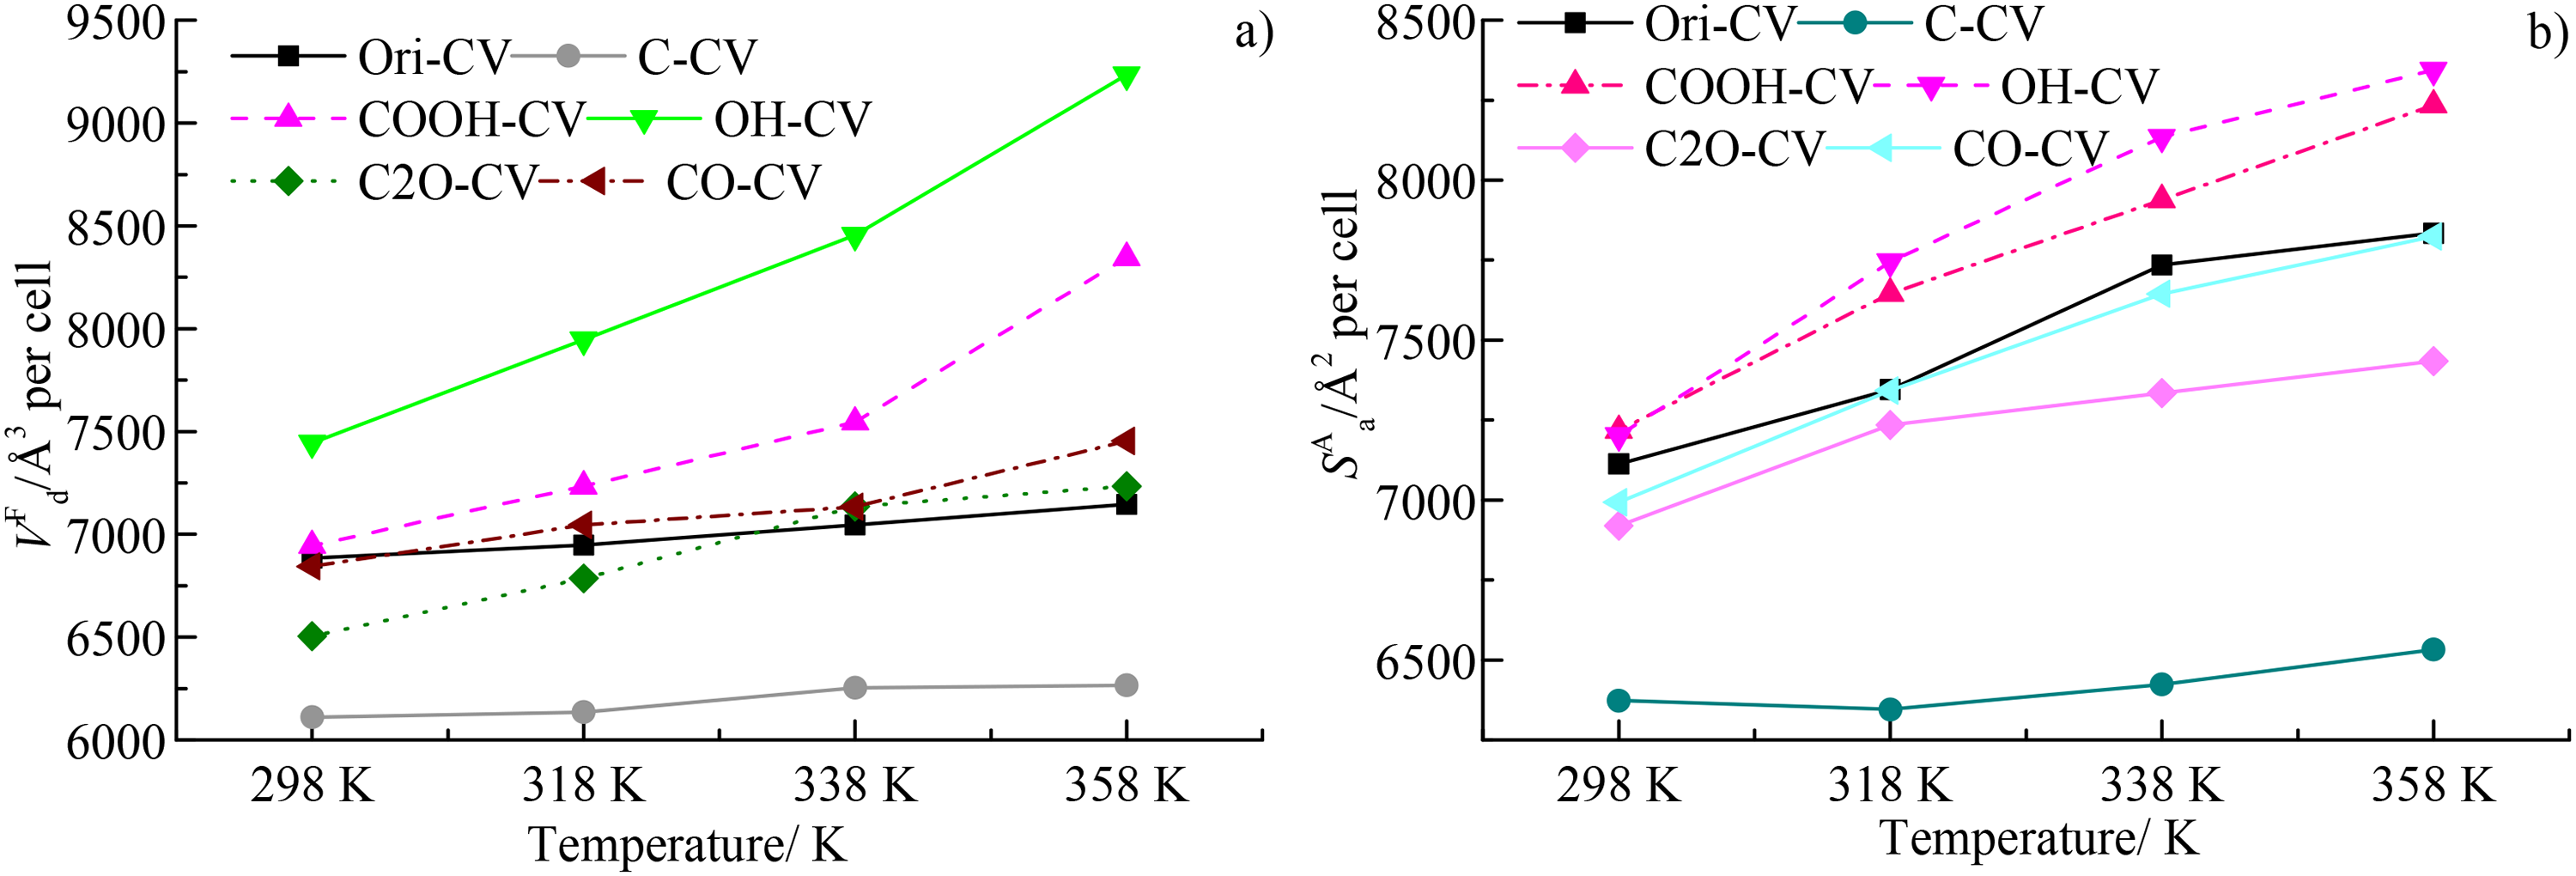
The variations of (a) a void phase known as free volume (VF) and (b) an accessible surface area (SA) under different temperatures.
The variations of SA for various coal macromolecules purified by different oxygen functional groups were depicted in Figure 5(b). At 298 K, the SA of OH-CV, Ori-CV, CO-CV, COOH-CV, and C2O-CV were basically the same and they were significantly higher than that of C-CV, also suggesting that the inclusion of oxygen functional groups could enhance the development of the micropores in coal. Then, the SA increases with the increase of the temperature. At the temperature of 298 K and 318 K, the SA for various coal macromolecules follows the order of OH-CV > CO-CV > COOH-CV > Ori-CV≈C2O-CV > C-CV. It should be noted that this order was not always consistent with the variation of VF (Figure 5(b)). With the further increase of temperature, the SA increases linearly. At 338 K and 358 K, the SA follows the order of OH-CV > COOH-CV > CO-CV > C2O-CV > Ori-CV > C-CV, suggesting that the OH and COOH could induce more micropores than the other functional groups. The porosity of different coal macromolecule can be calculated the VF and VO and the variation was depicted in Figure 6. It was larger than the values reported in previous reference (Islam et al., 2020; Liu et al., 2023; Ramandi et al., 2016) and was basically consistent with the variations of VF and VO. The higher porosity of these coal macromolecules should be attributed to two reasons: (1) the molecular probe could detect both the open and closed pores within coal macromolecule, however, the experimental methods can only detect the accessible micropores and (2) the coal contains mineral matters and they can plug and fill into the micropores.
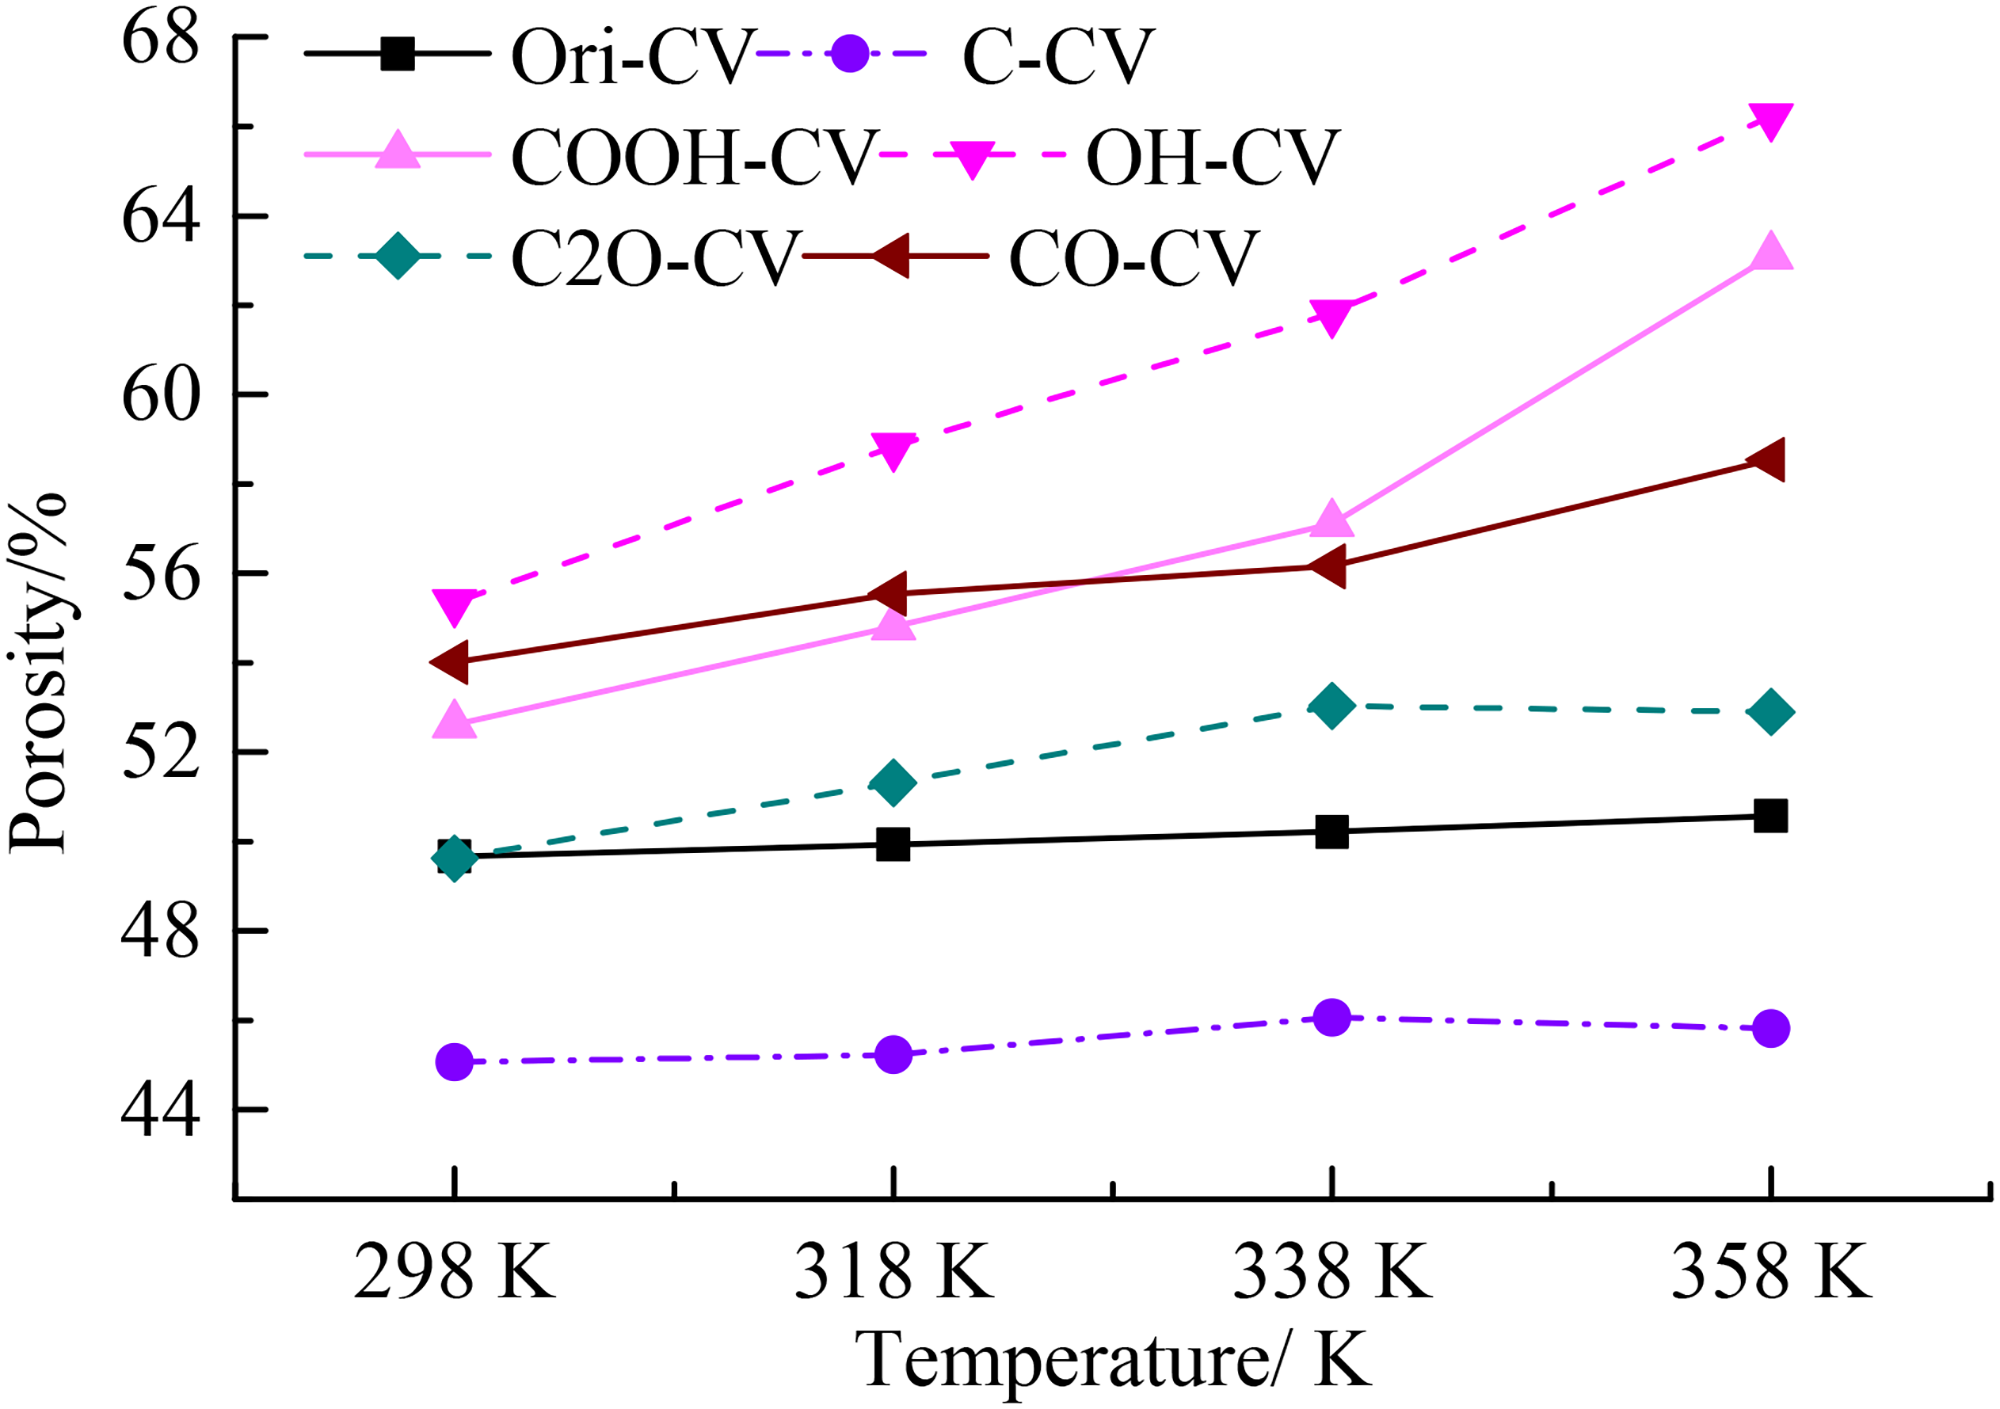
The variations of porosity under different temperatures.
Single adsorption
The simulation method here used the procedure proposed by Song et al. (2017a). Firstly, the CH4 molecules were added one by one to the coal macromolecule using the Metropolis rule and Deriding force field, producing the adsorption configuration and potential energy composition. Then, the total potential energy decreases as the increasing number of the CH4 molecules, suggesting that the adsorption process was an advanced process to approach the lowest energy configuration. The adsorption process could continue as long as the total potential energy decreases, finally, the adsorption process ends up if the total potential energy increases at a certain number of CH4 molecules, indicating the saturated adsorption state of the adsorption for different coal macromolecules. The saturated adsorption configuration and the corresponding potential energy distribution.
The variations of saturated adsorption capacity for CH4 for different coal macromolecules were depicted in Figure 7(a). The adsorption capacities of the OH-CV, Ori-CV, and COOH-CV were significantly higher than C2O-CV, CO-CV, and C-CV and they all decrease with the decreasing temperature, which should be attributed to the reduction in activities of molecular kinetic energy. However, there exists significant difference in the decrease rate for different coal macromolecules. At the temperature of higher than 318 K, the CO-CV, and C-CV have a higher reduction rate than the others, suggesting their temperature sensitivity, followed by the Ori-CV, and COOH-CV. The OH-CV and C2O-CV have a lower temperature sensitivity and they both show a volatile decrease with the increasing temperature (Figure 7(a)). The Figure 7(b) depicted the variations of saturated adsorption capacity for CO2 and it could be clearly showed that the saturated adsorption capacity for CO2 was significantly higher than that of CH4 for all the coal macromolecules considered here, indicating the adsorption advantages of CO2 over CH4 despite of various functional groups. At lower temperatures, the adsorption capacity of CO2 follows the order of OH-CV > CO-CV > COOH-CV > C2O-CV > C-CV, which was basically consistent with that of CH4. The saturated adsorption capacity of CO2 in coals purified by oxygen functional groups decreases significantly with the increase of the temperature, however, the saturated adsorption capacity of C-CV decreases slightly or even increases with the increase of temperature (Figure 7(b)), indicating its temperature insensitivity in response to the heat.
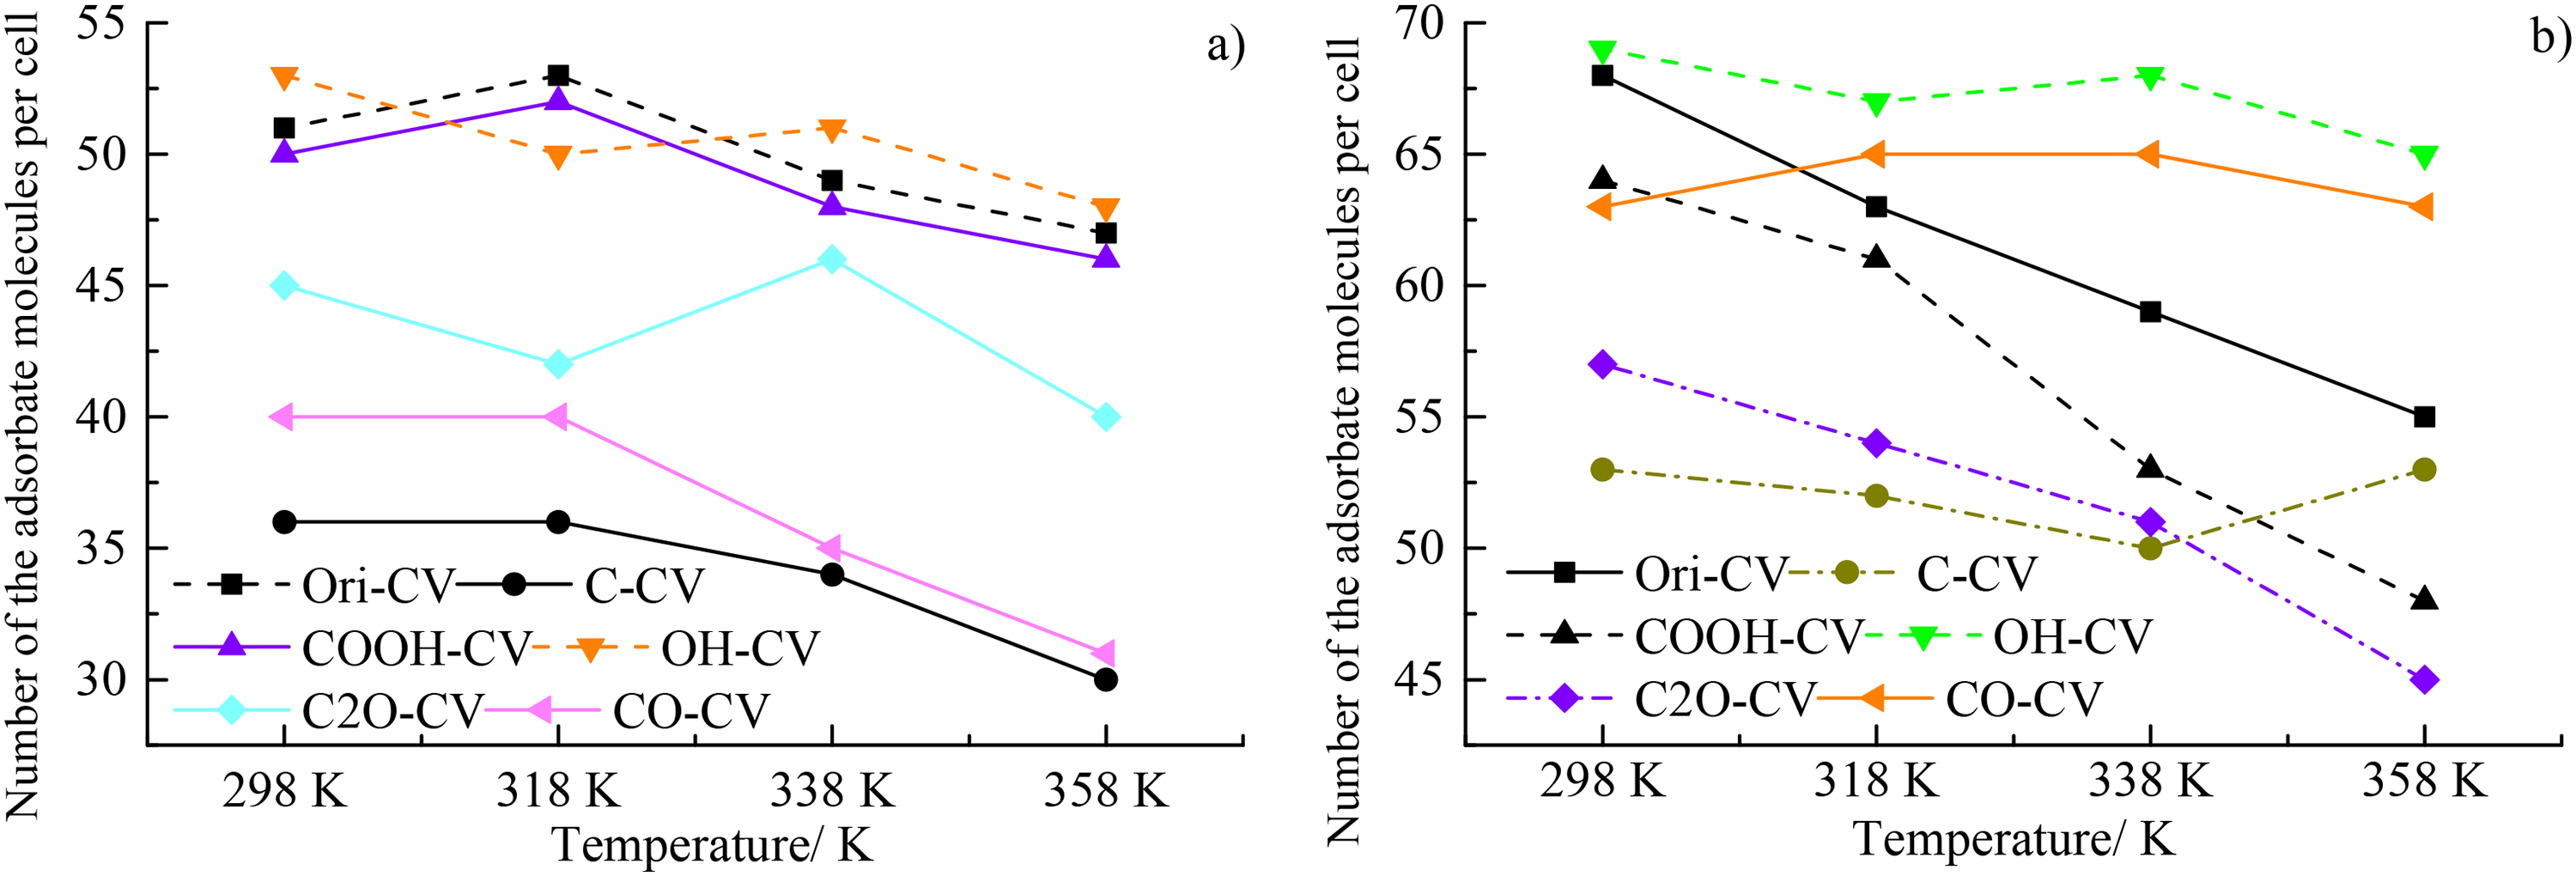
The variations of saturated adsorption capacity for (a) CH4 and (b) CO2 for different coal macromolecules.
Besides the adsorption configuration, the adsorption isotherm of CO2 and CH4 can be calculated using the Isotherm task in the adsorption module. The adsorption isotherm (298 K) of CH4 and CO2 at the pure adsorption case was depicted in Figure 8(a) and (b), respectively. The adsorption amounts first increases sharply and then keeps stable with the increasing pressure. At the higher pressures, the maximum adsorption amounts of CH4 follow the order of OH-CV > COOH-CV > Ori-CV≈CO-CV > C-CV≈C2O > CV, suggesting the higher adsorption affinity of OH and COOH than pure carbon atoms and other oxygen functional groups (Figure 8(a)). The calculation results of Isotherm task were in line with the Locate task. It should be noted that the OH and COOH have a significantly higher adsorption amount than other coal macromolecules and the others have a close adsorption amount, which is consistent with the higher micropores of OH and COOH discussed above. Here, the adsorption curves of CH4 were more smooth than CO2, the latter was more complex with more mutation points (Figure 8(a) and (b)). The maximum adsorption amounts of CO2 follow the order of Ori-CV > OH-CV≈COOH-CV > C2O-CV > CO-CV > C-CV (Figure 8(b)), in line with the results of Locate task.
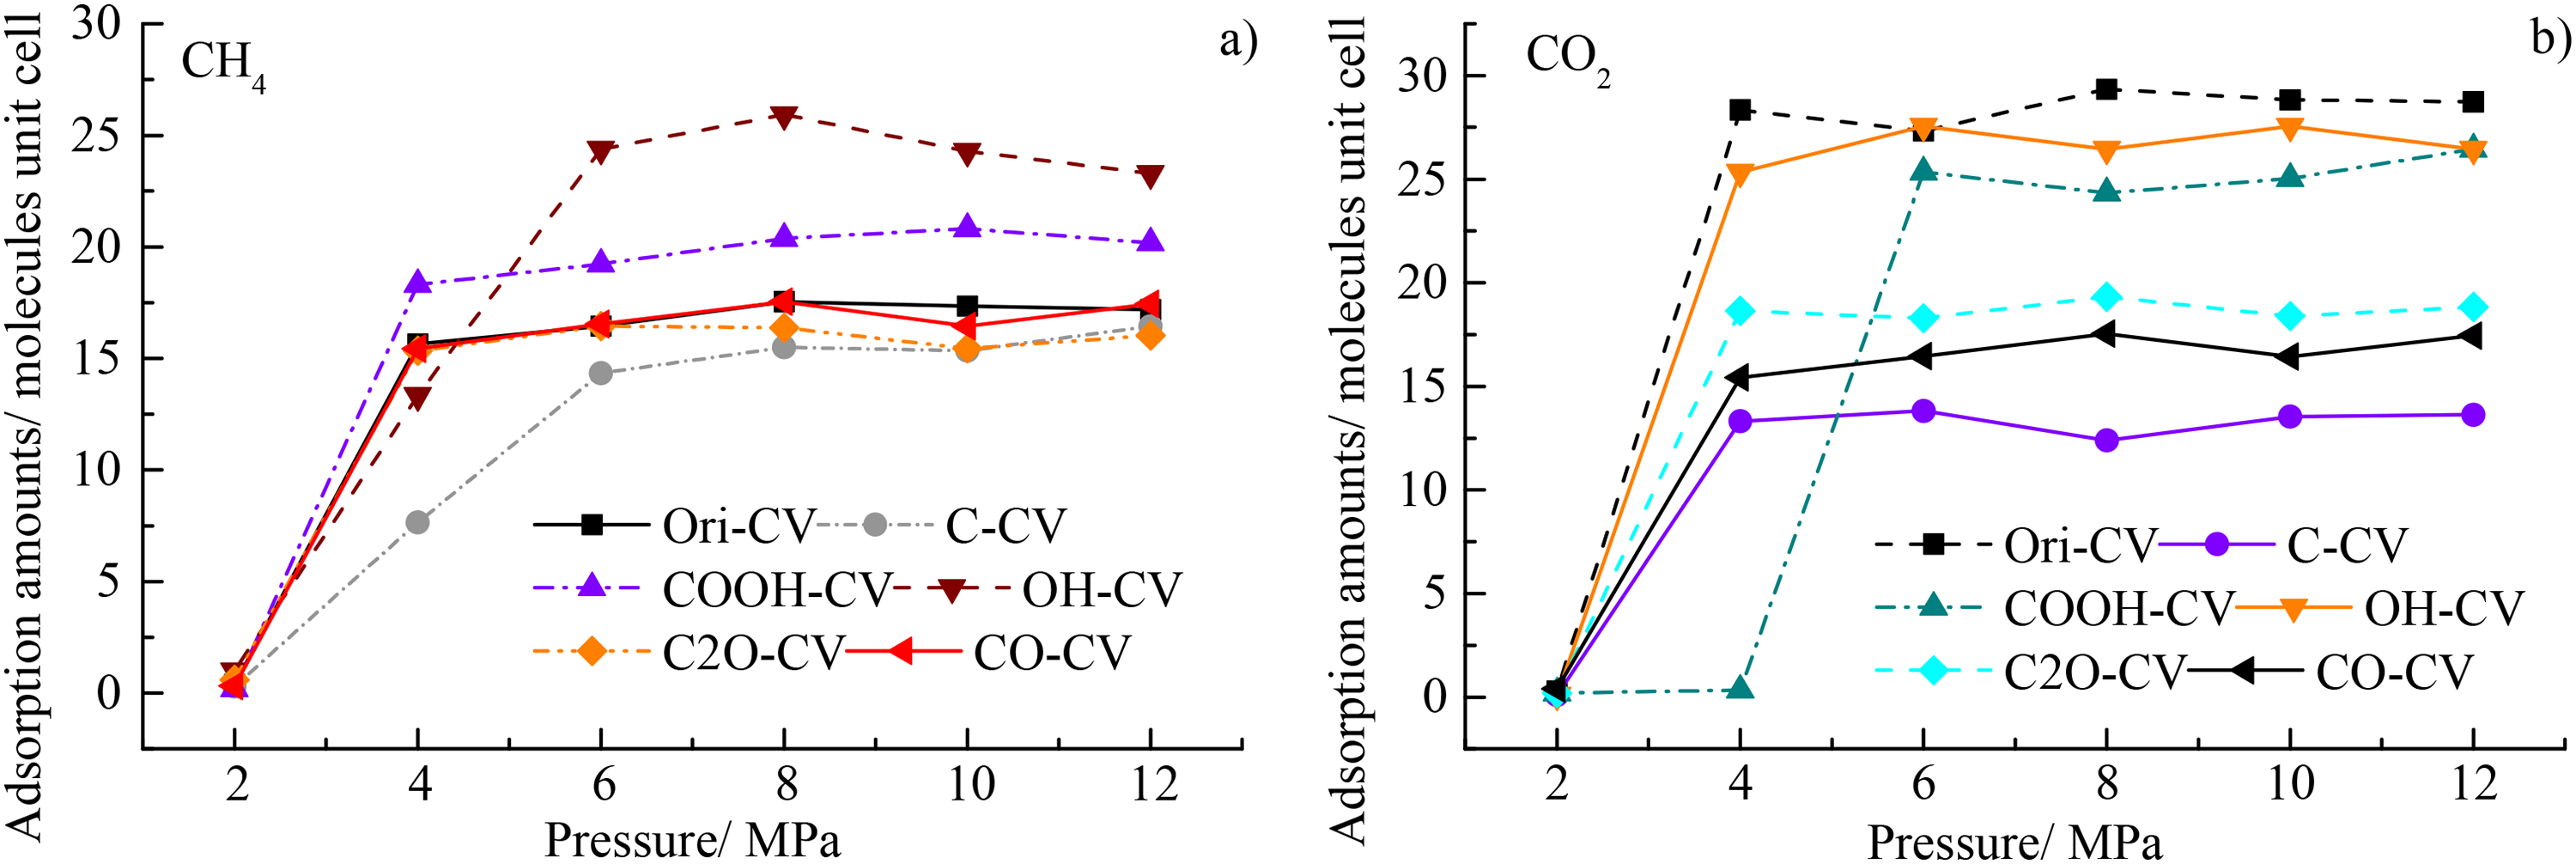
The adsorption isotherm of (a) CH4 and (b) CO2 at the pure adsorption case.
Although the results in Figure 8(b) were obtained via the Isotherm task, the maximum adsorption amount of CO2 was still higher than CH4 for the coal representations such as Ori-CV, OH-CV, COOH-CV, C2O-CV, and CO-CV. However, the maximum adsorption amounts of CO2 and CH4 are similar in Figure 8(b), it was insufficient to analyze the adsorption preference of CO2 and CH4 due to two reasons: (1) this was the result from the pure gas adsorption and can’t depict the binary competitive adsorption system; (2) the “maximum adsorption amounts” in Figure 8 here were different from the “saturated adsorption capacity” in Figure 7. Thus, the adsorption isotherm of CO2 and CH4 here was to depict the adsorption affinity of different functional groups. The adsorption selectivity of CO2 over CH4 will be discussed in the following co-adsorption results.
Co-adsorption
The competitive adsorption configuration of CO2 and CH4 onto coal macromolecules purified by different oxygen functional groups can be calculated using the Locate Task and Dreiding force field. First, 20 CO2 molecules were absorbed onto these coal macromolecules and then geometrically and energetically optimized using the MD in the Forcite Task. Song et al. (2017a, 2017b) utilized the GCMC and DFT to clarify the optimal adsorption sites of the CV macromolecules and found that the aromatic clusters have higher adsorption energy for both CH4 and CO2, indicating the stronger adsorption affinity of aromatic clusters than aliphatic structures and oxygen functional groups. The outcomes of this study also support this conclusion. Then, these adsorption configurations were used to simulate the adsorption amounts of CH4 at the case of 20 CO2 molecules. The saturated adsorption capacity of CH4 follows the order of COOH-CV > C2O-CV > OH-CV > Ori-CV > CO-CV > C-CV, indicating that the COOH, C2O, and OH have a higher adsorption affinity at the competitive adsorption of CO2-CH4, followed by the Ori-CV and CO-CV. The higher adsorption amounts of CO2 than CH4 here also suggested the stronger adsorption affinity of CO2 over CH4. At the competitive adsorption situation, the optimal adsorption sites could preferentially be occupied by CO2 and CH4 trends to settle at the suboptimal adsorption sites.
An important parameter adsorption selectivity was used to characterize the adsorption selectivity of CO2 over CH4, which was defined as: SA/B = (xA/xB) adsorbed /(yA/yB) bulk, where the xi denotes the average mole fraction of component i and the subscripts ()adsorbed and ()bulk refer to the quantities of adsorbed phase in pores and bulk phases, respectively. The variations of adsorption selectivity of CO2 over CH4 under different pressures and different temperatures were depicted in Figure 9(a) and (b), respectively. All the SA/B was higher than 1 here, indicating the adsorption preference of CO2 over CH4 for almost all the cases. For the pressure dependence, the SA/B first decreases significantly for the pressure of < 4 MPa and then slightly for the pressures of >4 MPa with the increasing pressure, indicating that high pressure was not conductive to the replacement of CH4 with CO2. For almost all the pressures here, the SA/B follows the order of COOH-CV > OH-CV≈C2O-CV≈Ori-CV≈CO-CV≈C-CV, indicating the highest adsorption preference of CO2 over CH4 for COOH-CV > OH-CV. However, for the temperature dependence, the SA/B of COOH-CV was significantly higher than that of the other coal macromolecules and the others have the close SA/B, suggesting that the temperature has an interference effect for the competitive adsorption of CO2 and CH4. All the SA/B here gradually decreases with the decreasing temperatures, indicating that high temperature was unfavorable for the replacement of CH4 with CO2 for the temperatures of 298 K to 358 K here.
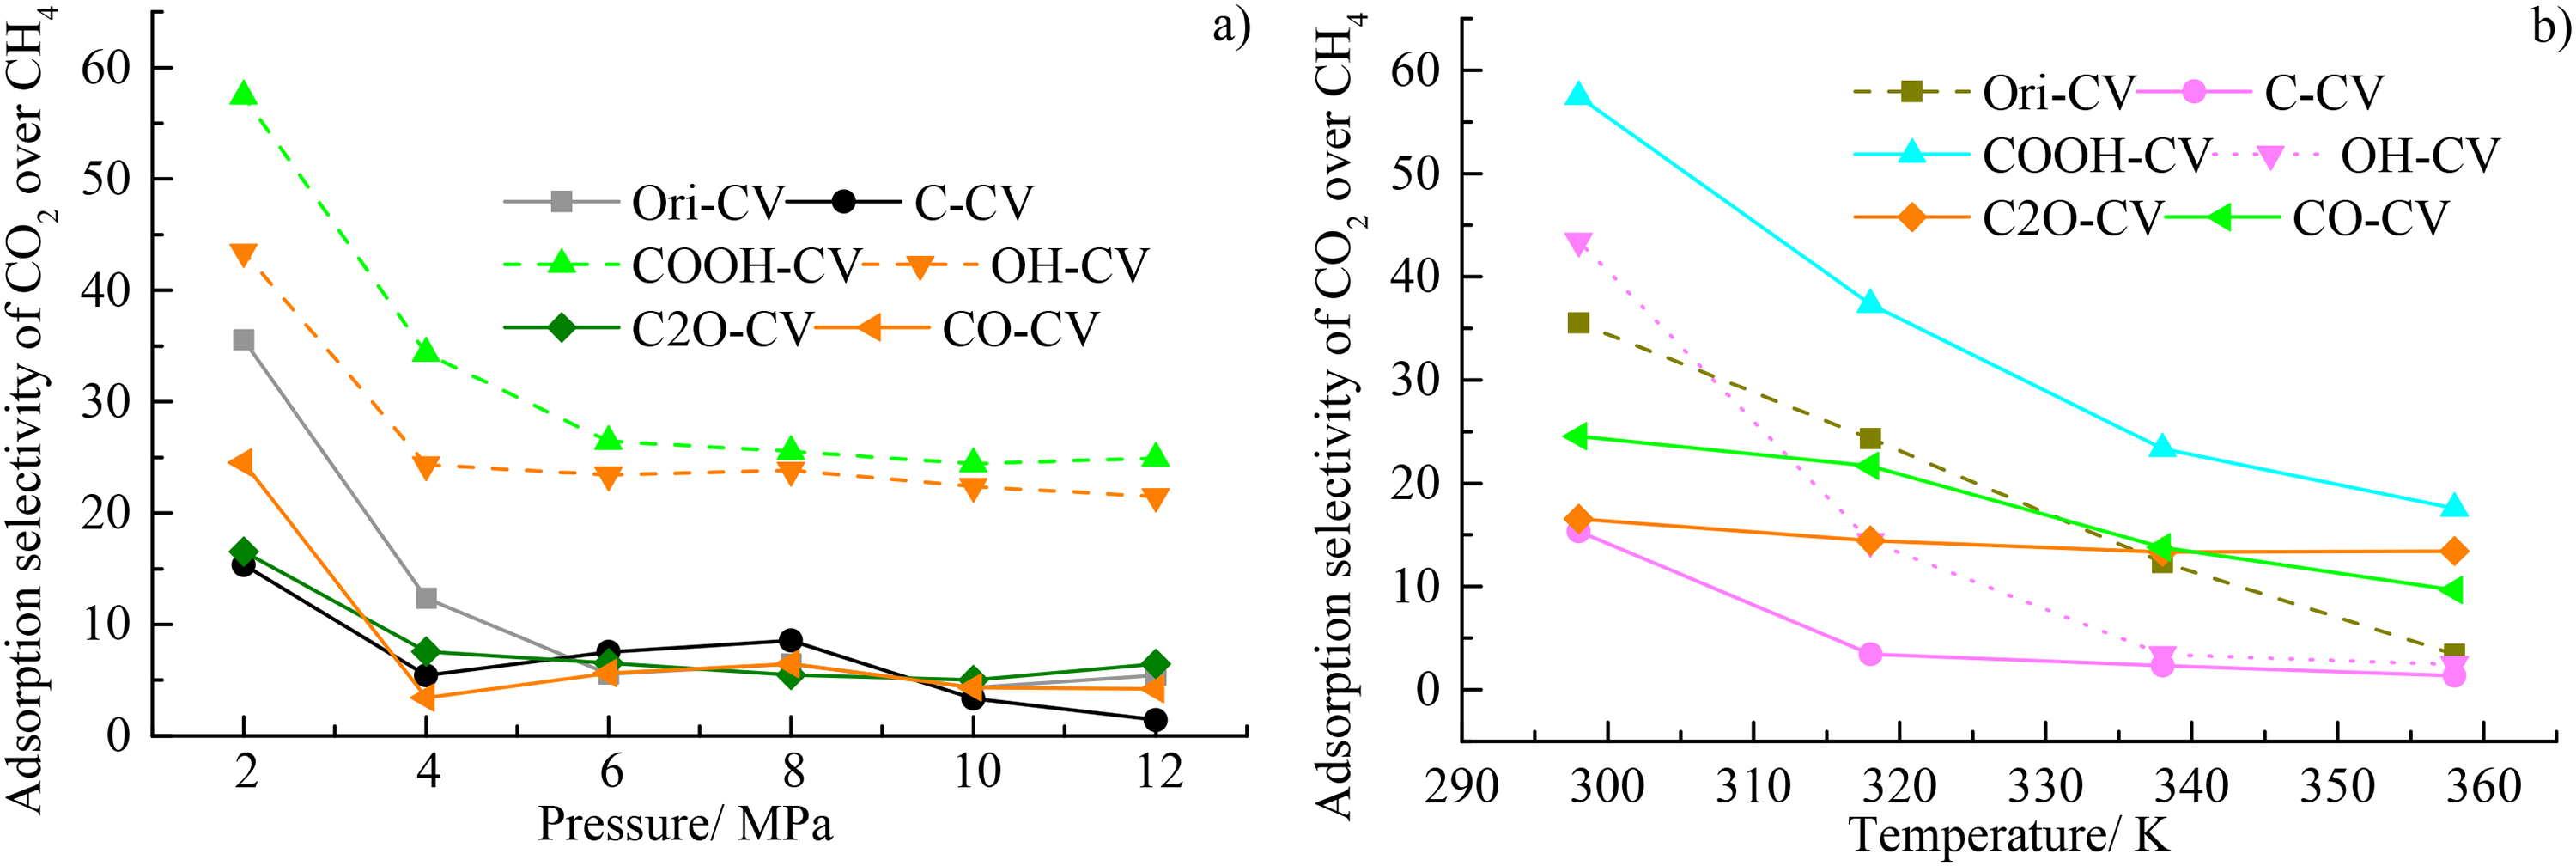
The variations of adsorption selectivity of CO2 over CH4 under (a) different pressures and (b) different temperatures.
Conclusions
In this study, the microporous development and competitive adsorption of CO2-CH4 were investigated using Connolly potential theory, MD, and GCMC, as well as the influences from different surface functional groups. The main conclusions were as follows.
The diameter of micropores induced from the COOH and OH was more sensitive to temperature than CO and C2O. However, the DM of Ori-CV and C-CV keeps the stable with the increase of the temperature, suggesting their insensitivity to the variations of the temperature for Ori-CV and C-CV. Compared with the variation of the DM, the COOH and OH could induce higher microporous development than other functional groups such as CO and C2O. The pure carbon atoms have a negative effect on the microporous development. The ether bond has the lowest development among these functional groups. The synergistic effect of the OH, COOH, CO, and C2O results in the higher VF of the Ori-CV than C-CV, also indicating the induced effects of the OH and COOH for micropores. The adsorption capacities of OH-CV, Ori-CV, and COOH-CV were significantly higher than C2O-CV, CO-CV, and C-CV and they all decrease with the decreasing temperature. The saturated adsorption capacity for CO2 was significantly higher than CH4 for all the coal macromolecules here, indicating the adsorption advantages of CO2 over CH4 despite of types of functional groups. Both the calculation results of Locate- and Isotherm task suggested that OH and COOH have a significantly higher adsorption amount than other coal macromolecules and the others have a close adsorption amount. All the adsorption selectivity of CO2 over CH4 (SA/B) was higher than 1 here, indicating the adsorption preference of CO2 over CH4 for almost all the cases. For the pressure dependence, the SA/B first decreases significantly for the pressure of < 4 MPa and then slightly for the pressures of >4 MPa with the increasing pressure, indicating that high pressure was not conductive to the replacement of CH4 with CO2. For almost all the pressures here, the SA/B follows the order of COOH-CV > OH-CV≈C2O-CV≈Ori-CV≈CO-CV≈C-CV, indicating the highest adsorption preference of CO2 over CH4 for COOH-CV > OH-CV.
Footnotes
Declaration of conflicting interests
The author(s) declared no potential conflicts of interest with respect to the research, authorship, and/or publication of this article.
Funding
The author(s) received no financial support for the research, authorship, and/or publication of this article