
Abstract
Wind and sunlight are increasingly being exploited as energy supplies that never run out. Additionally, renewable energy resources, including sun, wind, and geothermal heat, are being used for different technologies. It was considered the use of hybridized wind-solar energy resources in smart vehicle technology. A thorough understanding of an integrated framework of the hybridized renewable energy for smart vehicle-to-grid (V2G) systems is essential and required to further identify and perhaps maximize existing opportunities. Aiming to develop a vehicle-to-grid (V2G) system where the smart vehicle runs on stored sunshine and wind energy, and vehicle batteries store energy and release it to the electricity grid in peak demand periods. To achieve this aim, mathematical models for solar and wind systems were created and entire 24-h simulations were run for case studies of three smart vehicles, which were assessed for different scenarios and circumstances, using the MATLAB/SIMULINK environment. The estimated values obtained were home load 10 MW, power factor 0.15 MVA, industrial load 0.16 MVA, and smart car-to-grid, solar panel farm, and wind farm power of 4 MW, 8 MW, and 4.5 MW, respectively. Therefore, the hybridized wind-solar energy sources were applicable for all three smart vehicles considered.
Introduction
Development of intelligent mechatronic systems is currently a popular field of study worldwide, with sophisticated mechatronics systems becoming an integral part of the highly automated modern manufacturing sector (Donoghue and Cruden, 2013; Guo et al., 2020; Krueger and Cruden, 2020). Power is the lifeblood of any technology, since it is required to run the entire system, but the energy needs of intelligent mechatronic systems have so far not been established. Additionally, while renewable energy sources like solar and wind are available world-wide, the sun does not always shine and the wind does not always blow (Amamra and Marco, 2019; Krueger and Cruden, 2018; Krueger et al., 2021; IEA 2015 Energy and Climate Change: World Energy Outlook Special Report (Paris: OECD/IEA); Sovacool et al., 2018; Williams et al., 2012). This unpredictable nature of natural resources makes it challenging to rely on renewable energy. To avoid power shortages, smart technology must store energy and make it available when needed. Recent developments such as intelligent technology and electric transportation can provide some solutions. Moreover, they can assist in stabilizing the energy market and in reducing hazardous emissions. Many studies have shown that vehicle-to-grid (V2G) technology can be a reliable option in this regard (Amertet et al., 2021; Bahn et al., 2013; Edwin et al., 2021a, 2021b, 2022; Krueger and Cruden, 2020), since it allows a vehicle's battery to store energy, including from renewable sources, and then safely discharge part of the energy back to the grid when it is needed most. With V2G, a fleet of electric vehicles (EV) could be charged overnight. Moreover, when energy demand is low, grid energy could be diverted to change buses during their regular schedule, and then discharge energy back to the grid while parked. Some studies suggest combining multiple vehicles into a virtual power plant (VPP) (Dennis and Thompson, 2009; Guille and Gross, 2009; Nitta, 2003; Sortomme and Cheung, 2012; Tepe et al., 2022). The concept goal of the hybridized renewable energy for smart vehicle-to-grid (V2G) systems along with the future deployment of the EVs puts forward various challenges in terms of electric grid infrastructure, communication and control. Following an intensive review on advanced Hybridized renewable energy for smart vehicle-to-grid (V2G) systems, the strategy for integrating the wind and solar renewal energy utilized by EVs. Various EV smart charging technologies are also extensively examined with the perspective of their potential, impacts and limitations under the vehicle-to-grid (V2G) phenomenon. Moreover, the high penetration of renewable energy sources (wind and photovoltaic solar) is soaring up into the power system. However, their intermittent power output poses different challenges to the planning, operation and control of the power system networks. On the other hand, the deployment of EVs in the energy market can compensate for the fluctuations of the electric grid. V2G can also be used to prioritize battery health and ensure that a vehicle has enough charge to perform its daily driving duties. Bidirectional energy flow is considered most suitable for both home and grid applications.
However, to the utility, the EVs are both the dynamic loads which are difficult to schedule but also a potential back up for the electric grid. Similarly, the vehicle owners have some notion that possessing an EV will substantially increase an extra operating cost when compared to owning an ICEV. Hence, an attractive scenario is needed to merge them so that a sharing of load can be realized between the two parties. As the majority of the people witness and become aware of the contemporary penetration of the EVs, they would require knowing how much it costs for recharging their vehicles and find a way to minimize charging costs similar to their usual ICEV refueling practice. Furthermore, most previous studies on smart technology development have considered unidirectional charging and discharging, and the energy effect could not be determined. Consequently, determining the direction of energy flow is challenging, leading to misinterpretation of the bidirectional energy flow required for home and grid needs (Gao et al., 2014; Grée et al., 2020; Høj et al., 2018; Li et al., 2020; Shinzaki et al., 2015). To further identify and potentially utilize these aforementioned opportunities a clear understanding of an integrated framework of the hybridized renewable energy(solar system and wind system) for smart vehicle-to-grid (V2G) systems is vital and indispensable. Therefore, this study focused on bidirectional flow energy in smart vehicle systems.
The reminder of this paper is organized as follow: Mathematical representation of smart mechatronics grid system components presented in section 2, section 3 carried out Results and Discussion, whereas conclusion drawn in the section 4.
Mathematical representation of smart mechatronics grid system components
Two types of mathematical models were developed and applied in the analysis, i.e., models for photovoltaics (PV) and wind power generation. In the basic strategy, we imported both load demand and the EV profile, and located EV peak values in the stage periods (Figure 1). Charging and discharging states were then determined. If there was a peak or valley in the charging/discharging state, we set the requirement that the state of charging (SOC) must be larger than 10%. When the SOC was larger than 10%, the discharging state occurred and the process was repeated by updating the load demand energy and the energy for the next charge-discharge cycle. Otherwise, the EV was scheduled for final charge and the load demand schedule for the next EV was updated (Figure 1).
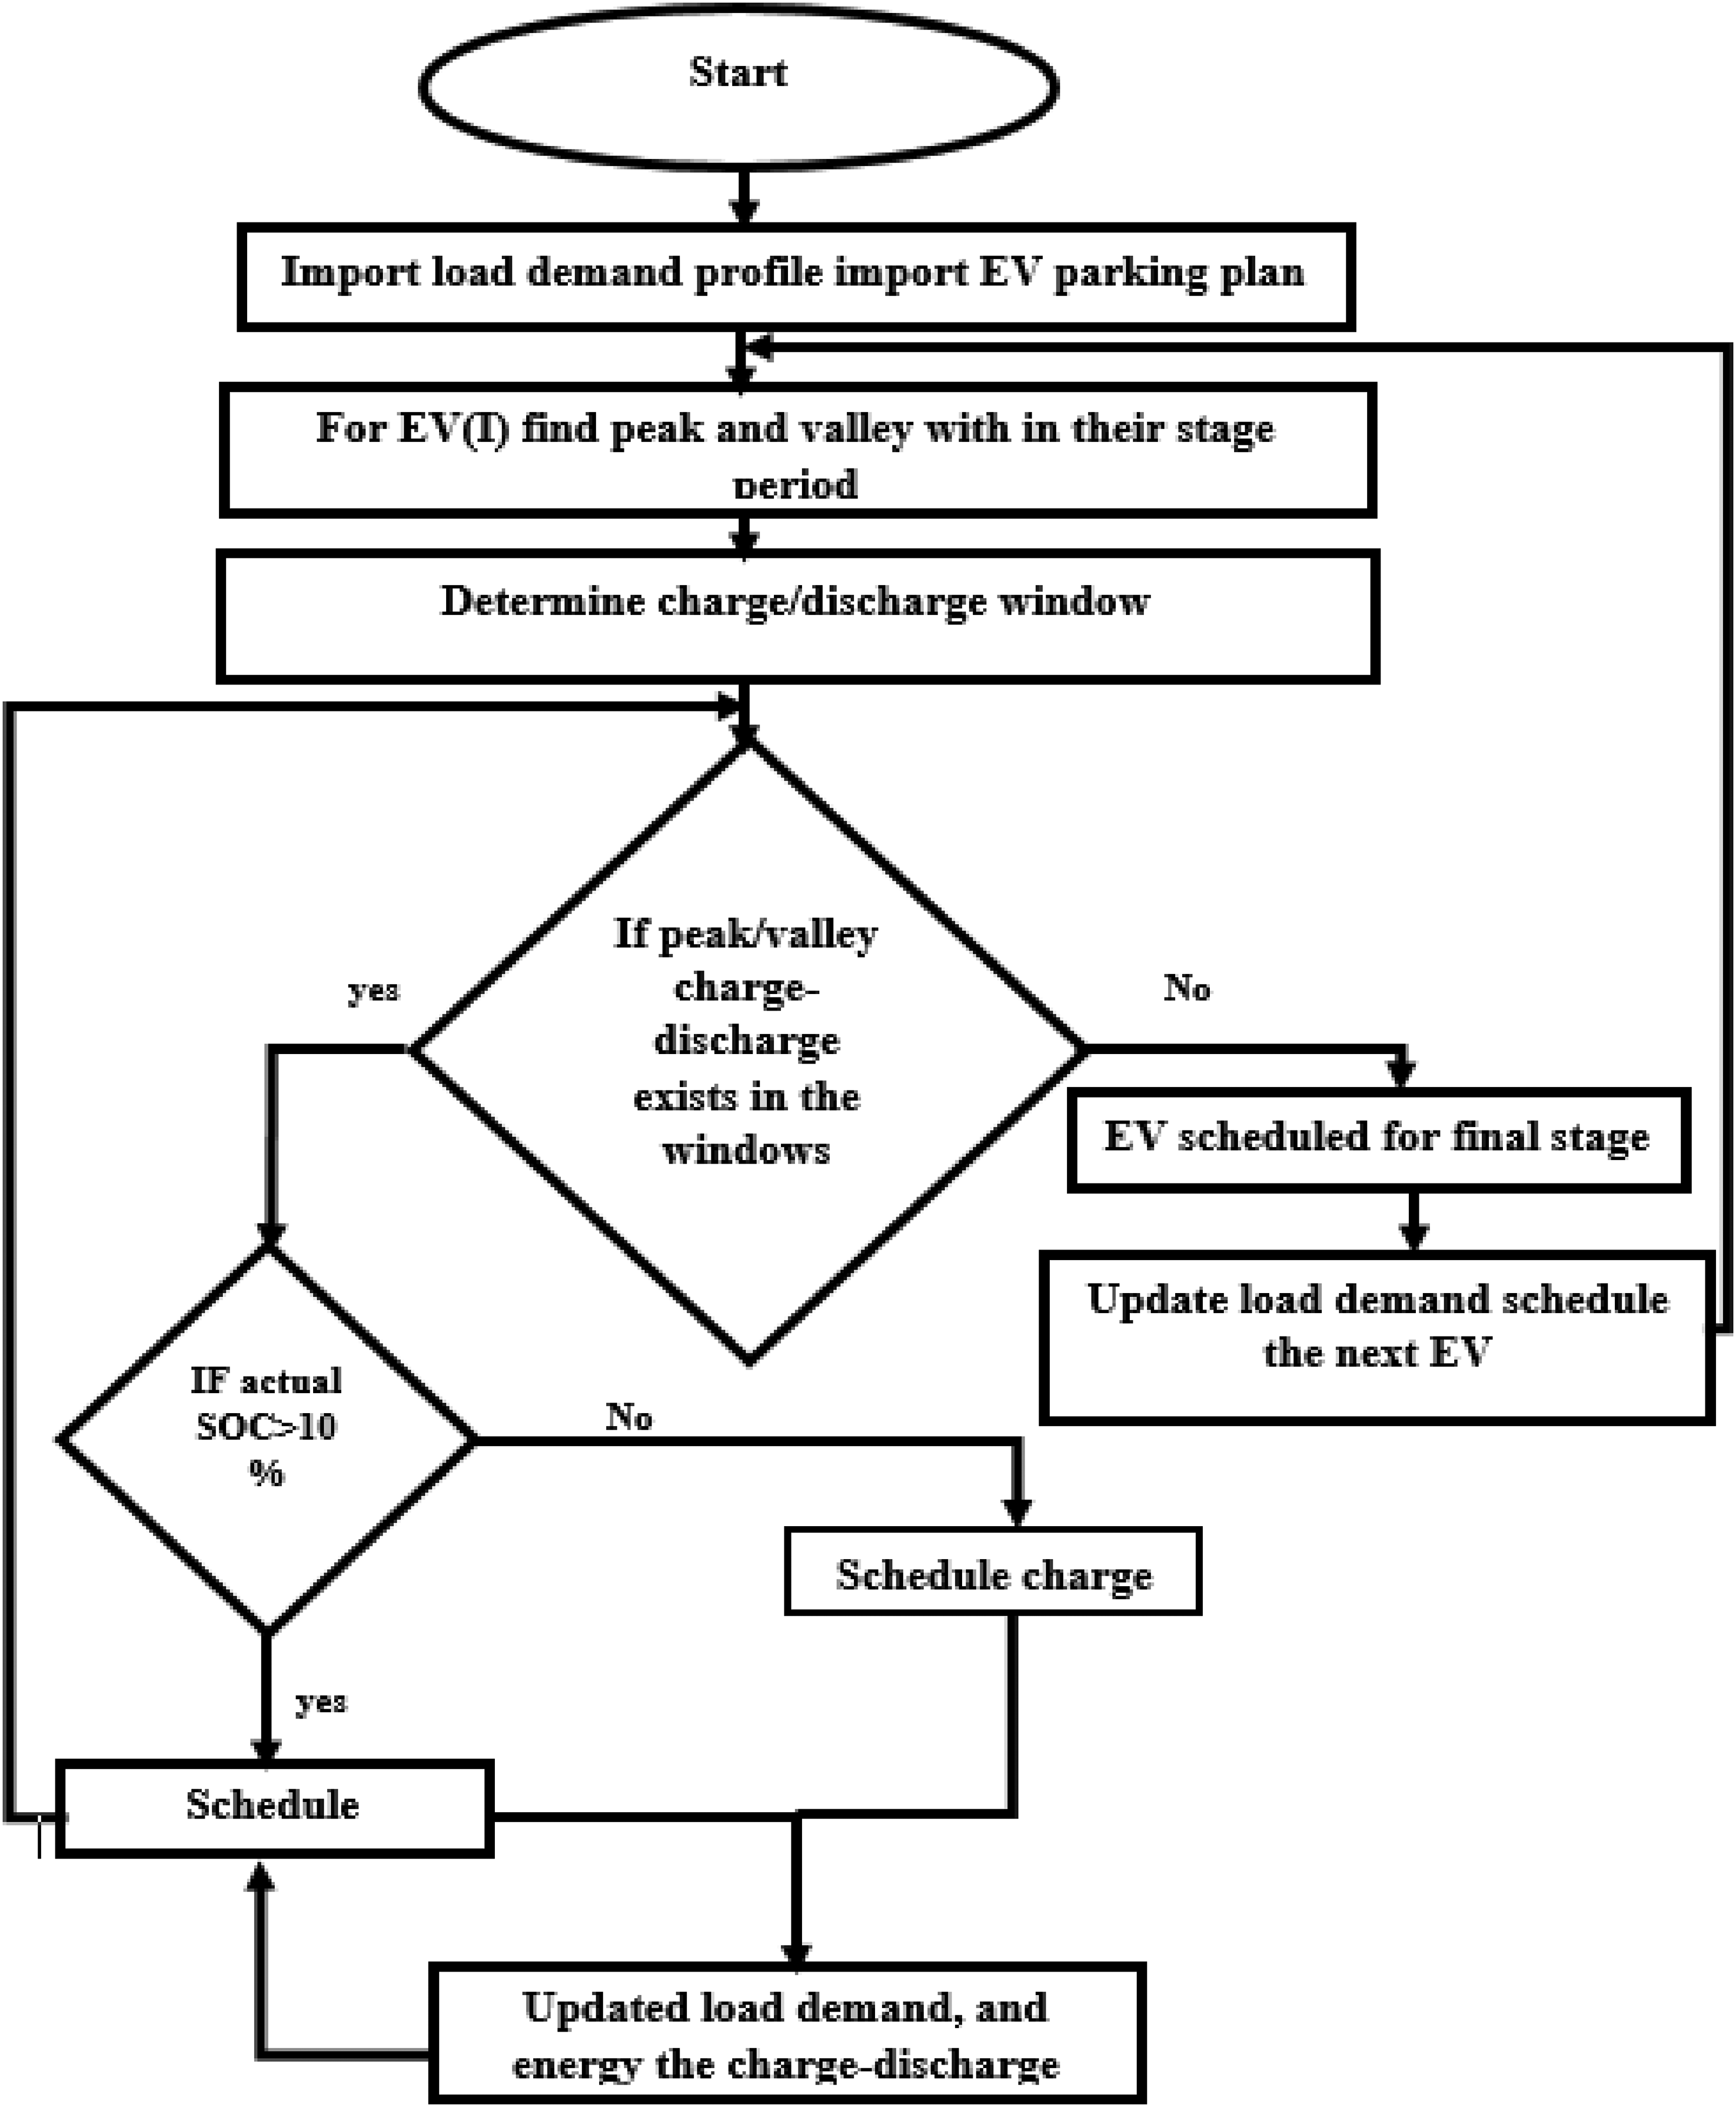
Correct to ‘discharge window’ ‘energy for charge-discharge’ ‘demand schedule for next EV.
The concept of energy generation in the V2G system during different types of days is shown in Figure 2. A system was put in place to support the integration of vehicles and the grid. Additionally, potential auxiliary services that V2G systems could provide were considered, including frequency oversight, voltage regulation, peak shaving, load leveling, renewable energy storage, intermittency reduction, and curtailment. Opportunities for economic growth and business opportunities could also arise.
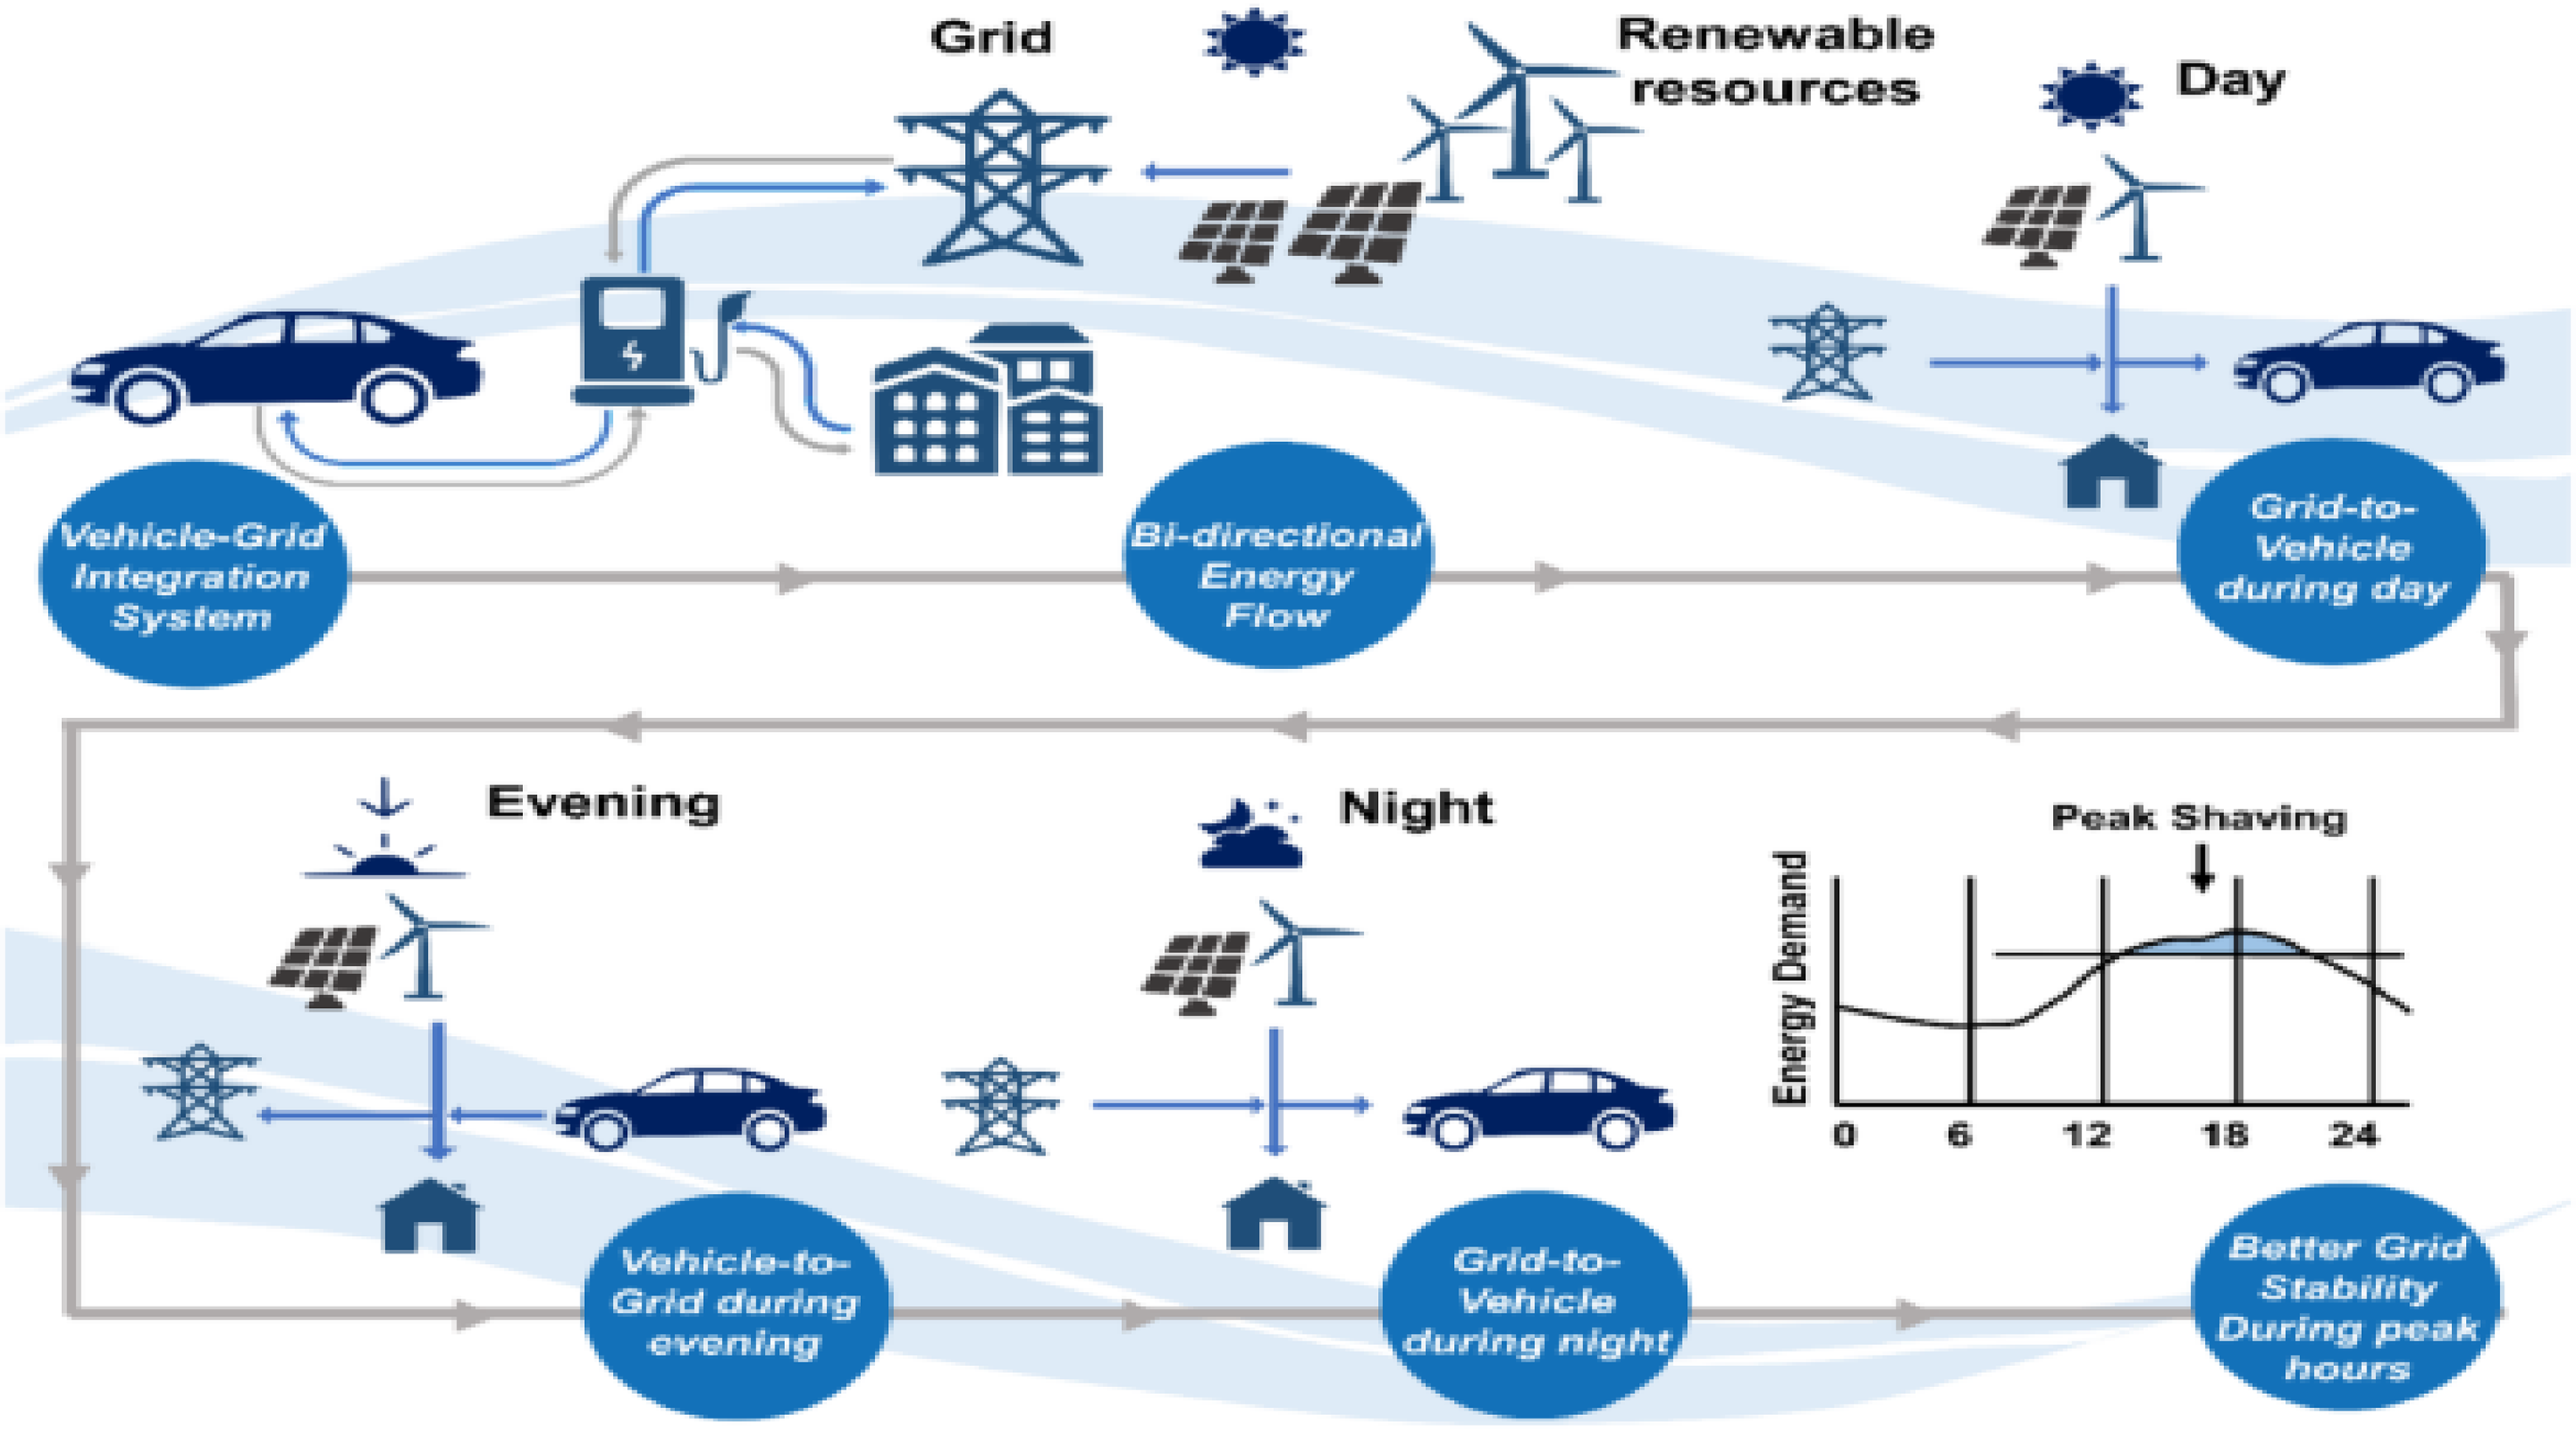
Concept for a renewable energy-based vehicle-to-grid (V2G) system (Guille and Gross, 2009; Krueger and Cruden, 2020; Nitta, 2003; Sortomme and Cheung, 2012; Tepe et al., 2022).
Mathematical model of photovoltaics (PV)
A simple PV circuit is shown in Figure 3, where Rp and Rs are the intrinsic shunt and series resistance of the cell and diode, respectively. The value of Rp is usually very large and that of Rs is very small, and hence they may be neglected to simplify the analysis. In practice, PV cells are grouped in larger units called PV modules and these modules are connected in series or parallel to create PV arrays, which are used to generate electricity in PV generation systems. In developing mathematical models for PV, we made three assumptions (Edwin et al., 2021a, 2021b; Guille and Gross, 2009; Krueger and Cruden, 2020; Sortomme and Cheung, 2012), regarding:
The size of the area covered by the PV farm, the efficiency of the solar panels, and the irradiance data. A simplified model of a wind PV farm that produces electrical power following a linear relationship with the wind. When the wind reaches a nominal value, the wind farm produces nominal power. The wind farm trips from the grid when the wind speed exceeds a maximum value and remains in that state until the wind gets back to its nominal value.
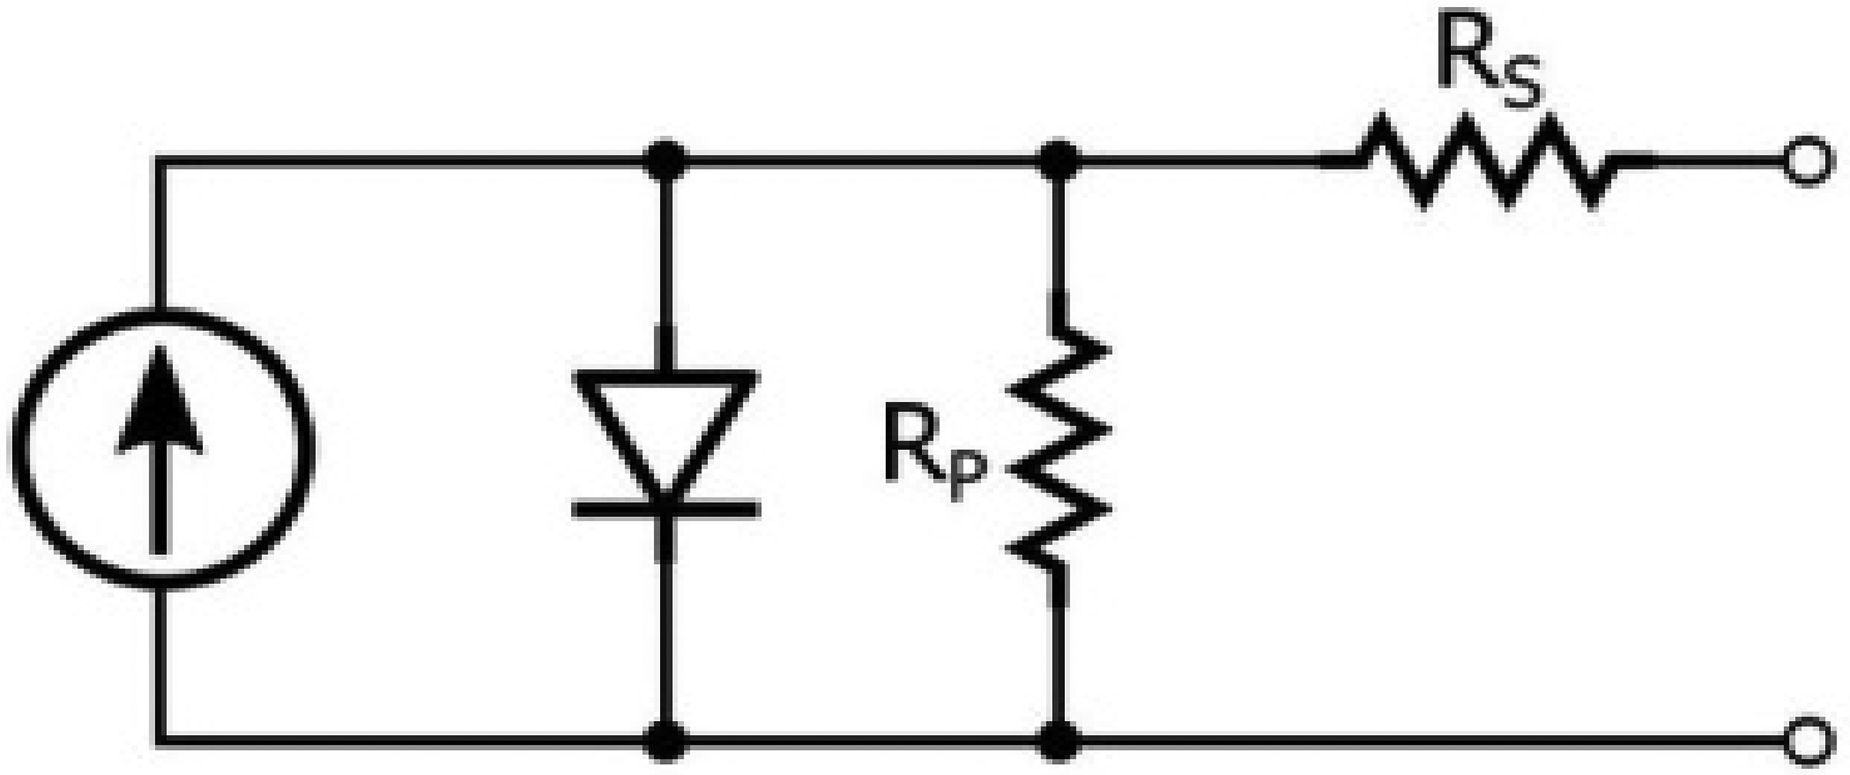
Equivalent photovoltaic (PV) circuit (Amertet et al., 2021; Bahn et al., 2013; Edwin et al., 2022; Williams et al., 2012).
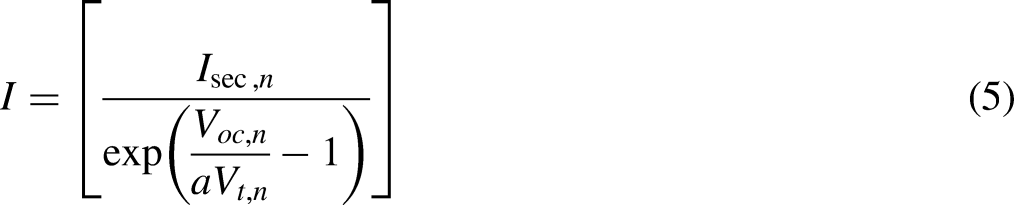
Based on these assumptions, we developed the following mathematical representation for current (I) and voltage (V):


State of charging (SOC) was calculated as:


The energy limits of a battery were determined depending on SOC level. Based upon the SOC, available power and demand, batteries operated in either charging or discharging mode:


Mathematical model of wind power generation
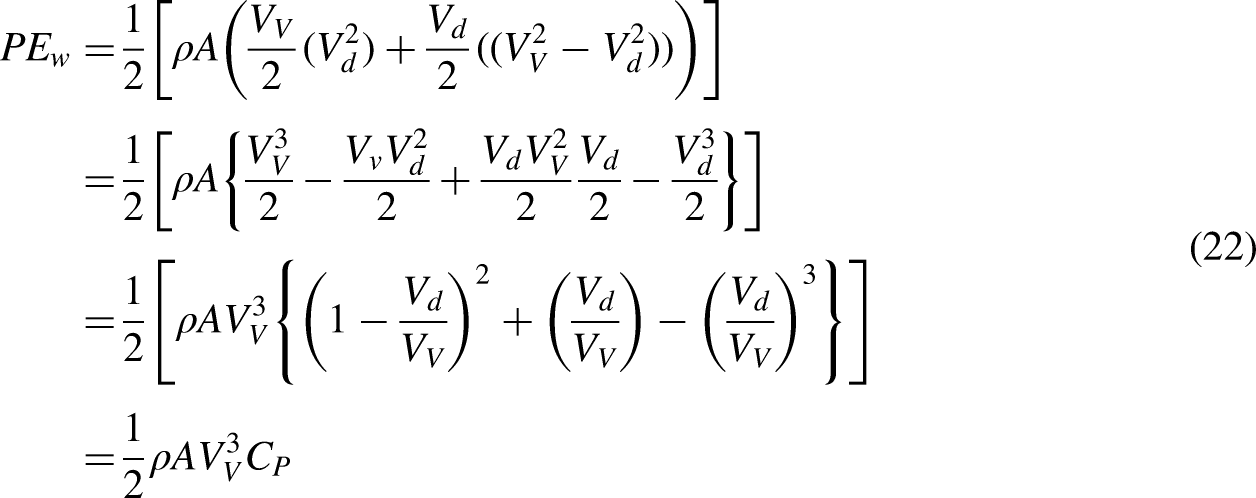
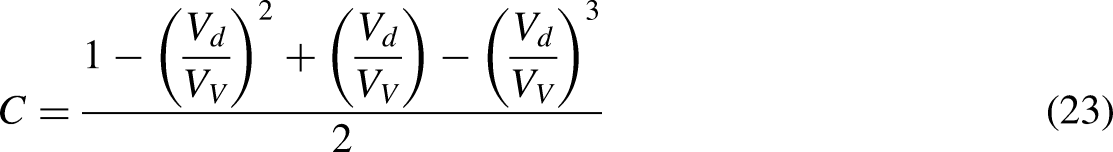
In order to obtain electrical energy from wind, we converted wind energy into rotating energy of the blades and then converted that rotating energy into electrical energy (Figure 4). The components required for wind power generation are a wind turbine and electronic devices. We made the fundamental assumptions that wind energy increases with the cubed value of wind speed. For this, we needed to know the constant pressure values, which we determined using Newton's second law of motion:


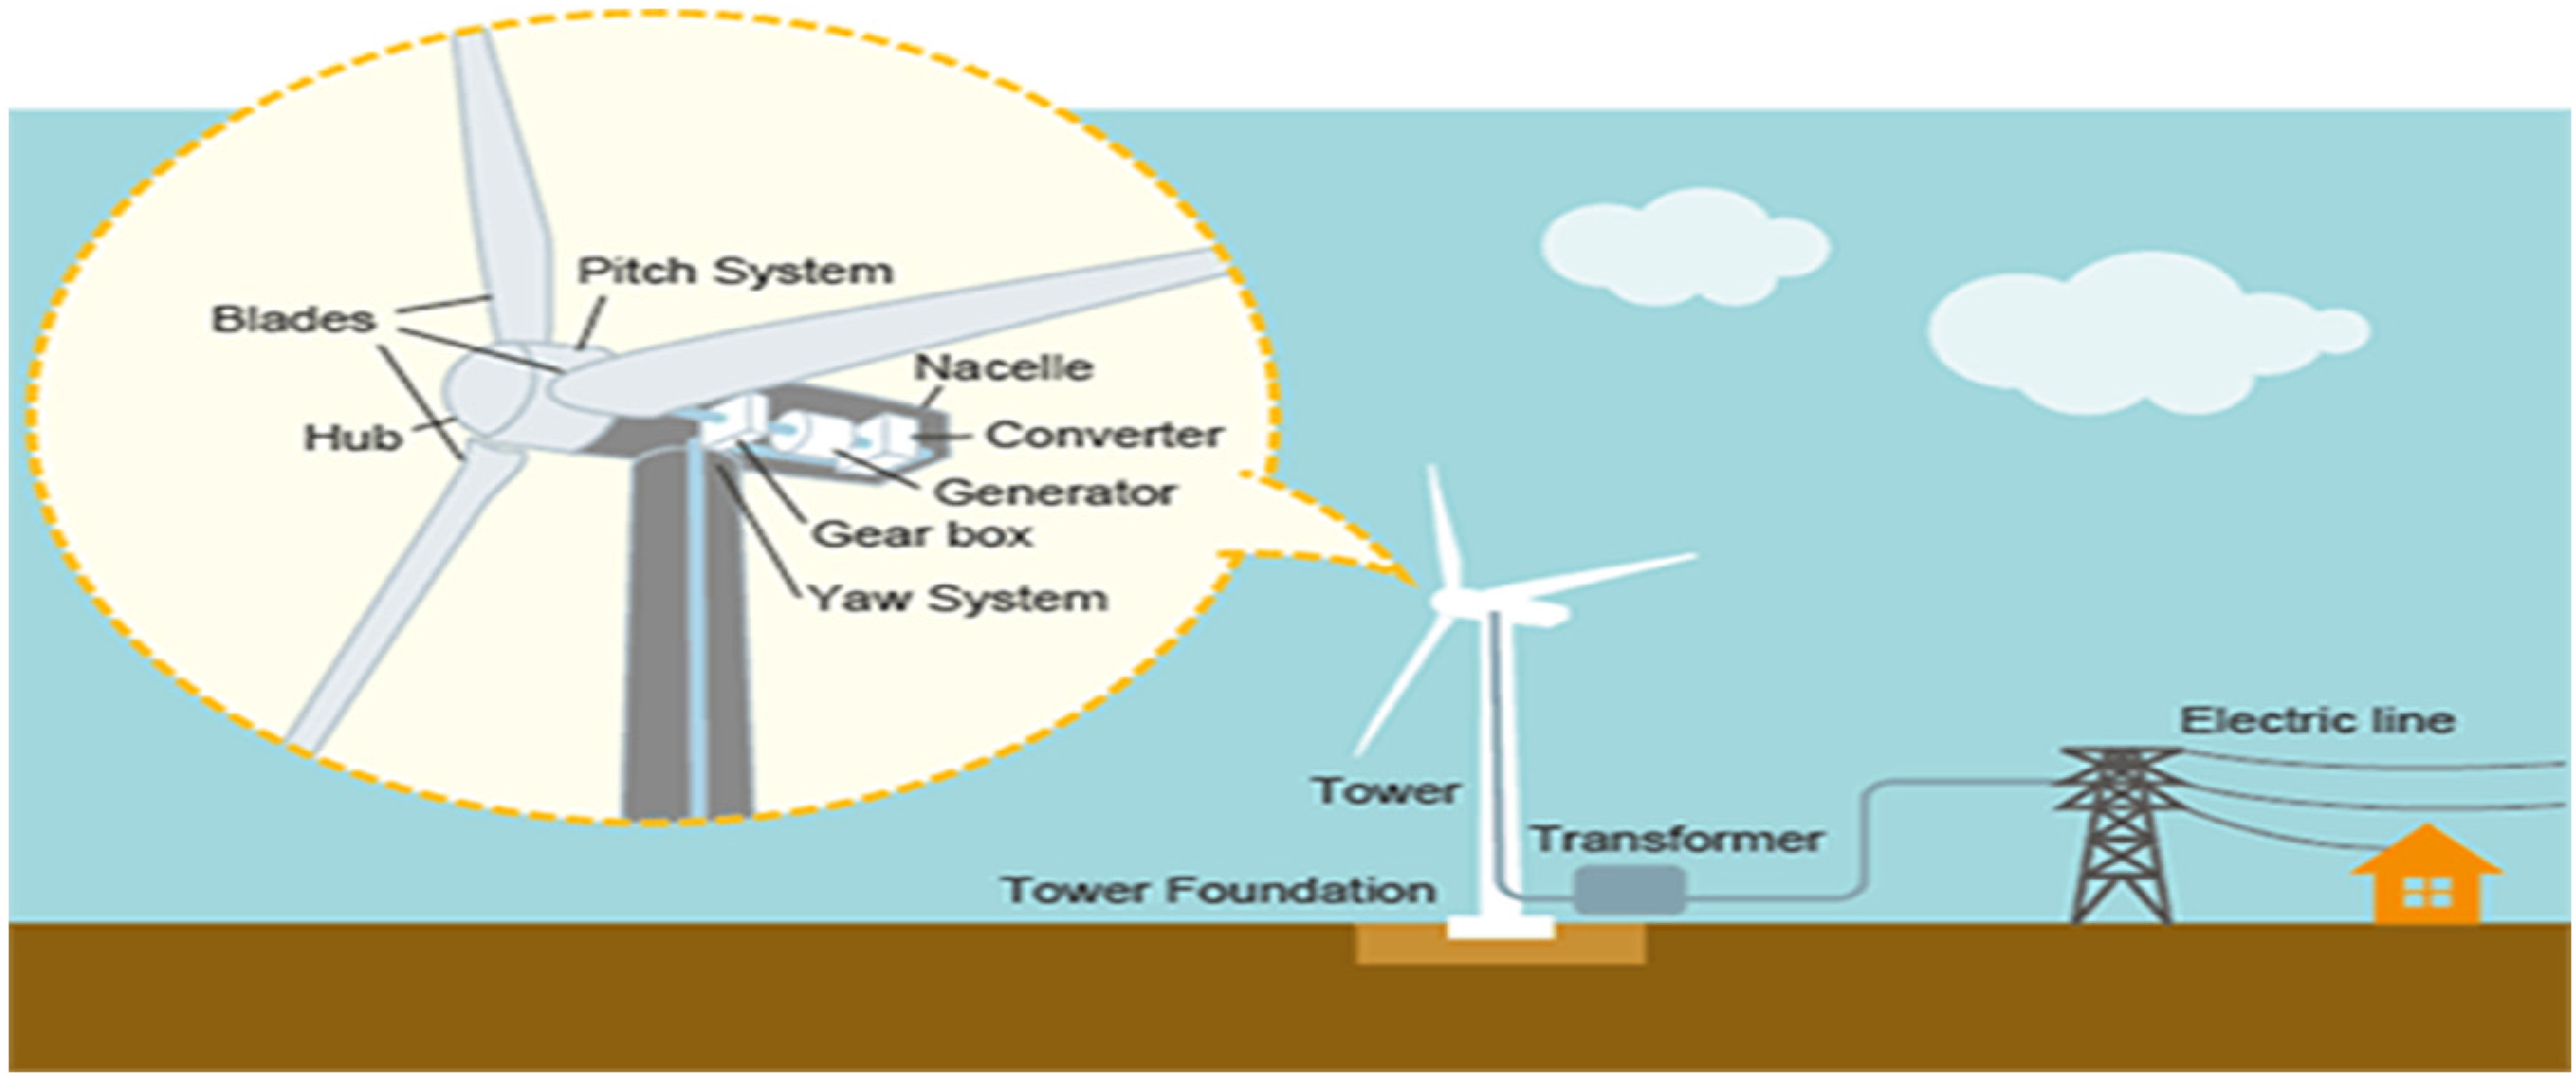
Components involved in wind energy generation (Guille and Gross, 2009; Nitta, 2003; Tepe et al., 2022).
Assuming that U = 0, then: Case 1: People going to work with the possibility of charging their car at work. Case 2: People going to work with the possibility of charging their car at work, but with a longer ride. Case 3: People going to work with no possibility to charge their car at work.
In all cases, the people were assumed to be working the night shift. To observe the impacts on micro-grid level, different loads, such as residential load and asynchronous machines, were considered, where residential load is a consumption profile with a given power factor and asynchronous machines are controlled by a square relationship between rotor speed and mechanical torque. Here, the load was assumed to be composed of residential load, while an asynchronous machine was used to represent the impact of an industrial inductive load (like a ventilation system) on the micro-grid. In each simulation, we considered the following three scenarios and thus performed three simulations lasting 24 h: (i) the intensity of the sun follows a normal distribution and reaches its maximum at noon. (ii) The wind changes drastically throughout the day and there are multiple ups and downs. (iii) Household load follows a typical pattern similar to normal household consumption, which is low during the day, peaks in the evening, and slowly declines at night. Therefore, three driving forces were assumed to affect grid frequency. Partial shading at noon in the first half of three hours during a grid trip to solar, the impact of asynchronous machines on the wind farm at 10 pm, and wind speed exceeding the maximum permissible wind power.


Results and discussion
We used the following parameters in order to simulate the entire system: The simulations were carried out at 60 Hz frequency, entire connections were considered as voltages connected in parallel, and currents were connected in series connections. In the MATLAB environment, we connected to smart cars to observe model performance.
From Figure 5, it can be seen that:
Voltage of the source was regulated. That of the parameter sources (V_src1, V_src2, V_src3 in Cases 1–3) were achieved at the steady state point for all loads. Because the systems were connected in parallel (see Figure 3), voltage drop in RP (VRP) was constant with source voltage (Vsrc). Mathematically:

Power production by energy source.
In Figure 5, black solid lines represent Case 1 (People going to work with the possibility of charging their car at work), blue dotted lines represent Case 2 (People going to work with the possibility of charging their car at work but with a longer ride), and red lines represent Case 3 (People going to work with no possibility to charge their car at work). Constant voltage in this study refers to the capacity to vary output current while maintaining a predetermined voltage. Additionally, a parallel circuit's voltage is constant and its current always travels down low resistance channels. Consequently, more current flow down the path with the least resistance.
Current source (I_src1, I_src2, I _src3)
As can be seen in Figure 5, the voltage source was not constant at all, because it was used for verifying the frequency response of power devices, frequency relays, and components. According to the frequency of the power supply, the current in this instance occurred as polynomial functions. Mathematically:

Contrary to expectation, fixed voltages and variable currents operated as the system's drivers.
Due to variation in the current, the total amount of electric power flowing from source to load (apparent power) also varied. Mathematically, The rate at which work was done or at which energy was expended (real power) also varied, because energy was expended per unit time. Mathematically:
But the significance was low, since apparent power was the product of the RMS value of voltage and RMS value of current.
The power that flowed back from the smart mechatronics vehicle destination toward the grid in an alternating current scenario varied non-significantly because of the dissipated power resulting from inductive and capacitive loads. Mathematically,


Production parameters for photovoltaics (PV) as the energy source are shown in Figure 6. All the energy fluctuations seemed similar for parameters such as current, active power, and apparent power, but the direction of change differed because of variation in the electronic device. Reactive power was sometimes positive and sometimes negative after the steady state points. Moreover, reactive loads such as inductors, and capacitors dissipate zero power, yet the fact that they drop, voltage and draw current gives the deceptive impression that they actually dissipate power. The voltage in the PV cells was constant and the other parameters fluctuated, because the PV modules were connected in parallel to the source parameter voltages and the voltage drop across these was the same. When each module was connected in series the current drop was constant, while when the PV modules were connected in parallel the current fluctuated. These conditions arose due to incorporation of a five-parameter model with light-generated current source (IL), diode, series resistance (Rs), and shunt resistance (Rsh) to represent the irradiance- and temperature-dependent I-V characteristics of the modules in the models. From Figure 6 the power production by photovoltaics starts from to zero until one second later. The meaning is that the real power is going to be the first term which, however, has a zero and a high frequency component in it and the reactive power however has a high frequency component only by high frequency.
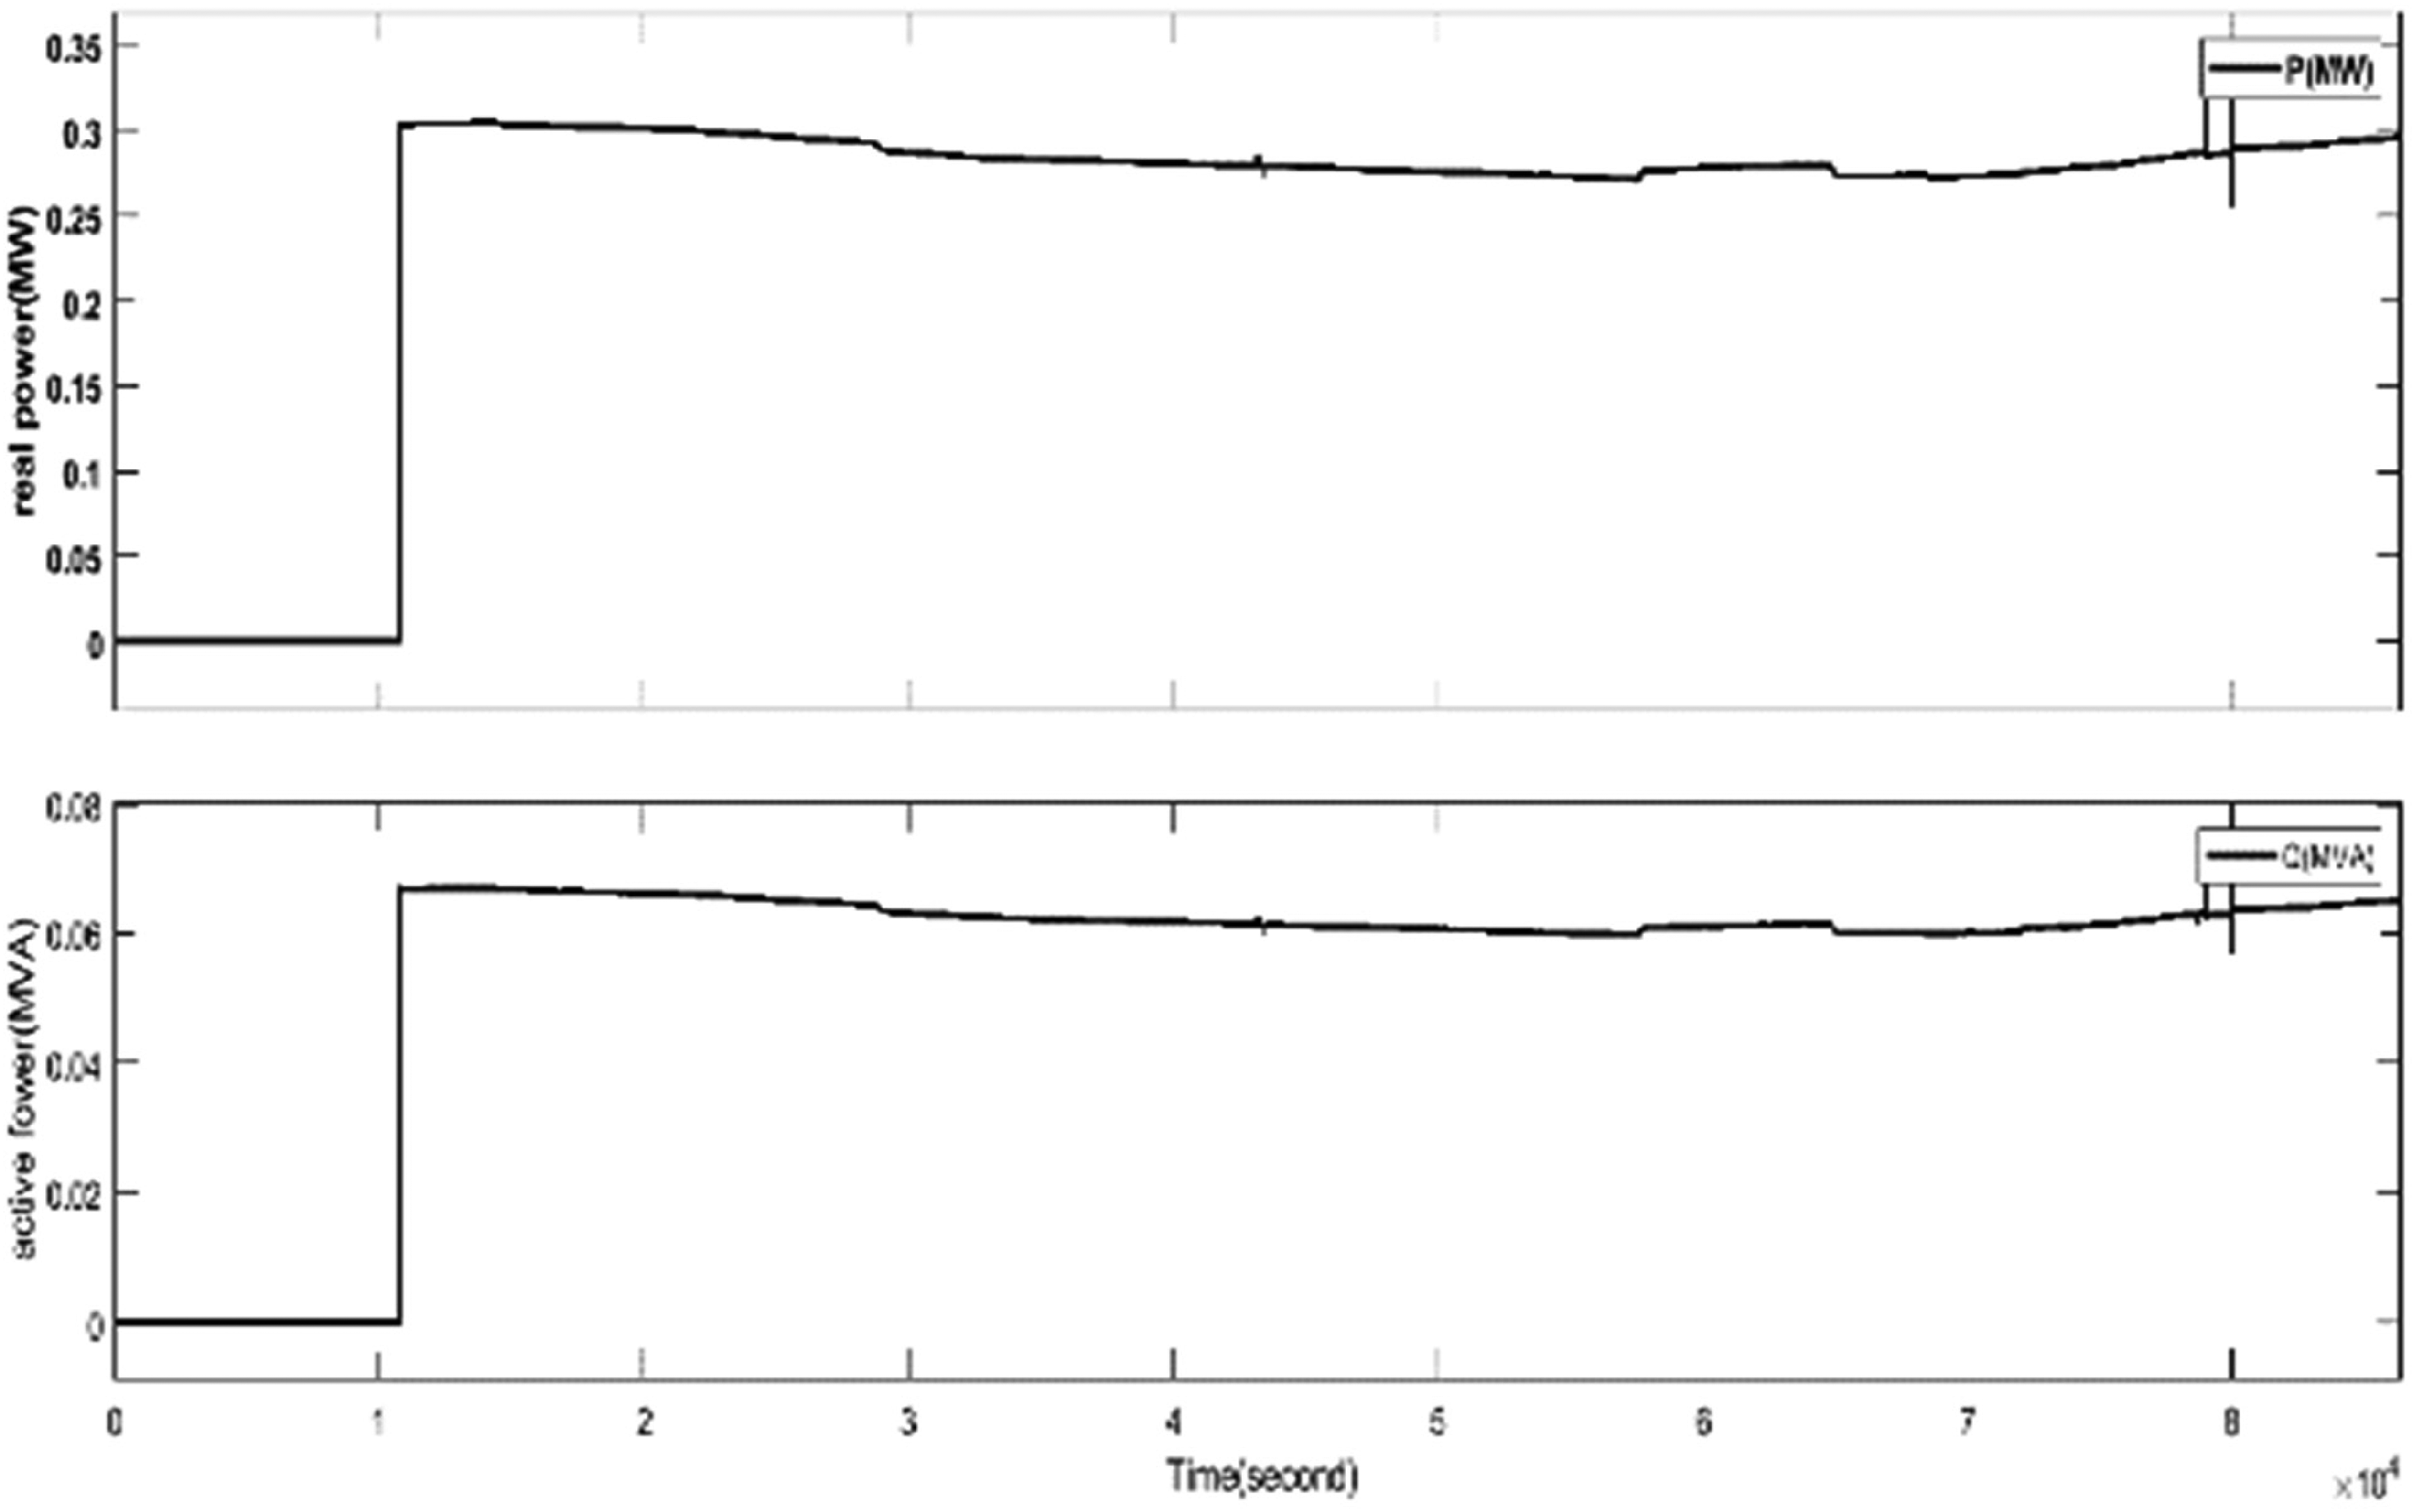
Power production by photovoltaics (PV).
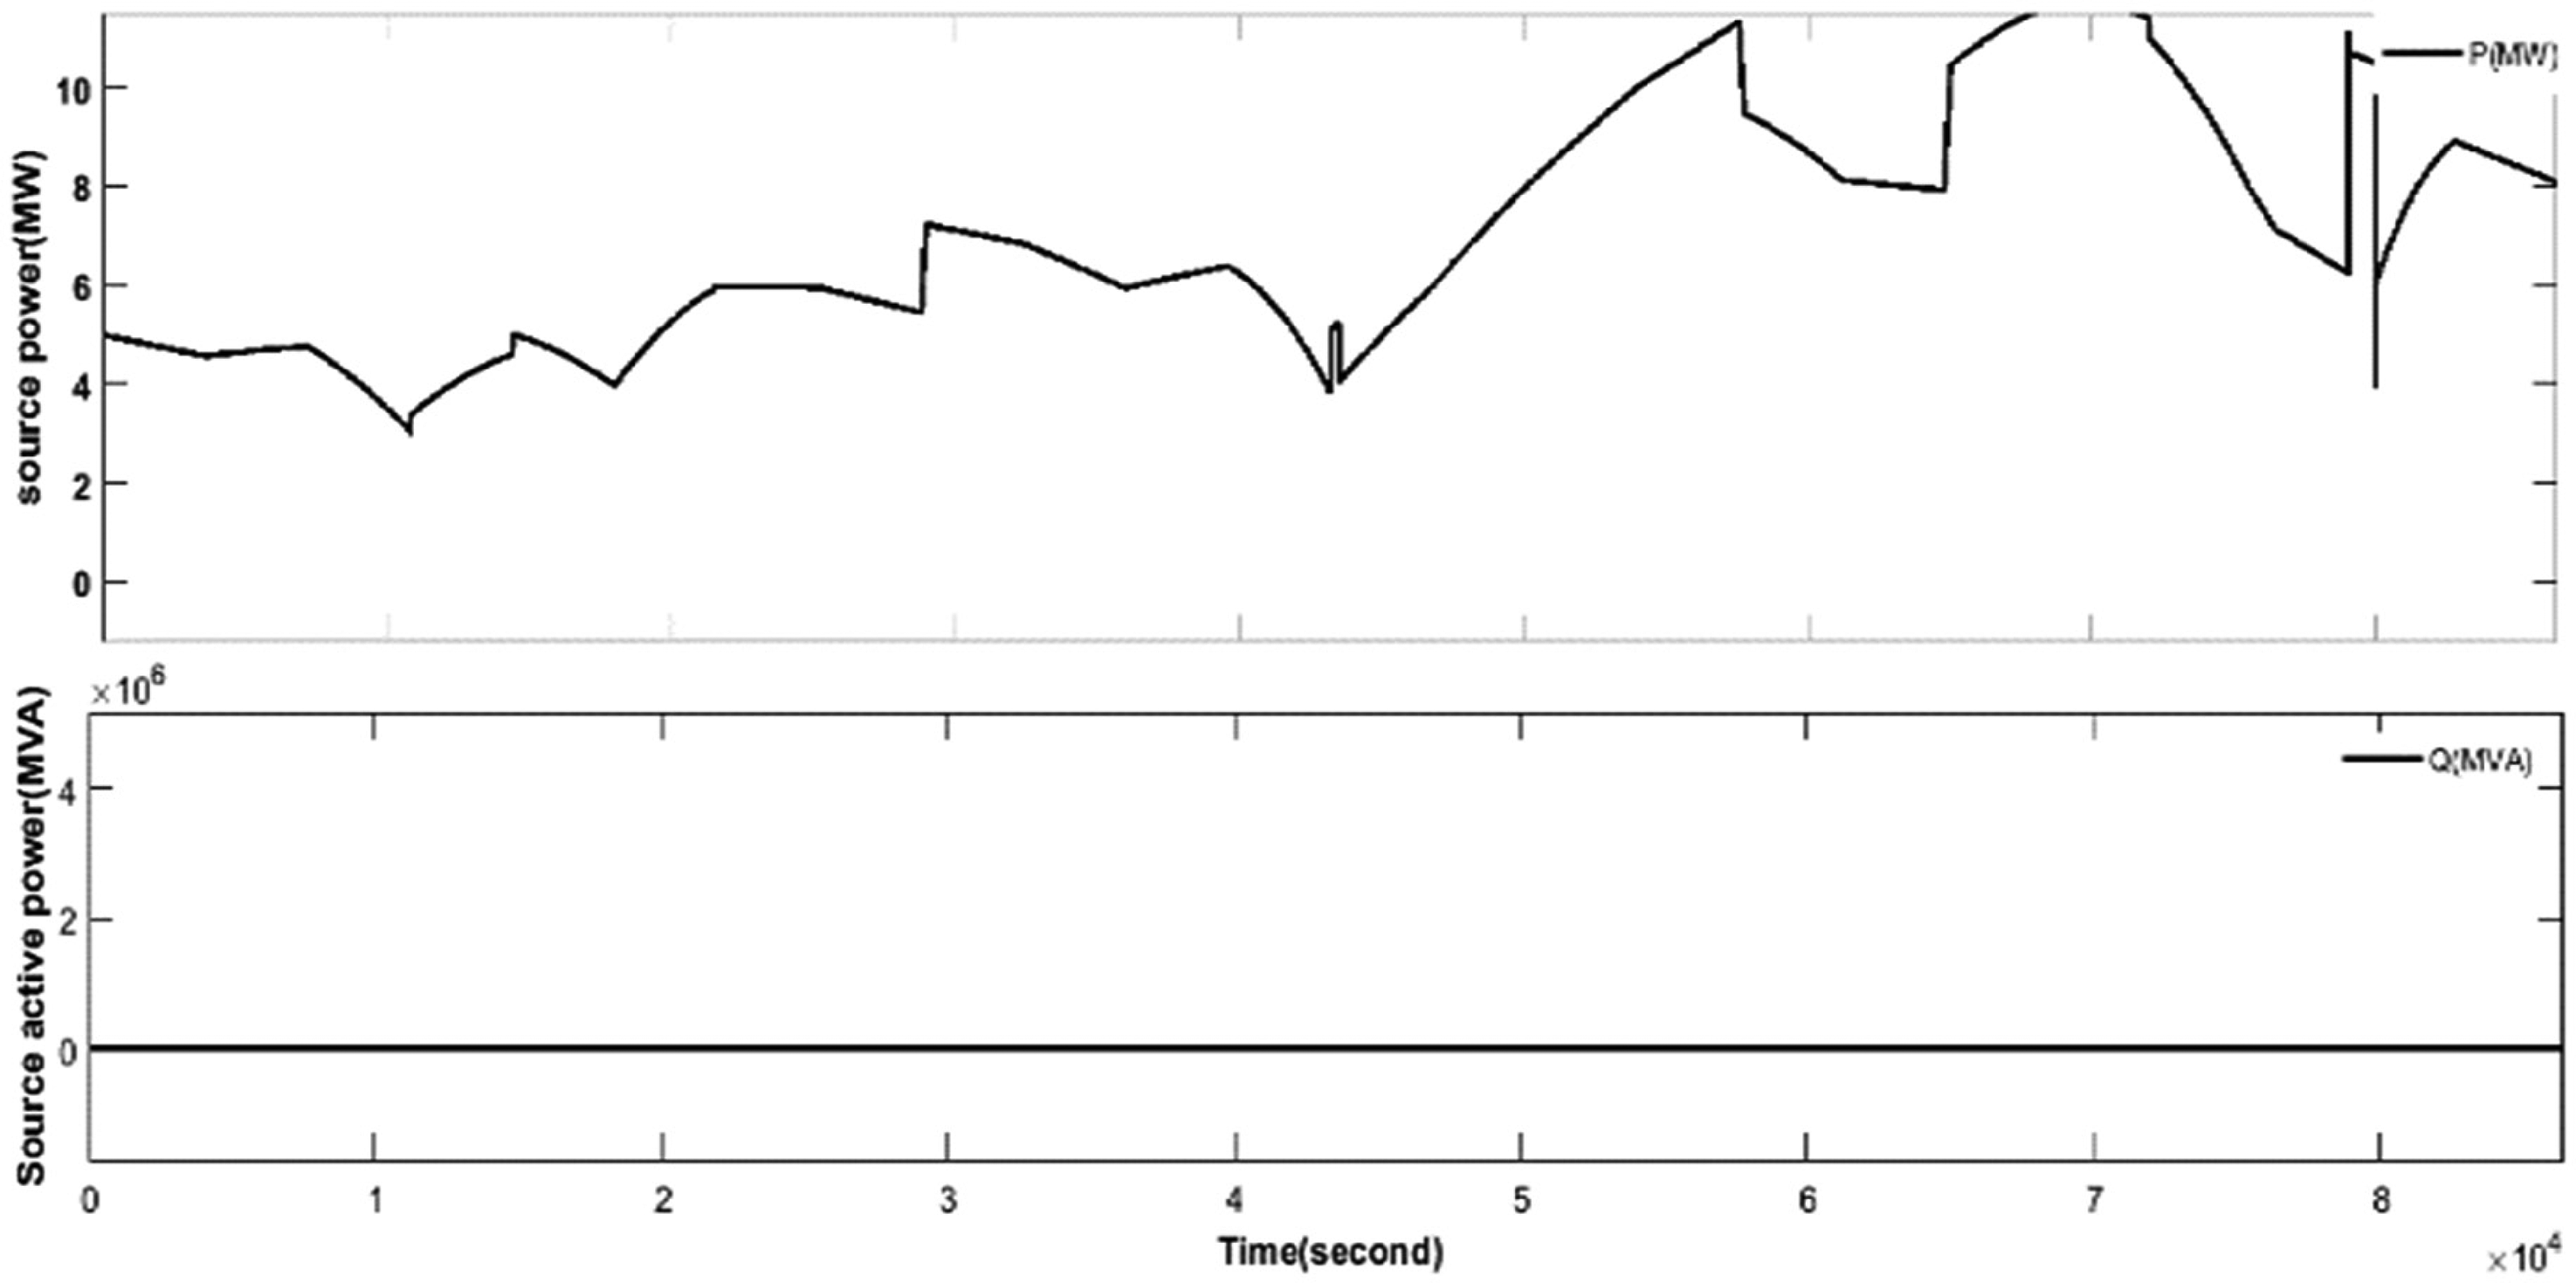
Figure 7 shows wind power generation power according to the concept mentioned previously and the respective power factor (pf).

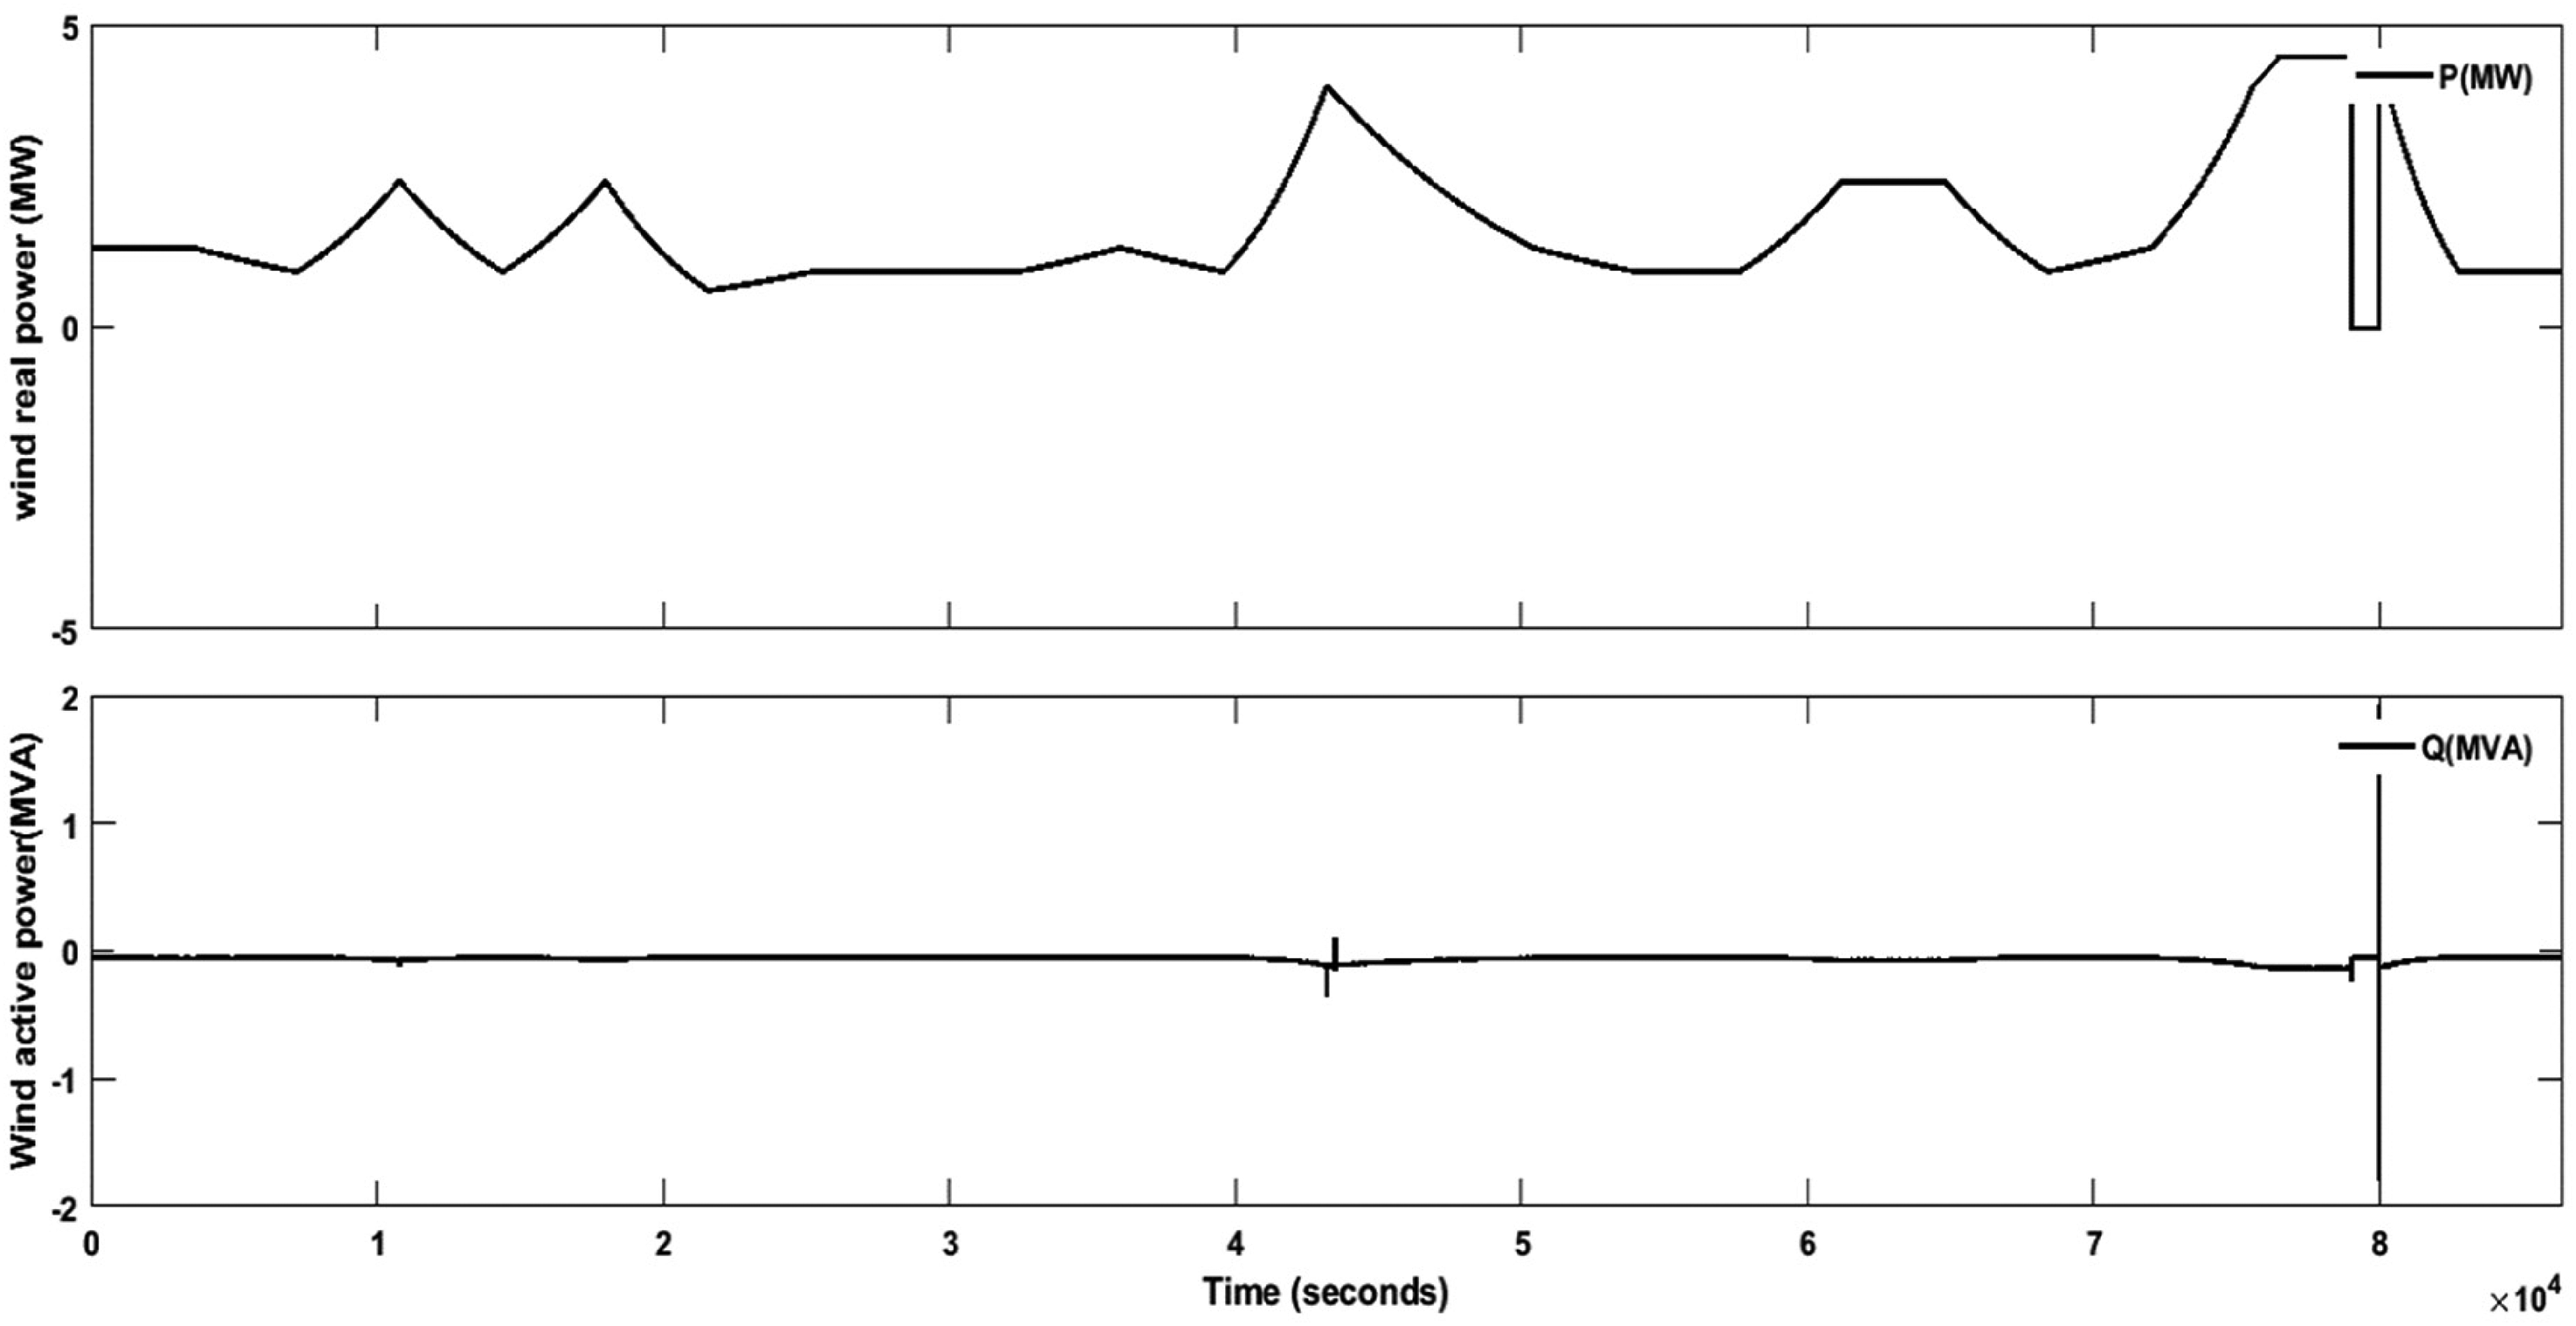
Power production by wind.
Where p is the real power and S is the apparent power. The load's actual power consumption and the circuit's apparent power flow ratio changed. This occurred because real power (p), which reflects the ability of electricity to accomplish work, was the average of the instantaneous product of voltage and current. More current flows in the circuit than would be necessary to transfer real power alone, because of the energy stored in the load and returned to the source or because of a non-linear load that distorts the wave shape of the current drawn from the source. When the voltage and current are out of phase, the average product of the two is reduced, and this is shown by a power factor magnitude of less than one. When a device—typically the load—generates actual power, that power flows back toward the source, resulting in a negative power factor. For the same amount of usable power delivered, a load in an electric power system with a low power factor requires more current than a load with a high power factor. Higher current necessitates larger wires and other equipment, and increases the amount of energy lost in the distribution system. Electrical utilities typically charge industrial or commercial clients more when there is low power, because of their use of larger equipment and wasted energy (Figure 7). Moreover, in the present analysis voltage was kept constant, whereas other source parameters showed fluctuations because wind speed is dependent on the geometers (height) above the earth. Mathematically, this could be represented as:
From the Figure 7 it was interpreted as Positive active power was caused by inductive loads due to electronics components of solar system. Whereas, negative active power was caused by capacitive loads. The zero active power happened by controllers were missed.
Figure 8 depicts SOC as the level of charge of a smart vehicle battery relative to its capacity. Mathematically:

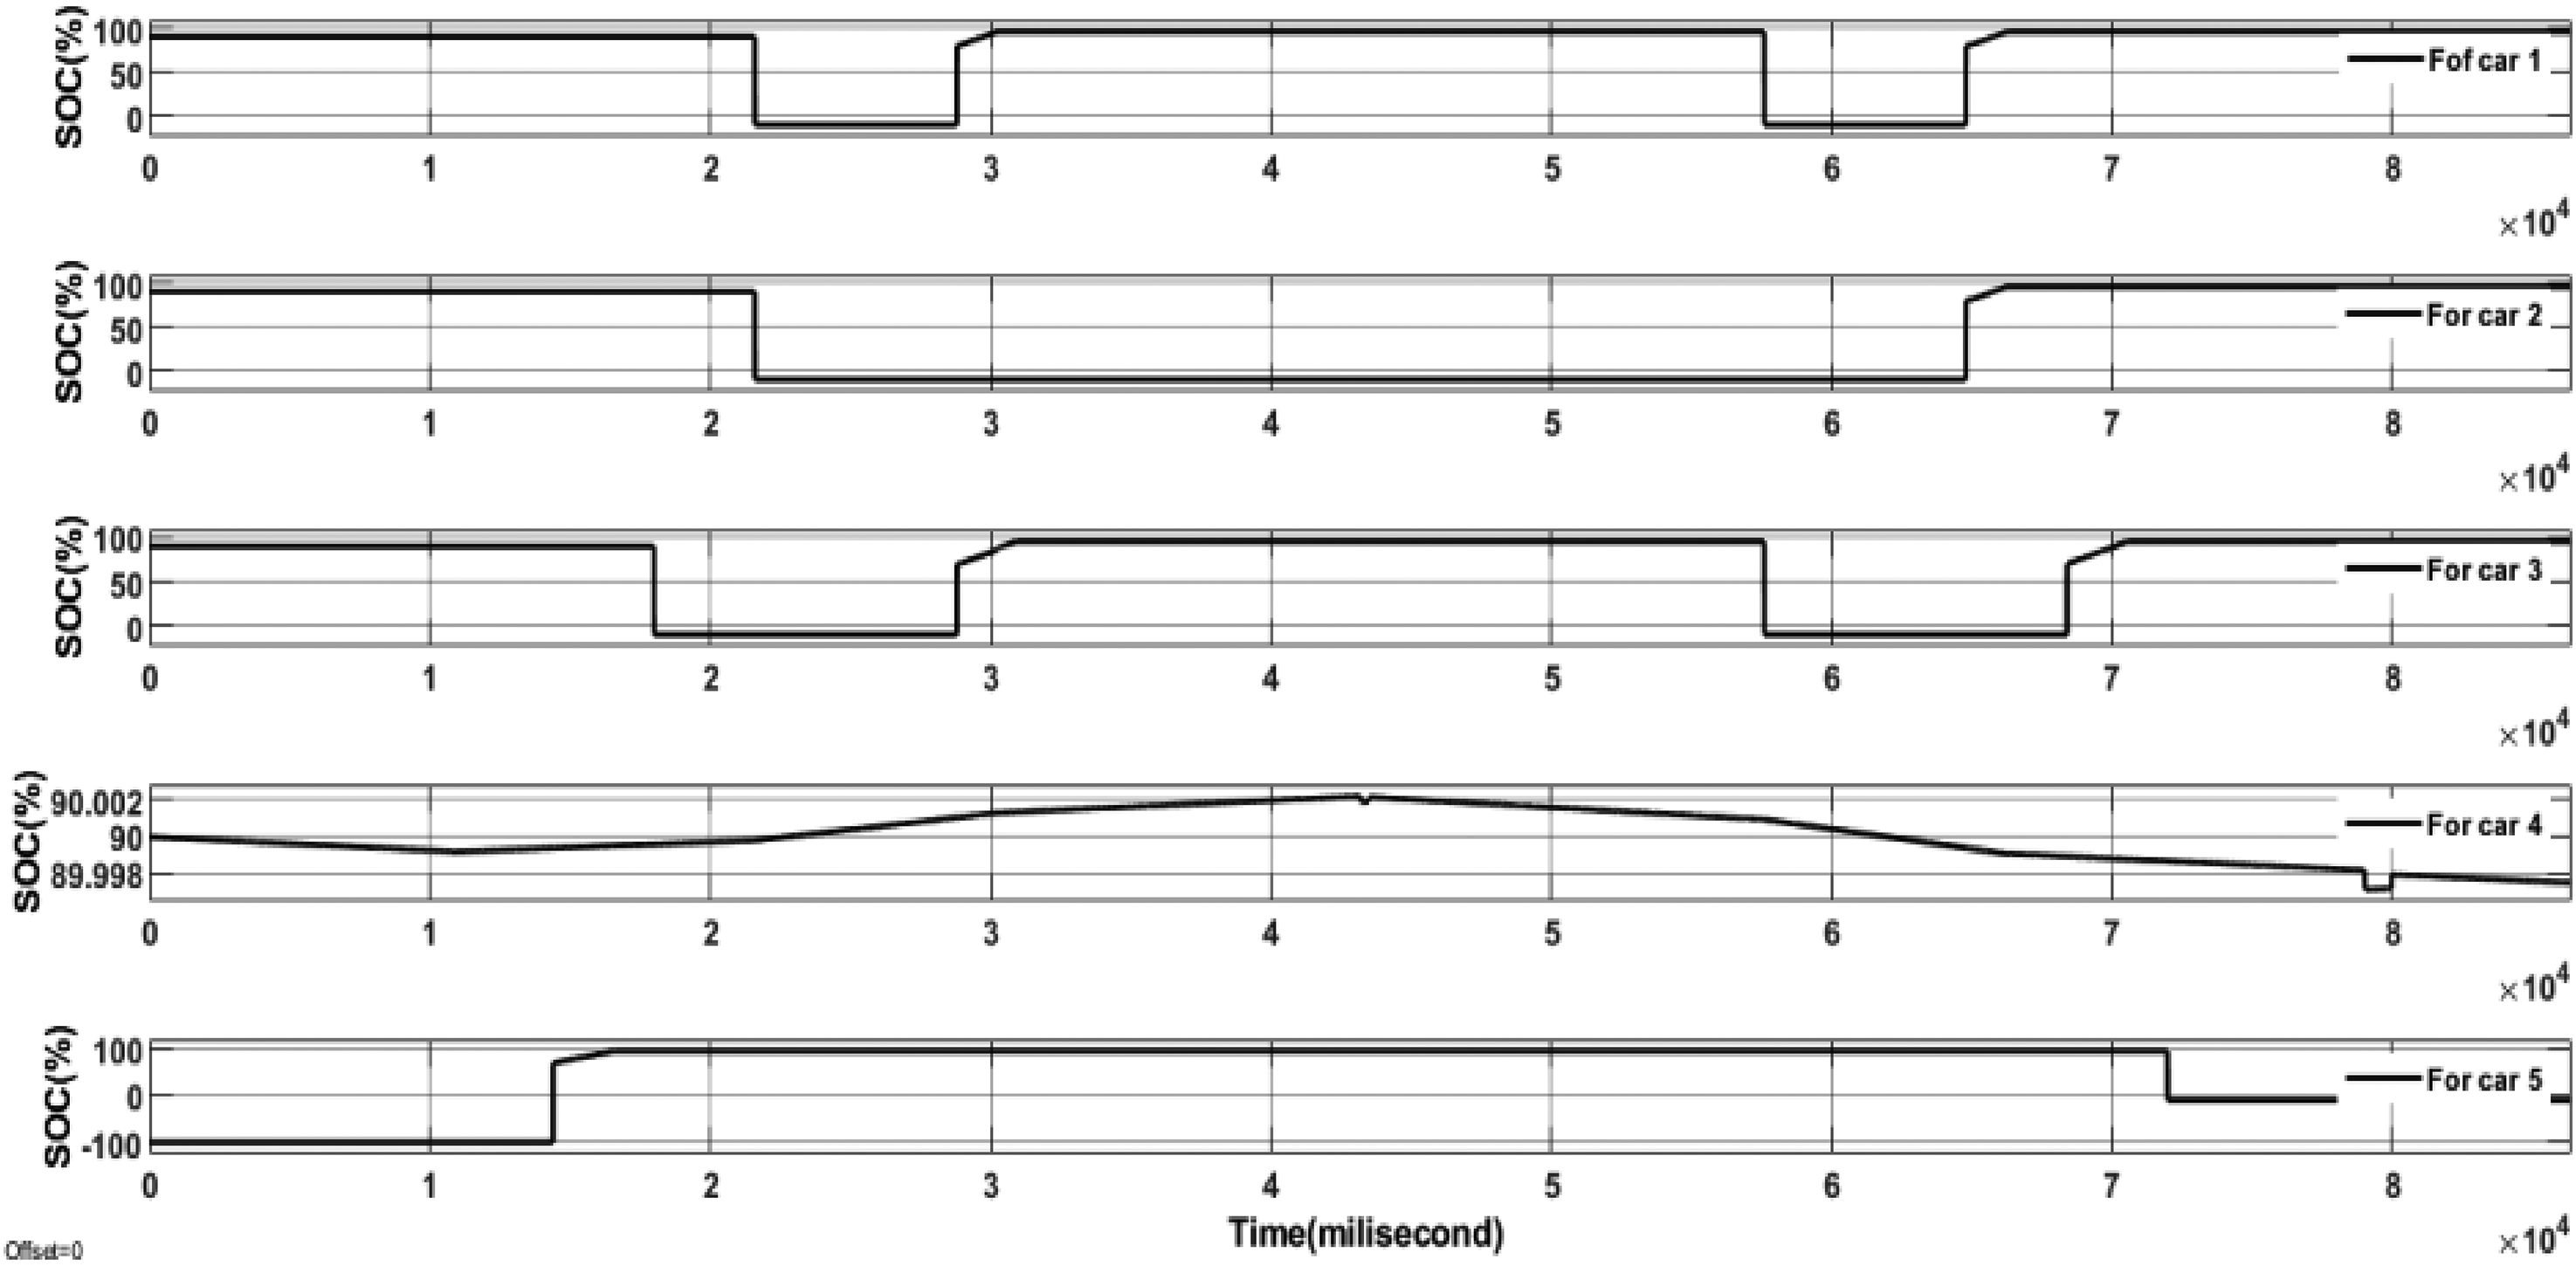
State of charging (SOC) of the five cars in the vehicle-to-grid (V2G) system studied.
SOC is usually expressed as a percentage (0% = empty; 100% = full). An alternative metric is depth of discharge (DOD). SOC is normally used when discussing the current state of a battery in use, while DOD is most often used when discussing the lifetime of the battery after repeated use. DOD, which can be thought of as the opposite of SOC, is determined mathematically as:

Table 1 shows the results of simulations under the assumption of parallel connection of modules. Charge capacity (QMAX) per hour was obtained, i.e., the amount of energy charge in a battery that enables 1 ampere of current to flow for 1 hour:

Charging and discharging at different hours of the simulation period (Q MAX /Ah = charge capacity, Q/Ah = , SOC = state of charging, DOD = depth of discharge).
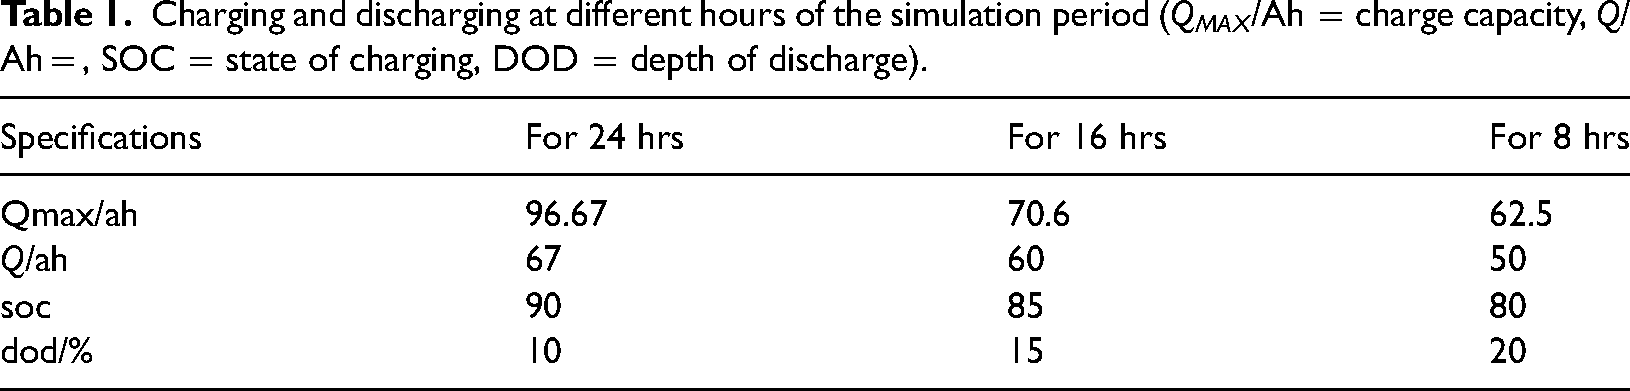
Where QMAX/Ah is the charge capacity, I is the current passing through the system, and t(s) is duration of charging. The state of charging determined for smart vehicles to the grid system indicated that the proposed systems were good for charging and discharging (Table 1).
Table 2 shows the power obtained for each load or fleet. Instead of pulling power from the grid, the V2G smart system allowed a vehicle's battery to store energy from the renewable sources and then safely discharge part of that energy back to the grid when it was needed most. With a V2G fleet, home load, power factors, industrial loads, smart car to grid system, solar panel farm, and wind farm could be charged overnight when energy demand is low. Vehicles could then drive their regular schedule, and discharge energy back to the grid while parked. Since batteries do not have huge heavy mechanical components that take a long time to start up, they can provide a really fast response. Moreover, people buy cars to drive around in, but the cars actually spend most of their time parked, i.e., this valuable asset sits doing nothing for most of the day. Electricity for several days can be obtained from a fully charged electric car battery. The simulation results obtained were home load 10MW (real power), power factor 0.15 MVA (reactive power), industrial load 0.16MVA (reactive power), smart car to grid 4MW (real power), solar panel farm 8MW (real power), and wind farm 4.5MW (real power), based on equations (24)–(29). The power consumed by industrial load and power factors was reactive power, since there was an electrical winding device incorporated, whereas real power was not reactive. As a result, industrial load and power factors were recorded as MVA, while the other loads were recorded as MW (Table 2).
Power values obtained in MATLAB simulations.
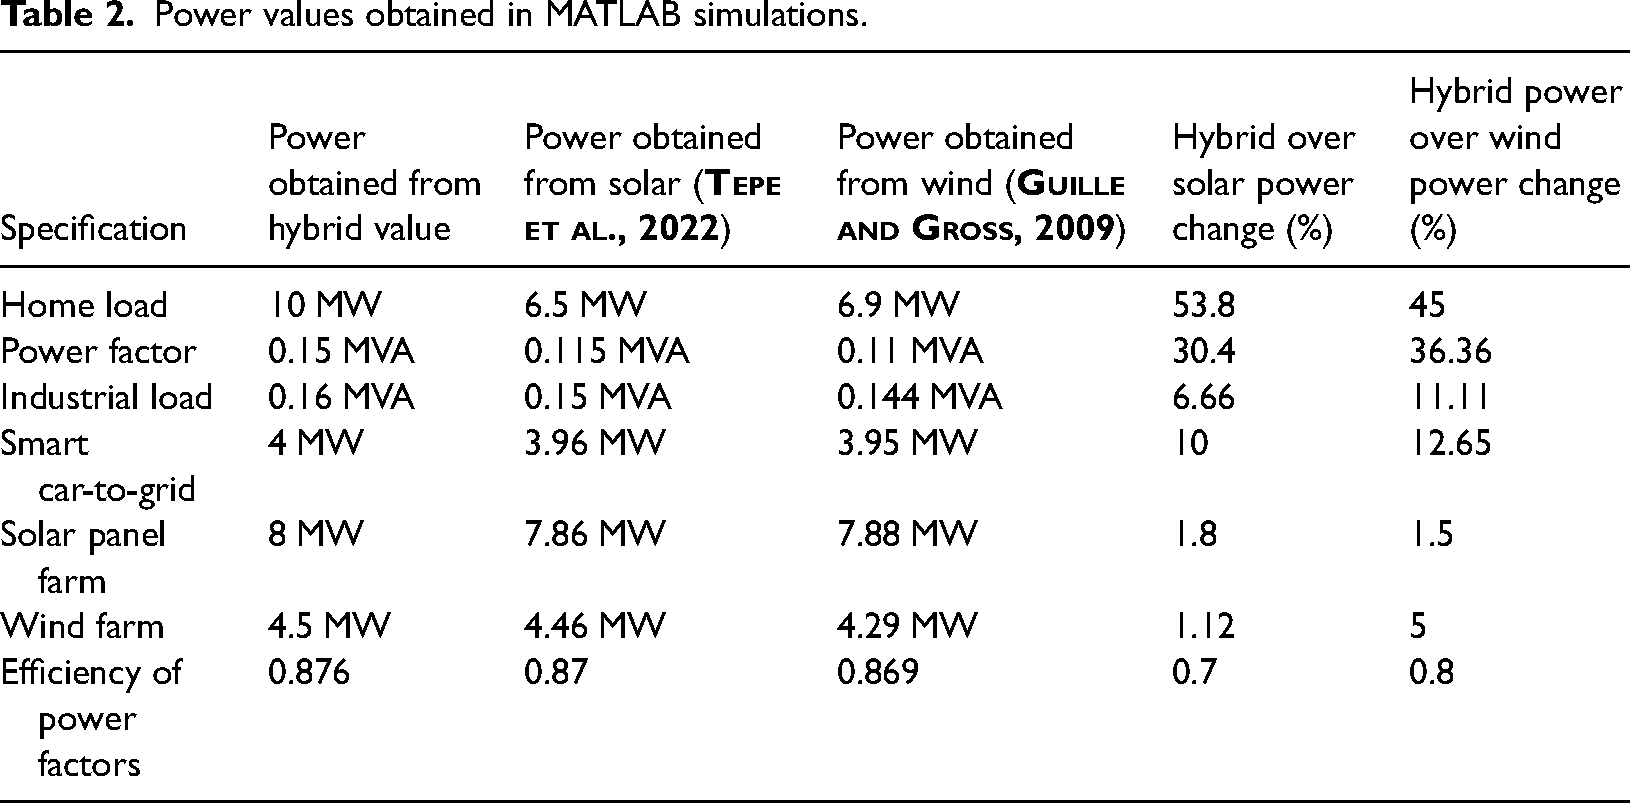
Efficiency of power factors was calculated as the ratio of energy output of the fleet (industrial load and power factors) to the energy input:
Electrical losses (

According to Table 2, the electricity generated by a hybrid system for a home's load was 53.8% greater than the power generated by a single solar system, but only 45% greater than a single wind system. Power factor, industrial load, smart car-to-grid, wind farm, solar panel farm, and efficiency of power factors were obtained as 30.4%, 6.66%, 10%, 1.8%, 1.12%, and 0.7% over the single power obtained from solar system, and 36.36%, 11.11%, 12.65%, 1.5%, 5%, and 0.8% over the single power obtained from wind system, respectively.
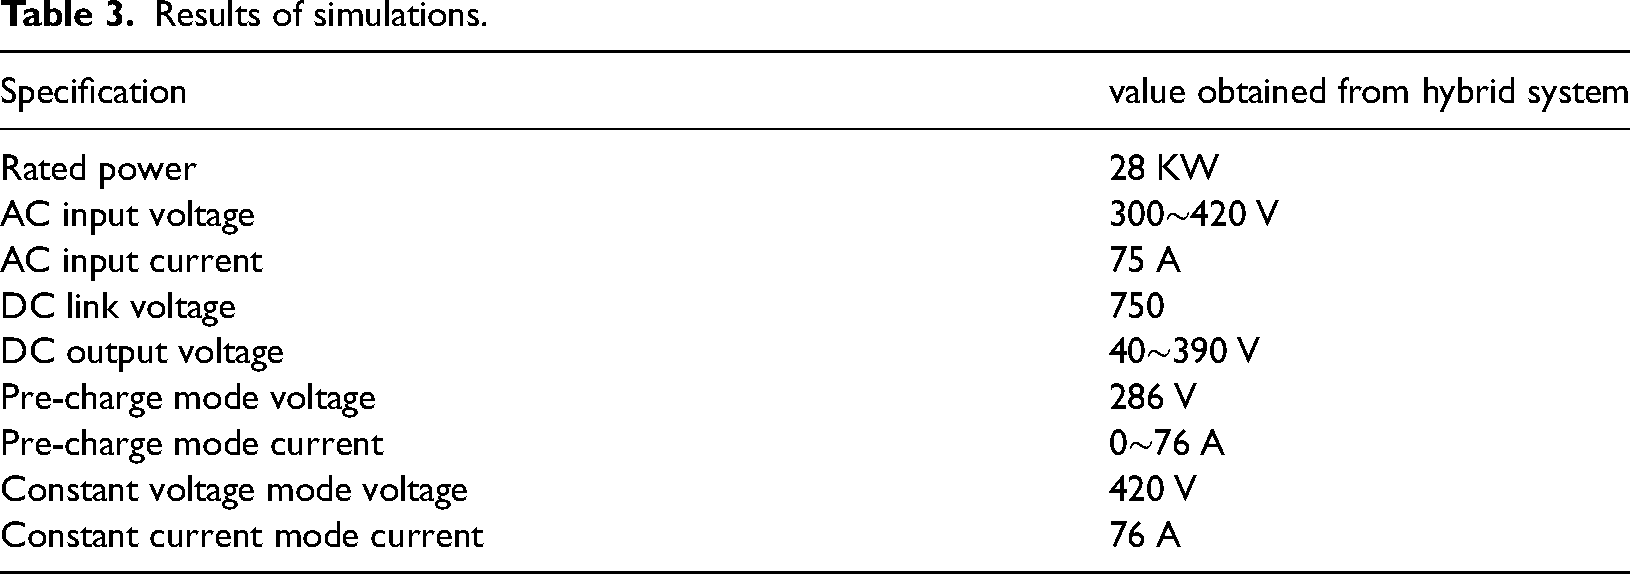
The simulation results indicated that the V2G technology allowed batteries from market vehicles to be combined into virtual power plants 9 Table 3). This combined energy could be sold on the energy market (used to provide grid services during peak times, thus helping to stabilize the grid and prevent blackouts). The V2G system also saved vehicle owners money by charging when electricity rates were low and could even power a building with low-cost energy stored in the batteries. All this was possible while prioritizing battery health and ensuring that all vehicles had enough charge to perform their daily duties. The V2G system has bidirectional energy flow. In order to convert from DC to AC power, the power flow needs to be handled in a way that alters the one-way flow of DC power into the alternating flow of AC. Mathematically, this was obtained from sinusoidal wave forms:


Results of simulations.
Where
Alternating current obtained from V2G could be employed in the transportation and electricity generating industries, and in practically all homes worldwide. To reduce to a value more suitable for the intended application, input voltage was used in our simulations. To deliver electricity through power transmission lines to homes and businesses, AC input current was applied. For simulation purposes, power convertors such as DC-Link capacitors were assumed to constitute an essential stage in power conversion for many applications, including three-phase pulse width modulation (PWM) inverters, photovoltaic and wind power inverters, industrial motor drives, automotive onboard chargers, and inverters. DC power is widely used in low-voltage applications such as charging batteries, automotive applications, and other low-voltage, low-current applications. Pre-charging of power line voltages in high-voltage DC applications, as a preliminary mode to limit the inrush current during the power-up procedure, was assumed in the simulations. Constant voltage is usually used on circuits that require a steady voltage supply for efficient operation. All numerical values in Table 3 were obtained using equations (35)–(38).
Conclusions
In-depth information about how hybridized renewable energy for smart vehicle-to-grid (V2G) systems interact with the smart grid architecture is provided in this study. It has also been discussed how to incorporate renewable energy sources with electric vehicles. Electric vehicles have been found to be able to support the grid with ancillary services like voltage and frequency management, peak power leverage, and reactive power support to improve operational effectiveness, secure the electric grid, and save operating costs. The study has demonstrated that the use of cutting-edge communication, control, and metering technologies will enable the deployment of hybridized renewable energy for smart vehicle-to-grid (V2G) systems into electric vehicles. In this situation, the smart grid will encourage EV compatibility for grid support.
Moreover, a vehicle-to-grid (V2G) system puts energy management back in the hands of the people, by turning their electric vehicles into mobile energy hubs. In an alternating system, current occurs in sine waves according to the frequency of the power source. In a circuit unaffected by inductance or reactance, voltage and current rise and fall together during each cycle. Moreover, constant current LED drivers have a fixed current in amperes or mill amperes and a variable voltage. Constant voltage drivers are similar, but show the opposite pattern, with fixed voltage and variable current. In the innovative smart V2G system in this study, the vehicles simulated were smart cars. The simulation results indicated that the electricity stored in smart vehicle batteries can be returned to the grid when needed. Thus in the home of the future, renewable energy could be used in daytime to power homes or offices and charge smart vehicles. When solar power cannot be produced and energy demand is high, the smart vehicles could give power back to the grid. In return, they could qualify for subsidies from the electricity provider as a reward for helping support infrastructure during peak times. During off-peak times at night, when little energy is needed in homes or offices, lower-cost energy could be drawn from the grid to recharge the smart cars. Thus the V2G technology would give cleaner power, lower energy costs, and greater stability. Smart vehicles can thereby power a more sustainable future. The V2G system also brings in revenue and reduces the overall cost of owning an electric vehicle, through putting the batteries to use when the vehicle is not being driven. Compared to previous study the present paper instructed some useful information how to use hybridized renewable energy for smart vehicle-to-grid (V2G) systems. It was found that there is high possibility potential energy generation from solars and wind to run smart vehicle-to-grid (V2G) systems. The power produced by a hybrid system was 53.8% more than the electricity produced by a single solar system, but only 45% more than the power produced by a single wind system. This suggested that a hybrid system is more effective at being defeated than a single system. These findings can accelerate adoption of electrical vehicles and help integrate renewable energy into the electric grid, while the suggested schematics are appropriate for making best use of limited resources for future smart vehicle technologies. The limitation of this paper was controller missed in the mathematical models, for this reason state of charging became zero which is impossible for real application. Moreover the paper was focused on simulation not practical, this is because of lack of experimental laboratories. Future studies on these issues should seek to optimize the methods, e.g., through model predictive control to achieve the best possible outcomes such as
Footnotes
Author’s Note
Sairoel Amertet, High school of Automation and Robotics, Peter the Great Saint Petersburg Polytechnic University, Saint Petersburg, Russia.
Declaration of conflicting interests
The author(s) declared no potential conflicts of interest with respect to the research, authorship, and/or publication of this article.
Funding
The author(s) received no financial support for the research, authorship, and/or publication of this article