
Abstract
Survey results have shown that many respondents report to be annoyed by vibration, which they attribute to a wind farm. The aim of this work is to explore wind turbine vibration characteristics and evaluate its effects on humans. The vibration was measured on a bed frame, the floor and a window in three dwellings located 3.3, 5 and 2.4 km from two wind farms in South Australia. It was found that vibration on the window was wind farm related as it contained amplitude modulation. Vibration on the bed and floor was low and dominated by ambient vibration. Evaluation based on the AS 2670-2 (1990) and BS 6472-1 (2008) standards indicated that the vibration levels on the floor are unlikely to cause discomfort or adverse comment. Also, vibration can be associated with local wind speed and low-frequency noise meaning that wind-induced structural vibration could be erroneously attributed to a wind farm.
Introduction
There are many benefits to renewable energy, which include reduced greenhouse emissions, improved air quality and avoiding the depletion of natural resources for future generations. Despite these clear benefits, the rapid expansion of wind energy has resulted in widespread community complaints regarding noise and vibration emission.1–5 In a survey conducted by Møller and Lydolf 6 in Denmark on 189 annoyed persons, the authors found that many residents have a ‘feeling’ of vibrations, either in their body (43.9%) or through objects around them (28.8%). Results from the survey conducted by Van den Berg et al. 7 also showed that apart from annoyance due to noise, 10% of respondents who live within 2.5 km of the nearest turbine noticed vibration, and 4% of respondents stated that they are annoyed by vibration (3% slightly annoyed and 1% rather annoyed).
Schofield 8 measured vibration signals at the Stateline wind farm in Oregon (US), consisting of 399 wind turbines with a rated power of 0.66 MW, in order to predict the effects of vibration signals of the proposed Maiden wind farm on the Laser Interferometric Gravitational wave Observatory site. The study found that the propagation of a 4.3 Hz vibration signal can be observed at distances up to approximately 18 km from the Stateline wind farm. In another study conducted by Styles et al. 9 on the effects of wind turbines on seismological records at the Eskdalemuir Seismic Array in Scotland, it was also found that low-frequency vibration signals can propagate beyond a 10 km distance from the wind farm. In a study related to assessment of the possible impact of wind farms on the Virgo gravitational wave observatory in Italy, Saccorotti et al. 10 showed that a 1.7 Hz vibration signal from a wind farm consisting of four 2 MW turbines can be detected at a site approximately 11 km from the wind farm. In Germany, the investigation of the impacts of wind turbine noise on seismic recordings was carried out by Stammler and Ceranna 11 and Estrella et al. 12 Both studies found that vibration signals produced by the operating wind turbines could be detected up to distances of approximately 15 km. Clearly, wind farm associated low-frequency vibration signals can propagate over long distances via the ground. However, these signals decay at a significant rate 13 and are hence expected to be at low levels at typical residential locations near a wind farm. Kelley et al. 14 demonstrated that vibration due to footsteps of a person in the vicinity of a house located approximately 1 km away from the downwind MOD-1 turbine was larger than the turbine-induced vibration. However, modern wind turbines are larger and hence, may produce stronger vibration which might propagate up to several kilometres from a wind farm.
Another possible way that vibration can transmit to residences is through air-borne noise propagation. Hubbard 15 summarised and analysed data on the vibration responses of houses from different noise sources and showed that acceleration amplitudes are linearly related to an acoustic loading. The study showed that the peak wind turbine noise can induce vibration measured on the floor and window. However, due to a lack of information on the distance of the houses from the wind farm, it is difficult to evaluate the effect of vibration on people. Schofield 8 also showed that vibration signals detected up to 11 km from a wind farm could be caused by air-borne noise propagation.
Environmental noise is often accompanied by vibration, which is not well researched in the case of wind turbines. Stable atmospheric conditions which occur during the night-time, can give rise to relatively high wind farm noise and vibration, which might affect sleep. It has been found that the frequency of arousal reactions during sleep is higher when the noise is accompanied by vibration, 16 leading to sleep fragmentation. Increasing vibration levels might also result in awakenings, sleep stage changes, stronger cardiac activations and negative influences on self-reported sleep parameters.17,18 Although the vibration levels in the context of wind farms may be relatively low, it is important to consider this issue because wind farms are often located in rural areas where the ambient vibration is also low. The presence of this vibration at residences in the vicinity of wind farms could contribute to annoyance. However, due to the dominance of low-frequency noise, the effects of visual impacts and the relatively low vibration levels, the annoyance experienced may be related to a placebo effect. Therefore, the aim of this work is to analyse vibration signals measured inside residences located near wind farms and to evaluate the acceptability of the vibration levels for human comfort.
Methodology
Field measurements
Measurements were carried out for several days at two houses located 2.4 and 3.3 km from the Waterloo wind farm, and one house located 5 km of the Canunda wind farm. At the time, the Waterloo wind farm contained 37 Vestas V90-3.0 MW turbines, each with 80 m hub height, 44 m rotor plane radius and an average rotational speed of 16 rpm. The Canunda wind farm consisted of 23 Vestas V80-2.0 MW wind turbines with a turbine hub height of 67m, rotor plane radius of 40 m and average rotational speed of 17 rpm. The wind farms are located in South Australia, as pictured in the Google Earth image shown in Figure 1(a) and (b). The location of the houses with respect to the wind farms and location of accelerometers and microphones used to measure vibration inside of the houses are also shown in Figure 1(c) to (e).
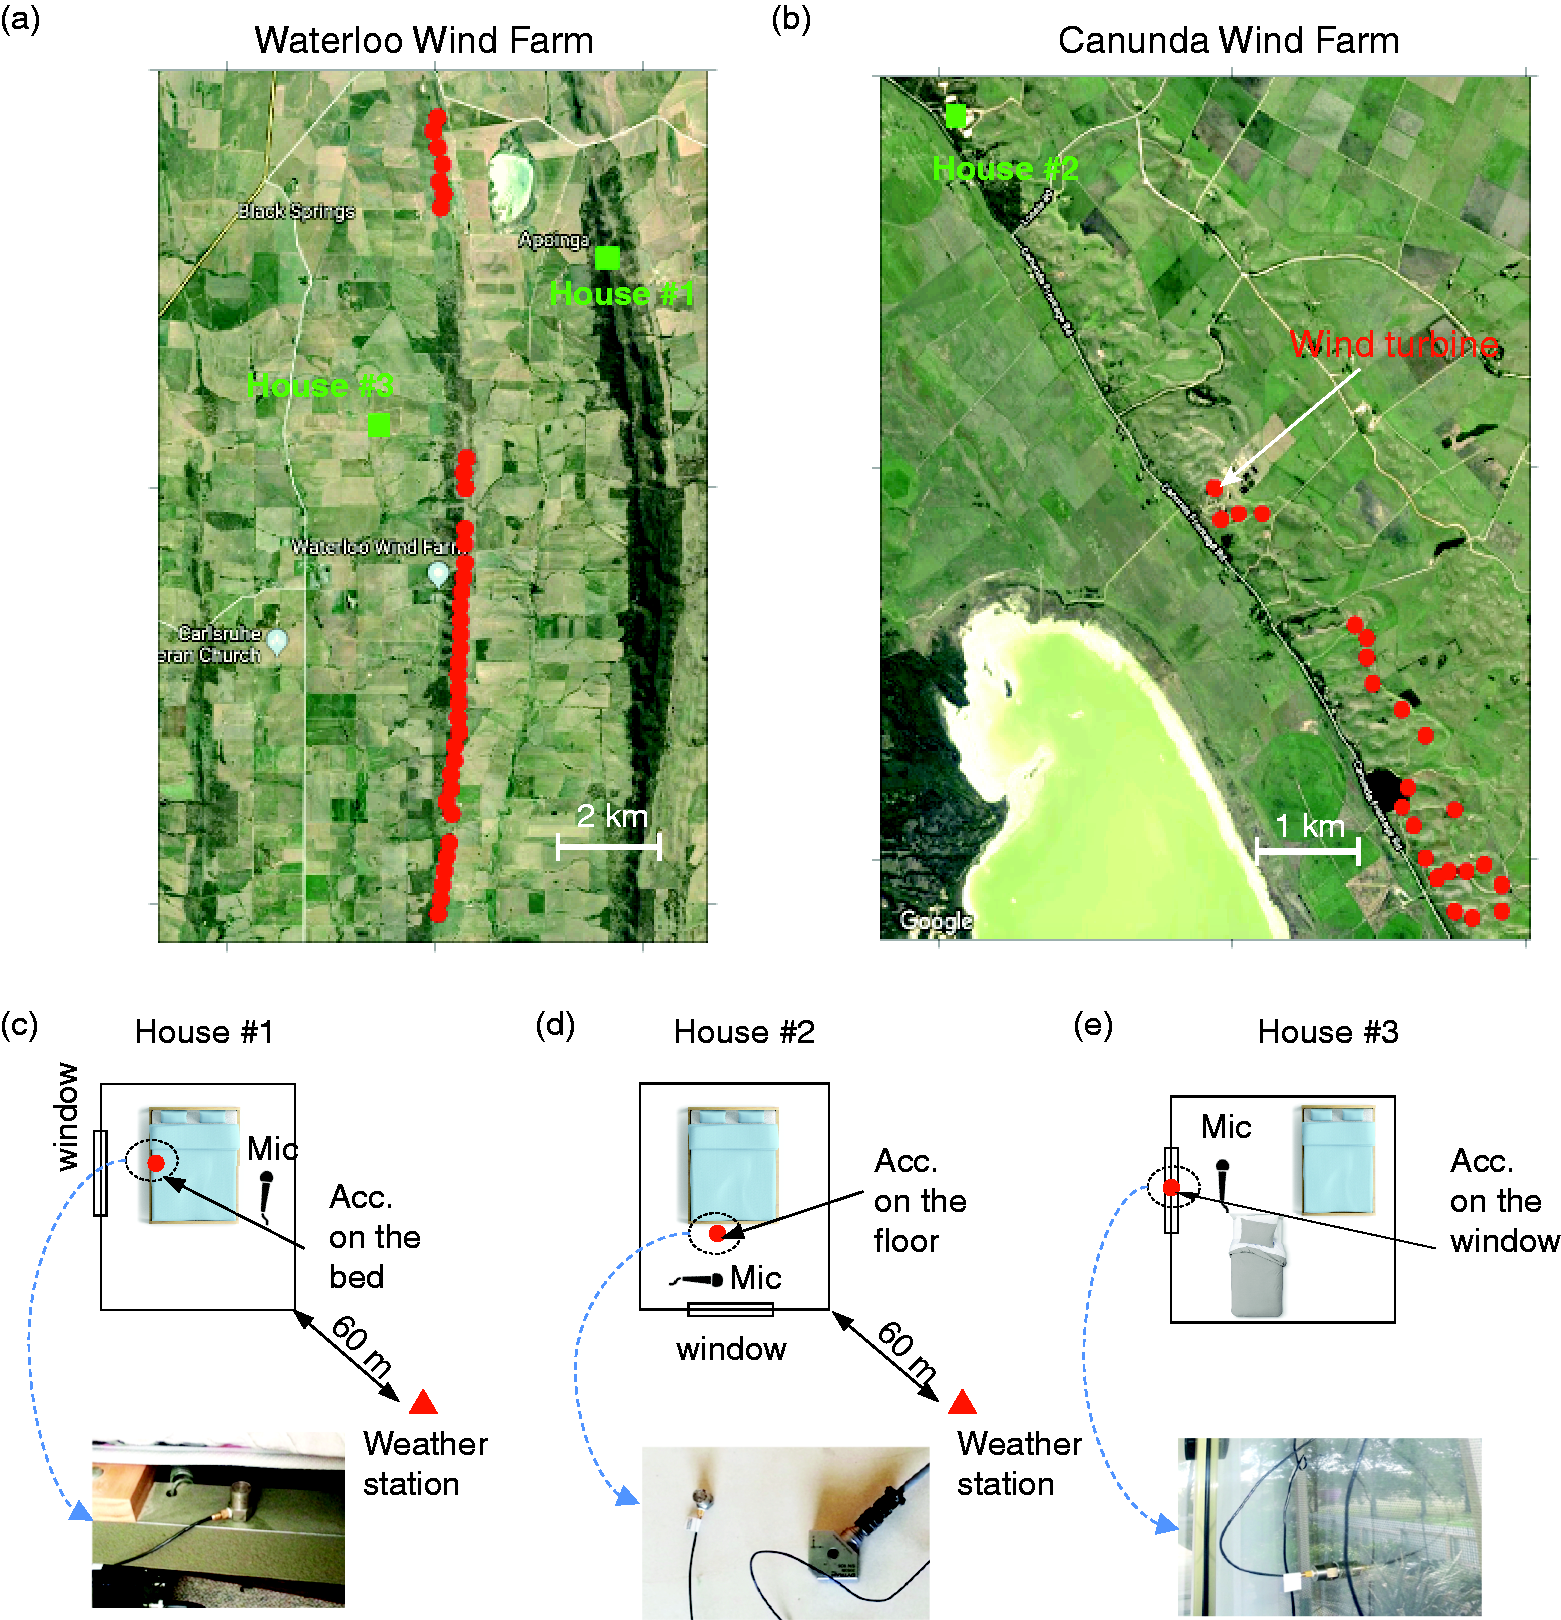
(a) Waterloo wind farm in South Australia made up of 37 × 3 MW turbines (red symbols) at the time of the measurements, (b) Canunda wind farm at Lake Bonney in South Australia made up of 23 × 2 MW turbines and (c) to (e) show locations of accelerometers and microphones inside the houses.
For House 1, an accelerometer was attached to the bed and a microphone situated near the bed (Figure 1(c)), and the measurement period was from 24 July 2013 to 1 August 2013. For House 2, data were collected from 6 May 2014 to 19 May 2014 and an accelerometer was attached to the floor and a microphone located near both the bed and window (Figure 1(d)). For House 3, an accelerometer was mounted to the glass of a window and a microphone located near the window (Figure 1(e)), and data were collected from 14 June 2013 to 25 June 2013. Due to variations in the availability of each residence for indoor measurements, the measurement duration varies for the three residences. All microphones were Brüel and Kjær (B&K) type 4955 with a noise floor of 6.5 dB and flat frequency response down to 6 Hz. The accelerometers were B&K type 4332, and they were attached to the relevant surfaces using a thin layer of bee’s wax to measure the vertical acceleration on the bed and floor and the horizontal acceleration on the window. Using bee's wax for attaching accelerometers onto surfaces is an accepted mounting method, provided that the surface temperature is less than 40°C and acceleration levels are below 100 m s−2.19,20 To determine the noise floor of the accelerometers, vibration levels at the three houses were measured when the wind farm was not operating, and the wind speed was close to zero. At the time of the measurements, House 2 and 3 were unoccupied while House 1 was occupied.
At House 1, the floor consists of wooden boards with carpet. The walls are constructed from stone and the interior is covered with a layer of plasterboard. The roof is made of galvanised iron sheets and the timber-framed windows are single glazed. House 2 is constructed on a concrete slab and the interior floor is vinyl. The wall construction consists of bricks and the interior is covered with double leaf limestone. The roof is colour-bond steel with high density insulation in the ceiling. At House 3, the 100 mm thick walls are constructed from weatherboard and 25 mm of cladding. The floors consist of concrete with carpet covering and the windows are single glazed and framed by aluminium. The roof consists of corrugated steel sheets. The ceiling is constructed from plasterboard and there is no insulation above it or in the walls. During the measurements, the windows were closed at all residences.
Data were recorded using B&K LAN-XI data acquisition hardware, which was operated using B&K Pulse software to acquire a continuous sequence of 10 min data blocks. The sampling frequency was 8192 Hz. The local wind speed and direction were recorded using Davis Vantage Vue and Davis Vantage Pro weather stations mounted at heights of 1.5 and 10 m, respectively. The accuracy of measuring wind speed and direction was 0.4 m s−1 and
Data analysis
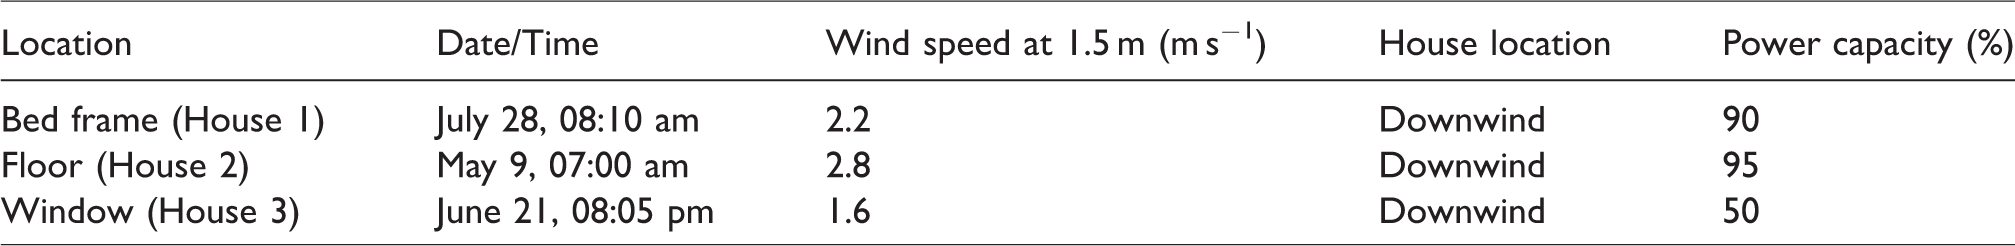
The vibration data were analysed using spectrogram plots which are obtained by dividing the time series data into segments of 81,920 (10 times the sampling frequency) points using a Hamming window and 50% overlap. This gives 0.1 Hz and 5 s frequency and time resolution, respectively, which are needed to detect the blade pass frequency at 0.8 Hz and harmonics. To capture worst case conditions, vibration data corresponding to high power output were used for evaluating the comfort perception of people inside the house. Additionally, to ascertain more detailed information about the spectral content of vibration signals, a narrowband analysis was carried out. The conditions associated with these measurement times are summarised in Table 1.
Summary of wind conditions and wind farm capacity factor for selected measurement times.
To evaluate whether vibration levels are lower or higher than levels of acceptance, the base curve given by AS 2670.2 (1990) 22 : ‘Evaluation of human exposure to whole-body vibration-Continuous and shock-induced vibration in buildings (1–80 Hz)’ was used. The Australian Standard is identical to ISO 2631-2 (1989), 23 and it is important to note that the base curve in the 1989 version of ISO 2631-2 was removed in the 2003 version. 24 As a result, the Australian Standard was withdrawn by the Standards Australia technical committees for Vibration and Shock Human Effects (AV-010) in 2013. However, due to the absence of a similar replacement and for comparison purposes, the guidance values in the old version of AS 2670.2 (1990) were still used.
The vibration signals were also evaluated using the British Standard BS 6472-1 (2008)
25
: ‘Guide to evaluation of human exposure to vibration in buildings – Part 1: Vibration sources other than blasting’. The level of acceptance according to the British Standard is evaluated based on vibration dose value (VDV), which takes into account such factors as exposure duration, magnitude and frequency, as shown in equation (1)
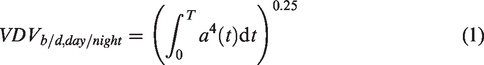
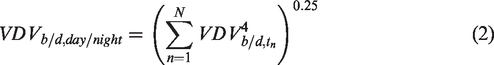
Since the data in this study were collected with a continuous sequence of 10 min data blocks, the total VDV for the day or night period can be estimated based on equation (2) as follows
Results
Characteristics of vibration inside residences
The acceleration levels measured on the bed visually correlated well with the local wind speed, although the vibration signals did not correlate well with the wind farm power output (Figure 2(a)). While high wind farm power output was seen between 23:00 (July 27) and 4:00 (July 28), the vibration levels were small. This implies that vibration on the bed could be induced by the local wind speed rather than transmitted from the wind farm. In addition, although the dominant peak at 23 Hz was observed on the spectrogram, this peak was not associated with wind farm operation since it remained at a constant level which was independent of variation in wind speed and wind farm power output, as shown by the dashed box in Figure 2(a). Similar results were also obtained in the acceleration measured on the floor where there were no obvious peaks in the frequency spectrum, except for electrical noise (Figure 2(b)). The vibration levels were significant at very low frequencies (<5 Hz). On the window, the signals correlated well with wind speed and power output, and peaks can be observed at approximately 9, 23, 28 and 48 Hz (Figure 2(c)).
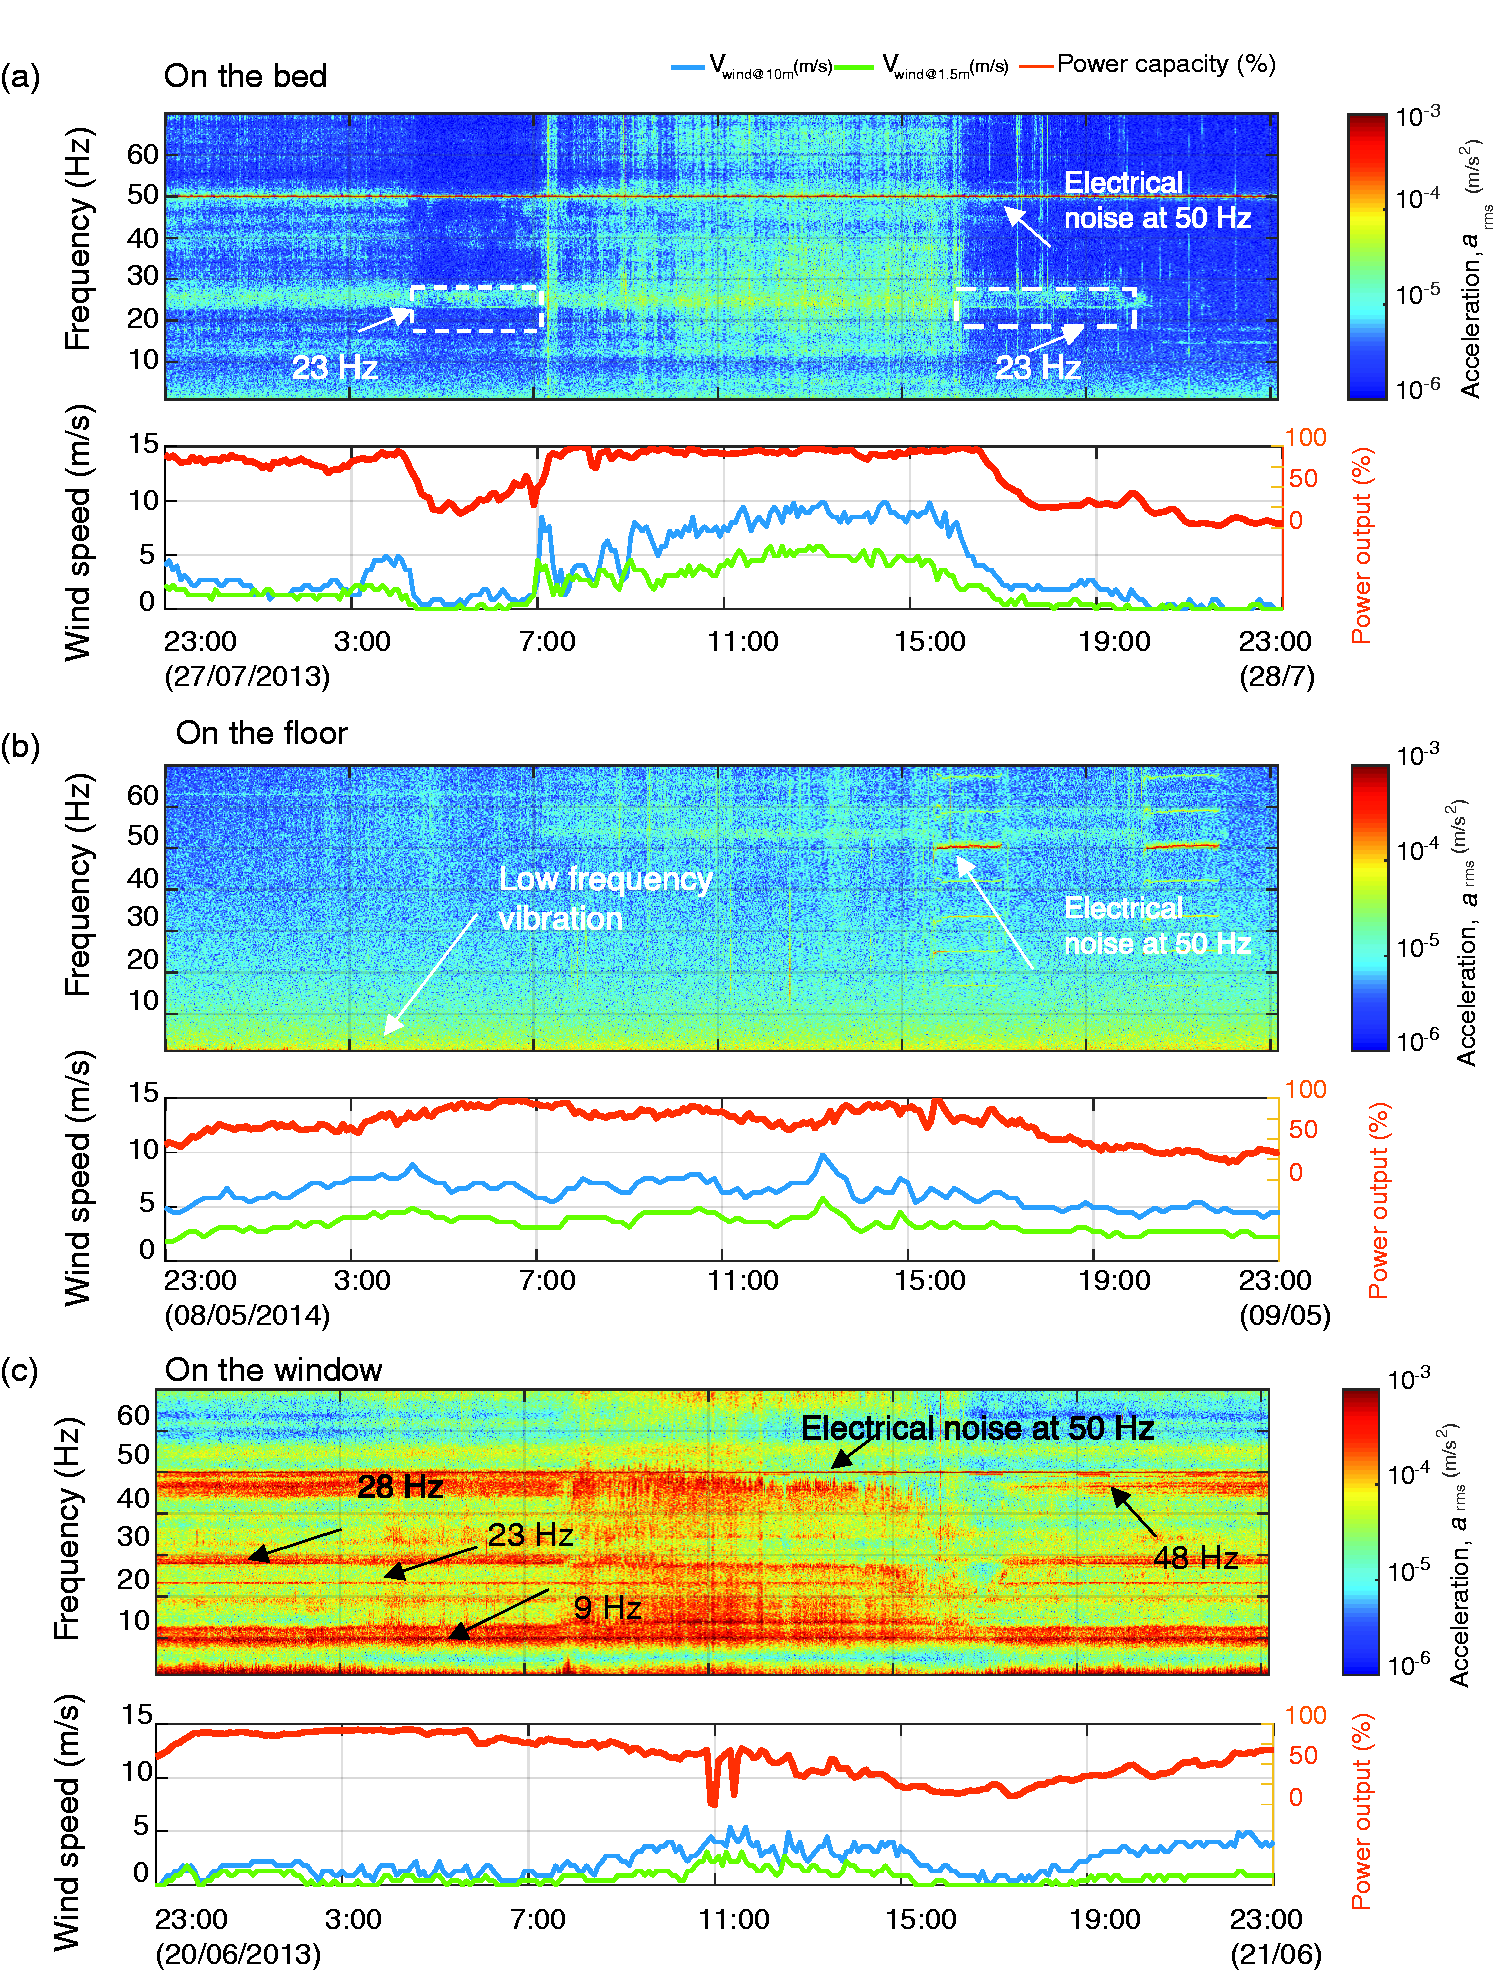
Spectrogram of vibration signals measured at: (a) House 1 on the bed, (b) House 2 on the floor and (c) House 3 on the window.
To interpret more detailed information about the spectral content of vibration signals, a narrowband analysis was conducted. The frequency response of data measured on the bed and floor did not contain noticeable spectral characteristics unique to wind turbines, as shown in Figure 3. This indicates that the vibration signals measured on the bed and floor were dominated by ambient vibrations. This is consistent with the results conducted by Kelley et al. 14 who showed that background vibration signals are more significant than the wind turbine signals at a house located approximately 1 km from the wind turbine. However, the vibration signals measured on the window at frequencies of 28 and 48 Hz were amplitude modulated (Figure 3(b)). Amplitude modulation (AM) is characterised by side-bands adjacent to the main spectral peaks that have a spacing equal to the blade-pass frequency (approx. 0.8 Hz). The presence of AM in the vibration signals measured on the window implies that the vibrations are wind farm related. Vibration measured on the window must be interpreted with caution as framing and sealing of the glass affect the vibration level.
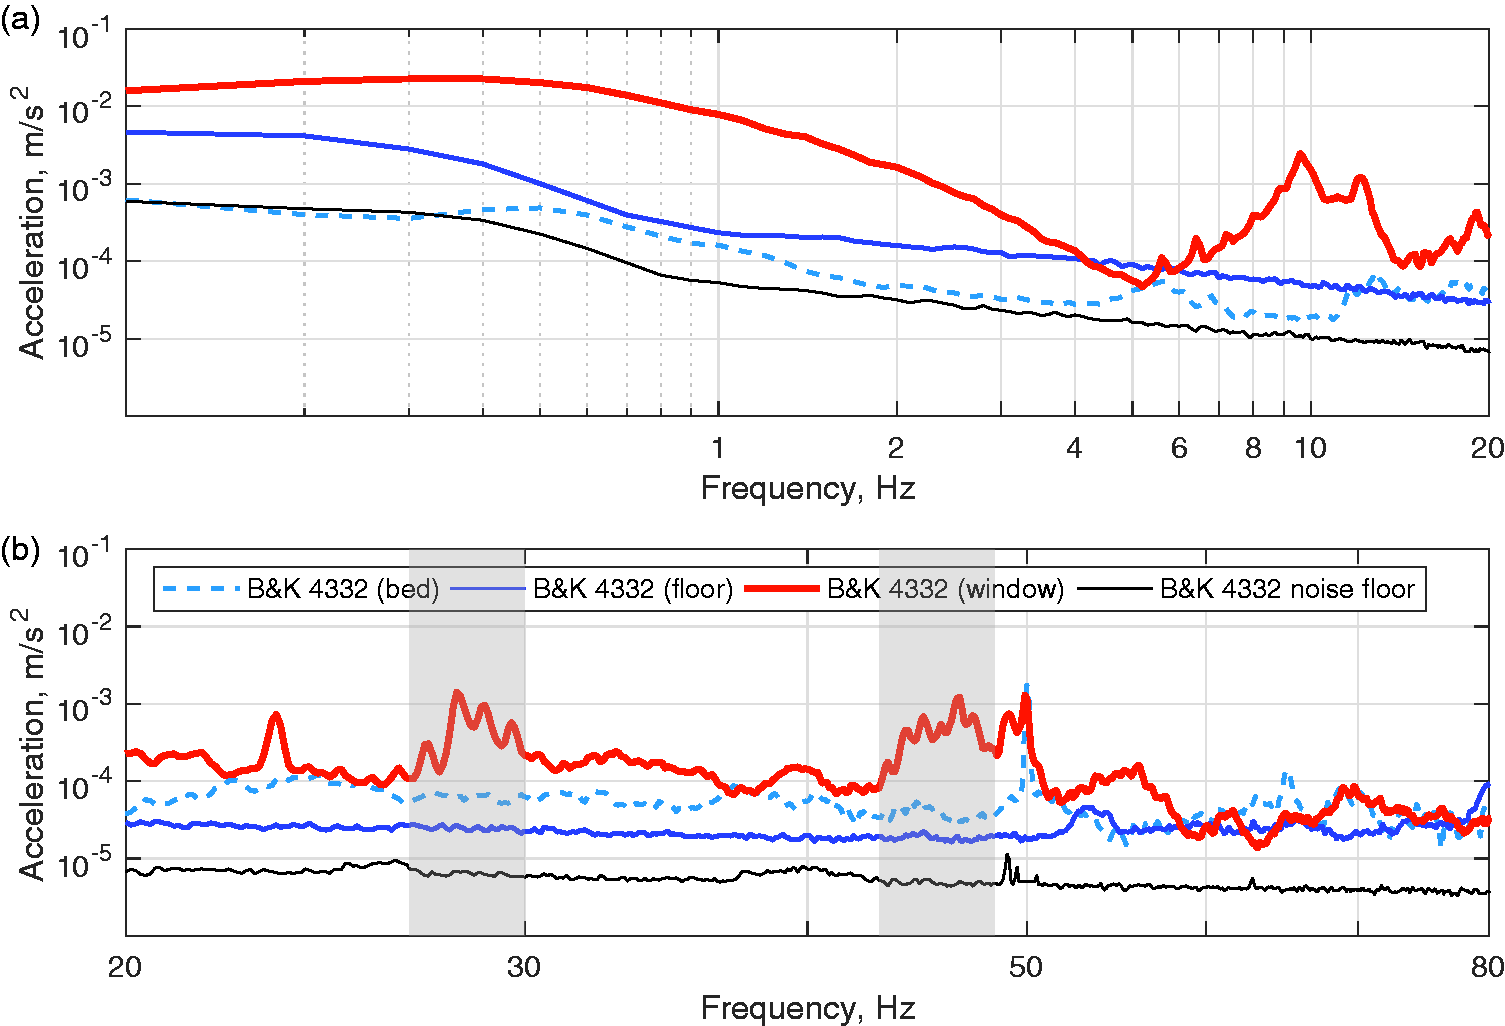
Narrowband plots corresponding to vibration measured on the bed and window at House 1 and 3, and on the floor of House 2. (a) Narrowband plot at frequencies from 0 to 20 Hz and (b) narrowband plot at frequencies 20–80 Hz. Frequency resolution is 0.1 Hz, accelerometer noise floors are shown by the black line.
Characteristics of noise inside the dwellings
When analysing the impact of wind farm vibration on humans, it is also important to consider the associated noise as its presence influences the assessment of vibration annoyance and adverse human health effects. 26 In this study, simultaneous acoustic measurements were taken inside of each residence, in the same room as the vibration measurements. Data from microphones were used for evaluating the acceptance of noise levels. The unweighted-10 min averaged 1/3-octave spectra for the low power output (power capacity < 10%) and high power output (power capacity > 80%) cases are shown in Figure 4. For the majority of 1/3-octave bands between 1 Hz and 1 kHz, the noise levels measured during the low power output cases were consistently lower than those during the high power output cases. The results in Figure 4 also indicate that the noise level in the 50 Hz 1/3-octave band, which contains the amplitude modulated 48 Hz tone that was identified at House 3, was close to the audibility threshold. 27
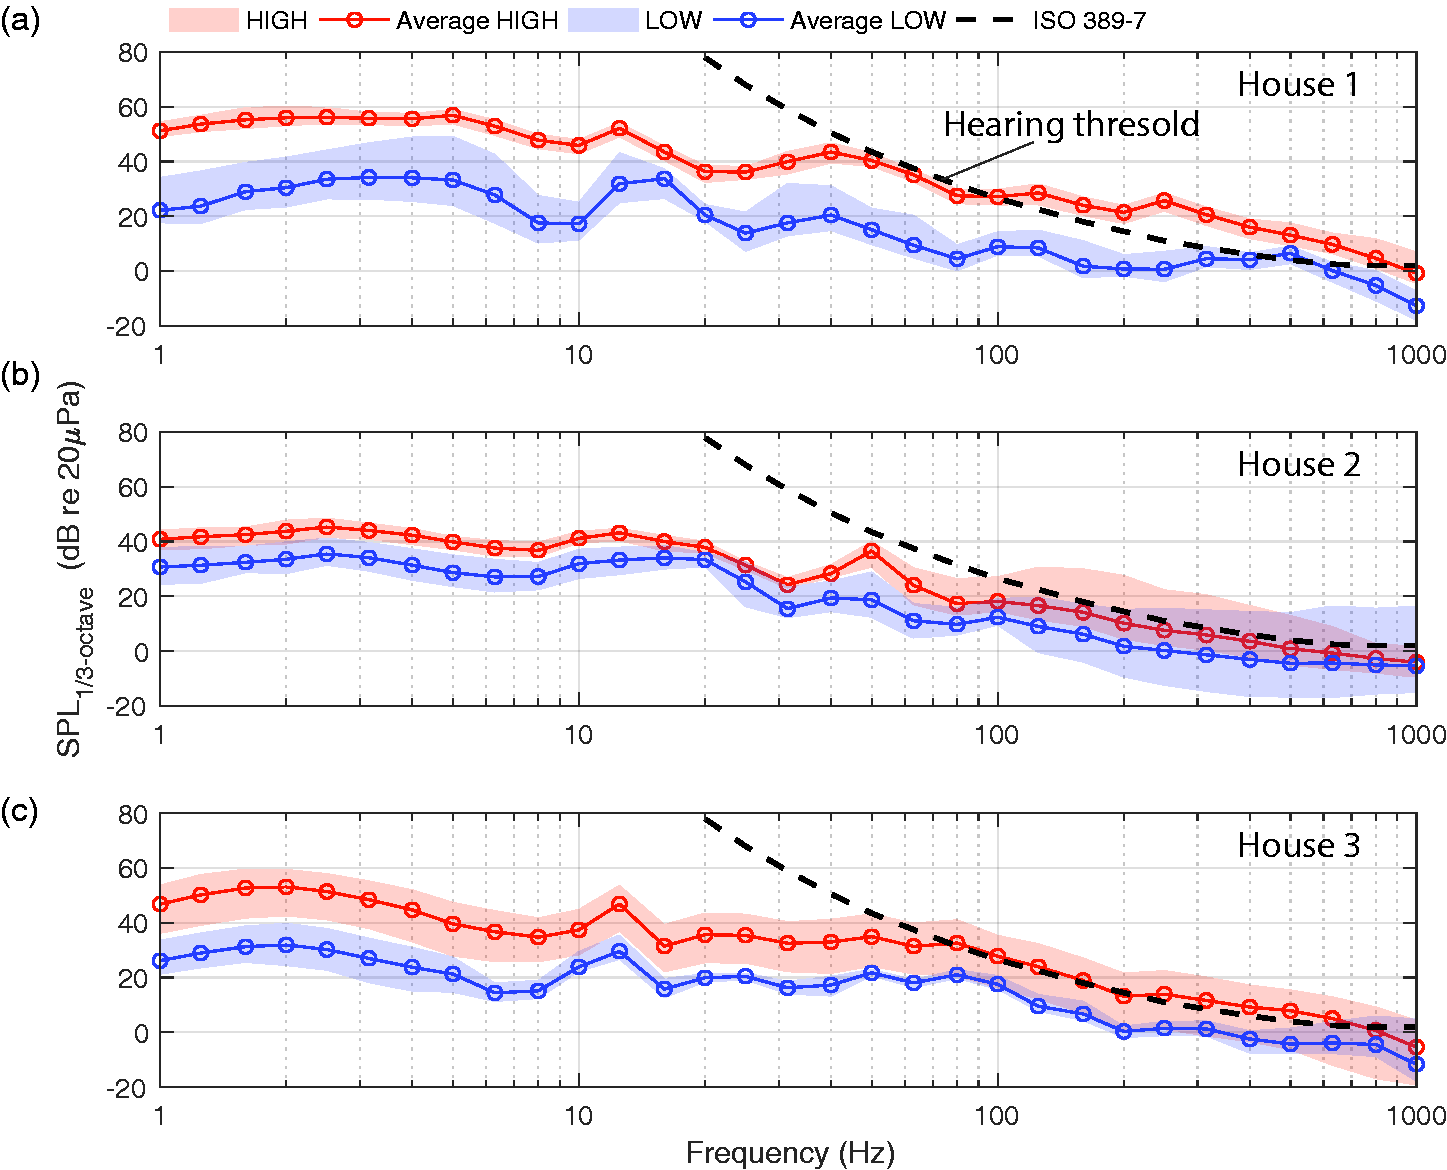
Comparison of 1/3-octave spectra SPL. (a) House 1, (b) House 2 and (c) House 3. The ISO 389-7 hearing threshold curve is shown by the dashed black line. The area shaded in red and blue indicates the range of measured values for the high power output cases (HIGH) and low power output cases (LOW), respectively. The mean spectra are shown by the red and blue curves, which generally lie midway between the areas of the range. SPL: sound pressure level.
Levels of infrasound were significantly below the audibility threshold. The SPL levels in the 20 Hz 1/3-octave band were at least 30 dB below the audibility threshold for a person with normal hearing. 27 Since the spectra shown in Figure 4 represent 10 min averaged values, the actual low-frequency noise levels are higher due to the presence of AM, particularly in the 50 Hz 1/3-octave frequency band. Therefore, it is likely that noise in the 50 Hz 1/3-octave band was audible indoors.
Vibration evaluation according to the Australian Standard
The comparison between measured vibration signals and the acceleration base curve for human comfort specified in AS 2670.2 (1990) is shown in Figure 5. The measured vibration levels on the bed frame were below the acceptable levels, as shown in Figure 5(a). In some cases, the bed frame structure plays a role as a dynamic absorber which can reduce the vibration levels transmitted from the floor. In that case, it is practical to evaluate the acceptability of building vibration by measuring on the floor. 28 Vibration levels on the floor appear are higher than vibration levels on the bed frame at frequencies below 16 Hz, suggesting the bed frame absorbing role. However, the bed frame vibration levels are still below acceptable levels as shown in Figure 5(b). The highest vibration levels were measured on the window, which is expected given window’s low weight and thickness; yet the levels were still below the acceptance criteria.
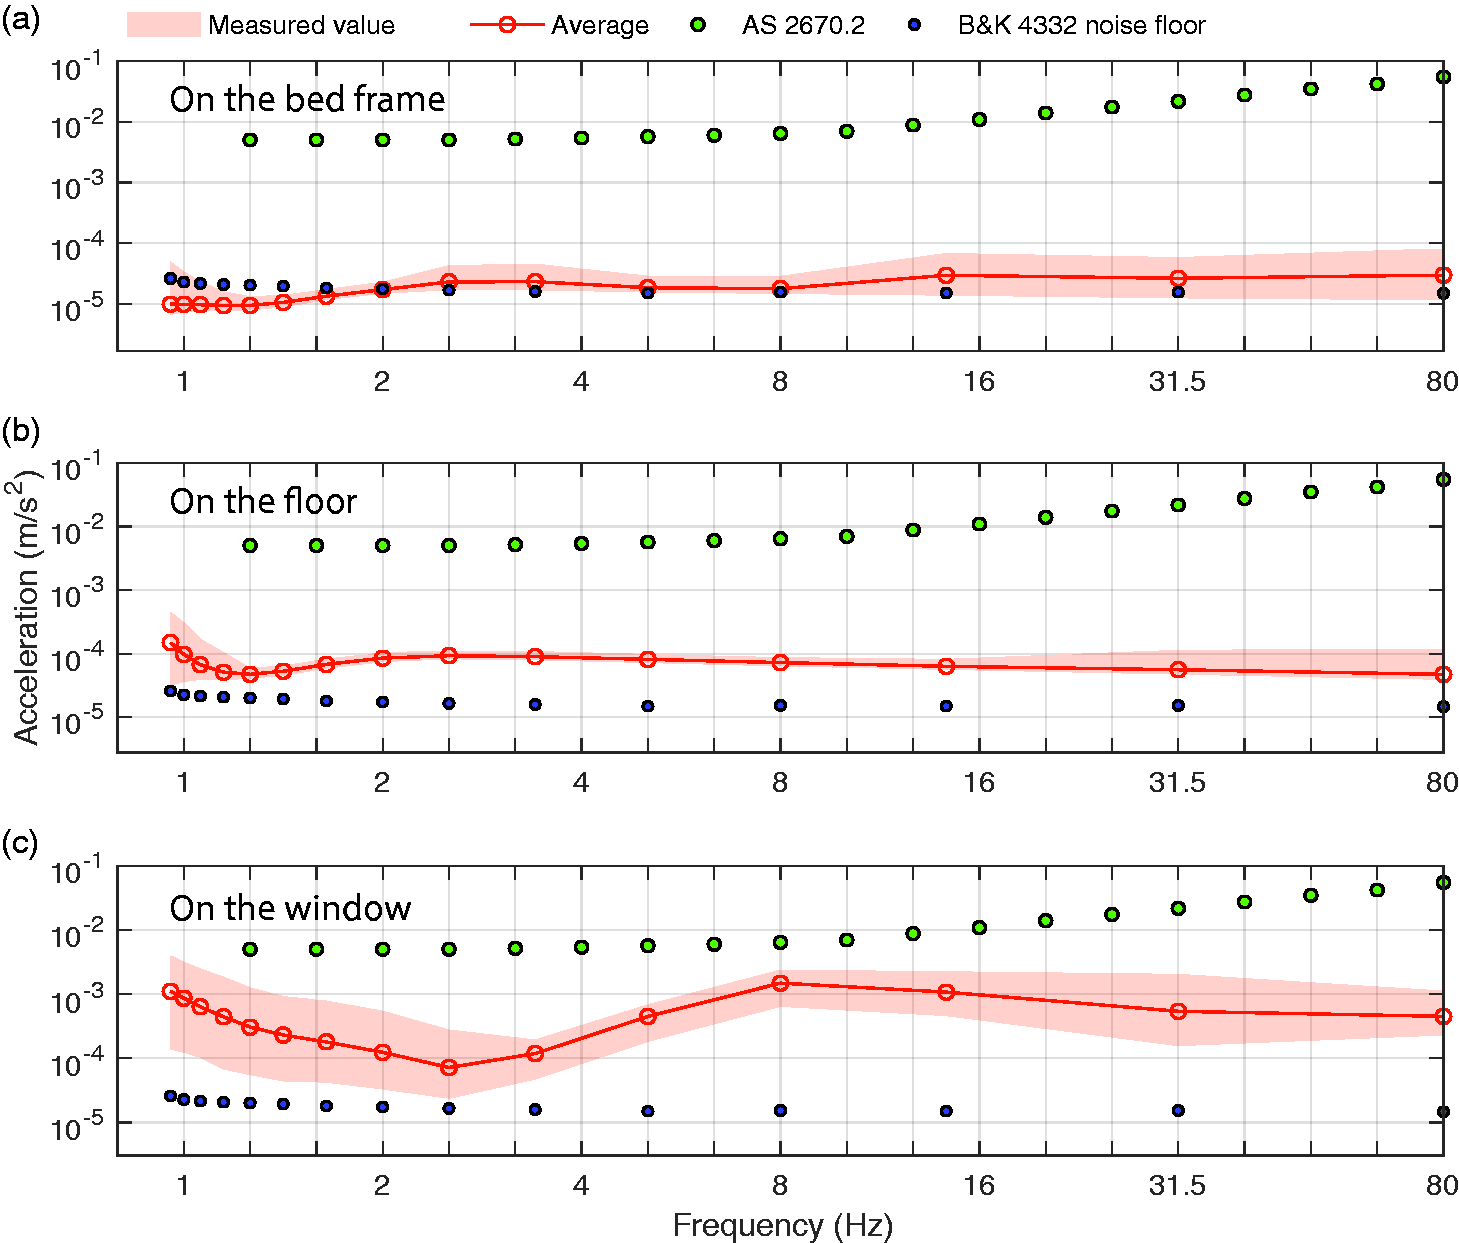
1/3-octave vibration acceleration spectra measured with three accelerometers. (a) Results on the bed, (b) on the floor and (c) on the window. AS 2670.2 acceleration base curve for building vibration (factor = 1.4, applied for night-time) is shown using green dots and the instrumentation vibration floor is also shown using black dots. The shaded region indicates the range of measured values. A line plot has been chosen for clarity, but it should be noted that only 1/3-octave band centre frequencies are relevant.
Vibration evaluation according to the British Standard
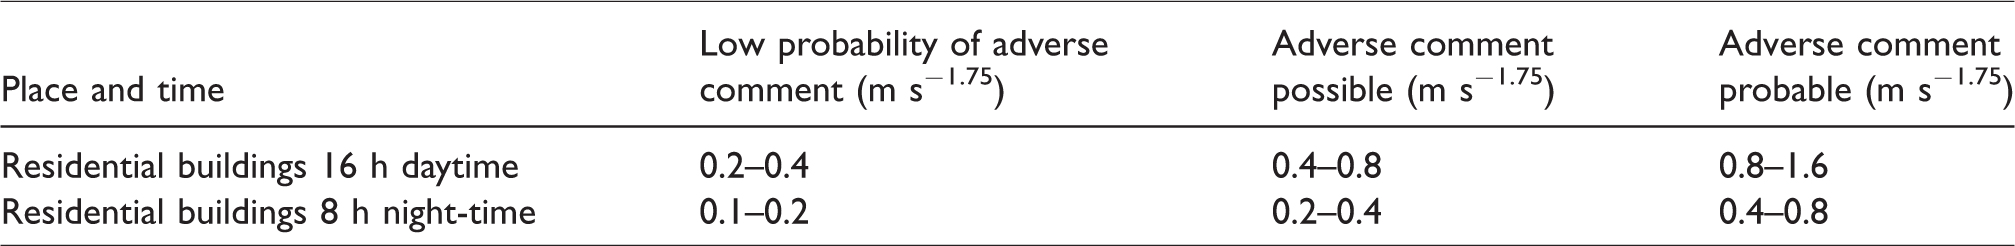
VDV values for each 10 min measured vibration sample were calculated using equation (1) and are shown in Figure 6. The VDV values estimated from data measured on the floor and window were higher during the night-time than the daytime, as shown in Figure 6(b) and (c). The total VDV values for the day or night period were estimated using equation (2) and the results are listed in Table 2. By comparing the total VDV values in Table 2 with the VDV values which might result in adverse comment in Table 3, the measured VDV values for the window were within the ‘Low probability of adverse comment’ range. On the bed frame and floor, the measured values were lower than the lowest bound of the before-mentioned range. The highest vibration levels were measured on the window. Although these levels could cause adverse comment as evident from Table 3, that is highly unlikely as people seldom make contact with the window.
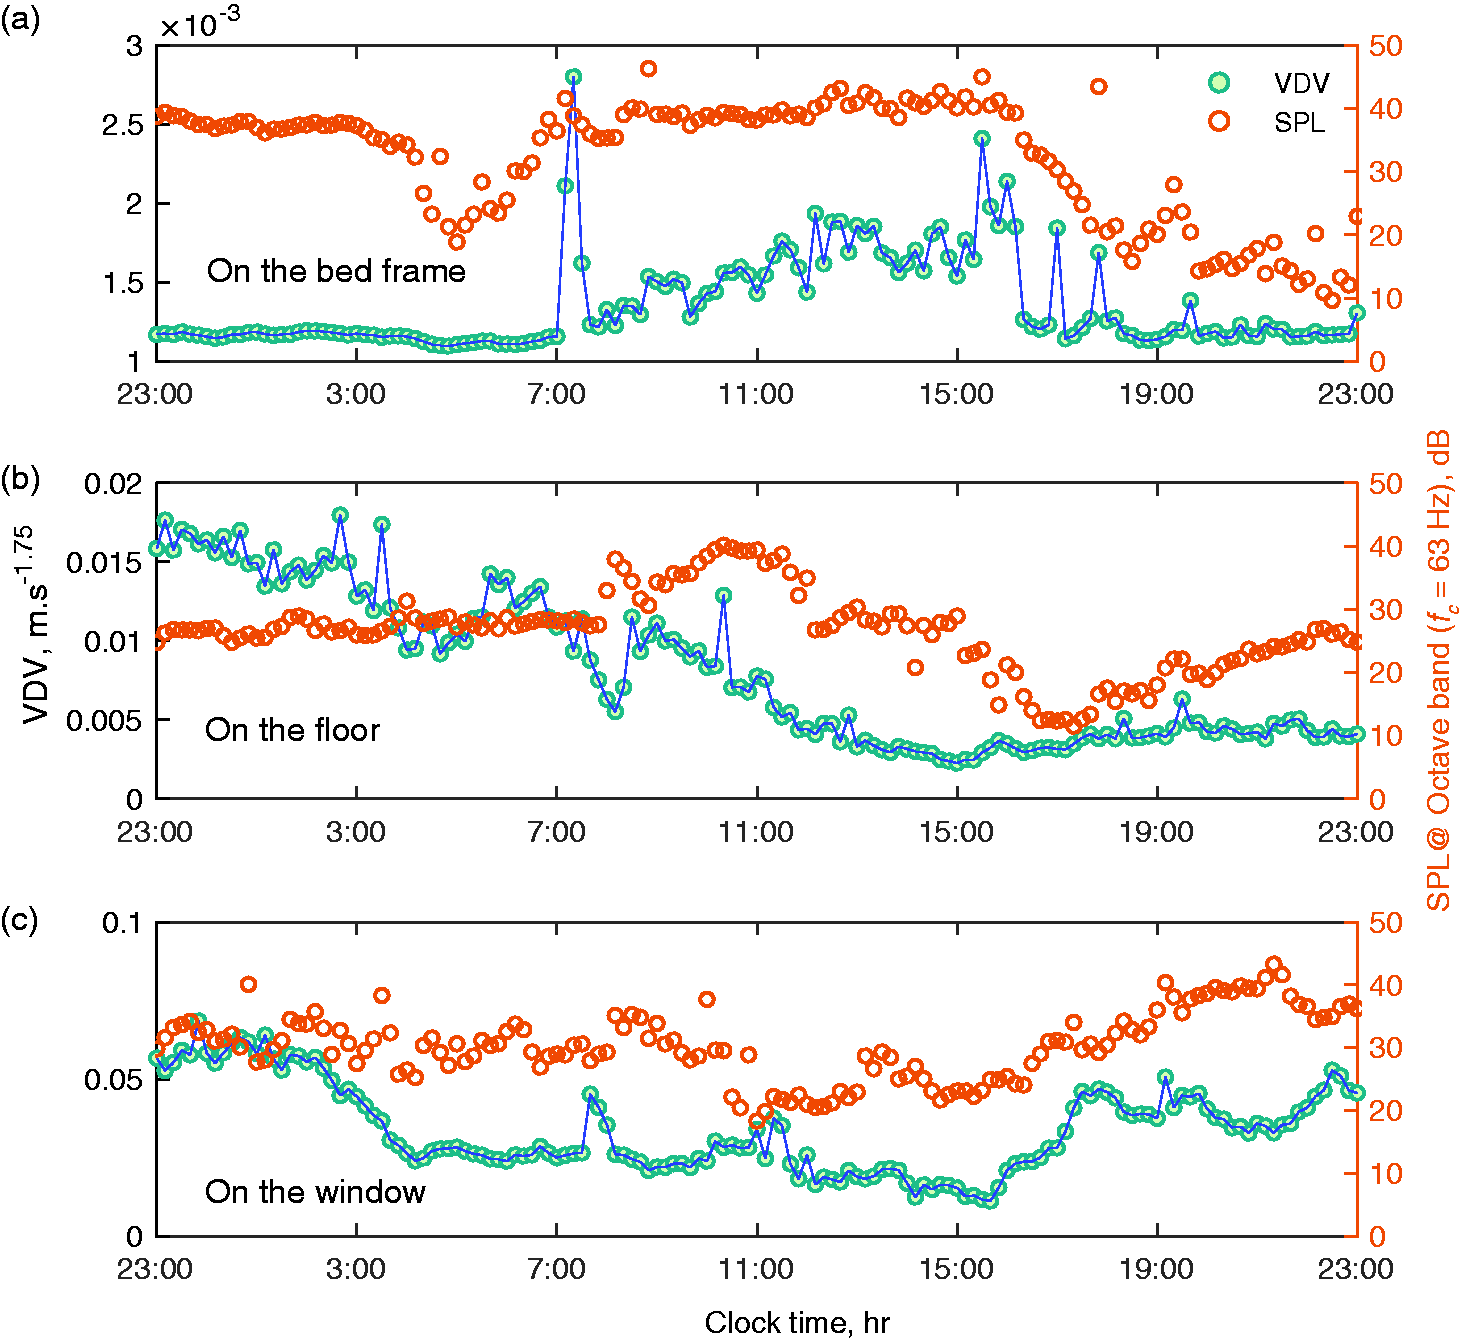
The VDV values for each 10 min vibration sample and the equivalent octave band SPL (octave band centre frequency of 63 Hz). (a) House 1 on the bed, (b) House 2 on the floor and (c) House 3 on the window. SPL: sound pressure level; VDV: vibration dose value.
The total VDV measured over the day and night-time.
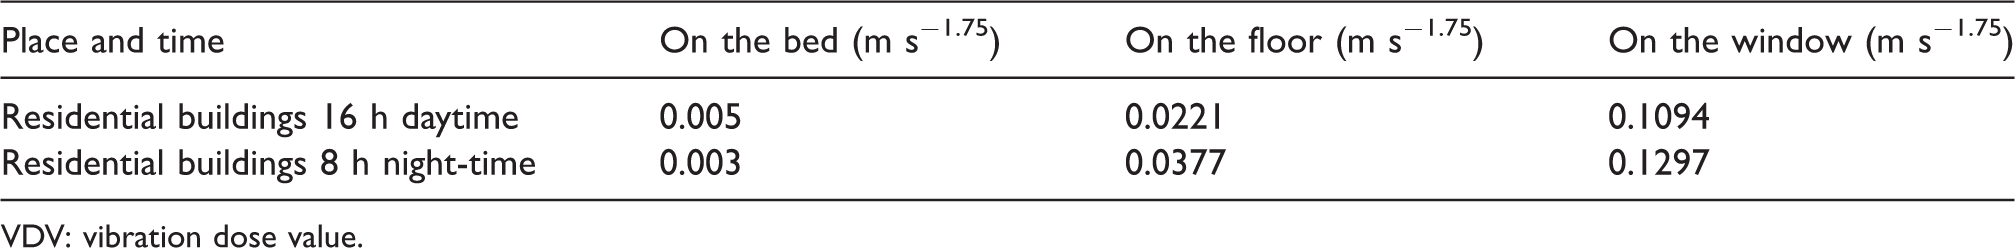
VDV: vibration dose value.
Vibration dose value ranges which might result in various probabilities of adverse comment within residential buildings. 25
Ideally, the vibration on the bed should be measured with a whole-body simulator in order to take into account the possible effects of resonance governed by body mass, mattress and bed frame which effectively form a mass–spring–damper system. However, measured vibration levels in Table 2 on a bed frame are approximately 30 times lower than VDVs in Table 3 meaning that any possible resonance at low frequencies is unlikely to exceed vibration dose levels.
To evaluate whether low-frequency noise could influence the perceived vibration levels, the SPL in the 63 Hz octave frequency band (44–88 Hz) was plotted alongside VDV values in Figure 6. This octave frequency band was chosen is because the vibration disturbance measured on the window and attributed to the wind farm was within this frequency range. Also, the SPL in this octave band often exceeds the normal hearing threshold. Inspection of the VDV and SPL in Figure 6(a) suggests a good visual correlation between 7 am and 3 pm for vibration measurements on the bed frame. It is also during that time period that the noise is at a high enough SPL to be audible. In Figure 6(b) and (c), there appears to be no visual correlation between the two for vibration measurements on the window and floor and furthermore noise is generally below the hearing threshold.
Discussion
For the first time, this exploratory study has investigated vibration measured inside homes positioned several kilometres away from a wind farm. The main aim was to explore vibration characteristics measured at three different locations inside a bedroom, in three separate dwellings located 2.4, 3.3 and 5 km away from a wind farm. Unfortunately, vibration measurements at all three measurement locations within the same dwelling are not available meaning that no direct comparison between the three measurement locations can be made. On the other hand, confounding factors such as dwelling structure, distance from the wind farm and wind farm operational conditions might cause spurious associations.
The vibration has been shown to correlate better with the local wind speed and power output than low-frequency noise as evident from Figures 2(a) and 6. Increases in the local wind speed are also presumably accompanied by an overall increase in the wind-induced structural vibration which could be falsely associated with wind farm vibration. Such a scenario is shown in Figure 2(a) between 7 am and 3 pm where an increase in the local wind speed is clearly accompanied with an increase in vibration levels.
The comparison between vibration levels measured on the bed frame with the British 25 or Australian Standard 22 must be taken with caution since a sleeper and not an awake person is exposed to that vibration. The perception of external stimuli such as noise or vibration continues during sleep and is different to that which occurs during an awake state 29 and it has been found that vibration and noise both contribute towards the likelihood of sleep disturbance. 17 Our understanding of how vibration effects sleep is still limited. While vertical vibration in the order of 0.02 (weighted according to ISO 2631-1) or 0.2 m s−2 disturbs sleep as shown by Smith et al. 17 and Arnberg et al., 30 respectively, the effect of low levels (around 0.001 m s−2 as shown in Figure 5(a) and (b)) such as measured in this study is unknown.
Some residents living nearby wind farms report the ‘feeling’ of vibration when one’s head is resting on the pillow.2,3,7,31 Since the vibration levels in such cases are low, we speculate that the ‘feeling’ of vibration could be enhanced or even misrepresented by the low-frequency noise whose perception in that case is strengthened by the pillow attenuation of higher frequency noise.
Conclusions
This study presented an exploratory analysis of the wind farm vibration measured inside dwellings located near wind farm. Measured vibration signals can correlate well with the local wind speed and wind farm power output, narrowband frequency analysis of signals measured on the bed frame and floor revealed no characteristics associated with wind farms. On the contrary, vibration signals measured on the window were amplitude modulated at the wind turbine blade pass frequency which suggests window vibration being wind farm noise induced.
Comparison of vibration signals with the acceleration base curve specified in AS 2670.2 (1990) indicates that measured vibration levels on the bed frame and floor were too low to cause discomfort. The vibration levels on the window were high in comparison to other measurement locations yet still below the residential night-time acceleration base curve as specified in AS 2670.2 (1990).
The VDV values estimated based on BS 6472.1 (2008) show that window vibration levels were in the ‘Low probability of adverse comment’ range. However, window vibration is unlikely to affect human comfort. At the other two measurement locations, the VDV values were too low to be a probable cause for adverse comment. On the other hand, vibration levels measured on the bed frame are not representable of the vibration experienced by a person lying on the bed. The vibration perception threshold might be different during sleep and hence comparison of vibration measured on the bed frame with standards22,23,25 must be taken with care.
The analysis presented here is based on data measured at three dwellings located 2.4, 3.3 and 5 km from two wind farms with total capacities of 110 and 46 MW, and hence these specific results must be interpreted with caution when applied to other wind turbine models and wind farms.
Footnotes
Acknowledgements
The authors acknowledge the contributions of the mechanical and electrical workshop staff at the University of Adelaide. We are also grateful to the rural residents in South Australia who participated in this study.
Declaration of conflicting interests
The author(s) declared no potential conflicts of interest with respect to the research, authorship, and/or publication of this article.
Funding
The author(s) disclosed receipt of the following financial support for the research, authorship, and/or publication of this article: Financial support from the Australian Research Council, Project DP120102185, is gratefully acknowledged.