
Abstract
Geothermal energy is a renewable energy that is environmentally friendly and will help reduce greenhouse emission resulting from the burning of fossil fuels. Nigeria has numerous geothermal surface manifestations like hot and warm springs in most parts of the country that has not been exploited or explored due to the initial high cost of exploration. Most research conducted on geothermal energy prospects in Nigeria considered specific geographical sections. Due to the geological features of Nigeria, the direct and indirect tectonic activities, there is the need to map the thermal anomalies over Nigeria to determine likely geothermal wells and ground heat catchment in Nigeria. Forty years remote sensing dataset (1980–2019), was obtained from the MERRA-2 for three hundred and two (302) locations across Nigeria. The acquired thermal parameters were processed using known models. The data was also analyzed statistically and spatially using the Statistical Package for Social Sciences (SPSS) and Quantum Geographic Information System (QGIS). The results of show that the Gummel-Kumaganum areas of chad basin, Owode-igbo ora areas of the Dahomey basin, Belli area of the basement complex in Taraba state, potiskum areas of the Upper benue Basin, Ekpoma-kwale, itu areas of the Niger delta basin are middle geothermal wells with the terrestial radiation of < −702 W/m2 while the terrestial radiation >200 W/m2 in the Gummi area of the sokoto basin, Hunkuyi area of the basement complex in the northeast, Gashua area of the chad basin, Ozubulu-idah area of Anambra basin, Atijere area of the Dahomey basin, Agbasa, Omoko, Akamkpa area of Niger delta basin, Shaki area of the southwest basement complex are heat catchment regions. Other heat catchment areas had been identified for standalone energy generation. Also, the thermal anomalies in those areas were significant. The validation of the result was achieved via benchmarking similar geothermal well around the globe and ground truthing at Ijebu-Ode Nigeria. Based on the thermal reversal depth (TRD) concept, Ijebu-Ode may have a deep geothermal well with temperatures pattern similar to geothermal wells in other parts of the globe. It is recommended that ground measurement should be carried out in the basement complex to cater for geothermal systems whose mechanism is based on conduction.
Introduction
Renewable energy sources have the most significant potential to offset greenhouse gas discharge into the atmosphere due to the conventional fossil fuel power generation, thereby significantly reducing climate change and its effects. Utilizing renewable energy to reduce Nigeria's reliance on fossil fuels is a notable difficulty faced by the country's energy industry because renewable energy in Nigeria is currently in its developmental stage, which is the era of revelation and deliberation on the discovery made. In Nigeria's commercial sector, residential and commercial energy users’ accounts for 80 percent of the country's GDP due to the rapid expansion in the economy (IRENA, 2019). It was forecasted that 15,730 MW would be installed in 2010, and 119,200 MW will be installed in 2030 under the reference case (annual economic growth of 7%) (ECN, 2008; IAEA, 2020). In November 2012, renewable electricity supply was aimed to rise from a sum total of 13% electricity production in 2015 to 23% in 2025 and 36% by 2030 (ECN, 2012; REMP, 2020).
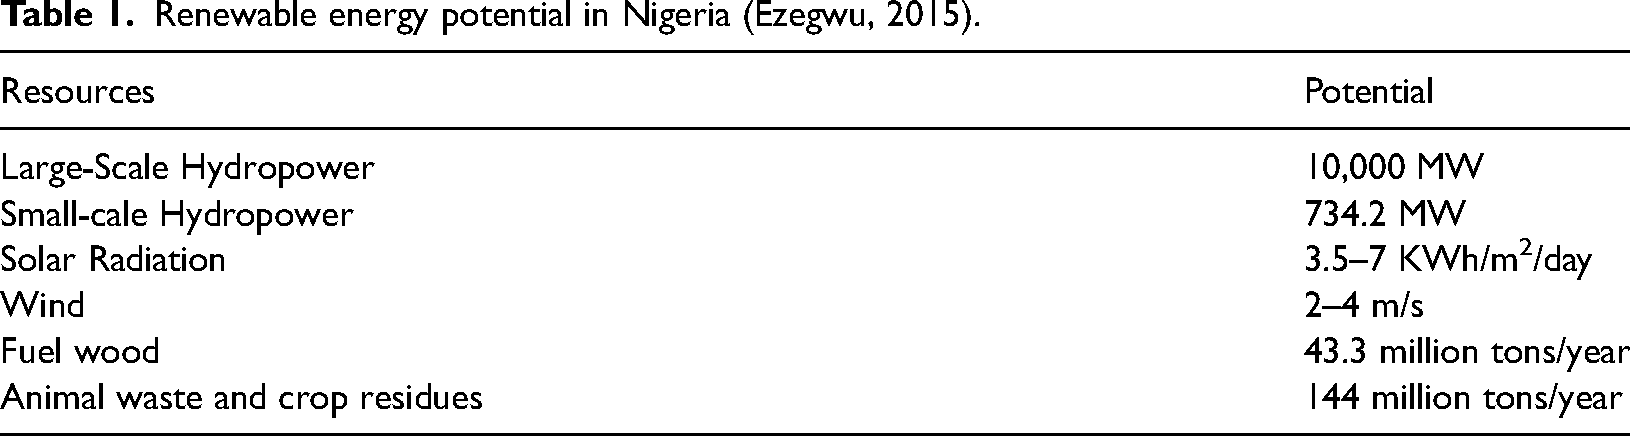
One of the renewable energy sources that has not been explored in Nigeria and most parts of the world is the geothermal energy. The advantages of geothermal energy includes continuous production throughout the year; it is a stable source of energy that cannot be affected by seasonal variations such as energies from wind or sun; its installations have a low visual impact and don't generate emissions; and has huge energy source for grid system utilization (Dong et al., 2022; Palomo-Torrejón et al., 2021). The prospect of renewable energy in Nigeria as reported by Ezegwu (2015) is presented in Table 1.
Renewable energy potential in Nigeria (Ezegwu, 2015).
Geothermal feature could be the source of steam, hot water, a mix of the two mainly found in tectonically active regions and volcanic areas. It could also be a geothermal land formation. A hydrothermal eruption crater is an example of such a mechanism. Hydrothermally changed rocks and minerals, such as clays, carbonates, silicates (Keam et al., 2005), and calcites, are sometimes more subtle representations of geothermal systems than obvious surface expression or manifestations like hot springs (Yalcin et al., 2020). These minerals are by-products of metasomatism, or the contact of high-temperature fluids with rocks, which results in eventual alteration (Van Ruitenbeek et al., 2020). These small impressions distinguish blind and petrified geothermal systems, which are difficult to detect with conventional methods.
Some geothermal features do occur individually. They could be a combination of two or more features in a geothermal area. Hot springs and fumarole were identified as prominent features surrounding the geothermal potential site Nage in Bajawa City, Ngada District, East Nusa Tenggara Province by Herzhegovina et al., (2020). Bilim et al., (2021) identified the presence of underlying volcanic rocks, which suggests a potential geothermal site located in the northwestern part of Turkey because of its placement on the accretionary region of multiple microcontinents and blocks. As a result, of the cracks or joints in western parts of the “North Anatolian Fault Zone.” Multiple basins are moving away from each other and/or depressions within the fault system in the research region due to trans-tensional forces. As a result, magmatic intrusions into fault segments are being observed. These tectonic processes and magmatic emplacements produce considerable magnetic anomalies throughout the region and also indicate the presence of a geothermal system. The presence of volcanic rocks, a noteworthy geothermal feature in the Geneva Basin (GB) and its adjacent French territory Plateau des Bornes and Bellegarde, suggests a possible geothermal resource resulting from historical volcanic activity in that region (Guglielmetti and Moscariello, 2021).
The geological structure of a region affects the overall dispersion of ground heat in the lithosphere and the extent of geothermal exploration in Nigeria (Okeifufe et al., 2020). Nigeria is situated between latitude 90N and longitude 80E. Proterozoic to Lower Palaeozoic metamorphic and igneous rocks, the tertiary to recent volcanic rocks make up the Basement Complex. In the southwestern part of the country, schist belts (metasediments and metavolcanics) dominate the basement (Ademila et al., 2018). The Benue Trough, which is part of a mega-rift system often called the West and Central Africa Rift System, is made up of 6000 meters Cretaceous sediments coupled with some volcanic activity (Edegbai et al., 2019; Obaje et al., 2009). The Santonian tectonic episode of compressional folding had an impact on the Benue Trough and was fairly severe, resulting in approximately 100 synclinal folds and anticlinal folds (Edegbai et al., 2019). The Afikpo synclinal fold and the Abakaliki anticlinal fold are two distinct deformations in the southern Benue Trough (Obaje et al., 2009). In terms of geography, the Benue Trough is split into three: lower (southern), middle (central), and upper (northern) (Figure 1). The southern Benue Trough comprises the Niger Delta-Benin Embayment, Anambra Basin, Abakaliki fold (Abakaliki Anticlinorium), Afikpo syncline, and Calabar flank, which are all part of the Sedimentary Basin in southern parts of Nigeria (Figure 1). The region has a variety of fault patterns, with the NE–SW direction being the most prominent. The southern Benue Trough and the surrounding Cameroun volcanics contain Upper Cretaceous to Tertiary volcanic (Edegbai et al., 2019). Salufu and Iyoha, (2019) proposed that late Eocene volcanic activity in the lower Benue Trough produced the region's fault trends. Troughs in Benue, folds of the Abakaliki, flanks in Calabar and Benin, and uplift along the Abakaliki axis all had a role in controlling sedimentation within this sedimentary basin. The Abakaliki–Benue episode (Aptian–Santonian) and Anambra–Benin episode (Campanian–Mid Eocene) are two tectonic episodes that have been identified (Salufu and Iyoha, 2019). These episodes occurred as a result of the Abakaliki region's uplift, folding in the santonian, depocenter derangement into the Afikpo region, and the Anambra fault (Salufu and Iyoha, 2019). The Nkporo Shale, Mamu Formation, Imo Formation, and Ameki sandstone were then deposited after the tectonic event.
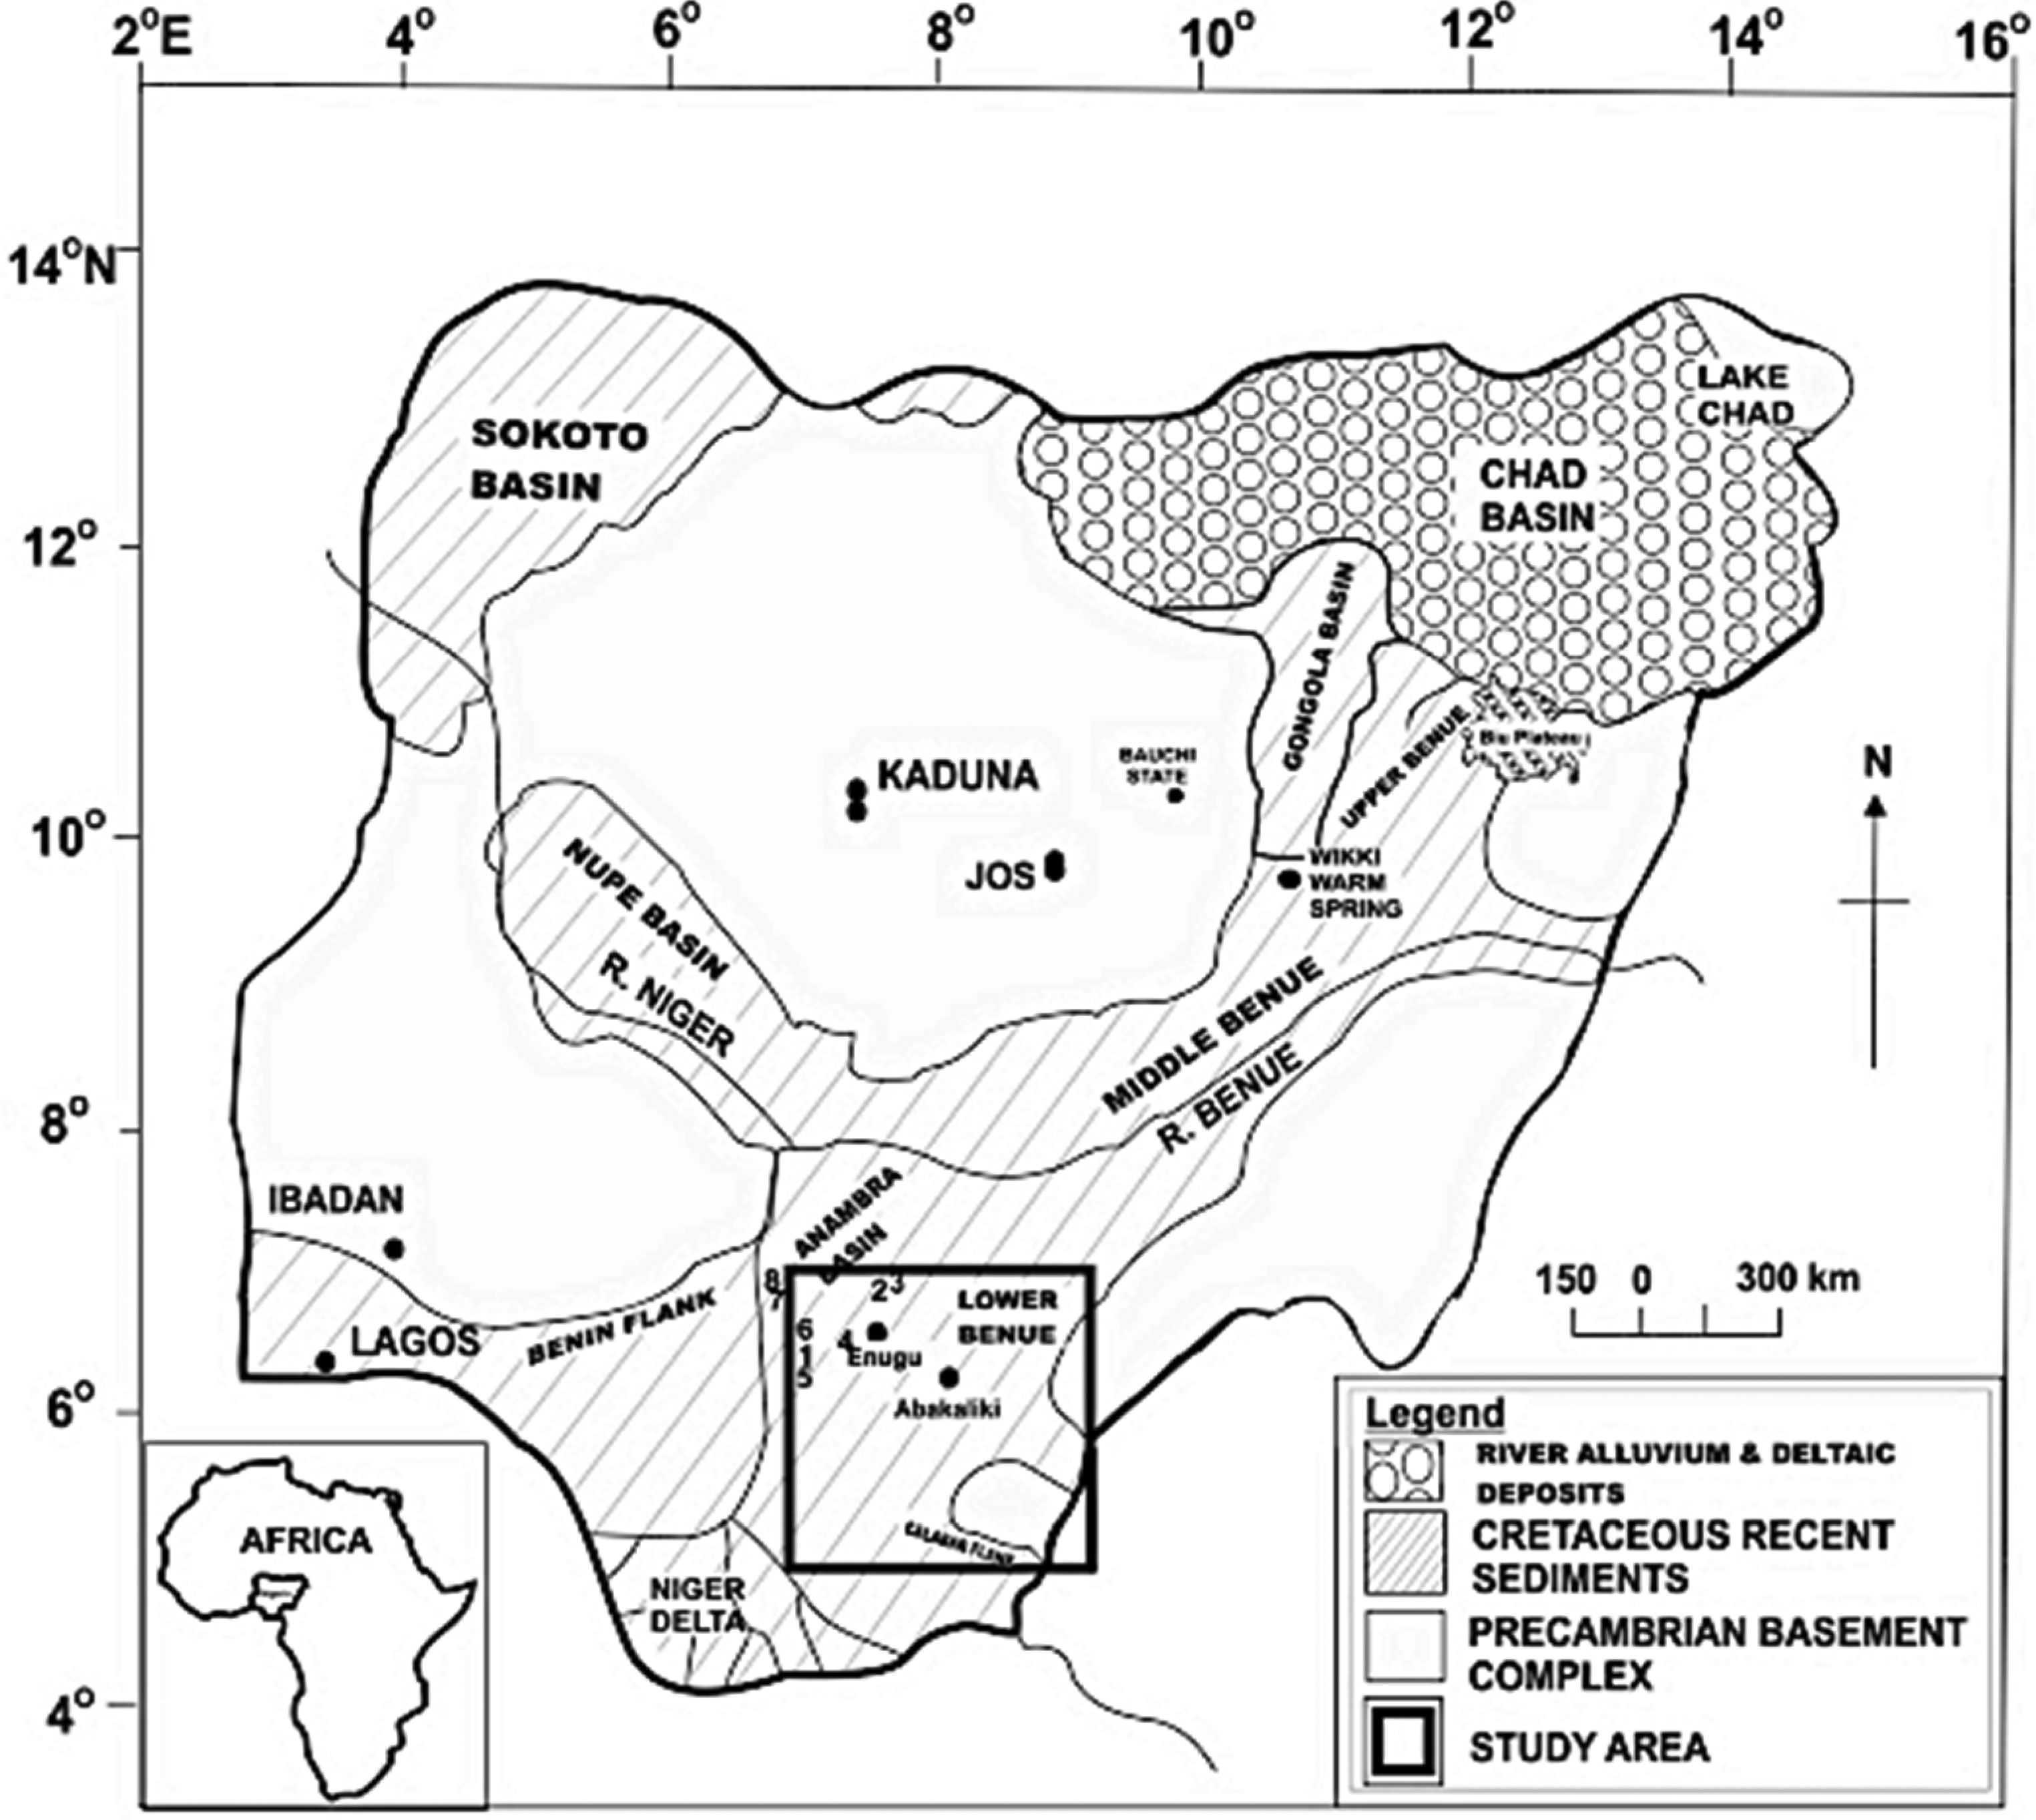
Geological Map of Nigeria.
Rock characteristics that links to the transfer and storage of thermal energy and liquids within the subterranean are especially important when using remote sensing as the exploration technique. These thermal characteristics include thermal conductivity, heat capacity, and heat production, while petrophysical properties, density and compressibility are important features of subsurface fluids (Mielke et al., 2015).
Geothermal energy operates on the principle of heat transfer. Geothermal heat can be transmitted via three different mechanisms: counter flow, heat conductivity through the rocks; and convection through a moving fluid (groundwater, gasses). The first and third mechanism can be detected using remote sensing techniques over any geographical region. The second mechanism can be detected using remote sensing through an improved aided technique or model. Remote sensing gathers information about a specific area using satellites and/or airborne sensors that are not in direct contact with any item. Both passive and active methods are possible. Various sensors are employed in passive approaches to detect natural radiation emitted or reflected by the object or area being examined. Energy is emitted in active remote sensing, and the signal that is reflected back by the object is measured (Vaughan et al., 2010). Remote sensing is utilized in oil and gas exploration as well as the discovery of geothermal resources. Remote sensing is used to conduct a preliminary investigation of geothermal potential. This will pave the way for extensive geochemical and geophysical surveys to determine the extent of geothermal resource exploitation. Remote sensing techniques may be effective preliminary surveying tools for mapping geology, detecting surface temperature anomalies, and finding geothermal potentials, such as hydrothermally changed minerals like sinter and tuff, in potentially geothermal locations (Calvin et al., 2015). Photographic and thermal infrared sensors can only measure depths of a few microns to millimeters below the surface (Manan et al., 2015). Thermal infrared remote sensing (RS) and the resultant land surface temperature (LST) can be used to map thermal anomalies and calculate geothermal heat flux in geothermal potential areas (Haselwimmer et al., 2013). Over the last two decades, significant improvements in wavelength coverage, spectral resolution, and image quality have led to the development of near-infrared and thermal-infrared imagery tools such as the Advanced Spaceborne Thermal Emission and Reflection Radiometer (ASTER), and the Moderate-resolution Imaging Spectroradiometer (MODIS) (Manan et al. 2015; Srivastava and Gupta, 2013).
Due to the geology of Nigeria and its reduced environmental disasters such as earthquake, tremor etc., there is the call for the adaption of geothermal energy as the current realities of climate change is affecting its main source of energy generation (hydrothermal energy). These issues underline the need to examine all conceivable energy resources to create a new energy future for Nigeria. Most research conducted on geothermal energy prospects in Nigeria considered specific geographical sections which may be already known by common geological features such as warm spring. Due to the geological features of Nigeria and the direct and indirect tectonic activities, there is the need to map the thermal parameters over Nigeria to determine likely geothermal wells and ground heat catchment locations in Nigeria. This research aims to investigate potential locations of geothermal wells and ground heat catchment over Nigeria with the specific objectives which are to: evaluate the thermal parameters of the study location using remote sensing; estimate the terrestrial radiation over the study area using spatial maps; evaluate the statistically significance of the thermal parameters; and validate the emerging theories obtained via remote sensing measurements to ground measurement of selected locations.
Theory of study
One of the aided models used for remote sensing investigation is the surface energy balance (SEB) model which is employed to introduce an ideal assimilating atmosphere because the Earth's atmosphere assimilates the majority of terrestrial radiation released from the earth's surface (Pierrehumbert, 2011; Trenberth et al. 2009). The energy equilibrium of a surface layer with a unit horizontal area and a finite depth can be expressed as, The Surface Energy Balance;
The net radiation for land 
The phenomena of terrestrial radiation validate the Stefan-Boltzmann equation, which asserts that the total energy flow F in units of watts per square meter (Wm2) emitted from an item/object is directly proportional to the absolute temperature T in units of Kelvin (K) to the power four of the object
The Earth's internal heat sources constantly transfer heat to the surface. Its magnitude is estimated and the total heat loss from Earth at 44.2 TW (4.42 × 10¹³ Watts) (Pollack et al., 1993). In the continental crust, the average heat flow is 65 W/m2, whereas over marine crust, it is 101 W/m2 (Pollack et al., 1993). This is 0.087 W/m2 on the average, 0.03% of solar radiation absorbed by Earth (Lindsey, 2009) but is intense in regions with thin lithospheres, such as near mantle plumes and mid-ocean ridges where new oceanic crust is formed (Richards et al., 1989).
Methodology
This study used four main methods as presented in the flowchart (Figure 2). The methods include data acquisition (via remote sensing and ground measurement), spatial analysis, statistical investigation, and the estimation of thermal terrestrial radiation using SEB model. The study area is Nigeria (Figure 3) located in West Africa and lies between latitude 40 and 140 and longitudes 30 and140 with a population of over 200 million and a square mass of 923,768km2. Nigeria is geographically located in the Atlantic Ocean between the Sahel to the north and the Gulf of Guinea to the south. Niger, Chad, Cameroon, and Benin are Nigeria's northern, eastern, and western neighbors, respectively. The thermal parameters of 40 years between 1980 and 2019 for three hundred and two locations across Nigeria (Figure 3) was used for this research was obtained MERRA-2.
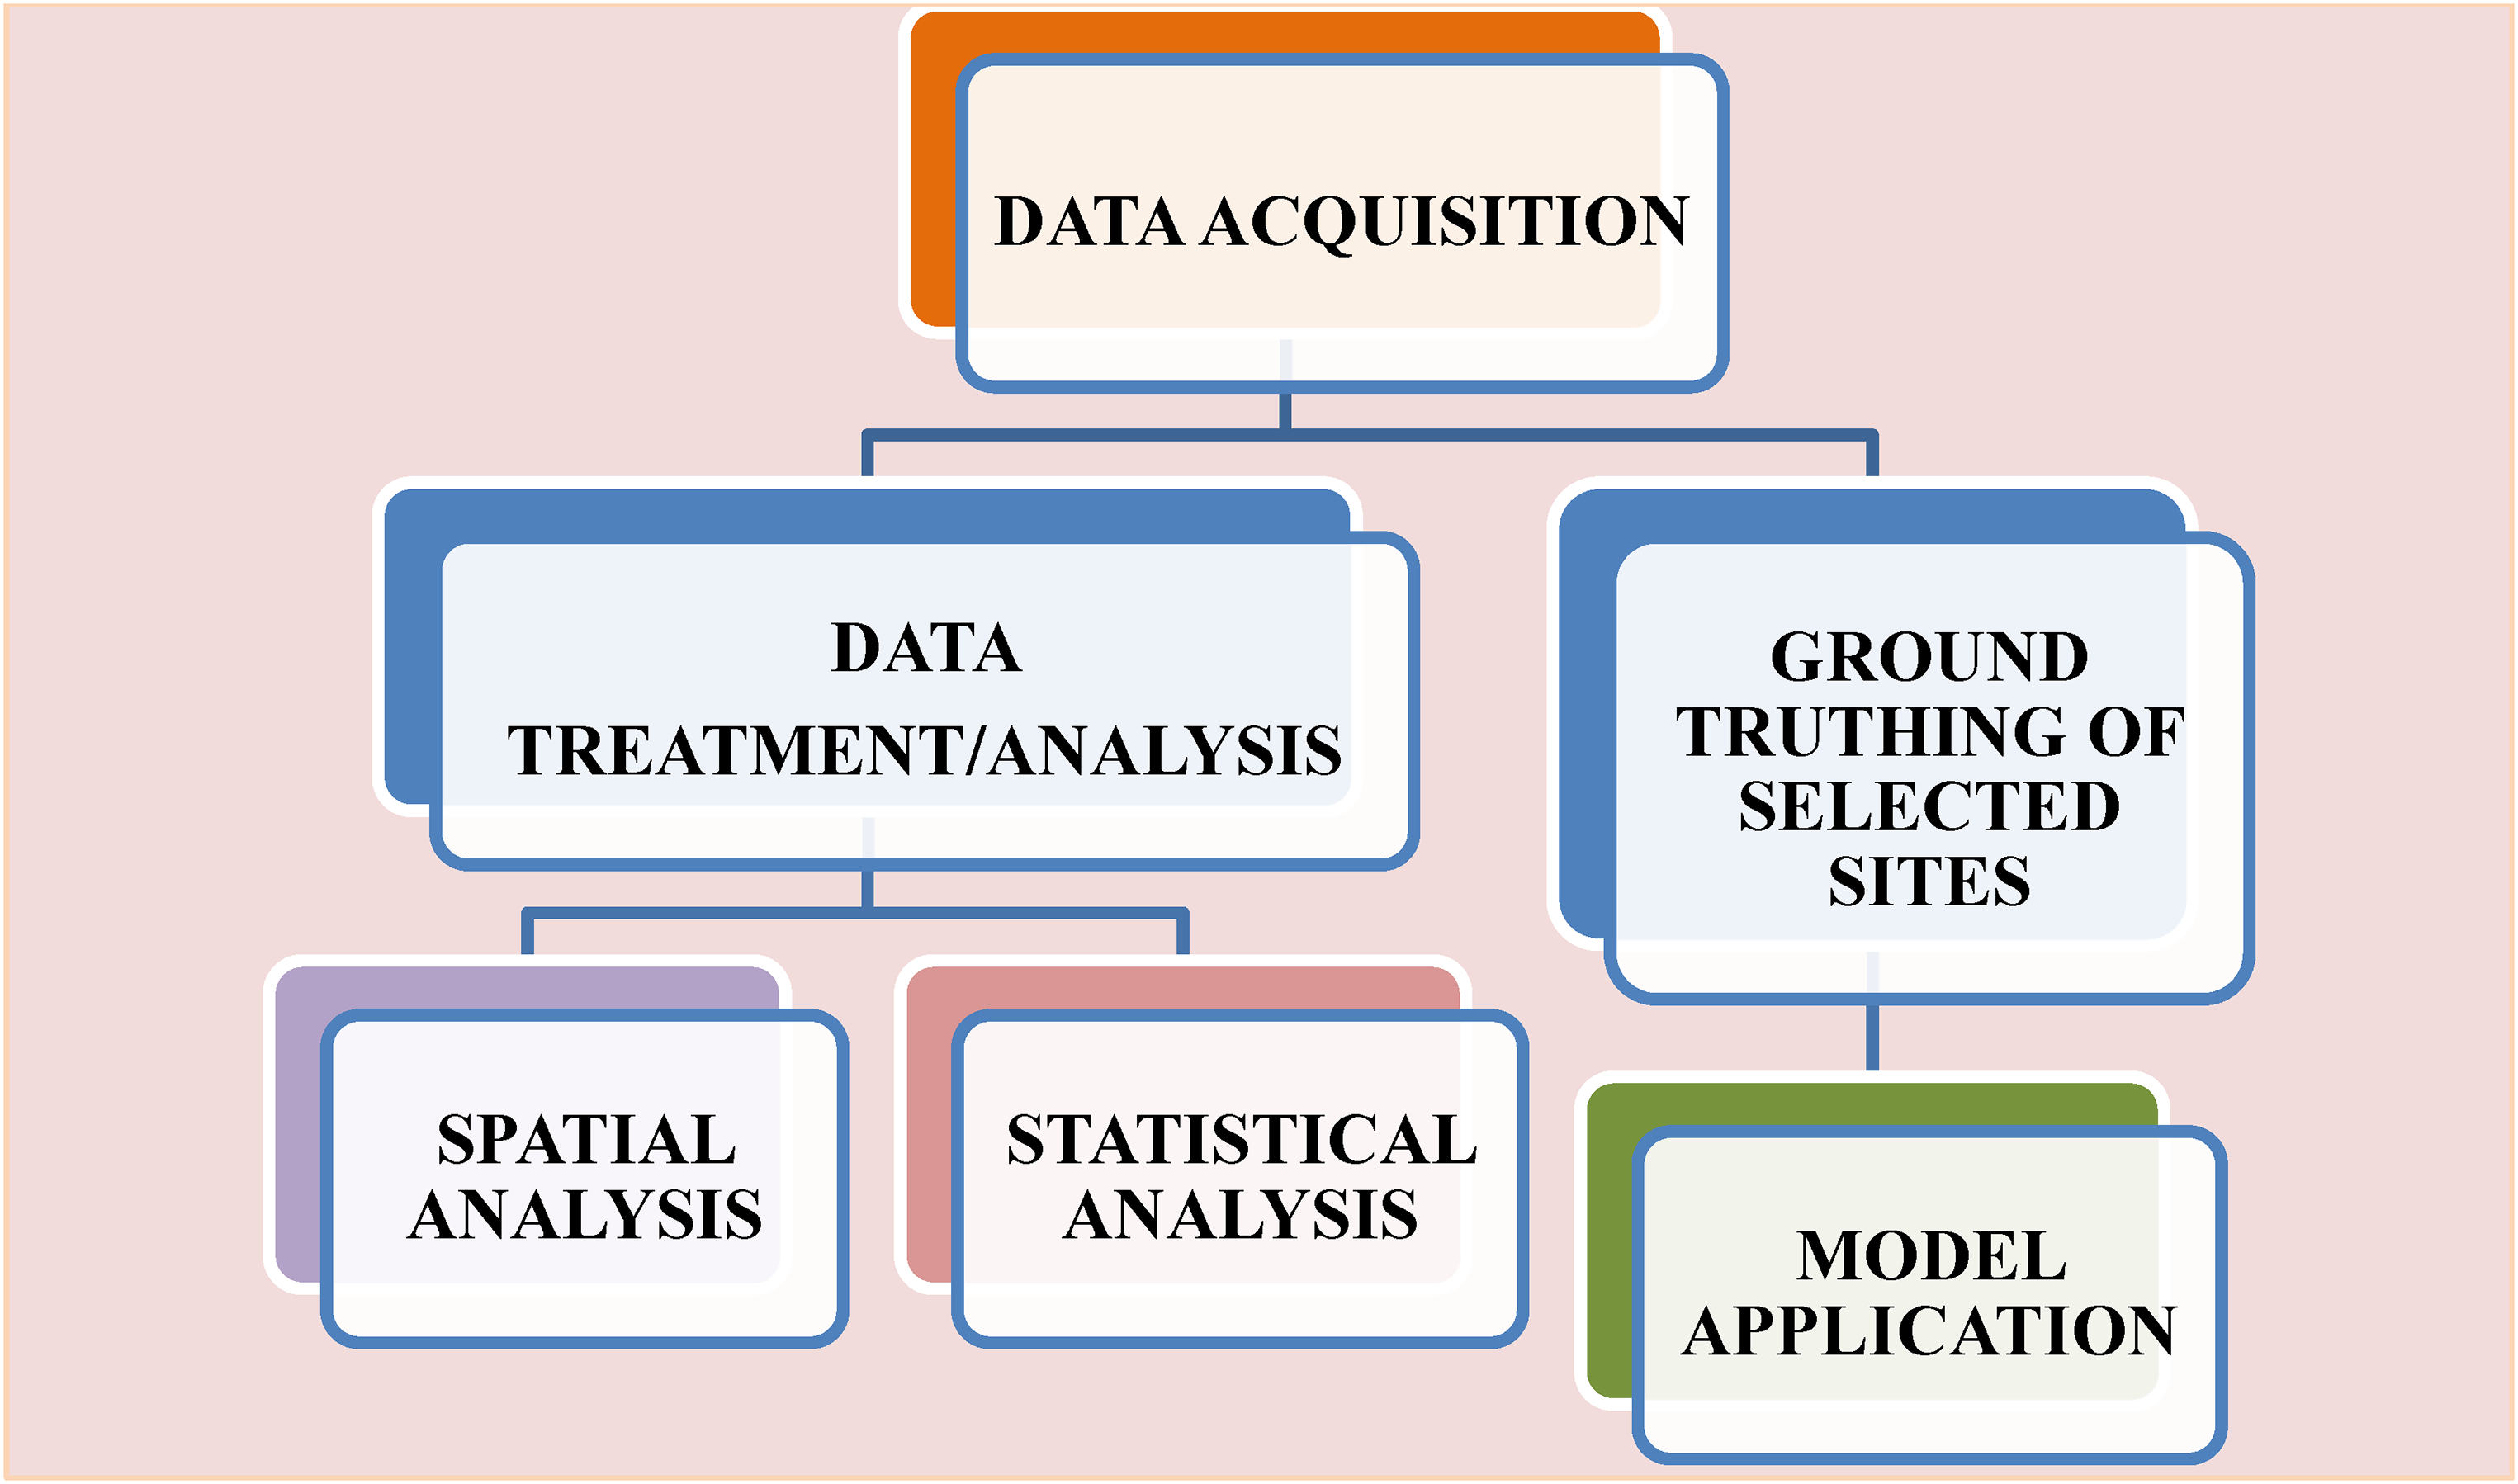
Methodology flowchart.
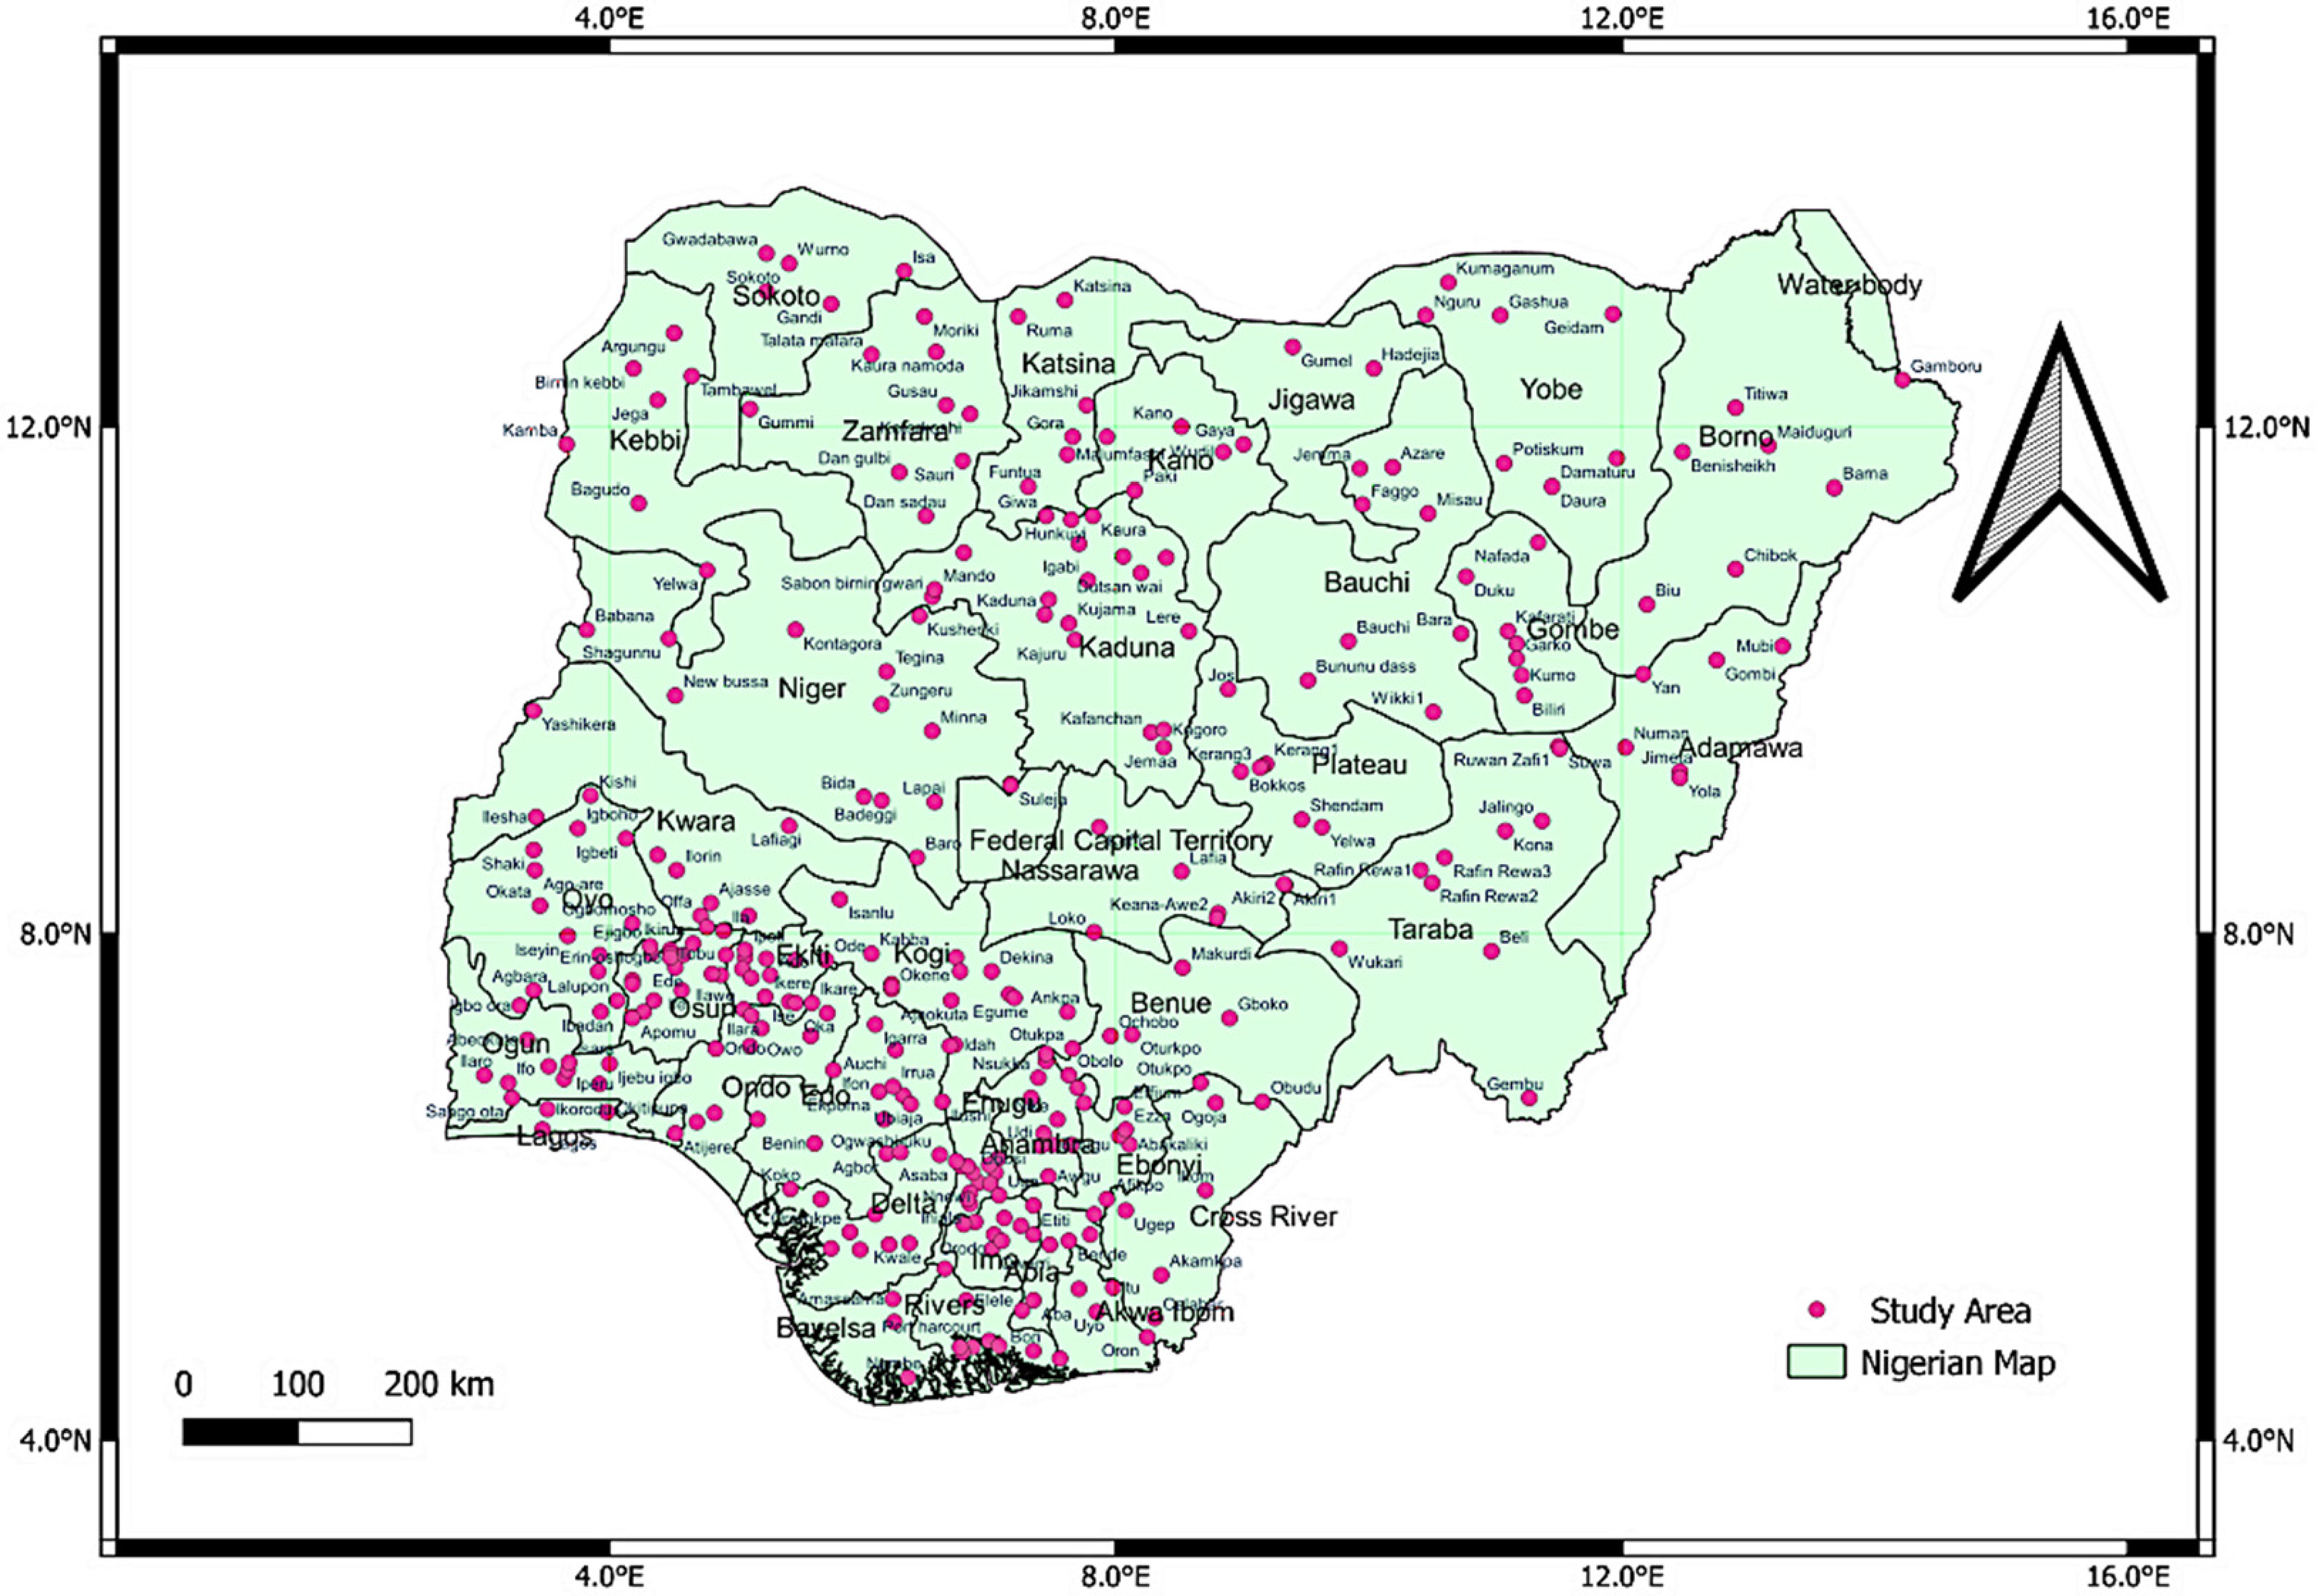
Map showing the study area.
The thermal parameters from the satellite measurement includes:
Ground heat land (GHLAND), Latent Heat Flux Land (LHLAND), Sensible Heat Flux Land (SHLAND), Net Long Wave Land (LWLAND), Net Shortwave Land (SWLAND), Rate Of Change Of Total Land Energy (ECHANGE), Soil Temperature Layer 1 (TSOIL1), Soil Temperature Layer 2 (TSOIL2), Soil Temperature Layer 3 (TSOIL3), Soil Temperature Layer 4 (TSOIL4), Soil Temperature Layer 5 (TSOIL5), Soil Temperature Layer 6 (TSOIL6), Surface Temperature Of Saturated Zone (TSAT), Surface Temperature Of Unsaturated Zone (TUNST), and Total Energy Storage Land (TELAND).
Second Modern-Era Retrospective analysis for Research and Applications is known as MERRA-2. It is an atmospheric reanalysis that comes from NASA's 1980-founded Global Modeling and Assimilation division. It uses the Global Statistical Interpolation (GSI) analysis method and an improved version of the Goddard Earth Observing System Model, Version 5 (GEOS-5) data assimilation system. It uses GEOS-5, Version 5.12.4, which compatible with the newer microwave sounders and hyperspectral infrared radiance instruments, among other instruments. It has a high spatial resolution of about 1⁄2° latitude by 5⁄8° longitude by 72 model levels and temporal (hourly) resolution from 00:30 UTC (time-averaged). It has a 2D spatial grid with a single-level, full horizontal resolution, longitude 576, latitude 361, time 24, and a granule size of around 200 MB. It also features of a more accurate surface mass balance and surface temperature estimation across ice sheets. MERRA-2's objectives are to create a consistently gridded, homogenous database of the global atmosphere and encompass other features of the climate system, such as climatological processes, improved land surface representation, and trace gas constituents.
The field validation was done using Global Positioning systems (GPS) device, thermal logger and image logger. The GPS device used was android enabled on a mobile phone. This device was used to ascertain the geographical coordinates and elevation of the data point during the ground measurement. The thermal logger collects information about the temperature, humidity, pressure, gas concentration, and depth of selected boreholes. This device was used in the study area to take the ground measurement of fifteen wells.
Based on the varying geology of the study area, a geostatistical analysis was carried-out for nine regions of the study location. The various tests carried out for the statistical analysis are normality test, univariate outliner test and correlation test. The resultant average does not a represent the data if the data is not normally distributed. Incorrect interpretation may come from improper choice of the representative value for a data set and calculating of the level of significance using the representative value. Therefore, the normality test is performed to ascertain if the data is a norm and subsequently to ascertain whether the average is a representational number of the data. This is the precondition for statistical tests because normalized data is an integrative theory in parametric testing. Some of the most popular techniques for examining the norm of continual data include the Shapiro–Wilk test, Kolmogorov–Smirnov test, skewness, kurtosis, histogram, box plot, P–P plot, Q–Q plot, and mean with standard deviation. The two procedures that are most frequently used to check the normality of the data are the Kolmogorov–Smirnov test and the Shapiro–Wilk test. Kolmogorov–Smirnov test is used for n ≥ 50 sample sizes, whereas Shapiro–Wilk test is used for small sample sizes <50. However, it can be used to handle bigger sample sizes. When P > 0.05 null speculation regularly occurring and facts are referred to as normally distributed. The data is deemed to considerably deviate from the norm if both tests have significant (Sig.) values higher than 0.05, but lower than 0.05.
The spatial analysis was carried-out to observe the seasonal distribution of the thermal parameters. This method is created for GIS applications to provide interpolation, a change among discretized and continuous forms of spatial fields, mostly used to convert irregular point or lines to raster forms or to repeat sampling among various raster resolutions.
Results and discussion
The spatial map in Figure 4 shows the Terrestrial radiation for December, January, and February (Terr_DJF) which is classified as the late dry season a period the country experiences a more sun shine and little or no rain as a result of warm wind known as harmattan. This season lasts a bit longer in the northern part of the country than the south because it is closer to the desert (WBG Climate Change Knowledge Portal, 2021). Temperature increases are expected to be lower in the southern areas of the country, but increases much more rapidly in the interior and northern areas in comparison. During this period the sun emits more radiation, the radiation is being absorbed into the earth (terrestrial radiation) while some are emitted into the atmosphere (shortwave radiation).
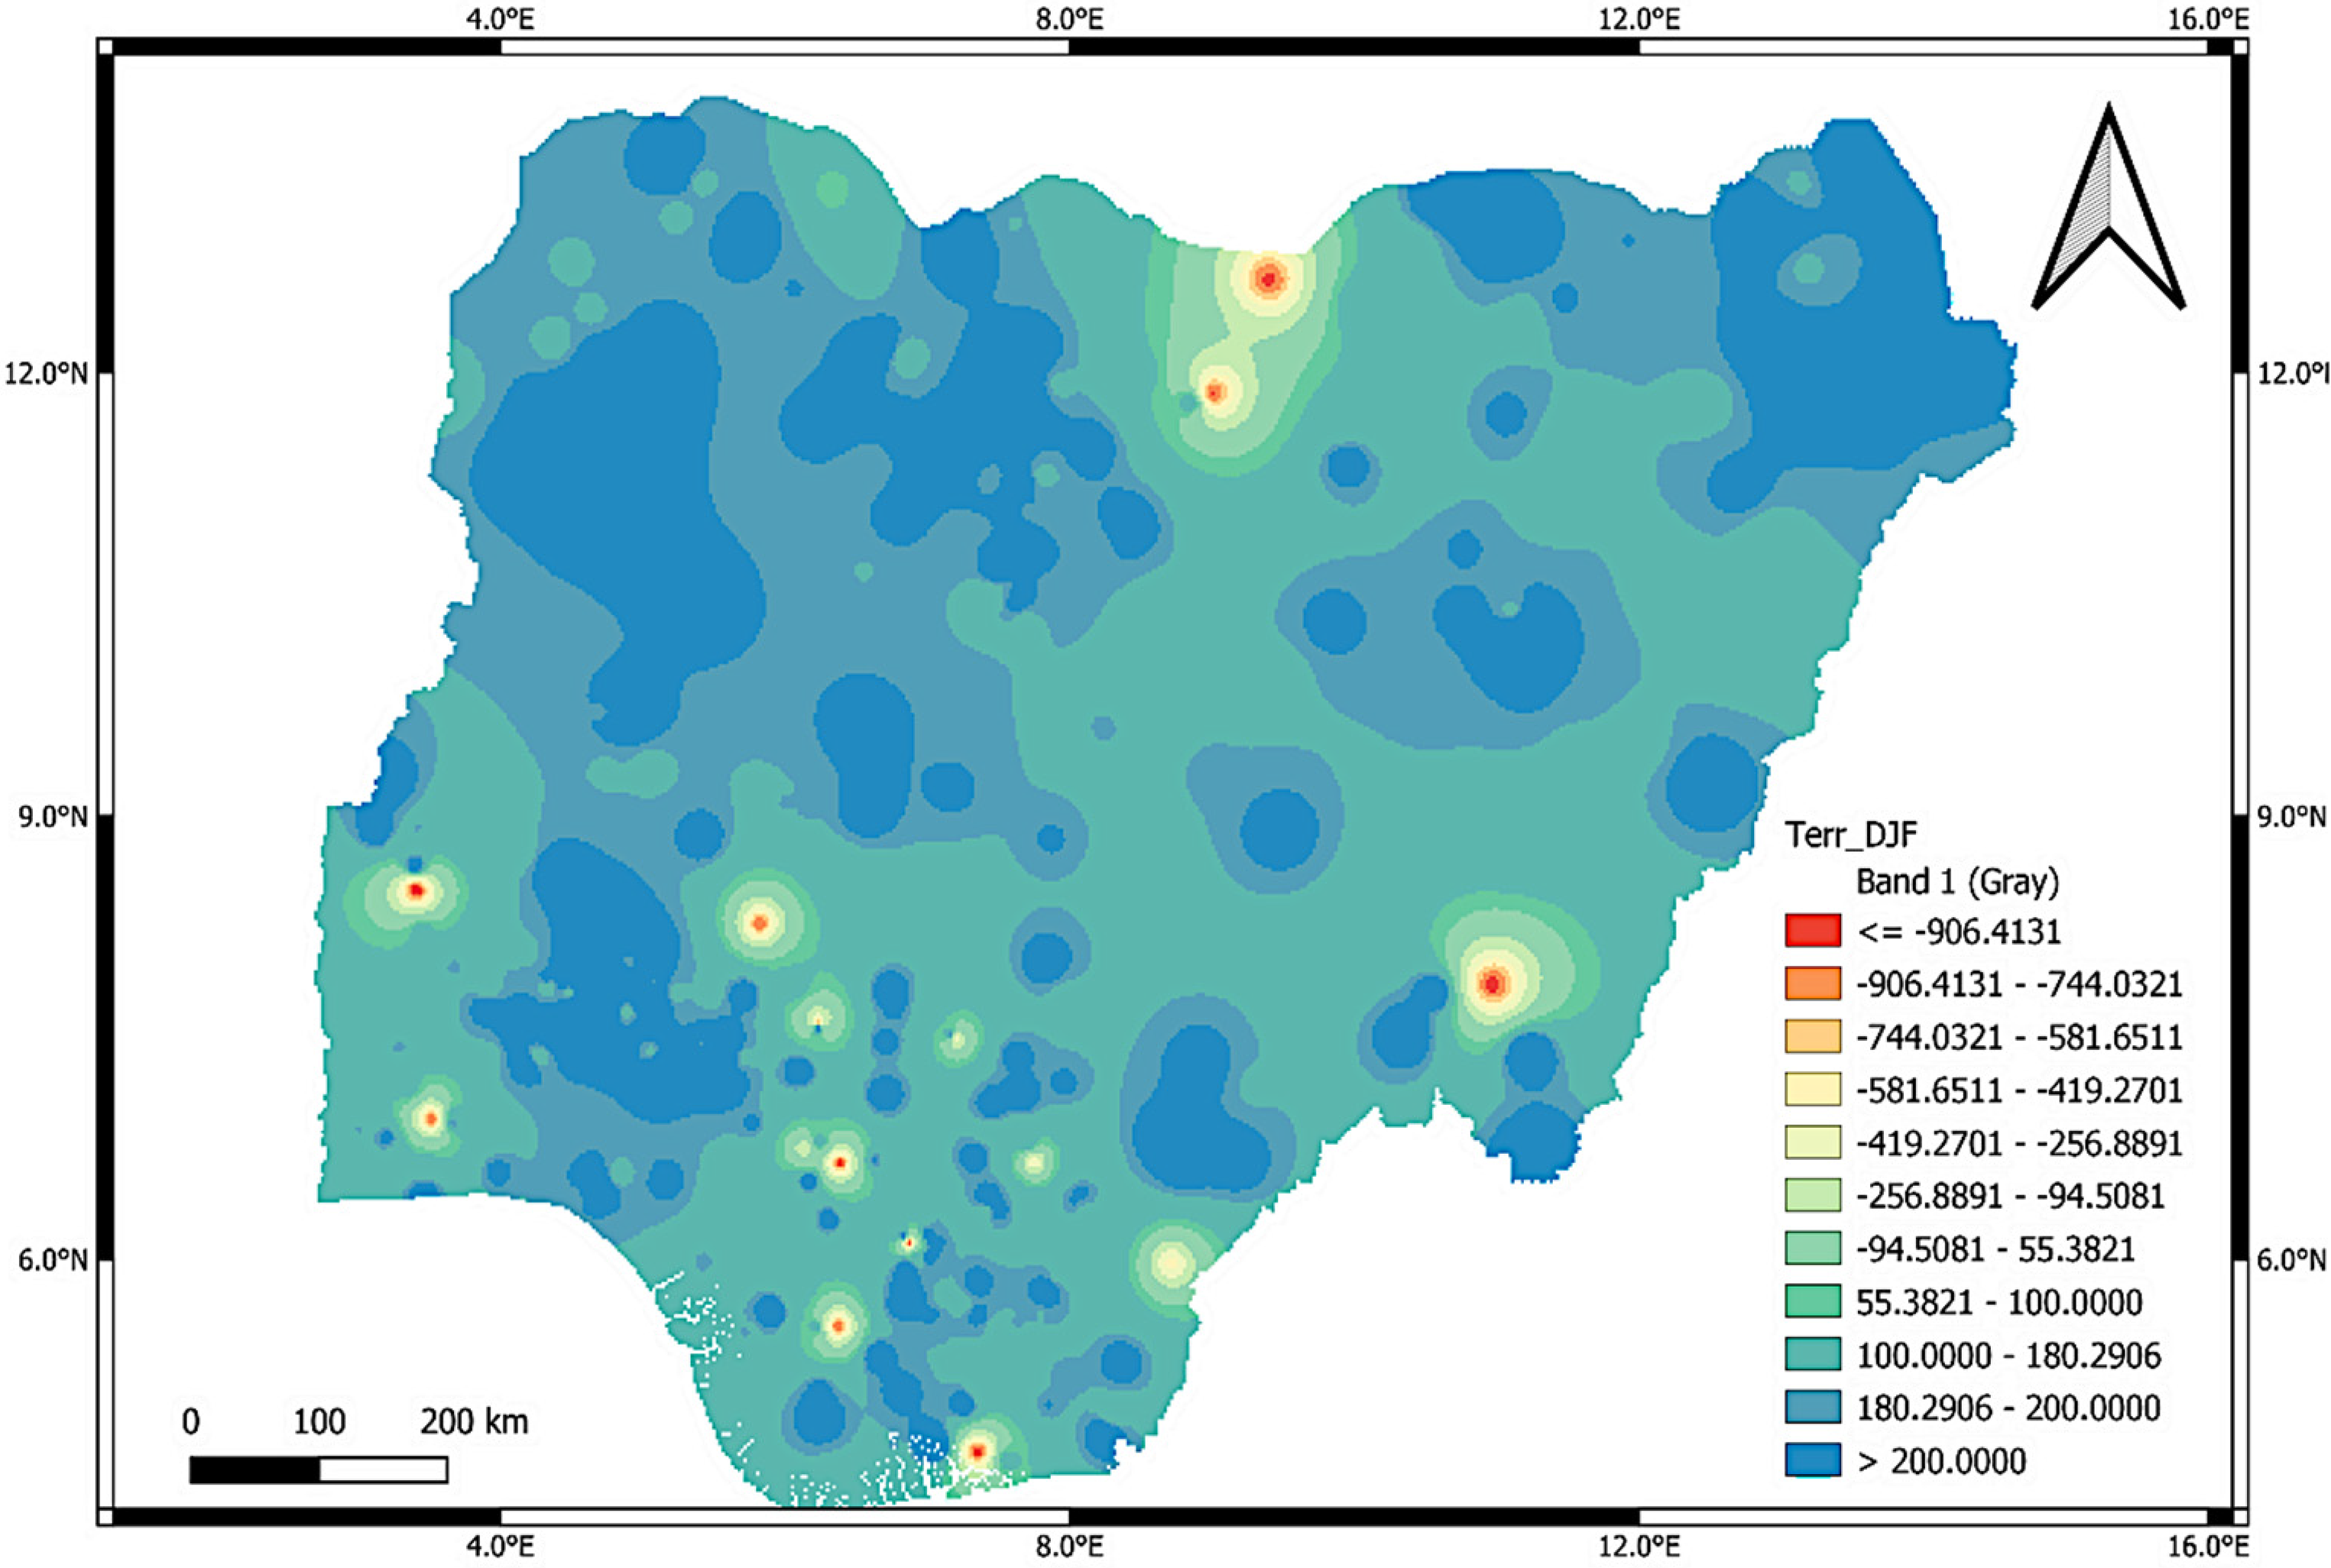
Spatial map of terrestrial radiation for December, January and February.
The map shows areas with a terrestrial radiation that is less than −906.4131Wm−2 in the southwest around Gummel and Gaya areas of the Chad basin. However, this area a sedimentary basin underlain by Proterozoic migmatites and granite, linked to the opening of the South Atlantic which created a rift-rift-rift (RRR) triple junction (Obaje et al., 2009) which created significant basement lineaments and faults following the same trends as other cretaceous to tertiary rifts. The stratigraphy of the basin includes the Bima sandstone which is upper albian to turonian in age also occurs in the Benue trough and it is the oldest (Obaje et al., 2009). It is composed of poorly sorted sand to thick bedded feldspathic sandstone and conglomerate resulting from the weather of the Jos Pleateu. The Gongila formation overlies the Bima sandstone and it is made up of limestone. The Fika shale upper turonian to santonaian in age overlies the Gongila formation made up of blue-black shales, gypsiferous with thin layer of limestone. This formation varies in thickness toward the center (500 m) of the basin and the southwestern area (100 m) of the basin which also indicates the dipping of the basin towards the center (Kogbe, 1989). The Gombe sandstone, upper Mastrichtian to Paleocene in age overlies the Fika shale. Evidence from drill core showed that its extent is about of 350 m in the southwestern area of the basin and thins out towards Lake Chad (Kogbe, 1989). The formation is not strongly folded as the earlier formation. It is made up of mudstones, ironstones in the lower bed and well bedded sandstone, siltstone and cross beds of sandstones. The kerri-Kerri formation, Paleocene in age lie uncomformably on the cretacoues sediment. It is made up of alternating layers of grit and iron rich sandstone dipping towards the northeast but is not present in Maduguri. The Quaternary Chad formation is the youngest strata in the basin, composed of fine- to coarsely-grained sand, siltstones, interbeds of diatomites, clays and blue-gray shales with an average thickness of 400 m (Adekoya et al., 2014).
These areas (Gummel and Gaya) are predominantly composed of clastics materisls such as sandstone than the rest of the basin because evidence from drill cores it seen that they wedge out with low thickness towards Maiduguri (Kogbe 1989) which has a high terrestrial radiation because of its minerals constituent (majorly quartz) possesses high thermal conductivity but this terrestrial radiation decreases slightly from these areas. The distribution of terrestrial radiation in this region shows the extent of the RRR triple junction with values >200 W/m2 close to the border of Nigeria. The southern parts of Chad have an average terrestrial radiation of 180 W/m2. However, there are locations in the northern Chad that had clear spots of 100 W/m2. This thermal variation is evidences of middle geothermal wells. The slight decrease in terrestrial radiation >55.381 W/m2 extends towards the Jos- plateau area in the North central and the upper Benue trough areas, around Belli area of Taraba state in the northeast, the lower benue trough (Anambra basin, Niger delta basin and the Dahomey basin) and the Ago-ore- igbo-ora areas of the southwest complex. The Yelwa, Malumfash areas of the basement complex in the Northwest; Yola, Gembu areas of the basement complex in the Northeast; Ilorin, Ilobu, Offa areas of the basement complex in the Southwest; Ete, Idah areas of the Anambra basin; and in the Elele, Amasssama and Oron areas of the Niger delta basin have lowest absorption of terrestrial radiation >200Wm−2.
The spatial map in Figure 5 shows the terrestial radiation for early wet or rainy season. The amount of rain that falls during this period varies across the country. It rains more in the southern (tropical rainforest) part of Nigeria than the north (tropical Savanna) and other parts because it is usually influenced by wind from the South Atlantic Ocean known as the tropical Maritime airmass (WBG Climate Change Knowledge Portal, 2021). The southern part receives an average rainfall of about 150 mm while the north and other parts of the country receives an average rainfall of about 59 mm during this season. During this period, it is expected that the wet subsurface would lead to lower magnitudes of thermal radiation as the heat from the inner earth crust transferred via conduction and convection.
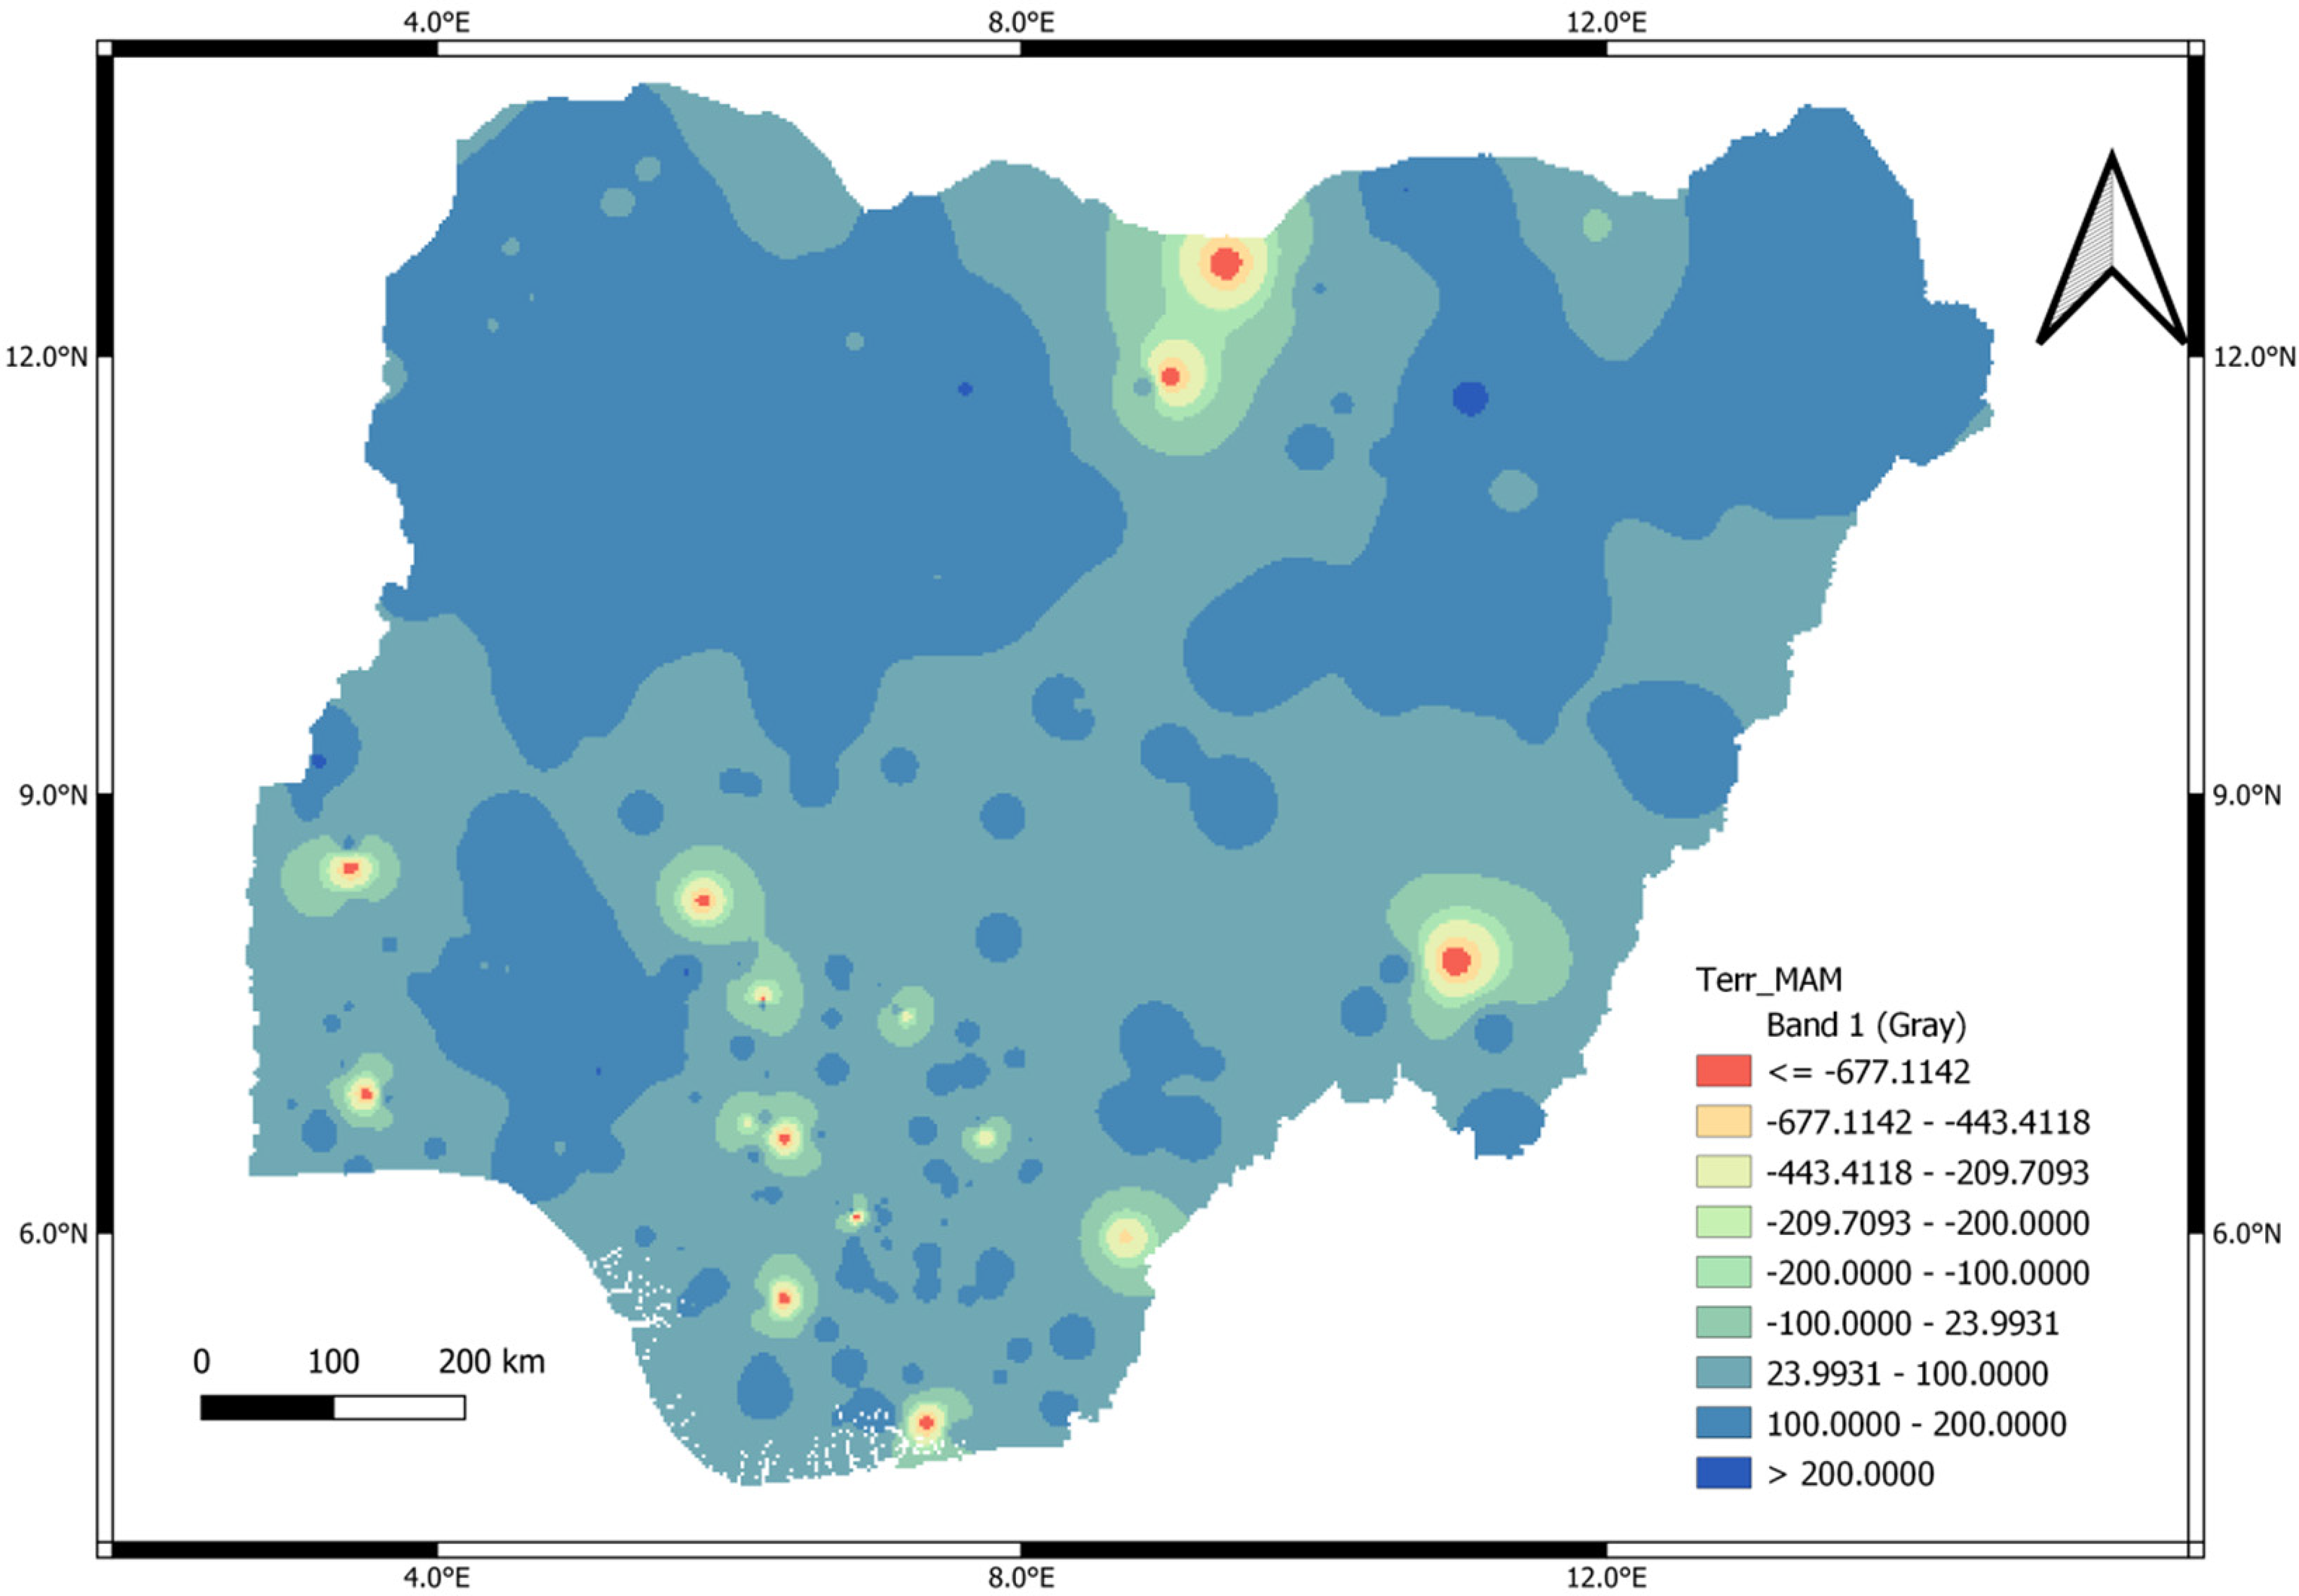
Spatial map of terrestrial radiation for March, April and March.
The map shows areas with the highest terresterrial radiation of >200 Wm−2 in the chad basin, the basement complex in the Belli area of taraba State, the basement complexes of the southwest around the isanlu-kabba area and ago-are-igebti. The Ekpoma, Kwale, and Ubiaja areas, Egume, Isa area in the mid-Benue basin, Bori and Abonemma areas of the Niger delta basin, Obosi- Eha-amufu areas of the Anambra basin, the Owode- Okitipupa areas of the Dahomey basin and the Obudu areas of Calabar had a terrestial radiation less than −677.1142 Wm−2. A slight reduction in terrestial radiation occur around the Jos-Plateau areas, around the kogi –Adamawa areas, a large part of the Anambra basin, Niger delta basin and part of the dahomey basin around Abeokuta– owode areas, and the Igbo-Ora-Igboho areas of the southwest basement complex with a terrestial radiation less than and equal to −100.000 Wm−2. Also, a very low terrestial radiation majorly in the Northwest, Northeast and part if the southwest which are all basement complexes and parts of the east and southern Nigeria with a terrestial radiation greater than 100.000Wm−2.
In this season, the terrestial radiation in the Niger delta basin and part of the southwest basement complex, did not experience any significant change despite the season variation but a noteable change was observed in the basement complex of the Northweast and part of the basement complex of the Northeast. Hence, the terrestrial radiation is not seasoned and can be relied upon to determine potential geothermal wells.
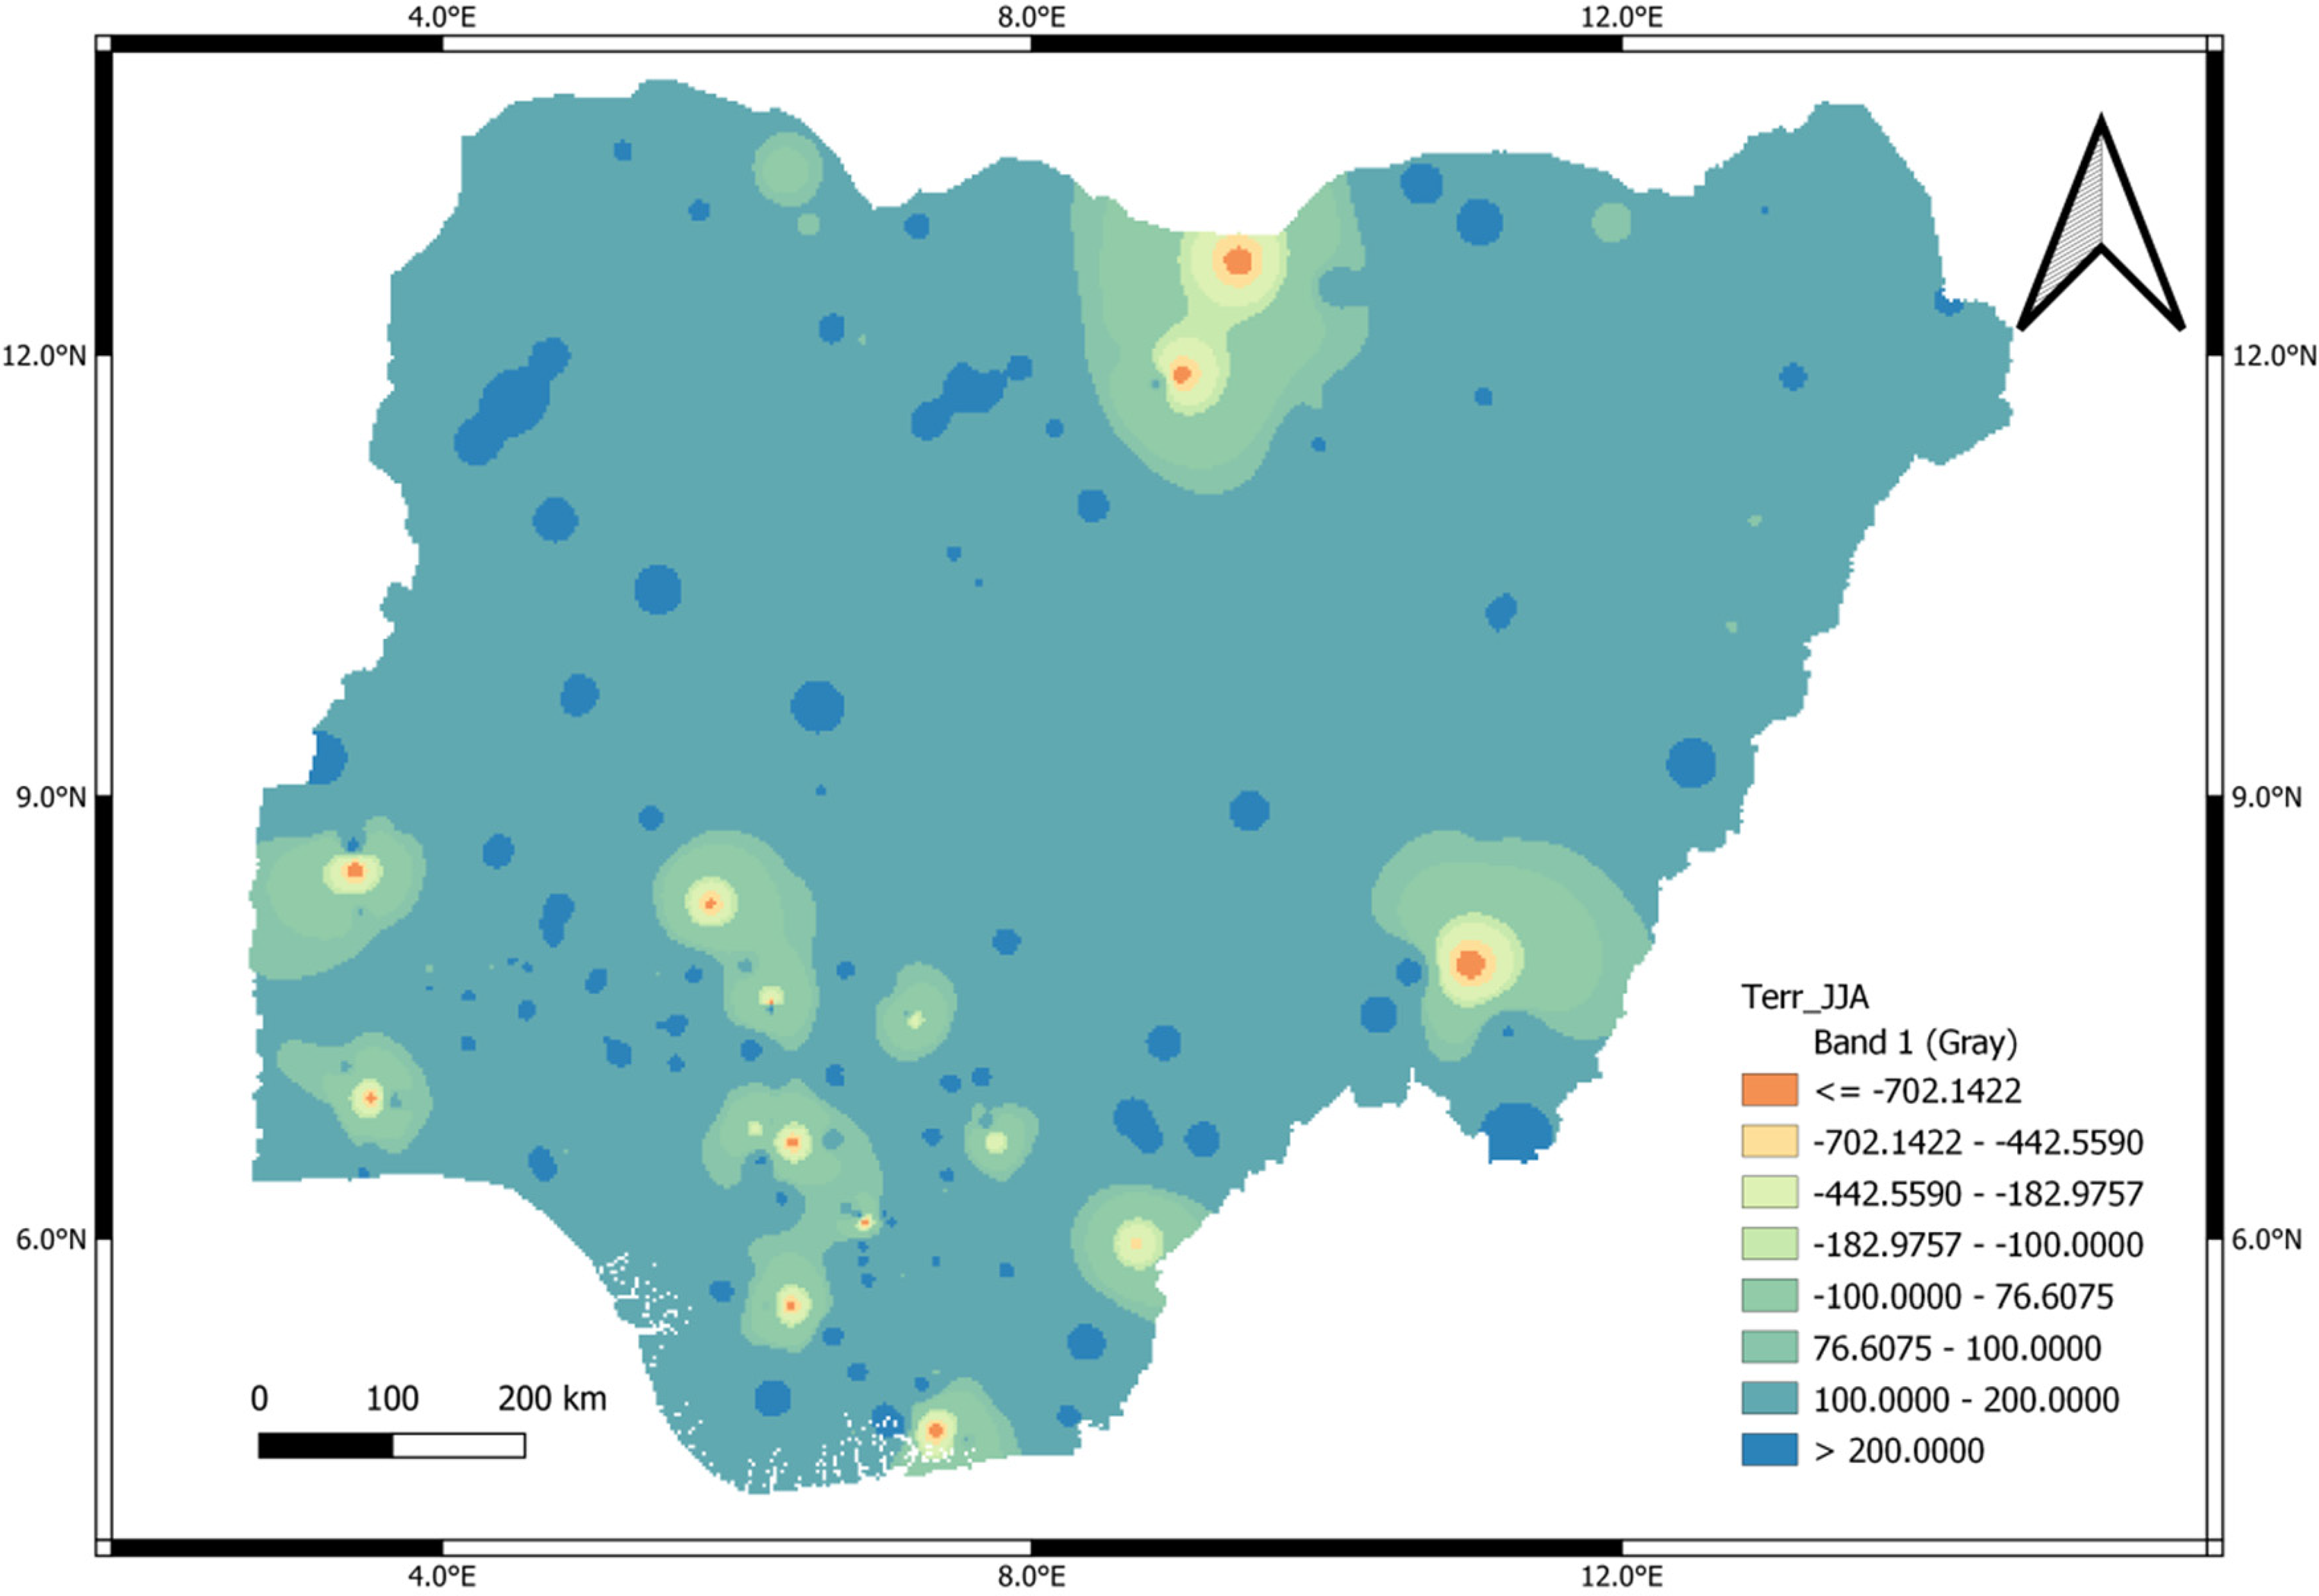
The spatial map in Figure 6 shows the terrestrial radiation of June, July and August (Terr_JJA) classified as late wet or rainy season usually characterized by mild rainfall not as heavy as that of March to May and rainfall break by August. The northern part of the country experiences its rainy season during this period, which is usually not heavy especially in the northeast (WBG Climate Change Knowledge Portal, 2021).
Spatial map of terrestrial radiation for June, July and August.
The map shows areas with a significant reduction of terrestial radiation in parts of the chad basin, the basement complex in the Belli area of taraba State, the basement complexes of the southwest around the Isanlu-Kabba area and Ago-are-Igebti, the Ekpoma- Kwale, and Ubiaja areas, Egume- Isa area in the mid-Benue basin, Bori and Abonemma areas of the Niger delta basin, the Obosi- Eha-amufu areas of the Anambra basin, the Owode- Okitipupa areas of the Dahomey basin and the Obudu areas of Calabar with a terrestial radiation <76 Wm−2. The spots with terrestial radiation >200 Wm−2 during JJA are heat catchment regions across the country. These locations include the Gummi area of the sokoto basin, Hunkuyi area of the basement complex in the northeast, Gashua area of the chad basin, idah area of Anambra basin, Atijere area of the dahomey basin, Agbasa,Omoko, Akamkpa area of Niger delta basin, Shaki area of the southwest basement complex.
From the terrestial radiation distribution in DJF, MAM, and JJA, some locations had almost constant radiation (the Gummel-Gaya area in the chad basin, the Belli area in the basement complex of the North east, the Nsukka, Awgu, Igboukwu area of the Anambra basin, the igbo ora areas of the Dahomey basin, the Ekpoma-kwale, itu and ogoja areas of Niger Delta basin, Icheu, ode, Ago-are areas of the southwest basement complex). These areas areas are the geothermal well locations within Nigeria. However, it is observed that the locations are extensive based on the geology of the location.
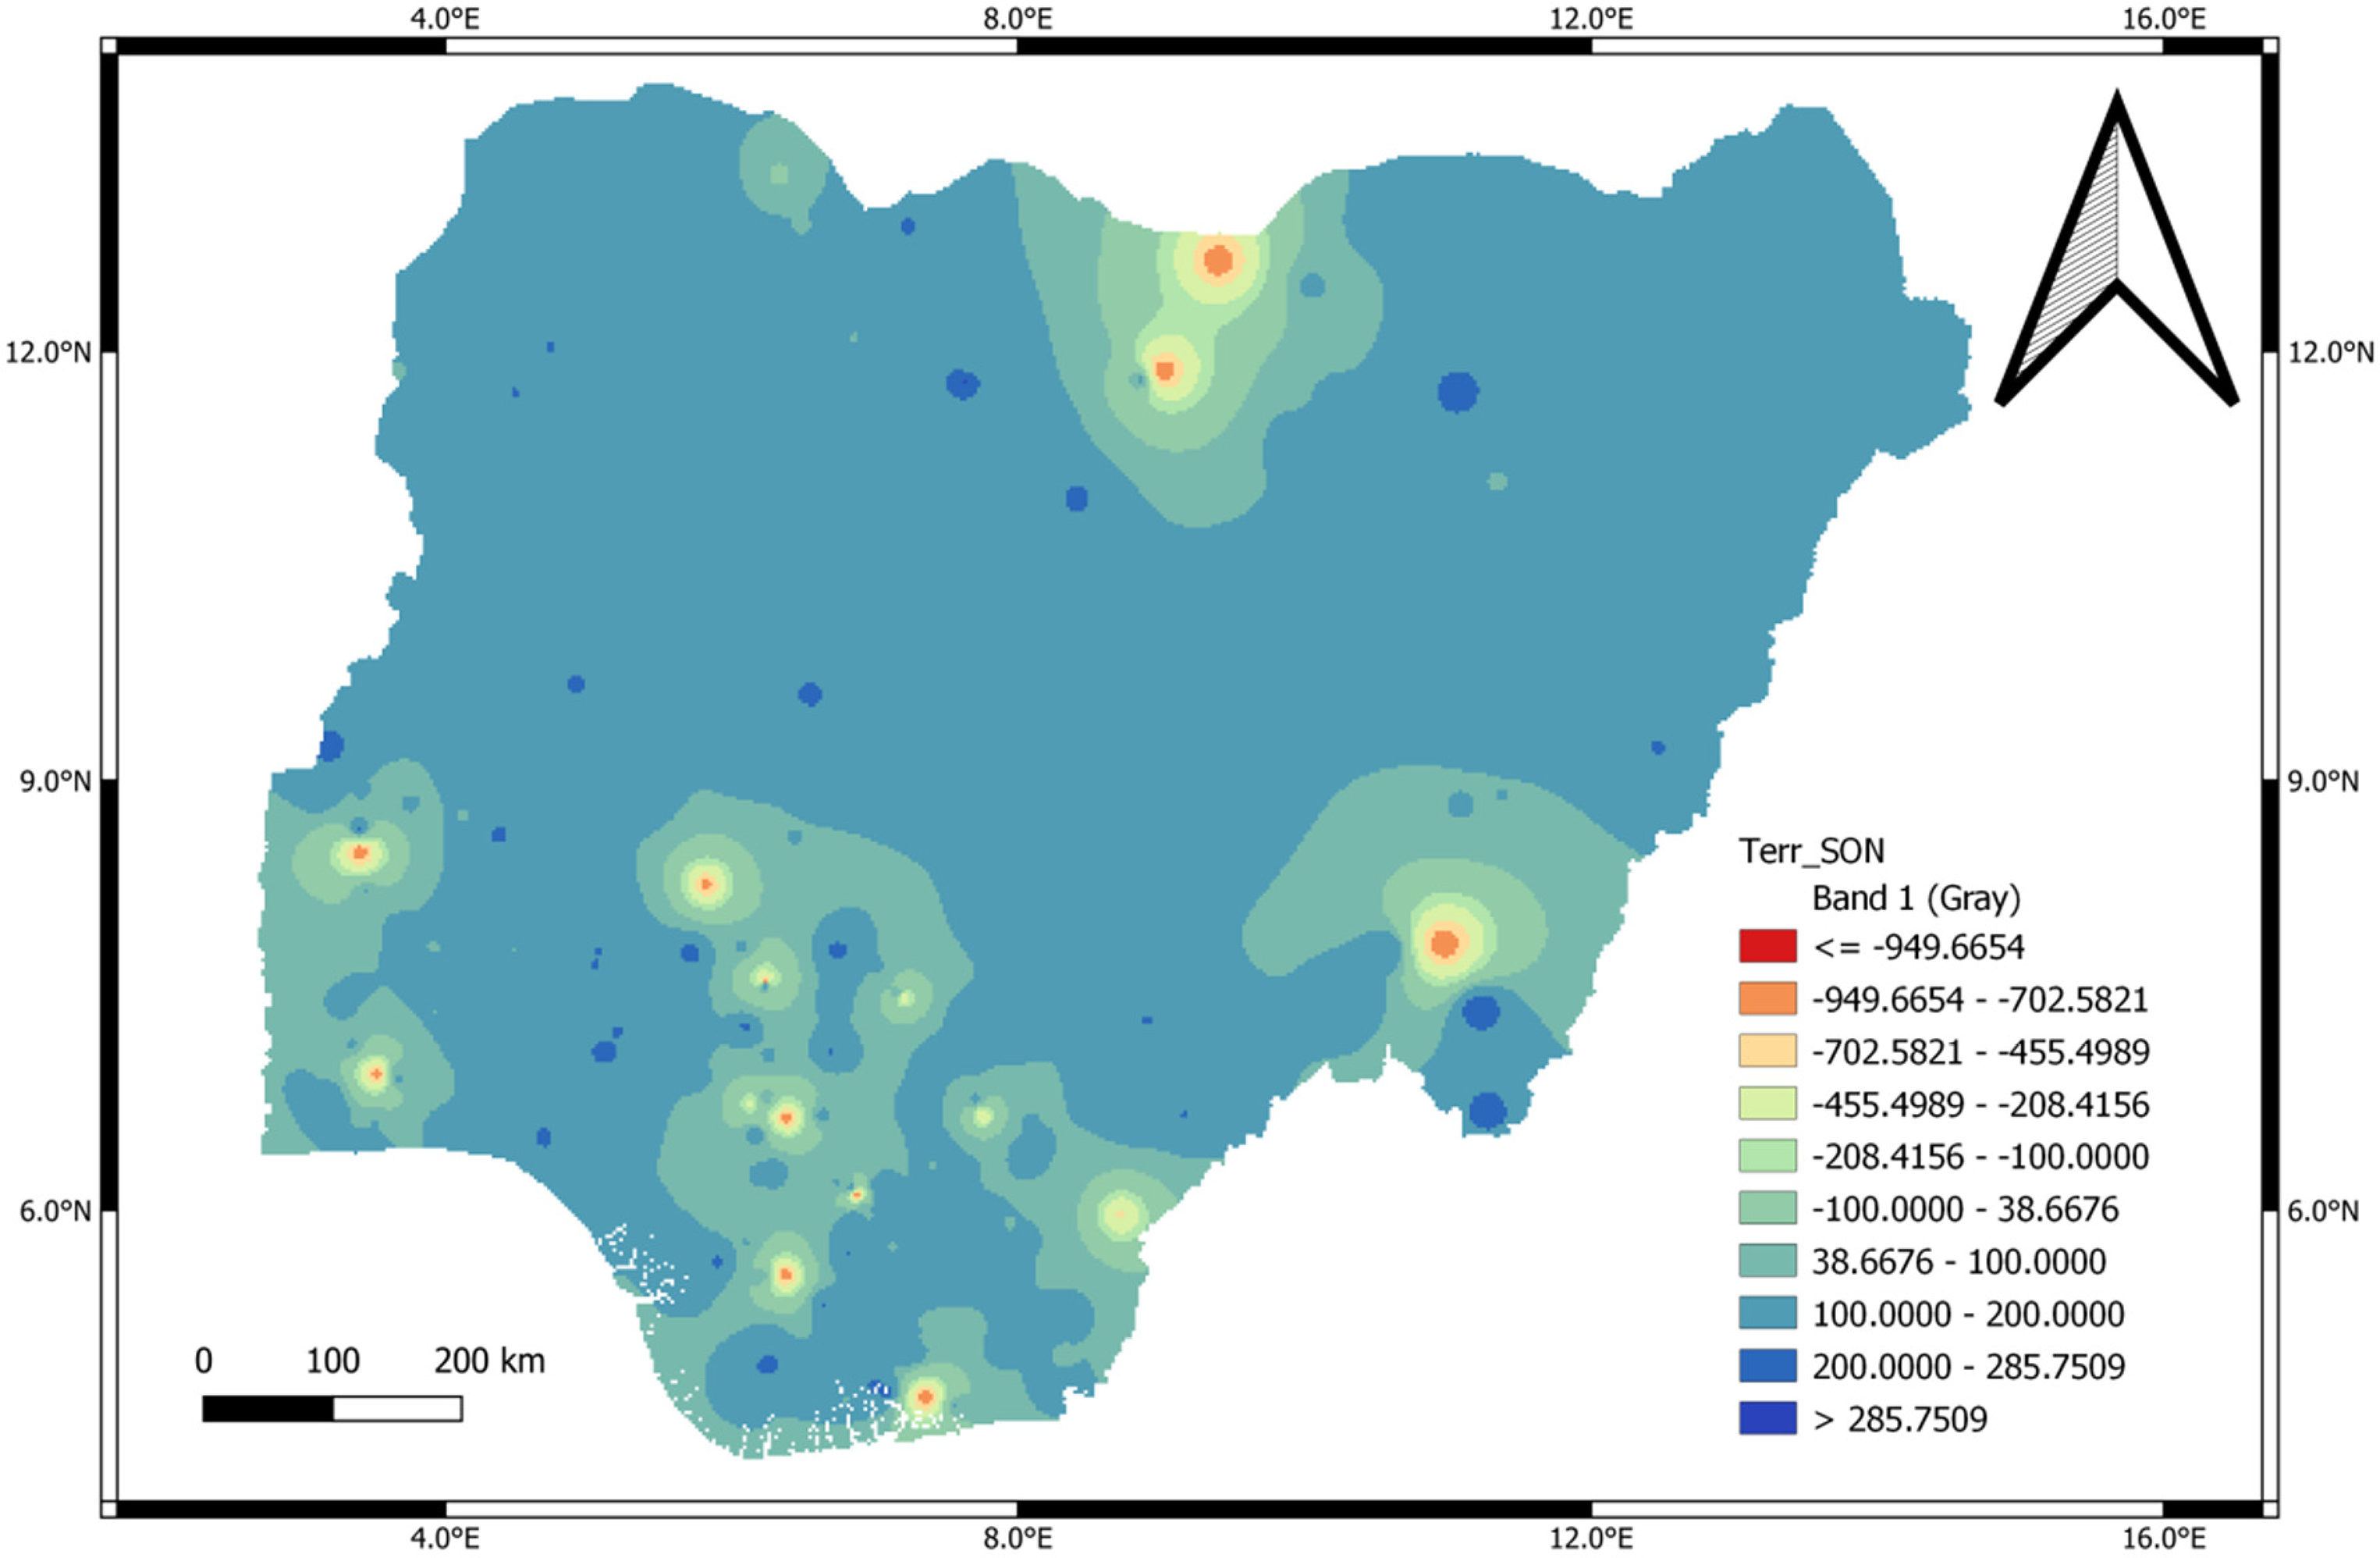
The spatial map in Figure 7 shows the terrestial radiation for September, October, November (Terr_SON) classified as the early dry season usually characterized by hot sunny days, high temperature and low humidity and it is affected by the warm winds from the sahara desert in the North. It is more intense in the north than in the southern parts of Nigeria (WBG Climate Change Knowledge Portal, 2021).
Spatial map of terrestrial radiation for September, October and November.
The terrestial radiation in this season is not completely low in all areas because this period is usually hot throught out the country.
However, locations with >200 Wm−2 further lists location that are heat catchment areas. These areas include the potiskum area of the upper benue trough, the Gembu area of the northeast basement complex, the Hunkuyi areas of the northwest basement complex. It is also observed that locations < −702 Wm−2 were the same as already observed in DJF, MAM, JJA. Based on the above, the Gummel-Gaya area in the chad basin, the Belli area in the basement complex of the North east, the Nsukka,Awgu, Igboukwu area of the Anambra basin, the igbo ora areas of the Dahomey basin, the Ekpoma-kwale, itu and ogoja areas of Niger Delta basin, Icheu, Ago-are areas of the southwest basement complex is belived to be deep geothermal wells while the areas surrounding the geothermal wells are medium geothermal wells.
The geostatistical analysis of the terrestial radiation for December, January, and February (Terr_DJF), March, April, and May (Terr_MAM), June, July, August (Terr_JJA), September, October, November (Terr_SON), January to December (Terr_Year) and geothermal gradient of January to December (GG_Year) across Nigeria were analysed within geological description based on the different sedimentary basins and basement complexes in Nigeria. They are the Anambra basin, Bida basin, Sokoto basin, Chad basin, Niger Delta basin, Dahomey basin, Upper Benue basin, Mid-Benue basin, Basement complex (as presented in Figure 1). The compedum of the geostatistics can be seen in the appendix.
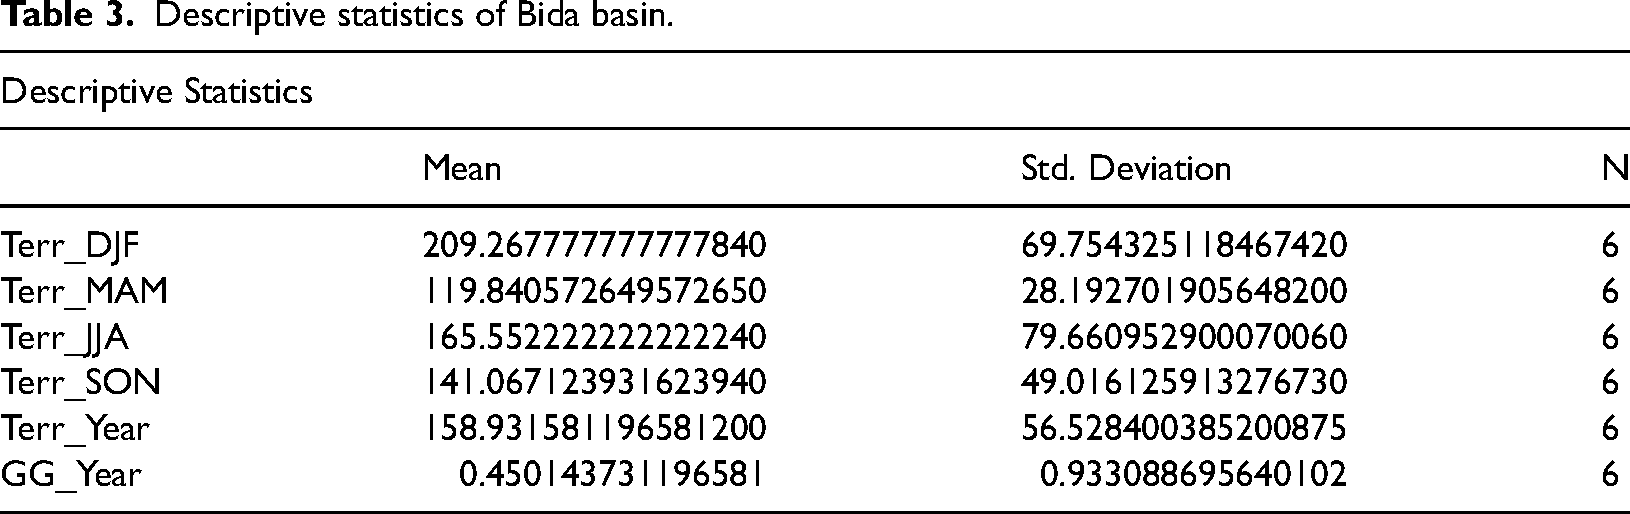
The Univariate outliners test was carried out on Terr_DJF, Terr_MAM, Terr_JJA, Terr_SON, Terr_Year and GG_Year of Anambra Basin which showed three outliners. At Eha amufu, Obolo and Obosi. These locations corroborate the shallow geospatial wells in the spatial map. The descriptive statistics (Table 2) show the distribution of the terrestrial radiation within the basin. The Univariate outliners test was carried out on Terr_DJF, Terr_MAM, Terr_JJA, Terr_SON, Terr_Year and GG_Year of Bida Basin. The results in the Appendix shows that Terr_DJF, Terr_MAM, Terr_JJA, Terr_SON, Terr_Year and GG_Year do not have outliners.
Descriptive statistics of Anambra basin.
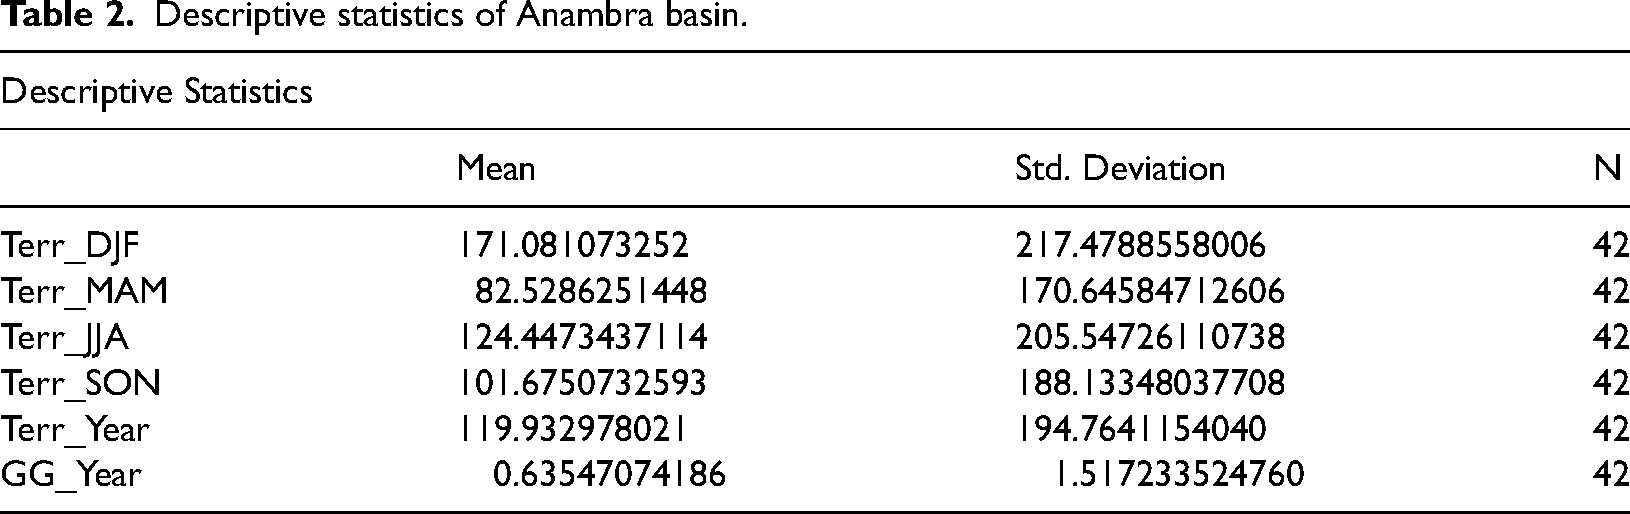
The descriptive analysis in Bida basin (Table 3) is higher than Anambra basin. However, the GG in Anambra basin is higher than Bida basin. From correlation table in the Appendix, each individual variables (Terr_DJF, Terr_MAM, Terr_JJA, Terr_SON, Terr_Year and GG_Year) correlate to one another, which is indicative of a positive correlation. Kendal Tan and spearman's rho shows significant correlation with the terrestrial radiation data interval of 40 years. However, there was no correlation between seasonal terrestrial radiation to geothermal gradient. This observation gives credence to the assertion made in spatial analysis.
Descriptive statistics of Bida basin.
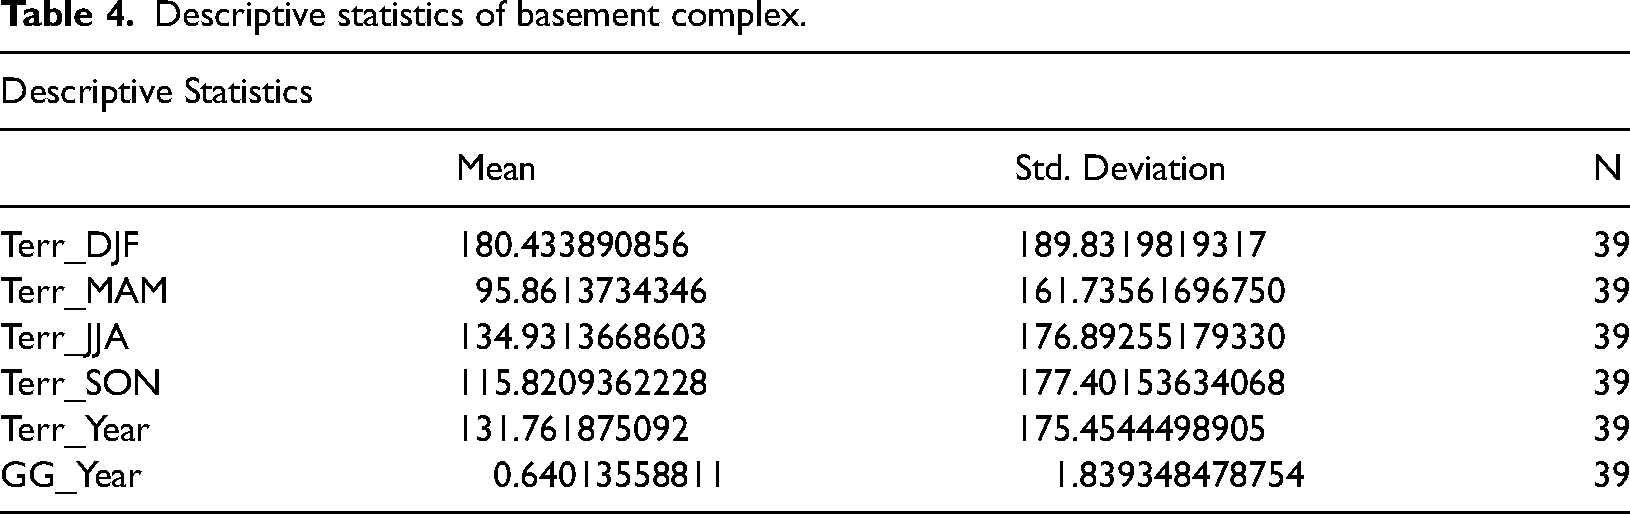
The descriptive analysis in the basement complex (Table 4) is lower than Bida basin. However, the geothermal gradient is higher than that of Bida basin. From correlation table in the Appendix, each individual variable (Terr_DJF, Terr_MAM, Terr_JJA, Terr_SON, Terr_Year, and GG_Year) has a lower correlation compared to the Anambra and Bida basin. The Univariate outliners test was carried out on Terr_DJF, Terr_MAM, Terr_JJA, Terr_SON, Terr_Year, and GG_Year of Basement complex which showed three outliners at Gaya, Kano, Moriki, and Sabon Birnin Gwari.
Descriptive statistics of basement complex.
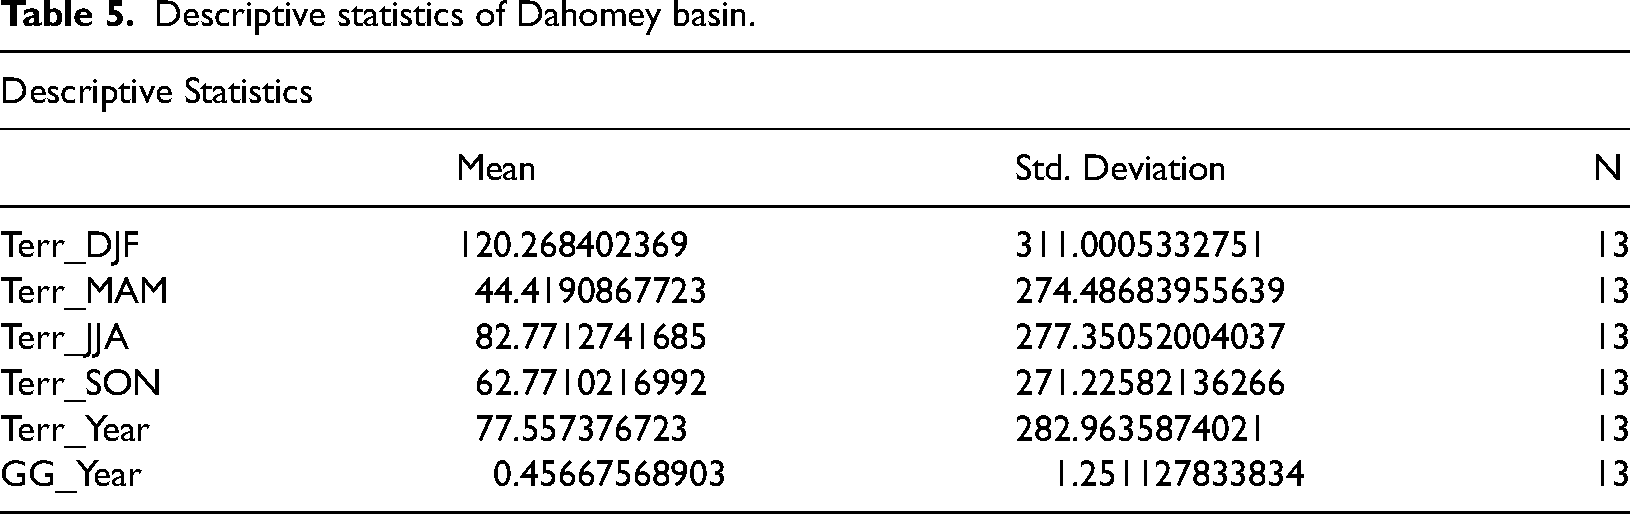
The descriptive analysis in Dahomey basin (Table 5) is lower than Anambra basin. However, the GG in Dahomey basin is higher than Bida basin. The Univariate outliners test was carried out on Terr_DJF, Terr_MAM, Terr_JJA, Terr_SON, Terr_Year, and GG_Year of the Dahomey basin which showed three outliners at Owode, Okitipupa, and Sango-Ota. From correlation table in the Appendix, each individual variables (Terr_DJF, Terr_MAM, Terr_JJA, Terr_SON, Terr_Year, and GG_Year) correlate to one another, which is indicative of a positive correlation. Kendal Tan and spearman's rho shows significant correlation with the terrestrial radiation data interval of 40 years. However, there was no correlation between seasonal terrestrial radiation to geothermal gradient. This observation gives credence to the assertion made in spatial analysis.
Descriptive statistics of Dahomey basin.
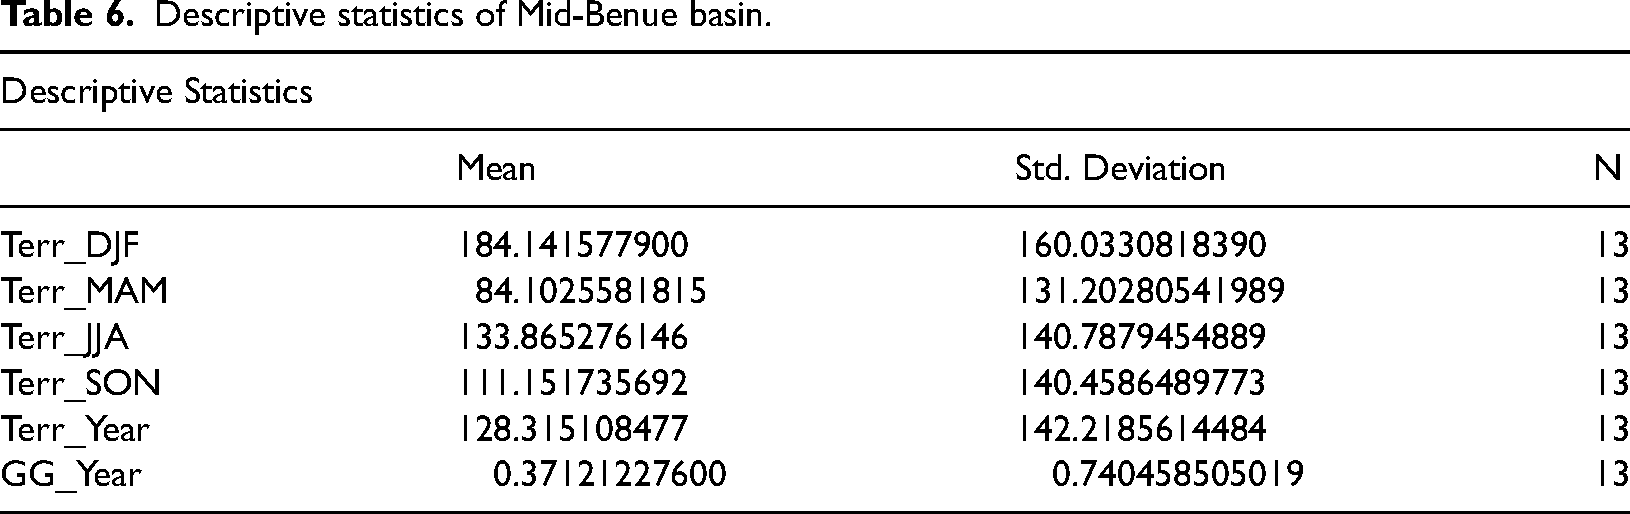
The descriptive analysis in of Mid-Benue basin (Table 6) is lower than Dahomey basin. However, the GG in of Mid-Benue basin is lower than Dahomey basin. The Univariate outliners test was carried out on Terr_DJF, Terr_MAM, Terr_JJA, Terr_SON, Terr_Year, and GG_Year of the Mid-Benue basin which show an outliner at Egume.
Descriptive statistics of Mid-Benue basin.
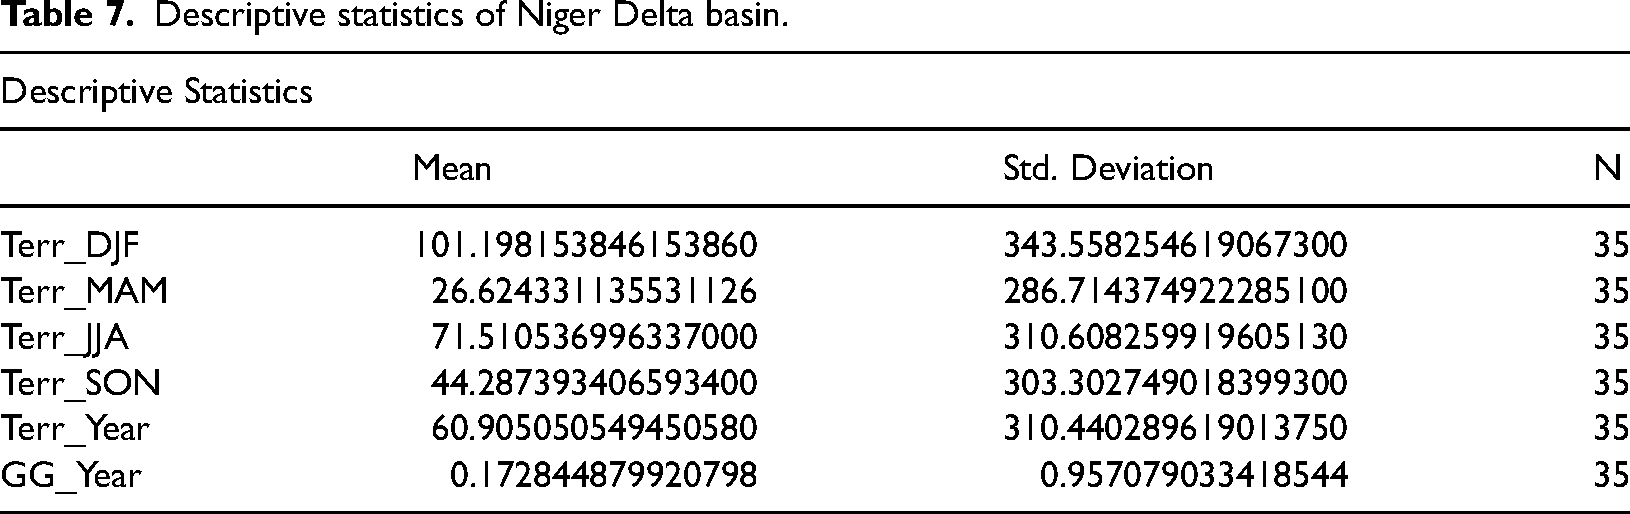
The descriptive analysis in of Niger Delta basin (Table 7) is lower than Dahomey basin. However, the GG in of Niger Delta basin is lower than Dahomey basin. From correlation table in the Appendix, each individual variables (Terr_DJF, Terr_MAM, Terr_JJA, Terr_SON, Terr_Year, and GG_Year) correlate to one another, which is indicative of a positive correlation. Kendal Tan and spearman's rho shows significant correlation with the terrestrial radiation data interval of 40 years. However, there was no correlation between seasonal terrestrial radiation to geothermal gradient. This observation gives credence to the assertion made in spatial analysis. The Univariate outliners test was carried out on Terr_DJF, Terr_MAM, Terr_JJA, Terr_SON, Terr_Year, and GG_Year of Basement complex of the North West which showed three extreme outliners in Ekpoma, Kwale, and Ubiaja.
Descriptive statistics of Niger Delta basin.
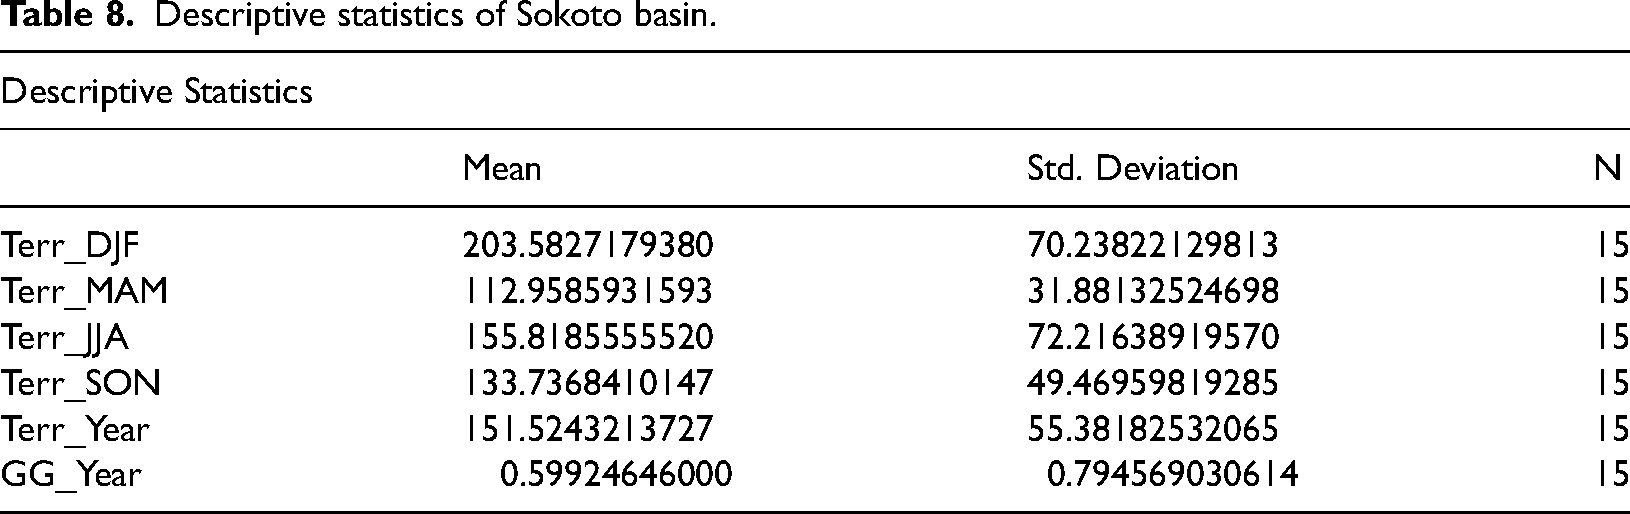
The descriptive analysis in of Sokoto basin (Table 8) is lower than Niger delta basin. However, the GG in of Sokoto basin is lower than Niger delta basin. From correlation table in the Appendix, each individual variables (Terr_DJF, Terr_MAM, Terr_JJA, Terr_SON, Terr_Year, and GG_Year) correlate to one another, which is indicative of a positive correlation. Kendal Tan and spearman's rho shows significant correlation with the terrestrial radiation data interval of 40 years. However, there was no correlation between seasonal terrestrial radiation to geothermal gradient. This observation gives credence to the assertion made in spatial analysis. The Univariate outliners test was carried out on Terr_DJF, Terr_MAM, Terr_JJA, Terr_SON, Terr_Year, and GG_Year of Sokoto Basin showed that the basin does not have outliners.
Descriptive statistics of Sokoto basin.
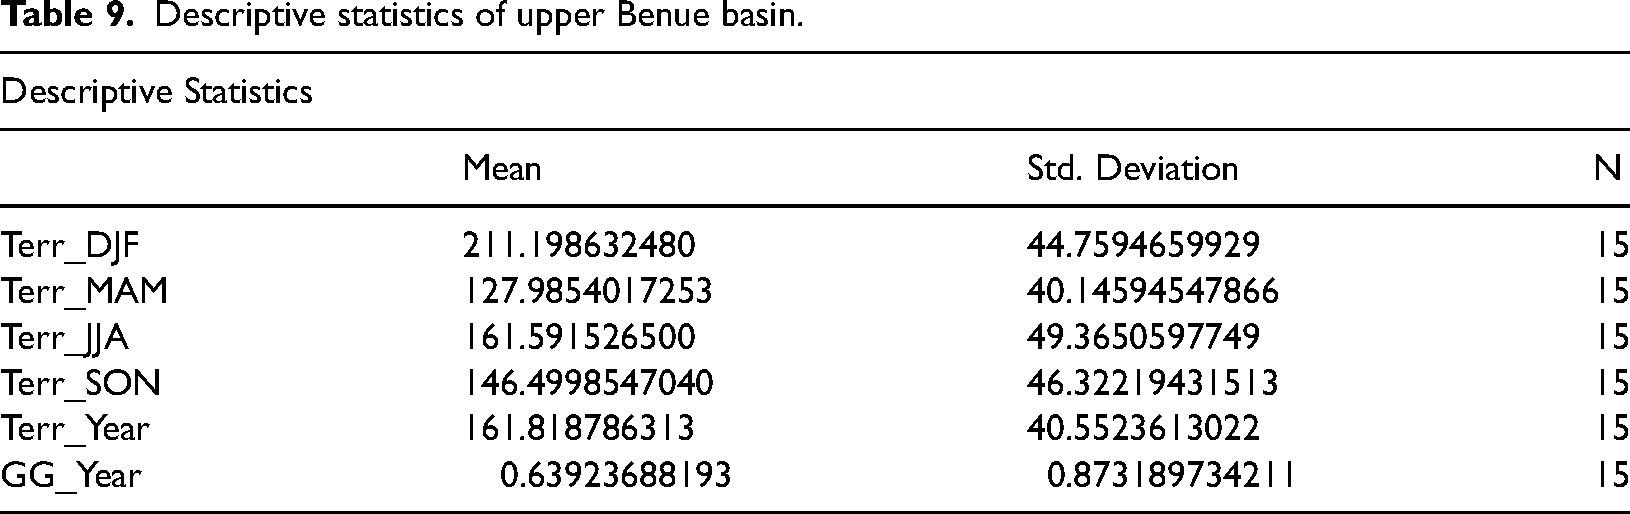
The descriptive analysis in of Upper Benue Basin (Table 9) is higher than Sokoto basin. However, the GG in of Upper Benue Basin is higher than Sokoto basin. From correlation table in the Appendix, each individual variables (Terr_DJF, Terr_MAM, Terr_JJA, Terr_SON, Terr_Year, and GG_Year) correlate to one another, which is indicative of a positive correlation. Kendal Tan and spearman's rho shows significant correlation with the terrestrial radiation data interval of 40 years. However, there was no correlation between seasonal terrestrial radiation to geothermal gradient. This observation gives credence to the assertion made in spatial analysis. The Univariate outliners test was carried out on Terr_DJF, Terr_MAM, Terr_JJA, Terr_SON, Terr_Year, and GG_Year of Upper Benue Basin.in Potiskum.
Descriptive statistics of upper Benue basin.
The descriptive analysis in of Chad Basin (Table 10) is higher than the rest of the basins. However, the GG of Chad Basin is higher than the previous basins. The Univariate outliners test was carried out on Terr_DJF, Terr_MAM, Terr_JJA, Terr_SON, Terr_Year, and GG_Year of Chad Basin in Geidam, Gummel and Kumaganum. From correlation table in the Appendix, each individual variables (Terr_DJF, Terr_MAM, Terr_JJA, Terr_SON, Terr_Year, and GG_Year) correlate to one another, which is indicative of a positive correlation. Kendal Tan and spearman's rho shows significant correlation with the terrestrial radiation data interval of 40 years. However, there was no correlation between seasonal terrestrial radiation to geothermal gradient. This observation gives credence to the assertion made in spatial analysis.
Descriptive statistics of Chad basin.
From correlation table in the Appendix, each individual variables (Terr_DJF, Terr_MAM, Terr_JJA, Terr_SON, Terr_Year, and GG_Year) correlate to one another, this is indicative of a positive correlation. Kendal Tan and spearman's rho shows significant correlation with the terrestrial radiation data interval of 40 years. However, there was no correlation between seasonal terrestrial radiation to geothermal gradient. This observation gives credence to the assertion made in spatial analysis.
From the spatial and statistical analysis, it is postulated that since the remote sensing most accurate within a geothermal mechanism i.e., convection and counter flow in a multi faulted zones, the thermal reversal depth (TRD) is the best means of classifying geothermal wells. TRD is the depth below the earth crust where the temperature reverses from negative to positive trend. In other to validate the TRD concept two known geothermal wells located in Dixie Valley, USA and Efeler, Turkey was used. The graph (Figure 8) shows the temperature from 10 am to 3 pm against soil depth of Dixie Valley, USA. The pattern shows a parabolic shape. The points of reversal are very essential in classifying deep, medium and shallow geothermal wells. In this case, the temperature reverses at depth 0.65 m and the pattern is being duplicated at varying magnitude throughout the day at varying magnitude as seen in Figure 8.
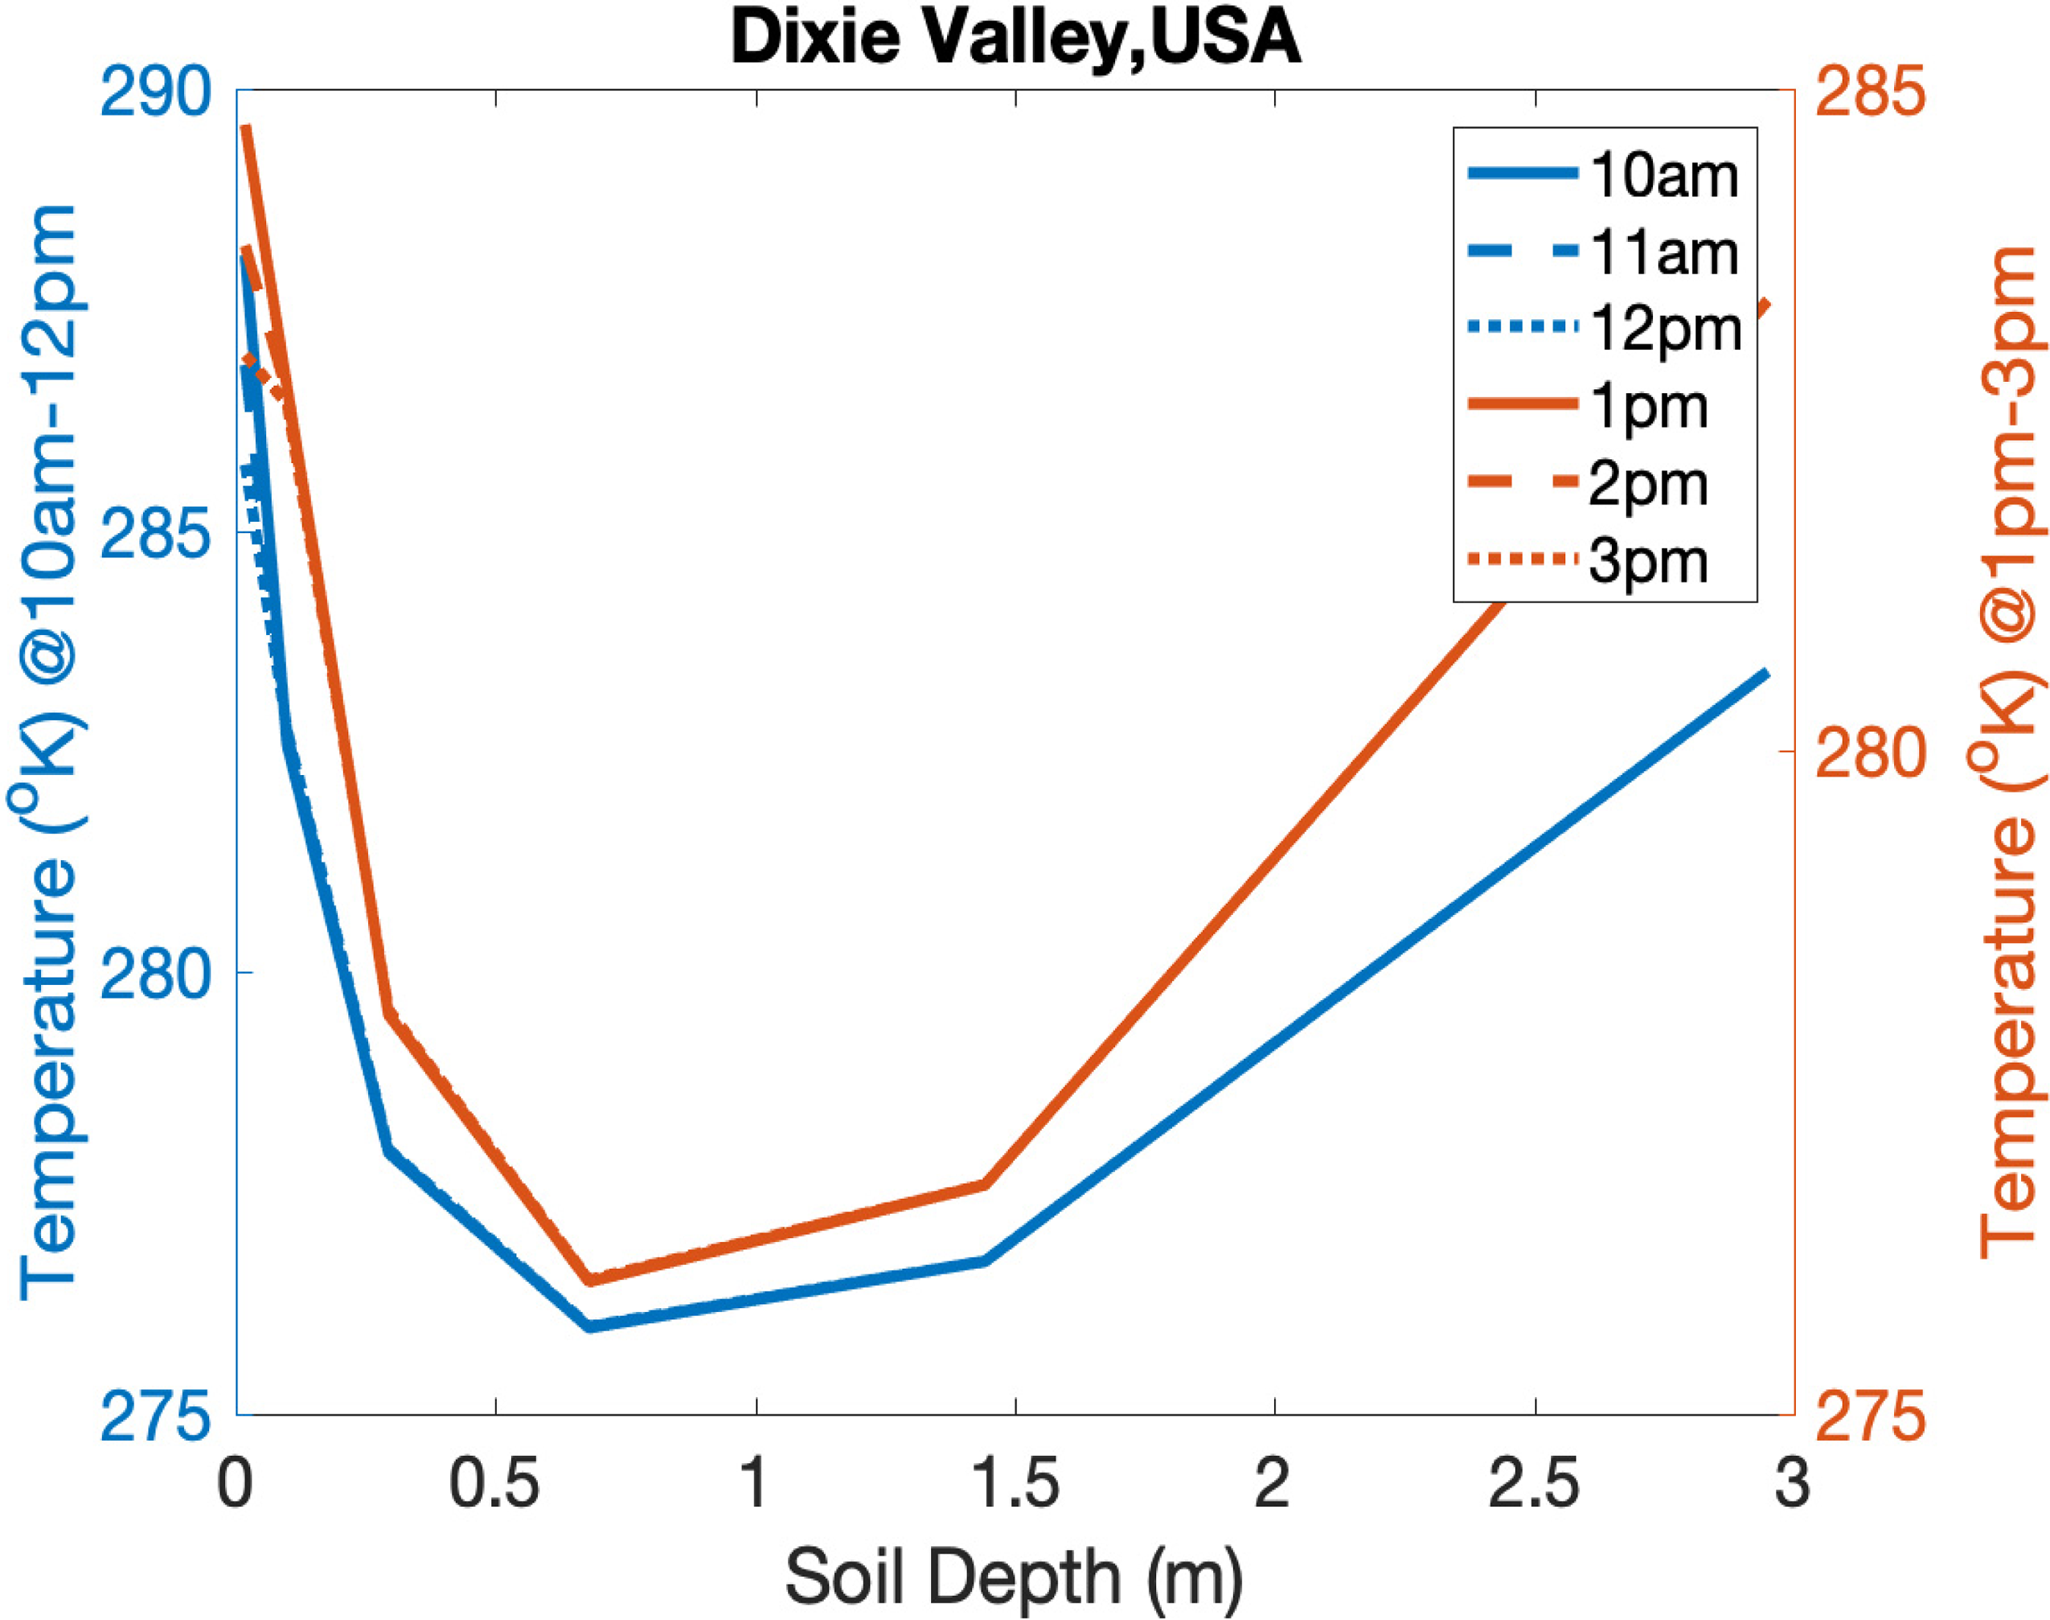
Remote sensing output of Dixie Valley, USA.
The graph (Figure 9) shows the temperature from 10 am to 3 pm against soil depth of Efeler, Turkey. The pattern shows a parabolic shape. The temperature reverses at depth 0.62 m and the pattern is being duplicated at varying magnitude throughout the day at varying magnitude as seen in Figure 9.
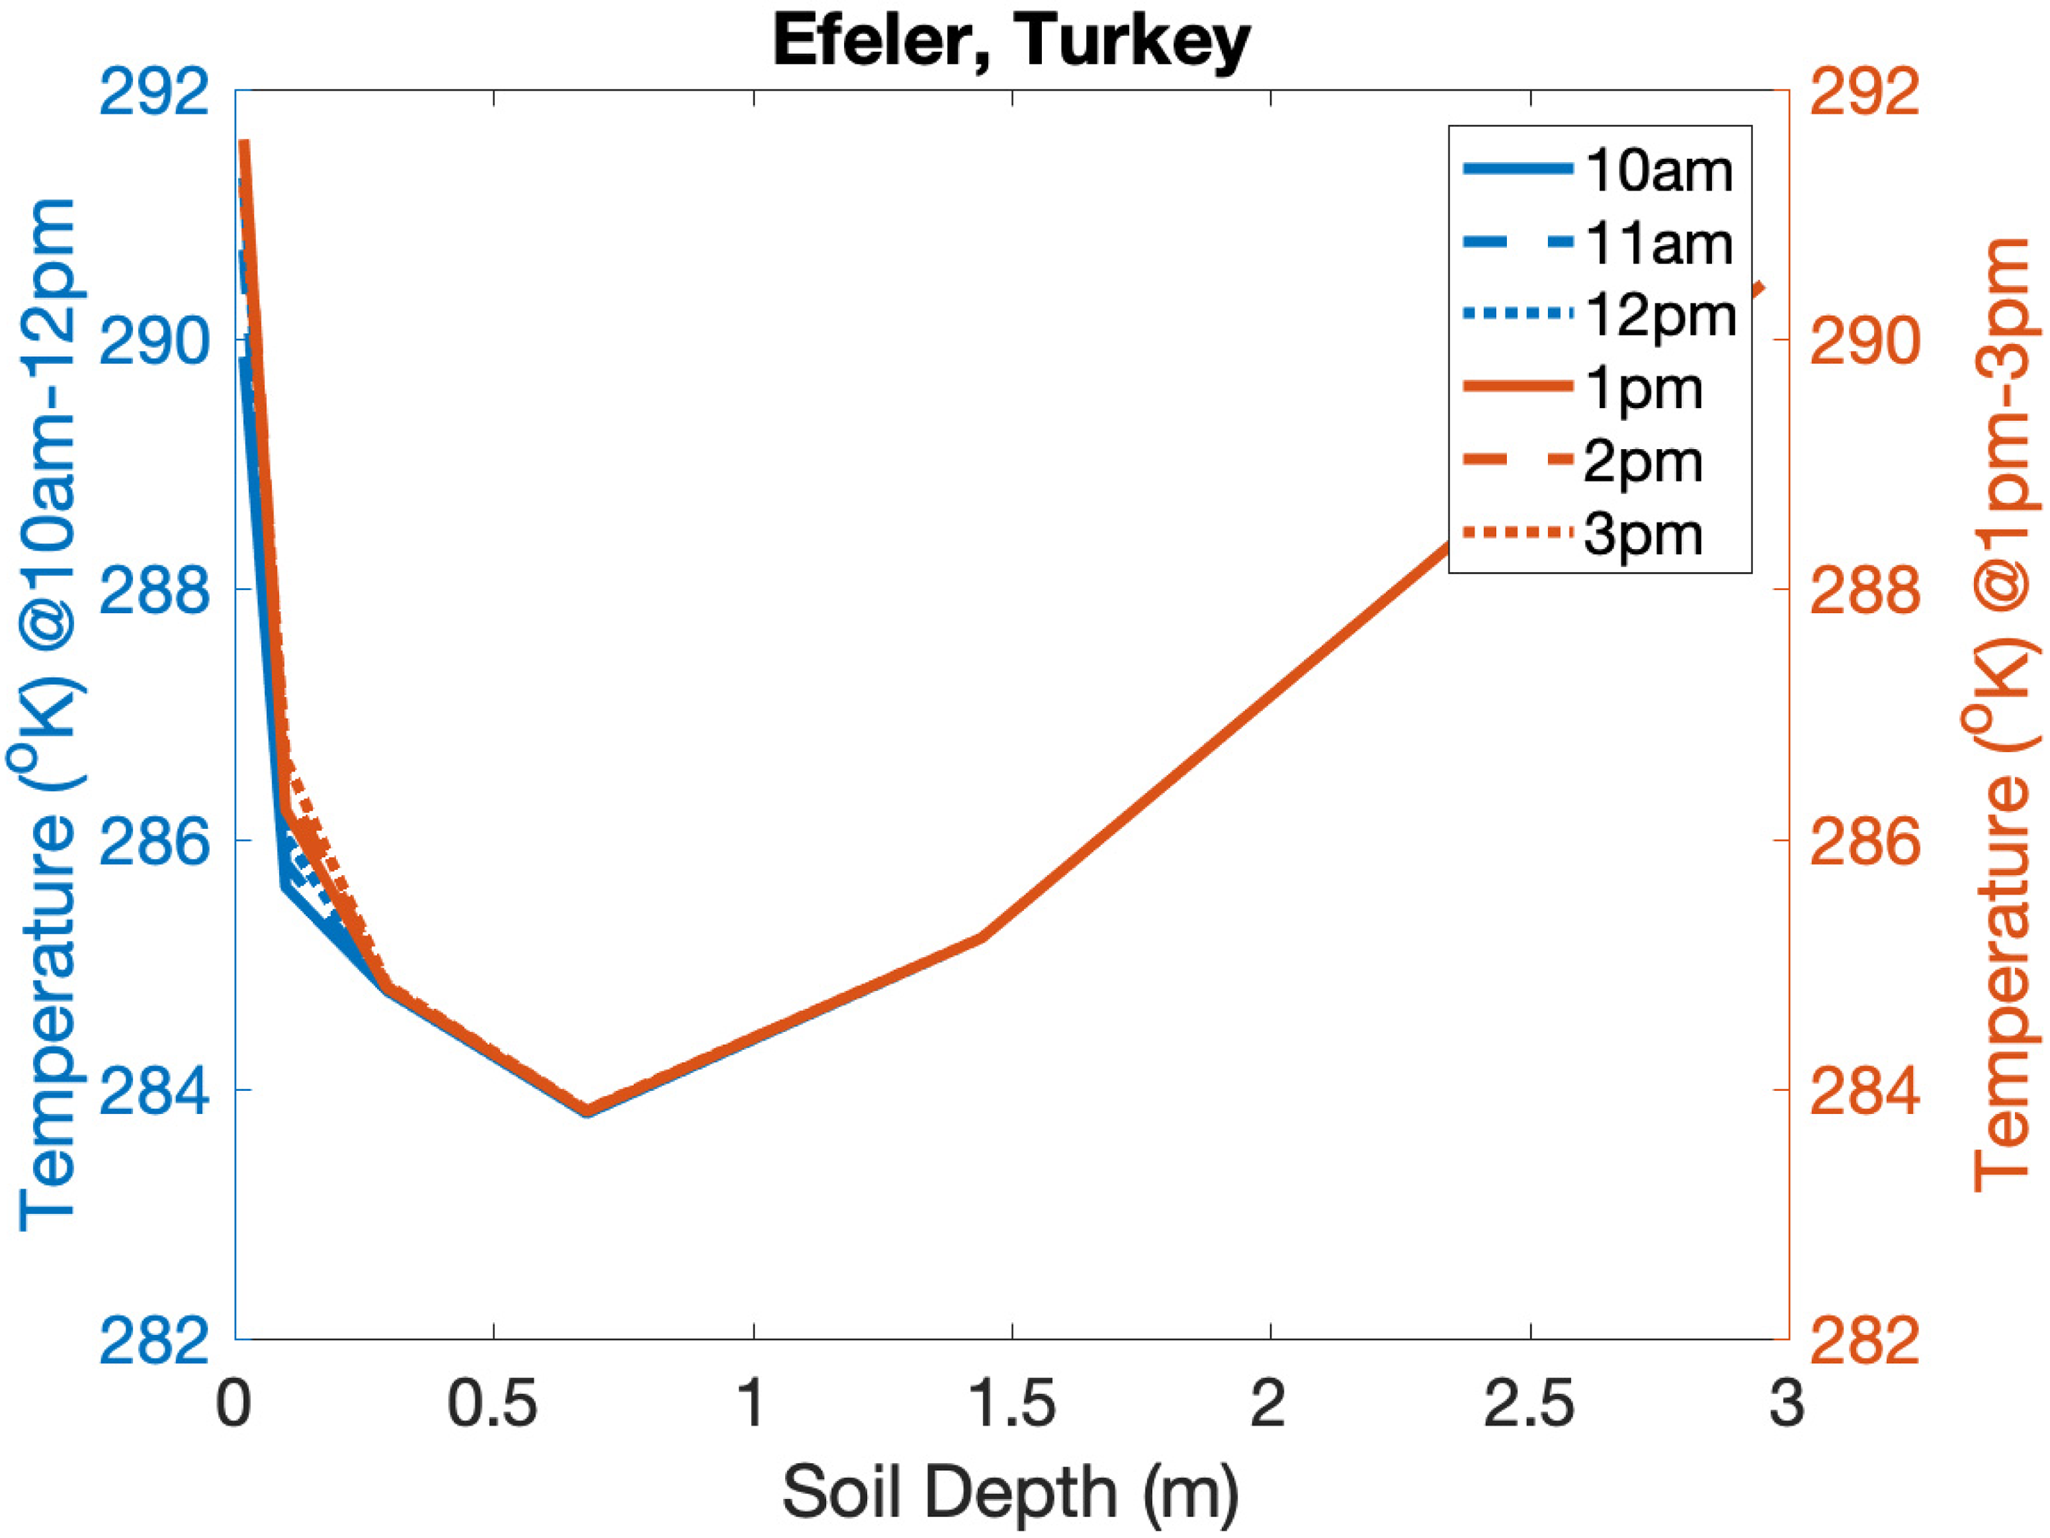
Remote sensing output of Efeler, Turkey.
The validation of the TRD concept was used to test another multi faulted zone's location in the lower Benue basin as presented in Figure 10. The graph (Figure 10) shows the temperature from 10 am to 3 pm against soil depth of Ijebu Igbo. It was observed that the remote sensing measurement from the selected locations did not have the TRD. Due to the geostatistical similarity with dataset from the two known geothermal wells, the field validation was carried-out. It was observed that the field measurement had TRD that occurred at <0.5 m. The difference between the remote sensing measurement and field measurement is largely due to the gridding system of MERRA2 whose spatial resolution is about 1⁄2° latitude by 5⁄8° longitude. Hence, the resultant measurement is a combination of larger land mass. On the other aspect, the field measurement is from a specific location within the selected field Figure 11.
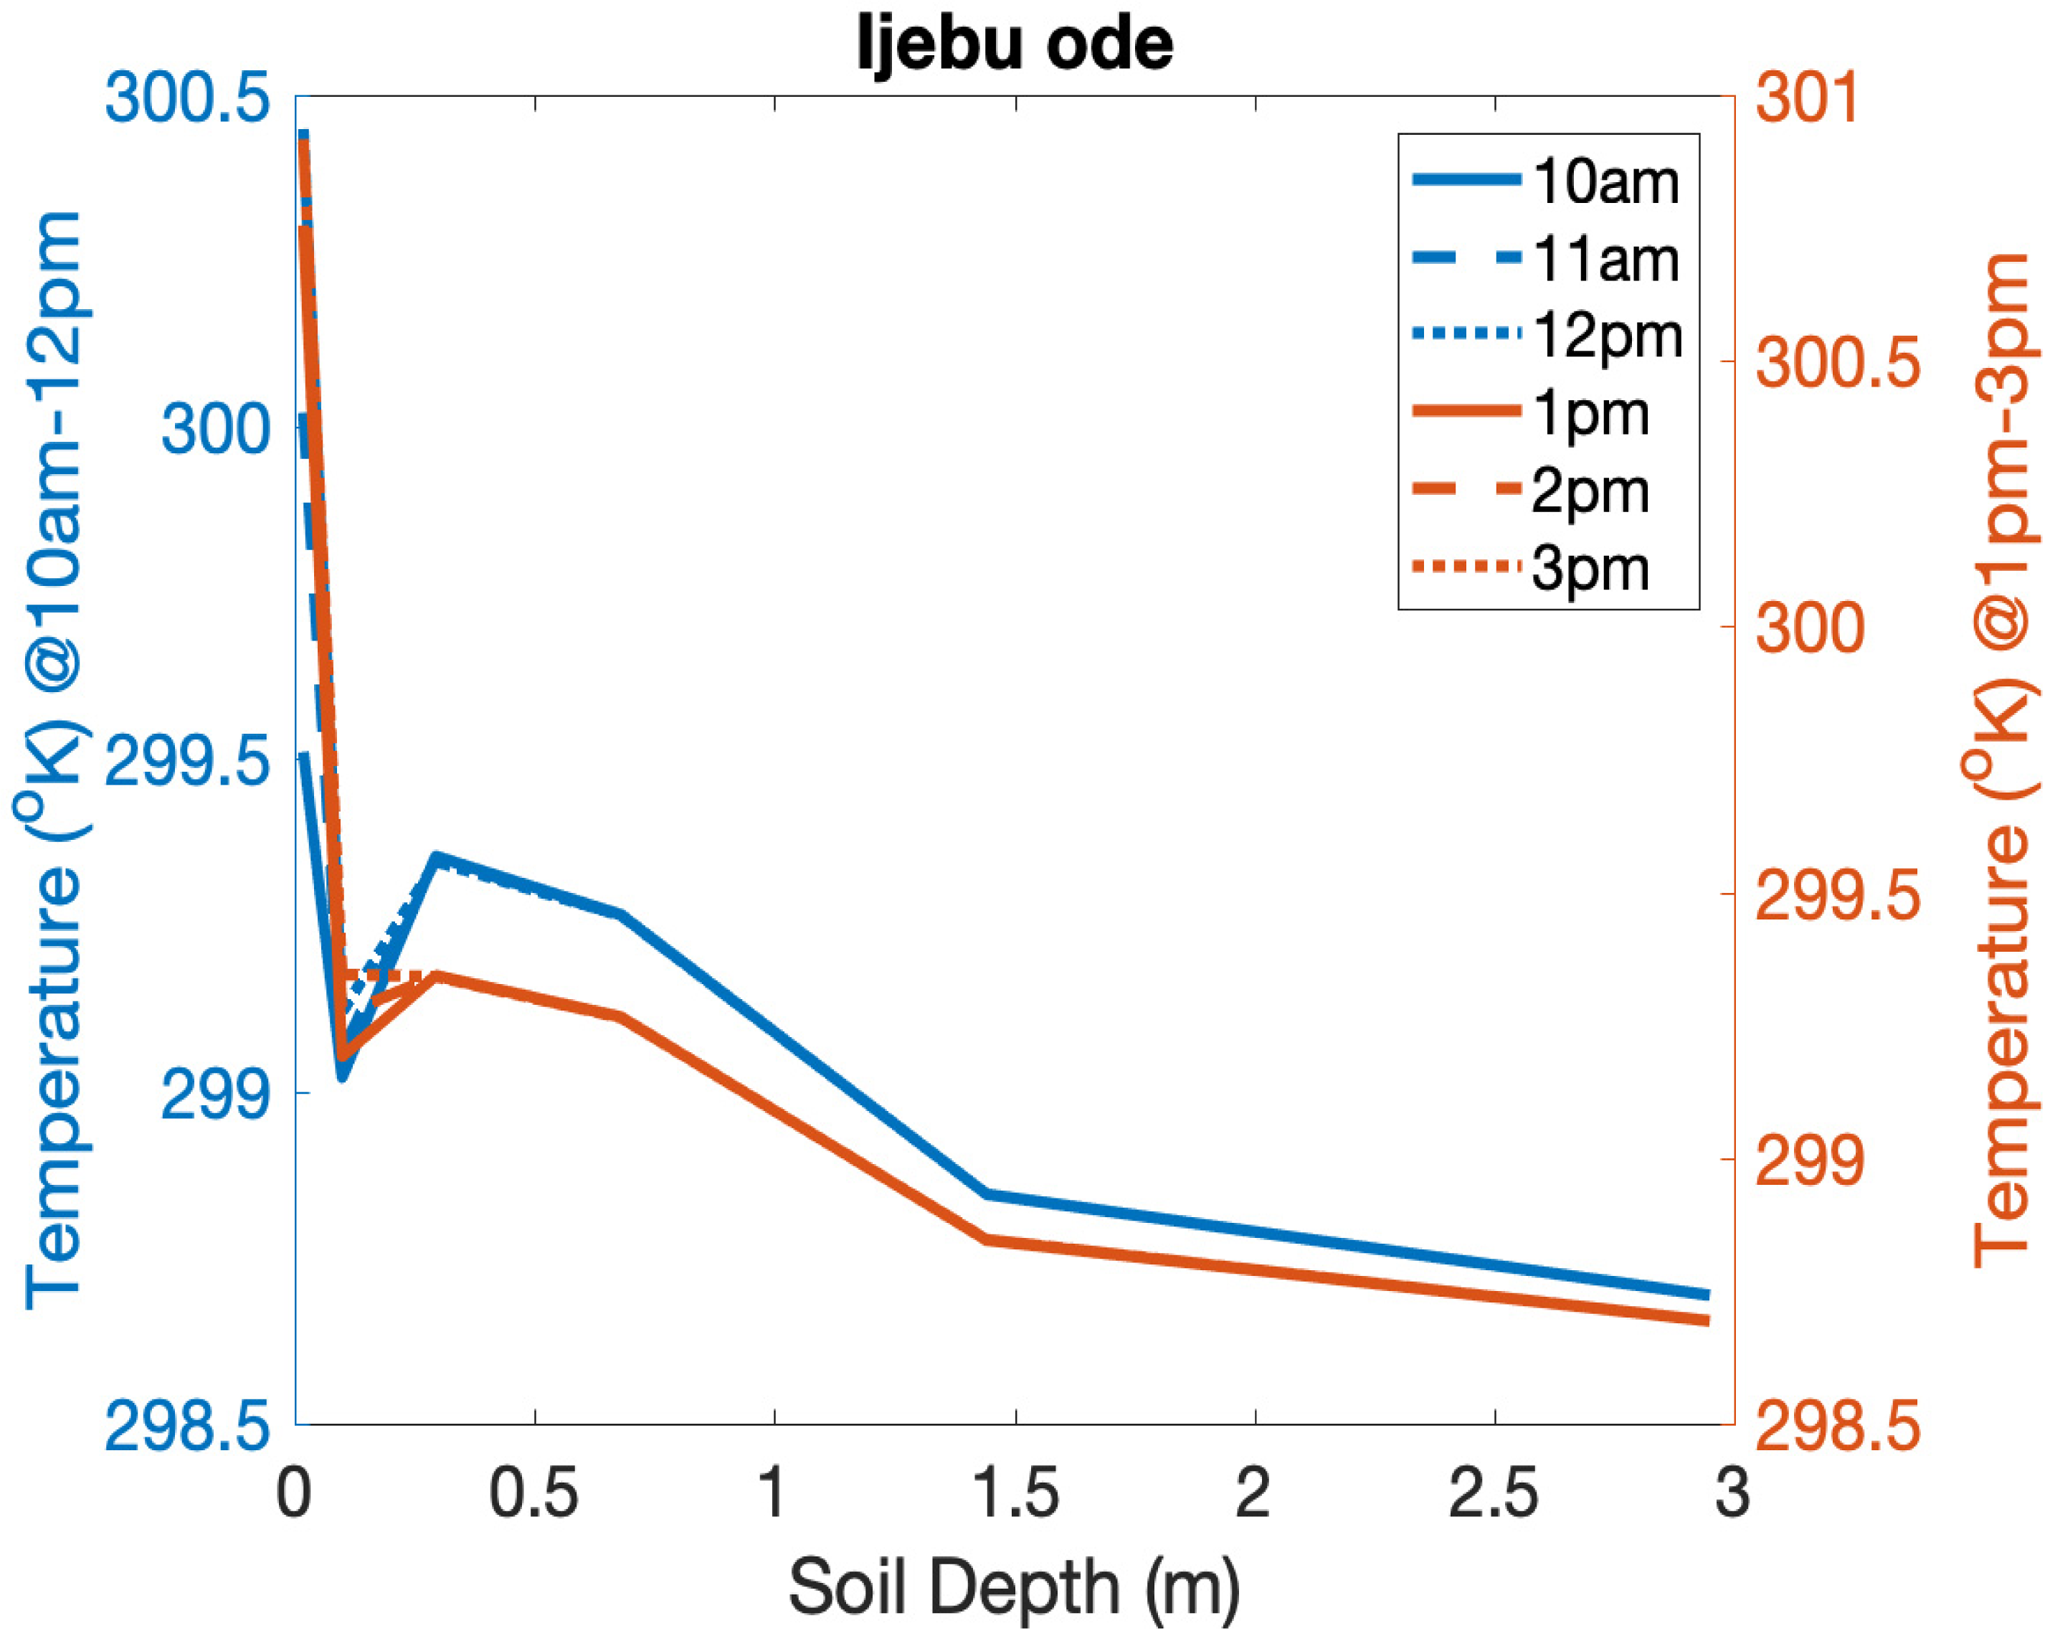
Remote sensing output of Ijebu Ode.
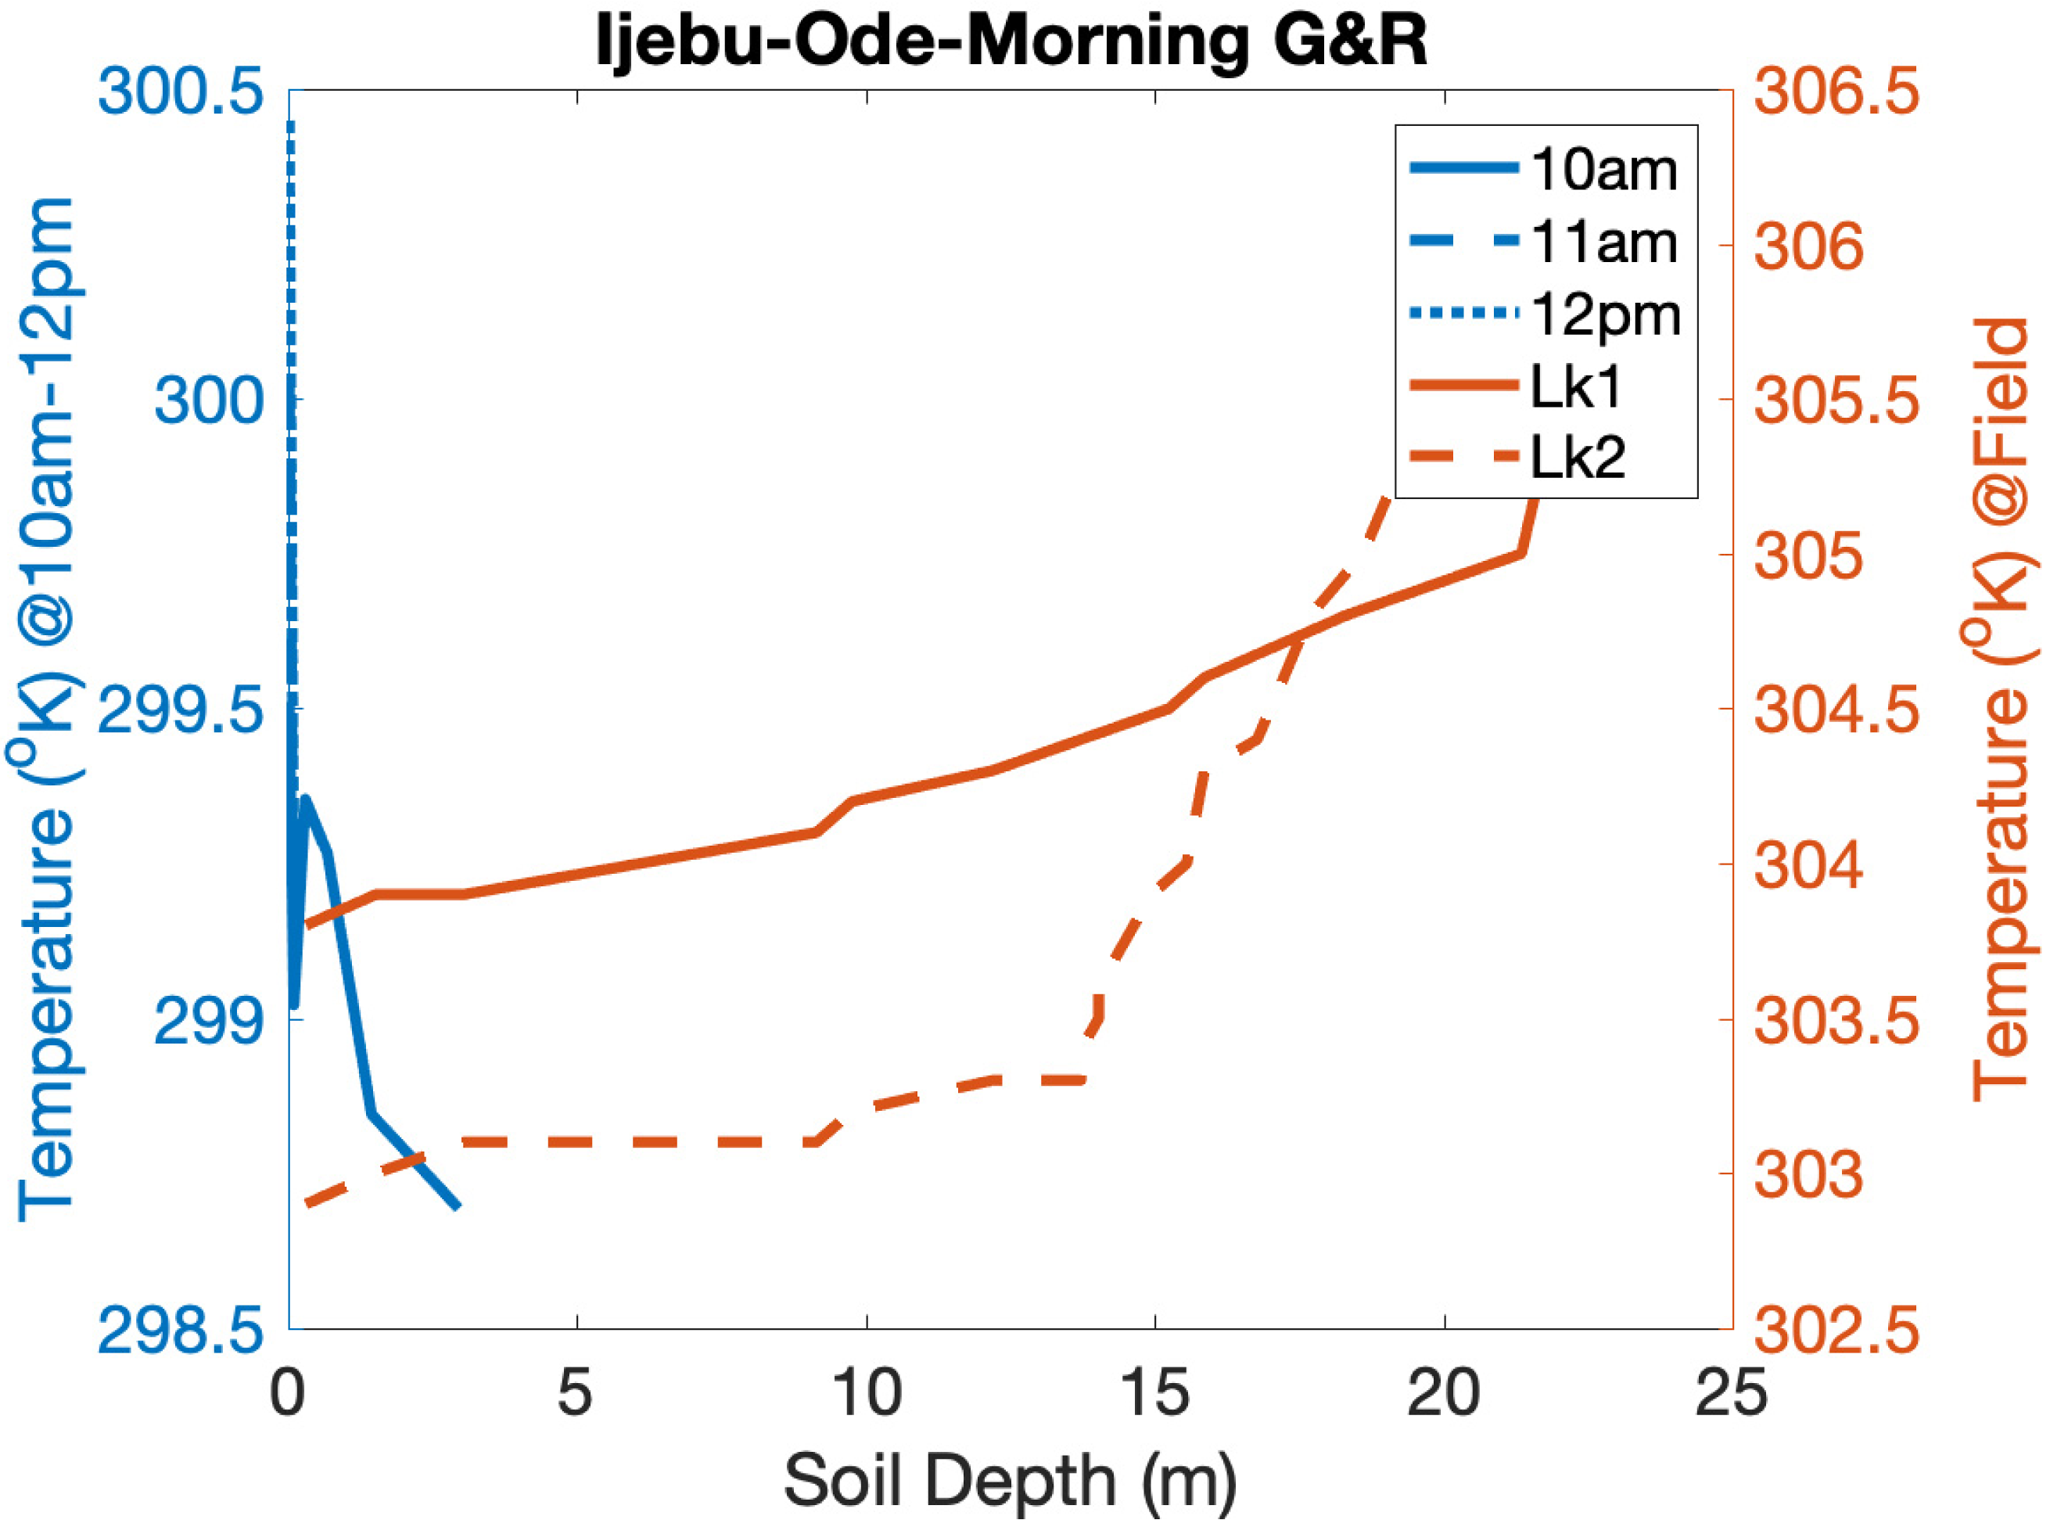
Remote sensing output and the field measurement of Ijebu ode-Morning.
Conclusion
The potential geothermal wells and heat catchment areas have been investigated in this study, which is the aim of this study using remote sensing data and field data. From the results, the thermal property of the nine basins was estimated using the mean and seasonal terrestrial radiation. The spatial analysis for the terrestrial radiation of the four season showed a constant terrestrial radiation of < −702 Wm−2 in the Gummel-Kumaganum areas of chad basin, Owode-igbo ora areas of the Dahomey basin, Belli area of the basement complex in Taraba state, potiskum areas of the Upper benue Basin, Ikot Ekpene and itu areas of the Niger delta basin. Also, spots with terrestial radiation >200 Wm−2 include the Gummi area of the Sokoto basin, Hunkuyi area of the basement complex in the northeast, Gashua area of the chad basin, Ozubulu-idah area of Anambra basin, Atijere area of the Dahomey basin, Agbasa, Omoko, Akamkpa area of Niger delta basin, Shaki area of the southwest basement complex. Other deep well locations include Ikogosi, Akiri, Aku, keana Awe, Jimeta, Ruwa-zafi, Wikki, and Talata. The spatial anaysis for location with high geothermal gradients coroborates with that of the terrestial radiation which indicates the presence of geothermal wells in regions having < −702 Wm−2 and heat catchment areas in regions with >200 Wm−2. This also indicates that the terrestial radiation is not affected by seasons. The result from the statistical analysis revealed that the Anambra basin, Dahomey basin, mid-Benue basin, Niger Delta basin and Chad basin were significant and showed extreme Outliers while the Bida basin, Sokoto basin and the Upper Benue basin were not significant and did not have any outliner except the Upper Benue basin with one Outlier in Potiskum. This extreme outliers corresponds with the areas heat catchment and the geothermal location (thermal Anomalies) from the spatial analysis. The ground measurement results, revealed that the field measurement and the satelite measurement of Shagamu, ijebu igbo and Ijebu-ode showed a very good correlation of its thermal anomalies and this was validated by comparing them with known deep geothermal wells around the globe. This field results validates our findings from the satellite data. Hence, a deep geothermal well exist in Ijebu-Ode. The heat catchment are found in Nembe, Okirika, Yenagoa (Niger-Delta basin); Ozubulu, Oguta, Obolo (Anambra basin); Okitipupa, Atijere (Dahomey basin); Eban, Mokwa (Bida basin); Kumaganum, Gashua, Geidam (Chad basin); Kuchi, Gwandi, Gwadabawa (Sokoto basin); Gombe, Potiskum, Kafarati (Upper Benue basin); Lokoja, Otukpa (Mid-Benue basin); and Malumfashi, Kano (Basement Complex). From the above study, it is recommended that further ground studies be carried out in the basement complexes of Nigeria. This is because there are little or no information on the temperature at depth due to the formation in those areas.
Supplemental Material
sj-docx-1-eea-10.1177_01445987231196917 - Supplemental material for Prospective geothermal well and heat catchment locations in Nigeria: Remote sensing interpretations and field validation
Supplemental material, sj-docx-1-eea-10.1177_01445987231196917 for Prospective geothermal well and heat catchment locations in Nigeria: Remote sensing interpretations and field validation by GE Akpan, ME Emetere, SA Afolalu and TC Jen in Energy Exploration & Exploitation
Footnotes
Nomenclature
Acknowledgements
The authors acknowledge the support of Miss Atinuke for aiding field collection of data.
Availability of data and material
The data of this data will be available on request.
Declaration of conflicting interests
The authors declared no potential conflicts of interest with respect to the research, authorship, and/or publication of this article.
Funding
The authors received no financial support for the research, authorship, and/or publication of this article.
Authors’ contributions
Akpan took the field measurement, analysed and wrote part of the paper. Emetere conceived the paper, downloaded and processed the remote sensing data, and wrote parts of the research. Jen wrote part of the paper.
Supplemental material
Supplemental material for this article is available online.
References
Supplementary Material
Please find the following supplemental material available below.
For Open Access articles published under a Creative Commons License, all supplemental material carries the same license as the article it is associated with.
For non-Open Access articles published, all supplemental material carries a non-exclusive license, and permission requests for re-use of supplemental material or any part of supplemental material shall be sent directly to the copyright owner as specified in the copyright notice associated with the article.