
Abstract
Closed-loop U-shaped geothermal wells show great potential owing to their special well-depth structure, which can provide a good flow rate and heat extraction. However, no advanced process parameter optimization method is available for U-shaped geothermal wells. To effectively describe the heat transfer processes of U-shaped geothermal wells, an analytical solution that couples transient heat conduction in the surrounding soil (or rocks) with the quasisteady heat transfer process in boreholes was developed. This modelling approach depends on many common elements, such as the thermophysical properties of the working fluid and series of resistances for various elements in the wellbore. Subsequently, based on the exergy analysis method, the optimal operating flow rate was defined and a design method for the optimal flow rate was developed.
Introduction
As The global warming issue becomes more prominent, the target of carbon neutral has prompted a shift in current energy systems. To reduce greenhouse gas emissions and keep the global temperature rise within 1.5 °C, a transition to sustainable energy must be made at the earliest (Blohm, 2021; Grubb, 1992). As a renewable and clean source of energy, geothermal energy offers the advantages of stability, efficiency, and continuity (Cadelano et al., 2019; Jung et al., 2015), and can be used for power generation and winter heating (Karlsdóttir et al., 2019; Liddell et al., 2016). The use of geothermal energy can reduce CO2 from energy supply sources by reducing its emission amount as well as from the energy consumption end by injecting and storing (Wu et al., 2021). Geothermal energy projects have great practical significance in regions with high-temperature geothermal resources to improve energy systems, revitalize the local economy, promote high-quality development, and realize the goals of achieving carbon peak as well as carbon neutrality.
Pumping–irrigation geothermal energy by extracting hot water from the formation, offering an advanced technology for the development and use of geothermal energy. However, subsequently, problems such as groundwater pollution, excessive sand production at the wellhead, hydrological decline, and even surface-water-level sinking may occur (Kamila et al., 2021; Kaya et al., 2011; Yin et al., 2021), which will increase the difficulty of subsequent geothermal development. Currently, these problems can be addressed using geothermal water recharge technology, which can achieve heat extraction without water and exhibits zero pollution as well as sustainability (van Oort et al., 2021).
Recently, closed-loop geothermal systems based on geothermal water recharge technology that consist of injection, horizontal, and production wells have been proposed (Fallah et al., 2021; Li, et al., 2019a; Sun et al., 2018). These systems are efficient and sustainable. Furthermore, they can reduce risks associated with drilling and improve the economy (Grayson and Gans, 2012); in addition, they demonstrate good applicability in the field (Song, et al., 2018a). Compared with geothermal systems based on the downhole coaxial heat exchanger, which are widely used at present (Beier et al., 2013; Davis and Michaelides, 2009; Li et al., 2020; Ma et al., 2020; Song et al., 2019; Song, et al., 2018b; Zhang et al., 2019), closed-loop U-shape geothermal wells can provide higher flow rate and better heat extraction owing to their special well-depth structure, thus showing great potential in the development and utilization of geothermal energy.
However, several current studies on U-shaped geothermal wells focus on their concept and nature (Li, et al., 2019a). Existing studies have developed mathematical models for flow and heat transfer to determine the relation between the well structure, wellbore size, process parameters, and working fluid physical parameters and the heating power and outlet temperature (Li, et al., 2019a; Liao et al., 2021; Lyu et al., 2020; Sun et al., 2019). The finding of such studies have laid the foundation for developing geothermal energy technology using U-shaped geothermal wells. However, many mathematical models have not been verified because of the lack of field or indoor experimental data. Additionally, a set of optimization design methods for their process parameters is lacking. These shortcomings have affected the early commercial usage of geothermal energy technology using U-shaped geothermal wells.
Exergy analysis, a method based on the second law of thermodynamics, considers both the “quality” and “quantity” of energy, and is a very useful tool for engineering design and optimization, particularly in power and energy systems (Moran and Enrico, 1994). Currently, the low utilization rate of geothermal energy has prompted the adoption of advanced methods for achieving more optimal process parameters for geothermal wells. However, the exergy balance is instrumental in the efficient use of resources because it can determine the location, type, and true magnitude of energy resource waste (Wall, 2003).
In geothermal systems, exergy analysis has been mainly employed in power systems (Hepbasli and Akdemir, 2004; Kurşun, 2020; Ozgener et al., 2005). For geothermal heating systems, simple exergy analysis was performed (Malana et al., 2020; Ozgener et al., 2005); however, the optimization of process parameters was not studied precisely. Furthermore, exergy analysis of geothermal wells mainly focuses on groundwater source heat pumps, and closed-loop U-shaped geothermal wells, which have been proposed in recent years, are rarely reported.
In this study, a mathematical model for the flow and heat transfer of U-shaped geothermal wells was developed to analyze the relation between different flow rates and the outlet fluid temperature as well as the relation between different flow rates and heat extraction. Based on the exergy analysis method, a design method for the optimal flow rate was developed and applied to a geothermal well in Xi’an, China, as an example. The findings of this study can expand the research ideas of the process parameter optimization of U-shaped geothermal wells and provide a theoretical basis for developing an optimal circulating-flow-rate design for U-shaped geothermal wells.
Physical Problem and mathematical model
Description Of U-shaped geothermal well operation
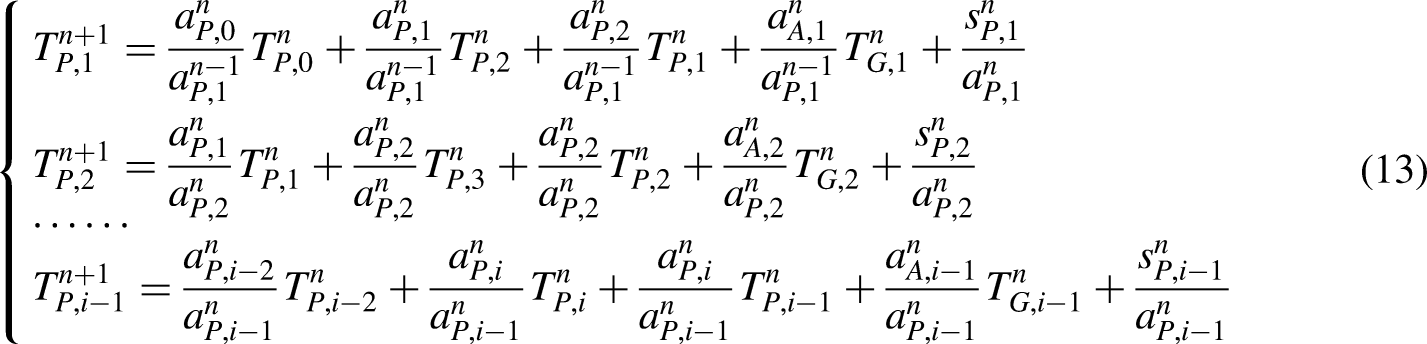
A U-shaped geothermal well was developed by joining a vertical well and a horizontal well. The developed well comprised four sections: a descending section, a diagonal section, a horizontal section, and an ascending section. Linear and heat-conducting cement was used in the horizontal section to improve heat transfer, whereas insulation materials were used in the ascending section to preserve heat loss. A working fluid medium was used to achieve heat exchange through the descending, diagonal, horizontal, and ascending sections and then through the heat pump system to complete the closed-loop cycle. The working fluid in a wellbore exchanges heat with the casing wall via forced convection, and heat conduction occurs in solid parts, including casings, cement sheaths, and rocks. This configuration breaks through the limitation of the low working flow of the downhole coaxial heat exchangers and simultaneously increases the use of high-temperature formation heat energy in the deepest part of the well. The working principle of the developed U-shaped geothermal well is presented in Figure 1.
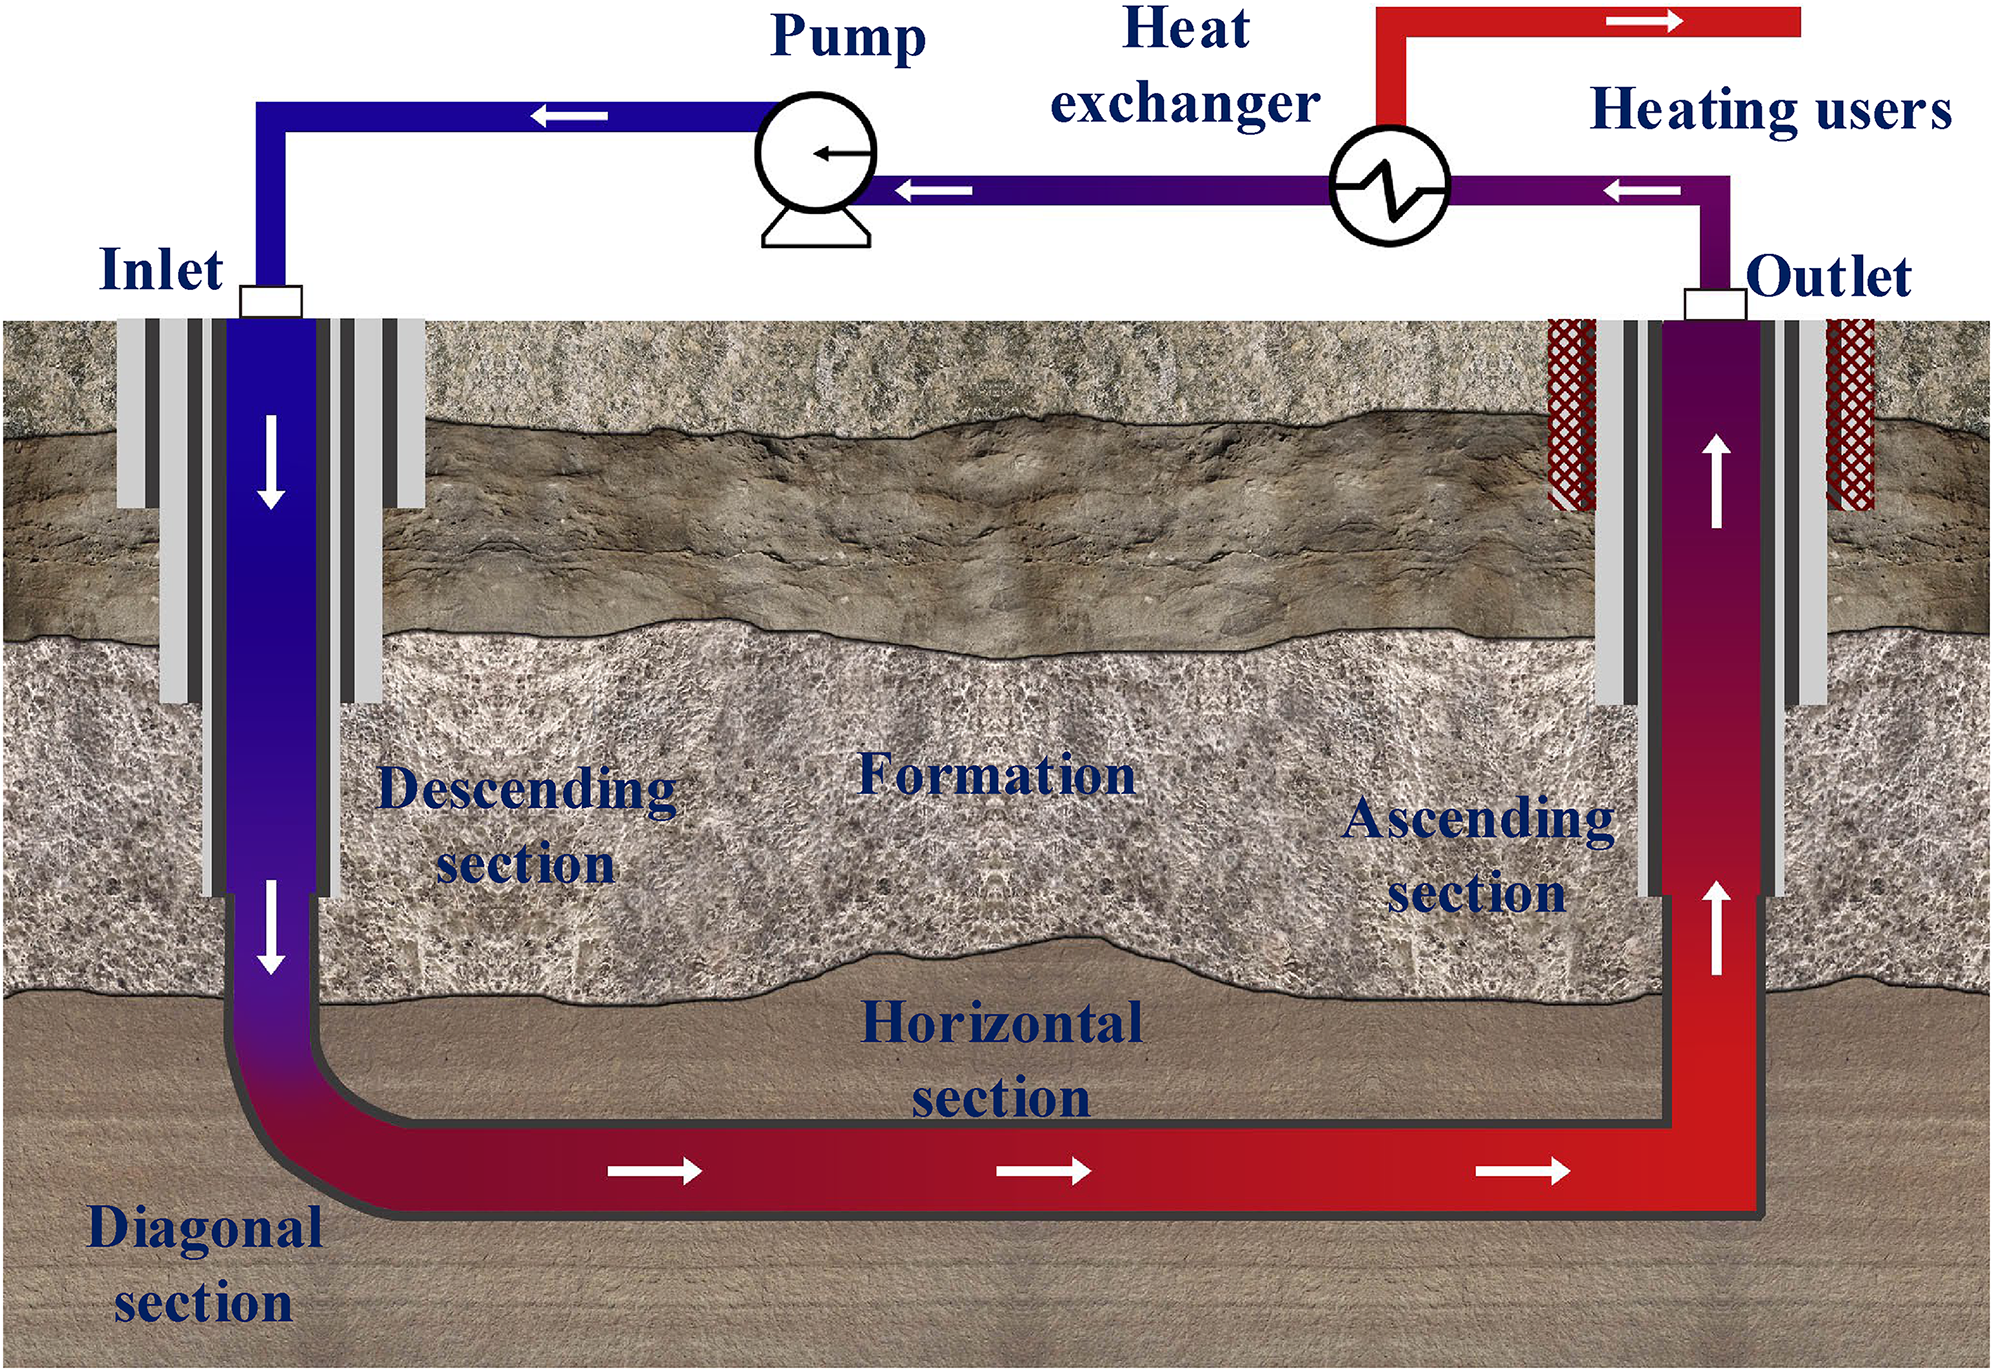
Schematic of a U-shaped geothermal well.
To formulate the energy equations needed to describe the thermal behaviour of the entire wellbore profile and surrounding formations, the following assumptions were made:
The first type of boundary condition is the formation set at an infinite distance from the wellbore; the formation follows a simple geothermal gradient distribution. In the International Ground Source Heat Pump Association method (Ahn et al., 2005), the change in heat transfer between the formation and the wellbore over time is reflected by the change in the thermal resistance of the formation over time. The circulating working fluid returning from the U-shaped geothermal well can fully exchange heat with the external environment through the heat exchanger, and the inlet temperature is maintained at ambient temperature. The equations do not consider radiation heat transfer or phase change of the working fluid in the downhole.
Mathematical Model
Considering the circulating working fluid in the borehole as the research object, a microelement section (the control body) was used for heat transfer analysis (Figure 2).
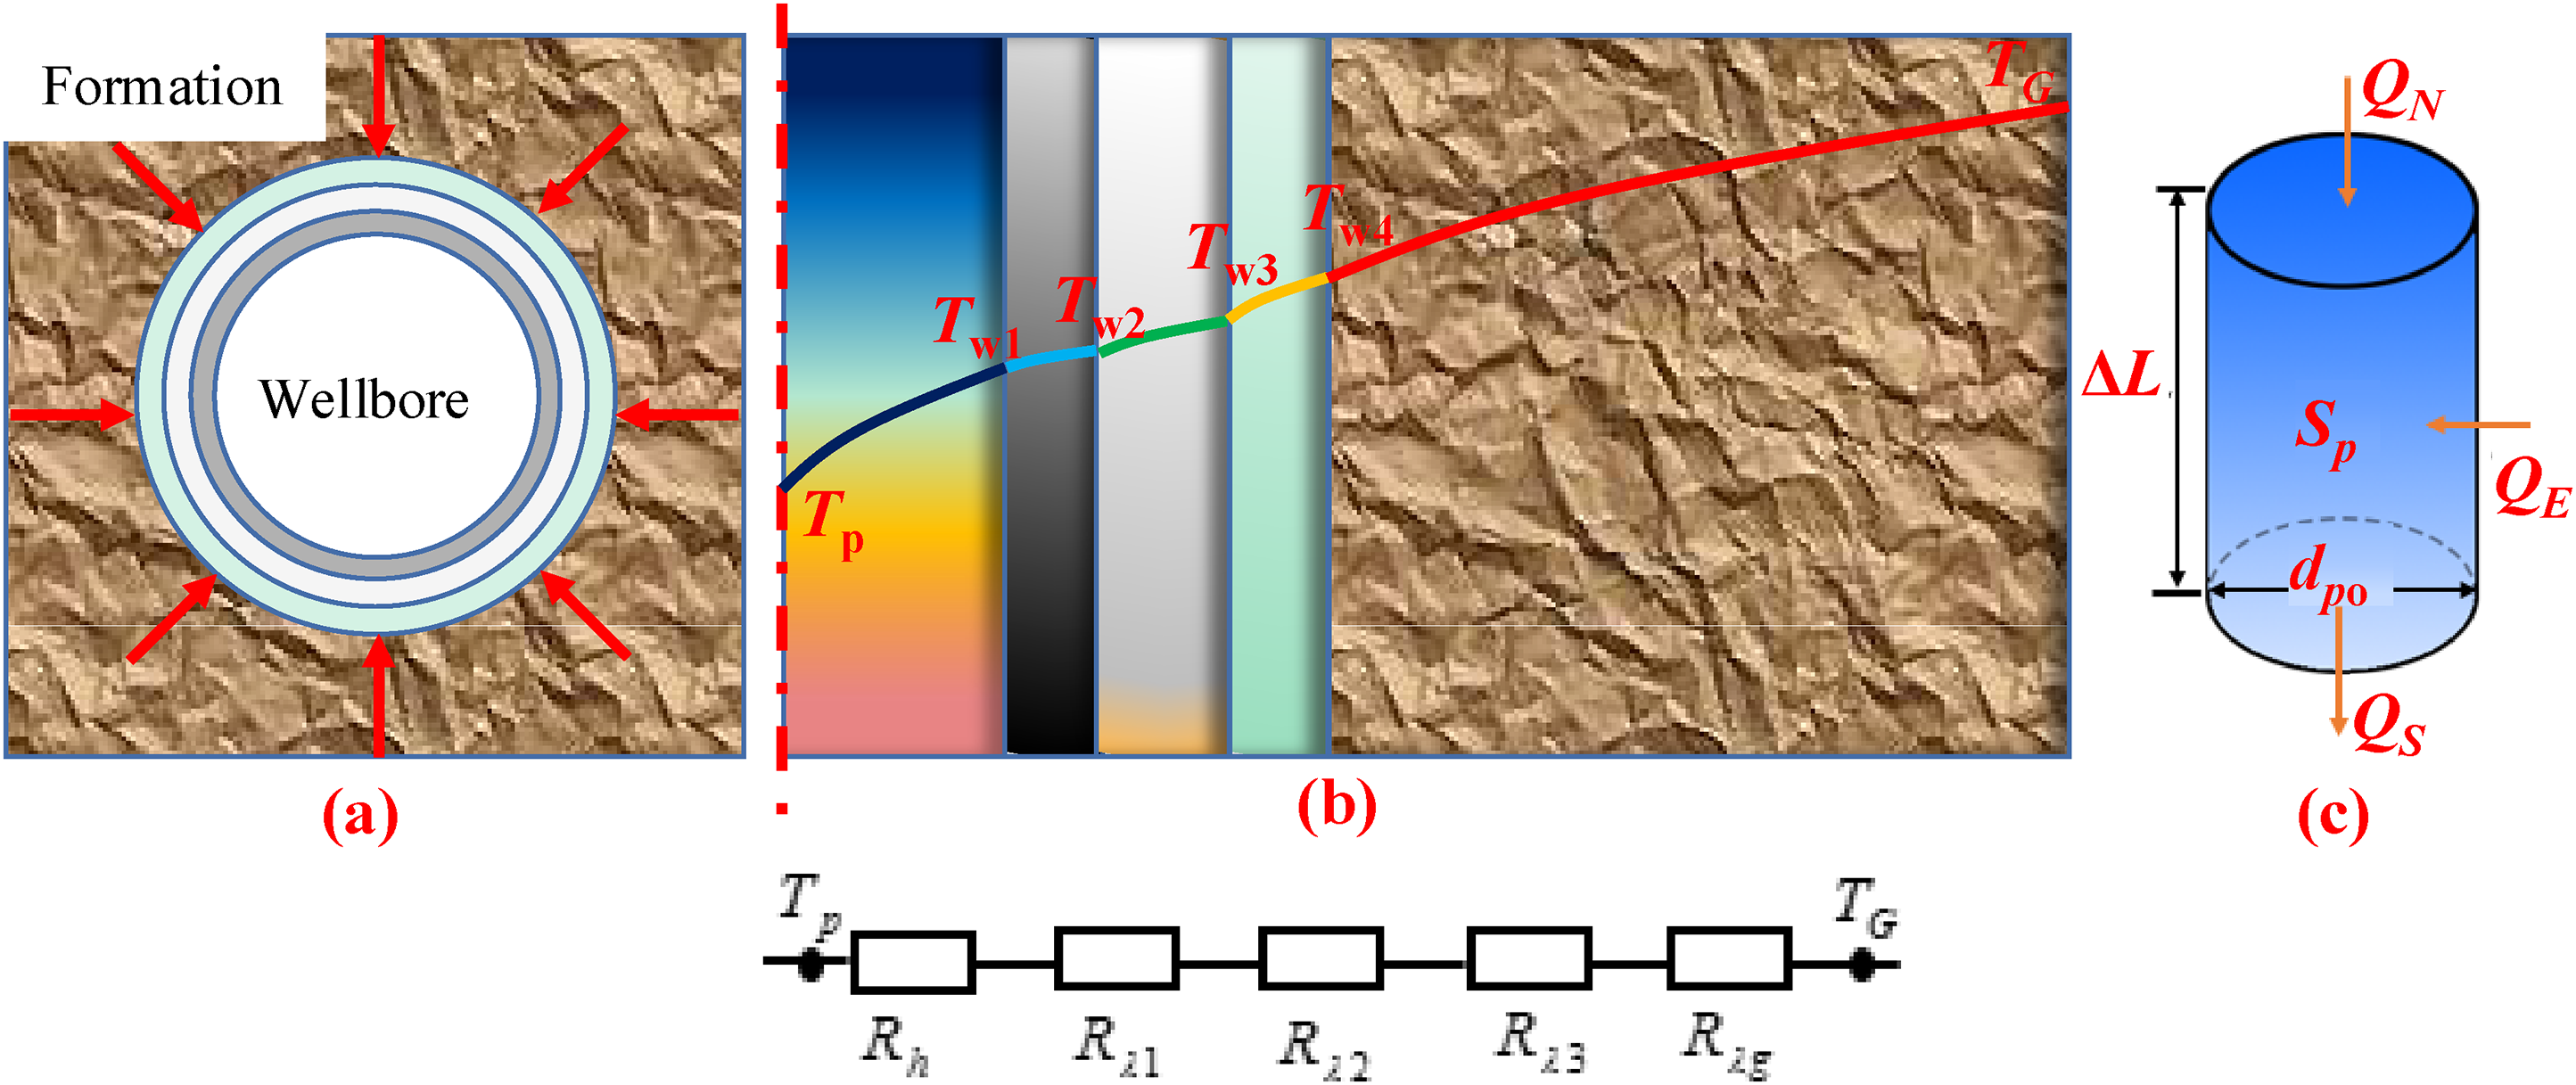
Schematic of the simplified heat transfer mathematical model.
Consider the heat flow inside the borehole during in period Δτ. The heat balance equation is expressed as follows:

To express the changes in various parameters with respect to the position and time, the average value is used to represent various energies. Thus, these energies can be further expressed as follows:


Hence, Eq. (1) can be expressed as
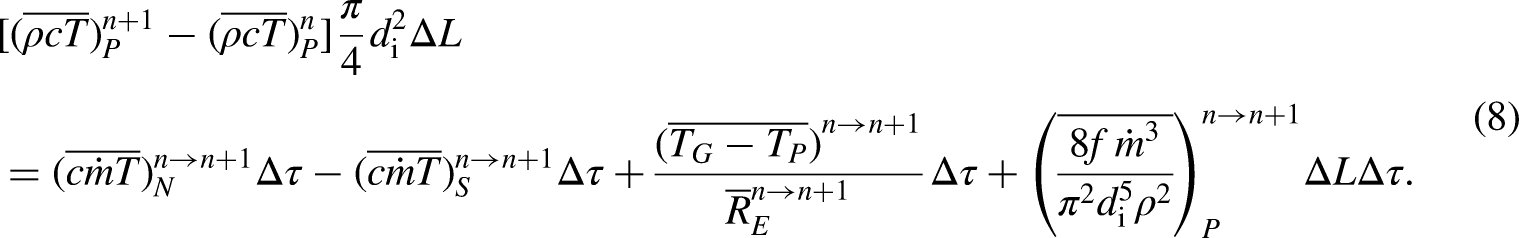
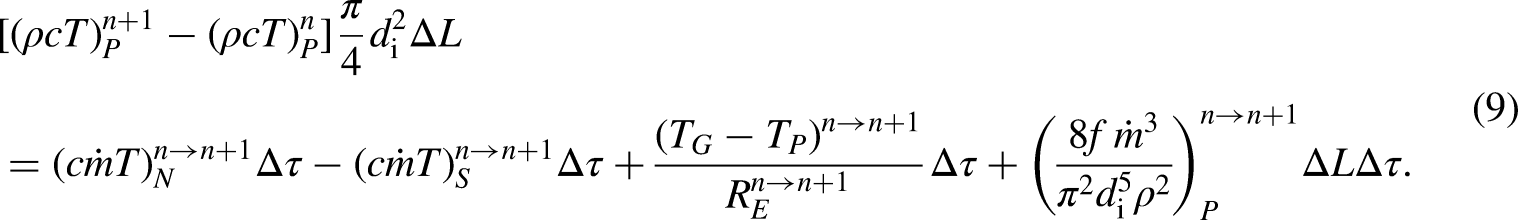
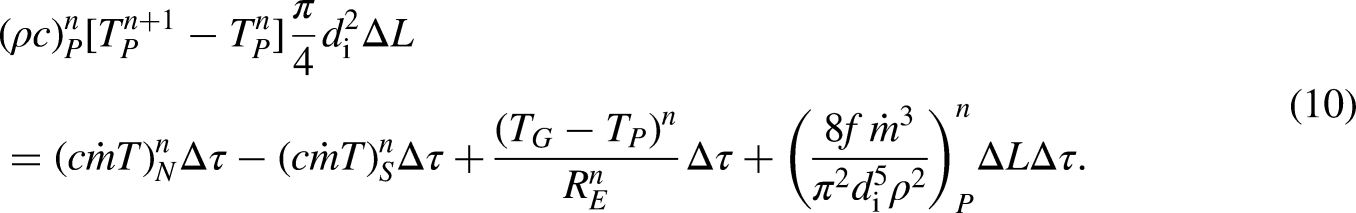
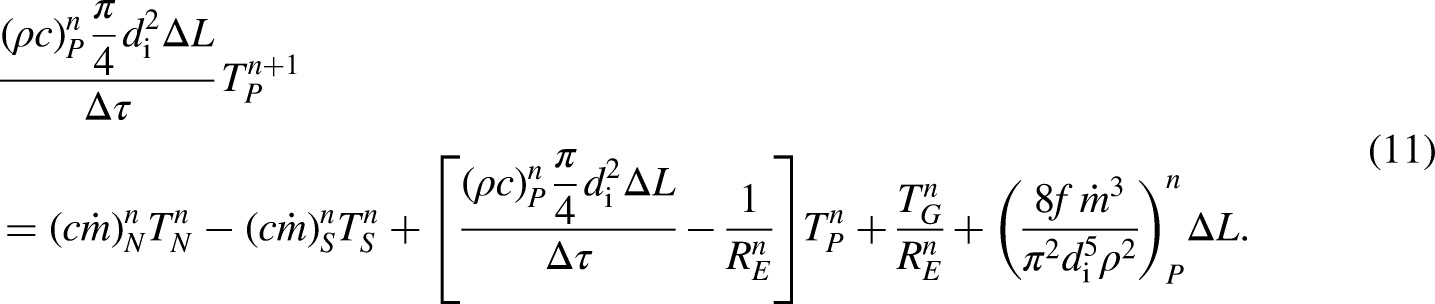

Extending Eq. (12) to the entire borehole, we achieve

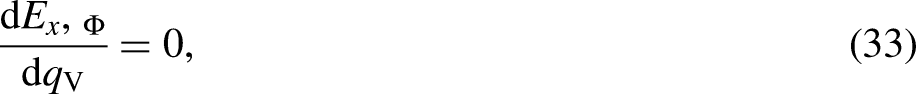
From the viewpoint of the first law of thermodynamics, the larger the Ф value, the better. However, this is not the case when considering the second law of thermodynamics. It should be considered in terms of the heat extraction availability. Heat exergy can be expressed in Eq. (15) (Ameri et al., 2010).

Using the proposed mathematical model, the heat extraction and outlet temperature can be calculated, and these values can be substituted in Eq. (15), yielding the heat exergy power of the U-shaped geothermal well.
Definite Solution conditions
The following definite solution conditions are required to achieve equation a closed equation.
Determination Of various thermal resistances
If the contact thermal resistance is not considered, the heat transfer process from the formation to the working fluid is described as follows. The formation first transfers heat to the cement ring by conduction (the ascending section has an insulating layer). Then, the cement ring transfers heat to the casing by conduction and the casing transfers heat to the working fluid by convection. According to the thermoelectric analogy for the theoretical calculation of heat transfer, each heat transfer link can be regarded as the heat transfer resistance. Thus, the sum of these thermal resistances RE in Eq. (6) and Eqs. (8)–(11) can be expressed as

In Eq. (16), the calculation of thermal resistance proceeds as follows:
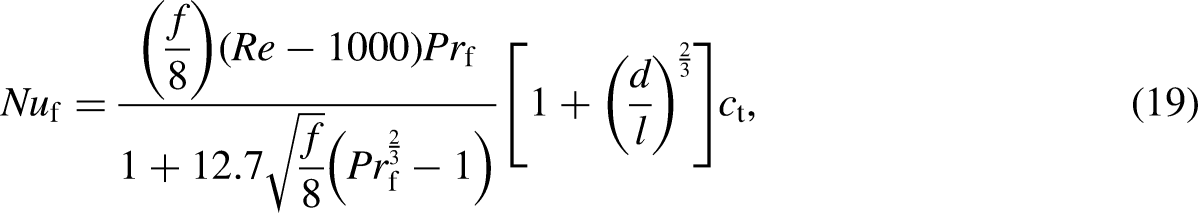
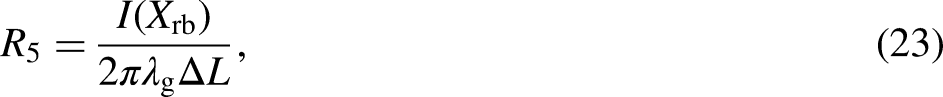
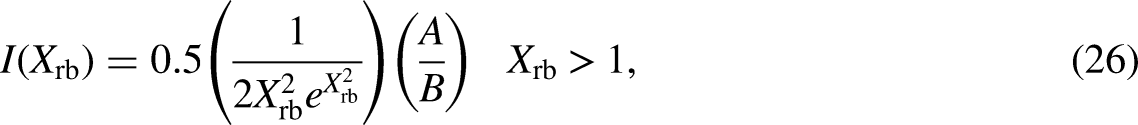
The thermal convection resistance (R1) can be calculated as In Eqs. (19) and (20), the range of application is Re = 3000–6,000,000 and Pr = 0.5–2000; moreover, ct denotes the correction coefficient of the physical property. For liquids, ct is determined by using Eq. (21): The thermal conduction resistance (R2, R3, and R4) is calculated using Eq. (22): The calculation of the thermal conduction resistance of the rock formation (R5) is based on Eqs. (23)–(24) (Ferreira et al., 2017): I(Xrb) in Eq. (23) can be determined using Eqs. (25)–(28) (Ahn et al., 2005):


Thermophysical Properties of the working fluid
Water is characterized by good thermodynamic properties and nontoxicity and is easy to obtain and odourless; thus, it is frequently used as a heat transfer working medium in the production of geothermal energy. The density, viscosity, thermal conductivity, and specific heat of water can be determined from data in the steam tables in SI units (Bacon and Parrish, 1973).
Initial Conditions
In the heat transfer process in the wellbores, the formation temperature can generally be set as the initial temperature of the wellbore:

Boundary Conditions
Based on the conditions for heat transfer between the U-shaped geothermal well and the rock formation, the circulating water inlet is set as a mass flow inlet boundary condition, which can be expressed as


Model Solution
The temperature distribution in the well can be calculated (Figure 2). The solution steps are as follows: Step 1: The basic parameter values, including the well structure, borehole size, geothermal gradient, the inlet temperature of the working fluid, and injection rate are provided as inputs.
Step 2: The time step is meshed and estimated.
Step 3: The initial wellbore temperature distribution is assumed.
Step 4: The thermophysical properties of the working fluid are determine.
Step 5: Various thermal resistances are calculated using Eqs. (16)–(28).
Step 6: The wellbore temperature distribution is calculated using Eq. (13).
Step 7: The temperature difference between steps 6 and 3 is compared. If the difference is greater than the required accuracy, the previous temperature in step 3 is replaced by substituting the temperature calculated in step 6; then the temperature distributions are recalculated by repeating steps 4–6. If the temperature difference is less than the required accuracy, step 8 is performed.
Step 8: The heat extraction power of the working fluid is calculated using Eq. (14).
Step 9: The heat exergy power of the working fluid is calculated using Eq. (15).
Step 10: The temperature distribution of the entire wellbore, the heat extraction power, and the heat exergy power of the working fluid at different times are output.
Figure 3 depicts a flowchart to help understand the solution for the mathematical model.
Results and discussion
Experimental Validation of the mathematical model
The mathematical model must be validated using experimental data or other calculated results to determine whether the mathematical model can accurately describe the temperature distribution and heat extraction using a U-shaped geothermal well. This work uses the test data of in situ experimental platform a U-shaped geothermal well to verify the mathematical model.
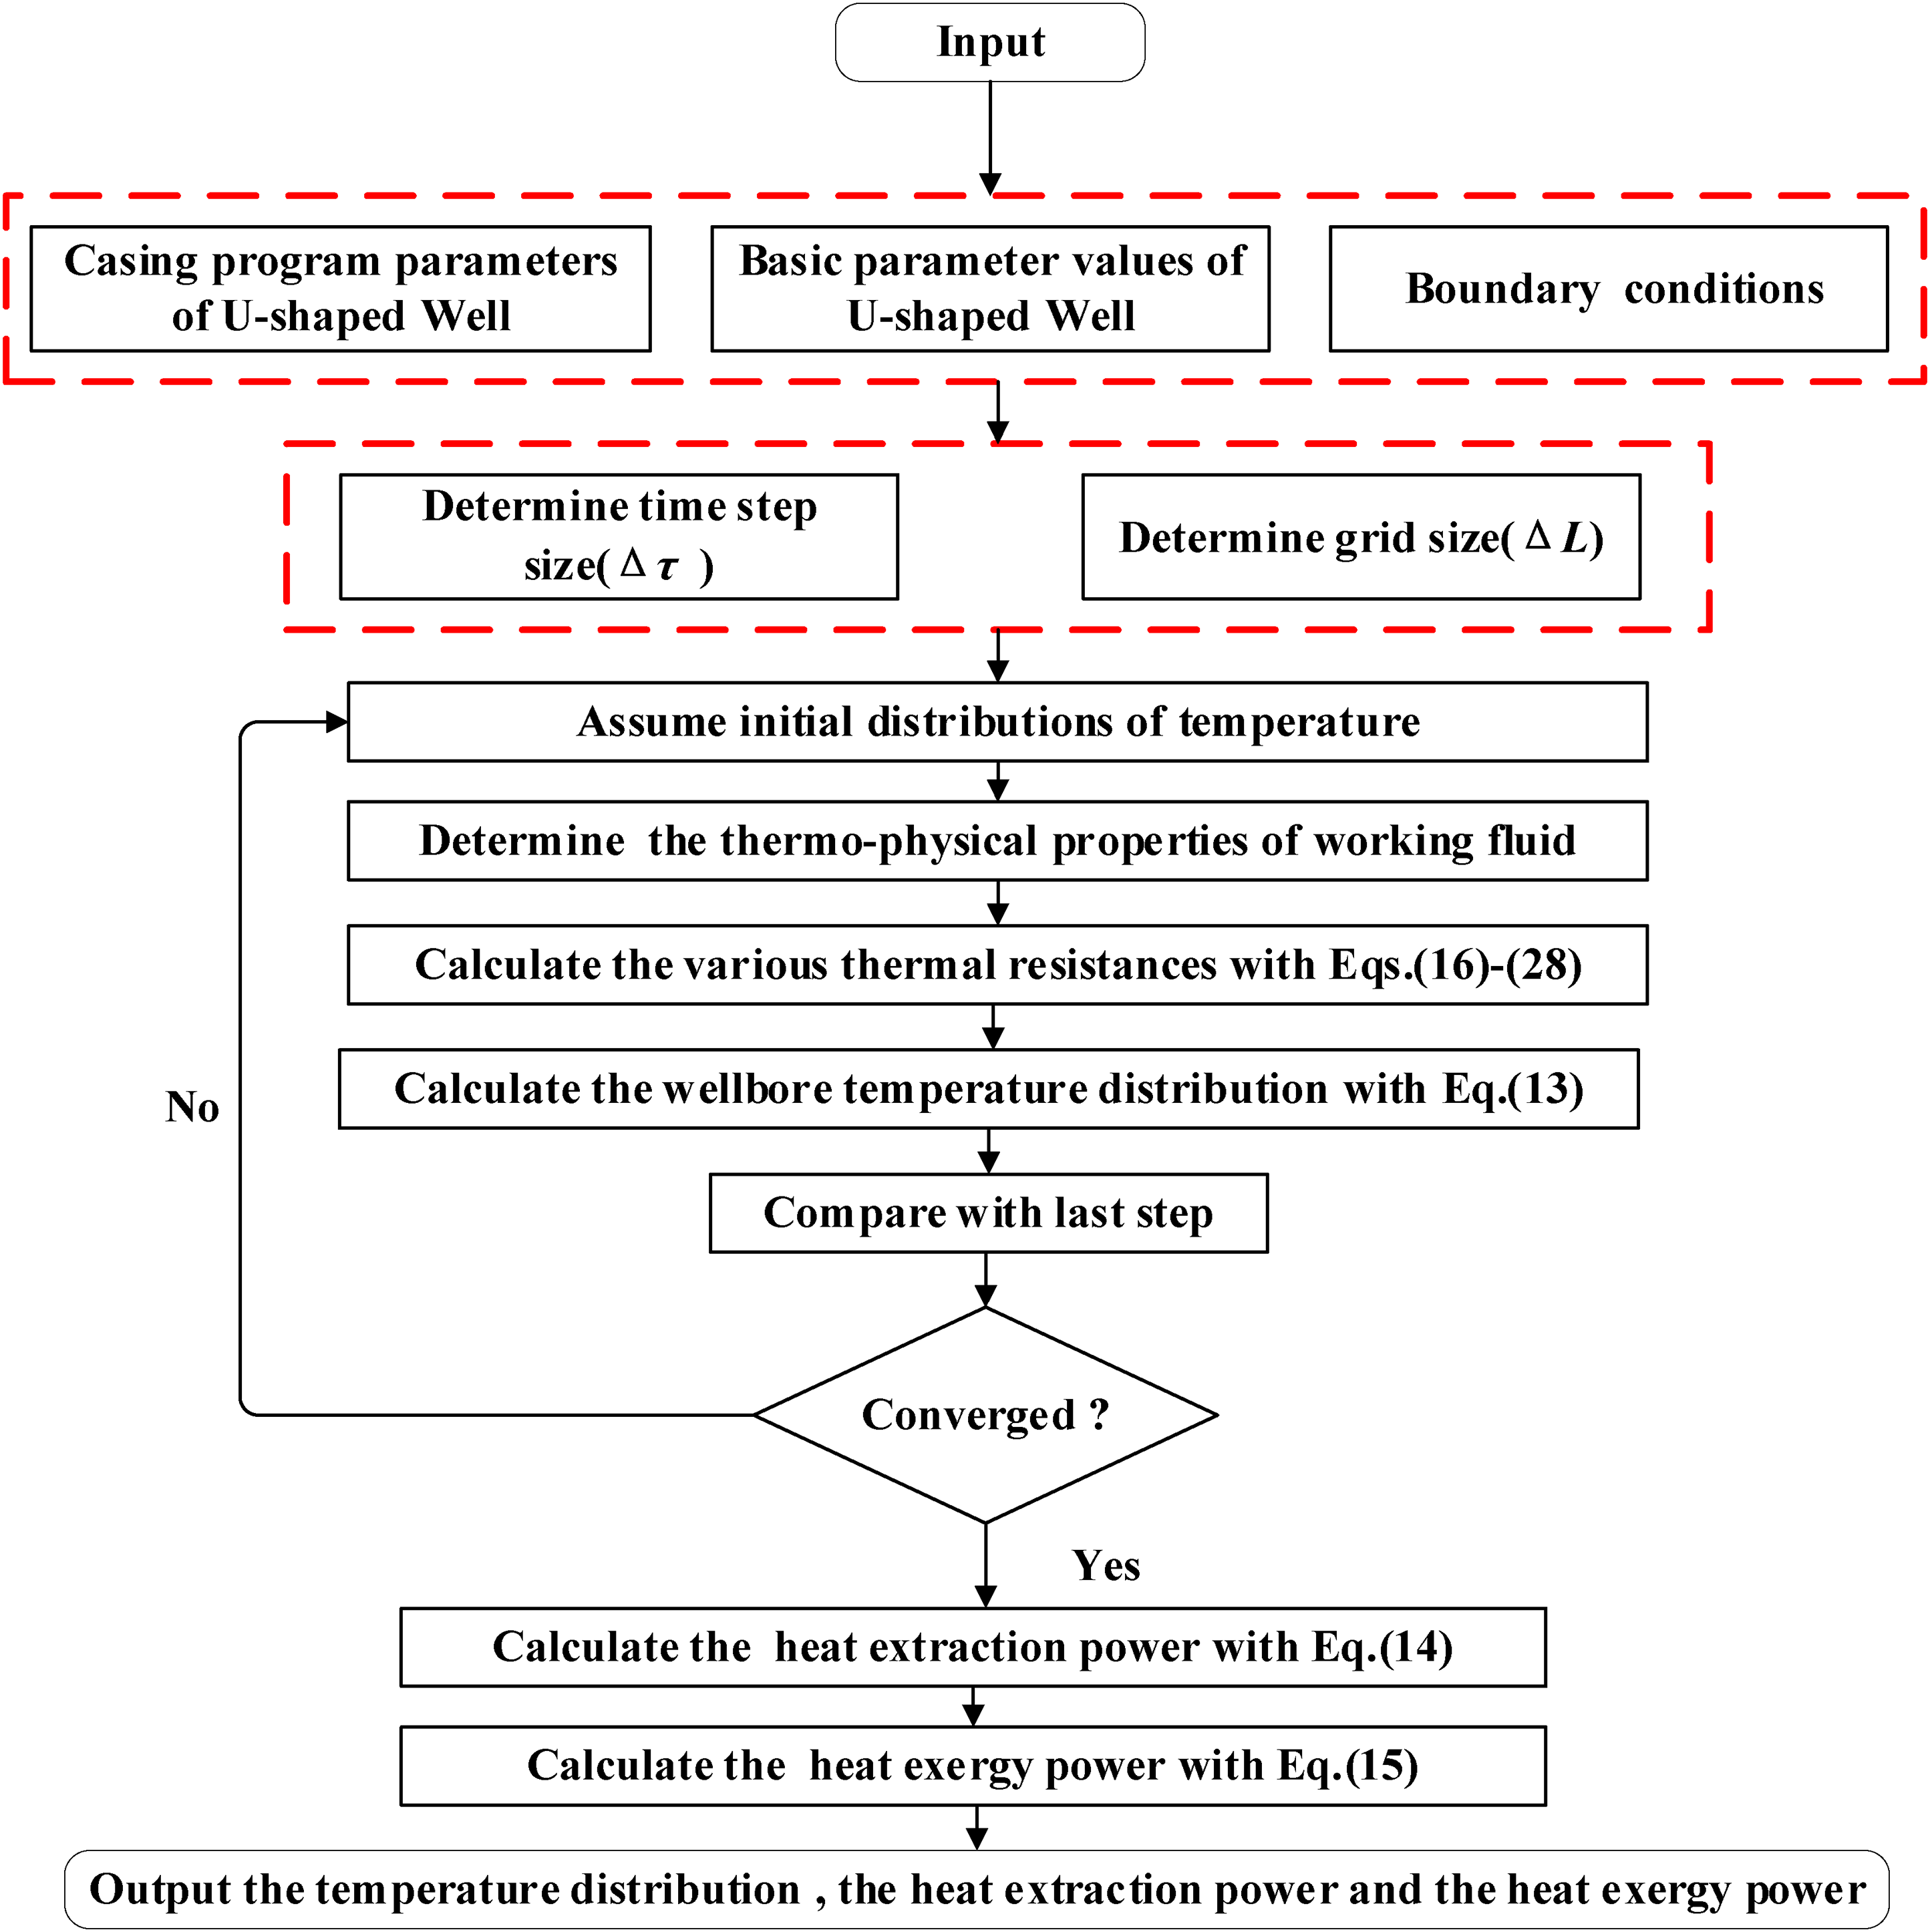
Flowchart of the mathematical model solution.
Experimental System and basic parameters
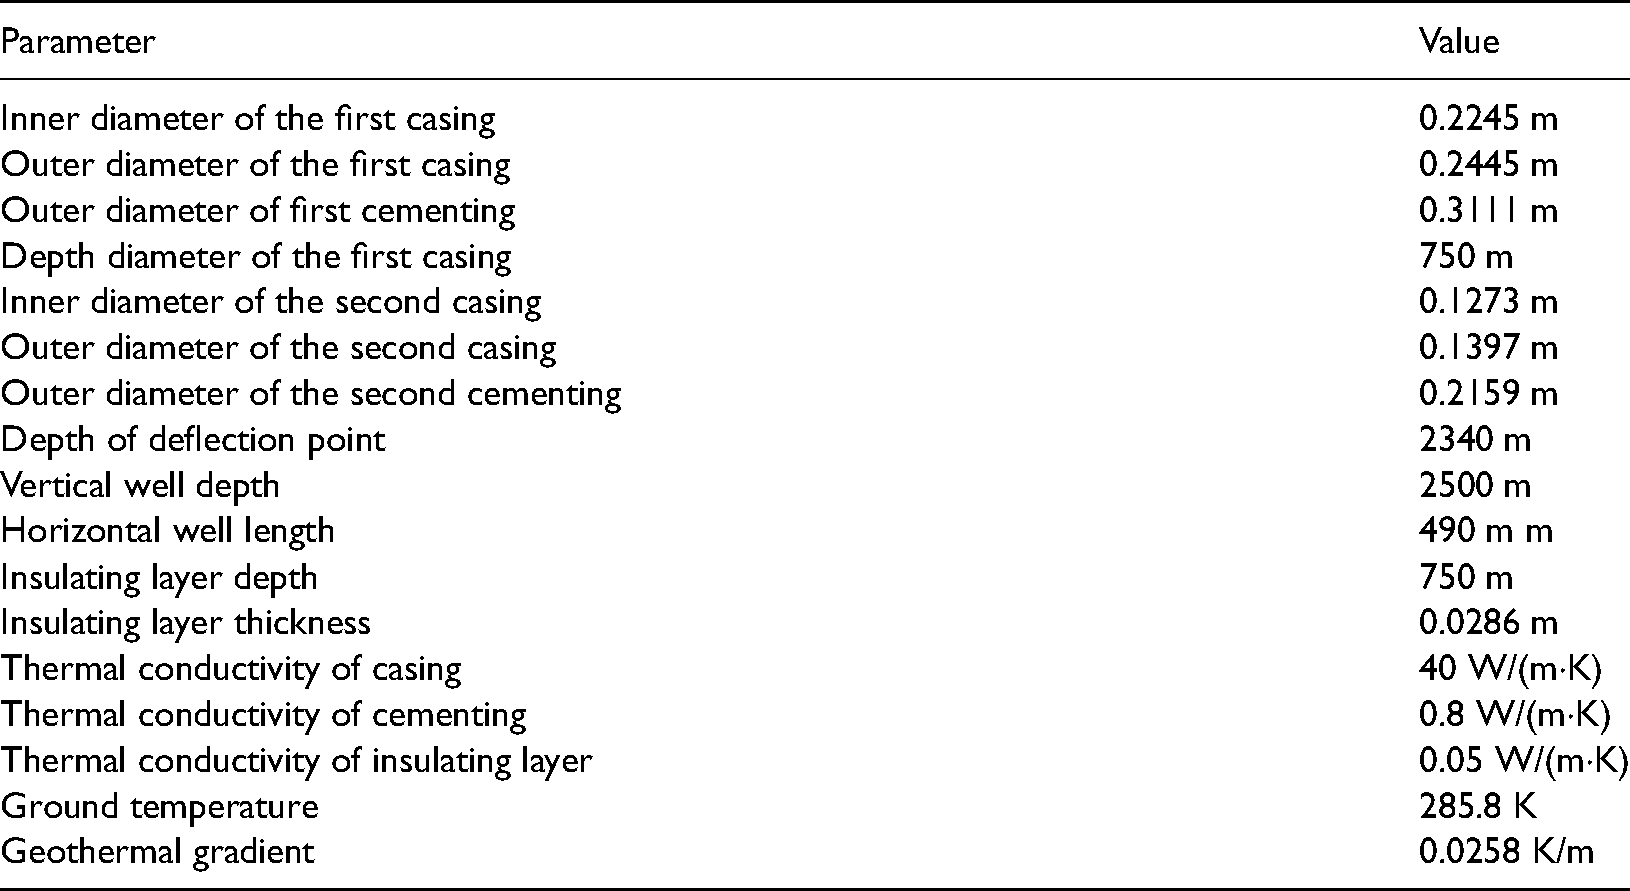
To accelerate the process of middle deep geothermal energy usage, Yanchang Petroleum International Exploration and Development Co. Ltd, set up an in situ experimental platform of a U-shaped geothermal well in a community in Xi’an. The basic parameters of the U-shaped geothermal well are presented in Table 1.
Basic parameters of the U-shaped geothermal well.
The experimental detection system and test equipment are presented in Figures 4 and 5 (Li et al., 2018; Li, et al., 2019b).
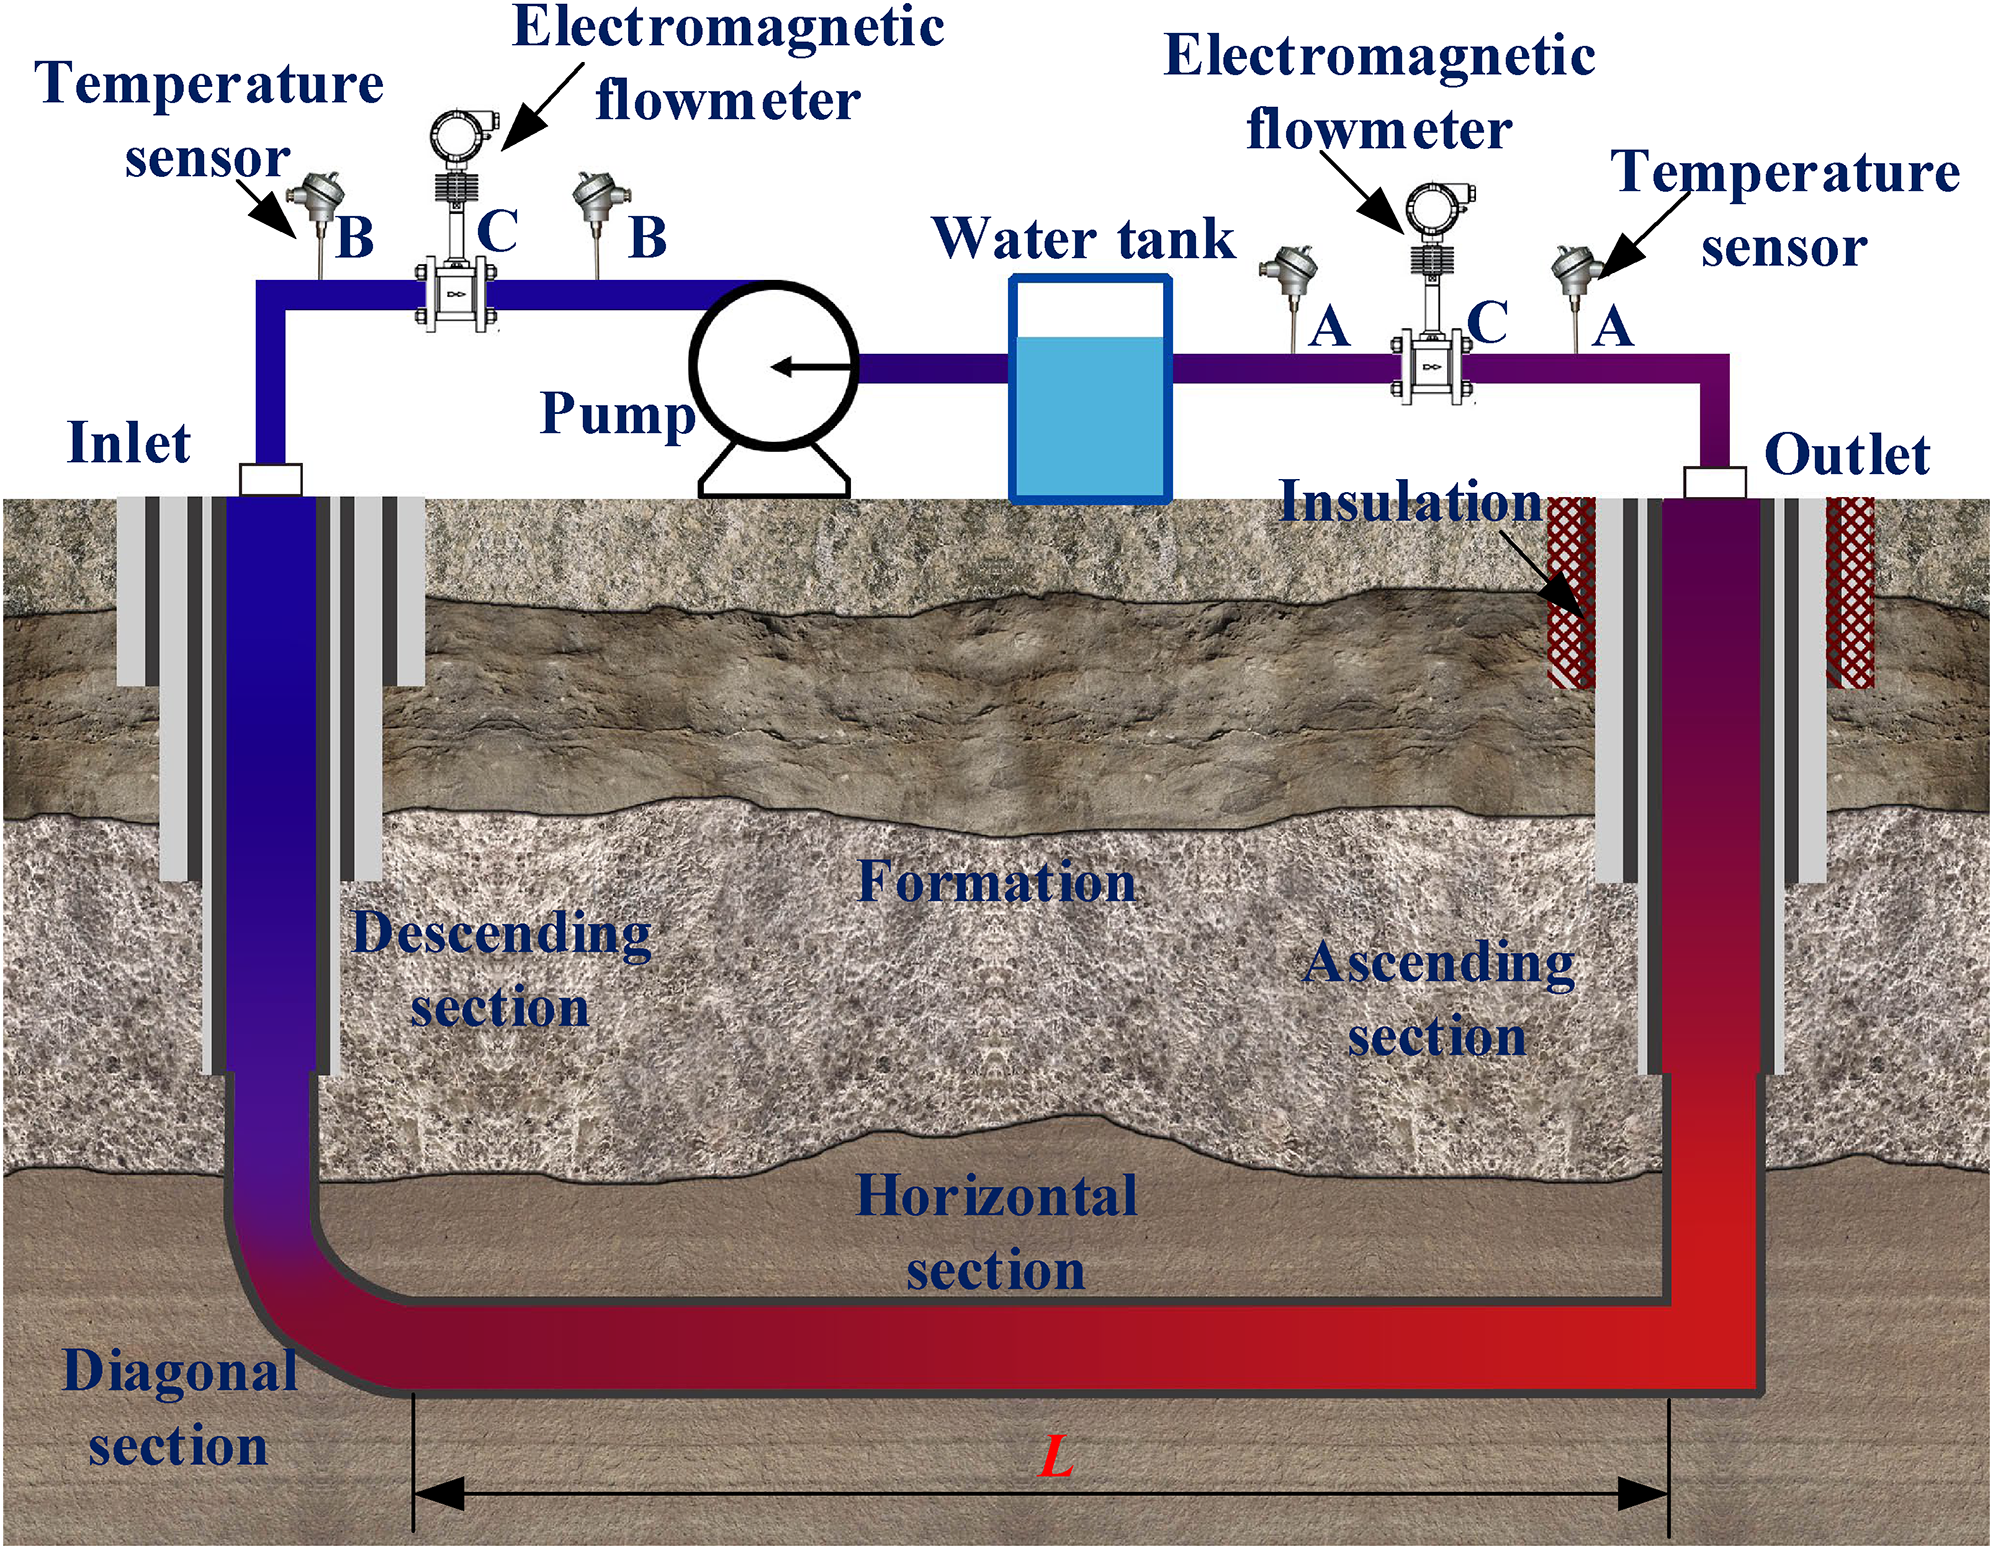
Experimental tube system and detection system.
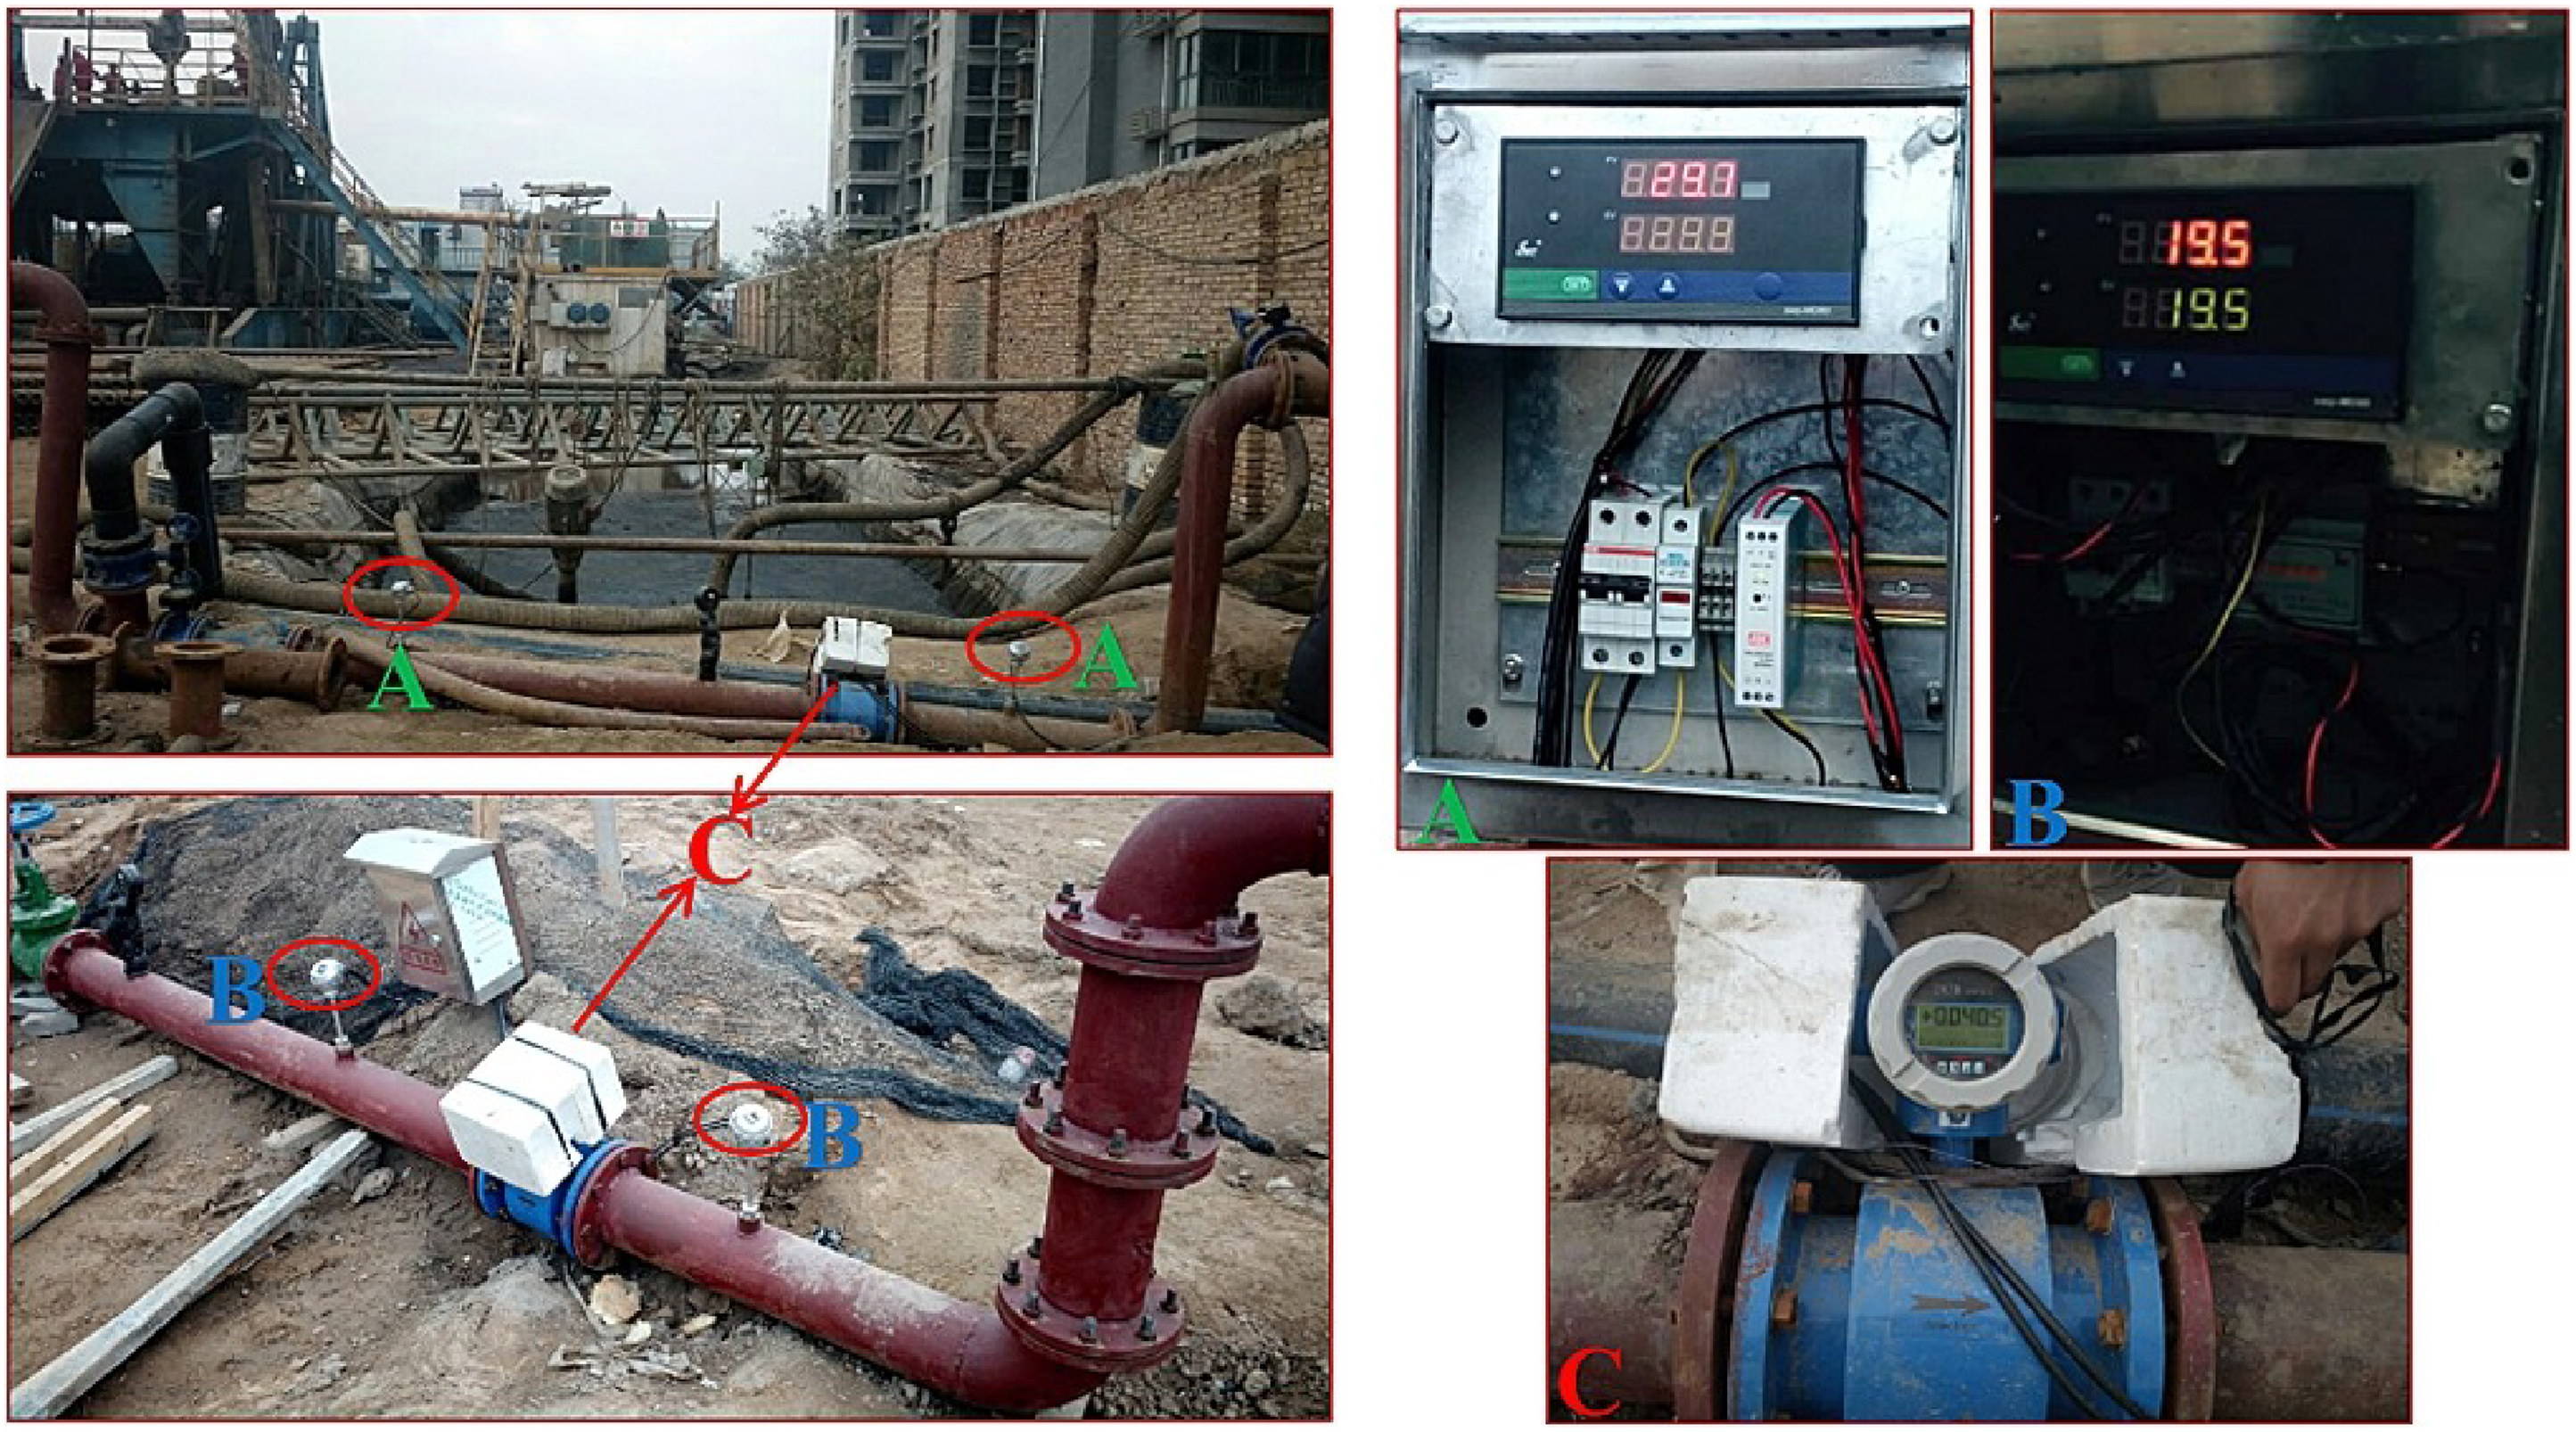
Experimental site and test equipment; A) temperature sensor of the outlet well, B) temperature sensor of the inlet well, and C) electromagnetic flowmeter.
Comparison Between simulation and experimental results
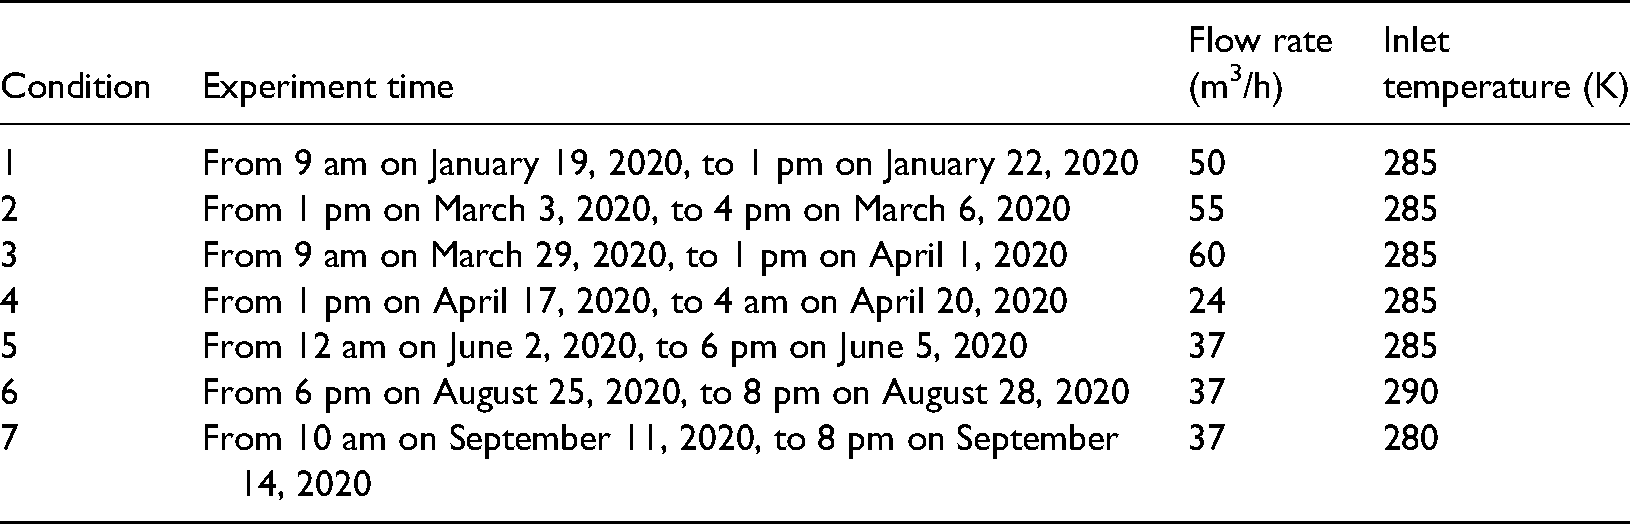
A series of experiments were conducted under seven sets of condition, and the duration of each experiment performed under each set of conditions exceeded 72 h. Table 2 presents the experimental parameters of each set of experimental conditions.
Experimental duration and parameters of the working conditions.
The inlet and outlet temperatures (Tin and Tout, respectively) are the average of two temperature sensors recorded at the same time. The flow rate is the average of the instantaneous flow rates of two flow sensors. Figure 6 presents the measured and theoretically calculated values of the outlet temperature under each condition.
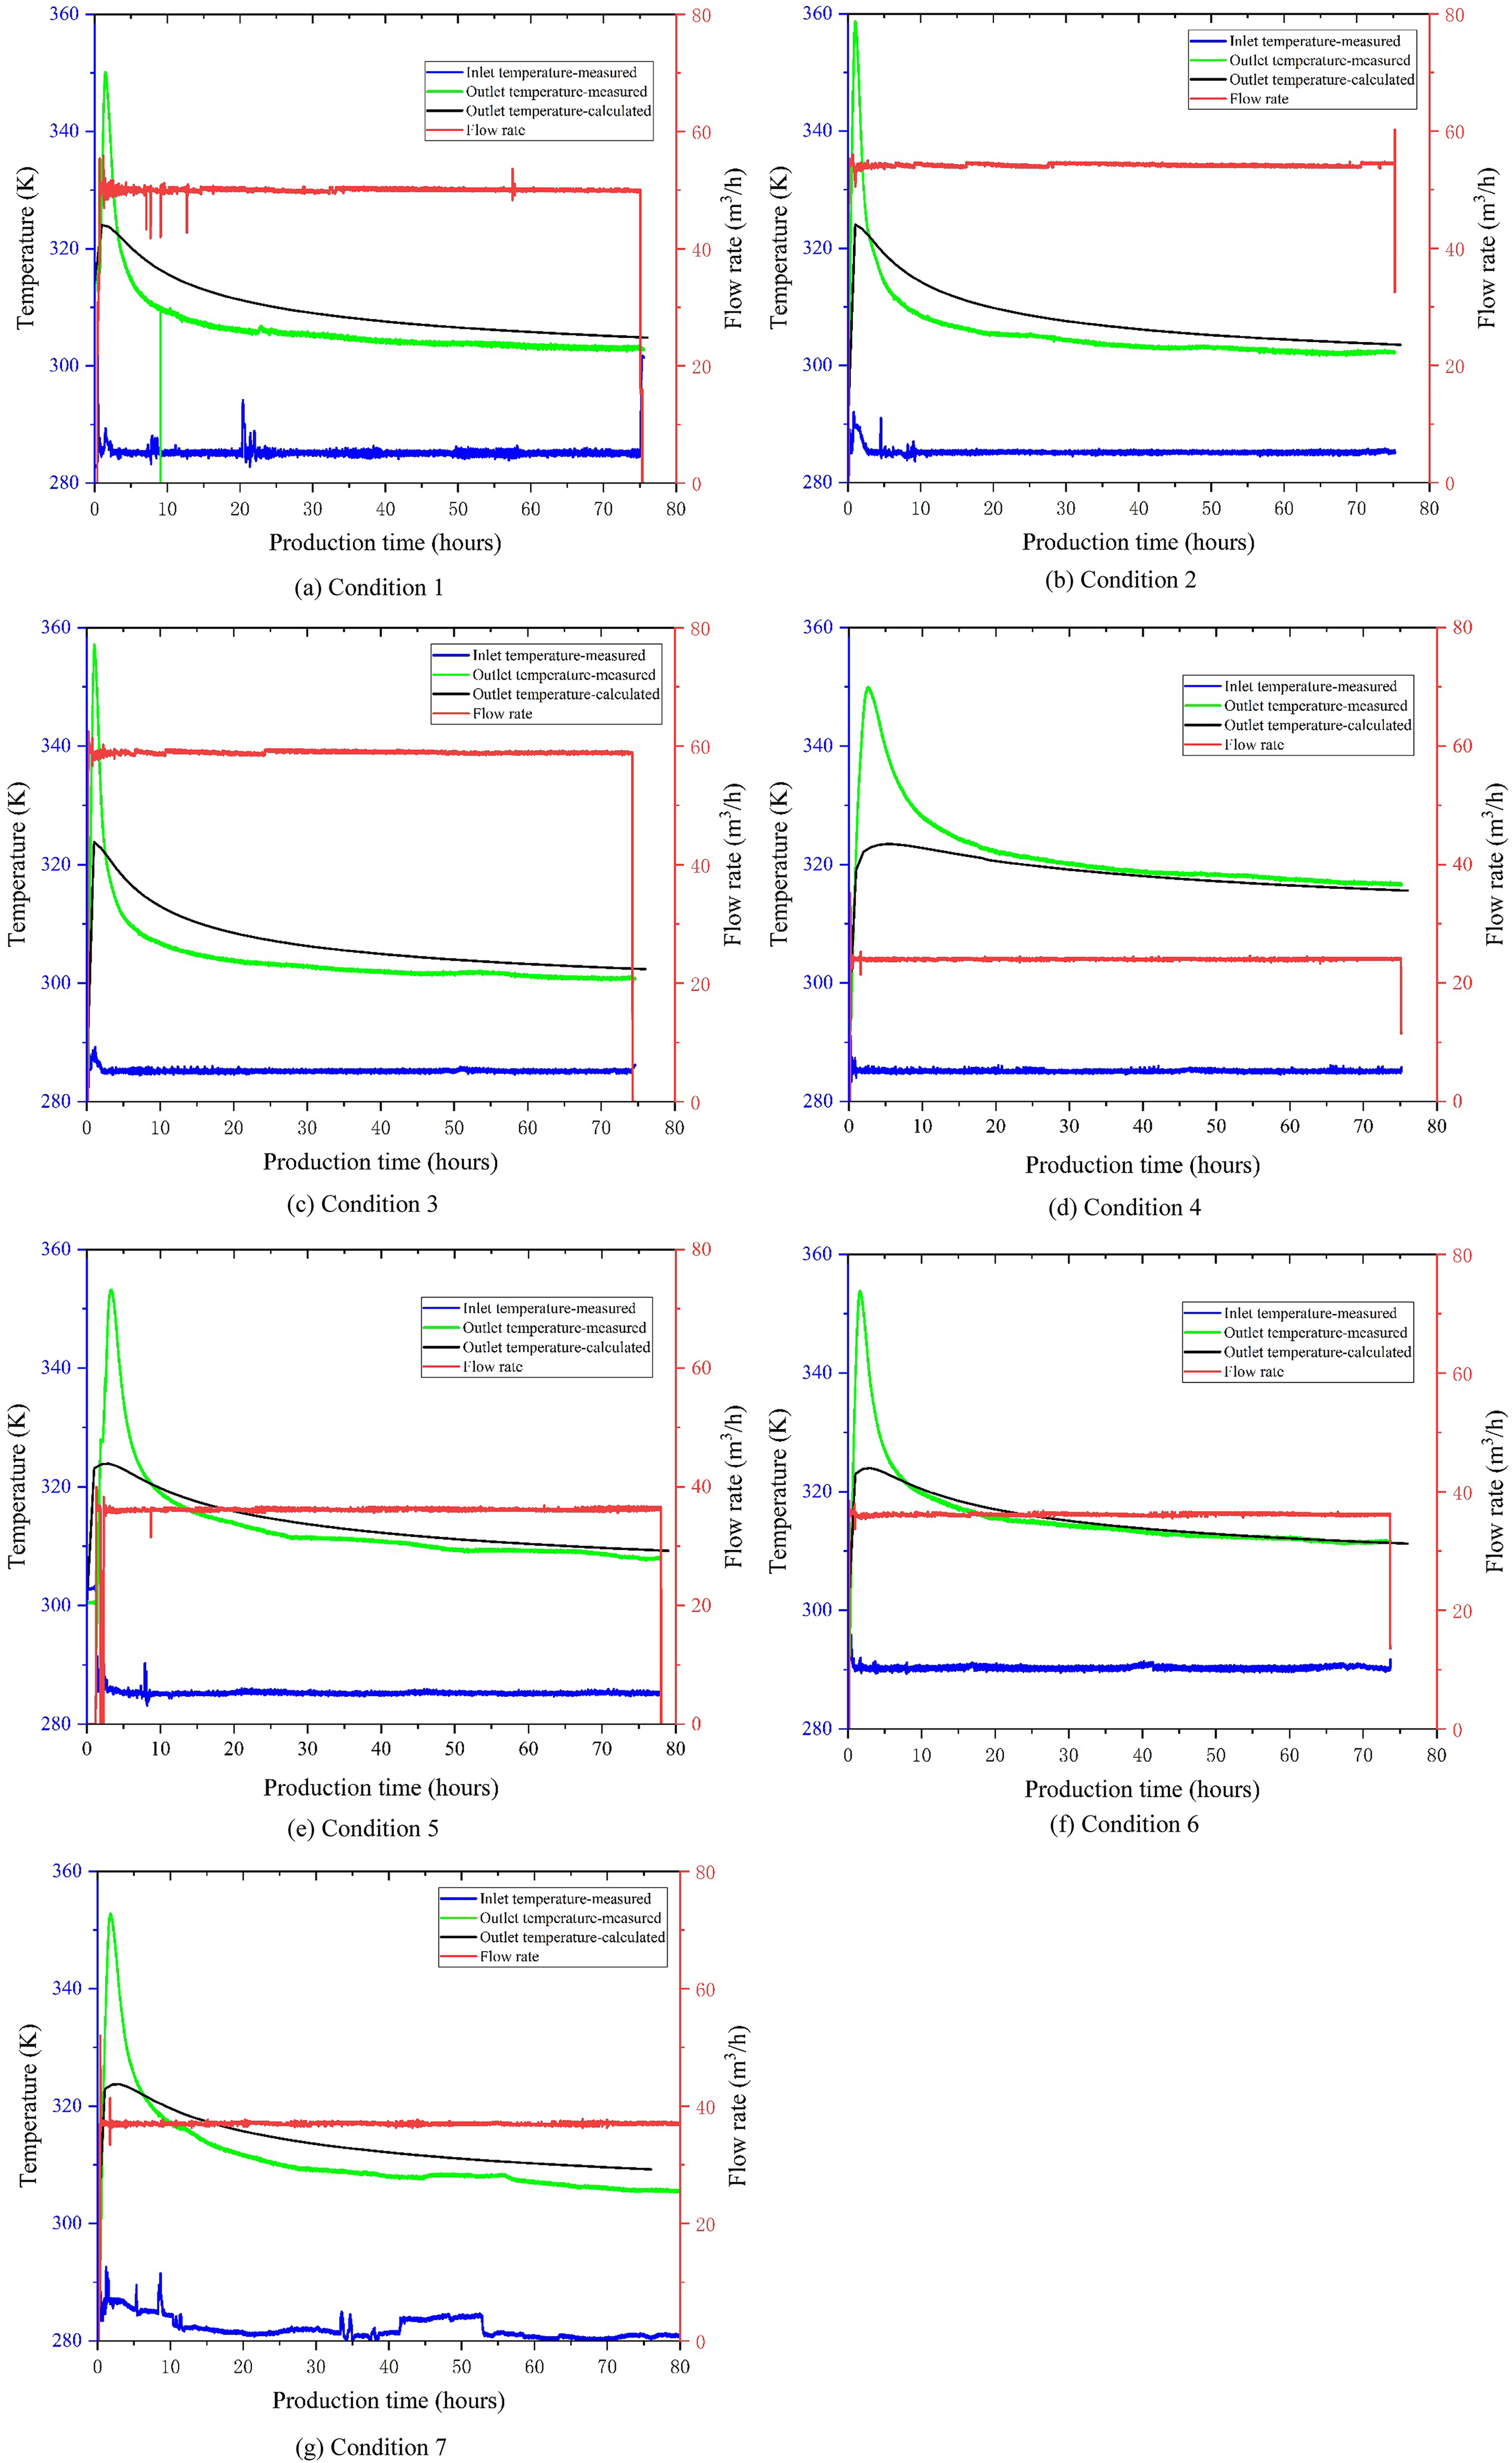
Comparison of experimental and calculated results of outlet temperature under each condition.
The comparison results indicate a considerable difference between the calculated and experimental results in the initial stage of the experiment. After approximately 9 h, the experimental results are almost the same as the calculated results. This is because the well was filled with water before the start of the experiment; thus, the water that initially exited the well was in full contact with the formation. Thus, the experimentally obtained outlet temperature is considerably higher than the calculated one. The experiment did not enter a normal cycle until all the original water in the well was changed, and the experimentally obtained outlet temperature corresponds to the calculated one.
Table 3 presents the experimental and calculates results obtained under each working condition after 72 h of circulation, as well as the relative error between the two results.
Comparison of the experimental and calculated results after 72 h.
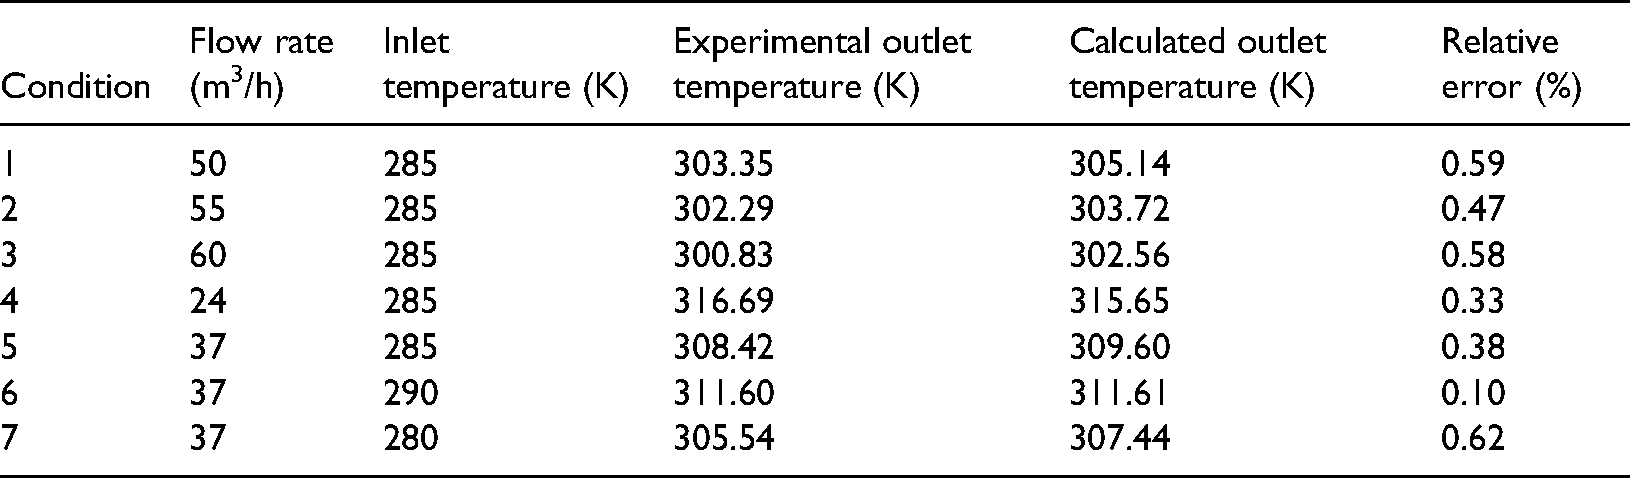
Figure 6 and Table 3 show that a certain difference between the calculated and experimental results. The difference in the results arises from the mathematical model that was developed herein under some assumptions to reduce the difficulty of the solution. However, considering the change trend, the calculated results agree well with the experimental results. Especially, under conditions 2, 4, 5, and 6, the relative error and maximum temperature difference between the calculated and experimental results are <0.5% and <1.5 K, respectively. In contrast, the relative error under conditions 1 and 7 is larger and the maximum temperature difference is approximately 2 K. The reason for these results is closely related to the experimental process. During the experiments, the inlet temperature under conditions 1 and 7 was unstable compared with the other conditions (Figure 6), causing a considerable change in the working fluid temperature, thus resulting in a large relative error. However, objectively speaking, the developed mathematical model achieves high calculation accuracy, accurately predicting the temperature of the circulating working fluid in the U-shaped geothermal well.
Sensitive Factor analysis
The most important parameters required for evaluating the performance of U-shaped geothermal wells are the outlet temperature and heat extraction power. The outlet temperature determines the heat energy availability, and the heat extraction power determines the heating capacity of geothermal wells.
After the U-shaped geothermal well was developed and put into operation, its well structure was fixed, while the relevant parameters of the working fluid, pipe string, and formation were also maintained constant. Additionally, for the simplicity of operation, the inlet temperature was generally the same as the ambient temperature and was considered to remain constant. Therefore, the circulating flow rate of the working fluid in the U-shaped geothermal well is the key process parameter that can be designed optimally.
Therefore, a geothermal well in Xi’an, China, was considered as an example to study the variation in the outlet temperature and heat extraction power with respect to the flow rate during the heating period.
Basic Parameters
The heating period in Xi’an generally starts on November 15 and lasts until March 15 of the following year, ∼120 days. The temperature data from November 15, 2019, to March 15, 2020, were obtained from the Xi’an Meteorological Bureau and are shown in Figure 7.
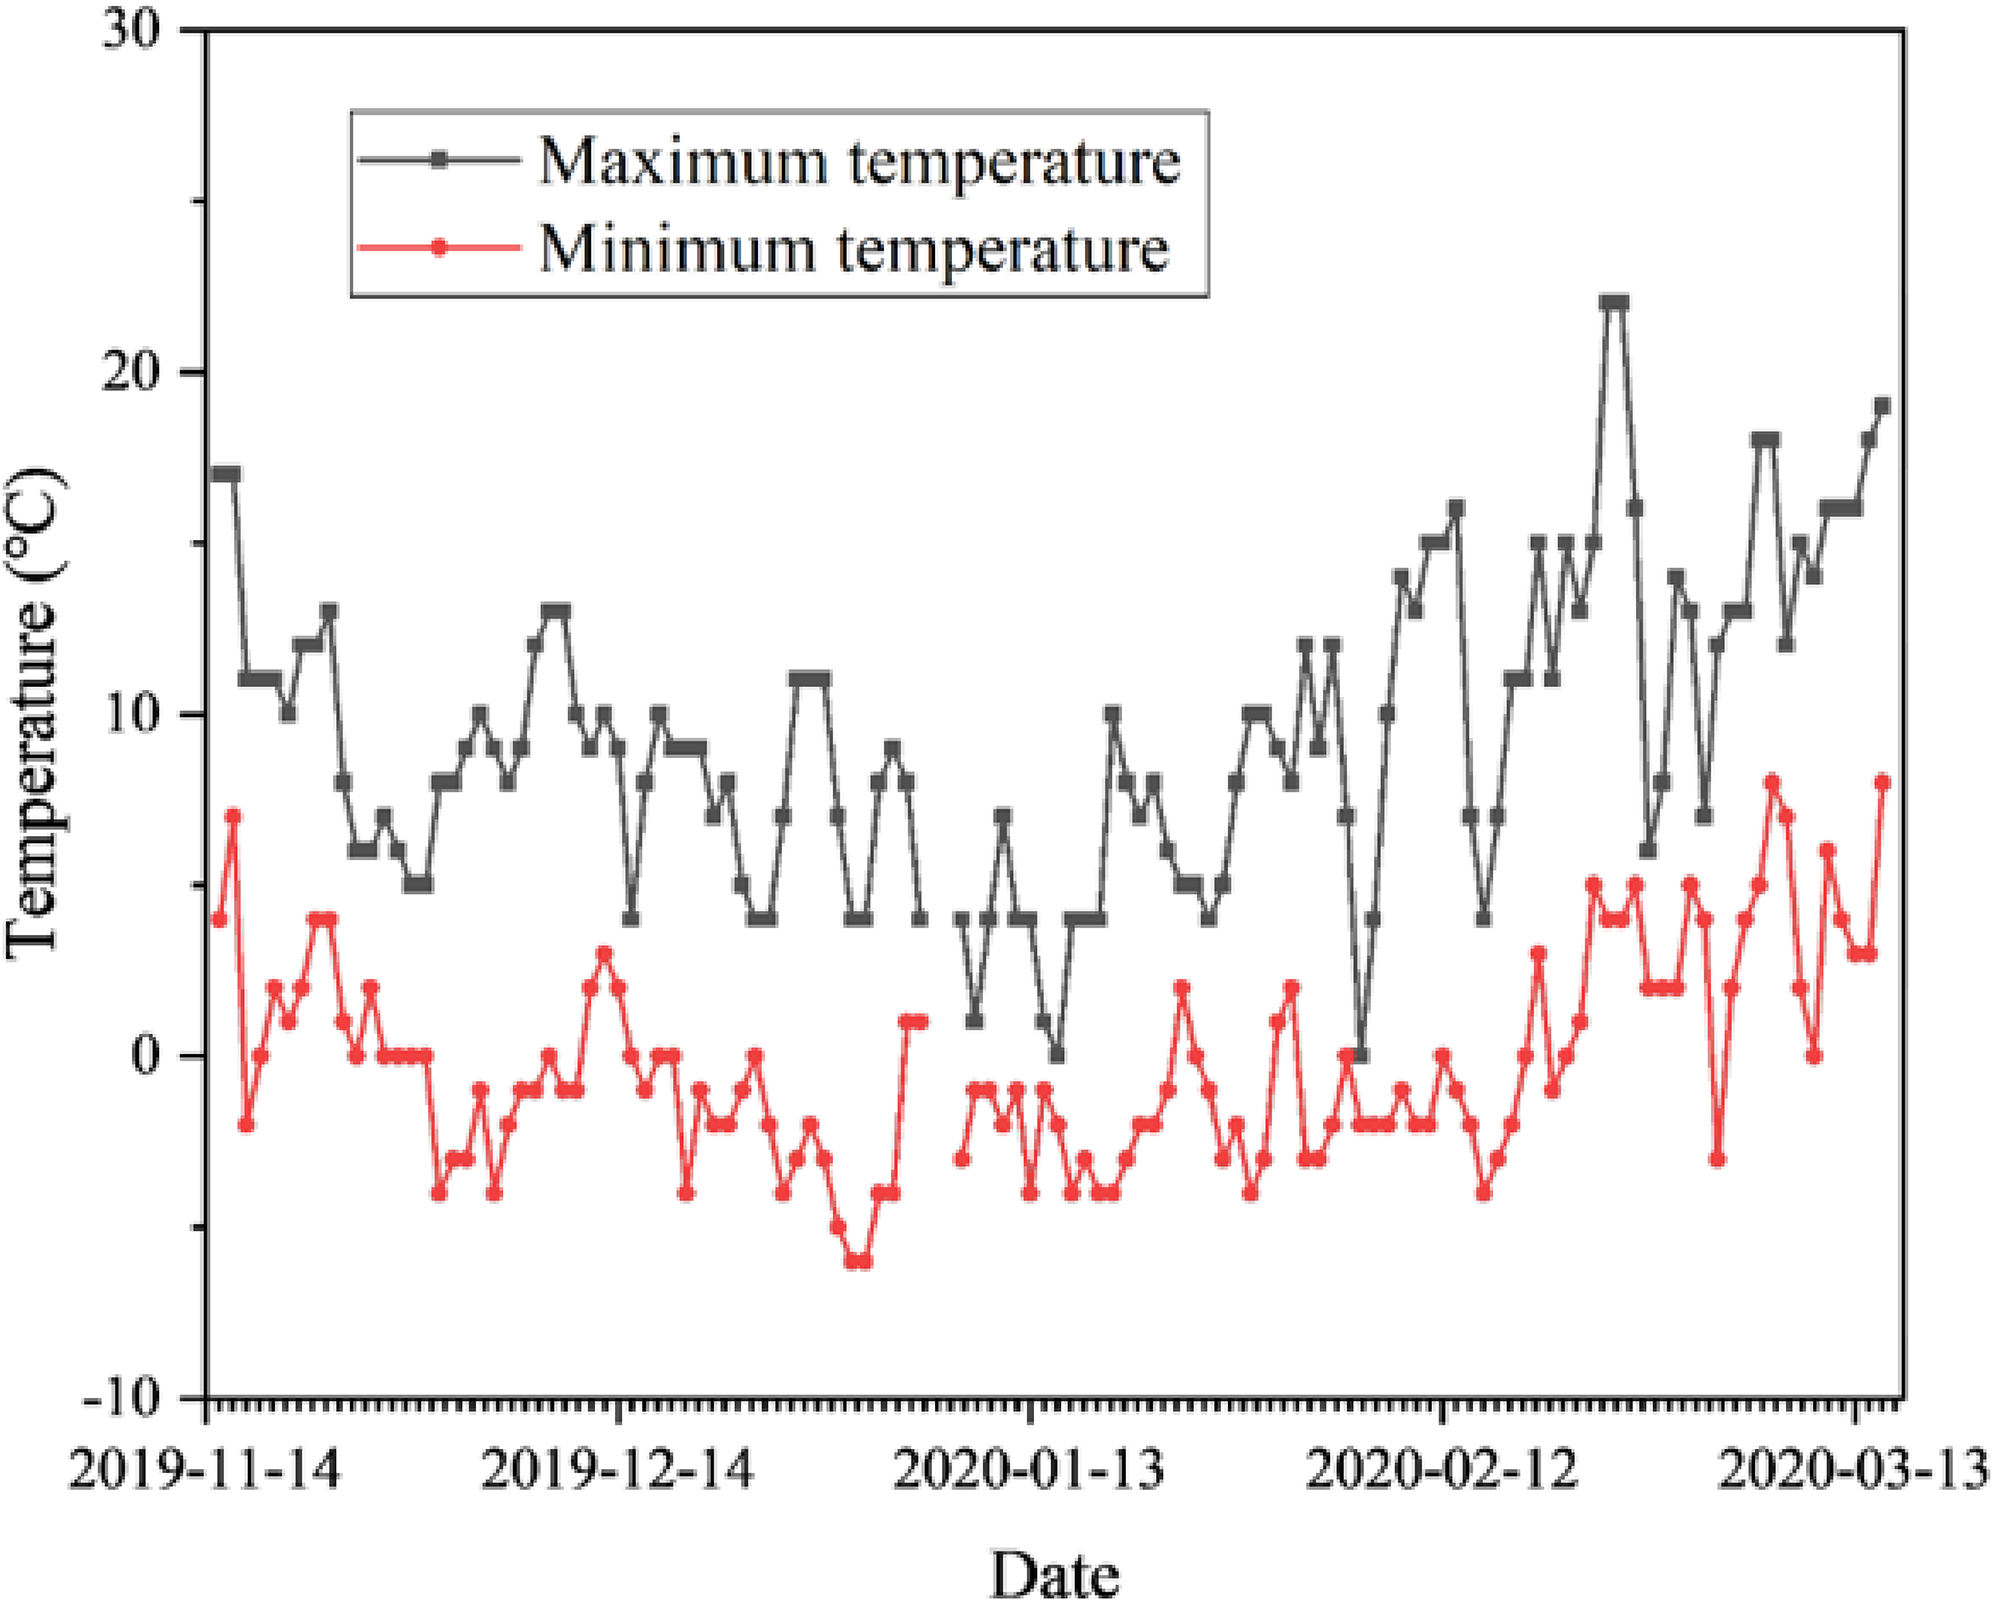
Temperature during the heating period in xi’an, China.
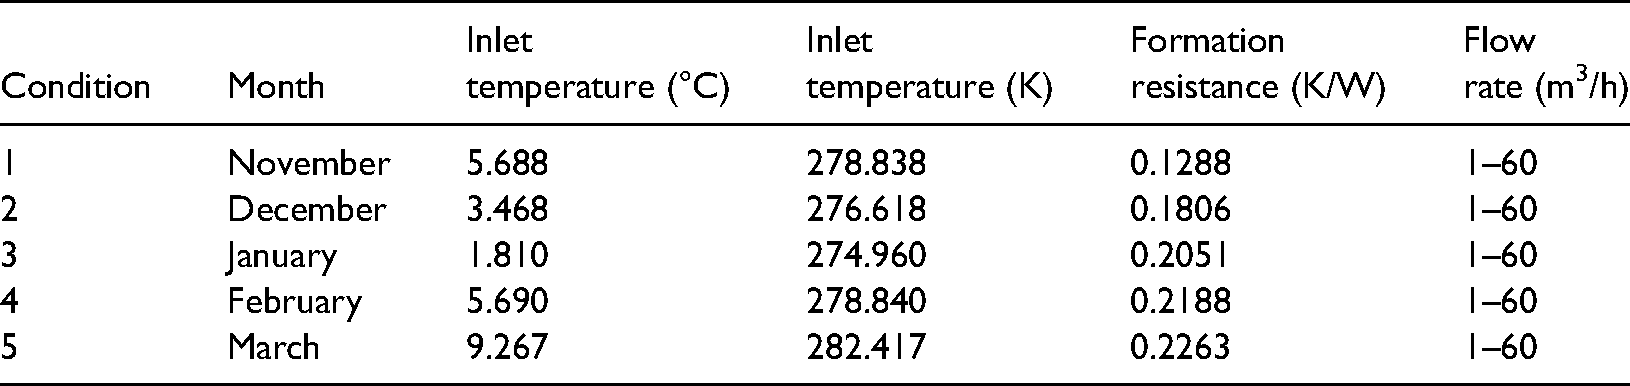
From November to March of the following year, one working condition is set every month, a total of five working conditions. The average temperature in each month is set as the inlet temperature of the working fluid, and the flow rate is set at 1–60 m3/h. The thermal resistance of the rock formation is calculated using Eqs. (22)–(27), which is set as the monthly average value. The calculation parameters are shown in Table 4, and the other variables are the same as those listed in Table 1.
Calculation parameters under each working condition.
Outlet Temperature changes with the flow rate
Figure 8 depicts the relationship between the outlet temperature of the working fluid and the flow rate of the U-shaped geothermal well from November to March of the following year.
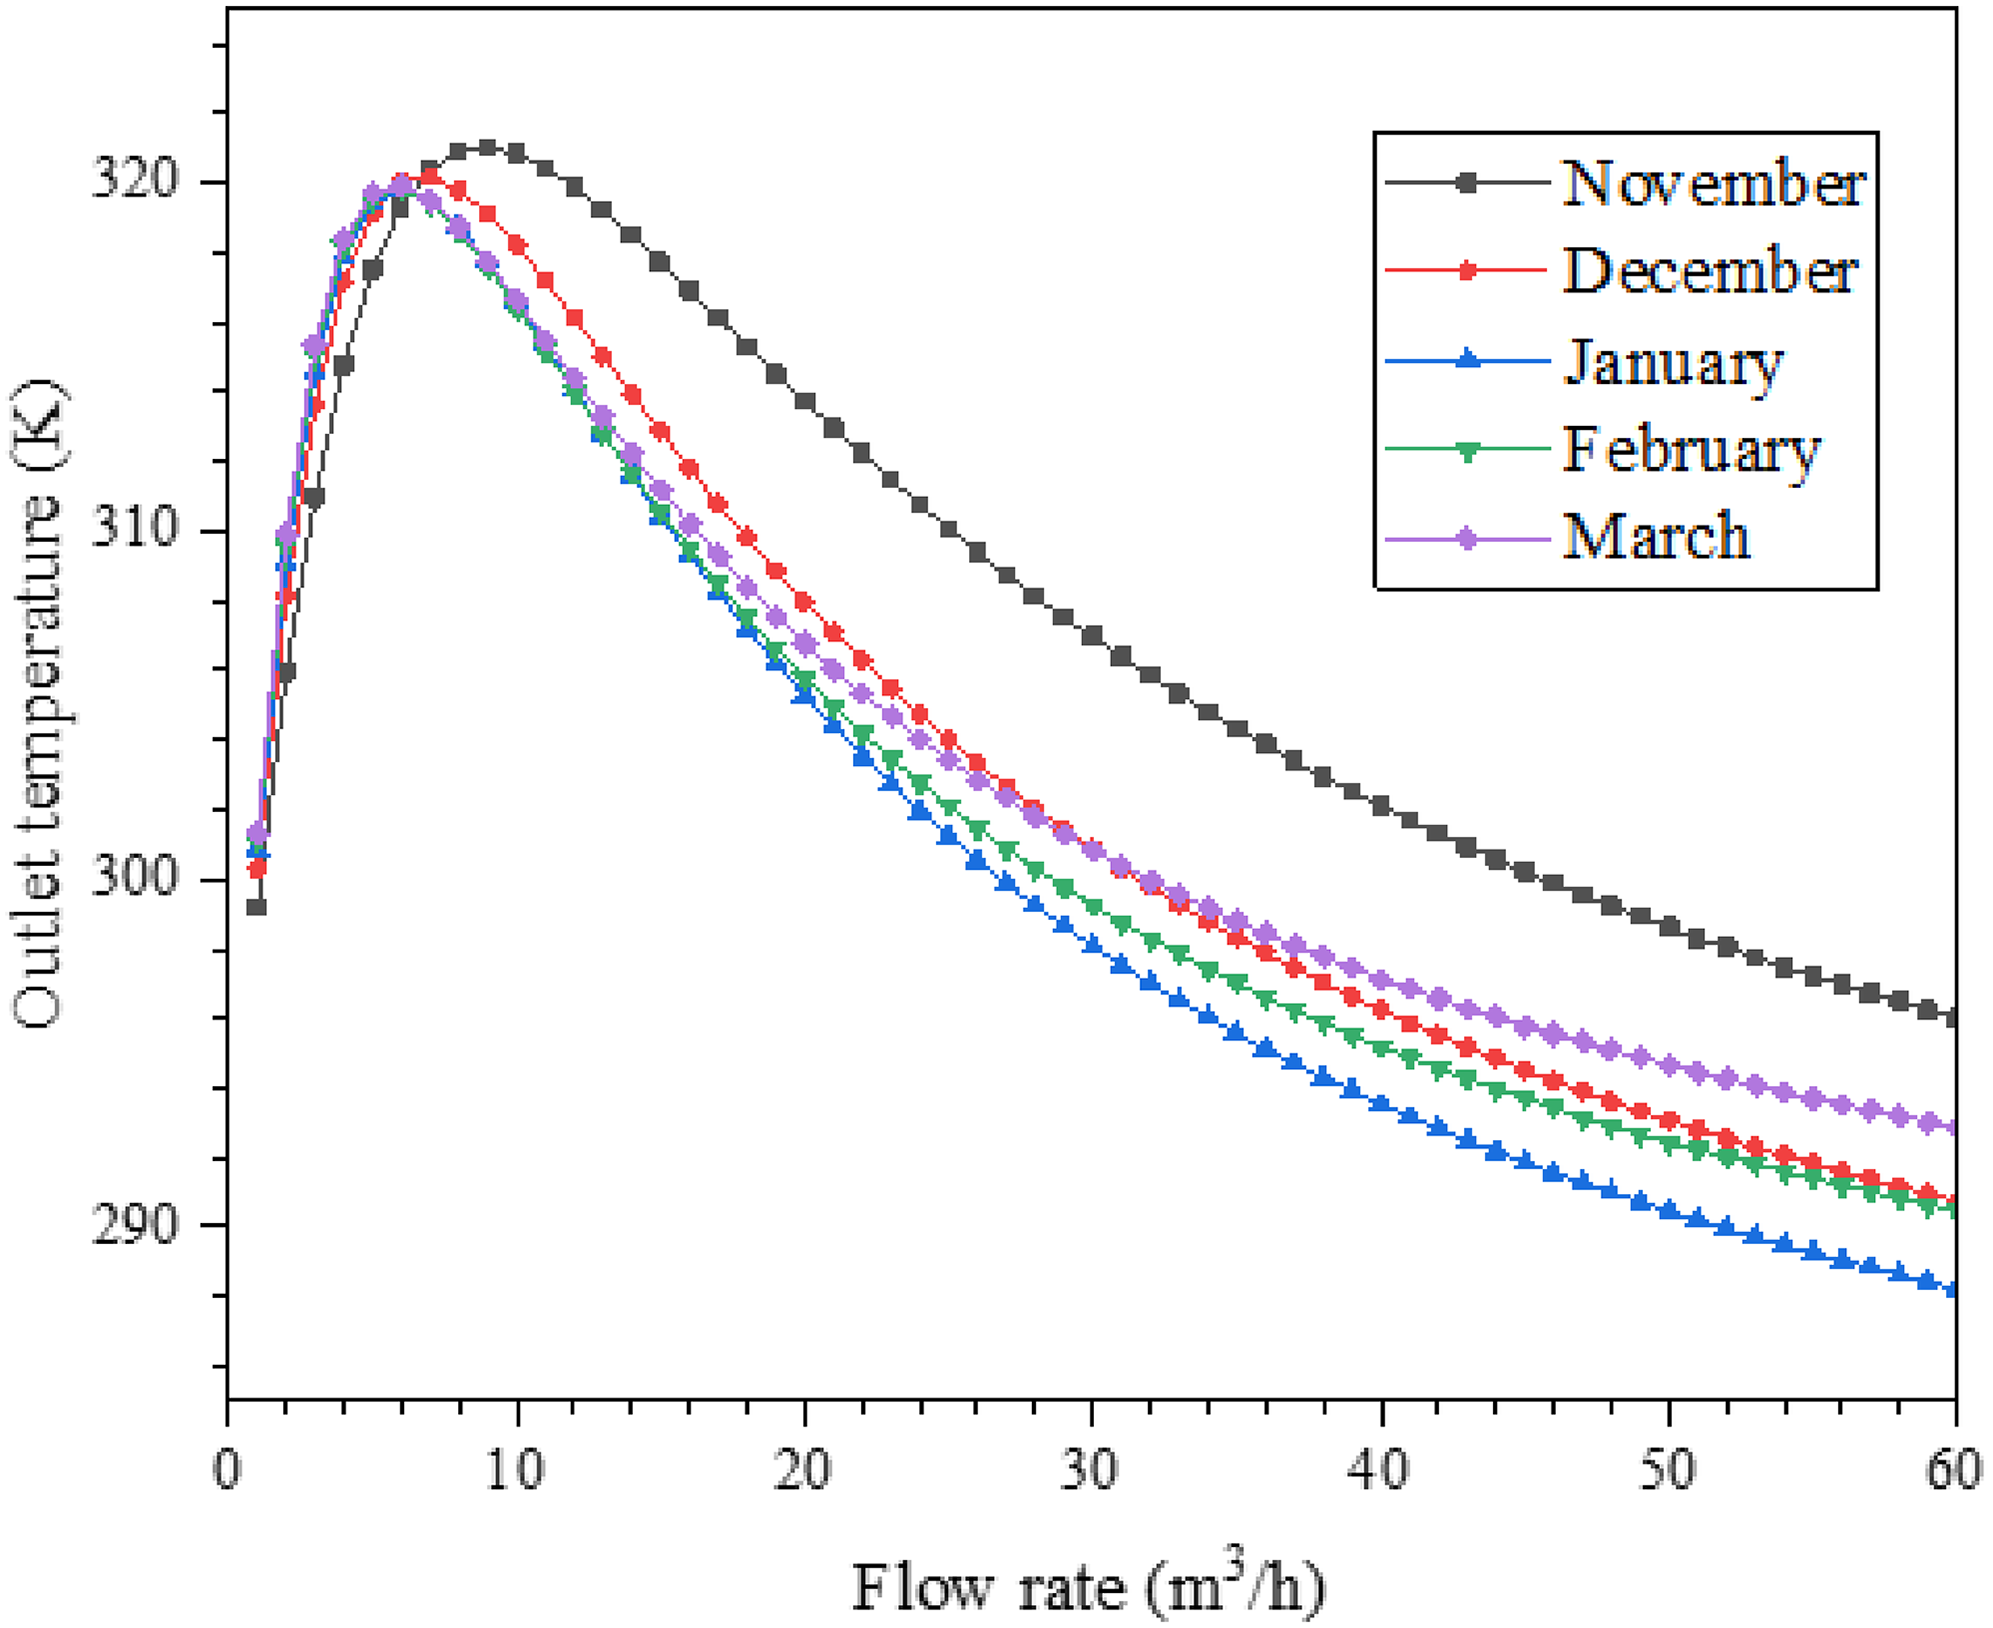
Outlet temperature changes with the flow rate.
As shown in Figure 8, each curve shows the same temperature change trend; as the flow rate increases, the outlet temperature of the working fluid first increases and then decreases. However, the outlet temperature becomes increasingly less sensitive to changes in the flow rate.
This is because when the flow rate is smaller, the heat exchange between the working fluid and the formation is more sufficient. In the endothermic zone (descending section, diagonal section, horizontal section, and the lower part of the ascending section), the temperature of the working fluid increases more rapidly. Similarly, in the heat-release zone (upper part of the ascending section), the temperature of the working fluid decreases more dramatically. Therefore, if the flow rate does not exceed a certain value and the insulation depth of the ascending section is insufficient, the temperature of the working fluid will decrease rapidly during the upward flow. Hence, in the first half of the curve (Figure 8), the outlet temperature increases with the flow rate. When the flow rate exceeds a certain value, a greater flow rate, yields a shorter heat transfer time between the working fluid and the formation, resulting in insufficient heat transfer between them. Hence, in the latter half of the curve, a greater flow rate affords a lower outlet temperature. Therefore, there is a flow rate value for each working condition to maximize the outlet temperature of the working fluid. For example, in the case of working condition 1in November, when the flow rate is set as 9 m3/h, the maximum outlet temperature achieved, i.e., 321.03 K (Figure 8). There are two reasons for this result. First, November is the initial heating period for the U-shaped geothermal well, which shows great heat-release potential. Second, compared with December and January, the inlet temperature is higher in November. Subsequently, with an increase in the thermal resistance, the heating capacity decreases. Therefore, at the end of the heating period (March), the maximum inlet temperature is 282.4 K; however, the outlet temperature is only 219.9 K, which does not reach the maximum temperature in November.
Table 5 shows the calculation results of the corresponding flow rate and maximum outlet temperature for each month.
Calculation results of the maximum outlet temperature.
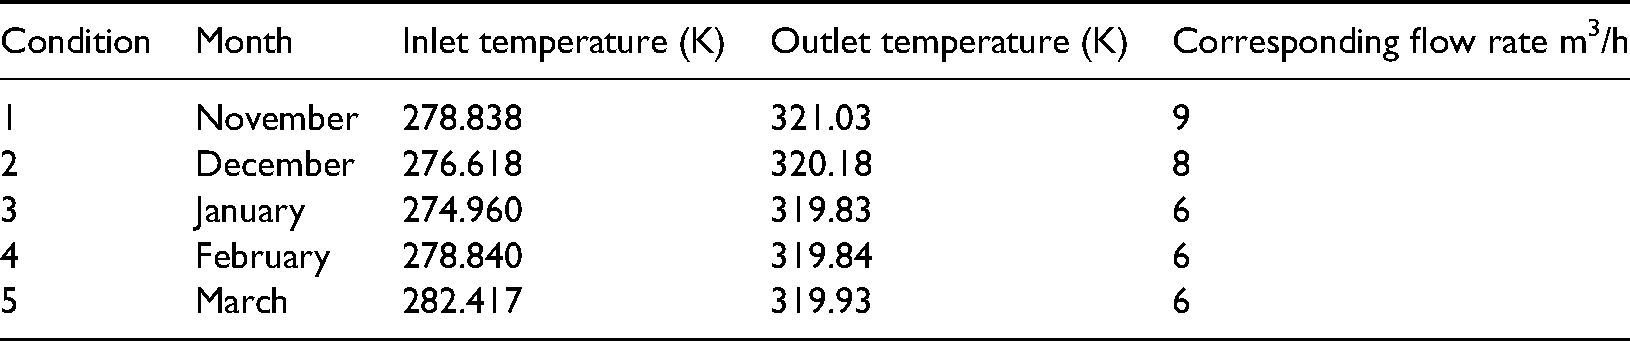
Owing to the difference in the boundary conditions for each working condition, the maximum value of the outlet temperature and the corresponding flow rate differed (Table 5). Of course, this does not mean that the flow rate at which the highest outlet temperature is achieved is the optimal value. It is also necessary to continue to investigate the change in heat extraction power with respect to the flow rate.
Heat Extraction power changes with the flow rate
Figure 9 shows the relationship between the heat extraction power and flow rate of the U-shaped geothermal well from November to March of the following year.
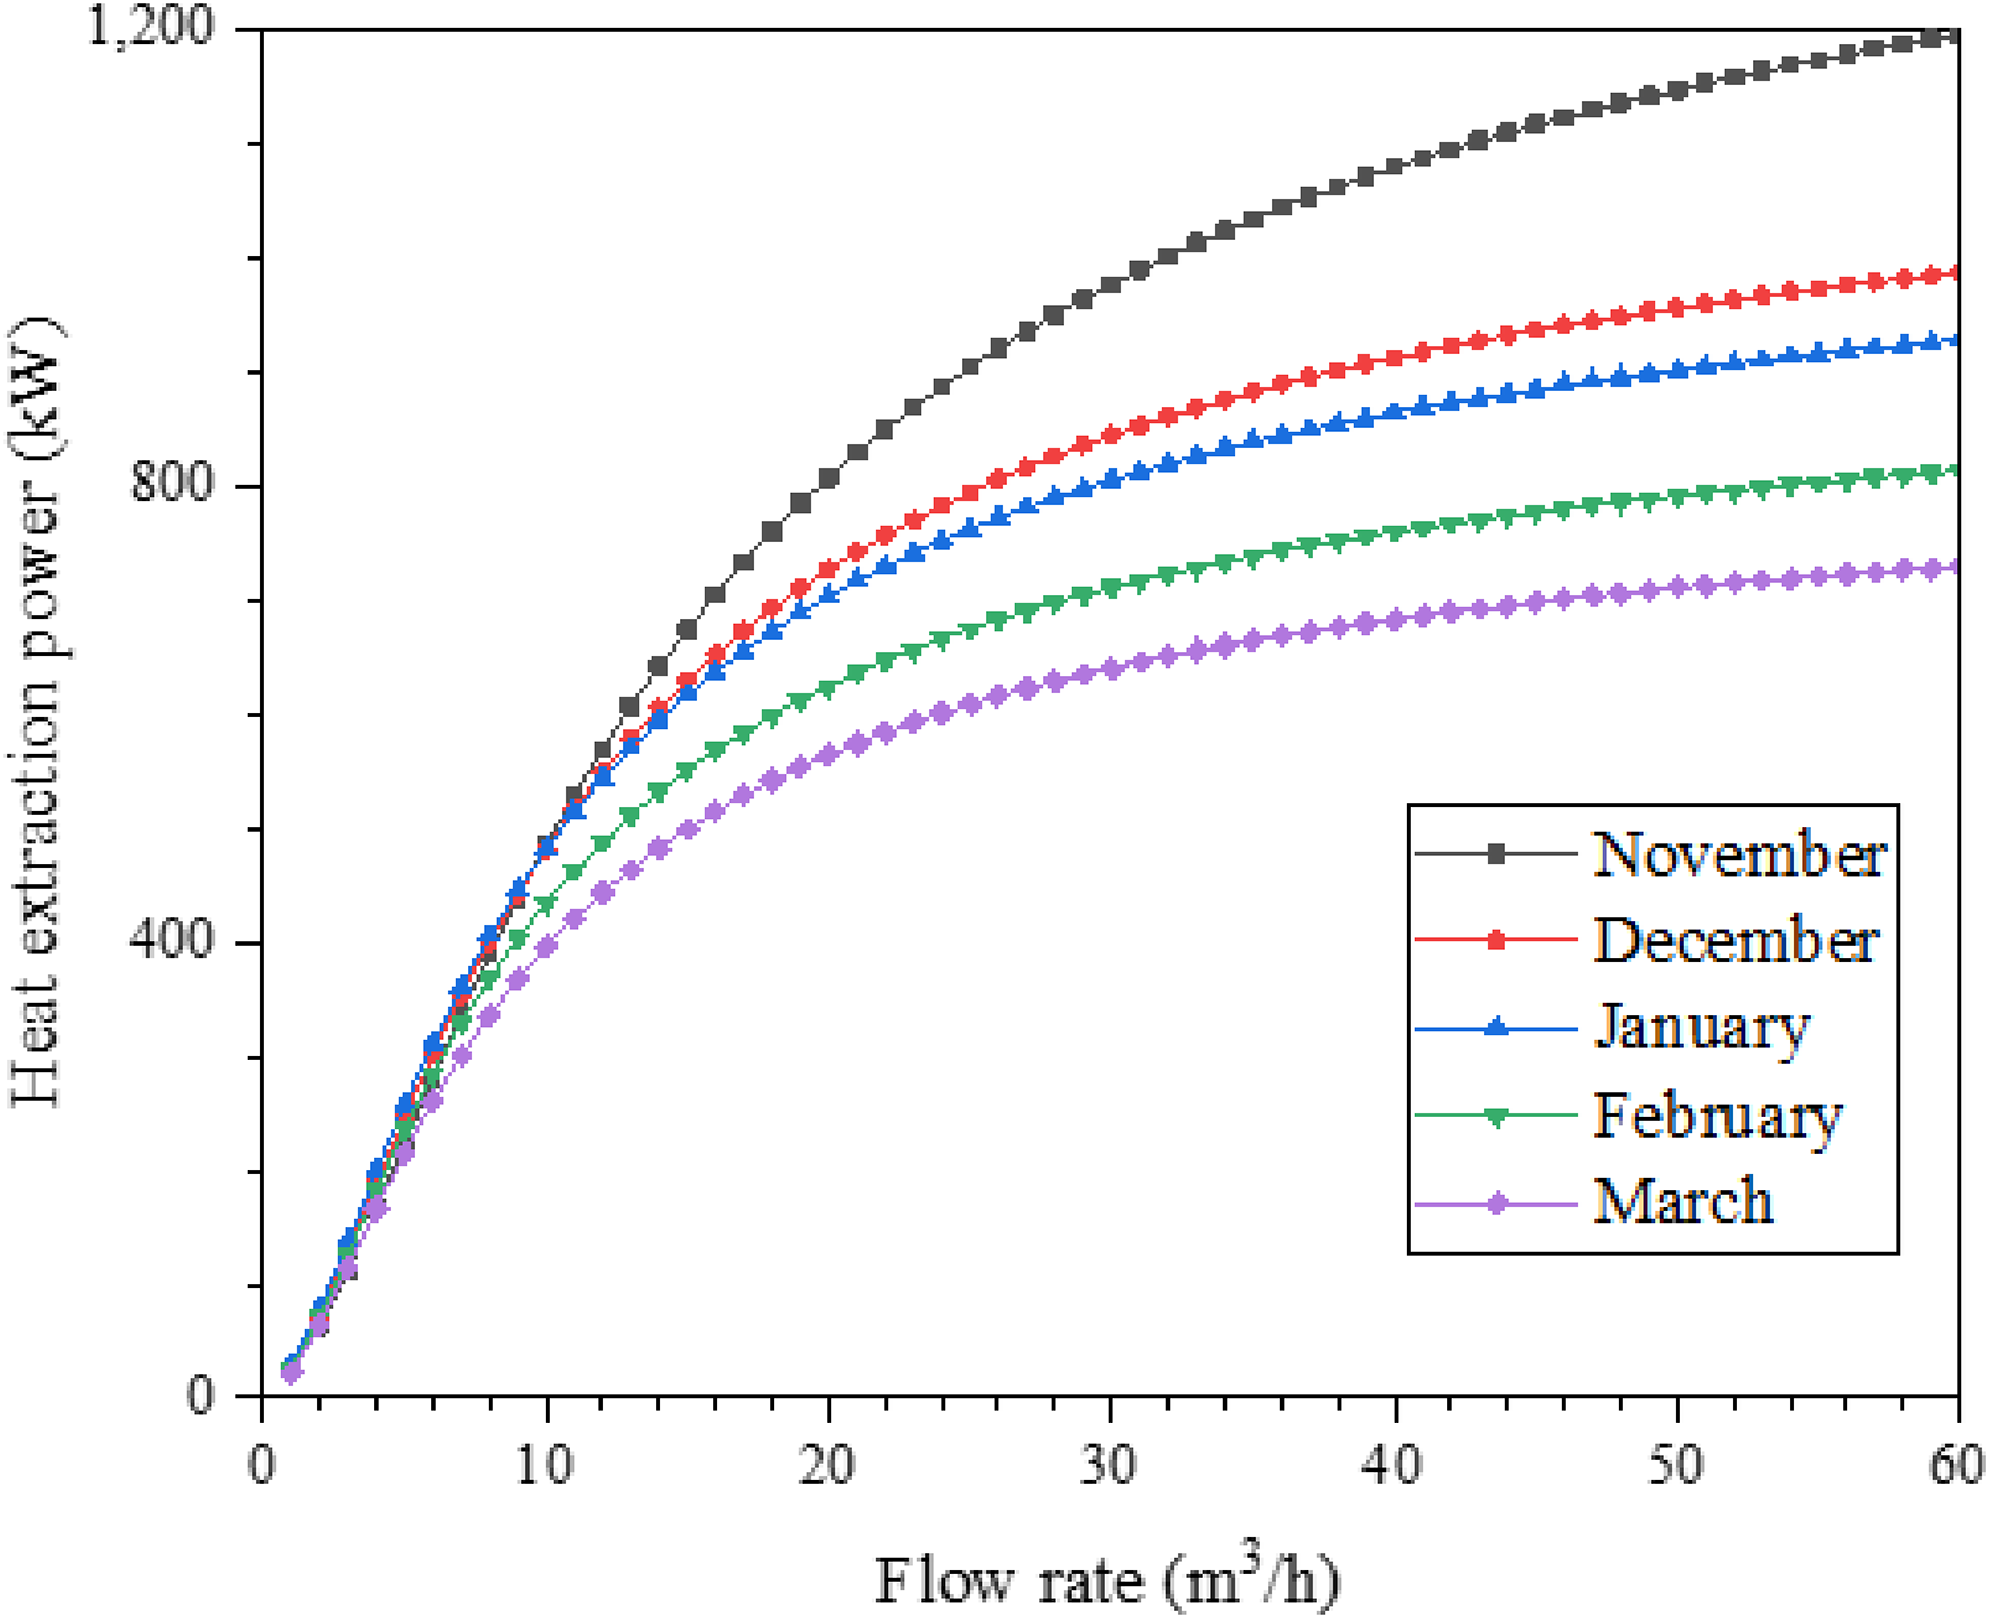
Heat extraction power changes with flow rate.
Each curve in Figure 9 shows the same change trend; as the flow rate increases, the heat extraction power increases. However, the flow rate becomes increasingly less sensitive to changes in the flow rate.
This is because if the flow rate is increased, the mass of the fluid that exchanges heat with the formation over unit time increases. Figure 9 also depicts that the heat extraction power tends to plateau at the later part of the curves. Of course, a high flow rate is not beneficial because a higher flow rate, yields a lower the outlet temperature. An excessively high flow rate will reduce the heat energy availability. Therefore, the exergy analysis method is effective analysis approach.
Optimal Flow rate based on exergy analysis
The exergy of each working condition can be calculated using Eq. (15). The greater the exergy, the more available thermal energy extracted from the geothermal well. According to the conclusion obtained in Section 3.2., when the flow rate exceeds a certain value, a higher flow rate, yields a lower the outlet temperature. However, when the flow rate is higher, the heat extraction is also greater. Under the premise that the ambient temperature is set as a fixed value, it is impossible to determine whether exergy increases or decreases with the flow rate; hence, further analysis is necessary. The flow rate obtained at the maximum exergy is set as the optimal flow rate. The main task of this section is to determine the optimal flow rate based on exergy analysis.
Fitting Of the function of outlet temperature and heat extraction power with flow rate
Based on the analysis in Section 3.2., both the outlet temperature and heat extraction will change with changes in the flow rate, and the change trend observed under different working conditions is the same. Hence, both the outlet temperature and heat extraction power are functions of the flow rate.
Thus, Eq. (15) can be expressed as
Therefore, determining how to fit the function of the outlet temperature and heat extraction power changing with the flow rate using curves shown in Figures 8 and 9 has become the key to achieve the optimal flow rate design.
Analyzing the curves shown in Figure 8, the function should meet the following relations:


Based on the aforementioned relations and using the function approximation principle (Denœux, 1997), the function form can be achieved as
Similarly, based on the shape of the curve shown in Figure 9, a function can be obtained for the heat extraction power,
According to the least-squares principle (Verma et al., 2006; Wong-Loya et al., 2015), the deviation function is defined as


According to the aforementioned ideas, considering the calculation result obtained in the case of November as an example, the fitted function between the outlet temperature and flow rate and that between the heat extraction power and flow rate are presented in Eqs. (50) and (51), respectively.

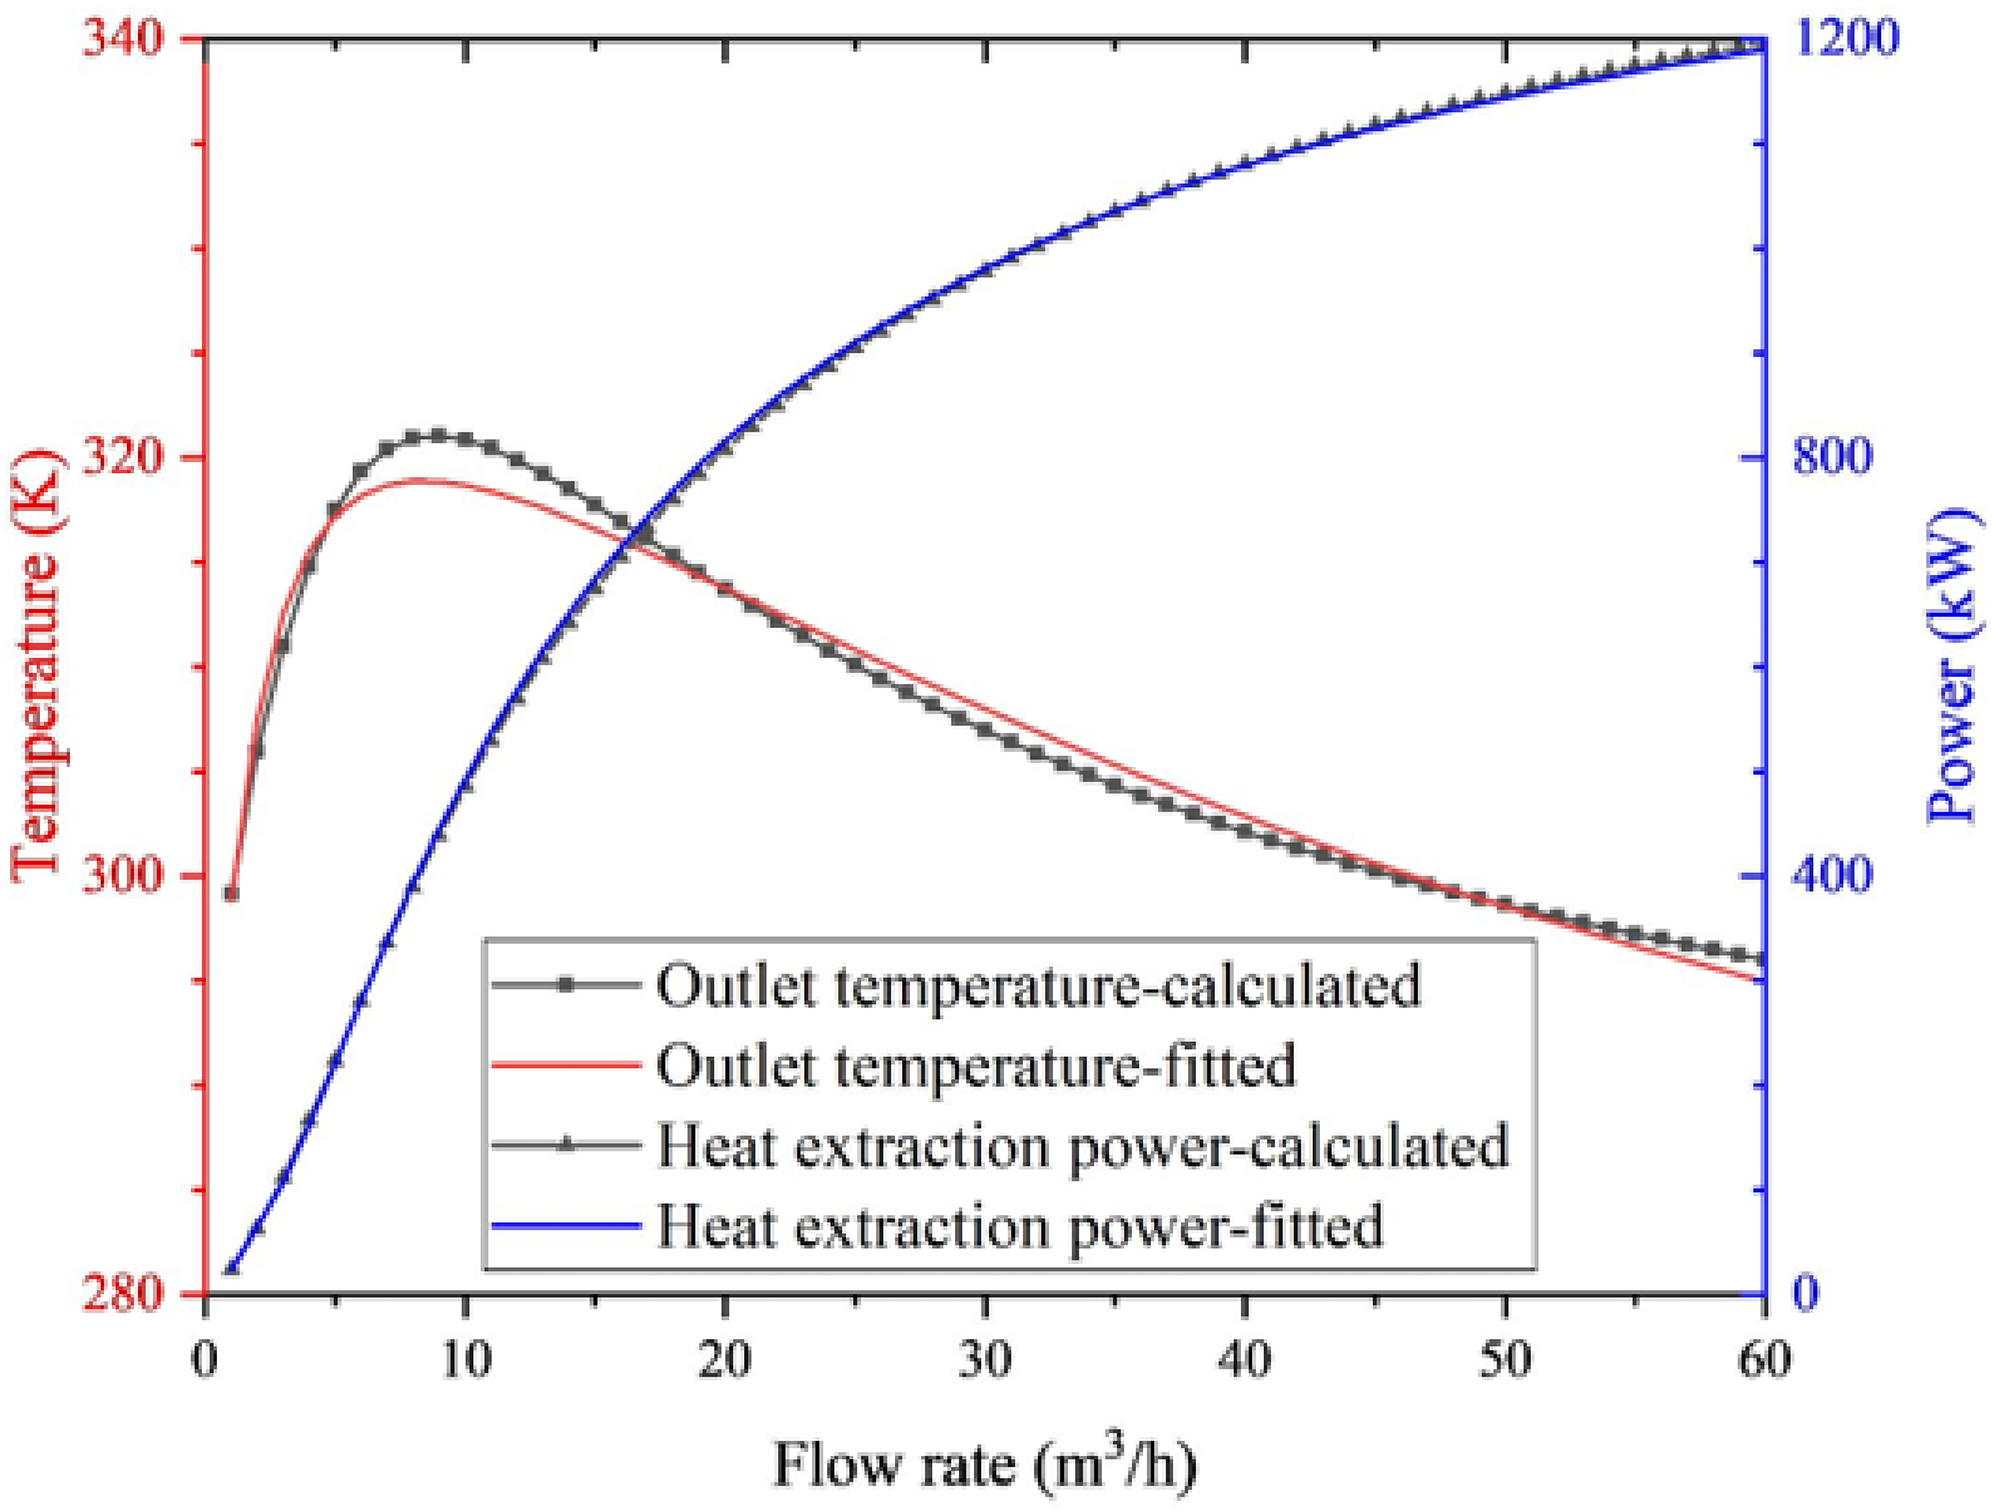
Comparison of the fitting function and calculated value.
Figure 10 also shows that the fitting function is consistent with the calculated value obtained using the mathematical model. Moreover, the fitting function can be used to perform exergy analysis.
Exergy Analysis based on the fitting function
Substituting the fitting function into Eq. (15), the heat exergy absorbed by the working fluid from the formation can be expressed as
Heat exergy change with the flow rate for November data.
As the flow rate increases, the heat exergy first increases and then decreases; the maximum exergy value is obtained at point E on the curve (Figure 11). The flow rate corresponding to point E is the optimal flow rate. The working fluid can obtain the maximum heat exergy value for the U-shaped geothermal well using this flow rate operation.
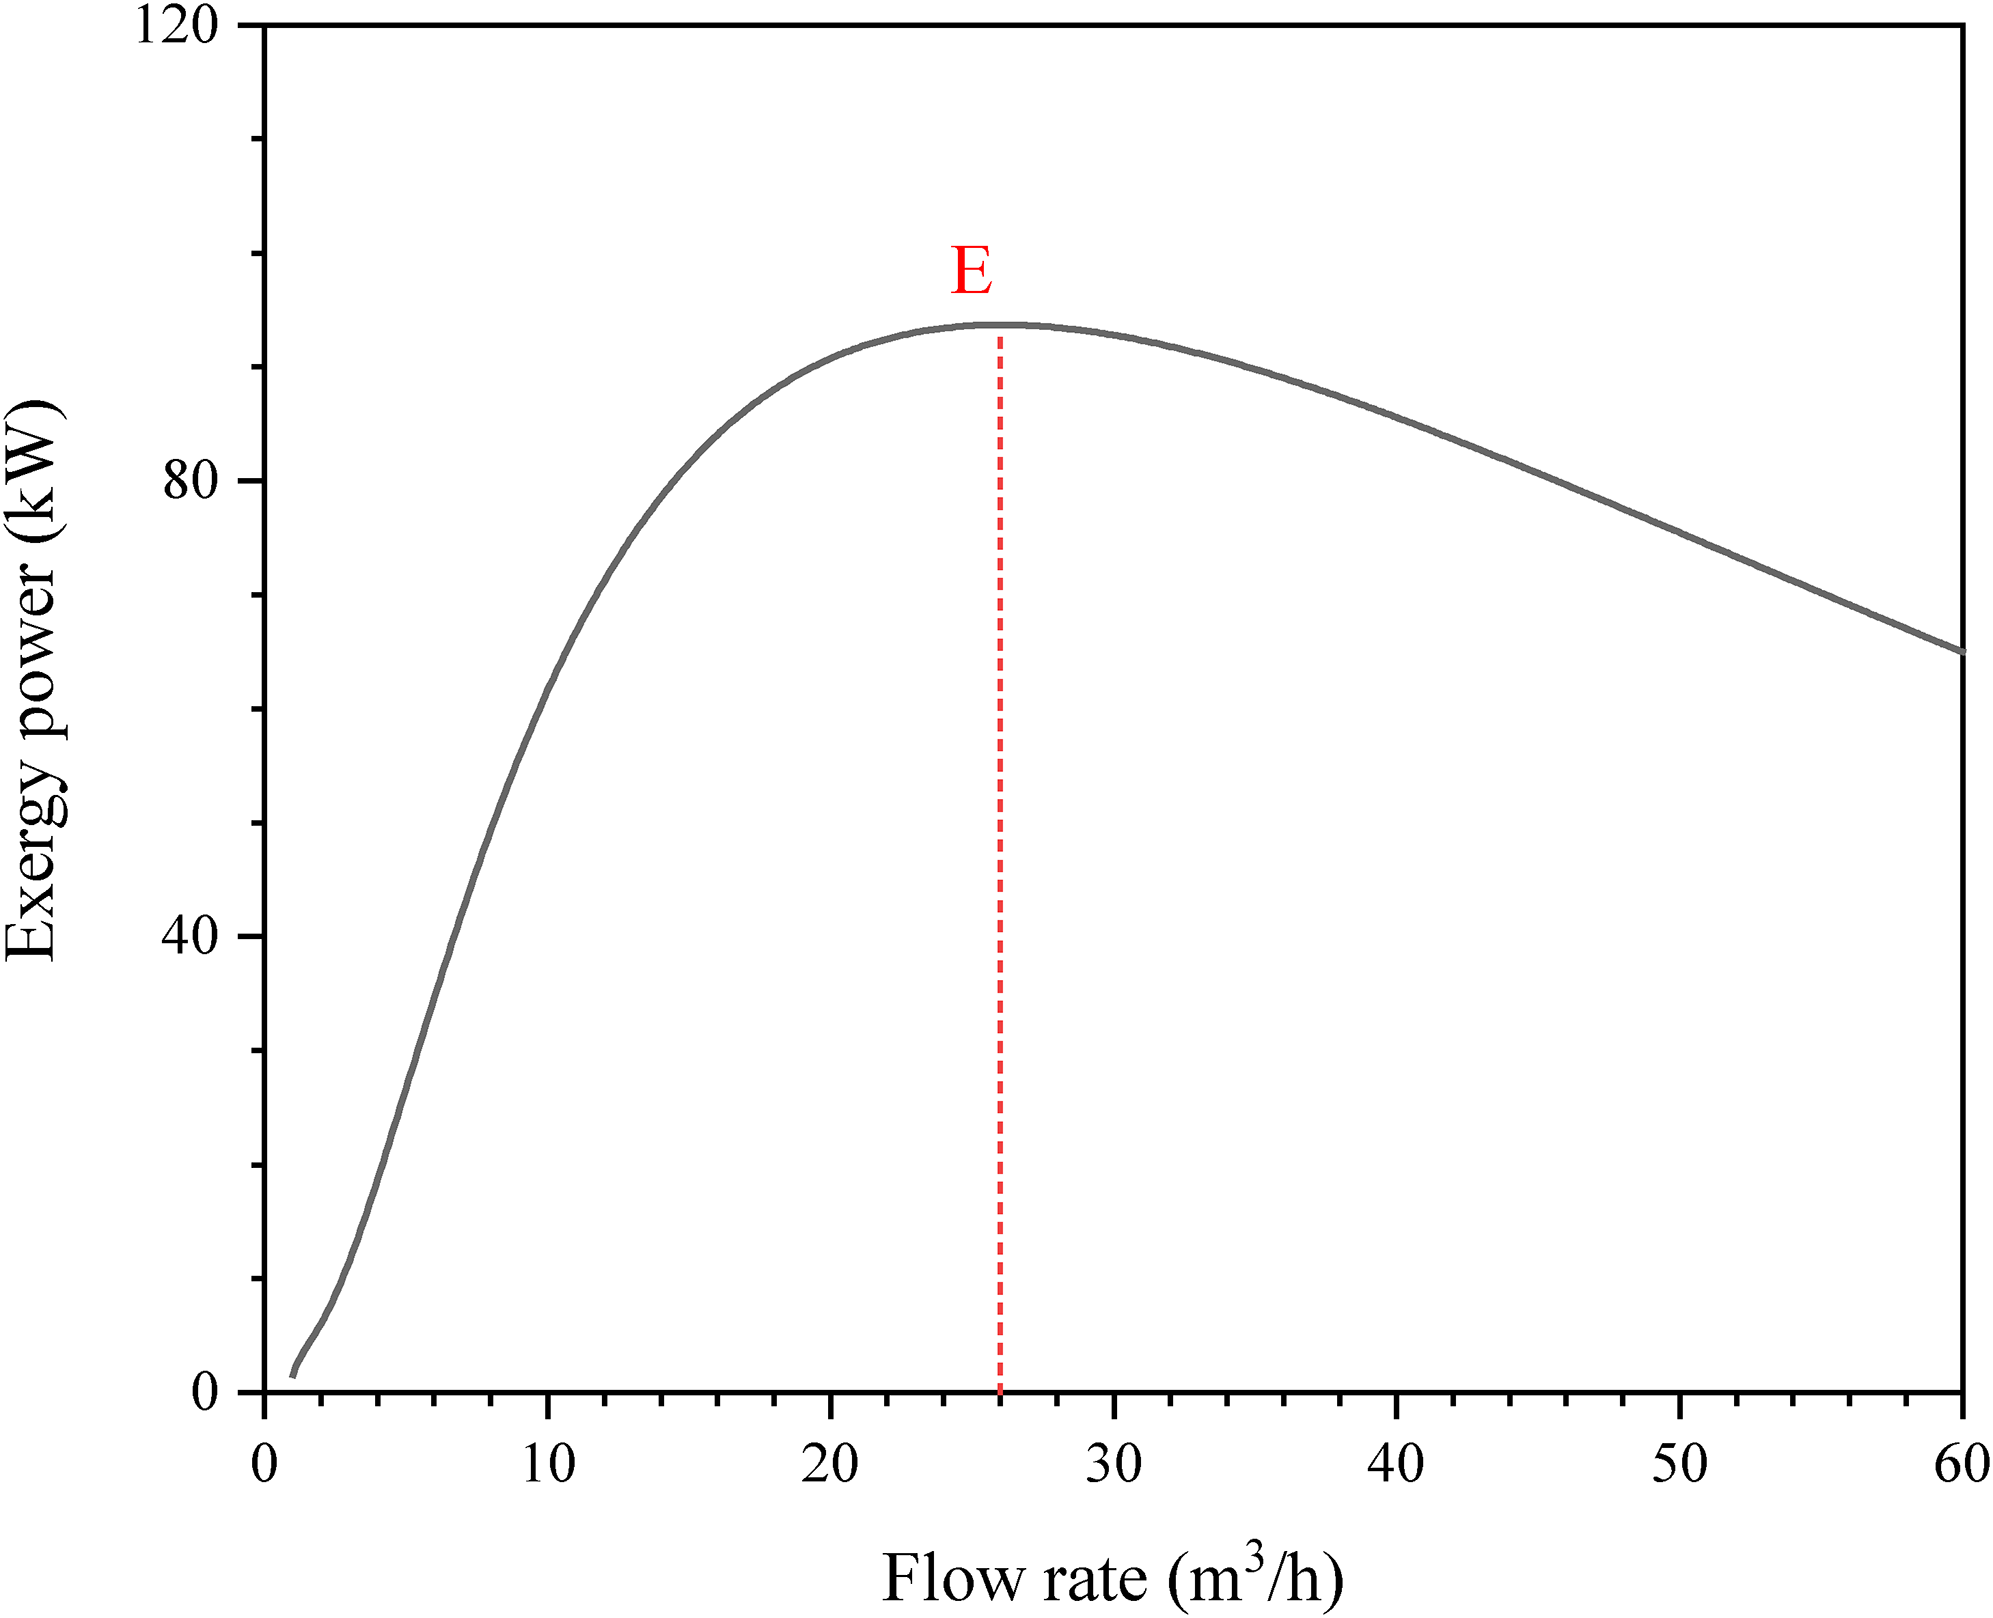
Similarly, the curve depicting changes in the heat exergy with respect to the flow rate in each month during the heating period can also be obtained (Figure 12). The designed operating flow rate and the corresponding maximum exergy power calculation results are shown in Table 6.
Heat exergy change with the flow rate during the heating period.
Design results for optimal flow rate.
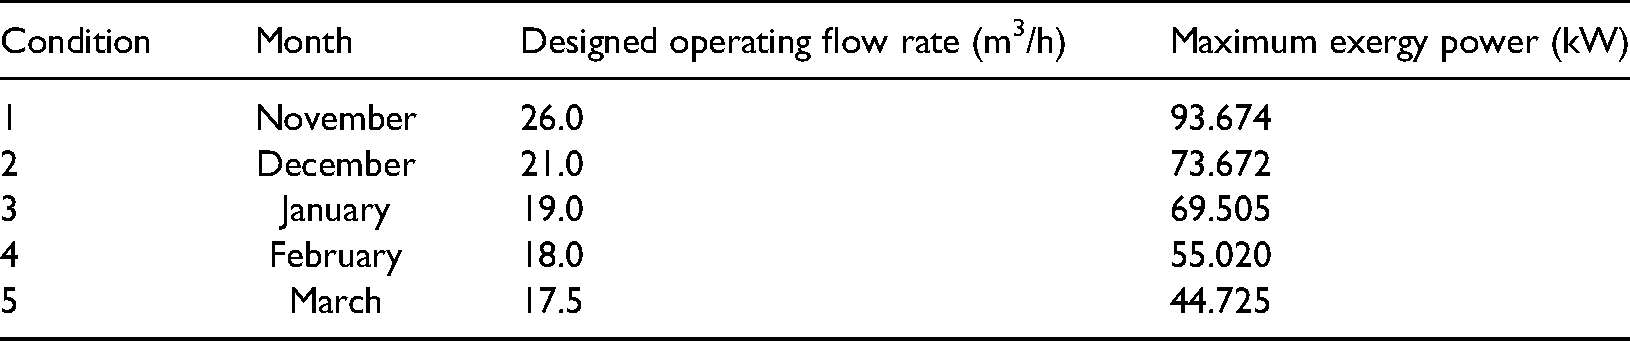
Figure 12 and Table 6 show that owing to different boundary conditions, the optimal flow rate for each month during the heating period differs. In the initial stage of the heating period, the exergy power is greater, and the optimal flow rate is higher. Thus, the U-shaped geothermal well must be operated at a higher flow rate. At the end of the heating period, the exergy power becomes smaller and the optimal flow rate decreases;, hence, the well must be operated at a smaller flow rate. The operating flow rate must be adjusted in time as the heating process progresses to obtain the maximum exergy power.
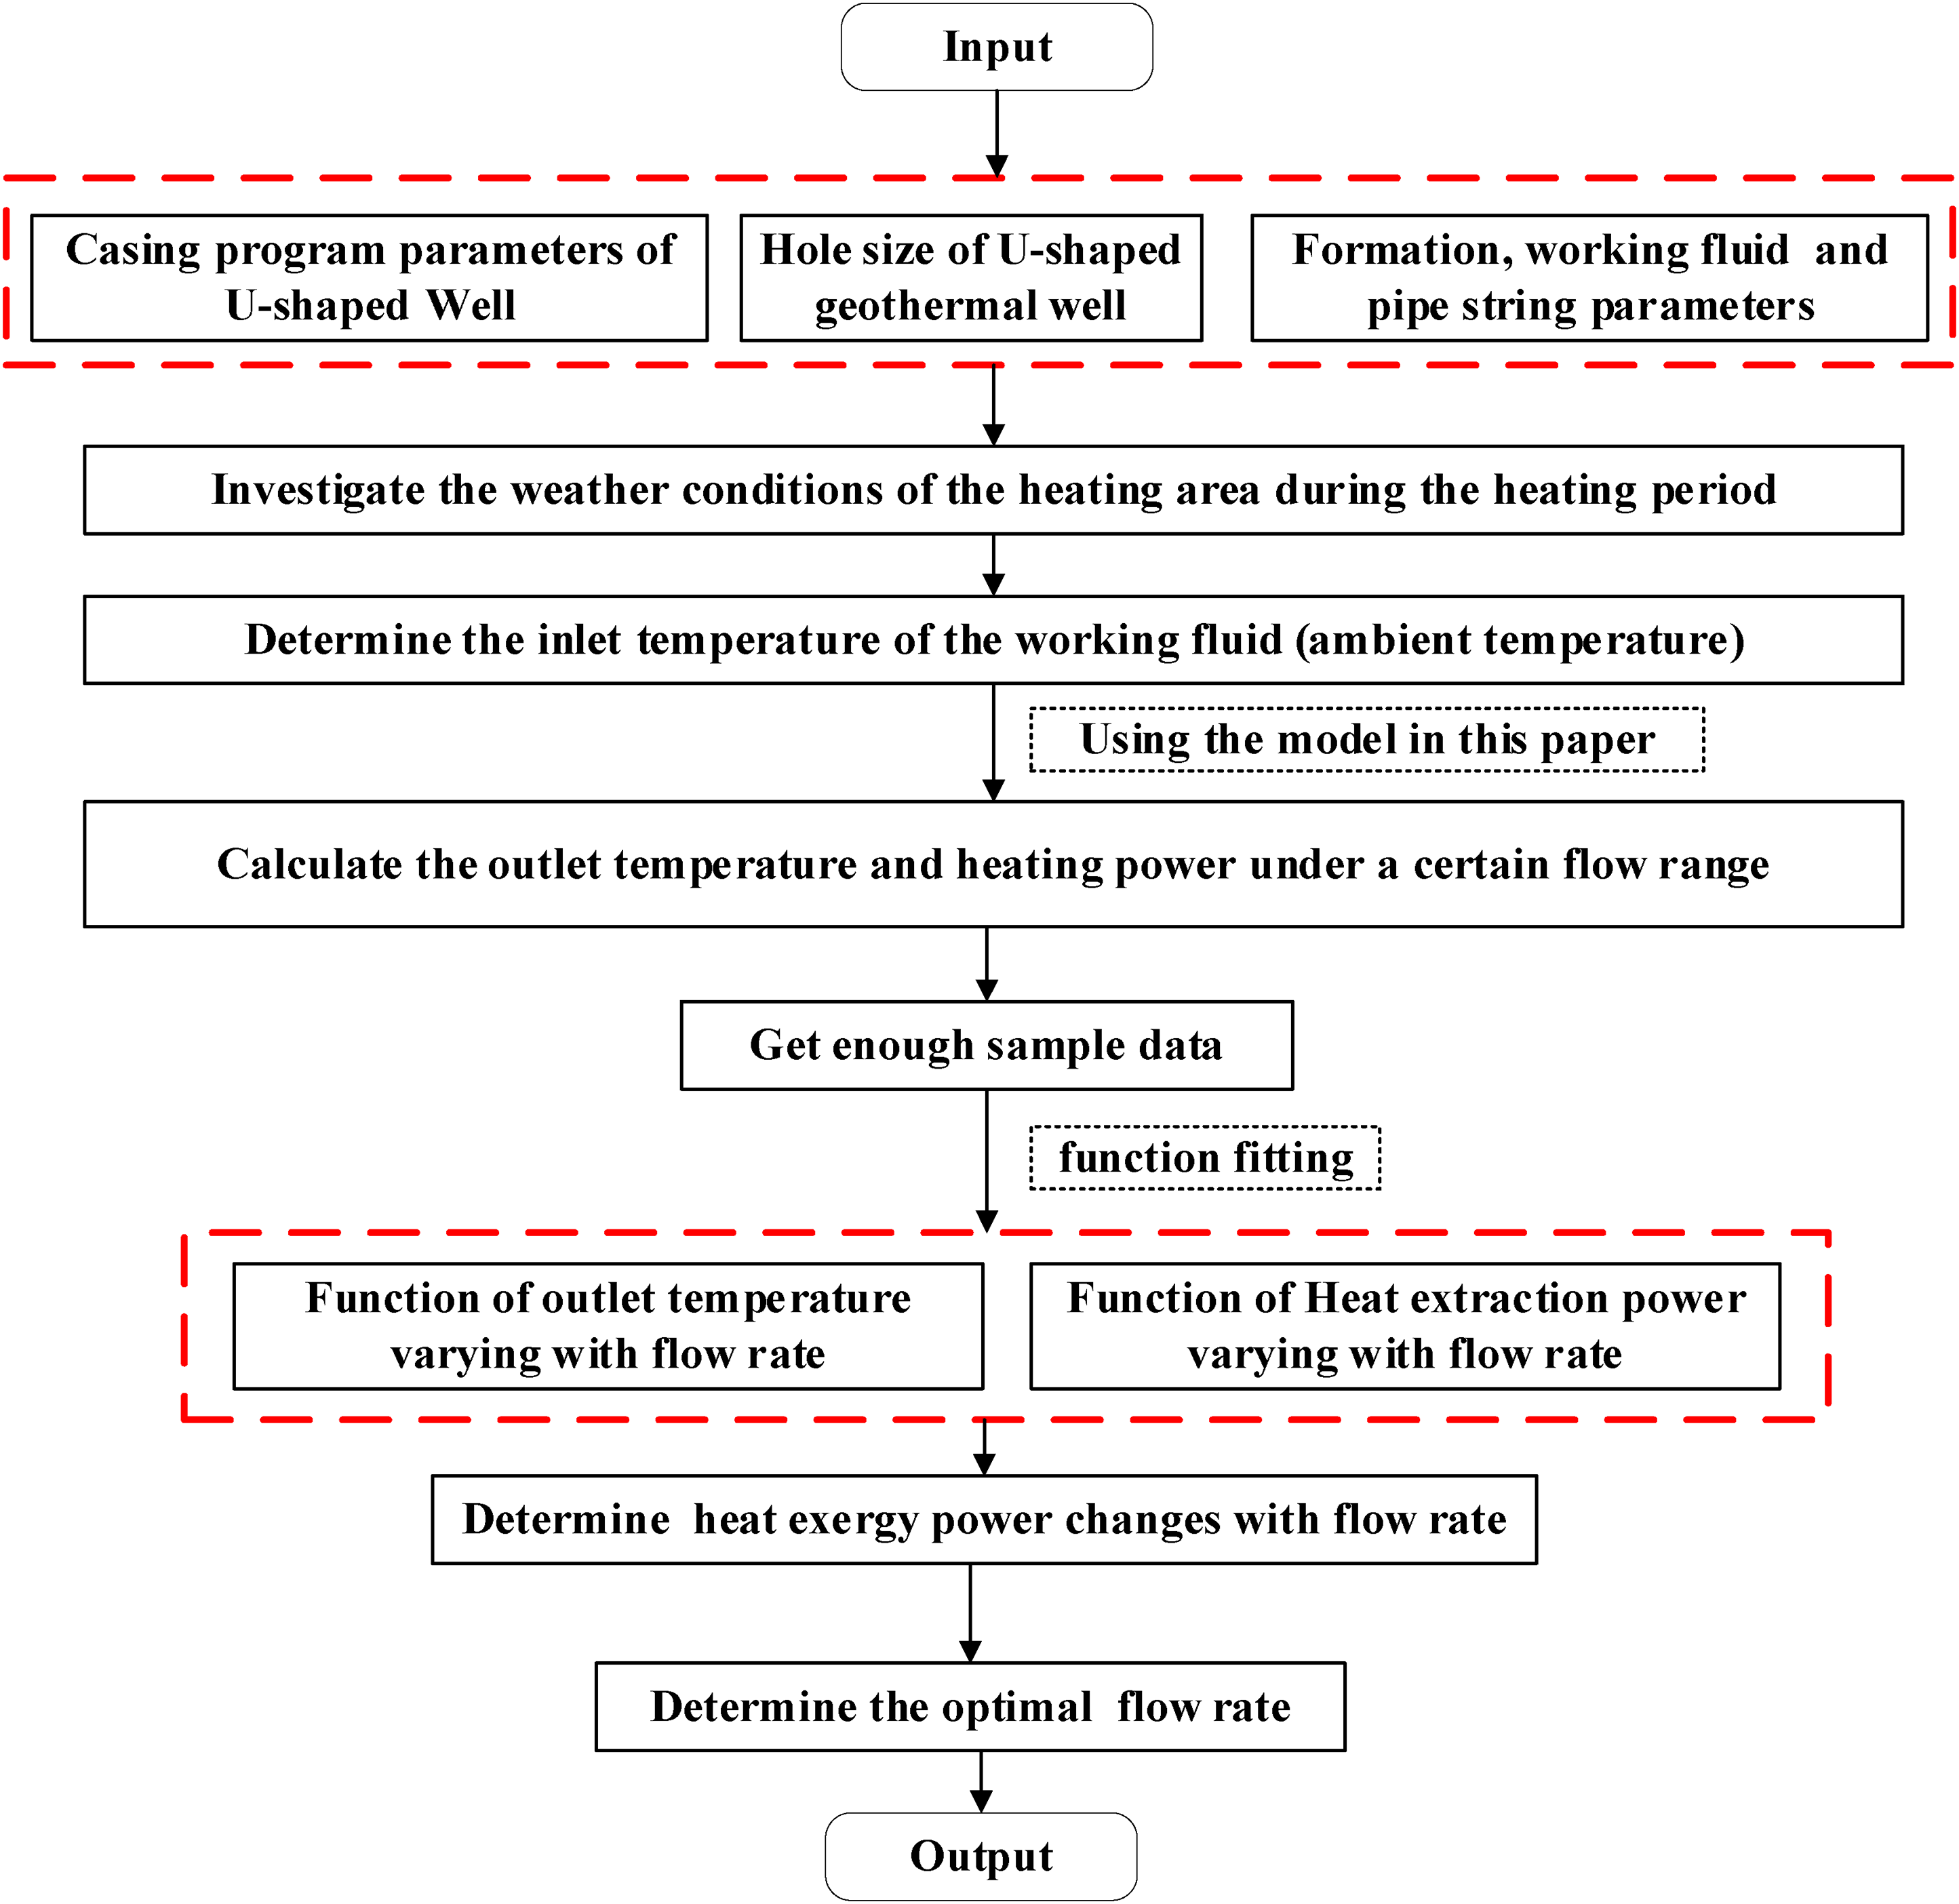
Optimal Flow rate design process
The subsequent analysis demonstrates that the proposed mathematical model can be used to calculate the exergy power of U-shaped geothermal wells developed under different flow rates to obtain the optimal flow rate during operation. The steps for designing the optimal flow rate of the U-shaped geothermal wells are listed below: Step 1: The basic parameters such as the well structure, formation, working fluid, and pipe string physical parameters are provided as input.
Step 2: The weather in the heating area during the heating period is investigated to determine the inlet temperature of the U-shaped geothermal well.
Step 3: The wellbore heat transfer model (established in Section 2) is employed at each stage of the heating period to calculate the outlet temperature and heat extraction power under a certain range of flow rates.
Step 4: Sufficient sample data are obtained and used to fit the function of the outlet temperature and heat extraction power changing with the flow rate.
Step 5: Eq. (32) is used to determine the change in exergy efficiency with respect to the flow rate. The flow rate corresponding to the maximum exergy efficiency is the optimal flow rate of the U-shaped geothermal well.
The flowchart shown in Figure 13 helps understand the process of determining the optimal flow rate of the U-shaped geothermal well.
Conclusions
Taking Xi’an area as an example, this work developed an evaluation (mathematical) model for obtaining the optimal flow rate of a U-shaped geothermal well based on exergy analysis. Some significant findings are summarized below:
The proposed heat extraction mathematical model for the U-shaped geothermal well is highly accurate and yields results that are consistent with the experimental results. The maximum relative error between the calculated and experimental results is only 0.62%. As the flow rate of the U-shaped geothermal well increases, the outlet temperature of the working fluid first increases and then decreases; however, the outlet temperature becomes increasingly less sensitive to changes in the flow rate. In the initial month of heating (November), the highest outlet temperature can be reached at 321.03 K, and the corresponding flow rate is 9 m3/h. As the flow rate increases, the heat extraction power increases; however, it becomes increasingly less sensitive to changes in the flow rate. A higher flow rate does not imply better performance because it reduces the heat energy availability. As the flow rate increases, the heat exergy first increases and then decreases, and the flow rate obtained at the maximum exergy value is the optimal flow rate. During the heating period from November to March of the following year, the monthly maximum heat exergy power is 93.7, 73.7, 69.5, 55.0, and 44.7 kW, and the corresponding optimal flow is 26, 21, 19, 18, and 17.5 m3/h, respectively. Therefore, the operating flow rate can be adjusted in time using the method for determining the best flow developed in this work to obtain the maximum exergy power.
Flowchart for determining the optimal flow rate.
The object of the exergy analysis in this study is the benefits obtained from the rock formation, excluding the cost of equipment. In the future, we will continue to investigate the optimal flow rate from the following two aspects:
From exergy efficiency, study the flow rate design with the largest ratio of benefit to cost will be studied. Coupling process parameters with economic parameters, the flow rate design with the most economical flow will be investigated.
Footnotes
Acknowledgements
The authors would like to express appreciation for the support by the National Natural Science Foundation of China [No.51874252], PetroChina Innovation Foundation [No.2020D-5007-0312], Sichuan Province Science and Technology Planning Project [No.2019JDTD0026], PetroChina-Southwest Petroleum University Innovation Consortium Project [No.2020CX040103], and Yanchang Petroleum Group geothermal project (No.GJM18TLH0005).
Declaration of conflicting interests
The author(s) declared no potential conflicts of interest with respect to the research, authorship, and/or publication of this article.
Funding
The author(s) disclosed receipt of the following financial support for the research, authorship, and/or publication of this article: This work was supported by the National Natural Science Foundation of China [grant number 51874252], PetroChina Innovation Foundation [grant number 2020D-5007-0312], Sichuan Province Science and Technology Planning Project [grant number 2019JDTD0026], PetroChina-Southwest Petroleum University Innovation Consortium Project [grant number 2020CX040103], and Yanchang Petroleum Group geothermal project (grant number GJM18TLH0005).